Article

A Supply–Demand-Driven Framework for Evaluating Service Effectiveness of University Campus Emergency Shelter: Evidence from Central Tianjin Under Earthquake Scenarios

1
School of Architecture, Tianjin University, Tianjin 300072, China
2
School of Architecture, Tianjin Chengjian University, Tianjin 300384, China
*
Author to whom correspondence should be addressed.
Land 2025, 14(7), 1411; https://doi.org/10.3390/land14071411
Submission received: 31 May 2025 / Revised: 26 June 2025 / Accepted: 1 July 2025 / Published: 4 July 2025
(This article belongs to the Section Land Use, Impact Assessment and Sustainability)

Abstract

Urban disaster risks are escalating, and university campus emergency shelters (UCESs) are key to alleviating the supply–demand imbalance in emergency shelter services (ESSs) within high-density central urban areas. However, existing studies lacked the measurement of UCES service effectiveness from a regional supply–demand perspective, limiting the ability to guide planning practices. Therefore, we focused on the capacity of UCESs to improve regional supply–demand relationships and developed a service effectiveness evaluation framework for UCESs in the central urban area of Tianjin under an earthquake scenario. We identified emergency shelter spaces within the campuses and developed a campus–city collaborative shelter capacity model to determine their service supply capacity. Then we quantified regional service demand driven by seismic risk. Finally, we quantified the service effectiveness of each UCES by constructing a service effectiveness evaluation model. Results showed that (1) the total shelter capacity and service coverage of 13 UCESs accounted for approximately 32.1% of the central district’s population and 67.5% of its land area, indicating their strong potential to provide large-scale ESSs. (2) Average seismic risk values ranged from 0.200 to 0.260, exhibiting the characteristic of being higher in the south and lower in the north. (3) Service effectiveness was classified into three levels—higher (1.150–1.257), medium (0.957–0.988), and lower (0.842–0.932)—corresponding to planning interventions that can be implemented based on them. This study aims to reveal differences between different UCESs to improve regional supply–demand relationships by evaluating their service effectiveness and supporting refined emergency management and planning decisions.

1. Introduction

With the ongoing advancement of urbanization and industrialization, the systemic and complex nature of urban disaster risks is increasingly exacerbated [1]. As a critical component of public safety and emergency management, emergency shelters (ESs) are increasingly recognized for their role as the “last line of life defense” [2]. However, in current planning practices, issues such as spatial imbalance and mismatches in supply–demand relationships continue to hinder the high-quality development of ESs. In particular, ESs are scarce in the high-density central districts of China’s mega and super-large cities, and supply–demand conflicts are especially pronounced. Since 2023, the Ministry of Emergency Management and the Ministry of Natural Resources of China have intensively issued policy documents, such as the Guiding Opinions on Actively and Steadily Promoting the Construction of Dual-Use Public Infrastructure in Mega and Super-Large Cities and the Guidelines for Resilient Urban Planning and Land Policy with Integrated Normal and Emergency Functions [3,4]. These documents emphasize promoting integrated uses of urban public infrastructure aligned with emergency service needs under a dual-use (applicable during both normal and emergency times) paradigm, aiming to accelerate ESs’ balanced distribution and quality improvement [5]. In this strategic transition, UCESs demonstrate superior resource endowments and planning value [6]. From a spatial perspective, Chinese university campuses cover an average area of 126 hectares, with over 40% of their land comprising open public spaces suitable for refuge, such as plazas, green areas, and sports fields, indicating strong potential to provide large-scale ESSs to urban residents [7]. From a functional perspective, university campus facilities such as canteens, campus clinics, and backup power supplies can sustain operations for 48 h or longer post-disaster, providing medium-to-long-term ESSs to urban populations [8]. From a locational perspective, most university campuses are adjacent to residential areas and major transportation corridors, facilitating the rapid evacuation of urban residents to campuses during disasters. From a management perspective, the robust campus security systems and predominantly young population contribute to efficiently organizing emergency responses. However, although the construction of UCESs was piloted in Chongqing in 2013—including five universities such as Chongqing University—by June 2024, only 8 out of 36 major cities in China had explicitly designated parts of university campuses as UCESs. Moreover, existing UCESs commonly suffer from structural deficiencies, such as unclear service boundaries, disordered classification systems, and the absence of coordinated planning for bidirectional campus–city demands [9]. The planning and development of UCESs in China urgently require scientific regulatory guidance and practical standards.
Since the late 20th century, international practices have promoted the integration and development of UCESs within emergency service systems through government legislation and the issuance of specialized guidelines [2]. The United States Federal Emergency Management Agency (FEMA) has established a comprehensive implementation framework for UCESs—encompassing resource identification, risk assessment, and mitigation actions—through its guideline Building a Disaster-Resistant University (2003). It has clarified the role of UCESs as hubs within regional disaster coordination networks [10]. The Netherlands’ Ministry of Infrastructure and Water Management has proposed enhancing collaboration between disaster risk reduction planning and higher education institutions in its Infrastructure and Spatial Structure Vision 2040. It has deployed shelter spaces and intelligent regional disaster command centers across 12 university campuses, including Delft University of Technology [11]. The Japanese Cabinet has revised the Disaster Countermeasures Basic Act 47 times and has supported universities in developing business continuity plans (BCPs) for performance evaluation and operational management of UCESs. As a result, it has progressively designated 100% of national universities (86), 100% of public universities (103), and 78% of private universities (478) as UCESs, effectively alleviating regional supply–demand imbalances in ESS [12].
International practices demonstrate that UCESs, as supplementary emergency service facilities within the urban stock planning stage, serve as a critical mechanism for improving the supply–demand balance of regional ESSs [13]. More importantly, evaluating the service effectiveness of UCESs as facility nodes within regional supply–demand networks—and identifying the extent to which university campus spatial resources can enhance regional ESS supply–demand relationships—can effectively support planning decision-making [14]. However, several limitations in existing research have hindered the effective implementation of related planning practices: (1) Most prior studies focused on the location suitability assessment and shelter space network construction of individual UCESs, while lacking consideration and evaluation of their service effectiveness from a regional supply–demand perspective [15,16,17]. As a result, they provided insufficient guidance for the refined spatial planning of UCESs. (2) Existing studies encountered bottlenecks in the identification of emergency shelter spaces within UCESs and the coordination of bidirectional campus–city demand [18], which led to insufficient exploration of sheltering potential and unclear service capacity [19], thereby affecting the accuracy of UCESs’ service effectiveness evaluations. To address the limitations, we developed an evaluation framework for assessing the service effectiveness of UCESs in high-density central urban areas, aiming to reveal how UCESs with different spatial resource conditions vary in their capacity to improve regional supply–demand relationships, and to provide evidence to support urban emergency management and planning interventions.
Accordingly, we selected an earthquake—characterized by high unpredictability and severe damage—as the disaster scenario and chose 13 university campuses in Tianjin’s central urban area as the research subjects. We developed a three-stage framework for evaluating the service effectiveness of UCESs, integrating the measurement of UCES shelter supply capacity, regional service demand, and the degree of improvement in regional supply–demand relationships. The primary research questions we aim to address include the following: (1) identifying the service supply capacity of UCESs, including shelter capacity, shelter types, and service coverage areas; (2) revealing differences in the capacity of UCESs to improve regional supply–demand relationships and prioritizing corresponding planning interventions; (3) providing optimization strategies and policy recommendations to enhance the service effectiveness of UCESs in high-density central urban areas.

2. Literature Review

2.1. Construction of Shelter Space Network and Location Suitability for UCESs

University campuses contain many widely distributed public open spaces, which, when utilized as UCESs, naturally form a shelter space network composed of various types of shelter units connected by evacuation routes [2]. Most studies assessed the disaster risks of campus buildings, open spaces, and roads to determine their safety during emergencies. These assessments supported the identification of shelter spaces [20], the planning of evacuation routes [21], and the allocation of emergency facilities [22], forming the basis for constructing refuge space networks with specified capacities and unit divisions [23]. Earthquakes, rainstorms, and fires are the most common hazards considered in risk assessments of campus public spaces. The finite element model (FEM) and seismic vulnerability index (SVI) were commonly used to quantify the structural safety and damage level of campus buildings during earthquakes and to assist in determining the potential collapse impact zones [24,25]. The storm water management model (SWMM) and finite-volume community ocean model (FVCOM) were frequently employed to simulate surface runoff during heavy rainfall on campus grounds, thereby assessing inundation risks for open spaces and roads [20,26]. Fire risk assessments focused on inspecting campus hazard sources, evaluating building fire protection capacity, and analyzing disaster chains triggered by other hazards [27]. In addition, some studies incorporated human-centered perspectives into hazard risk assessments [28]. By employing video surveillance, evacuation drills, and other methods, these studies identified behavioral characteristics of evacuees on campus—such as herding behavior, spatial preferences, and environmental dependence [29,30]. They further integrated agent-based modeling (ABM) and GIS-based siting tools to optimize campus refuge space networks by coupling evacuation behavior [31,32,33].
The location of UCESs directly determines their service capacity within the urban system [34]. Even with sufficient resources and facilities, a UCES cannot perform its intended function if disasters threaten it or make it difficult to access. Previous studies treated facility siting as a multi-objective decision-making (MODM) or multi-criteria decision analysis (MCDA) problem [35,36], considering a variety of factors such as risk exposure, facility capacity, accessibility, and land suitability [37]. Integrating disaster risk assessment with facility siting has become a standard practice [15,17,38]. Researchers simulated disaster scenarios (e.g., floods and earthquakes) or developed risk assessment systems to identify potentially affected areas and populations, thereby aligning facility distribution with spatial risk patterns [16,22,39]. Several studies constructed tripartite risk assessment frameworks integrating hazard, exposure, and vulnerability to identify flood-prone areas in urban environments and to formulate optimized spatial allocation strategies for emergency shelter facilities [40]. Other studies developed generalized seismic fragility models based on machine learning and incorporated the spatial distribution of urban assets to predict and assess seismic risks [41]. In addition, post-earthquake geostatistical analysis based on GIS was introduced to offer a holistic interpretation of urban seismic risk, effectively addressing the limitations of conventional single-disciplinary analytical methods [42]. The disaster risk assessment methods employed in research on facility siting and spatial configuration exhibited considerable diversity. Beyond the aforementioned approaches, historical disaster statistics [43], multi-criteria decision-making [44], remote sensing integrated with GIS [45], and scenario simulation analysis [46] were also widely applied.
In addition to avoiding disaster risks, facility siting must ensure adequate accessibility [47]. Accessibility determines the operational efficiency of the facility [48]. Key considerations include the ease of access from demand points to facility locations and the likelihood that evacuation routes may become inoperative due to disaster impacts [38,49,50]. With the advancement of smart city development and the emergence of large-scale urban data, researchers increasingly adopted artificial intelligence algorithms—such as random forest (RF) and support vector machine (SVM) algorithms [51,52,53]—alongside traditional location models including P-Median, P-Center, location set covering problem (LSCP), and maximum covering location problem (MCLP) to support emergency shelter siting [54,55]. For example, one study introduced a variational graph autoencoder combined with a random forest (VGAE-RF) model to predict optimal emergency shelter locations in urban Beijing [56], capturing latent spatial correlations among constraints such as disaster risks and transportation networks that traditional approaches may overlook. For UCESs, ideal location selection requires a balance between safety—characterized by low disaster exposure—and accessibility—defined by proximity to vulnerable populations and ease of access during emergencies [20]. However, relevant practice has shown that even when general suitability criteria are met, there may still be a mismatch between the locations of emergency shelters and the spatial distribution of demand during actual disasters [56]. In other words, choosing locations that are both safe and accessible is a necessary condition, but not a sufficient one for ensuring service effectiveness—ultimately, the siting of emergency shelters is a form of social resource allocation based on the distribution of shelter demand [57]. This recognition leads to the next critical discussion: evaluating the service effectiveness of emergency shelters through supply–demand analysis.

2.2. Evaluation of Service Effectiveness Based on Supply–Demand Analysis

2.2.1. Conceptualization and Assessment Methods for ES Service Effectiveness from a Supply–Demand Alignment Perspective

In the field of ES research, service effectiveness is commonly defined as a facility’s ability to provide shelter space, supplies, and medical services promptly and effectively during a disaster [58], thereby safeguarding lives and meeting basic survival needs [59]. A scientific assessment of this effectiveness constitutes the prerequisite and cornerstone for enhancing urban disaster-response capacity [60], whose core dimension lies in the degree of alignment between resource supply and shelter demand [54,61,62,63]. Such alignment is reflected not only in static capacity but also in a dynamic, multidimensional, and spatial resource-matching process [64]. Key challenges include the spatiotemporal heterogeneity and complexity of demand (e.g., population mobility and stratified needs), shortages and uneven distribution of resources, and the uncertainty of emergency evacuations [59]. Traditional assessments typically employed static indices—such as the ratio of shelter capacity to regional population or the service-population gap [65,66]—an approach that was simple and intuitive and was often applied during macro-planning [57]. However, because these methods ignored dynamic population changes and actual evacuation demand, they exhibited significant limitations in dynamic disaster scenarios and failed to capture post-disaster population flows and real-time resource allocation with precision [67]. In recent years, scholars introduced dynamic demand-prediction models such as the post-disaster homeless population estimation model (PDHPEM) [68] and the long-term shelter-seeking population ratio prediction model (LTSPRPM) [69]. By accounting for temporal variations in population distribution and mobility, these models now accurately predict the evolution of shelter demand and effectively prevent supply–demand imbalances caused by timing discrepancies.
With advances in spatial big-data technologies, the use of real-time sources—mobile signaling data, population heat-map data, and location-based services (LBSs)—precisely depicts population distribution and mobility, markedly enhancing the accuracy and timeliness of emergency shelter demand forecasting and supply–demand alignment [70,71]. For example, the practical implementation of Tencent Location Big Data in Shanghai’s Pudong New Area showed that real-time spatial data accurately revealed temporal and spatial variations in population density, thereby enabling more precise and timely allocation of shelter resources [72]. Moreover, studies that integrate disaster risk analysis with population exposure assessment further enhance the precision of shelter-demand prediction [59,62]. By analyzing the scale of population exposure, degrees of building damage, and potential shelter demand under specific disaster scenarios, researchers were able to pinpoint high-risk areas and exposure characteristics more precisely, significantly strengthen the focus and effectiveness of supply–demand matching schemes, and ensure that limited shelter resources were allocated with precision and efficiency [73].

2.2.2. Spatial Accessibility-Driven Assessment of ES Service Effectiveness and Optimization of Supply–Demand Alignment

Spatial accessibility is now recognized as a key indicator for assessing the service effectiveness of ES from a supply–demand alignment perspective [60]. The two-step floating catchment area (2SFCA) method and its derivative models—Dynamic 2SFCA (D2SFCA) [74], Gaussian 2SFCA (Ga2SFCA) [75], three-step floating catchment area (3SFCA) [76], and Huff 2SFCA (H2SFCA) [77]—were widely used to analyze spatial accessibility between shelters and affected populations. These models dynamically adjusted service radii and incorporated diverse transport modes and travel behaviors, thereby more realistically capturing residents’ evacuation needs and patterns under disaster scenarios and enhancing both the scientific rigor and practical utility of accessibility assessments [78,79]. Meanwhile, to promote evidence-based shelter siting and equitable resource allocation, location–allocation models were also extensively applied to optimize the spatial layout of emergency facilities [35]. By precisely analyzing spatial disparities between regional population distribution and shelter demand, these optimization models effectively improved resource use efficiency and spatial equity while markedly reducing service failures stemming from supply–demand mismatches [67].
When analyzing spatial accessibility, the service effectiveness of ESs is fully coupled with population distribution, facility spatial configuration, and the structure of the road network [58]. By constructing an accessibility index centered on travel time thresholds, road network connectivity, and evacuation bottleneck identification, researchers quantified the actual difficulty of reaching shelters from different demand points and thereby revealed potential service blind spots [80]. Embedding this index within the service effectiveness evaluation framework supplements traditional metrics—capacity, coverage, and demand intensity—by capturing how spatiotemporal accessibility disparities constrain shelter performance, and it provides precise decision support for site optimization, corridor improvement, and tiered intervention strategies [57].

2.2.3. Supply–Demand Mismatch Identification and Multi-Indicator Assessment of ES Service Effectiveness

To effectively identify and quantify spatial mismatches in shelter supply and demand, researchers proposed several dedicated evaluation indices, including the priority index (PRI) [81] and the mismatch coefficient [82]. The PRI is chiefly used to quantify the proportional relationship between shelter capacity and population demand, thereby assessing the overall alignment of supply and demand. The mismatch coefficient goes a step further by measuring discrepancies between the spatial distribution of shelter resources and population locations, directly revealing areas with resource shortages or surpluses [35]. Furthermore, to achieve a more comprehensive assessment of service effectiveness and to guide precise resource optimization strategies, composite approaches such as grey relational analysis, TOPSIS, and the analytic hierarchy process (AHP) were widely applied [83]. These methods considered not only the balance between capacity and population size but also incorporated dimensions such as spatial accessibility, safety, equity, sustainability, and capacity utilization efficiency [84], thereby providing a detailed and holistic picture of current supply–demand alignment and optimization potential for emergency shelters [36].
Relevant research has laid the foundation for evaluating the service effectiveness of UCESs, but several key limitations still remain: (1) Complicated hazard risk assessments related to building structure and hydrogeological conditions made the identification of emergency shelter spaces and the measurement of shelter capacity for UCESs increasingly complex and time-consuming [18,78], thereby limiting the timeliness and accuracy of service effectiveness evaluations. (2) There has been limited applied research specifically focused on UCESs as a distinct type of emergency service facility, and little attention has been paid to the systemic characteristics of university campuses. For example, few studies have considered the dual demand coordination between internal campus populations (faculty and students) and external urban residents [79], resulting in unreasonable capacity allocation, service classification, and coverage delineation for UCESs. (3) Current studies have shown a degree of fragmentation—many have focused either on spatial planning (such as location selection and hazard avoidance) or supply–demand analysis, with few proposing integrated frameworks that combine both dimensions. (4) The concept of service effectiveness still has room for expansion. In addition to quantitative indicators such as supply–demand ratios and accessibility, service effectiveness should incorporate qualitative sheltering aspects, including comfort levels and accommodating vulnerable population needs. Addressing these limitations through future research will contribute to developing an integrated evaluation framework that combines supply–demand perspectives with disaster risk, thereby supporting the comprehensive improvement of UCES service effectiveness.
Moreover, existing studies on service effectiveness predominantly focused on the global spatial matching between groups of ESs and overall population distributions at the macro-regional scale, and they lacked support for evaluating the service effectiveness of individual ES units at meso- and micro-scales and for informing intervention decisions [85]. To address this gap and overcome scale limitations, our study aims to establish a systematic perspective and methodology for measuring and analyzing the service effectiveness of UCESs at a coupled campus–city scale. It investigates how individual UCESs differ in their ability to enhance overall urban ESS supply–demand alignment, thereby supporting fine-grained planning interventions for UCESs and providing a generalizable service effectiveness assessment tool for other dual-use public infrastructure during the urban stock development phase.

3. Materials and Methods

3.1. Disaster Scenario and Data

Compared to meteorological hazards such as floods and storm surges, earthquakes are more challenging to predict regarding timing and intensity, often preventing emergency management agencies from issuing effective early warnings or organizing timely evacuations [83]. Therefore, we selected earthquakes as the disaster scenario. Table 1 shows the data types and sources used in this study, including built environment data of university campuses, seismic risk assessment indicators data for Tianjin, and basic information data of ESs in Tianjin.
We primarily used UAV data, building vector data, POI data, ES data, and geospatial information. The UAV data were collected independently by our research team. From September to November 2024, we used a DJI Mavic 3E (SZ DJI Technology Co Ltd, Shenzhen, China) drone to capture a total of 128,630 visible-light images of university campuses under clear weather conditions. The original UAV imagery was then processed using the Agisoft Metashape Pro V2.2.1, supported by aerial triangulation, resulting in 3D point cloud models for 13 university campuses. These point clouds were further processed using CloudCompare V2.11.0 to perform object classification and separation, from which we calculated normalized Digital Surface Model (nDSM) containing building height information. For urban building and road vector data, we retrieved 2024 datasets via the Gaode Map API V12.05.01, integrated into an R environment. By configuring search URLs, API keys, and nesting loop statements, we identified and extracted building footprints and road geometries, saving the results in .rds format. The data were subsequently georeferenced through synthesis and coordinate transformation. The POI data were obtained through a similar procedure. ES data were provided by the Bureau of Emergency Management of Tianjin in .xlsx format. We geocoded the shelters based on their names and addresses to obtain their geographic coordinates (latitude and longitude). Most of the geospatial information data were acquired from the GEE platform, while the 2020 GDP data were generated independently based on the methods outlined in reference [86].

3.2. Study Area

Tianjin is a municipality directly under the central government and a national central city in China. Its central urban area covers 371 Km2 and has a population of approximately 4.2 million, making it a typical high-density urban district. Regarding seismic hazards, Tianjin is located on the eastern edge of the North China Plain seismic belt. It is recognized as a significant seismic monitoring and protection region in China [87], presenting urgent disaster prevention, mitigation, and ES planning needs. In terms of higher education infrastructure, as of the end of 2024, Tianjin hosts 56 general and vocational higher education institutions. Among them, 22 universities are located in the central urban area, encompassing 27 campuses (as some universities operate multiple sites) [88].
To ensure the representativeness of the study sites, we conducted a systematic field investigation of the university campuses and their surrounding environments using drone photogrammetry and fieldwork. The investigation revealed several key findings. First, university campuses in this area are generally surrounded by numerous, densely populated communities, indicating the feasibility of providing ESSs from campuses to adjacent urban neighborhoods. However, the level of demand for UCESs varies across different campus surroundings. Second, the southeastern portion of Tianjin’s central urban area is traversed by the Haihe Fault Zone, exposing many university campuses in this region to considerable seismic risk. Third, university campuses differ significantly in terms of land area and spatial configuration. Therefore, it is necessary to identify campuses with large land coverage and abundant public open space that have greater potential to provide ESSs to surrounding urban areas.
Therefore, we focused on analyzing the potential and necessity of these campuses to function as UCESs. Based on population data, official emergency shelter facility data, and built environment indicators, we further screened 27 existing university campuses in the central urban area of Tianjin. The specific selection criteria are as follows: (1) A 5 km buffer zone—corresponding to the maximum service radius for emergency shelters under current Chinese standards [89]—was generated from each campus entrance, and only campuses whose buffer zones had a population density exceeding 15,000 persons/km2 (a widely accepted threshold for high-density urban areas [90]) were retained. This criterion confirms the high-density characteristics of the surrounding urban environment. (2) The per capita effective shelter area within the 5 km buffer zone was less than 2.0 m2, which is below the minimum per capita shelter space required by national guidelines. This criterion indicates a shortage of emergency shelter resources in the surrounding area and, consequently, a strong necessity for the campus to provide supplementary ESS to nearby communities. (3) The ratio of existing public open space within the campus to the total campus population exceeded 3.0 m2/person, surpassing the maximum per capita shelter area standard defined by current regulations. This criterion demonstrates that the campus not only meets the internal demand for shelter in extreme disaster scenarios but also possesses surplus capacity to support external communities. Based on these criteria, we ultimately selected 13 campuses affiliated with 11 universities in Tianjin’s central urban area as the study sample (Table 2). Among them, the Hongqiao Campus of Hebei University of Technology includes three sub-campuses: North, South, and East. The spatial distribution of the 13 selected campuses is illustrated in Figure 1.

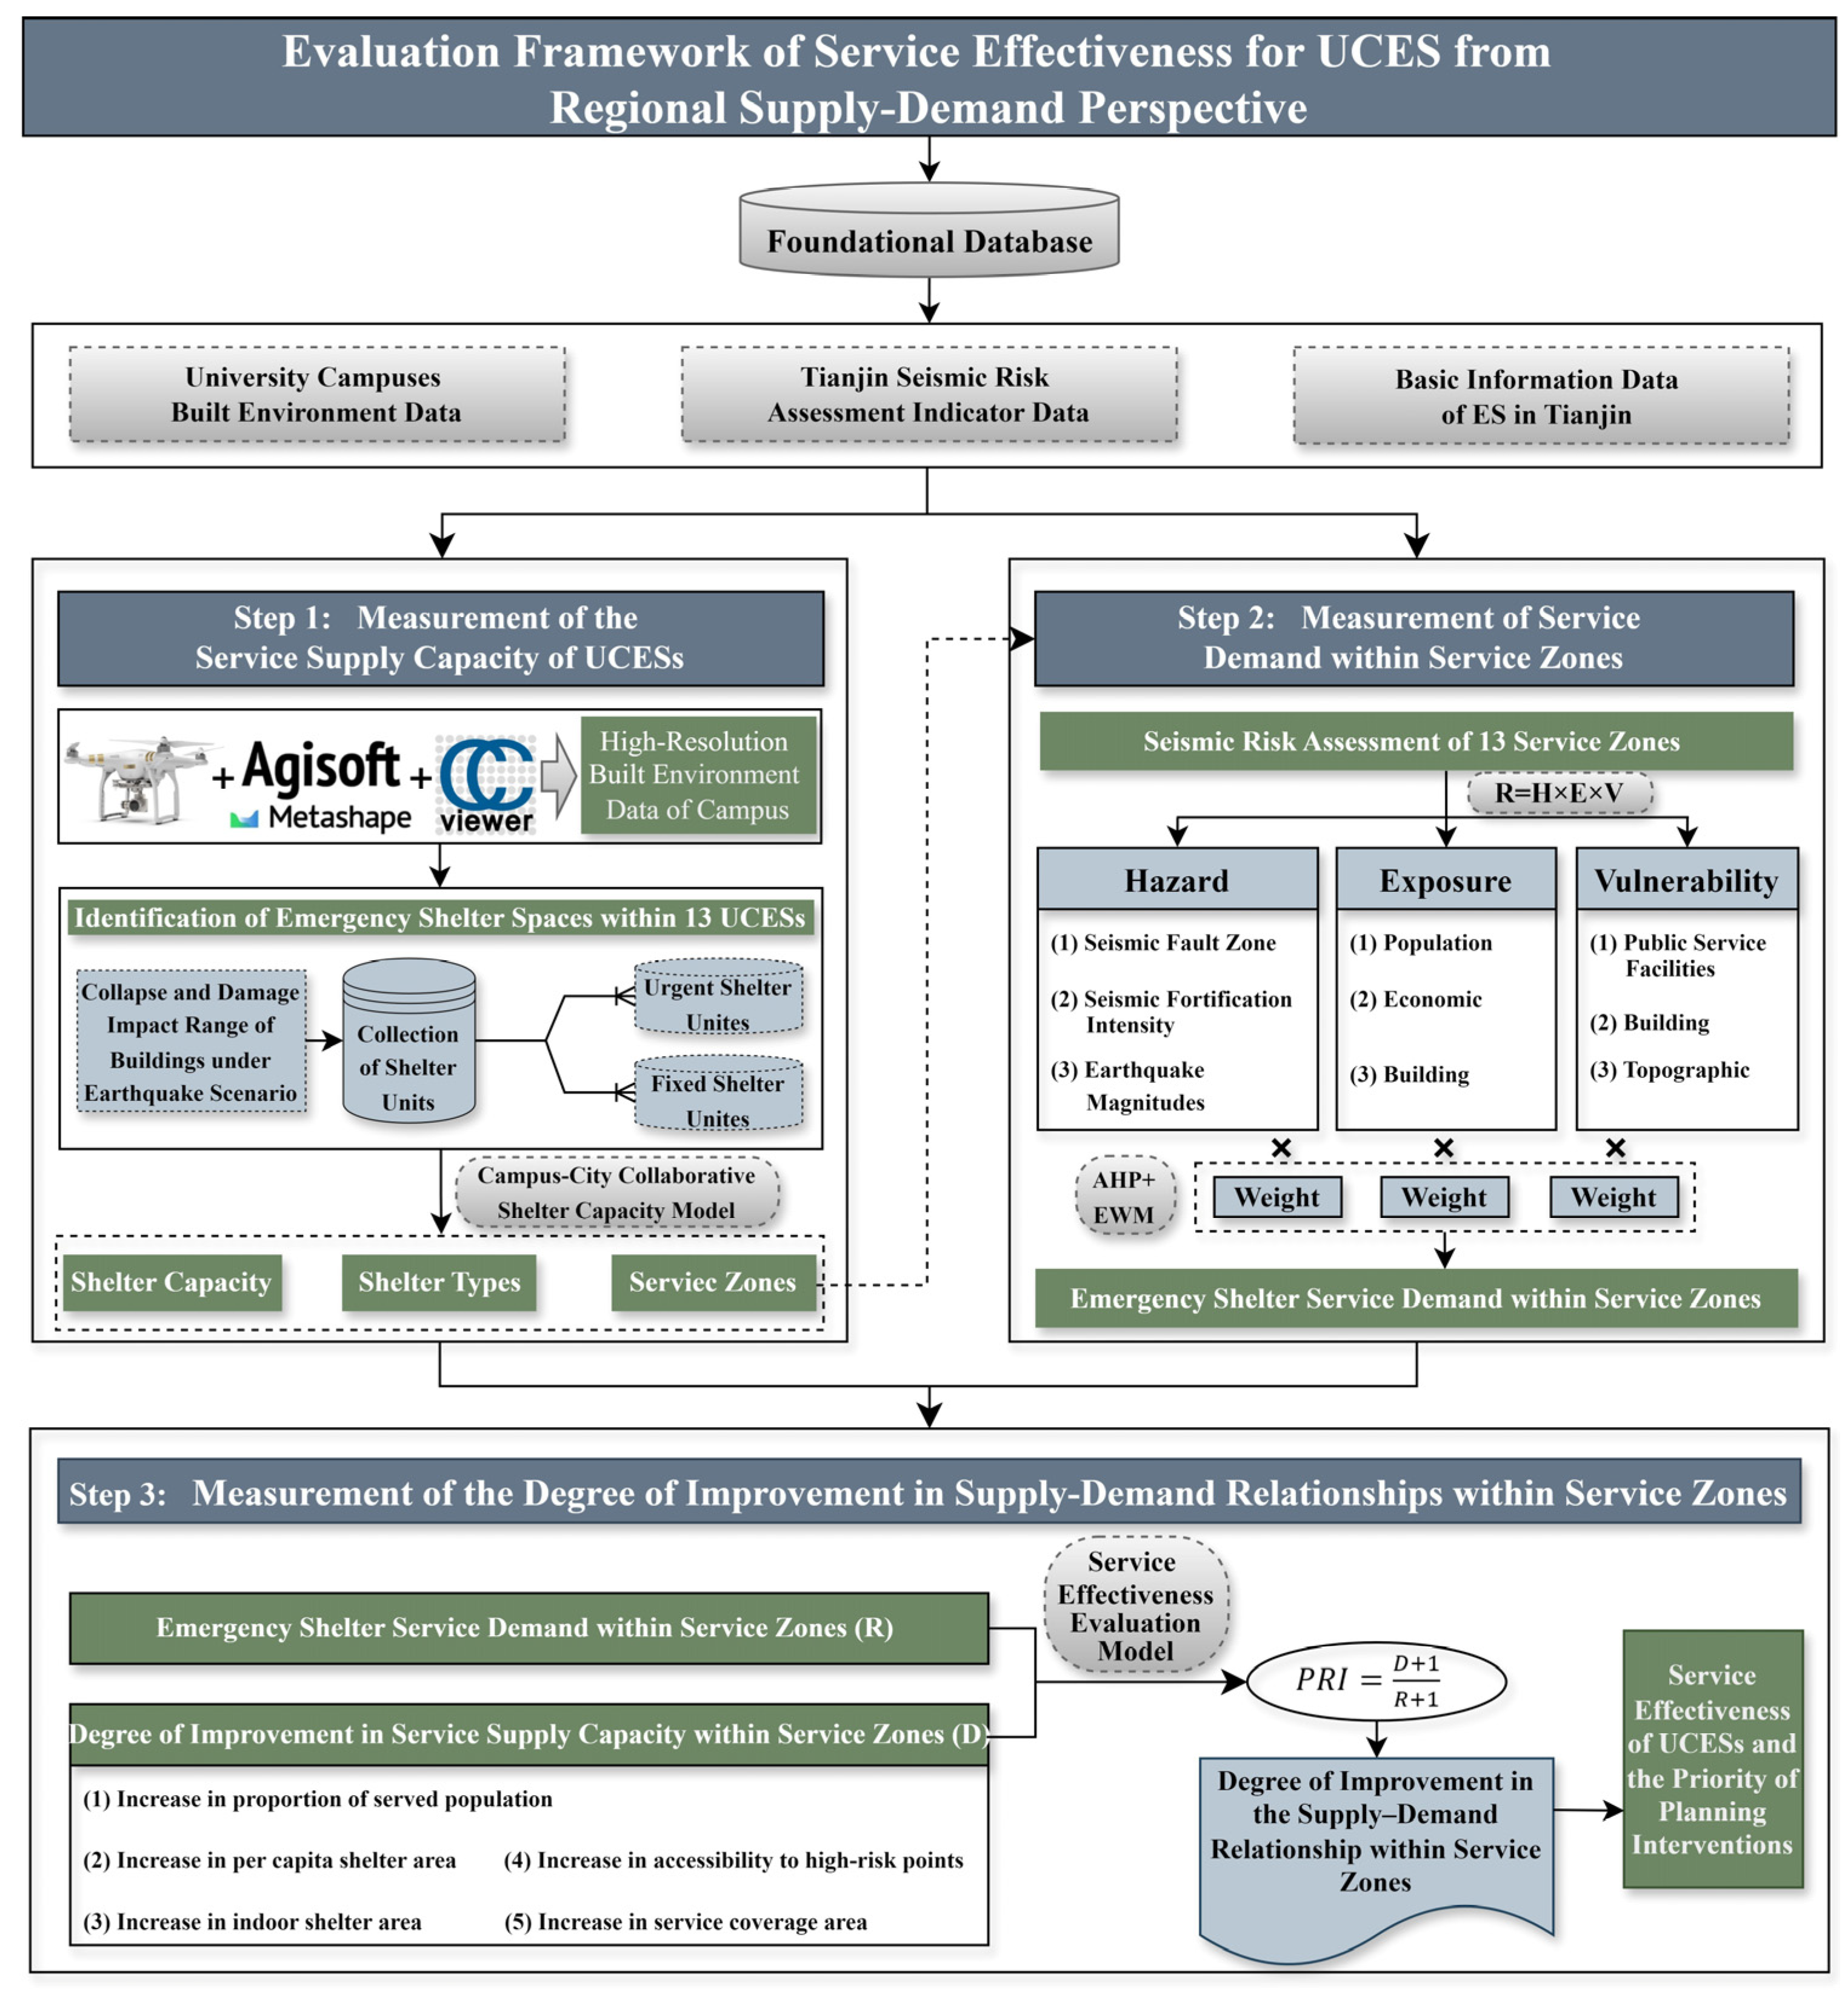
3.3. Evaluation Framework of UCESs Service Effectiveness

The service effectiveness evaluation framework shown in Figure 2 consists of three components: the measurement of service supply capacity of UCESs, the measurement of service demand levels within service zones, and the assessment of the degree of supply–demand improvement within service zones.
(1) Measurement of the service supply capacity of UCESs. We identified emergency shelter spaces across 13 university campuses under an earthquake scenario. Then we calculated the total shelter capacity of each campus and its redundant shelter capacity for serving the surrounding urban area. Next, based on the redundant shelter capacity, we determined the shelter type, service radius, and service zone extent of each UCES. The service zone refers to the spatial area within which a UCES delivers ESSs to the city, positioning the campus as a critical source for accessing shelter services.
(2) Measurement of service demand within the service zones. We constructed an assessment index system to measure the seismic risk within each service zone and used the average risk value to represent the corresponding demand level for ESSs.
(3) Measurement of the degree of improvement in supply–demand relationships within service zones. We developed a service effectiveness evaluation model for UCESs based on the priority index (PRI). The model quantified the extent to which each UCES improved ESS supply capacity within its service zone and subsequently assessed the degree of supply–demand relationship improvement by incorporating service demand.

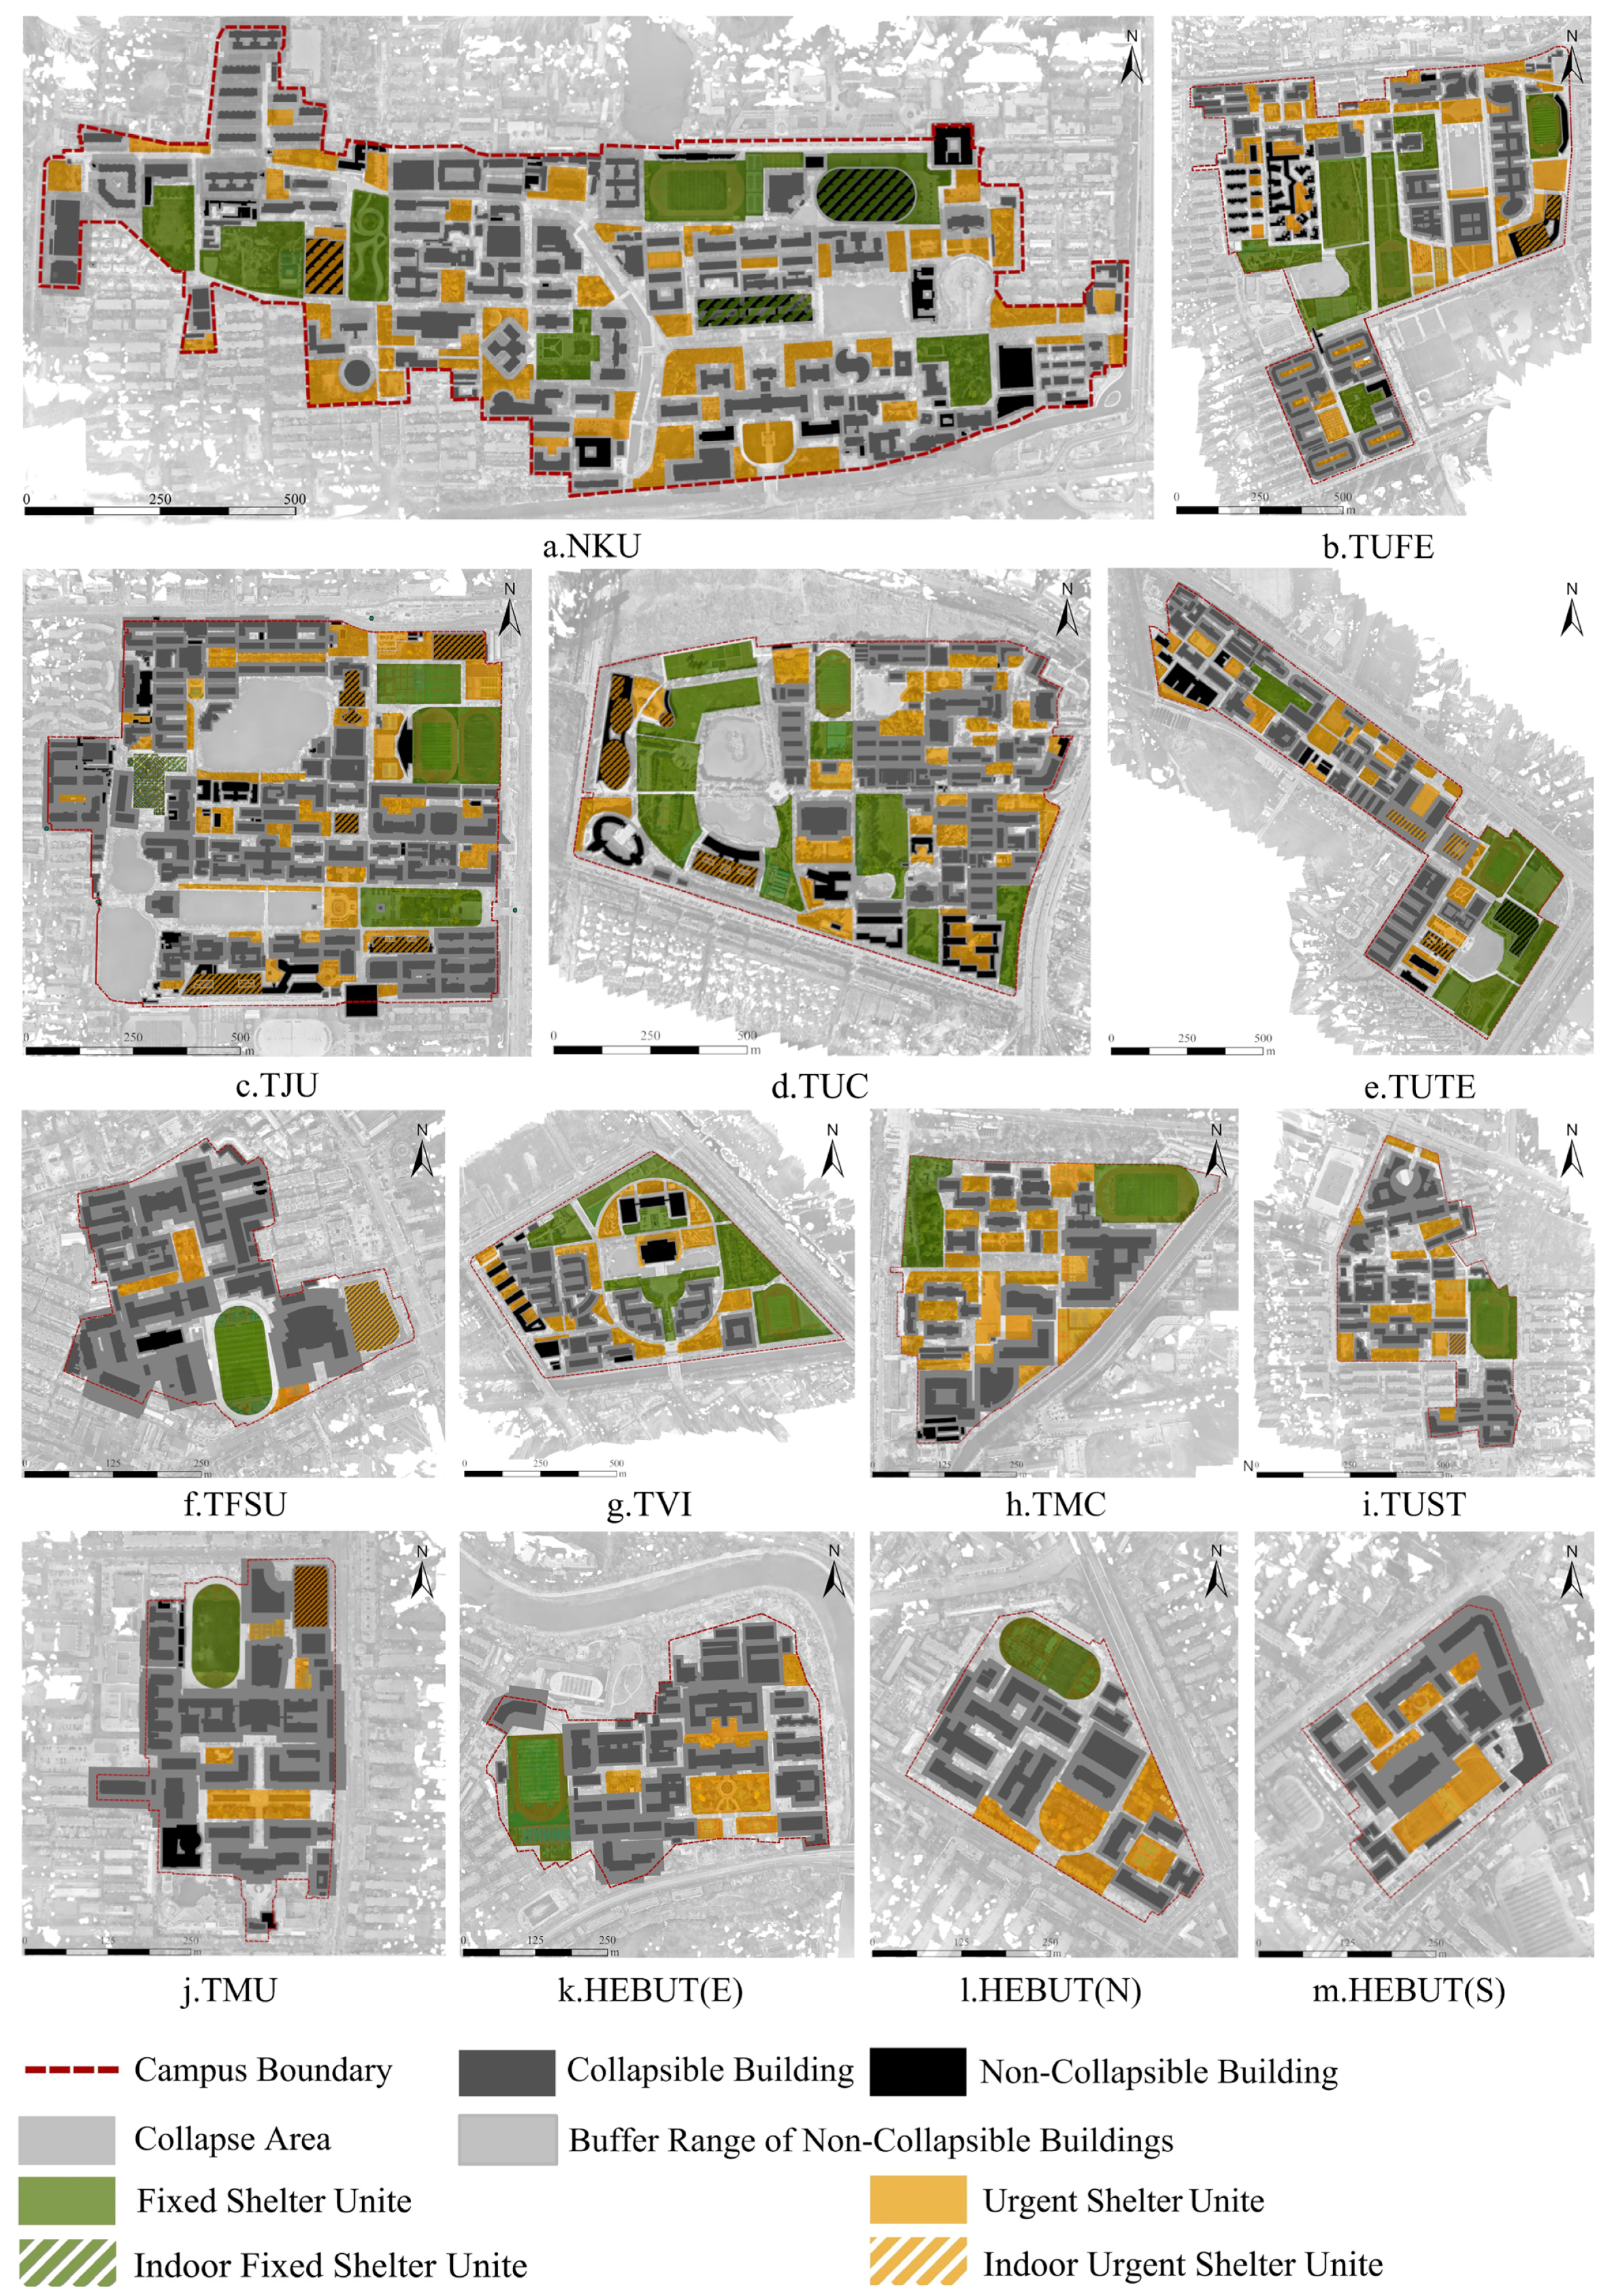
3.3.1. Identification of Emergency Shelter Spaces Within UCESs

The collapse and damage impact range of university campus buildings under an earthquake scenario serves as the basis for delineating potential hazard zones and identifying usable shelter spaces [91]. According to the Chinese national standard Code for Design of Disasters Mitigation Emergency Congregate Shelter (GB 51143-2015) [92], the impact width of building collapse caused by earthquakes was calculated using Equation (1), while the safety buffer zone for non-collapsing buildings was determined based on a 3 m clearance to prevent falling debris. The following three types of university campus buildings are considered non-collapsing under seismic conditions: (1) Buildings designed and constructed following the Chinese national standard Code for Seismic Design of Buildings (GB 50011-2010) [93], i.e., completed after December 1, 2010; (2) buildings with special or enhanced seismic fortification as specified in the Chinese national standard Standard for Classification of Seismic Protection of Building Constructions (GB 50223-95/2004/2008) [94]; (3) buildings with superior seismic performance, characterized by structural systems such as space frames, latticed shells, suspension cables, or tensile membrane structures.
W = K × H
where W represents the impact width of building collapse, defined as the distance from the outer edge of the building to the edge of the debris; K is the width coefficient, with values specified in Table 3; H denotes the building height.
In addition, high-resolution built environment data is the foundation for calculating the impact range of building collapse and structural damage [95]. We used a DJI Mavic 3E drone to capture visible-light imagery of 13 university campuses. Then we conducted aerial triangulation and point cloud modeling in Agisoft Metashape to generate campus DEM, DSM, and DOM data at a 0.1 m resolution. In addition, we applied interpolation operations in CloudCompare to construct a normalized digital surface model (nDSM), from which we extracted building footprints, building heights, and campus terrain information [96]. The nDSM is calculated using Equation (2):
nDSM (x, y) = DSM (x, y) − DEM (x, y)
where DSM (x, y) represents the elevation value at the x-th row and y-th column of the DSM grid; DEM (x, y) represents the elevation value at the x-th row and y-th column of the DEM grid.
Accordingly, we used the ArcGIS 10.8 platform to map the collapse impact zones of buildings across 13 university campuses. Emergency shelter spaces were then identified through reverse screening, and a collection of campus emergency shelter units was subsequently established. According to the local standard Construction Requirements of Emergency Shelters (DB12/T 1031-2021) [97] in Tianjin, secured public spaces within campuses larger than 1000 m2 were defined as urgent shelter units, and those larger than 10,000 m2 were classified as fixed shelter units. Due to their larger capacity, fixed shelter units can be equipped with lodging functions and supporting facilities, enabling them to provide mid-to-long-term ESSs.

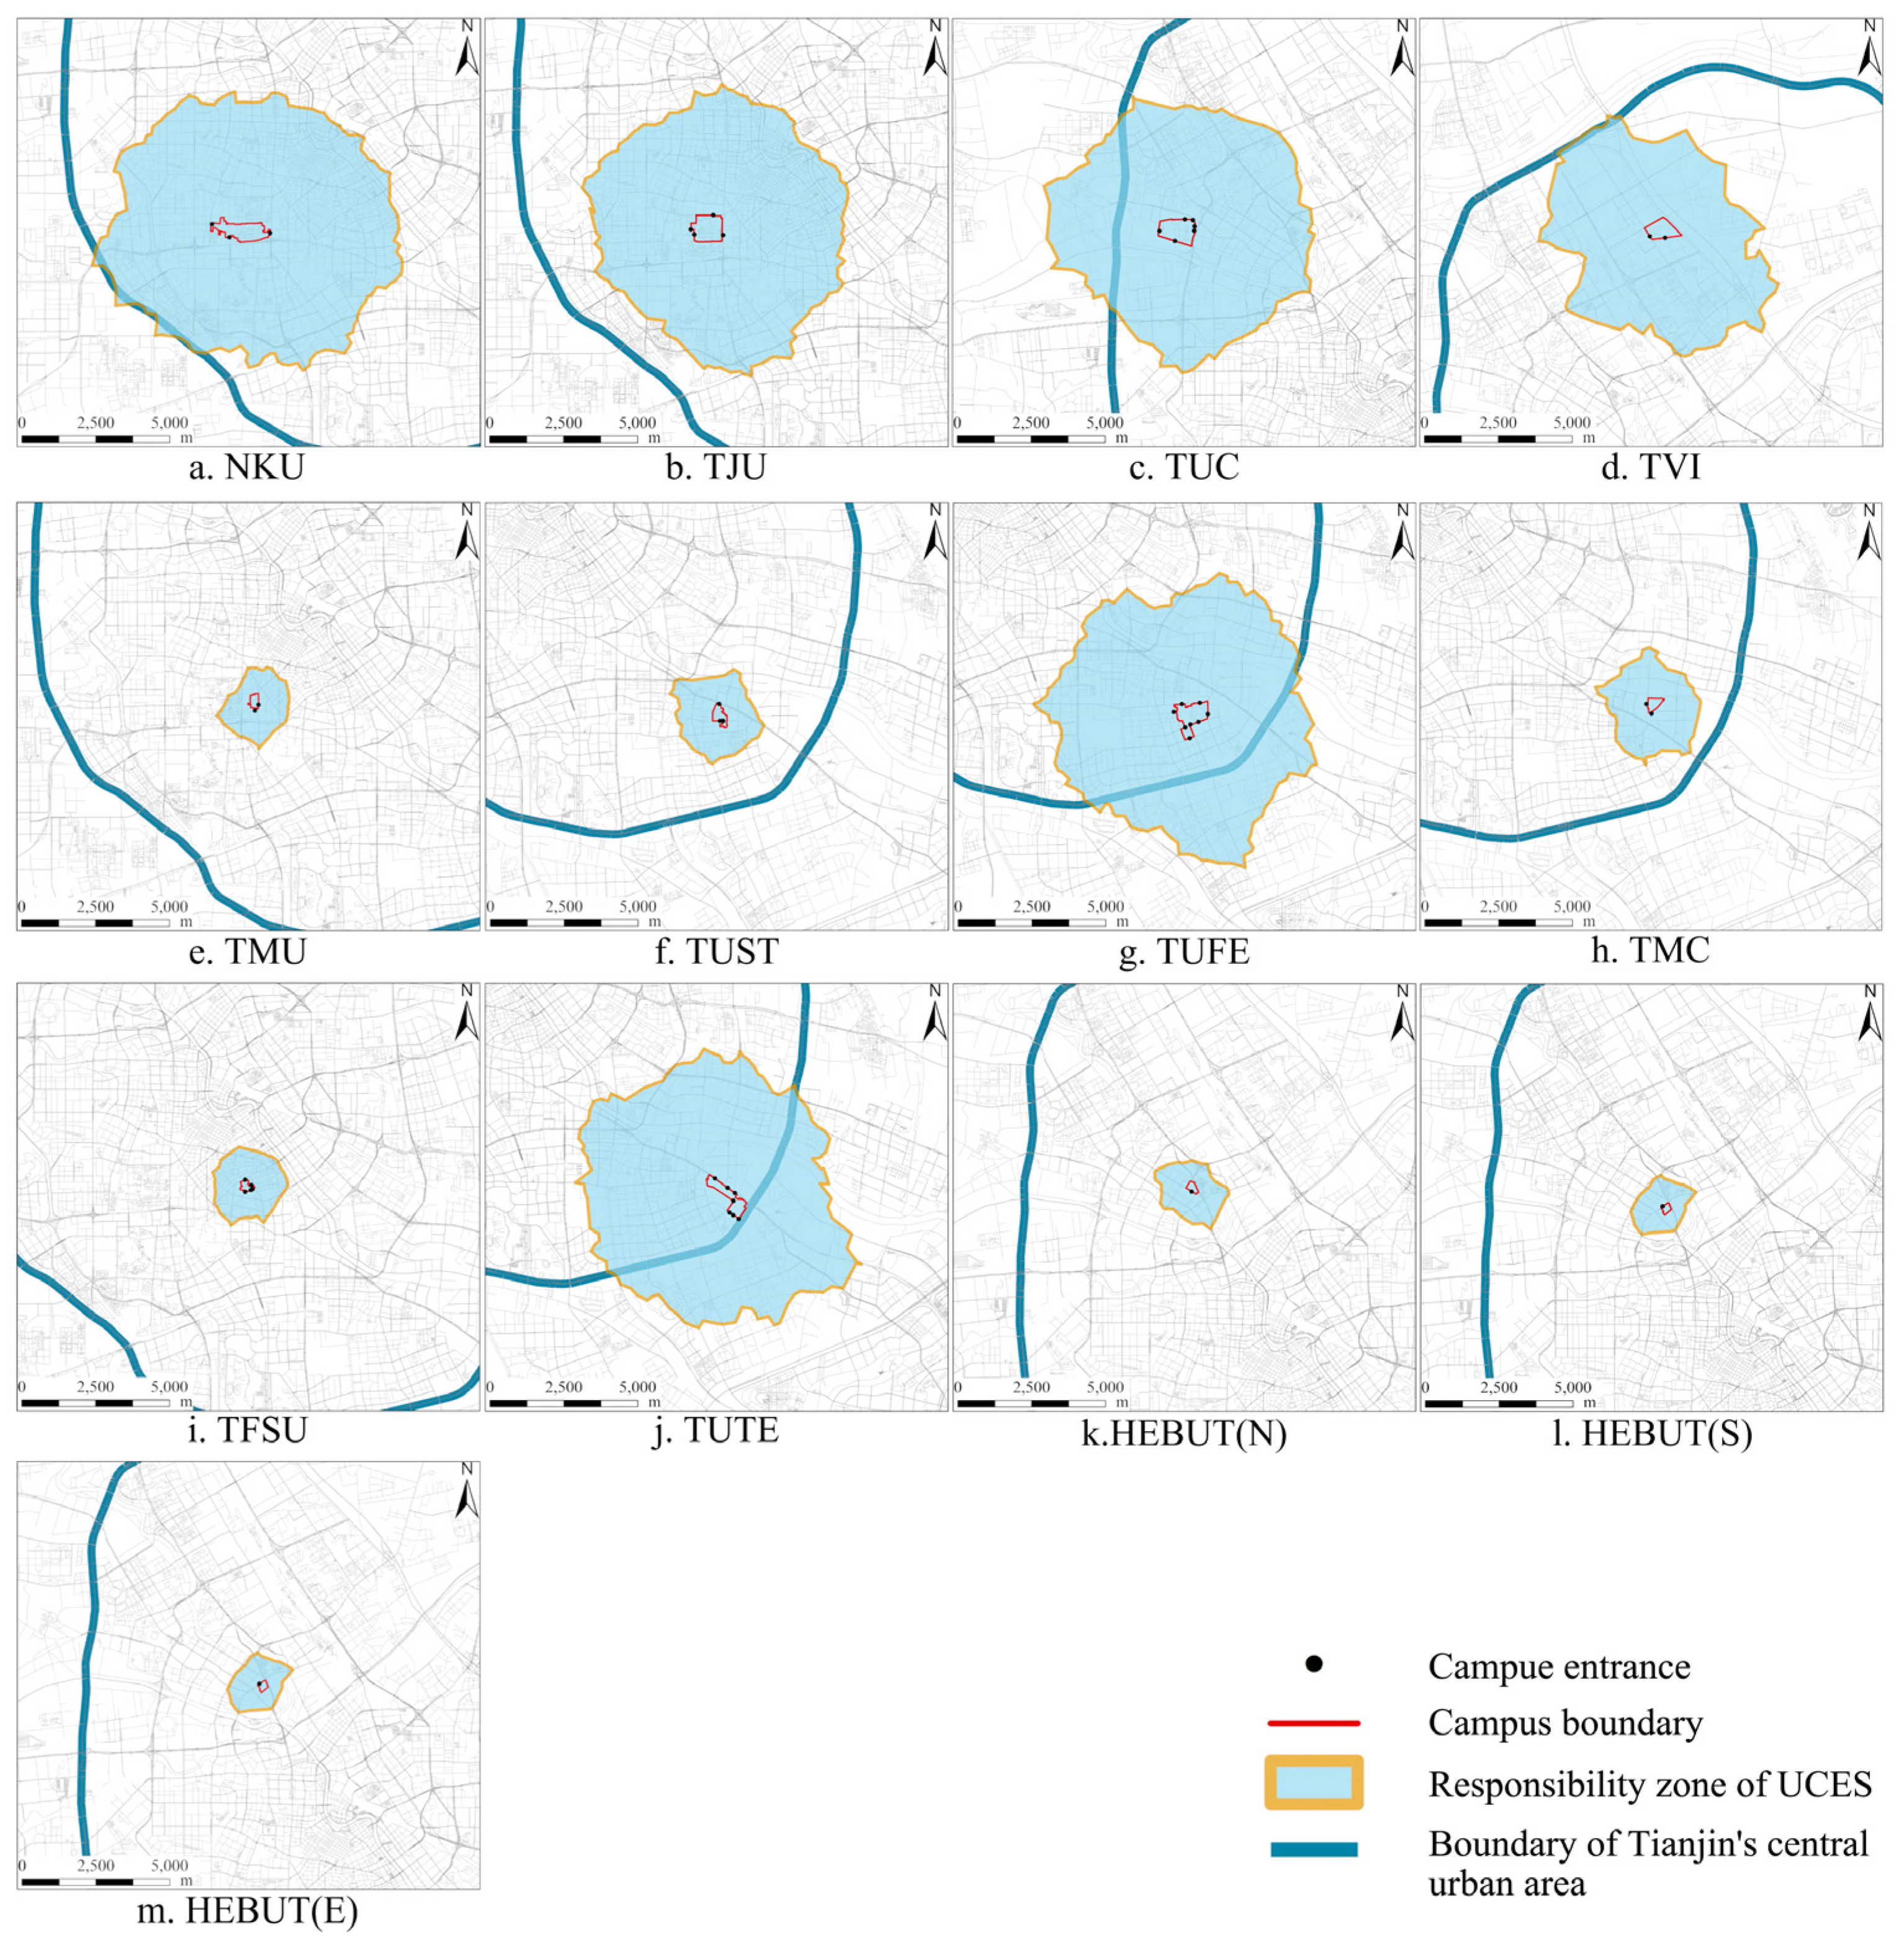
3.3.2. Capacity Measurement, Type Classification, and Service Zone Delineation for UCESs

We developed the campus–city collaborative shelter capacity model shown in Equation (3), based on integrating campus–urban bidirectional shelter demand. According to Construction Requirements of Emergency Shelters (DB12/T 1031-2021) in Tianjin, we used a standard of 1 m2 of effective shelter area per person for urgent shelter units and 2 m2 per person for fixed shelter units. We then applied the correction coefficient γ for per capita effective shelter area, as specified in the Chinese national standard Standard for urban planning on comprehensive disaster resistance and prevention (GB/T 51327-2018) [98], to calculate the total shelter capacity of each campus. Next, we subtracted the number of faculty and students from the total capacity to determine the redundant shelter capacity available for urban residents.
C U = i = 1 n A i A p i × 1 γ i P U
where CU represents the redundant shelter capacity; Ai represents the area of the i-th shelter unit; APi represents the per capita effective shelter area of the i-th unit, determined by the type of shelter unit; γi represents the correction coefficient for the i-th shelter unit, with values specified in Table 4; PU represents the number of faculty and students on campus; n represents the number of shelter units within the campus.
Based on the redundant shelter capacity, we determined the shelter type of each of the 13 UCESs following the classification control requirements specified in the Chinese national standard Emergency Shelter—Grading and Classification (GB/T 44013-2024) (Table 5) [89] and delineated the corresponding service zone for each UCES according to the prescribed service radius.

3.3.3. Measurement of ESS Demand Within Service Zones

Most existing studies used regional population size as the sole indicator for measuring ESS demand, with limited consideration of the driving effects of disaster risk, resulting in overly rigid and unrealistic demand estimations [73]. Therefore, we represented the ESS demand level of each UCES service zone using a seismic risk metric that incorporates population factors. Drawing on the widely accepted disaster risk formation mechanism, we regarded seismic risk as the outcome of the interaction among three systemic elements: disaster-inducing factors, disaster-bearing bodies, and disaster-pregnant environments [99]. Disaster-inducing factors represent the “source” of disaster risk [100]. They are triggered by the disaster-pregnant environment and, in turn, exert feedback on it. The disaster-pregnant environment forms the “foundation” of disaster risk formation [101]. Under the premise that the disaster-bearing body provides the core structural support, it serves as the medium through which disaster-inducing factors are transformed into actual disasters. The disaster-bearing body is the material “carrier” of disaster risk and serves as the primary recipient of the interactions between disaster-inducing factors and the disaster-pregnant environment [102]. These three elements belong to distinct spatial systems and play different roles in the formation of disaster risk. Therefore, a comprehensive consideration of the “source–foundation–carrier” relationship is essential for conducting a rational and holistic disaster risk assessment [103]. The seismic risk of a UCES service zone is calculated using Equation (4):
R = H × E × V
where R represents the seismic risk level, which characterizes the ESS demand level within the service zone; H represents the hazard intensity of disaster-inducing factors; E represents the exposure of disaster-bearing bodies; and V represents the vulnerability of the disaster-pregnant environment.
Based on the seismic hazard characteristics of Tianjin’s central urban area and the established disaster risk formation mechanism, we developed a seismic risk assessment indicator system for UCES service zones (Table 6). The system adopted the hazard of disaster-inducing factors, the exposure of disaster-bearing bodies, and the vulnerability of disaster-pregnant environments as the criterion layer and selected 7 indices and 16 factors. The following section explains the selection of each indicator and factor:
(1) Hazard (H) refers to physical natural events that have the potential to cause disasters to human society. We quantify hazard by selecting relevant indicators associated with the seismic environment and earthquake intensity (H1) [104]. For the seismic environment, we use the distance from the seismic fault zone (H11) [105], as areas located closer to fault lines tend to face a higher probability and intensity of seismic events. Regarding earthquake intensity, we select seismic fortification intensity (H12) [106] and historical earthquake magnitudes (H13) [107]. A higher seismic fortification intensity suggests that the area is assessed as having elevated seismic risk and serves as a standardized indicator of potential earthquake impacts. Historical earthquake magnitudes reflect the intensity and frequency of seismic activity in the region; higher magnitudes imply a greater likelihood of strong earthquakes occurring in the future.
(2) Exposure (E) refers to the overall loss caused by an earthquake under a given hazard intensity, encompassing impacts on population (E1), economy (E2), and buildings and roads (E3) [108]. Higher population density (E11) [109] indicates a greater number of people potentially affected during a disaster, leading to higher risks of casualties. The proportion of elderly and children (E12) [110], who are considered vulnerable groups with limited mobility and higher care needs during emergencies, increases the complexity of disaster response and recovery. Higher per capita GDP (E21) [111] reflects greater regional economic development, which implies a larger scale of potential economic losses and higher post-disaster recovery costs. A higher level of regional GDP (E22) [112] corresponds to greater absolute economic exposure, indicating the overall scale of potential economic damage. High building density (E31) [113] suggests an increased likelihood of structural damage during earthquakes, resulting in higher risks to life and property. Similarly, higher road density (E32) [114] reflects a greater extent of infrastructure exposure and may lead to secondary disasters such as traffic congestion and delays in emergency rescue due to road damage.
(3) Vulnerability (V) is the state of susceptibility to harm resulting from exposure to environmental and social stressors and from a lack of adaptive capacity [115]. We quantify vulnerability by selecting influencing factors across three dimensions: public service facilities’ vulnerability (V1), building vulnerability (V2), and topographic vulnerability (V3). A higher density of medical institutions (V11) [11] enhances the region’s capacity for emergency response and medical assistance, thereby reducing disaster vulnerability. A longer distance from fire stations (V12) [27] lowers the timeliness of emergency response and rescue operations, increasing regional disaster risk. A higher density of public security organizations (V13) [37] indicates a stronger capacity to maintain order and provide safety during disasters. Regarding buildings, greater building height (V21) [116] is associated with increased structural vulnerability, as high-rise buildings are more prone to structural damage and secondary risks such as fires and evacuation difficulties during earthquakes. Newer construction dates (V22) [117] indicate better structural performance and lower vulnerability, as recent buildings are typically constructed under stricter seismic codes. In terms of topography, larger differences in ground elevation (V31) [118] suggest a higher risk of secondary disasters such as landslides and collapses triggered by earthquakes. Slopes (V32) [119] indicate increased susceptibility to earthquake-induced secondary hazards and pose additional challenges for evacuation.
Compared with traditional studies that primarily employed population density and per capita economic indicators, our research emphasized the vulnerability of at-risk populations by incorporating the proportion of elderly and young population into the assessment of population exposure. This approach allowed for a more accurate representation of risk characteristics in China’s aging, high-density urban areas [110]. Given the limited number of fire stations in the central urban area of Tianjin, we converted the conventional indicators of fire station count or density into spatial distance measures, which more realistically reflected the spatial accessibility of emergency response services. Furthermore, we integrated both ground elevation difference and slope into the evaluation framework to provide a more comprehensive depiction of how topographic conditions influence the propagation of seismic hazards and the occurrence of secondary disasters. These methodological enhancements significantly improved the precision and practical applicability of the risk assessment system.
Due to inconsistencies in the precision of the original data used for seismic risk assessment, we resampled all datasets into 30 m × 30 m raster grids covering the study area. After data standardization and integration, we constructed a seismic risk dataset for the service zones. After normalizing the indicators using Equations (5) and (6), we applied a combined weighting method integrating the analytic hierarchy process (AHP) and entropy weight method (EWM) to calculate the weights of each evaluation index. The subjective weights were obtained using the AHP. To ensure the rationality of the subjective weights, we use Equation (7) for consistency testing [120]. The objective weights were derived using the EWM, and the calculation process is presented in Equations (8)–(11) [121]. The combined weights are obtained through distance functions [36] as defined in Equations (12)–(15).
Positive   indicators :   Z i j = X i j m i n X j m a x X j m i n X j
Negative   indicators :   Z i j = m a x X j X i j m a x X j m i n X j
where X i j and Z i j are the original and normalized values, respectively, of the j indicator of unit i , i = 1,2 , , n ; j = 1,2 , , m .
C R = λ m a x n / n 1 R I
where λ m a x is the maximum eigenvalue of the pairwise comparison matrix, n signifies the number of indicators, and R I denotes the value of the random consistency index. If the consistency ratio C R < 0.1 , the matrix is deemed to have successfully passed the consistency test.
P i j = Z i j i = 1 n Z i j
H j = k i = 1 n P i j ln P i j
d j = 1 H j ,   j = 1 , , m
w j = d j j = 1 m d j
where in Equation (9) k = 1 ln n > 0 so it satisfies H j 0 ; P i j is the proportion of the value of the i t h unit under the j t h indicator; H j is the entropy value of the j t h indicator; and w j represents the objective weight of the j t h indicator.
W i = α W i + β W i
where Wi represents the combined weight; Wi denotes the subjective weight; Wi denotes the objective weight; α and β are allocation coefficients for the weights, where α + β = 1 .
Equation (13) presents the distance function between Wi and Wi.
d ( W i   , W i   ) = [ 1 2 i = 1 n ( W i W i   ) 2 ] 1 2
Equation (14) provides the expression for the difference between α and β, where d indicates the divergence between the allocation coefficients.
d = α β
Based on the above, the system of equations is constructed as follows:
d ( W i W i   ) 2 = α β 2 α + β = 1

3.3.4. Evaluation of Service Effectiveness for UCESs

We developed a service effectiveness evaluation model for UCESs based on the priority index (PRI) [70], as shown in Equations (16)–(22). The PRI is a multi-criteria decision-support tool that is widely used to evaluate the supply–demand alignment of public resources in the fields of urban planning, infrastructure management, and disaster risk governance [122]. PRI integrates multiple standardized indicators through weighted aggregation, transforming complex service demands, resource supply conditions, and risk factors into a unified priority score [123]. It is particularly suitable for contexts where indicators are heterogeneous, and trade-offs are difficult to quantify, enabling scientific classification of spatial units and prioritization of planning interventions [124]. In this study, the PRI is employed to construct a service effectiveness evaluation model for UCESs, based on two primary considerations. First, the PRI is well-suited for integrating multidimensional and heterogeneous information. The service effectiveness of UCESs is influenced by various factors, including disaster exposure, population density within the service radius, and the adequacy of spatial resources. PRI integrates these indicators to calculate the relative ratio between supply capacity and demand level, identify differences in the ability of different UCESs to improve regional ESS supply–demand alignment, and enable spatial rankings with strong comparability. Second, PRI supports refined resource allocation and phased optimization. It enables the batch-level quantification of planning intervention priorities across multiple UCESs, thereby assisting in the formulation of urgency-based and zoned or staged intervention strategies that enhance both investment efficiency and disaster mitigation outcomes.
The service effectiveness of UCESs was influenced by two key characteristics of the service zone: the degree of improvement in its service supply capacity and its service demand. The seismic risk level determined the service demand. The improvement degree of service supply capacity was measured using five indicators: increase in proportion of served population, increase in per capita shelter area, increase in indoor shelter area, increase in accessibility to high-risk points, and increase in service coverage area. These indicators correspond to the key attributes of ESS, including validity, suitability, safety, accessibility, and fairness [84].
P R I = D + 1 R + 1
where PRI denotes the service effectiveness of a UCES; D represents the degree of improvement in service supply capacity within the service zone; and R represents the service demand in the service zone.
A higher PRI indicates higher service effectiveness, meaning that the UCES contributes more significantly to improving the supply–demand relationship of ESS and thus requires a higher priority for planning intervention.
D = w 1 D R + w 2 D P + w 3 D S + w 4 D A + w 5 D C
where DR denotes the increase in the proportion of the served population; DP denotes the increase in per capita shelter area; DS denotes the increase in indoor shelter area; DA denotes the increase in accessibility to high-risk points; DC denotes the increase in service coverage area; w represents the weight assigned to each dimension. We applied the AHP to determine the indicator weights: w1 = 0.2289, w2 = 0.1923, w3 = 0.1482, w4 = 0.2275, and w5 = 0.2031.
The key attributes, data processing methods, and measurement steps of the above five indicators are as follows:
(1) Validity: Increase in proportion of served population
The proportion of served population refers to the ratio between the total shelter capacity of all ESs in a given region and the total population, representing the baseline capability of the ES system to provide ESSs [38]. If the available shelter capacity cannot accommodate the total population within the region, the ESS provided by the system is considered to lack validity [125]. To capture the contribution of UCESs to improving service coverage, the increase in proportion of served population is defined as the ratio between the proportion of served population after the inclusion of a UCES in the service zone and the original proportion prior to its inclusion. This metric reflects the extent to which the UCES enhances the validity of the ESS—namely, its ability to fill the gap in the number of people served. The normalized formula is as follows:
D R = R U R R 1
where R U denotes the service population ratio of the service zone after incorporating the UCES; R R denotes the original service population ratio of the service zone.
(2) Suitability: Increase in per capita shelter area
The per capita shelter area refers to the ratio between the total effective shelter area of all ESs within a given region and the total population, representing the allocation of shelter resources on a per-person basis [16,33]. A low per capita shelter area reduces shelter comfort, lowers the efficiency of emergency facility deployment, and increases the risk of disease transmission, indicating a lack of suitability in the corresponding ESS [126]. To assess the role of UCESs in improving this condition, the increase in per capita shelter area is defined as the ratio between the per capita shelter area after the addition of a UCES to the service zone and the original per capita shelter area. This indicator reflects the degree to which the UCES enhances the suitability of ESS. The normalized formula is as follows:
D P = P U P R 1
where P U denotes the per capita refuge area of the service zone after incorporating the UCES; P R denotes the original per capita refuge area of the service zone.
(3) Safety: Increase in indoor shelter area
The indoor shelter area refers to the total effective shelter area provided by all indoor ESs within a given region. Indoor shelters help to address the limitations of outdoor shelters in meeting high-quality, medium-to-long-term sheltering needs, and are essential for ensuring the safety of vulnerable groups such as the elderly, children, and persons with disabilities [110]. The increase in indoor shelter area is defined as the ratio between the indoor shelter area after the addition of a UCES to the service zone and the original indoor shelter area. This indicator reflects the extent to which the UCES improves the safety dimension of the ESS. The normalized formula is as follows:
D S = S U S R 1
where S U denotes the indoor sheltering space area of the service zone after incorporating the UCES; S R denotes the original indoor sheltering space area of the service zone.
(4) Accessibility: Increase in accessibility to high-risk points
Accessibility to high-risk points refers to the spatial distance from each high-risk location (i.e., high-demand point) within a service zone to the nearest ES. Higher accessibility implies that residents at these locations incur lower time and distance costs when accessing emergency shelter services (ESSs) and have a higher likelihood of successful evacuation [60,127]. The increase in accessibility to high-risk points reflects the extent to which a UCES improves ESS accessibility for high-risk locations within the service zone. The 13 UCESs considered in this study can be classified into different types of ESs, indicating that high-risk points in different service zones may have access to varying levels of ESSs. Therefore, evaluating changes in accessibility to the same type of ESs—namely, shelters that offer equivalent levels of ESSs—before and after the addition of UCESs provides a more meaningful assessment of their functional contribution. First, we extracted high-risk locations within each service zone based on the seismic risk assessment results. Second, we classified existing ESs in Tianjin according to their shelter capacity, as shown in Table 5. Finally, using the network analysis tool in ArcGIS 10.8, we calculated the spatial distance between each high-risk point and the nearest same-type ES before and after the inclusion of UCESs. Based on these results, we derived the increase in accessibility to high-risk points. The normalized formula is as follows:
D A = 1 A U A R
where A U denotes the accessibility of high-risk points in the service zone to reach ES after incorporating the UCES; A R denotes the original accessibility of high-risk points in the service zone to reach ESs.
(5) Fairness: Increase in service coverage area
Service coverage area refers to the actual spatial extent within which all ESs in a region can provide services based on their designated service radii [53]. If certain areas within a region fall outside the coverage of existing ESs, residents in these uncovered zones may face higher time and distance costs in accessing ESSs, indicating a spatial fairness issue in ESS provision [128]. The increase in service coverage area is defined as the ratio between the uncovered area within a service zone and the total area of that zone, reflecting the extent to which a UCES improves the spatial fairness of ESSs. The calculation is carried out in two steps. First, we determined the service radius for each existing ES in the service zone based on its classification and shelter capacity and generated its service coverage using the Buffer Tool in ArcGIS 10.8. Second, we identified the uncovered areas within each service zone and computed the ratio of the uncovered area to the total zone area, thereby deriving the increase in service coverage area. The calculation formula is as follows:
D C = C R C U
where C R denotes the uncovered area of the original ESs within the service zone; C U denotes the UCES service zone area.

4. Results

4.1. Emergency Shelter Spaces Within UCESs

In October 2024, we used drones to acquire visible light images for the study area. Based on high-resolution built environment data of university campuses and constraints from the earthquake disaster scenario, we identified and constructed the emergency shelter unit collections for 13 UCESs (Figure 3).
Figure 4 illustrates the total shelter area of each UCES and the proportional area distribution among different types of shelter units. In terms of overall shelter area, the total shelter space of NKU, TJU, TUC, TVI, TUFE, and TUTE exceeded 200,000 m2, while that of TMU, TFSU, HEBUT(N), and HEBUT(S) was less than 30,000 m2. Regarding the proportion of urgent and fixed shelter units, fixed shelter units accounted for a larger share in HEBUT(S), TUTE, TUFE, TVI, and TUC. In contrast, urgent shelter units dominated the remaining eight UCESs. In terms of the proportion of indoor and outdoor shelter space, HEBUT(E), HEBUT(S), HEBUT(N), TMC, and TVI lacked indoor shelter units. The remaining eight UCESs had a generally low proportion of indoor shelter space, which was predominantly composed of urgent shelter units.

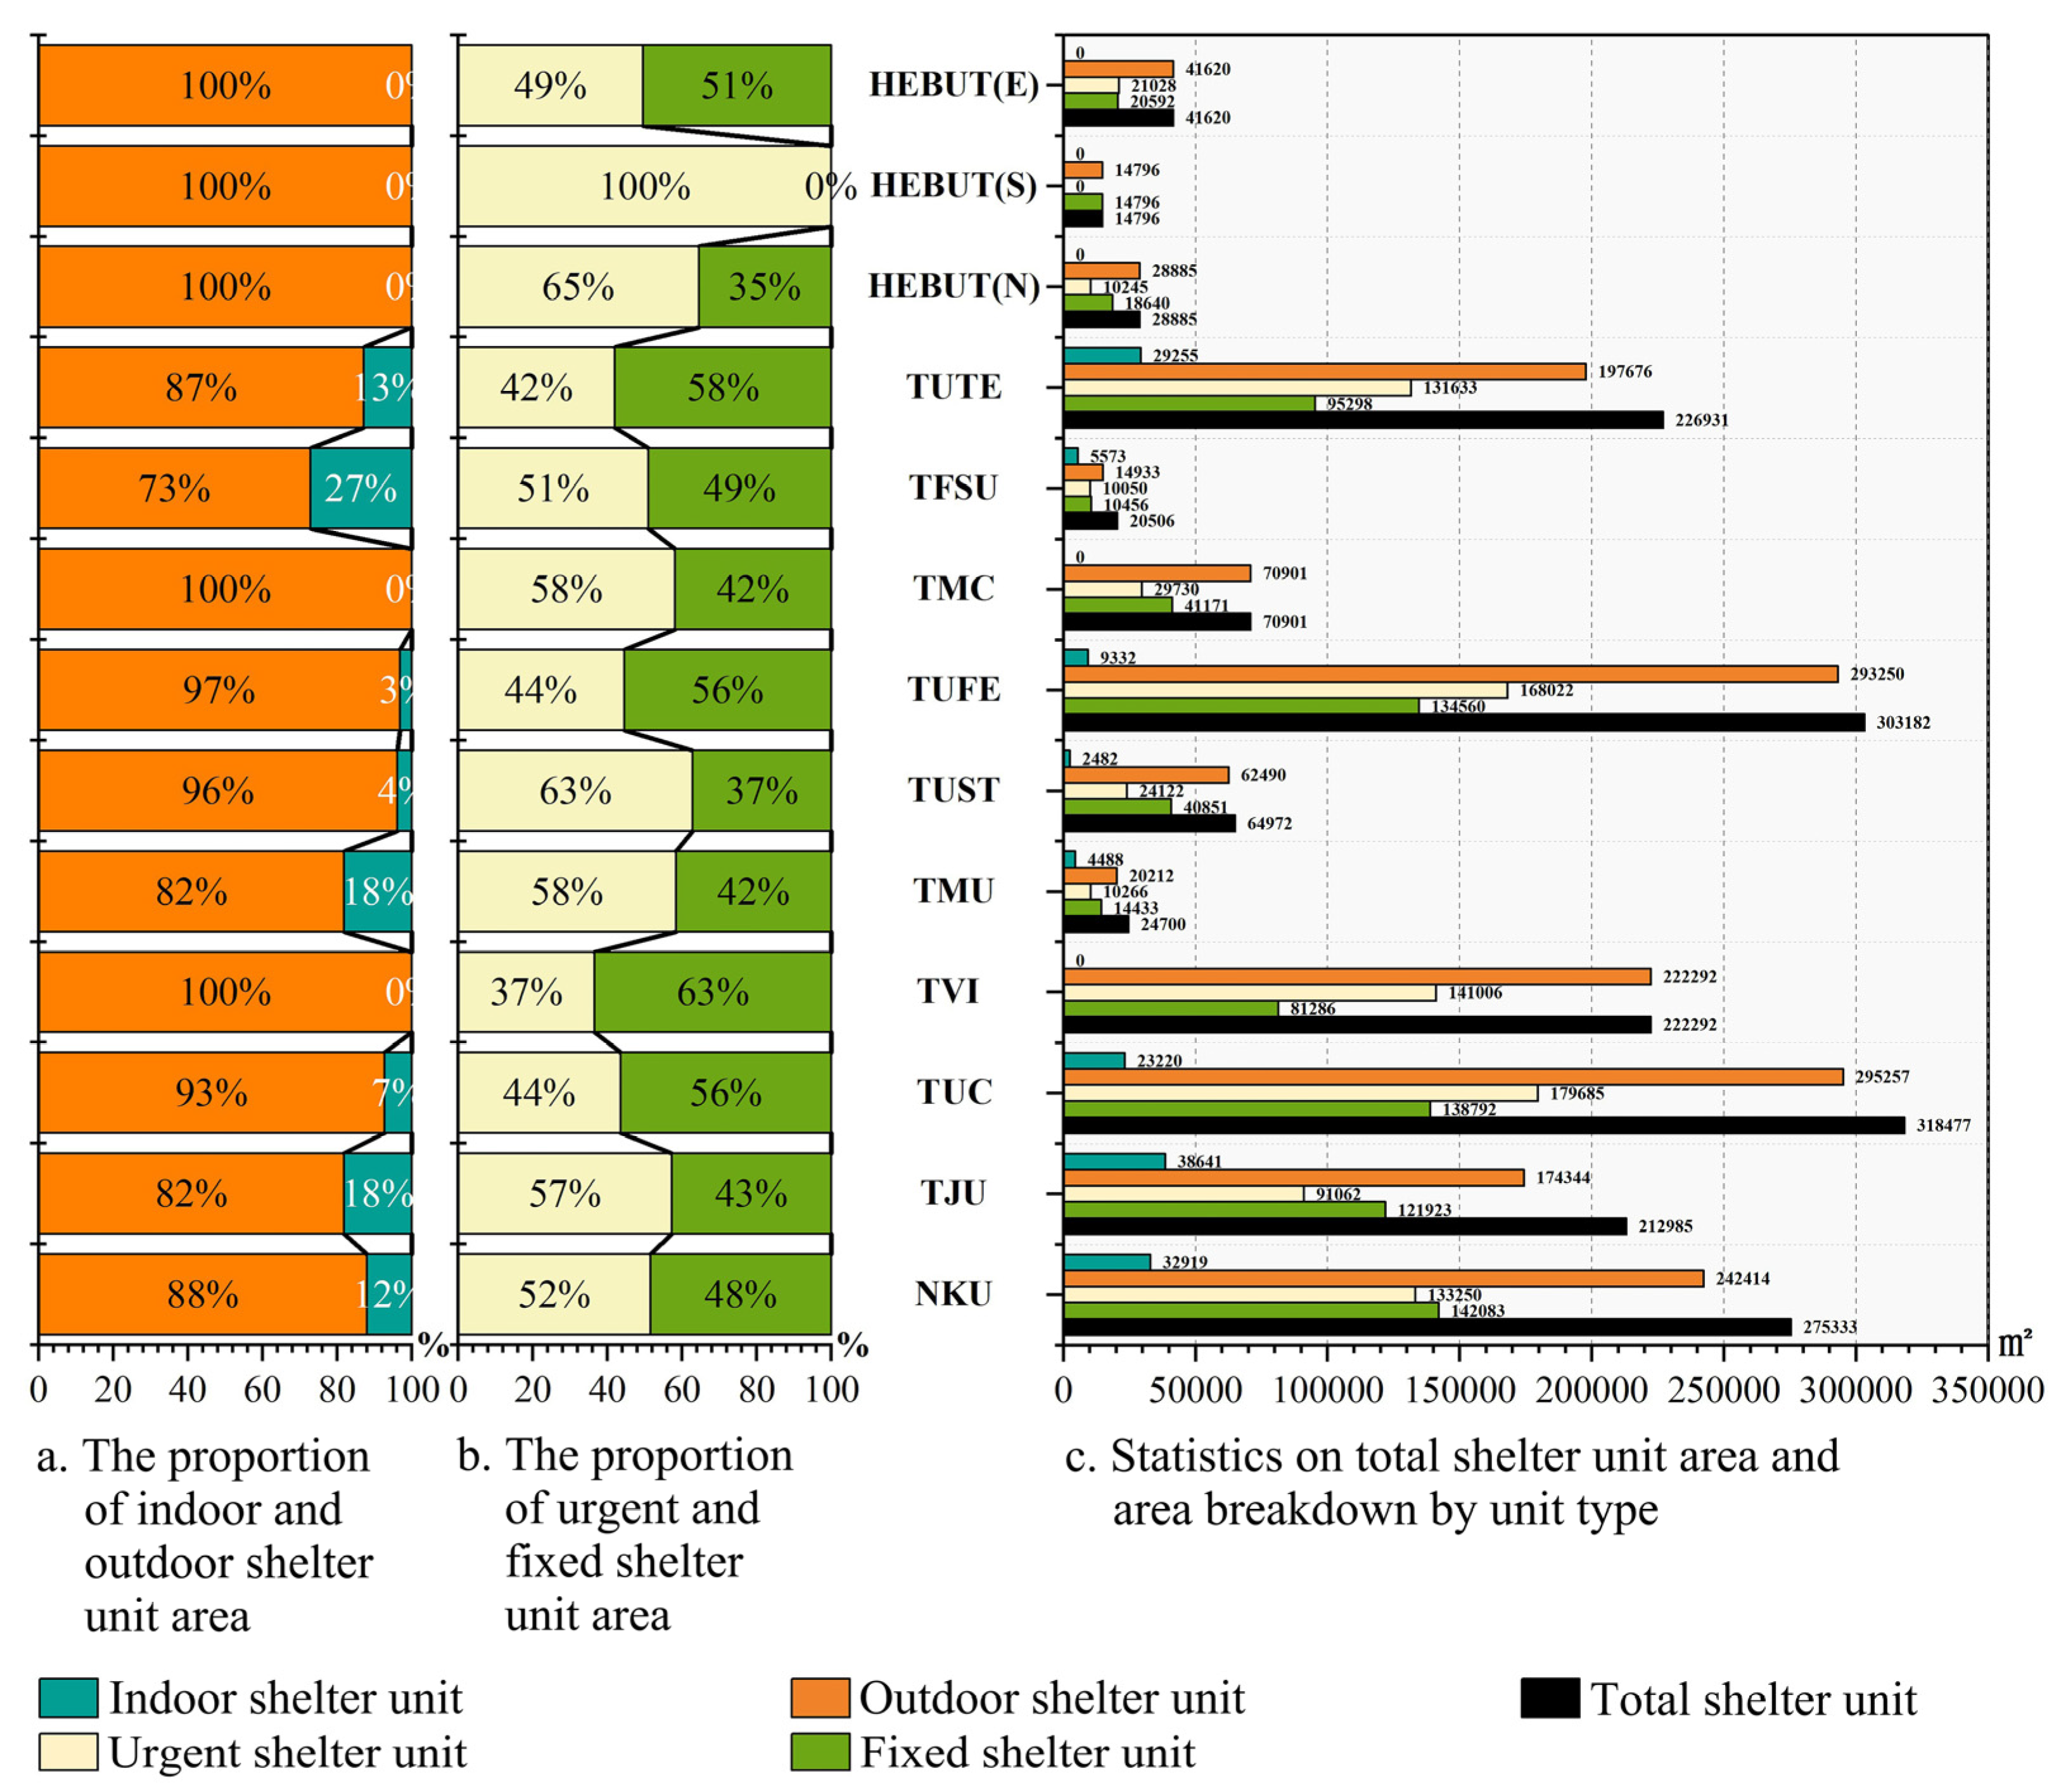
4.2. Capacity, Types, and Service Zones of UCESs

Based on the UCES emergency shelter unit collections and the campus–city collaborative shelter capacity model, we calculated the total and redundant shelter capacity for the 13 UCESs. Next, based on their redundant shelter capacity, the 13 UCESs were classified into CECS, Long-Term RECS, and Medium-Term RECS. Finally, according to the types of UCESs and their redundant capacity, we calculated the precise service radius of each UCES using the linear interpolation method (Table 7). Notably, the redundant shelter capacity of NKU, TJU, TUC, TVI, TUFE, and TUTE significantly exceeded the lower threshold of CECS shelter capacity (90,000 persons). Since current Chinese regulations have not yet specified an upper limit for CECS capacity, we assigned a uniform service radius of 5 km—the upper bound of the CECS range—to these six UCESs.
Existing studies often used Euclidean distance as the buffer radius when calculating the service coverage of an ES, without accounting for the influence of road networks on evacuation [129]. Network analysis calculates the distance between two points based on the road network configuration and reflects the travel routes from demand points to shelters [84]. Therefore, based on the service radii of UCESs and the road network of Tianjin, we generated service zones for the 13 UCESs using the Network Analysis tool in ArcGIS 10.8 (Figure 5).
According to the above data, under the earthquake scenario, the total shelter capacity of the 13 UCESs reaches 1.35 million people, accounting for approximately 32.1% of the population in Tianjin’s central urban area. The total service coverage area reaches 250.2 km2, covering about 67.5% of the total area of the central district. The results demonstrate that university campuses in Tianjin’s central urban area have a strong potential to provide large-scale ESSs to the city.

4.3. ESS Demand Within Service Zones

The seismic risk assessment results for the 13 service zones are shown in Figure 6. Using the natural breaks method, the study area was divided into five categories: high risk (0.286–0.402), relatively high risk (0.247–0.285), medium risk (0.214–0.246), relatively low risk (0.184–0.213), and low risk (0.096–0.183). The seismic risk in the study area exhibited a spatial pattern of higher risk in the south and lower risk in the north. In addition, the 13 service zones were roughly grouped into four clusters: the northern cluster (TVI), the northwestern cluster (TUC; HEBUT (N, S, E)), the southwestern cluster (NKU, TJU, TMU, and TFSU), and the southeastern cluster (TUST, TUFE, TMC, and TUTE). Among them, the northern and southwestern clusters exhibited slightly higher risk levels, with average values of 0.202. The northwestern cluster had the lowest average risk level at 0.201. The southeastern cluster, directly intersected by the Haihe Fault Zone, had the highest average risk level of 0.260—approximately 30% higher than the other clusters. The mean value of seismic risk of the 13 service zones ranged from 0.200 to 0.260 (Figure 7).

4.4. Service Effectiveness of UCESs

4.4.1. Improvement Degree of Service Supply Capacity Within Service Zones

The measurement results for the increase in proportion of served population, per capita shelter area, indoor shelter area, accessibility to high-risk points, and service coverage area across the 13 service zones are presented in Appendix A.
(1) Increase in proportion of served population: TMC contributed the most significant improvement in its service zone, with an increase of 69.961%. NKU, TJU, TMU, and TUST also demonstrated notable improvements, with increases ranging from 9% to 16%. The improvements contributed by the other UCES were less significant, as the corresponding service zones had only minor or no pre-existing gaps in the served population.
(2) Increase in per capita shelter area: TMC and TVI showed the most substantial improvements in their service zones, with increases of 91.412% and 80.944%, respectively. The corresponding service zones of TUC, TUST, TUFE, and TUTE experienced moderate improvements, with increases ranging from 27% to 37%. The remaining service zones had increases below 16%, indicating relatively minor improvements.
(3) Increase in indoor shelter area: By benefiting from abundant indoor public space, TUTE significantly improved by 21.083% in its service zone. The service zone of TUST improved by 16.180%, which was attributable to its original indoor shelter space being only 15,340 m2, and the limited baseline resulted in more significant potential for improvement. The corresponding service zones of NKU, TJU, TUC, TMU, TUFE, and TFSU showed minor improvements, with increases ranging from 3% to 7%. The other UCESs did not contribute to any improvement in their service zones due to the absence of indoor shelter space.
(4) Increase in accessibility to high-risk points: High-risk points within each service zone were identified based on the results of the seismic risk assessment. In addition, since the 13 UCESs were classified into CECS, Long-Term RECS, and Medium-Term RECS, we categorized the existing ESs in Tianjin accordingly and extracted the location points of shelters by type. The results showed that TVI had the highest improvement in its service zone, with an increase of 74.95%. NKU, TJU, TUC, TUFE, TUTE, TFSU, and HEBUT(E) contributed moderate improvements to their respective service zones, with increases ranging from 30% to 60%. The remaining service zones showed less than 1% increases, indicating no significant improvement.
(5) Increase in service coverage area: TVI demonstrated the most significant improvement in its service zone, with an increase of 91.489%, primarily since the original service blind spot area reached 1998.674 hm2, far exceeding that of any other service zone. TMC, TUC, and TUTE contributed moderate improvements to their respective service zones, with increases ranging from 9% to 27%. The remaining service zones exhibited limited potential for improvement, as they were already covered mainly by existing emergency shelters, with increases of less than 5%.
Accordingly, we integrated the measurement results of the five indicators using Equation (10) and obtained the degree of improvement in service supply capacity within each service zone (Table 8).

4.4.2. Service Effectiveness and Planning Intervention Priority of UCESs

Based on the service effectiveness evaluation model, we integrated the seismic risk assessment results and the measured improvement degrees of service supply capacity for each service zone. Subsequently, we quantified the service effectiveness of each UCES (Table 9). In addition, we applied the natural breaks method to classify the service effectiveness of the 13 UCESs into three levels—higher (1.150–1.257), medium (0.957–0.988), and lower (0.842–0.932)—and established the priority order for planning interventions at both the central district scale and the service zone cluster scale.
Planning intervention includes emergency management authorities’ official designation of UCESs and subsequent spatial renovation, facility upgrades, and material allocation within the campuses [20]. At the scale of Tianjin’s central urban district, municipal emergency management authorities should implement phased planning interventions for the 13 UCESs based on their service effectiveness levels. Higher-effectiveness UCESs should be prioritized for planning intervention to promptly address spatial imbalances in Ess’ allocation and to mitigate supply–demand mismatches in the corresponding areas. Medium-effectiveness UCESs should be incorporated into the city’s near-term disaster prevention and mitigation plans, with immediate actions such as resource inventorying and on-site investigations. Low-effectiveness UCESs may be selectively targeted for planning intervention based on the city’s medium-to-long-term disaster mitigation strategies. In addition, at the service zone cluster scale, emergency management authorities of districts can conduct orderly planning interventions for UCESs based on local needs within their jurisdictions. Specifically, the northern cluster should prioritize TVI; the northwestern cluster should prioritize TUC; the southwestern cluster should prioritize NKU and TJU; and the southeastern cluster should prioritize TMC for planning intervention.

5. Discussion

5.1. Analysis of the Driving Factors and Research Paradigms of UCES Service Effectiveness

Further analysis of the measurement results of the service effectiveness indicators reveals the following: (1) The geographic location of a UCES and the spatial and demographic characteristics of its corresponding service zone largely determine its service effectiveness. Campuses located at the periphery of the central urban area often cover service blind spots that previously lacked ES, thereby significantly expanding the overall coverage of regional ESs. In contrast, UCESs located in core areas contribute relatively little to additional coverage due to the high density of existing shelters nearby. For example, TVI increased the service coverage within its service zone by approximately 91%, far exceeding the less than 5% increase observed in core-area campuses such as NKU and TJU. Moreover, the demographic structure within a service zone further amplifies shelter demand. Residents in communities with high population density or pronounced aging trends exhibit a stronger reliance on nearby shelters during disasters, resulting in greater shelter demand and more acute supply–demand mismatches. Introducing UCESs near such communities can significantly increase the covered population. For instance, the population coverage rate in TMC’s service zone rose by nearly 70%. In contrast, in areas with adequate existing shelter supply or younger population structures, the improvement in population coverage by UCESs remains relatively limited. (2) The spatial resource endowment is a key factor influencing the service effectiveness of UCESs. In particular, the proportion and spatial concentration of indoor shelter space have a notable impact on enhancing the safety dimension of service effectiveness. UCESs with abundant and centrally arranged indoor shelter spaces provide better protection for evacuees against aftershocks and severe weather, thereby improving the quality of ESSs. For example, due to its abundant indoor public spaces, TUTE increased the indoor shelter area in its service zone by 21.1%. In contrast, UCESs lacking indoor space contribute almost nothing to the improvement of indoor shelter provision. Additionally, the connectivity of transportation networks significantly affects the service coverage and response efficiency of UCESs. Campuses located near major roads and with high accessibility can serve high-risk populations more efficiently. For instance, TVI, due to its proximity to an urban expressway, increased the accessibility of high-risk sites by approximately 75%. In contrast, campuses such as TUST, HEBUT(N), and HEBUT(S) improved accessibility to high-risk sites by less than 1% due to poor surrounding transportation conditions. In summary, the supply–demand coupling advantages of UCESs can only be fully realized when their internal spatial resources align with the characteristics of external demand environments.
Our evaluation of UCES service effectiveness from a supply–demand perspective, along with the phased planning intervention strategies developed based on the evaluation results, represented an optimization of the existing research paradigm for ES. (1) Building on conventional methods for measuring ES service supply capacity, we proposed a campus–city collaborative shelter capacity model adapted to the spatial characteristics of university campuses. Although campuses are similar in scale to other dual-purpose ES types such as urban parks and green spaces, they feature significantly higher building density and permanent populations, resulting in much greater development intensity and daily utilization [26,27]. Based on this distinction, we identified effective shelter spaces under earthquake scenarios by considering specific factors such as building collapse risk and applied the campus–city collaborative model to jointly coordinate and allocate shelter capacity across campus and city levels. This enabled a more accurate assessment of the fundamental service provision capability of UCESs as a unique category of emergency facilities. (2) We also refined the method for measuring regional service demand. While most existing studies regard ES allocation as a supply–demand issue, their demand-side assessment often remains at the level of population distribution and lacks a substantial connection to the root cause of shelter demand–disaster risk [38,56]. Our disaster risk assessment for the service zones of 13 UCESs integrated the disaster-inducing factors, disaster-bearing body, and disaster-pregnant environment in central Tianjin, providing a more comprehensive representation of regional demand levels. (3) The service effectiveness evaluation model we constructed based on the PRI addressed the need for fine-grained assessment and intervention strategies for UCESs during the urban stock-based planning era. Although UCESs possess various advantages in emergency resource availability, they also face challenges such as complex stakeholder involvement, difficulties in retrofitting, and high upgrade costs, which require targeted and efficient planning actions [28]. Previous research has largely relied on POI-based and topological analysis methods to quantify spatial suitability and identify priority zones for intervention [36,70]. Building on these methods, we further applied PRI to evaluate the capacity of individual UCESs to improve regional supply–demand relationships and to determine the appropriate prioritization of planning interventions based on their relative effectiveness.

5.2. Determinants of Service Effectiveness Variation and the Logic of Hierarchical Planning Interventions

5.2.1. Service Effectiveness Disparities Among UCESs Driven by Supply–Demand Coupling

Variations in service effectiveness among UCESs reflect disparities in the coupling between regional improvements in service supply capacity and corresponding demand levels [57]. UCESs with higher service effectiveness typically possess greater redundant shelter capacity and well-developed facility conditions, enabling them to alleviate the original supply–demand imbalances within their service zones significantly. This indicates that the physical spatial resource endowment of UCESs is one of the key determinants of their service effectiveness [130]. However, service effectiveness depends not only on supply-side capacity but also on pressure from the demand side. When a service zone faces high risk and lacks adequate shelter resources, even a UCES with superior service capacity may exhibit only moderate or low service effectiveness due to significant demand gaps. In other words, high demand pressure may lower the relative effectiveness of an individual facility. This suggests that regional risk distribution and the baseline stock of shelter resources are also critical factors influencing the service effectiveness of UCESs.
Therefore, the service effectiveness of UCESs is constrained by internal resource endowment and external demand environments [53]. The spatial scale and facility configuration of a UCES determine the upper limit of its contribution to improving regional service supply capacity. In contrast, the disaster risk and baseline shelter resources within the service zone determine the magnitude of demand pressure. The greater the mismatch between the two, the lower the relative service effectiveness of the UCES. This conclusion underscores the importance of evaluating emergency service facilities’ effectiveness from the supply–demand coupling perspective.

5.2.2. Phased Planning Interventions Guided by Supply–Demand Alignment

We proposed the planning intervention priorities based on the evaluation results of service effectiveness. This reflects a phased strategy for optimizing resource allocation and gradually improving the supply–demand alignment across regions [131]. Prioritizing planning intervention for higher-effectiveness UCESs can quickly alleviate shortages and imbalances in shelter resources within the corresponding service zones. This means that limited investments can cover the largest populations and reduce the highest risks within the shortest possible time. Medium-effectiveness UCESs have a certain capacity to improve the supply–demand relationship, but the urgency for implementing planning intervention is relatively low. Conducting preparatory work such as baseline data collection and on-site investigations in advance helps ensure rapid service provision during disasters. Lower-effectiveness UCESs, due to their limited improvement potential or relatively low demand within their service zones, may be selectively addressed in medium-to-long-term urban planning. It is important to note that “lower effectiveness” does not imply insignificance but indicates limited intervention benefits under current conditions. Including lower-effectiveness UCESs in long-term urban planning can ensure that surrounding residents are ultimately provided with sufficient shelter guarantees, thereby promoting spatial equity and social justice.
Overall, the phased implementation strategy of planning intervention balances efficiency and equity, enhancing the technical alignment between supply and demand and adhering to the ethical principle of prioritizing vulnerable groups in disaster scenarios. This is consistent with the staged resource allocation approach commonly adopted in emergency management practice [53], which emphasizes concentrating resources to address the most critical mismatches first, followed by broader improvements in an overall service capacity while ensuring that no region or population group remains systematically underserved over the long term.

5.3. Optimization Strategies for UCESs

Based on the current resource conditions and functional capacities of different UCESs, we proposed differentiated short-term and long-term optimization strategies according to their classified levels of service effectiveness. From the perspective of service effectiveness, higher-effectiveness UCESs possess favorable spatial resource conditions and should focus on strategies involving resource integration and intelligent management. Medium-effectiveness UCESs exhibit certain deficiencies in shelter space and facility conditions; thus, their optimization strategies should address these infrastructure shortcomings. In contrast, lower-effectiveness UCESs are characterized by relatively limited shelter resources and should prioritize basic safety assurance and regional coordination mechanisms. In balancing short- and long-term development goals, short-term strategies should emphasize the rapid formation and enhancement of shelter service capacity, while long-term strategies should focus on promoting sustainable development and strengthening the resilience of UCESs over time.

5.3.1. Short-Term Optimization: Enhancing Utilization Efficiency of Existing Resources

(1) Higher-effectiveness UCESs: Strengthening dual-use conversion and intelligent coordination. Higher-effectiveness UCESs such as TVI and TMC should focus on enhancing the multifunctionality of campus shelter spaces by equipping fixed shelter units with integrated emergency modules—such as medical care, food services, and supply storage—to improve conversion efficiency from normal to emergency use and to strengthen medium-to-long-term sheltering capabilities. In addition, these UCESs can adopt the model of intelligent command hubs implemented in Dutch university campuses [11] by leveraging population heatmap data and large language model technologies to develop a real-time monitoring and intelligent dispatching platform. This would allow for the dynamic matching of shelter capacity with multi-stakeholder demands from both campus and city contexts.
(2) Medium-effectiveness UCESs: Addressing deficiencies in shelter space typologies. Medium-effectiveness UCESs should focus on the refinement and expansion of shelter space resources. For instance, HEBUT(E) should eliminate internal spatial fragmentation by integrating dispersed urgent shelter units into larger-scale fixed shelter units, thereby rapidly increasing shelter capacity in the short term. Drawing on Japan’s Guidelines for the Construction of School Facilities [12], TUC can retrofit indoor spaces with floor areas exceeding 1000 m2 to enhance seismic resilience and implement barrier-free accessibility improvements, thereby increasing the availability and usability of indoor shelter units.
(3) Lower-effectiveness UCESs: Enhancing evacuation guidance and emergency coordination. Given the limited shelter capacity and spatial resources of lower-effectiveness UCESs, optimization should prioritize improving the rapid response capacity of existing shelter spaces. Campuses should delineate shelter functions, define evacuation routes, and install standardized guidance signage to enhance efficiency. Neighboring UCESs—such as the three campuses of HEBUT—can establish emergency collaboration networks to expand their effective service radius. In addition, low-effectiveness UCESs should develop coordination mechanisms with nearby ESs to ensure the timely redirection of evacuees to higher-tier ES facilities in the event of a disaster.

5.3.2. Long-Term Optimization: Building a Resilience-Driven Spatial System

(1) Higher-effectiveness UCESs: Developing into hubs and enhancing regional coordination. In the long term, higher-effectiveness UCESs should be further developed into regional emergency shelter hubs. While continuously enhancing the multifunctionality of their shelter spaces and associated facilities, these UCESs should also be integrated into the city-level emergency command system. Disaster prevention green corridors should be planned around the campuses to connect surrounding ES nodes, strengthening spatial connectivity between UCESs and other ESs and fostering an integrated campus–city shelter network for regional coordination.
(2) Medium-effectiveness UCESs: Structural reinforcement and multifunctional expansion. Medium-effectiveness UCESs should focus on improving the structural safety of campus buildings. Priority should be given to reinforcing the seismic performance of critical facilities to ensure the safety of students, faculty, and nearby residents during disasters. In parallel, campuses should expand indoor shelter space through spatial reconfiguration and equip these areas with essential emergency facilities, such as medical treatment zones, supply storage units, and emergency communication systems, to ensure that indoor shelters can effectively accommodate diverse medium-to-long-term needs. Additionally, university administrators should identify and retrofit spaces with dual-use potential to enhance the long-term spatial resilience of the campus.
(3) Lower-effectiveness UCESs: Targeted stock upgrading and infrastructure enhancement. Lower-effectiveness UCESs should undertake targeted structural reinforcement of aging buildings that present significant safety risks or lack adequate seismic resistance. Existing architectural spaces can be retrofitted into multi-level shelter platforms to increase shelter capacity per unit area through vertical evacuation strategies. In addition, campuses should improve basic emergency infrastructure by providing backup power supplies, emergency communication equipment, and essential sanitation facilities to meet the minimum requirements for disaster-time living conditions.

5.4. Implications

Only a small number of university campuses in China have been formally designated as UCESs, and even among those designated, many face problems such as underutilized shelter potential, unclear service capacity, mismatches between supply and demand, and poorly coordinated planning processes. In response, relevant stakeholders—including government agencies, emergency management departments, urban planning institutions, and universities—should advance the refined development and spatial deployment of UCESs through the following approaches.
(1) The government should establish a multi-level, multi-stakeholder governance mechanism for UCESs planning. At the policy level, the national government should incorporate UCESs into the broader disaster prevention and mitigation strategy and issue dedicated planning guidelines. Local governments should integrate UCESs into both the emergency shelter master plans and the territorial spatial planning system. At the operational level, universities and surrounding communities should sign cooperation agreements that define clear campus access and resource allocation protocols during emergencies. Moreover, all levels of government should institutionalize a multi-stakeholder coordination mechanism by regularly organizing joint meetings and drills involving emergency management departments, urban planning institutions, universities, and community representatives, ensuring that the planning and development of UCESs are well-aligned with actual emergency needs.
(2) Emergency management departments should lead in formulating dedicated planning guidelines and a standardized framework for UCESs’ development. On the one hand, emergency management departments should establish technical construction standards for UCESs, including specific parameters such as shelter capacity, per capita shelter area, service radius, and coverage area. These standards should also define principles for location selection, layout strategies, and classification systems. On the other hand, management and operational standards should be developed to specify facility configurations and operational models tailored to different grades and types of UCESs.
(3) Urban planning institutions should adopt a supply–demand coordination approach to optimize the spatial layout of UCESs. Relevant departments should utilize GIS mapping, disaster risk modeling, and population distribution data to accurately assess regional shelter demand and prioritize the development of university campuses located near high-demand areas with limited resources. In addition, a bidirectional campus–city coordination mechanism should be established to allocate UCES shelter capacity and emergency facilities based on the actual needs of urban residents and campus populations. This would help align the layout of campus shelters with broader urban planning objectives.
(4) University campuses should enhance comprehensive disaster preparedness and strengthen dual-use infrastructure development. Campus emergency management should embrace a multi-hazard perspective by performing risk assessments for earthquakes, extreme weather events, floods, fires, and other potential disasters, and by creating contingency plans and retrofitting measures designed for significant hazard types. Regarding campus planning and design, public spaces such as plazas and gymnasiums should be designed with spatial and functional flexibility to convert into shelter areas during emergencies rapidly. Additionally, campus logistics and security departments should regularly inspect shelter facilities and organize emergency drills to ensure the timely activation of shelter functions and the effective coordination of people and resources, maximizing safety and operational efficiency in disaster scenarios.

6. Conclusions

Against the backdrop of escalating disaster risks, the planning and development of UCESs play a critical role in improving the supply–demand balance of ESS in high-density central urban areas. However, existing studies lacked consideration and measurement of UCES service effectiveness from a regional supply–demand perspective, limiting their ability to guide planning practices effectively. To address this gap, we developed a service effectiveness evaluation framework for UCESs using 13 university campuses in Tianjin’s central district under an earthquake scenario. Our study aims to reveal how UCESs with different spatial resource conditions vary in their capacity to improve regional supply–demand relationships, thereby supporting refined emergency management and planning decisions. The results showed that (1) the total shelter capacity and service coverage of the 13 UCESs accounted for approximately 32.1% of the central district’s population and 67.5% of its land area. University campuses in Tianjin’s central district have strong potential to provide large-scale ESSs and can serve as a key supplement to the existing urban ESS system. (2) The mean seismic risk values across the service zones ranged from 0.200 to 0.260, exhibiting a spatial pattern of higher risk in the south and lower risk in the north. (3) Service effectiveness was categorized into three levels—higher (1.150–1.257), medium (0.957–0.988), and lower (0.842–0.932)—and corresponding planning interventions can be implemented in phases based on effectiveness levels. The differences in service effectiveness among UCESs indicate that internal resource endowments and external demand environments shape their impact on regional supply–demand networks. The degree of alignment between service supply and demand distribution determines how UCESs can improve regional supply–demand relationships. Phased planning interventions based on differences in service effectiveness can enhance the coordination of regional ESS supply and demand in an orderly manner while balancing efficiency and equity. In addition, we proposed short- and long-term optimization strategies based on service effectiveness classifications and placed forward specific policy recommendations for key stakeholders, including governments, emergency management agencies, urban planning institutions, and universities. These strategies and recommendations help to unlock the service potential of UCESs further and enhance the resilience of urban emergency management systems.
We provided a novel research perspective and methodological framework for evaluating the service effectiveness of UCESs in high-density central urban areas. However, several limitations remain that should be addressed in future studies. First, in terms of data completeness, our study did not fully account for the seismic performance of building structures. Instead, it used the year of construction as a proxy for structural vulnerability, omitting critical parameters such as structural type and building materials. This data gap may introduce a certain degree of bias and uncertainty into regional disaster risk assessments. Second, with respect to disaster scenario settings, our study focused solely on earthquakes as a single hazard scenario and did not consider the compound or cascading effects of multiple hazards such as floods and extreme heat. This single-hazard assumption may underestimate potential changes in the spatial distribution of ESS demand and the prioritization of planning interventions under multi-hazard conditions. Additionally, at the intra-campus spatial scale, effective emergency shelter spaces were identified based on the risk of building collapse under an earthquake scenario. However, when considering the compound effects of other hazards such as high temperatures and pluvial flooding, the identification of effective shelter spaces within campuses may vary significantly, which in turn affects key service capabilities such as shelter capacity and service radius. Therefore, future research should systematically incorporate data related to the seismic performance of building structures and conduct comprehensive multi-hazard scenario analyses to enhance the robustness and practical applicability of service effectiveness evaluation models.
In addition, future research should further focus on the dynamic characteristics and functional optimization strategies of UCES service effectiveness. In terms of dynamics, the population distribution within university campuses and surrounding communities exhibits significant temporal heterogeneity. For example, urban residential areas experience commuter-induced fluctuations between day and night, while campus populations vary cyclically between academic terms and vacation periods. Therefore, it is essential to incorporate mobile signaling data and location-based service (LBS) data to simulate dynamic population distributions and conduct time-sensitive evaluations of UCES service effectiveness, thereby supporting flexible and adaptive shelter space planning. In terms of functional optimization, future research should be aligned with the “dual-use” planning paradigm by systematically promoting hazard-adaptive renovation and multifunctional configuration of campus public spaces. This includes exploring embedded layout strategies for emergency resource storage, mobile medical units, and temporary accommodation modules. Furthermore, it is critical to expand the campus–city coordination perspective by investigating institutional mechanisms for mobilizing campus resources to support surrounding communities during disasters, and by advancing the formal integration of UCES into statutory urban emergency shelter planning systems.

Author Contributions

H.G.: Methodology, Conceptualization, Validation, Formal analysis, Investigation, Data curation, Writing—original draft, Visualization; Y.H.: Software, Writing—original draft, Visualization; J.Z.: Formal analysis, Data curation, Visualization; Y.S.: Investigation, Data curation; T.Z.: Investigation, Data curation; F.T.: Writing—original draft, Visualization; S.S.: Software, Writing—review and editing, Supervision, Project administration, Funding acquisition. All authors have read and agreed to the published version of the manuscript.

Funding

This research was funded by the National Natural Science Foundation of China (52078325).

Data Availability Statement

Data derived from the current study can be provided to the readers based on their explicit request.

Conflicts of Interest

The authors declare no conflicts of interest.

Appendix A

Table A1. Increase in proportion of served population, per capita shelter area, indoor shelter space area, accessibility to high-risk points, and service coverage area in 13 service zones.
Service Zone of UCESVarious Indicators of Service Zone Before Incorporating UCESVarious Indicators of Service Zone After Incorporating UCESDR (%)DP (%)DS (%)DA (%)DC (%)
Proportion of Served Population
(%)
Per Capita Shelter Area
(m2)
Indoor Shelter Space Area
(m2)
Accessibility to High-Risk Points
(m)
Pre-Existing Service Blind Spots
(hm2)
Proportion of Served Population
(%)
Per Capita Shelter Area
(m2)
Indoor Shelter Space Area
(m2)
Accessibility to High-Risk Points
(m)
Area of Service Zone
(hm2)
NKU87.4781.237963,7915723.025109.42396.4731.365996,7102578.8617010.91710.28810.3363.41654.9391.586
TJU78.4911.102829,3574907.4620.00085.5651.204867,9982225.9305948.4399.0079.27514.65954.6420.000
TUC99.3221.361377,7234337.315597.163100.0001.735400,9432448.4465708.9900.68627.4766.14743.54911.682
TVI100.0001.649106,3438376.8961998.673100.0002.984106,3432098.8184183.2880.00080.9440.00074.94591.489
TMU62.6430.94779,246305.6460.00072.6051.09883,734305.646417.63315.90415.8985.6630.00%0.000
TUST87.2681.34415,340725.5040.000100.0001.83017,822722.817643.45014.59536.21816.1800.3700.000
TUFE100.0001.615138,1444831.730249.696100.0002.137147,4762834.3266150.3240.00032.3086.75541.3394.232
TMC54.3360.62314,8031029.972179.23592.3441.19214,803850.676843.28869.96191.4120.00017.40826.991
TFSU84.6041.359124,491543.0180.00090.4821.454130,064368.518474.7576.9476.9464.47732.1350.000
TUTE100.0001.771138,7625292.886530.114100.0002.258168,0172660.5136187.0780.00027.48721.08349.7349.371
HEBUT(N)100.0001.855101,103428.6410.000100.0002.102101,103428.127371.8070.00013.3510.0000.1200.000
HEBUT(S)100.0001.77061,425501.3410.000100.0001.94161,425496.859278.9350.0009.6930.0000.8940.000
HEBUT(E)100.0001.60089,481506.5860.000100.0001.84589,481217.742633.2360.00015.3160.00057.0180.000

References

  1. United Nations Office for Disaster Risk Reduction. The Human Cost of Disasters: An Overview of the Last 20 Years (2000–2019); United Nations Office for Disaster Risk Reduction: Geneva, Switzerland, 2020. [Google Scholar]
  2. Wei, Y.; Jin, L.; Xu, M.; Pan, S.; Xu, Y.; Zhang, Y. Instructions for planning emergency shelters and open spaces in China: Lessons from global experiences and expertise. Int. J. Disaster Risk Reduct. 2020, 51, 101813. [Google Scholar] [CrossRef]
  3. Ministry of Natural Resources of the People’s Republic of China. Resilient Urban Planning and Land Policy Guidelines for the Integration of Flat and Urgent Functions Have Been Released. Available online: https://www.mnr.gov.cn/dt/ywbb/202405/t20240515_2845237.html (accessed on 4 March 2025).
  4. The State Council of the People’s Republic of China. The Construction of the “Dual-Use of Flat and Urgent” Project is Rapidly Advancing from Point to Surface. Available online: https://www.gov.cn/lianbo/bumen/202407/content_6960782.htm (accessed on 3 March 2025).
  5. Ran, J.; Jiang, X.; He, L.; Xu, Y.; Zhang, P.; Yan, X. Typology and Spatial System of Urban Dual-Use Public Infrastructure and the Key Points in Planning. Urban Plan. Forum 2024, 5, 98–105. (In Chinese) [Google Scholar]
  6. Xin, F.; Ma, Y.; Liao, P.; Fu, B. Evaluation of the university campus layout for the dual use as a city-level emergency shelter. Habitat Int. 2025, 156, 103285. [Google Scholar] [CrossRef]
  7. Villagra-Islas, P.; Alves, S. Open space and their attributes, uses and restorative qualities in an earthquake emergency scenario: The case of Concepcion, Chile. Urban For. Urban Green. 2016, 19, 56–67. [Google Scholar] [CrossRef]
  8. Kim, M.; Kim, K.; Kim, E. Problems and Implications of Shelter Planning Focusing on Habitability: A Case Study of a Temporary Disaster Shelter after the Pohang Earthquake in South Korea. Int. J. Environ. Res. Public Health 2021, 18, 2868. [Google Scholar] [CrossRef]
  9. Shenzhen Planning and Natural Resources Bureau. Shenzhen Emergency Evacuation and Rescue Space Plan (2021–2035). Available online: https://www.sz.gov.cn/cn/xxgk/szszdxzjczl/jctzgg/content/mpost_10948850.html (accessed on 4 March 2025).
  10. Great Value Colleges. 30 US Colleges that Are Prepared for Natural Disasters: These Colleges Are Well Equipped to Overcome a Range of Environmental Emergencies. Available online: https://news.stthom.edu/ust-ranks-among-30-us-colleges--best-prepared-for-natural-disasters/ (accessed on 4 February 2025).
  11. The Netherlands’ Ministry of Infrastructure and Water Management. National Policy Strategy for Infrastructure and Spatial Planning. Available online: https://www.government.nl/ministries/ministry-of-infrastructure-and-water-management (accessed on 21 January 2025).
  12. OOHSM. Evacuation Area at Tsukuba Campus. Office of Occupational Health and Safety Management. University of Tsukuba. Available online: https://anzenkanri.tsukuba.ac.jp/?page_id=13263 (accessed on 1 March 2025).
  13. Mi, S.; Piao, Y.-J.; Zhang, R.; Cho, T.-D. The Campus of University Earthquake Disaster Prevention Planning—The Research of Spatial Pattern Based on GIS. J. Environ. Sci. Int. 2014, 23, 1213–1221. [Google Scholar] [CrossRef]
  14. Broege, T. A Shelter in the Time of Storm. Available online: https://library.timelesstruths.org/music/A_Shelter_in_the_Time_of_Storm/ (accessed on 18 January 2025).
  15. Chouhan, S.; Narang, A.; Mukherjee, M. Multihazard risk assessment of educational institutes of Dehradun, Uttarakhand. Int. J. Disaster Resil. Built Environ. 2024, 15, 45–58. [Google Scholar] [CrossRef]
  16. Gibbs, L.; bin Jehangir, H.; Kwong, E.J.L.; Little, A. Universities and multiple disaster scenarios: A transformative framework for disaster resilient universities. Int. J. Disaster Risk Reduct. 2022, 78, 103132. [Google Scholar] [CrossRef]
  17. Kuo, J.-I.; Chuko, C.; Tung, H.C.; Huang, W.-C.; Chao, F.-L. Relationships between Sustainable Campus Partial Renovation Project and Disaster Prevention Indices. In Proceedings of the IOP Conference Series: Earth and Environmental Science, Changchun, China, 21–23 August 2020; Volume 505, p. 012038. [Google Scholar]
  18. Gao, J.; Sang, Y. Identification and estimation of landslide-debris flow disaster risk in primary and middle school campuses in a mountainous area of Southwest China. Int. J. Disaster Risk Reduct. 2017, 25, 60–71. [Google Scholar] [CrossRef]
  19. Zheng, L.; Guo, Y.; Peeta, S.; Wu, B. Impacts of Information from Various Sources on the Evacuation Decision-Making Process during No-Notice Evacuations in Campus Environment. J. Transp. Saf. Secur. 2018, 12, 892–923. [Google Scholar] [CrossRef]
  20. Ke, X.; Yang, W.; Misheng, L.; Ranting, Z. Urban and architectural design from the perspective of flood resilience: Framework development and case study of a Chinese university campus. J. Asian Archit. Build. Eng. 2023, 22, 3100–3114. [Google Scholar] [CrossRef]
  21. Kapucu, N.; Khosa, S. Disaster Resiliency and Culture of Preparedness for University and College Campuses. Adm. Soc. 2013, 45, 3–37. [Google Scholar] [CrossRef]
  22. Omidvar, B.; Karimloo, K.; Tavakoli Sani, S.; Darabi, H. Disaster Management Structure of Universities: Case Study of the Central Campus of the University of Tehran. Disaster Med. Public Health Prep. 2017, 11, 681–693. [Google Scholar] [CrossRef]
  23. Lu, X.; Yang, Z.; Chea, C.; Guan, H. Experimental study on earthquake-induced falling debris of exterior infill walls and its impact to pedestrian evacuation. Int. J. Disaster Risk Reduct. 2020, 43, 101372. [Google Scholar] [CrossRef]
  24. Kassem, M.M.; Nazri, F.M.; Farsangi, E.N.; Ozturk, B. Development of a uniform seismic vulnerability index framework for reinforced concrete building typology. J. Build. Eng. 2022, 47, 103838. [Google Scholar] [CrossRef]
  25. Wang, T.; Guomai, S.; Zhang, L.; Li, G.; Li, Y.; Chen, J. Earthquake emergency response framework on campus based on multi-source data monitoring. J. Clean. Prod. 2019, 238, 117965. [Google Scholar] [CrossRef]
  26. Tan, Y.; Cheng, Q.; Lyu, F.; Liu, F.; Liu, L.; Su, Y.; Yuan, S.; Xiao, W.; Liu, Z.; Chen, Y. Hydrological reduction and control effect evaluation of sponge city construction based on one-way coupling model of SWMM-FVCOM: A case in university campus. J. Environ. Manag. 2024, 349, 119599. [Google Scholar] [CrossRef]
  27. Wu, S.; Shao, B.; Bian, G.; Zhang, Z. Research on Fire Disaster Chain and Emergency Management Decision—making in Colleges and University Based on Complex Network. J. Catastrophol. 2022, 37, 156–161+166. (In Chinese) [Google Scholar]
  28. Cao, S.; Fu, L.; Wang, P.; Zeng, G.; Song, W. Experimental and modeling study on evacuation under good and limited visibility in a supermarket. Fire Saf. J. 2018, 102, 27–36. [Google Scholar] [CrossRef]
  29. Liu, W. Considering the Effects of Sustainable Safety Education on Student Evacuation Behavior During College Emergencies. IEEE Access 2024, 12, 154901–154917. [Google Scholar] [CrossRef]
  30. Xie, W.; Lee, E.W.M.; Cheng, Y.; Shi, M.; Cao, R.; Zhang, Y. Evacuation performance of individuals and social groups under different visibility conditions: Experiments and surveys. Int. J. Disaster Risk Reduct. 2020, 47, 101527. [Google Scholar] [CrossRef]
  31. Bera, S.; Gnyawali, K.; Dahal, K.; Melo, R.; Li-Juan, M.; Guru, B.; Ramana, G.V. Assessment of shelter location-allocation for multi-hazard emergency evacuation. Int. J. Disaster Risk Reduct. 2023, 84, 103435. [Google Scholar] [CrossRef]
  32. Duan, P.; Xiong, S.; Yang, C.; Zhang, H.; Liu, M. Personalized route planning system based on Wardrop Equilibrium model for pedestrian–vehicle mixed evacuation in campus. J. Inf. Secur. Appl. 2016, 31, 14–22. [Google Scholar] [CrossRef]
  33. Rahman, S.A.F.S.A.; Maulud, K.N.A.; Pradhan, B.; Mustorpha, S.N.A.S.; Ani, A.I.C. Impact of evacuation design parameter on users’ evacuation time using a multi-agent simulation. Ain Shams Eng. J. 2021, 12, 2355–2369. [Google Scholar] [CrossRef]
  34. Chen, W.; Zhai, G.; Ren, C.; Shi, Y.; Zhang, J. Urban Resources Selection and Allocation for Emergency Shelters: In a Multi-Hazard Environment. Int. J. Environ. Res. Public Health 2018, 15, 1261. [Google Scholar] [CrossRef]
  35. Trivedi, A. A multi-criteria decision approach based on DEMATEL to assess determinants of shelter site selection in disaster response. Int. J. Disaster Risk Reduct. 2018, 31, 722–728. [Google Scholar] [CrossRef]
  36. Xu, W.; Zhao, X.; Ma, Y.; Li, Y.; Qin, L.; Wang, Y.; Du, J. A multi-objective optimization based method for evaluating earthquake shelter location–allocation. Geomat. Nat. Hazards Risk 2018, 9, 662–677. [Google Scholar] [CrossRef]
  37. Wang, Y.; Han, Y.; Luo, A.; Xu, S.; Chen, J.; Liu, W. Site selection and prediction of urban emergency shelter based on VGAE-RF model. Sci. Rep. 2024, 14, 14368. [Google Scholar] [CrossRef]
  38. Kar, B.; Hodgson, M. A GIS-Based Model to Determine Site Suitability of Emergency Evacuation Shelters. Trans. GIS 2008, 12, 227–248. [Google Scholar] [CrossRef]
  39. Soltani, A.; Ardalan, A.; Boloorani, A.D.; Haghdoost, A.; Hosseinzadeh-Attar, M.J. Site selection criteria for sheltering after earthquakes: A systematic review. PLoS Curr. 2014, 6. [Google Scholar] [CrossRef]
  40. Wang, Y.; Zhang, Q.; Lin, K.; Liu, Z.; Liang, Y.; Liu, Y.; Li, C. A Novel Framework for Urban Flood Risk Assessment: Multiple Perspectives and Causal Analysis. Water Res. 2024, 256, 121591. [Google Scholar] [CrossRef]
  41. Ding, J.-W.; Lu, D.-G.; Cao, Z.-G. Risk Assessment of Spatially Distributed Assets with Generalized Seismic Fragility Models Based on Machine Learning. Soil Dyn. Earthq. Eng. 2025, 198, 109533. [Google Scholar] [CrossRef]
  42. García-Ayllón, S.; Tomás, A.; Ródenas, J.L. The Spatial Perspective in Post-Earthquake Evaluation to Improve Mitigation Strategies: Geostatistical Analysis of the Seismic Damage Applied to a Real Case Study. Appl. Sci. 2019, 9, 3182. [Google Scholar] [CrossRef]
  43. Benito, G.; Lang, M.; Barriendos, M.; Llasat, M.C.; Francés, F.; Ouarda, T.; Thorndycraft, V.; Enzel, Y.; Bardossy, A.; Coeur, D.; et al. Use of Systematic, Palaeoflood and Historical Data for the Improvement of Flood Risk Estimation. Review of scientific methods. Nat. Hazards 2004, 31, 623–643. [Google Scholar]
  44. Lyu, H.-M.; Zhou, W.-H.; Shen, S.-L.; Zhou, A.-N. Inundation Risk Assessment of Metro System Using AHP and TFN-AHP in Shenzhen. Sustain. Cities Soc. 2020, 56, 102103. [Google Scholar] [CrossRef]
  45. Lyu, H.-M.; Sun, W.-J.; Shen, S.-L.; Arulrajah, A. Flood Risk Assessment in Metro Systems of Mega-Cities Using a GIS-Based Modeling Approach. Sci. Total Environ. 2018, 626, 1012–1025. [Google Scholar] [CrossRef]
  46. Lin, J.; He, P.; Yang, L.; He, X.; Lu, S.; Liu, D. Predicting Future Urban Waterlogging-Prone Areas by Coupling the Maximum Entropy and FLUS Model. Sustain. Cities Soc. 2022, 80, 103812. [Google Scholar] [CrossRef]
  47. Banke-Thomas, A.O.; Wong, K.L.M.; Olubodun, T.; Macharia, P.M.; Sundararajan, N.; Shah, Y.; Prasad, G.; Kansal, M.; Vispute, S.; Shekel, T.; et al. Geographical accessibility to functional emergency obstetric care facilities in urban Nigeria using closer-to-reality travel time estimates: A population-based spatial analysis. Lancet Glob. Health 2024, 12 5, e848–e858. [Google Scholar] [CrossRef]
  48. Allan, P.; Bryant, M. The Critical Role of Open Space in Earthquake Recovery: A Case Study. Environ. Sci. Eng. 2010. [Google Scholar]
  49. Chen, W.; Shi, Y.; Wang, W.; Li, W.; Wu, C. The Spatial Optimization of Emergency Shelters Based on an Urban-Scale Evacuation Simulation. Appl. Sci. 2021, 11, 11909. [Google Scholar] [CrossRef]
  50. Ertugay, K.; Argyroudis, S.; Düzgün, H.Ş. Accessibility modeling in earthquake case considering road closure probabilities: A case study of health and shelter service accessibility in Thessaloniki, Greece. Int. J. Disaster Risk Reduct. 2016, 17, 49–66. [Google Scholar] [CrossRef]
  51. Mazhi, K.Z.; Suryana, L.E.; Davi, A.; Devi, W.R. Site Selection of Retail Shop Based on Spatial Analysis and Machine Learning. In Proceedings of the 2020 International Conference on Advanced Computer Science and Information Systems (ICACSIS), Depok, Indonesia, 17–18 October 2020. [Google Scholar]
  52. Mohsin, M.; Ali, S.A.; Shamim, S.K.; Ahmad, A. A GIS-based novel approach for suitable sanitary landfill site selection using integrated fuzzy analytic hierarchy process and machine learning algorithms. Environ. Sci. Pollut. Res. 2022, 29, 31511–31540. [Google Scholar] [CrossRef]
  53. Yang, Y.; Tang, J.; Luo, H.; Law, R. Hotel location evaluation: A combination of machine learning tools and web GIS. Int. J. Hosp. Manag. 2015, 47, 14–24. [Google Scholar] [CrossRef]
  54. Church, R.L. Geographical information systems and location science. Comput. Oper. Res. 2002, 29, 541–562. [Google Scholar] [CrossRef]
  55. Murray, A.T. Advances in location modeling: GIS linkages and contributions. J. Geogr. Syst. 2010, 12, 335–354. [Google Scholar] [CrossRef]
  56. Zhu, Y.; Gan, L.; Li, X.; Zuo, Y.; Liu, J.; Lev, B. Orienting people-centred disaster shelter planning based on risk assessing with semi-supervised learning. Heliyon 2024, 10, e35128. [Google Scholar] [CrossRef]
  57. Zhang, X.; Yu, J.; Chen, Y.; Wen, J.; Chen, J.; Yin, Z. Supply–Demand Analysis of Urban Emergency Shelters Based on Spatiotemporal Population Estimation. Int. J. Disaster Risk Sci. 2020, 11, 519–537. [Google Scholar] [CrossRef]
  58. Chen, W.; Fang, Y.; Zhai, Q.; Wang, W.; Zhang, Y. Assessing Emergency Shelter Demand Using POI Data and Evacuation Simulation. ISPRS Int. J. Geo-Inf. 2020, 9, 41. [Google Scholar] [CrossRef]
  59. Geng, S.; Hou, H. Demand Stratification and Prediction of Evacuees after Earthquakes. Sustainability 2021, 13, 8837. [Google Scholar] [CrossRef]
  60. Jue, J.; Xiaolu, G.; Congcong, X.; Shixiang, X.; Fei, T. Evaluating method on service quality of seismic emergency shelters based on evacuation behaviors. Prog. Geogr. 2017, 36, 965–973. (In Chinese) [Google Scholar]
  61. Wang, P.; Hou, Z.; An, L. Demand estimation of emergency shelters based on setting earthquake scenarios: A case study of Hedong District, Tianjin City. China Earthq. Eng. J. 2024, 46, 1484–1492. (In Chinese) [Google Scholar]
  62. Ge, H.; Cao, W.; Song, W. Precision scale-based research on the spatiotemporal coverage efficacy of urban emergency shelters: A case study in the main urban area of Nanjing. Geogr. Res. 2024, 43, 2887–2901. (In Chinese) [Google Scholar]
  63. Zhao, L.; Li, H.; Sun, Y.; Huang, R.; Hu, Q.; Wang, J.; Gao, F. Planning Emergency Shelters for Urban Disaster Resilience: An Integrated Location-Allocation Modeling Approach. Sustainability 2017, 9, 2098. [Google Scholar] [CrossRef]
  64. Yu, J.; Wen, J. Multi-Criteria Satisfaction Assessment of the Spatial Distribution of Urban Emergency Shelters Based on High-Precision Population Estimation. Int. J. Disaster Risk Sci. 2016, 7, 413–429. [Google Scholar] [CrossRef]
  65. Ma, D.; Guo, X.; Wang, Z. Guidelines for the Implementation of Urban Seismic and Disaster Prevention Planning Standards. China Architecture Publishing: Beijing, China, 2008. [Google Scholar]
  66. Yang, W.; Caunhye, A.M.; Zhuo, M.; Wang, Q. Integrated planning of emergency supply pre-positioning and victim evacuation. Socio-Econ. Plan. Sci. 2024, 95, 101965. [Google Scholar] [CrossRef]
  67. Chen, Z.; Chen, X.; Qiang, L.; Chen, J. The Temporal Hierarchy of Shelters: A Hierarchical Location Model for Earth-quake-Shelter Planning. Int. J. Geogr. Inf. Sci. 2013, 27, 1612–1630. [Google Scholar] [CrossRef]
  68. Yu, S.; Chen, W.; Zhang, N.; Liu, C.; Yang, S.; Wang, Y. Study on the Layout of Urban Earthquake Emergency Shelters based on Spatiotemporal Big Data: A Case Study of Xi’xia District, Yinchuan City. North China Earthq. Sci. 2022, 40, 8–15. (In Chinese) [Google Scholar]
  69. Fei, W.; Lu, D.; Li, Z. Research on the layout of urban disaster-prevention and risk-avoidance green space under the improvement of supply and demand match: The case study of the main urban area of Nanjing, China. Ecol. Indic. 2023, 154, 110657. [Google Scholar] [CrossRef]
  70. Maragno, D.; Gaglio, M.; Robbi, M.; Appiotti, F.; Fano, E.A.; Gissi, E. Fine-scale analysis of urban flooding reduction from green infrastructure: An ecosystem services approach for the management of water flows. Ecol. Model. 2018, 386, 1–10. [Google Scholar] [CrossRef]
  71. Ye, K.; Su, X. Dislocation of Supply and Demand in the Spatial Layout of Shelters in Mountainous Cities Driven by Data: A Case Study of Yuzhong District, Chongqing. Urban Dev. Stud. 2022, 29, 54–59+33. (In Chinese) [Google Scholar]
  72. Jia, Y.; Jiahong, W.; Yun, C.; Banggu, L.; Shiqiang, D. Spatial configuration of urban shelters based on simulation using emer-gency evacuation agent-based model:A case study in Jing’an District, Shanghai. Acta Geogr. Sin. 2017, 72, 1458–1475. (In Chinese) [Google Scholar]
  73. Aihemaiti, N.; Zeng, J.; Jiang, F. Supply—Demand Analysis and Planning Intervention of Emergency Shelter Services based on Comprehensive Disaster Risk: A Case Study in Tianjin. J. Catastrophol. 2022, 37, 92–100. (In Chinese) [Google Scholar]
  74. McGrail, M.R.; Humphreys, J.S. Measuring Spatial Accessibility to Primary Health Care Services: Utilising Dynamic Catch-ment Sizes. Appl. Geogr. 2014, 54, 182–188. [Google Scholar] [CrossRef]
  75. Dai, D. Racial/Ethnic and Socioeconomic Disparities in Urban Green Space Accessibility: Where to Intervene? Landsc. Urban Plan. 2011, 102, 234–244. [Google Scholar] [CrossRef]
  76. Laura, B. Access to Primary Health Care: Does Neighbourhood of Residence Matter? Master’s Thesis, University of Toronto, Toronto, ON, Canada, 2009. [Google Scholar]
  77. Luo, J. Integrating the Huff Model and Floating Catchment Area Methods to Analyze Spatial Access to Healthcare Services. Trans. GIS 2014, 18, 436–448. [Google Scholar] [CrossRef]
  78. Jia, H.; Yao, H.; Tang, Y.; Yu, S.; Field, R.; Tafuri, A.N. LID-BMPs planning for urban runoff control and the case study in China. J. Environ. Manag. 2015, 149, 65–76. [Google Scholar] [CrossRef]
  79. Xin, F.; Ma, Y.; Fu, B. Research Matching of University Campus Space and Urban Emergency Needs. Contemp. Archit. 2022, 51–56. (In Chinese) [Google Scholar]
  80. Tun, E.; Nishikiori, T.; Varghese, V.; Chikaraishi, M.; Seike, M.; Fujiwara, A. Emergency Shelter Location–Allocation Analysis with Time–Varying Demand. Asian Transp. Stud. 2024, 10, 100152. [Google Scholar] [CrossRef]
  81. Ding, Z.; Dong, H.; Yang, L.; Xue, N.; He, L.; Yao, X. A Study on the Emergency Shelter Spatial Accessibility Based on the Adaptive Catchment Size 2SFCA Method. ISPRS Int. J. Geo-Inf. 2022, 11, 593. [Google Scholar] [CrossRef]
  82. Zhu, X.; Tong, Z.; Liu, X.; Li, X.; Lin, P.; Wang, T. An Improved Two-Step Floating Catchment Area Method for Evaluating Spatial Accessibility to Urban Emergency Shelters. Sustainability 2018, 10, 2180. [Google Scholar] [CrossRef]
  83. Koshiba, Y.; Suzuki, Y. Factors affecting post-evacuation behaviors following an earthquake: A questionnaire-based survey. Int. J. Disaster Risk Reduct. 2018, 31, 548–554. [Google Scholar] [CrossRef]
  84. Wang, X.; Guan, M.; Dong, C.; Wang, J.; Fan, Y.; Xin, F.; Lian, G. A Multi-Indicator Evaluation Method for Spatial Distribution of Urban Emergency Shelters. Remote Sens. 2022, 14, 4649. [Google Scholar] [CrossRef]
  85. Xu, W.; Ma, Y.; Zhao, X.; Li, Y.; Qin, L.; Du, J. A Comparison of Scenario-Based Hybrid Bilevel and Multi-Objective Loca-tion-Allocation Models for Earthquake Emergency Shelters: A Case Study in the Central Area of Beijing, China. Int. J. Geogr. Inf. Sci. 2017, 32, 236–256. [Google Scholar] [CrossRef]
  86. Xu, Z. Assessment on the vulnerability of urban hazard bearing body based on refined spatial patterns. Adv. Water Sci. 2024, 35, 38–47. (In Chinese) [Google Scholar]
  87. Hou, J.; Zhang, Y.; Wang, L.; Zhao, Z. Earthquake relocation using a 3D velocity model and implications on seismogenic faults in the Beijing-Tianjin-Hebei region. Earthq. Res. Adv. 2024, 4, 100256. [Google Scholar] [CrossRef]
  88. Ministry of Education of the People’s Republic of China. Number of Higher Education Institutions. Available online: http://www.moe.gov.cn/jyb_sjzl/moe_560/2023/gedi/202501/t20250120_1176264.html (accessed on 31 December 2024).
  89. GB/T 44013-2024; Emergency Shelter—Grading and Classification. Ministry of Emergency Management of the People’s Republic of China: Beijing, China, 2024. Available online: https://openstd.samr.gov.cn/bzgk/std/newGbInfo?hcno=E71005A86694B2613A01CAFCAA70D884 (accessed on 1 March 2025).
  90. Min, L.; Changdong, Y. Threshold Standard and Global Distribution of High-Density Cities. World Reg. Stud. 2015, 24, 38. (In Chinese) [Google Scholar]
  91. Ellidokuz, H.; Ucku, R.; Aydin, U.Y.; Ellidokuz, E. Risk factors for death and injuries in earthquake: Cross-sectional study from Afyon, Turkey. Croat. Med. J. 2005, 46, 613–618. [Google Scholar]
  92. GB 51143-2015; Announcement of the Ministry of Housing and Urban Rural Development on Issuing the National Standard “Design Specification for Disaster Prevention and Refuge Sites”. Ministry of Housing and Urban-Rural Development of the People’s Republic of China: Beijing, China, 2015. Available online: https://www.mohurd.gov.cn/gongkai/zc/wjk/art/2016/art_17339_226442.html (accessed on 1 March 2025).
  93. GB 50011-2010; Announcement of the Ministry of Housing and Urban Rural Development on the Partial Revision of the National Standard “Code for Seismic Design of Buildings”. Ministry of Housing and Urban-Rural Development of the People’s Republic of China: Beijing, China, 2024. Available online: https://www.mohurd.gov.cn/gongkai/zc/wjk/art/2024/art_17339_778179.html (accessed on 1 March 2025).
  94. GB 50223-2008; Standard for Classification of Seismic Protection of Building Constructions. Ministry of Housing and Urban-Rural Development of the People’s Republic of China: Beijing, China, 2008. Available online: https://www.doc88.com/p-1731450277275.html (accessed on 1 March 2025).
  95. Berrett, B.E.; Vernon, C.A.; Beckstrand, H.; Pollei, M.; Markert, K.; Franke, K.W.; Hedengren, J.D. Large-Scale Reality Modeling of a University Campus Using Combined UAV and Terrestrial Photogrammetry for Historical Preservation and Practical Use. Drones 2021, 5, 136. [Google Scholar] [CrossRef]
  96. Cao, J.; Leng, W.; Liu, K.; He, Z.; Zhu, Y. Object-Based Mangrove Species Classification Using Unmanned Aerial Vehicle Hyperspectral Images and Digital Surface Models. Remote Sens. 2018, 10, 89. [Google Scholar] [CrossRef]
  97. DB 12/T 1031-2021; Construction Requirements of Emergency Shelters. Bureau of Emergency Management of Tianjin: Tianjin, China, 2022. Available online: https://yjgl.tj.gov.cn/ZWFW5050/BZ2939/DFBZ7510/202103/t20210305_5375254.html (accessed on 24 September 2024).
  98. GB/T 51327-2018; Standard for Urban Planning on Comprehensivedisaster Resistance and Prevention. Ministry of Housing and Urban-Rural Development of the People’s Republic of China: Beijing, China, 2018. Available online: https://max.book118.com/html/2024/0604/8046115125006075.shtm (accessed on 2 March 2025).
  99. Gao, C.; Zhang, B.; Shao, S.; Hao, M.; Zhang, Y.; Xu, Y.; Kuang, Y.; Dong, L.; Wang, Z. Risk assessment and zoning of flood disaster in Wuchengxiyu Region, China. Urban Clim. 2023, 49, 101562. [Google Scholar] [CrossRef]
  100. Gober, P.; Wheater, H. Debates-Perspectives on Socio-Hydrology: Modeling Flood Risk as a Public Policy Problem: Socio-Hydrology Modeling for Public Policy Problems. Water Resour. Res. 2015, 51, 4789–4794. [Google Scholar] [CrossRef]
  101. Merz, B.; Blöschl, G.; Vorogushyn, S.; Dottori, F.; Aerts, J.C.J.H.; Bates, P.; Bertola, M.; Kemter, M.; Kreibich, H.; Lall, U.; et al. Causes, Impacts and Patterns of Disastrous River Floods. Nat. Rev. Earth Environ. 2021, 2, 592–609. [Google Scholar] [CrossRef]
  102. Reisinger, A.; Howden, M.; Vera, C.; Garschagen, M. The Concept of Risk in the IPCC Sixth Assessment Report: A Summary of Cross-Working Group Discussions; Intergovernmental Panel on Climate Change: Geneva, Switzerland, 2020; p. 15. [Google Scholar]
  103. Coles, D.; Yu, D.; Wilby, R.L.; Green, D.; Herring, Z. Beyond ‘Flood Hotspots’: Modelling Emergency Service Accessibility during Flooding in York, UK. J. Hydrol. 2017, 546, 419–436. [Google Scholar] [CrossRef]
  104. Wu, Z.; Shen, Y.; Wang, H.; Wu, M. Urban Flood Disaster Risk Evaluation Based on Ontology and Bayesian Network. J. Hydrol. 2020, 583, 124596. [Google Scholar] [CrossRef]
  105. Fajfar, P. Analysis in Seismic Provisions for Buildings: Past, Present and Future. Geotech. Geol. Earthq. Eng. 2018, 46, 1–49. [Google Scholar]
  106. Hosseinpour, V.; Saeidi, A.; Nollet, M.-J.; Nastev, M. Seismic Loss Estimation Software: A Comprehensive Review of Risk Assessment Steps, Software Development and Limitations. Eng. Struct. 2021, 232, 111866. [Google Scholar] [CrossRef]
  107. Zhang, Y.; Fung, J.F.; Johnson, K.J.; Sattar, S. Review of Seismic Risk Mitigation Policies in Earthquake-Prone Countries: Lessons for Earthquake Resilience in the United States. J. Earthq. Eng. 2022, 26, 6208–6235. [Google Scholar] [CrossRef]
  108. Musacchio, G.; Saraò, A.; Falsaperla, S.; Scolobig, A. A Scoping Review of Seismic Risk Communication in Europe. Front. Earth Sci. 2023, 11, e1155576. [Google Scholar] [CrossRef]
  109. Chitkeshwar, A. The Role of Machine Learning in Earthquake Seismology: A Review. Arch. Comput. Methods Eng. 2024, 31, 3963–3975. [Google Scholar] [CrossRef]
  110. Li, W.; Zhai, G.; Chen, W. Location-allocation of fixed shelters for the elderly from the perspective of needs for refuge: A case of Hefei, China. Int. J. Disaster Risk Reduct. 2023, 92, 103717. [Google Scholar] [CrossRef]
  111. Dávila, L.D.; Cabrero, J.M.; Flores, O. New Seismic Exposure Modeling Approach for Guatemala City. Bull. Earthq. Eng. 2023, 21, 739–766. [Google Scholar] [CrossRef]
  112. Scudero, S.; Costanzo, A.; D’Alessandro, A. Urban Seismic Networks: A Worldwide Review. Appl. Sci. 2023, 13, 13165. [Google Scholar] [CrossRef]
  113. Pavel, F.; Nica, G. The Seismic Evaluation of Existing Buildings for Energy Renovation—A Case Study for the Residential Building Stock in Bucharest (Romania). Buildings 2024, 14, 1742. [Google Scholar] [CrossRef]
  114. Jena, R.; Pradhan, B.; Beydoun, G.; Al-Amri, A.; Sofyan, H. Seismic Hazard and Risk Assessment: A Review of State-of-the-Art Traditional and GIS Models. Arab. J. Geosci. 2020, 13, 50. [Google Scholar] [CrossRef]
  115. Adger, W.N. Vulnerability. Glob. Environ. Change 2006, 16, 268–281. [Google Scholar] [CrossRef]
  116. Kuria, K.K.; Kegyes-Brassai, O.K. Pushover Analysis in Seismic Engineering: A Detailed Chronology and Review of Techniques for Structural Assessment. Appl. Sci. 2024, 14, 151. [Google Scholar] [CrossRef]
  117. Samuel, M.A.; Xiong, E.; Haris, M.; Lekeufack, B.C.; Xie, Y.; Han, Y. Assessing Seismic Vulnerability Methods for RC-Frame Buildings Pre- and Post-Earthquake. Sustainability 2024, 16, 10392. [Google Scholar] [CrossRef]
  118. Djerbal, L.; Khoudi, I.; Alimrina, N.; Melbouci, B.; Bahar, R. Assessment and Mapping of Earthquake-Induced Landslides in Tigzirt City, Algeria. Nat. Hazards 2017, 87, 1859–1879. [Google Scholar] [CrossRef]
  119. Goda, K.; Risi, R.D. Future Perspectives of Earthquake-Tsunami Catastrophe Modelling: From Single-Hazards to Cascading and Compounding Multi-Hazards. Front. Built Environ. 2023, 8, 1022736. [Google Scholar] [CrossRef]
  120. Liang, Y.; Wang, C.; Chen, G.; Xie, Z. Evaluation Framework ACR-UFDR for Urban Form Disaster Resilience under Rain-storm and Flood Scenarios: A Case Study in Nanjing, China. Sustain. Cities Soc. 2024, 107, 105424. [Google Scholar] [CrossRef]
  121. Sun, J.; Zhai, N.; Mu, H.; Miao, J.; Li, W.; Li, M. Assessment of Urban Resilience and Subsystem Coupling Coordination in the Beijing-Tianjin-Hebei Urban Agglomeration. Sustain. Cities Soc. 2024, 100, 105058. [Google Scholar] [CrossRef]
  122. Salihu, H.M.; Salinas-Miranda, A.A.; Wang, W.; Turner, D.; Berry, E.L.; Zoorob, R. Community Priority Index: Utility, Ap-plicability and Validation for Priority Setting in Community-Based Participatory Research. J. Public Health Res. 2015, 4, 443. [Google Scholar] [CrossRef]
  123. Mohammed, A.M.S. The Heat Adaptation Priority Index (HAPI): A Practical Tool for Urban Heat Risk Assessment and Mitigation Priority. Sustain. Cities Soc. 2025, 126, 106420. [Google Scholar] [CrossRef]
  124. Salihu, H.M.; Salinas-Miranda, A.A.; Paothong, A.; Wang, W.; King, L.M. Community-Based Decision Making and Priority Setting Using the R Software: The Community Priority Index. Comput. Math. Methods Med. 2015, 2015, 347501. [Google Scholar] [CrossRef]
  125. Xiao, H. Effectiveness Research of the Urban Primary and Secondary Emergency Shelter. Master’s Thesis, Southwest University of Science and Technology, Mianyang, China, 2017. (In Chinese). [Google Scholar]
  126. Anhorn, J.; Khazai, B. Open Space Suitability Analysis for Emergency Shelter after an Earthquake. Nat. Hazards Earth Syst. Sci. 2015, 15, 789–803. [Google Scholar] [CrossRef]
  127. Zhong, G.; Lu, Y.; Chen, W.; Zhai, G. Multi-objective optimization approach of shelter location with maximum equity: An empirical study in Xin Jiekou district of Nanjing, China. Geomat. Nat. Hazards Risk 2023, 14, 2165973. [Google Scholar] [CrossRef]
  128. Shaoli, L.; Yuqi, L.; Xiaoping, G.; Youfa, P.; Tao, L. Reasonability of Spatial Distribution for Urban Emergency Shelter. Urban Dev. Stud. 2012, 19, 113–117+120. (In Chinese) [Google Scholar]
  129. Ekaputra, R.A.; Lee, C.; Kee, S.; Yee, J. Emergency Shelter Geospatial Location Optimization for Flood Disaster Condition: A Review. Sustainability 2022, 14, 12482. [Google Scholar] [CrossRef]
  130. Geng, S.; Hou, H.; Geng, J. The Mechanism of Operation Effectiveness of Emergency Shelter Rescue Systems. Sustainability 2021, 13, 5540. [Google Scholar] [CrossRef]
  131. Geng, S.; Hou, H.; Zhou, Z. A dynamic multi-objective model for emergency shelter relief system design integrating the supply and demand sides. Nat. Hazards 2024, 120, 2379–2402. [Google Scholar] [CrossRef]
Figure 1. Locations distribution of 13 university campuses in Tianjin’s central urban area.
Land 14 01411 g001
Figure 2. Evaluation framework for the service effectiveness of UCESs.
Land 14 01411 g002
Figure 3. Collection of 13 UCESs’ emergency shelter units.
Land 14 01411 g003
Figure 4. Statistics of shelter space area and types proportion for 13 UCESs.
Land 14 01411 g004
Figure 5. Service zones of 13 UCESs.
Land 14 01411 g005
Figure 6. Results of seismic risk assessment in the study area.
Land 14 01411 g006
Figure 7. Mean value of seismic risk for 13 service zones.
Land 14 01411 g007
Table 1. Data types and sources.
Category Type Precision Time Source
University campuses’ built environment data
  • Digital elevation model (DEM)
0.1 m2024
  • DJI Mavic 3E drone (the UAV aerial photography followed a predefined flight route, with a flight altitude of 100 m and a speed of 15 m/s. The forward overlap ratio was 80%, and the side overlap ratio was 70%.)
  • Digital surface model (DSM)
  • Digital orthophoto map (DOM)
  • Normalized digital surface model (nDSM)
  • Building structure and seismic design grade
2025
  • Site investigation and construction archive inquiry
  • Construction year of building
2025
Tianjin seismic risk assessment indicator data
  • Population data (population density; numbers of elderly and young people)
100 m2020
  • GDP
30 m2020
  • Calculated based on reference [86]
  • Building and road vector data
2024
  • Earthquake hazard points, geological faults, and seismic design intensity
2025
  • DEM
30 m2025
  • STRM data acquired from GEE
  • Building construction year (address, geographic coordinates, and completion date)
2025
  • POI data
2025
Basic information data of ES in Tianjin
  • Place name, geographic coordinates, effective shelter area, and effective shelter capacity
2025
Notes: a dash (“—”) in the “Precision” column indicates that the data are vector-based.
Table 2. 13 University campuses in Tianjin’s central urban area.
Administrative District University
Campus
Construction Land Area (Km2) Population
(Students/Faculty)
(Person)
Nankai
  • Nankai University
    (NKU)

1.21614,706 (13,800/906)
  • Tianjin University
    (TJU)

1.36219,994 (17,750/2244)
Beichen
  • Tianjin University of Commerce
    (TUC)

0.93324,181 (23,000/1181)
  • Tianjin Vocational Institute
    (TVI)

0.49712,656 (11,900/756)
Heping
  • Tianjin Medical University
    (TMU)

0.1523220 (2870/350)
Hexi
  • Tianjin University of Science and Technology (TUST)
0.24128,426 (27,000/1426)
  • Tianjin University of Finance and Economics (TUFE)
0.78717,232 (16,000/1232)
  • Tianjin Medical College
    (TMC)

0.1898701 (8000/701)
  • Tianjin Foreign Studies University
    (TFSU)

0.1162710 (2500/210)
Jinnan
  • Tianjin University of Technology and Education (TUTE)
0.54319,400 (18,000/1400)
Hongqiao
  • Hebei University of Technology
    (HEBUT)
  • North courtyard (N)
0.0982250 (1994/256)
  • South courtyard
    (S)
0.0691584 (1404/180)
  • East courtyard
    (E)
0.1774065 (3602/463)
Table 3. Simplified calculation table for impact distance of building collapse or damage.
Types of Distances Affected by Building DamageBuilding Height (H)Width Coefficient (K)
Parallel to the Building’s Long AxisParallel to the Building’s Short Axis
Distance affected by collapsed buildings<24 m0.670.50
24 m~54 m0.67~0.500.50~0.30
54 m~100 m0.500.30~0.25
100 m~160 m0.50~0.400.25~0.20
160 m~250 m0.40~0.300.20~0.15
Safety buffer distance for non-collapsed buildingsDetermined based on the safety distance to prevent falling objects (≥3 m)
Table 4. Correction factor for per capita effective shelter area.
Number of People Aggregated Within the Shelter Unit
(People)
Correction Factor
(γ)
≥10000.90
≥50000.95
≥10,0001.00
≥20,0001.05
≥40,0001.10
Table 5. Categorical regulation for emergency shelter.
Categories of Emergency ShelterCategorical Control Indicators
Service Radius
(Km)
Shelter Capacity
(10 Thousand Person)
CECS2.5~5.0>9.00
Long-Term RECS1.5~2.52.3~9.0
Medium-Term RECS1.0~1.50.50~2.30
Short-Term RECS0.5~1.00.10~0.50
EEES0.5unlimited
Notes: “CECS” denotes Central Emergency Congregate Shelter; “RECS” denotes Resident Emergency Congregate Shelter; “EEES” denotes Emergency Evacuation and Embarkation Shelter.
Table 6. Seismic risk assessment indicator system for UCES service zones.
Target
Layer
Criterion LayerIndex
Layer
Factor
Layer
DirectionAHP WeightEWM WeightIntegrated Weight
Seismic risk of UCES service zones (R)Hazard
(H)
Seismic hazard (H1)Distance from the seismic fault zone (H11)Negative0.10440.02310.0727
Seismic fortification intensity (H12)Positive0.10910.13580.1228
Historical earthquake magnitudes (H13)Positive0.11200.02610.0814
Exposure
(E)
Population exposure (E1)Population density (E11)Positive0.05260.04090.0461
Proportion of elderly and young population (E12)Positive0.07870.13910.1077
Economic exposure (E2)Per capita GDP (E21)Positive0.03430.03550.0335
Regional GDP(E22)Positive0.03470.02350.0289
Building and road exposure (E3)Building density (E31)Positive0.07890.13780.1054
Road density (E32)Positive0.04240.04990.0431
Vulnerability
(V)
Public service facilities’ vulnerability
(V1)
Density of medical institutions (V11)Negative0.05910.02220.0443
Distance from the fire stations (V12)Positive0.03710.02970.0327
Density of the public security organizations (V13)Negative0.04340.02210.0329
Building vulnerability (V2)Building height (V21)Positive0.04760.09700.0656
Construction date (V22)Negative0.05730.01170.0359
Topographic vulnerability (V3)Ground elevation difference (V31)Positive0.05640.06150.0572
Slope (V32)Positive0.05200.14400.0898
Table 7. Shelter capacity, shelter types, and service radius of 13 UCESs.
University Campus (UCES)Total Sheltering
Capacity
(Person)
Campus
Population
(Person)
Redundant Shelter Capacity
(Person)
Shelter
Types
Service Radius (Km)
NKU208,70814,706194,002CECS5
TJU167,45419,994147,460CECS5
TUC228,63424,181204,453CECS5
TVI151,78912,656139,133CECS5
TMU19,566322016,346Medium-Term RECS1.315
TUST52,91228,42624,486Long-Term RECS1.522
TUFE218,57117,232201,339CECS5
TMC56,036870147,335Long-Term RECS1.863
TFSU15,48127,1012,771Medium-Term RECS1.216
TUTE161,11419,400141,714CECS5
HEBUT(N)23,762225021,512Medium-Term RECS1.459
HEBUT(S)14,796158413,212Medium-Term RECS1.228
HEBUT(E)31,106406527,041Long-Term RECS1.56
Table 8. Degree of improvement in service supply capacity within each service zone.
Service Zone of UCESImprovement Degree of Service Supply Capacity (%)
NKU17.668
TJU16.965
TUC18.630
TVI51.195
TMU7.535
TUST12.786
TUFE17.476
TMC43.035
TFSU10.899
TUTE21.626
HEBUT(N)2.595
HEBUT(S)2.067
HEBUT(E)15.915
Table 9. Service effectiveness and planning intervention priority of 13 UCESs.
Service Effectiveness LevelUniversity
Campus (UCES)
Service Zone ClusterPRIPriority for Planning Intervention at the Central Urban Area ScalePriority for Planning Intervention at the Service Zone Cluster Scale
HigherTVIN1.25711
TMCSE1.15021
MediumTUCNW0.98831
NKUSW0.97941
TJUSW0.97452
TUTESE0.96762
HEBUT(E)NW0.95772
LowerTUFESE0.93283
TFSUSW0.92193
TUSTSE0.904104
TMUSW0.895114
HEBUT(N)NW0.847123
HEBUT(S)NW0.842134
Notes: “N” denotes the northern cluster; “NW” denotes the northwestern cluster; “SW” denotes the southwestern cluster; “SE” denotes the southeastern cluster.
Disclaimer/Publisher’s Note: The statements, opinions and data contained in all publications are solely those of the individual author(s) and contributor(s) and not of MDPI and/or the editor(s). MDPI and/or the editor(s) disclaim responsibility for any injury to people or property resulting from any ideas, methods, instructions or products referred to in the content.

