Review

Land Use, Spatial Planning, and Their Influence on Carbon Emissions: A Comprehensive Review

1
Department of Land Management, School of Public Affairs, Zhejiang University, Hangzhou 310058, China
2
Hangzhou International Urbanology Research Center (Center for Urban Governance Studies), Hangzhou 310020, China
*
Author to whom correspondence should be addressed.
Land 2025, 14(7), 1406; https://doi.org/10.3390/land14071406
Submission received: 11 June 2025 / Revised: 28 June 2025 / Accepted: 3 July 2025 / Published: 4 July 2025
(This article belongs to the Section Land Use, Impact Assessment and Sustainability)

Abstract

Carbon emissions from land use account for a significant portion of anthropogenic carbon emissions. As an important policy instrument for regulating land use, spatial planning can shape future land patterns, thereby influencing human activities and associated carbon emissions. This review presents a scientometric analysis of important articles between 2000 and 2024 on the impacts of land use and spatial planning on carbon emissions, and it summarizes the key research topics, methods, and main consensus. Scientometric and qualitative analysis methods were used. The results showed the following: (1) The number of articles published reveals an increasing trend, especially after 2009, with China, the USA, and England paying more attention to it. (2) Studies mainly focus on four key research topics: the impacts of land use and land cover change (LULCC) on carbon stocks, the relationship between land use structure/spatial form and carbon emissions, and the paths and schemes for low-carbon spatial planning. (3) Studies usually use upscale, homoscale, and downscale routes to correlate carbon emissions to land and then use comparative analysis, regression analysis, spatial analysis, and scenario simulation methods to conduct further analyses. (4) Studies have yielded some consensus: human land use can influence carbon emissions through LULCC, land use structure and spatial form, and spatial planning can reduce carbon emissions. In conclusion, this paper proposes that future research could be deepened in the following aspects: introducing land property rights and spatial planning management systems as research preconditions; exploring the sensitivity of carbon emissions from human activities to land space; strengthening research on low-carbon planning at medium- and long-term time scales and micro- and meso-spatial scales.

1. Introduction

Since the Industrial Revolution, global carbon emissions have been increasing quickly, resulting in a number of ecological and environmental problems, such as global warming and sea level rising, which have garnered significant attention from the international community. From 1850 to 2021, the cumulative anthropogenic CO2 emissions from land use change and fossil fuel combustion, the two major sources, have reached 2455 Gt. In the time sequence, the emissions from 1850 to 1960, 1960 to 2000, and 2000 to 2021 have accounted for 30%, 37%, and 33%, respectively. In terms of the contributors, the carbon emissions from land use change mainly came from countries in the tropical region; the top three countries (regions) in cumulative fossil fuel carbon emissions are the USA, the European Union, and China, with China’s annual fossil fuel carbon emissions having jumped to the top since 2006 [1]. With regard to the sectoral composition of emissions, total global greenhouse gas emissions in 2019 were approximately 59 Gt CO2 equivalent, of which 34% came from the energy supply sector, 24% from industry, 22% from agriculture, forestry, and other land use (AFOLU), 15% from transport, and 6% from buildings [2].
Anthropogenic carbon emissions are the product of biological, chemical, and physical processes of human activities. The degree of economic and social development, the level of science and technology, the energy structure, and the industrial structure have the most primary and widespread influence on carbon emissions [3,4]. However, human land use activities also have significant impacts on carbon emissions. Land use involves the alteration of the Earth’s terrestrial surface through human activities to obtain ecological, economic, or social benefits, and it is a coupled human–natural system that directly links local human actions to global environmental changes [5]. Human land use activities can directly affect vegetation carbon stocks and soil organic carbon stocks in terrestrial ecosystems by changing land use and land cover (LULC) types, or it can indirectly affect carbon emissions from socio-economic systems by changing the type and intensity of activities carried out by human beings above the ground.
Spatial planning is a crucial tool for managing both development and environmental protection within a given area. While contemporary spatial planning extends beyond traditional land use control, it remains fundamentally grounded in regulating land use. Indeed, it serves as a key policy instrument for adjusting land use structures and spatial patterns, thereby influencing regional agglomeration, environmental sustainability, and other outcomes. Spatial planning can be categorized by scale—such as transboundary, national, regional, and urban design planning. In this paper, the term “spatial planning” is used broadly and does not refer specifically to any single scale, as the reviewed literature encompasses multiple geographic levels.
Overall, land use contributes significantly to anthropogenic carbon emissions. As an important policy instrument for regulating land use, spatial planning can shape future land patterns, thereby influencing human activities and associated carbon emissions. Thus, understanding the current state of research on the impacts of land use and spatial planning on carbon emissions, and examining future research trajectories, is imperative.

2. Materials and Methods

2.1. Data

In order to grasp the hot topics in this field, this study searched the Science Citation Index Expanded and Social Sciences Citation Index Editions, Web of Science Core Collection database with the topic “land use carbon emissions” or “low carbon spatial planning”, resulting in a total of 15,472 documents. After sorting by relevance, we found that around the 2000th article started to deviate from our topic of interest, so we selected the 2000 most relevant documents with the document type of article and publication years located between 2000 and 2024 and exported them in txt format for scientometric analysis. In addition, this paper searched the main literature related to the impacts of land use and spatial planning on carbon emissions for qualitative analysis based on the results of the overall analysis.

2.2. Methods

This paper used a hybrid research methodology that combines scientometric analysis with qualitative analysis. Scientometrics applies quantitative methods to analyze scientific literature, aiming to measure research productivity, map knowledge structures, and evaluate scientific impact through bibliometric indicators such as citations and co-authorship networks [6]. Visualization tools can enable domain analysis for science and technology management by visually presenting data in graphs [7]. Among these tools, CiteSpace and VOSviewer are widely used in the visual analysis of various disciplines [8,9]. This study used CiteSpace 6.3.1 and VOSviewer 1.6.20 to visualize and analyze the temporal and spatial distribution characteristics and research hotspots of the 2000 articles. On this basis, this study further analyzed and summarized the key research topics, methods, and the main consensus of highly cited articles and other important articles, and it proposed future research directions.

3. Results

3.1. Overall Results

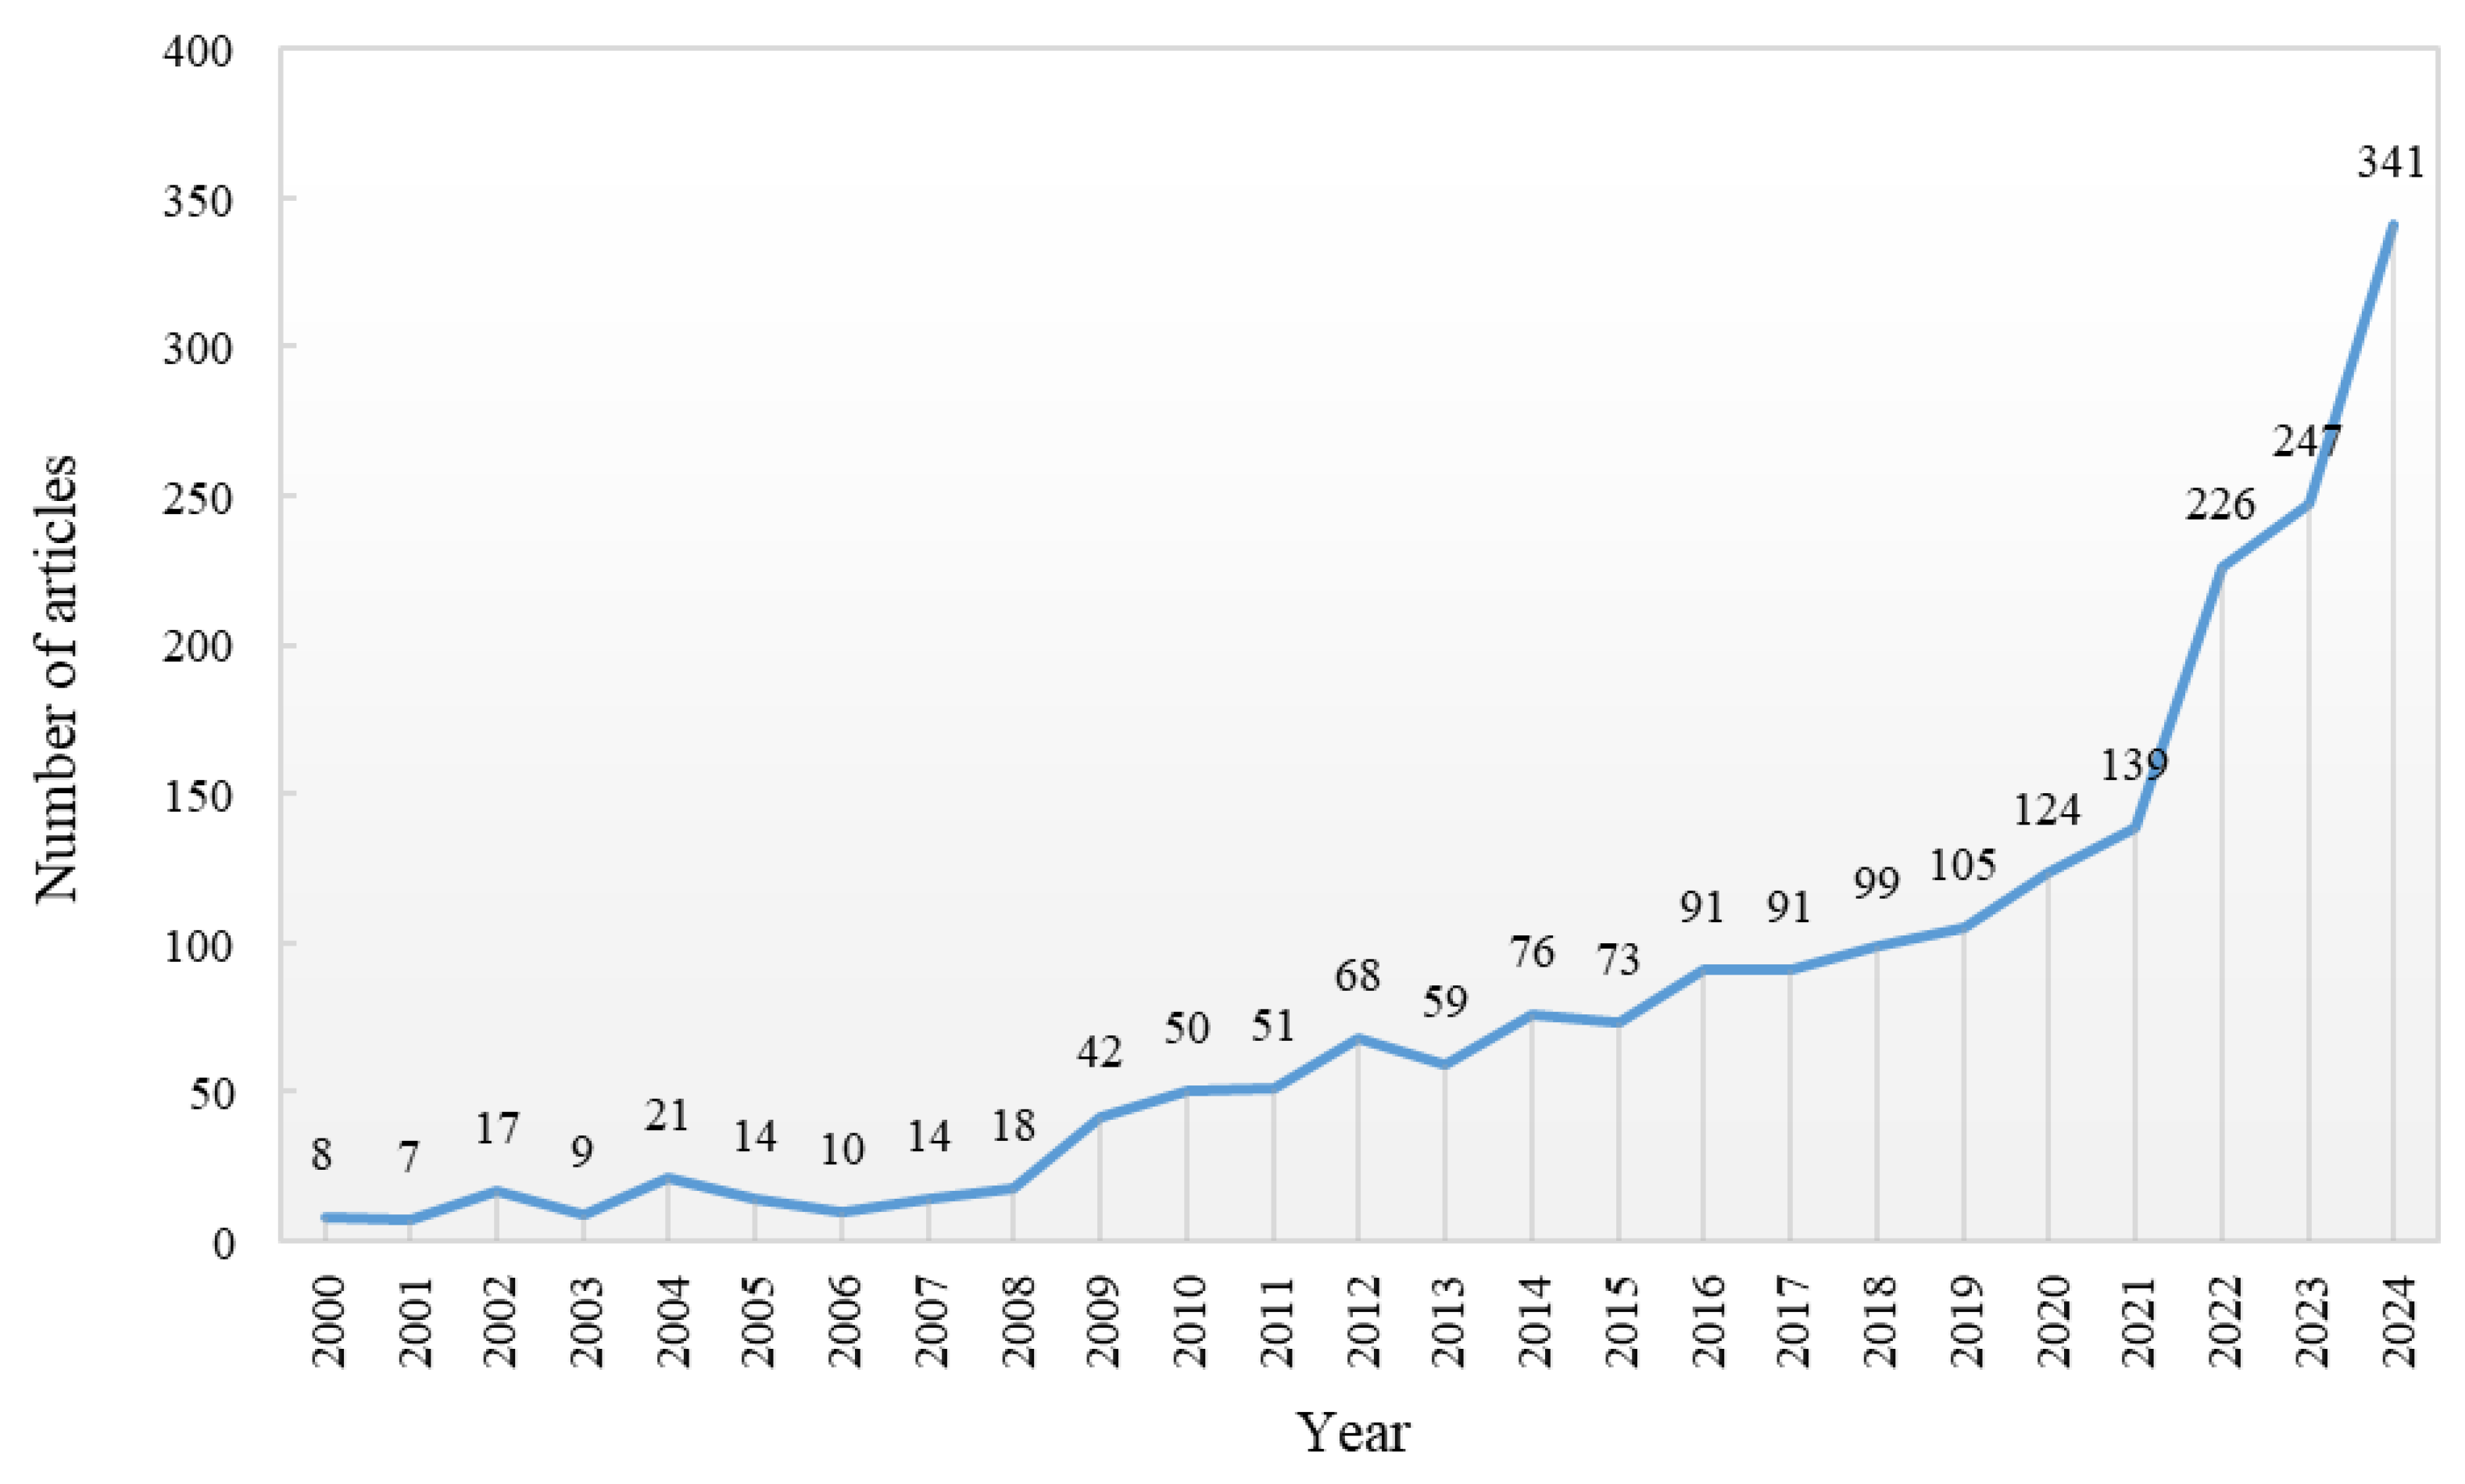
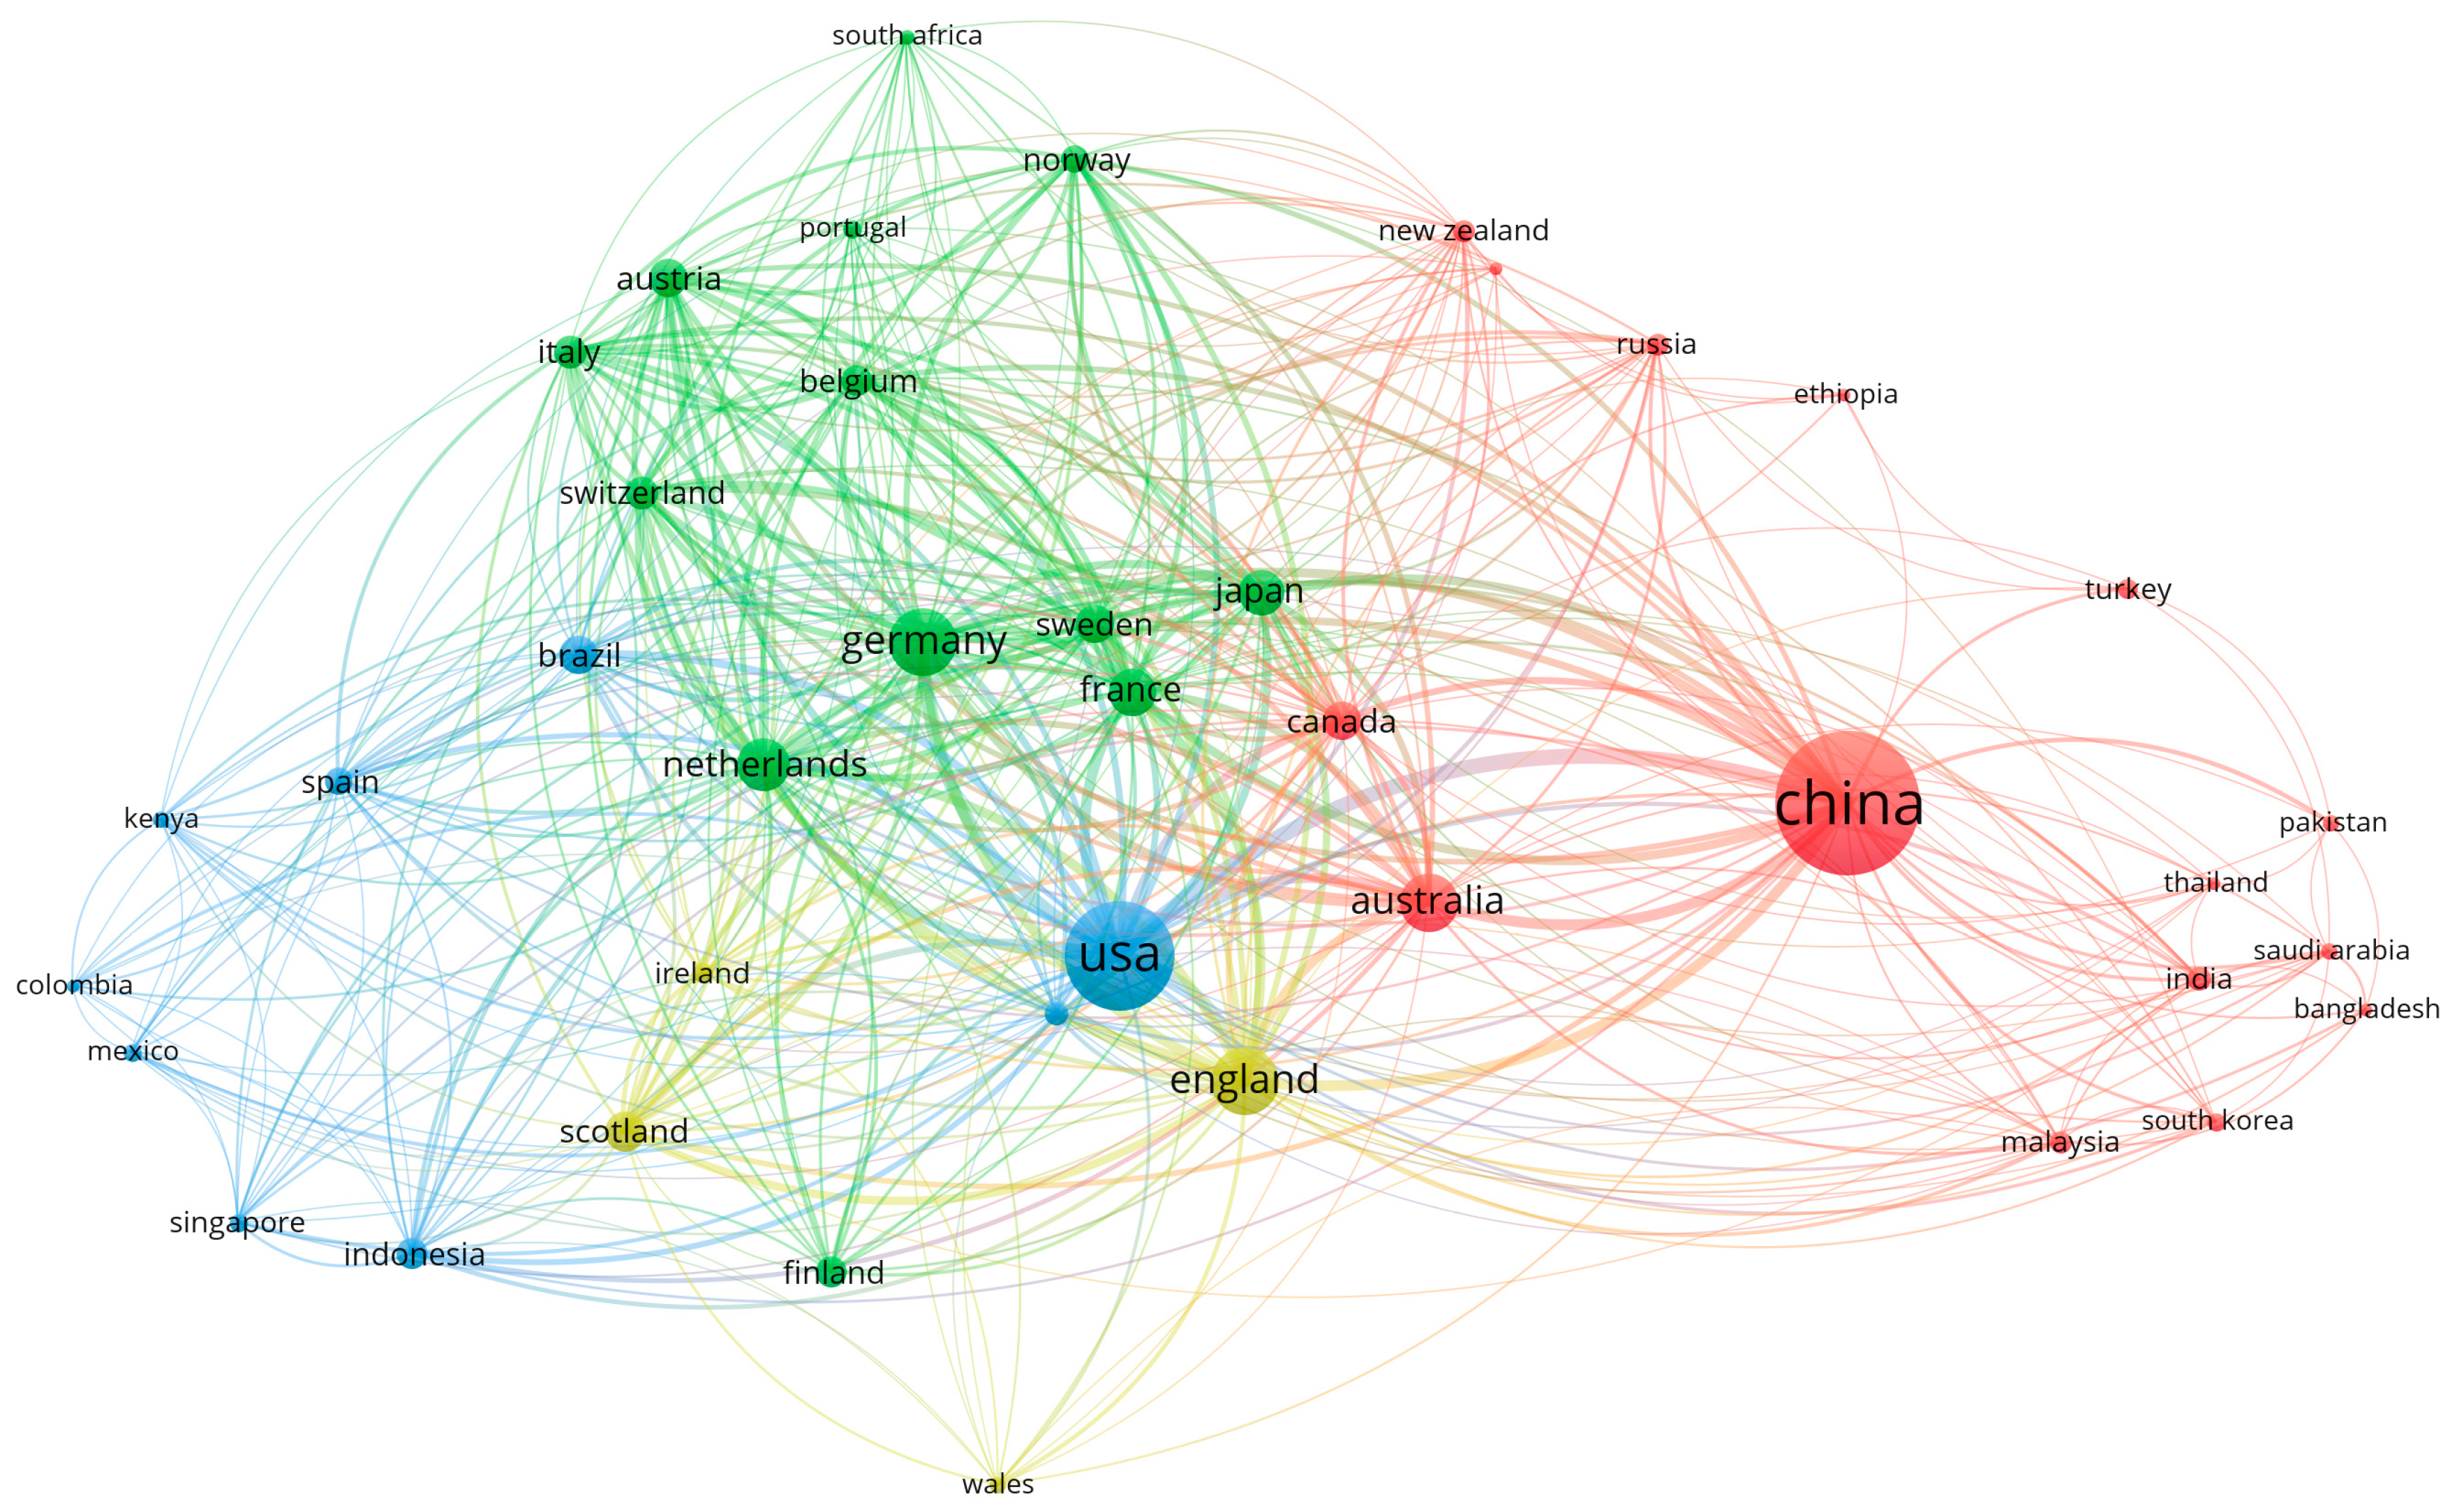
3.1.1. Temporal and Spatial Distribution Characteristics

The number and publication years of articles can reveal the characteristics of academic evolution in a particular field. The distribution of the number and publication years of articles related to land use carbon emissions and low-carbon spatial planning is shown in Figure 1. The number of articles published was relatively stable from 2000 to 2008, increasing slowly from 2009 and growing rapidly from 2021. The growth of article numbers is related to the international emphasis on low-carbon development and the introduction of relevant policies in recent years, such as the Doha Amendment to the Kyoto Protocol in 2012 and the Paris Agreement in 2015. As one of the important elements of low-carbon development, the relationship between land use, spatial planning, and carbon emissions has increasingly become the focus of academic attention.
According to the frequency statistics of articles by country, the top 10 countries are China, the USA, England, Germany, Australia, the Netherlands, France, Japan, Scotland, and Sweden, as shown in Figure 2, where the size of the node circle indicates the occurrence of country, the larger the circle, the higher the occurrence of country. Moreover, the co-authorship analysis of countries using VOSviewer 1.6.20 found that the USA, China, and England ranked in the top three in terms of the total link strength, suggesting stronger research correlations between these three countries with other countries.

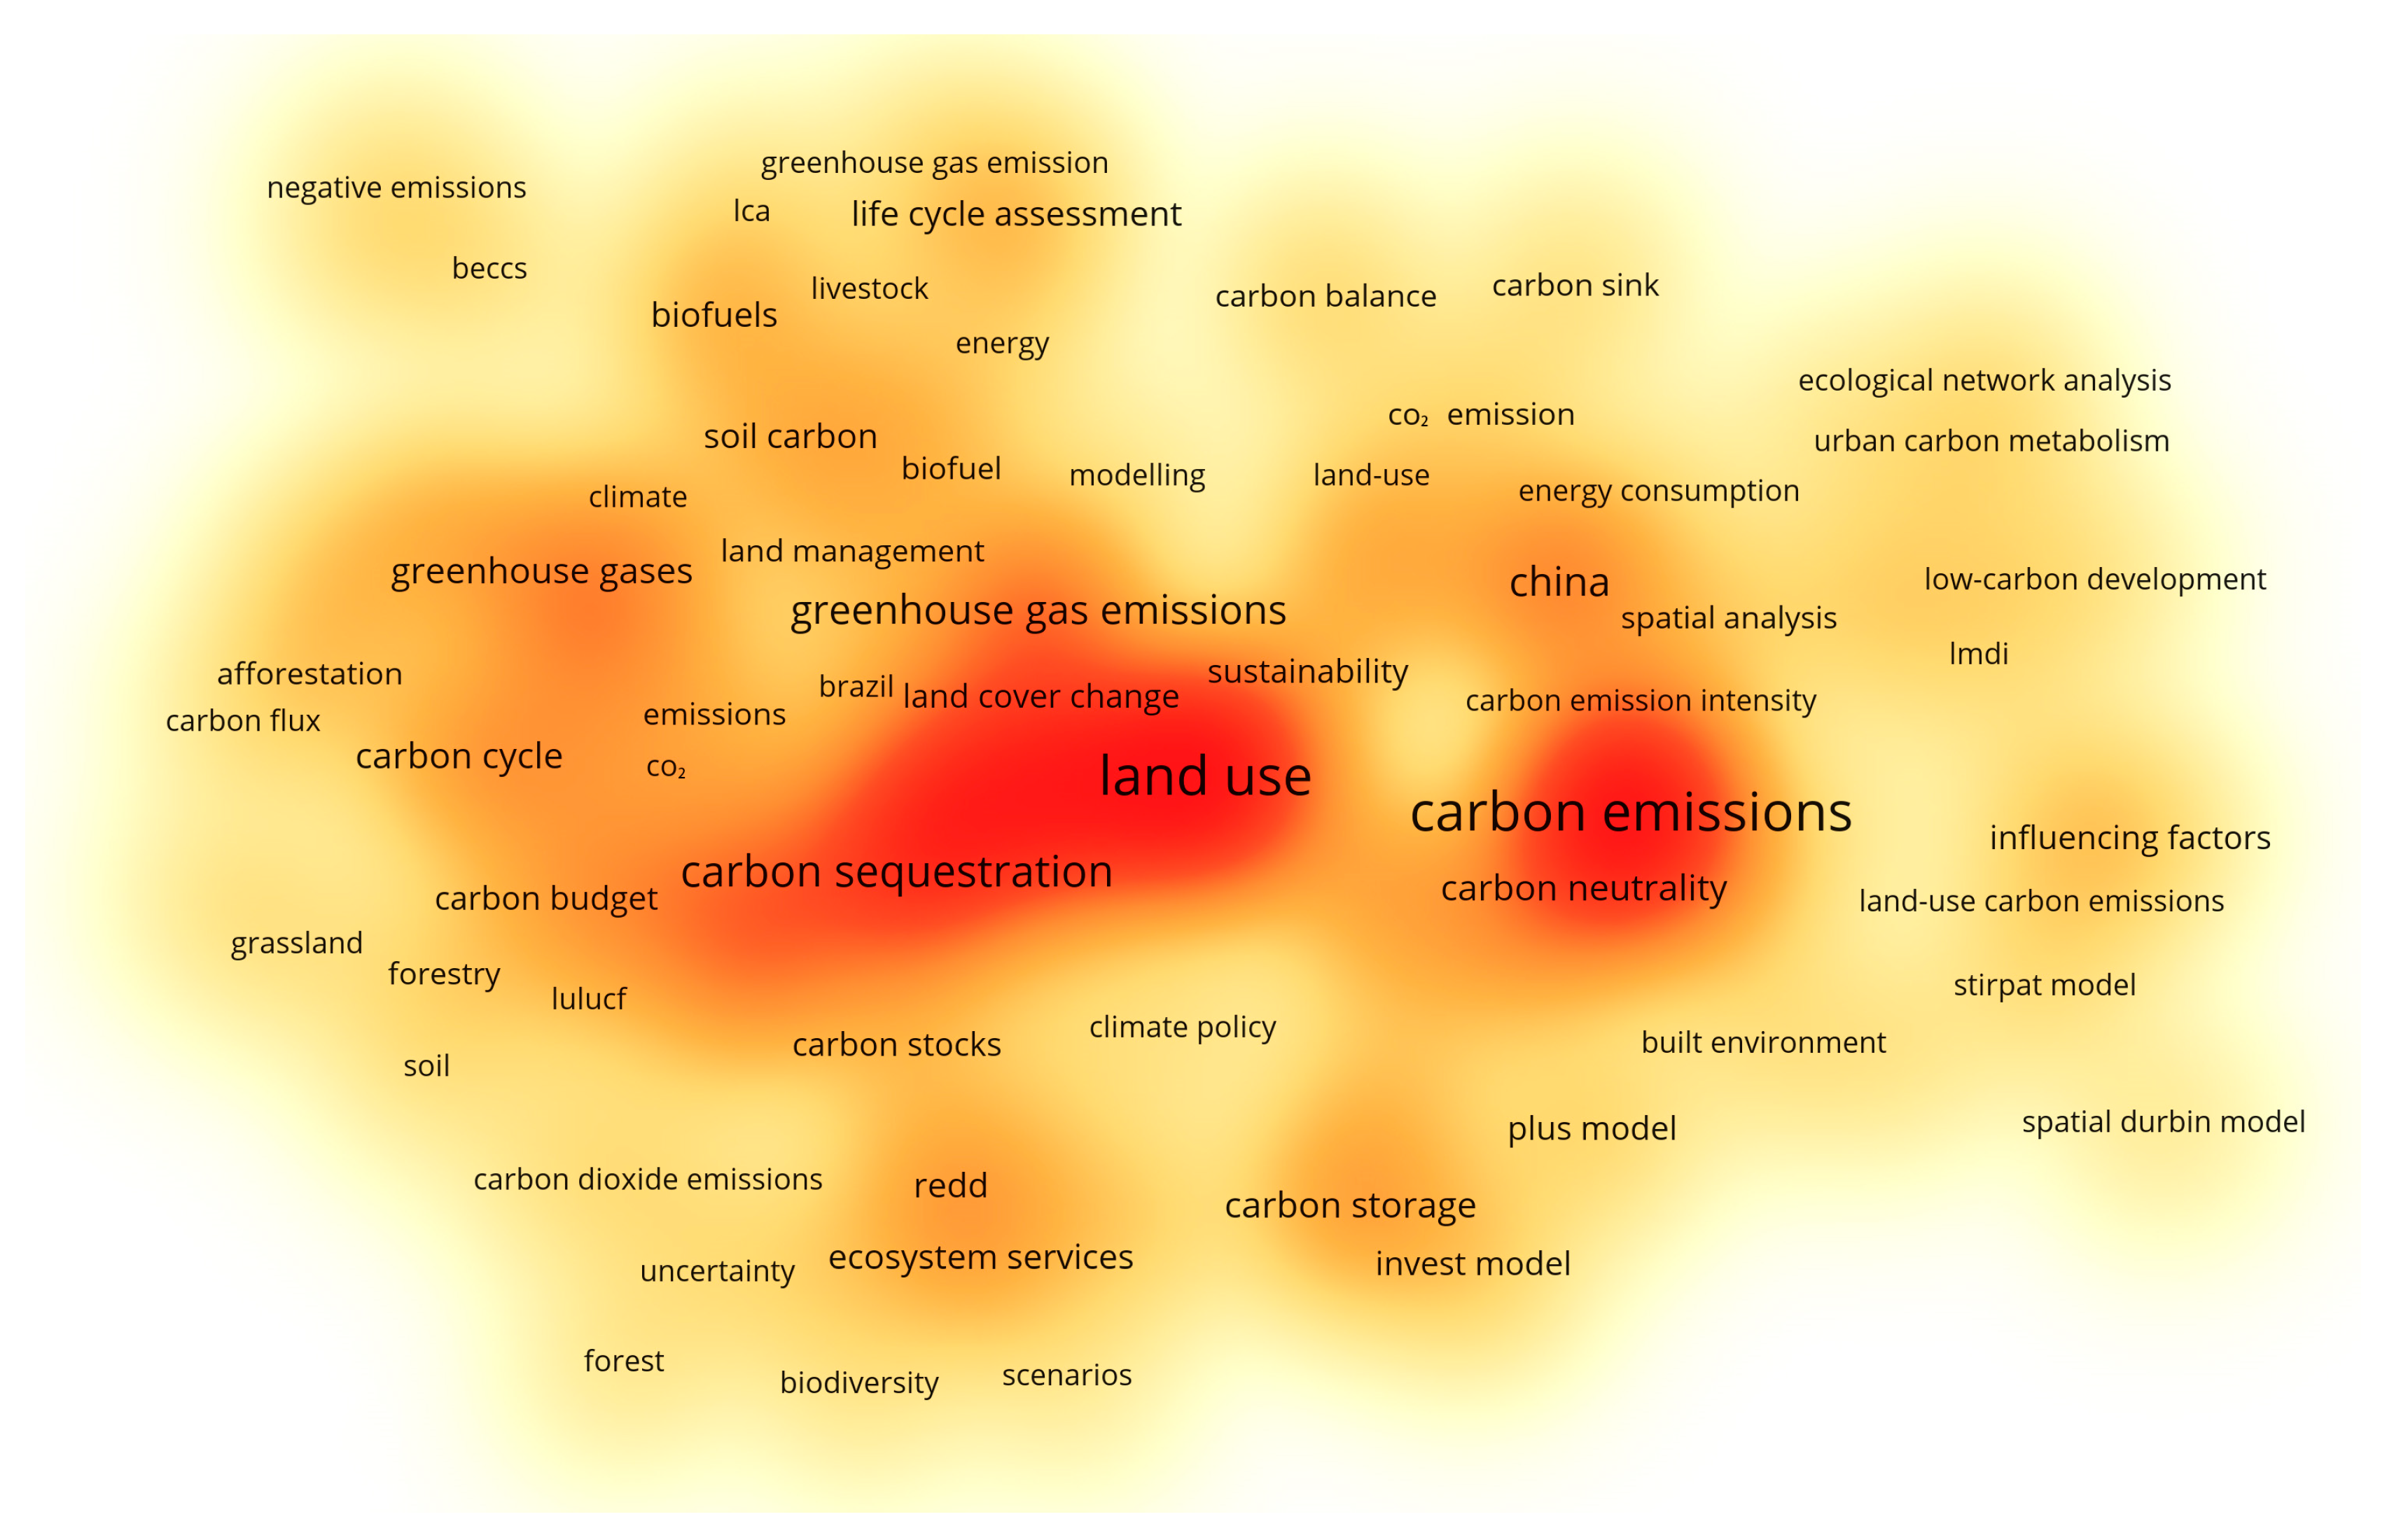
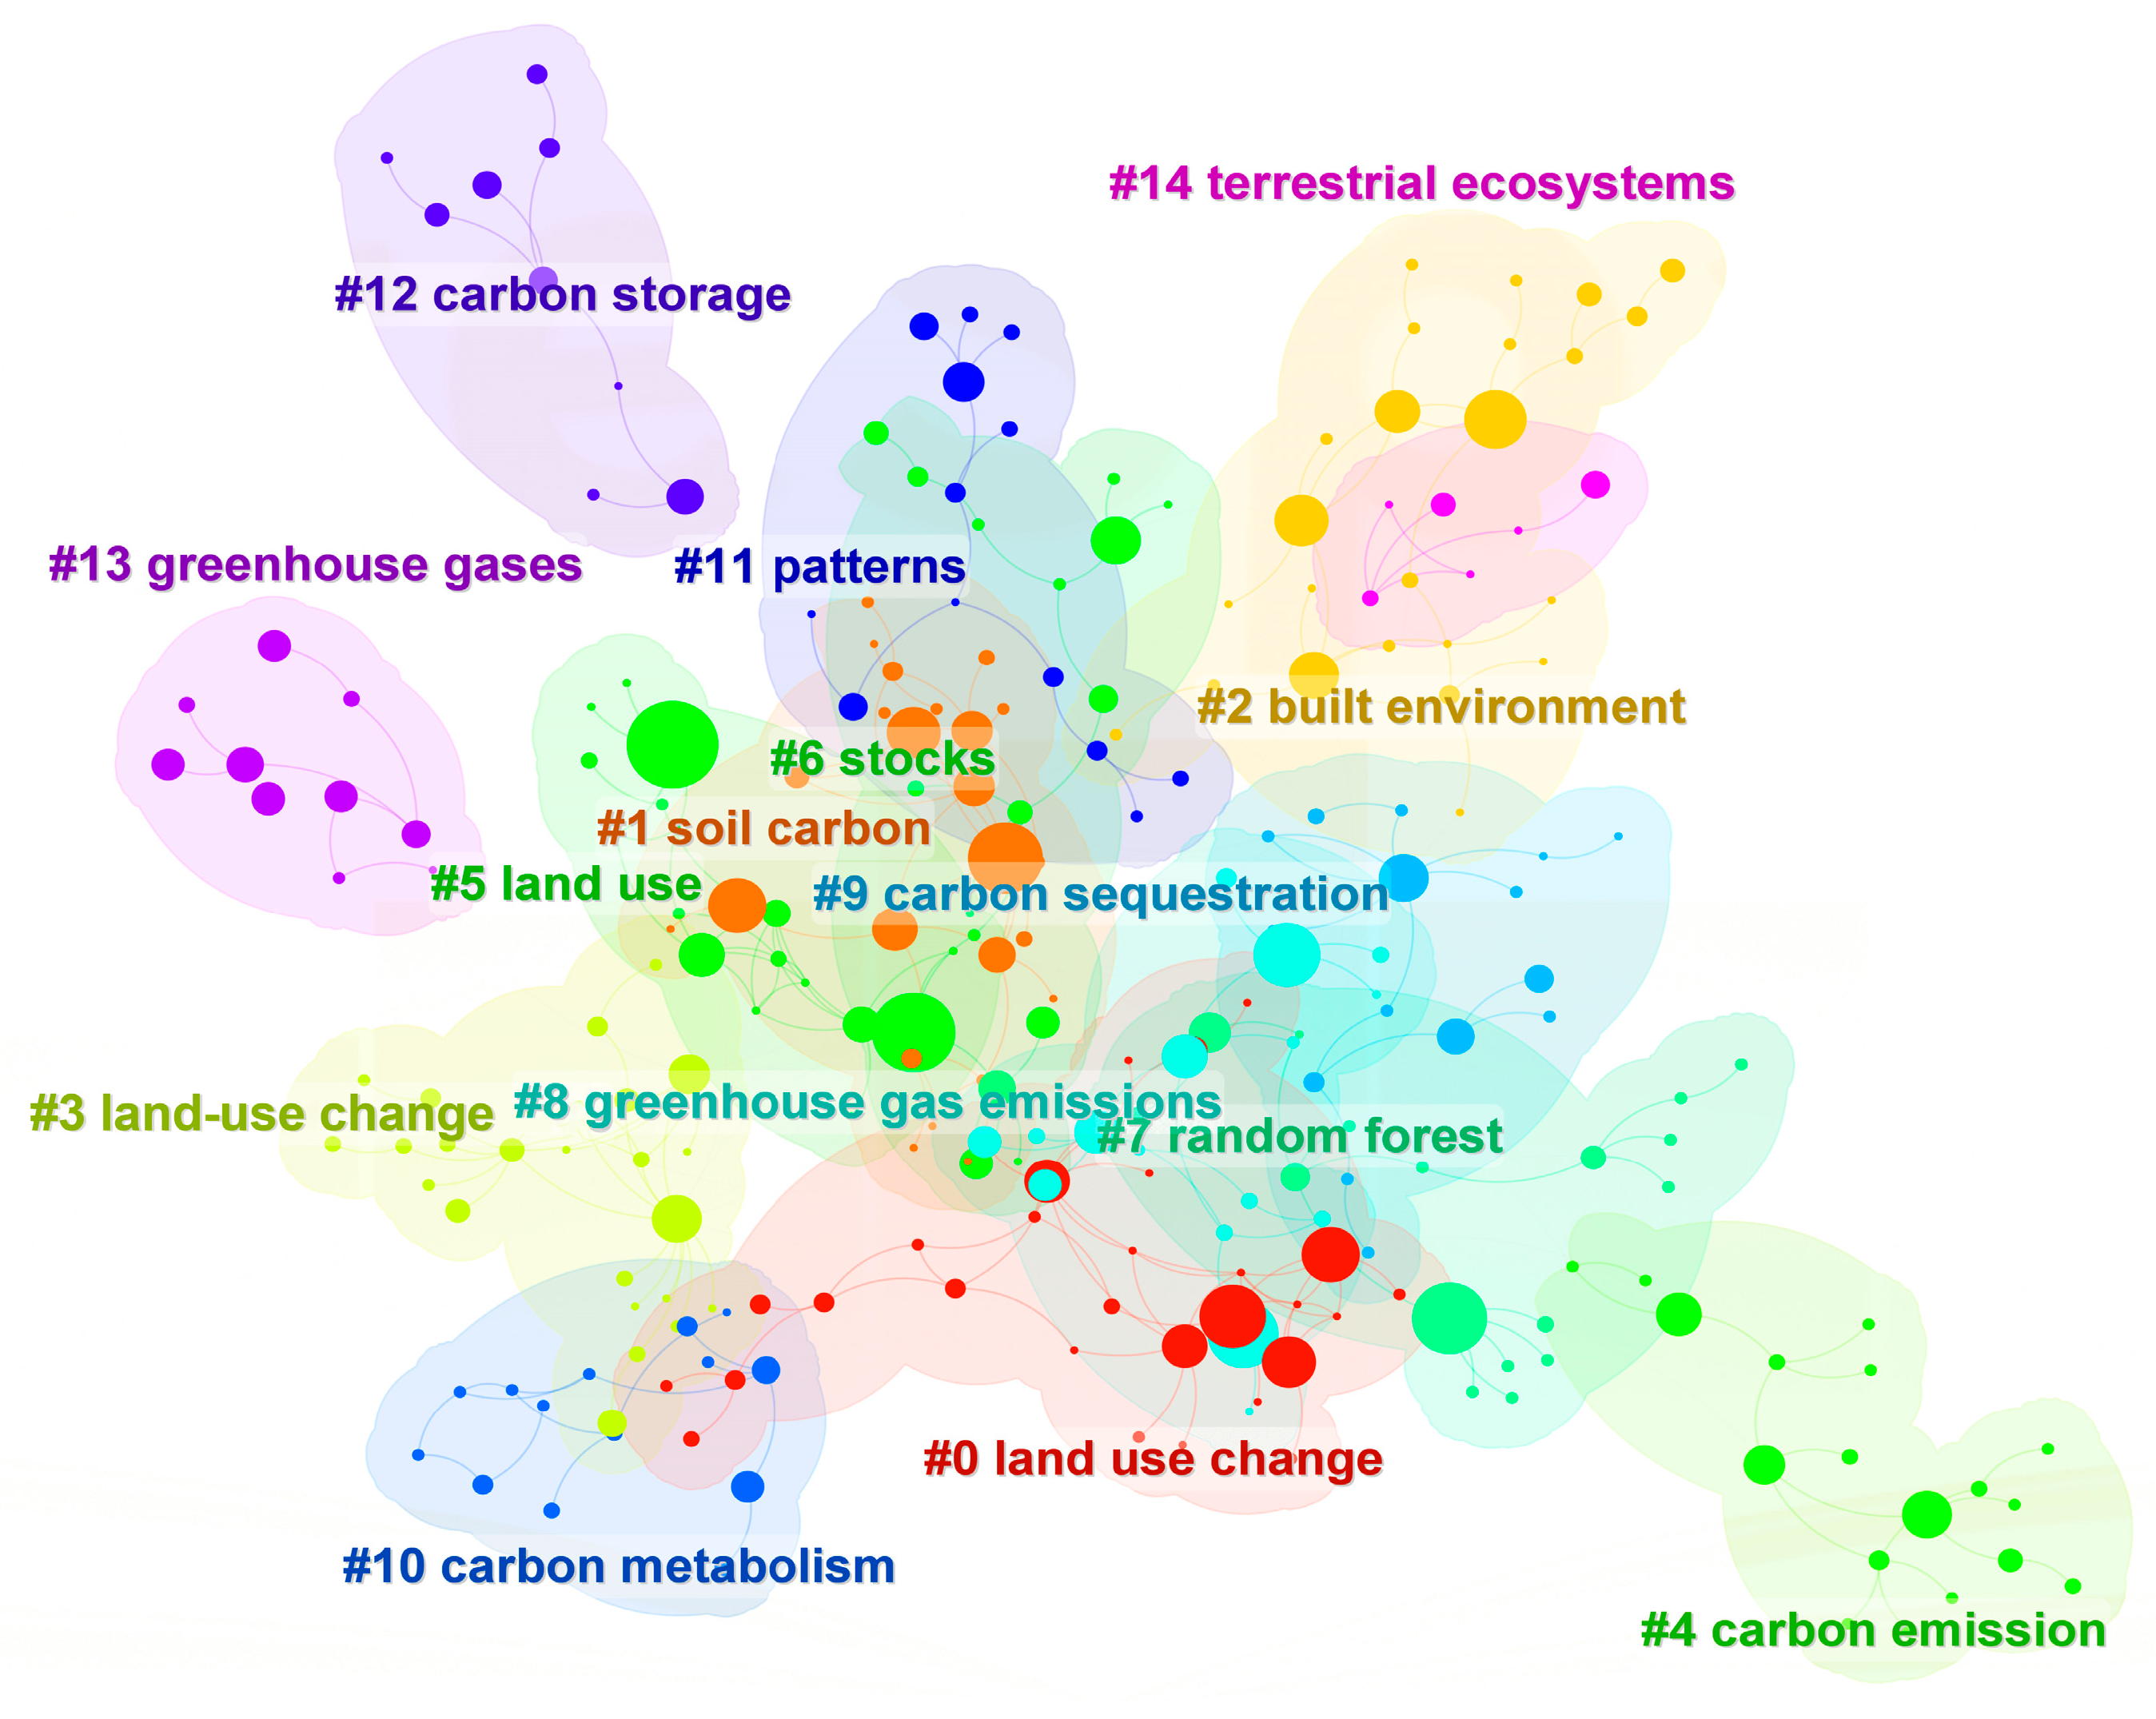
3.1.2. Research Hotspots

Keywords express a high degree of generalization and condensation of the topic of the literature, and the analysis of high-frequency keywords in the literature can reveal the hotspot in a field of research, tendencies, and the relationship between the various research topics. This study used VOSviewer 1.6.20 for high-frequency keyword analysis, the results are shown in Figure 3, where darker colors indicate higher density, i.e., a higher frequency of keyword occurrence. The 10 most frequently occurring keywords are “land use”, “carbon emissions”, “land use change”, “climate change”, “carbon sequestration”, “deforestation”, “China”, “carbon storage”, “agriculture”, and “urbanization”. In addition, the high-frequency keywords related to land use, spatial planning, and carbon emissions are “model”, “greenhouse gas”, “impact”, “city”, “footprint”, etc.
With CiteSpace 6.3.1 used for keyword clustering, the words with, obviously, the same characteristics in the keywords are taken as the clustering object [9]. Thus, the keyword clustering in the research field of land use carbon emissions and low-carbon spatial planning can be obtained. The value of modularity Q is 0.7813, greater than the critical value of 0.3, indicating that the clustering structure is significant; the mean silhouette value is 0.9368, greater than the critical value of 0.7, indicating that the clustering results are convincing. Through the use of the log-likelihood ratio algorithm, a total of 16 groups of clustering labels were obtained, as shown in Table 1 and Figure 4.
Based on the analysis of keyword hotspots and keyword clustering, it can be found that the main focus of current research on land use carbon emissions and low-carbon spatial planning lies in the following aspects: the relationship between land use and carbon emissions or carbon stocks, the impacts of urbanization or urban spatial layout (urban form, built environment, etc.) on carbon emissions, low-carbon spatial planning strategies, and the simulation of future land use and spatial patterns.
It is worth noting that, according to the overall scientometric analysis results, China is the country with the highest number of articles, and the word “China” is one of the top ten hotspot words, together with the fact that China is currently one of the world’s leading carbon-emitting countries. Therefore, in the qualitative analysis that follows, we will pay special attention to China while presenting the current status of global research.

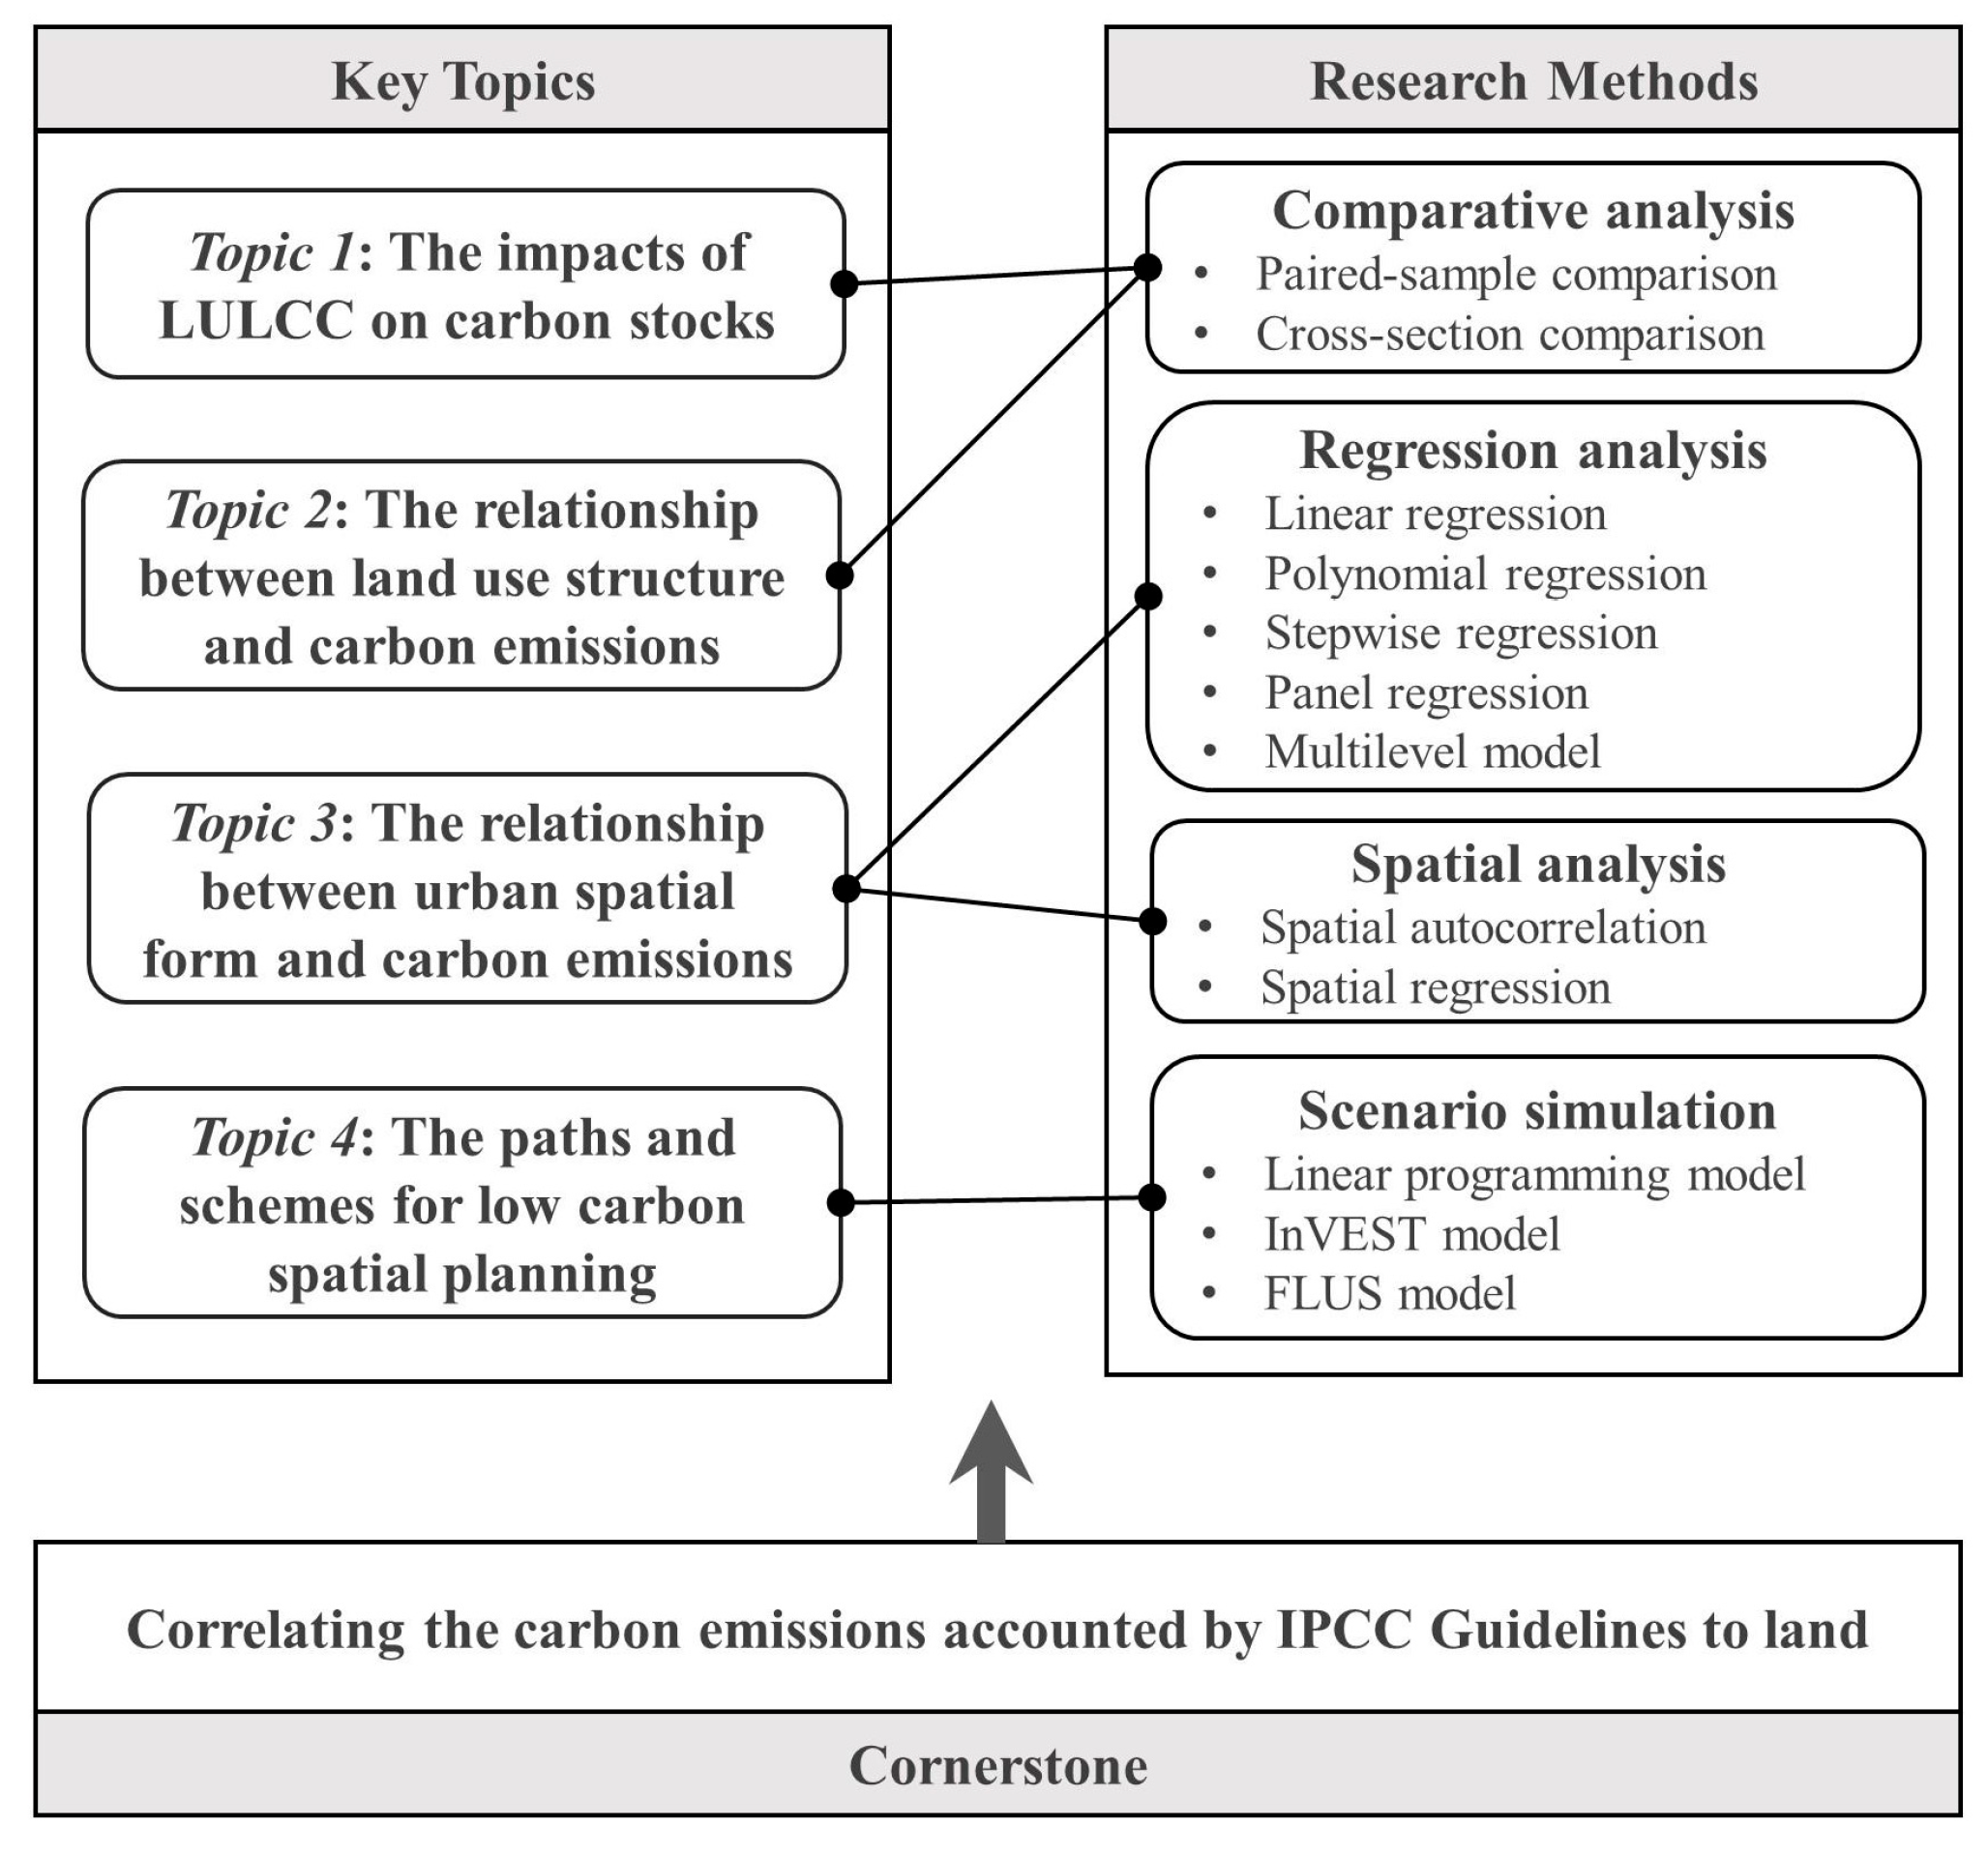
3.2. Key Research Topics

Based on the analysis of research hotspots in the previous section, combined with the intensive reading and summarizing of important literature on the impacts of land use and spatial planning on carbon emissions, this study mainly focuses on four research topics: Topic 1 is the impacts of LULCC on carbon stocks; Topic 2 is the relationship between land use structure and carbon emissions; Topic 3 is the relationship between urban spatial form and carbon emissions; and Topic 4 is the paths and schemes for low-carbon spatial planning. Topic 1 to Topic 3 concern the impacts of land use on carbon emissions, while Topic 4 involves the impacts of spatial planning on carbon emissions.

3.2.1. The Impacts of LULCC on Carbon Stocks

Carbon stocks in terrestrial ecosystems usually refer to the sum of organic carbon stored in vegetation, soil, and dead organic matter in a certain area, and the carbon emissions of terrestrial ecosystems in a region can be obtained through the change of carbon stocks in different periods. LULC types are important determinants of carbon stocks, and current studies have mostly concentrated on the ecological mechanisms of the impacts of LULCC on carbon stocks and the impacts of LULCC on carbon stocks at different spatial or temporal scales.
The changes in vegetation and soil carbon stocks following the conversion from one type of LULC to another, as well as the ecological mechanisms of these changes, were the earliest issues to gain attention. The growing population forces people to convert forests, grasslands, and wetlands into cropland or convert forests into grasslands due to the need for food, leading to changes in soil organic carbon (SOC) [10,11,12,13,14,15]. Urbanization leads to the conversion of natural lands into construction lands, changing both the net primary productivity (NPP) of vegetation and SOC [16,17,18,19]. Various natural or artificial interventions resulting in the return of cropland to forests, grasslands, and wetlands, as well as the re-conversion of abandoned cropland to natural vegetation, may lead to an increase in SOC densities [20,21,22,23,24,25,26,27].
As for the research scale, studies have analyzed the ways in which LULCC affects carbon stocks at the global [28], national [29], and regional [30,31,32,33] levels, and also explored the mechanisms through which LULCC affects carbon stocks at different time scales, such as annual updates [1], decadal scales [34,35], and centennial scales [28,36,37,38].
Changes in other land features can have impacts on soil carbon stocks even when LULC types remain unchanged. For forests, tree species, plant diversity, soil nitrogen and water content, and other factors all have substantial impacts on soil carbon stability and soil carbon stocks [39,40]. For cropland, changes in climate, microorganisms, moisture, nutrients, etc., can significantly affect the soil carbon pool [41,42,43].

3.2.2. The Relationship Between Land Use Structure and Carbon Emissions

Scholars usually express the land use structure in terms of the area composition of different land use types, and studies have mainly concentrated on the socio-economic mechanisms of the impacts of land use structure on carbon emissions at different spatial or temporal scales.
As for the socio-economic mechanisms of the impacts of land use structure on carbon emissions, most studies assumed that land area change was the only contributor to carbon emissions, equated carbon emissions occurring in a particular space to the carbon emissions from land use in that space, and analyzed the response of carbon emissions to the land use structure under this premise [44,45,46]. Several studies combined the area of land with other socio-economic factors, introduced the concept of the degree of intensive use of land, and discussed the relationship between changes in land use structure and carbon emissions on this basis [47,48].
In terms of the spatial scale of the study, some studies analyzed the impacts of land use structure on carbon emissions at the national scale [49], but most studies explored the relationship between land use structure and carbon emissions at the regional scale, such as the province [50], important ecological regions [44,51,52], city circles [53], and major cities [33]. In terms of the temporal scale of the study, limited by land use and socio-economic data, most of the studies have a starting point after 1980. Most studies analyzed the carbon emission effects of land use structure over a period of 10 to 20 years [33,46,54,55]. A few studies spanned more than 40 years [56].

3.2.3. The Relationship Between Urban Spatial Form and Carbon Emissions

In recent years, as a concentrated area of human activities, urban carbon emissions have attracted extensive attention from scholars, and the relationship between the urban spatial form and carbon emissions is one of the most important research topics. The urban spatial form is the pattern and spatial arrangement of land use, transportation networks, and urban design elements, including the physical urban extent, the configuration of streets and building orientation, and the internal configuration of settlements [57]. Current articles have attempted to quantify and characterize urban spatial form using different indicators such as urban centricity, landscape metrics, “5Ds”, building form, etc. and then explored their relationship with carbon emissions.
Urban centricity is an important indicator to characterize the concentration of urban economic development, and numerous studies have explored which is more conducive to carbon emission reduction: urban monocentric or polycentric structure [58,59,60,61,62,63,64].
Landscape metrics—which can quantify the spatial morphology and patterns of patches in the landscape—have become increasingly popular in recent years. Some researchers chose landscape metrics that they thought could represent urban spatial form [65,66,67]; other studies established a reasonable set of landscape metrics for urban morphology after eliminating covariance for a series of landscape metrics [68,69].
Ewing and Cervero proposed characterizing the urban spatial form using the “3Ds”, density, diversity, and design [70], and later added distance to transit and destination accessibility, which were expanded to “5Ds” [71]. A lot of the literature has focused on the relationship between one or more elements of the “5Ds” and carbon emissions. Density is the measure of an urban unit of interest (e.g., population, employment) per area unit (e.g., block, city), and common measures are population density and employment density [72,73,74]. Diversity refers to the integration of land use types or urban functions, which is commonly measured using the variety and mixture of land use types and the ratio of jobs to residents [75,76,77]. Design refers to street design, which is commonly measured through intersection density, road density [78,79], etc. Distance to transit represents the convenience of residents in accessing public transportation services [80]. Destination accessibility is related to the ease of reaching the desired destination [81].
Some scholars pay special attention to the relationship between building form and building energy consumption. Building form includes not only the form of an individual building, such as the building type, building size, and shape coefficient, but also the form of a building group, such as the building group layout, the average building floors, the building density, the street orientation, etc. Recent articles have mainly focused on the relationship between the morphological characteristics of residential buildings and their energy consumption [71,82,83,84].

3.2.4. The Paths and Schemes for Low-Carbon Spatial Planning

Low-carbon spatial planning has emerged as one of the most important research areas as a crucial means for realizing carbon emission reduction and sink enhancement. Relevant studies have mainly explored the planning paths of carbon emission reduction and sink enhancement from the aspects of land use structure and spatial layout. Nonetheless, international planning schemes for carbon emission reduction and sink enhancement vary as well because of the significant variations in planning tools across nations.
Carbon sequestration in plantations can play an important role in mitigating the buildup of atmospheric carbon [85]. Because forests perform a substantial carbon sequestration function, a number of studies have focused on their future carbon sequestration potential. There was a wealth of research on the carbon sequestration potential of future afforestation and reforestation at the global scale, but the estimates are dependent on various scenario assumptions, especially on the amount of available land, and many studies have suggested that only abandoned or low-productivity land can be used for afforestation and reforestation [85,86,87,88].
Concerning the achievement of emission reductions and carbon sink enhancement through land use structure optimization, at the theoretical level, some scholars have proposed the planning response logic of land use structure optimization [89]. At the empirical level, scholars established models for optimizing the land use structure by taking the maximization of ecosystem organic carbon stock or the minimization of land use carbon emission as the objective function [90,91,92,93].
On the topic of achieving carbon emission reduction and sink enhancement through optimized spatial zoning, some studies have proposed measures from the perspective of planning and zoning [89,94,95], many scholars have attempted to simulate the land spatial layout under different spatial expansion constraint scenarios in planning and compared the carbon emissions of the scenarios to find low-carbon land spatial layouts [46,96,97].
In discussing the achievement of carbon emission reduction through optimizing urban form, since transportation carbon emissions account for a relatively high proportion of all types of carbon emissions, some studies have focused on how to achieve carbon emission reduction through transportation layout optimization, such as transit-oriented development (TOD) strategy [98,99], bus rapid transit (BRT) combined with walking and cycling [100], and land-transportation integrated planning [101,102]. Carbon emission reduction in building layout is also an important area of research [103,104].

3.3. Research Methods

The current internationally accepted methodology for accounting for carbon emissions is the IPCC Guidelines for National Greenhouse Gas Inventories (IPCC Guidelines), which accounts for carbon emissions by five sectors: energy, industrial processes and product use, AFOLU, waste, and other. In the study of the impacts of land use and spatial planning on carbon emissions, the most basic and critical step is to correlate the carbon emissions accounted for in the IPCC Guidelines to land. On this basis, according to the review of the main literature, it is found that four methods, namely comparative analysis, regression analysis, spatial analysis, and scenario simulation, are more widely employed in studies, and their correspondence with the four key topics is shown in Figure 5.

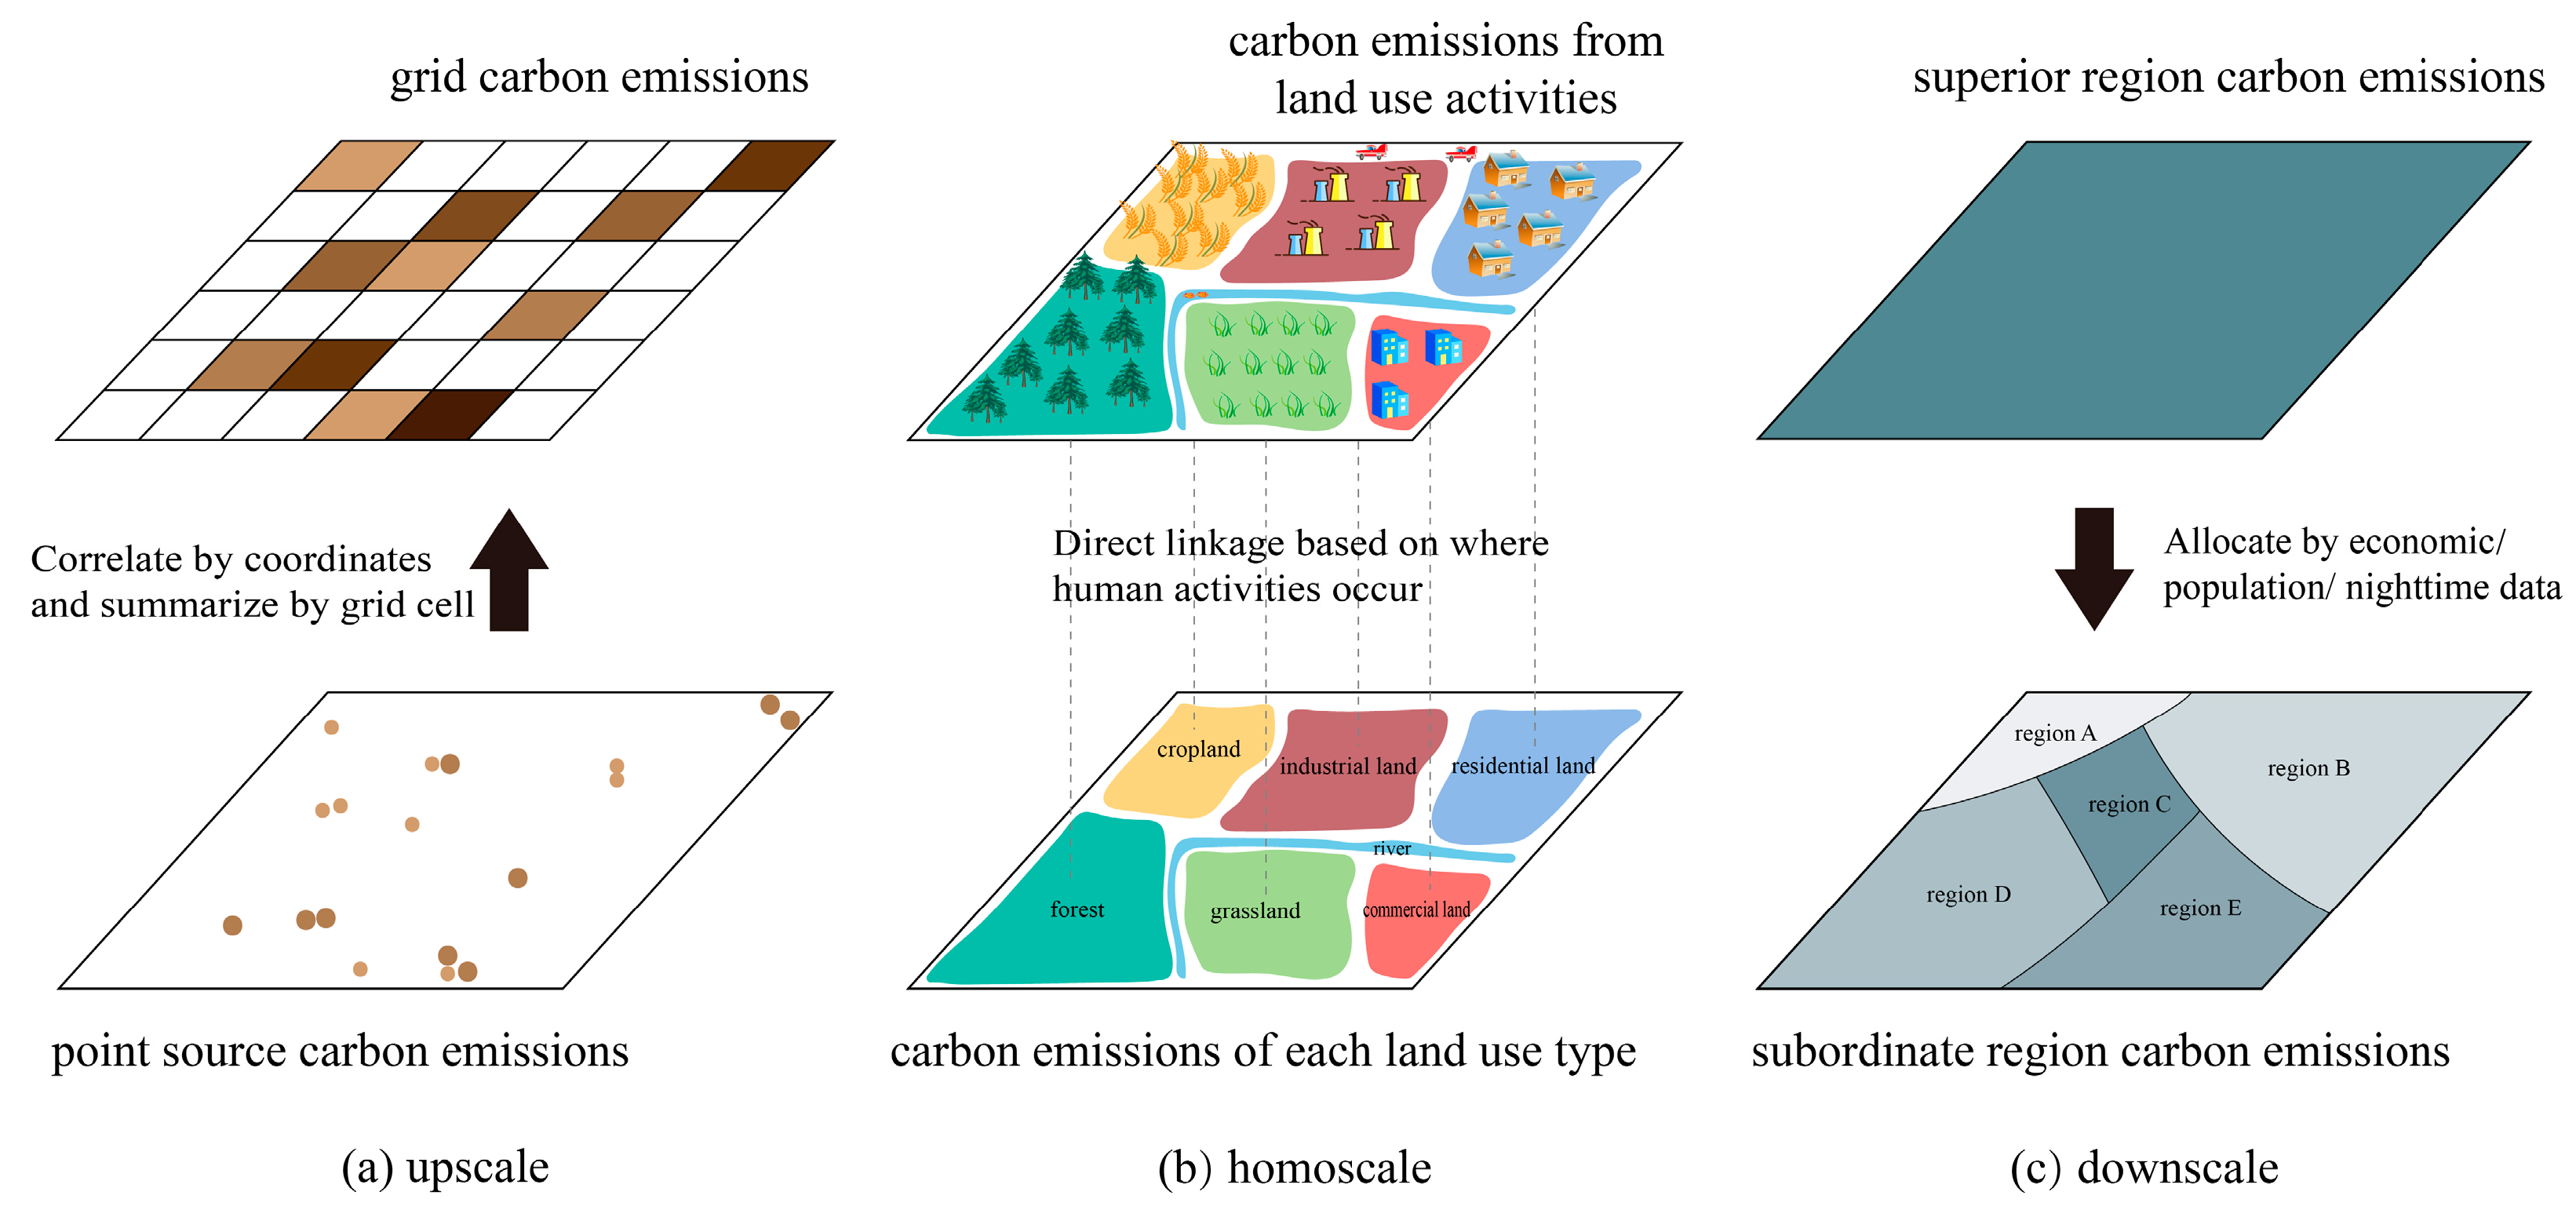
3.3.1. Methods for Spatial Correlation of Carbon Emissions

In general, studies have focused on the “activity-space” carrying relationship, correlating one or more types of carbon emissions in the IPCC Guidelines to the land space where the activities occur via three routes (Figure 6).
(i)
Upscale route.
The first route is based on the investigation of point source carbon emission activities. According to the “activity-location” relationship, the point source carbon emissions are related to the corresponding spatial unit by geographic coordinates, and carbon emissions at the target scale can be obtained by aggregating upward. This is an upscale approach to obtaining spatial carbon emissions, as shown in Figure 6a. Many studies have used this approach to establish industrial point source-space relationships [105,106,107,108].
(ii)
Homoscale route.
The second route is based on the classification of human activities. According to the “activity-land use type” carrying relationship, the carbon emissions generated via each type of activity are related to the land where the activity occurs, and the carbon emissions of all human activities carried on the land use type are summarized as the total carbon emissions of that land use type, as shown in Figure 6b. This approach is commonly applied by Chinese scholars [44,45,109,110,111,112].
(iii)
Downscale route.
The third route is based on the characterization of regional activity level. According to the “activity-region” carrying relationship, the activity proportion of each region under its jurisdiction is taken as the carbon emission decomposition coefficient, and the carbon emissions of the superior region are decomposed down to its subordinate region, as shown in Figure 6c. This is a downscale approach to obtaining spatial carbon emissions. It is usually assumed that the level of activity determines the amount of carbon emissions on this route, but various indicators have been used to characterize the level of regional activity. Economic indicators are often used in research, such as the proportion of the output value of economic sectors [113,114], revenue or turnover of economic sectors [114], or regional GDP [46] in the province of the municipality or county. Demographic indicators are also common in research. For carbon emissions from residential domestic energy consumption, waste disposal, and residential respiration, the decomposition coefficients for downscaling are often population proportion or population density [106,113,114]. Nighttime light data has been shown to be closely related to activity levels such as GDP and population density of a country or region [115,116], so some studies have employed nighttime light data to downscale the carbon emissions from energy consumption [117].
(iv)
Advantages and disadvantages of the three routes.
The upscale route adopts a “bottom-up” approach to collect data, calculate carbon emissions from activities, and relate them to spatial units, which is more accurate, but data acquisition is difficult and costly, making it hard to obtain large-scale, time-continuous data. This route is mainly used to calculate surface carbon emissions at the point when the country or region has detailed investigation data. The homoscale route needs to clarify the human activities on land and treat carbon emissions from human activities as the same as those from land use, which cannot describe the spatial differentiation of the carbon emissions within the same land category. The downscale route adopts a “top-down” approach to calculate the carbon emissions and then expresses the level of activities using characteristic indicators such as economic indicators, demographic indicators, and nighttime light data values to decompose carbon emissions into subordinate regions, but no matter how the decomposition is carried out, it can only obtain a rough correspondence.

3.3.2. Comparative Analysis Method

The comparative analysis method is a commonly used method for Topic 1 and Topic 2. Topic 1 typically requires comparing changes in vegetation and soil carbon stocks after conversion from one LULC to another through sampling. Topic 2 requires comparing carbon emissions before and after the structural change in land use.
According to the difference in the comparison object, it can be further divided into two categories: the paired-sample comparison method and the cross-section comparison method. The paired-sample comparison is the main method used in Topic 1, and the comparison object is usually the SOC of the sample plots before and after LULCC [10,11,13,26]. The cross-section comparison method is applied to both Topic 1 and Topic 2, with the comparison based on cross-section data of carbon stocks [28,31] or carbon emissions at different time points in the study area [44,54]. Both methods are applicable in their own contexts, with the paired-sample comparison being relatively more costly due to the need for field sampling.

3.3.3. Regression Analysis Method

In Topic 3, scholars usually take spatial form indicators such as urban centrality, landscape metrics, “5Ds”, and building form as independent variables and carbon emissions as dependent variables, and they set up regression models in traditional econometrics to examine the relationship between the two. Linear regression models, polynomial regression models, stepwise regression models, panel regression models, and multilevel models are among the most often used regression models in research.
Linear regression models are most typically employed; scholars have established simple linear regression models [72] or multiple linear regression models [76] to analyze the relationship between urban spatial form and carbon emissions. Some scholars have built a polynomial regression model using cross-section data [66], and some have used a stepwise regression model to identify landscape metrics that have an impact on urban carbon emissions and are free of multicollinearity [69]. Given the unique advantages of panel data, more and more studies have used panel regression models to analyze the relationship between urban spatial form and carbon emissions, specifically including fixed effects models [64,65,67] and pooled regression models [68]. In addition, there were also studies using multilevel models that can further analyze individual differences [78].
Which regression analysis method was used in the study is determined by the source of data and the objectives of the study. As it stands, the panel regression model combines the characteristics of time series and cross-sectional data and has advantages in improving estimation accuracy and reducing covariance.

3.3.4. Spatial Analysis Method

Spatial analysis methods, including spatial correlation network analysis, spatial autocorrelation analysis, and models based on spatial autocorrelation analysis, such as spatial regression models (spatial lag model, spatial error model, spatial Durbin model, etc.), have been widely used in Topic 3. In Figure 3, analytical methods such as spatial analysis and spatial Durbin modeling are also high-frequency terms. The spatial autocorrelation analysis is used to test spatial dependence; some studies have used the spatial regression model in spatial econometrics to analyze the relationship between urban spatial form and carbon emissions on the basis of spatial autocorrelation analysis. For example, Zheng et al. compared the merits and demerits of the spatial error model and the ordinary least squares method in analyzing the relationship between urban spatial form and carbon emissions [69]; Sun et al. used the spatial Durbin model, the spatial lag model, and the spatial error model to analyze he relationship between urban spatial form and carbon emissions [63].
In contrast to the traditional regression model in Section 3.3.3, the geographic structure in the spatial analysis method is transformed into quantifiable parameters through the introduction of the spatial weighting matrix, which reveals complex interaction mechanisms that cannot be captured by the traditional regression model.

3.3.5. Scenario Simulation Method

In Topic 4, the scenario simulation method is the most widely employed method for assessing the potential of future carbon storage and the amount of carbon emissions under different land use structures, and “scenarios”, “invest model”, and “plus model” are high-frequency terms in Figure 3. This method sets up several possible planning scenarios based on previous trends and future development goals and then compares the differences in carbon emissions between the scenarios.
The more commonly used models include the InVEST model, FLUS model, PLUS model, linear programming model, etc. Through rational parameterization and scenario analysis, the InVEST carbon module can efficiently support the assessment of ecosystem carbon sequestration function, so many scholars use this model for carbon storage simulation [118,119,120]. Both the FLUS and PLUS models are state-of-the-art models for LULCC simulation and prediction, and they are particularly good at spatially explicit simulation based on the principle of cellular automata; most studies have used them for the simulation of the regional land use structure and spatial layout [46,96,97,121,122]. The linear programming model can be used to optimize land use structure, and optimization is accomplished through the use of Linear Interactive and General Optimizer (LINGO) software; some studies used this model to simulate the land use structure under the target scenarios of maximizing the organic carbon stocks in terrestrial ecosystems or minimizing the carbon emissions from land use [44,90].
These scenario simulation methods are applicable to different research needs: the InVEST model is mainly used for carbon storage simulation; the PLUS and FLUS models are applicable to the simulation of land use structure and spatial layout; and the linear programming model is only applicable to the simulation of land use structure and is not capable of spatial layout simulation. Most of the current research tries to use a combination of these methods.

3.4. Main Research Consensus

3.4.1. Human Land Use Is an Important Influencing Factor on Carbon Stocks

Whether on a global, national, or regional scale, or over a period of 10, 15, or even 100 years, the decrease in forest area and the increase in cropland and construction land as a result of human land use activities with population growth have been the primary causes of the decrease in NPP and SOC, while programs such as returning cropland to forests, grasslands, and wetlands have increased the carbon stocks to a certain extent [10,11,12,13,14,15,16,17,18,19,20,21,22,23,24,25,26,27].

3.4.2. The Impacts of Land Use on Carbon Emissions Vary, Depending on the Historical Stages

The characteristics of land use vary, depending on the historical stages, as do the causes of carbon emissions. Taking China as an example, during the 300 years preceding 1980, China was dominated by agricultural production, with cropland area increasing steadily and cropland primarily converted from forests and grasslands, and changes in vegetation and soils resulting in carbon emissions [36,37,38]. After 1980, China experienced tremendous population urbanization. The rapid expansion of construction land and the encroachment of cropland, forests, and grasslands were the main causes of carbon emissions in this period, and the area of cropland also changed from continuous growth before 1980 to gradual reduction [31,32,35]. Meanwhile, ecological projects such as land greening, afforestation, and natural forest protection were widely implemented during this period, supplementing the forest area and increasing the carbon sinks [30,123].

3.4.3. Urban Spatial Form Mainly Affects Carbon Emissions from Transportation and Buildings

A vast amount of empirical research on the relationship between urban spatial form and carbon emissions has been conducted, and the findings indicate that the impacts of urban spatial form on carbon emissions can be mainly attributed to the impacts on transportation and building carbon emissions.
The city’s centrality, agglomeration, and complexity at the macro-level, as well as its meso-level layout, have a significant impact on transportation carbon emissions. Urban centricity is an important indicator in characterizing the city’s centrality. While some researchers thought that a monocentric structure would help establish an effective public transportation system [60,61], others thought that a polycentric structure could promote the balance of jobs and housing and shorten commuting times [58,63]. However, other studies revealed that the relationship between urban centricity and transportation carbon emissions depends on the type, scale, and location of the city [64]. Many studies have described the agglomeration and complexity of urban form using landscape metrics, and it is generally accepted that scattered or irregular urban form could increase transportation carbon emissions, whereas agglomerated and continuous urban form could reduce transportation carbon emissions [65,66,67,68,69]. Studies using the “5Ds” to describe the distribution of residential, commercial, public facility, road, and transit stations within cities have shown that high population and employment density, high land use mix and job-housing balance, high connectivity, high accessibility, and low distance to transit are associated with low vehicle miles traveled and low transportation carbon emissions [73,74,76,78,81].
At the micro-level, development density indicators such as building density and the building spacing of a plot, as well as building form indicators, can affect building energy consumption by influencing building lighting and solar energy utilization, the urban heat island effect, etc., thus affecting building carbon emissions [71,82,83,84].

3.4.4. Spatial Planning Can Reduce Carbon Emissions

Worldwide, it is generally acknowledged that afforestation and reforestation, converting cropland to forests or grasslands, and restoring wetlands should be promoted in the future through planning policies to increase carbon stocks in terrestrial ecosystems [123,124].
Urban spatial form can have an important impact on carbon emissions and is difficult to change once formed. Based on this understanding, many scholars have tried to find a low-carbon urban spatial layout, such as controlling urban sprawl through urban development boundaries [89,96], advocating mixed land use and diversified development [75], implementing TOD strategy, improving low connectivity of roads, and implementing land-transportation integrated planning [98,99,100,101,102], determining a parcel’s reasonable development capacity and the layout of its building groups [89,125].
Many scholars have optimized land use structure through multi-objective planning to solve the problem of carbon emissions caused by construction land expansion and proposed objectives and corresponding carbon emissions under different scenarios in the future so as to provide programmatic references for the preparation and implementation of low-carbon spatial planning [46,90,91,93,97].

4. Conclusions and Discussion

4.1. Conclusions

This study presents a scientometric analysis of a knowledge map of the impacts of land use and spatial planning on carbon emissions, and it summarizes the key research topics, methods, and main consensus of highly cited articles and other important articles. The following conclusions are formulated.
First, the analysis of the temporal and spatial distribution characteristics of the articles shows that global attention to low-carbon spatial planning has increased significantly after 2009, and that China, the USA, and England has paid more attention to the relationship between land use, spatial planning, and carbon emissions. Based on the analysis of keyword hotspots and keyword clustering, it can be found that the main focus of research on land use carbon emissions and low-carbon spatial planning lies in the relationship between land use and carbon emissions or carbon stocks, the impacts of urbanization or urban spatial layout on carbon emissions, low-carbon spatial planning strategies, and the simulation of future land use and spatial patterns.
Second, combining the hotspots analysis and the key literature analysis, it is found that the current studies mainly focus on four key research topics. Topic 1 is the impacts of LULCC on carbon stocks, which concentrated on the ecological mechanisms of the impacts of LULCC on carbon stocks and the impacts at different spatial or temporal scales. Topic 2 is the relationship between land use structure and carbon emissions, which concentrated on the socio-economic mechanisms of the impacts of land use structure on carbon emissions and the impacts at different spatial or temporal scales. Topic 3 is the relationship between urban spatial form and carbon emissions; articles have attempted to quantify and characterize urban spatial form using different indicators such as urban centricity, landscape metrics, “5Ds”, and building form. Topic 4 is the paths and schemes for low-carbon spatial planning.
Third, in the study of the impacts of land use and spatial planning on carbon emissions, the most basic and critical step is to correlate the carbon emissions accounted for in the IPCC Guidelines to land space, with the three upscale, homoscale, and downscale routes. On this basis, four research methods, comprising the comparative analysis method, the regression analysis method, the spatial analysis method, and the scenario simulation method, were widely used in studies, with comparative analysis method mainly applied to Topic 1 and Topic 2, regression analysis and spatial analysis mainly applied to Topic 3, and scenario simulation mainly applied to Topic 4.
Fourth, studies have yielded some consensus, including that human land use is an important influencing factor on carbon stocks, that the impacts of land use on carbon emissions vary depending on the historical stages, that urban spatial form mainly affects carbon emissions from transportation and buildings, and that spatial planning can reduce carbon emissions, yet low-carbon planning paths vary across countries and regions.

4.2. Discussion

While significant progress has been achieved, there remain several limitations in current research. First, human land use is a complex process in which natural reproduction and economic reproduction are intertwined, residing under the joint action of terrestrial ecosystems and socio-economic systems, which should be taken into account in national or regional spatial planning. However, most studies have ignored this point, thereby undermining the legitimacy of the research findings and policy recommendations. Second, most studies have treated carbon emissions from human activities in land space as the same as those from land use, making it difficult to distinguish and quantify the contribution of carbon emissions from land use. Therefore, the reliability of the proposed low-carbon spatial planning strategies is generally unsatisfactory. Thirdly, the research on the impacts of land use and spatial planning on carbon emissions at the meso- and micro-scales has to date received far less attention than that at the macro-scales, such as the global and national scales.
Based on the recognition of the challenges in this field, future research could be further refined and deepened in the following aspects:
Firstly, land property rights, market structures, and spatial planning management systems in different countries should be introduced as research preconditions. Carbon emissions caused by human land use will vary depending on land property rights, market structures, and spatial planning management systems of different countries. For example, China, with its public land ownership system, is a vast unitary state with a five-tier spatial planning and management system from the central to local levels; whereas the USA, as a federal country, does not have a unified planning system up and down the country, with planning basically being the responsibility of state and local governments. As a result, the impacts of land use on carbon emissions and their low-carbon spatial planning response strategies are bound to be different in these two countries.
Secondly, the sensitivity of carbon emissions from human activities to land space should be explored. Based on the natural productivity and spatial carrying function of land, carbon emissions from land use can be divided into two categories: direct carbon emissions from terrestrial ecosystems and indirect carbon emissions from socio-economic systems. There should be differences in the sensitivity of carbon emissions to land in these two systems. In future research, it is necessary to vigorously promote the study of the sensitivity of different carbon sources and sinks to land space, distinguish between carbon sources and sinks that are directly or indirectly related to spatial planning elements, and use this as a foundation for studying the carbon emission effects of human land use.
Finally, research on low-carbon planning at medium- and long-term time scales and micro- and meso-spatial scales should be strengthened. Spatial planning is an important policy tool for mitigating or adapting to climate change. For the implementation of carbon emission reduction responsibilities, it is extremely urgent to enhance the research on low-carbon planning at the temporal scale of 10 to 15 years and the spatial scale of city, county, and community. In addition, the impact mechanisms of various planning elements on carbon emissions should be studied at the spatiotemporal scales of planning implementation, and land management measures and spatial planning strategies for emission reduction and sink enhancement that meet regional reality should be proposed.

Author Contributions

Conceptualization, Y.W. and X.J.; methodology, X.J.; software, Y.W.; validation, X.J.; formal analysis, Y.W.; investigation, Y.W.; resources, X.J.; data curation, X.J.; writing—original draft preparation, Y.W.; writing—review and editing, X.J.; visualization, Y.W.; supervision, X.J.; project administration, X.J. All authors have read and agreed to the published version of the manuscript.

Funding

This research received no external funding.

Data Availability Statement

Data is contained within the article.

Conflicts of Interest

The authors declare no conflicts of interest.

Abbreviations

The following abbreviations are used in this manuscript:
AFOLUAgriculture, Forestry, and Other Land Use
LULCLand Use and Land Cover
LULCCLand Use and Land Cover Change
SOCSoil Organic Carbon
NPPNet Primary Productivity
TODTransit-Oriented Development
BRTBus Rapid Transit

References

  1. Friedlingstein, P.; O’Sullivan, M.; Jones, M.W.; Andrew, R.M.; Gregor, L.; Hauck, J.; Le Quéré, C.; Luijkx, I.T.; Olsen, A.; Peters, G.P.; et al. Global carbon budget 2022. Earth Syst. Sci. Data 2022, 14, 4811–4900. [Google Scholar] [CrossRef]
  2. Dhakal, S.; Minx, J.C.; Toth, F.L.; Abdel-Aziz, A.; Meza, M.J.F.; Hubacek, K.; Jonckheere, I.G.C.; Kim, Y.-G.; Nemet, G.F.; Pachauri, S.; et al. Emissions Trends and Drivers. In Climate Change 2022: Mitigation of Climate Change, Contribution of Working Group III to the Sixth Assessment Report of the Intergovernmental Panel on Climate Change; IPCC, Ed.; Cambridge University Press: Cambridge, UK, 2022; p. 236. [Google Scholar]
  3. Raupach, M.R.; Marland, G.; Ciais, P.; Le Quéré, C.; Canadell, J.G.; Klepper, G.; Field, C.B. Global and regional drivers of accelerating CO2 emissions. Proc. Natl. Acad. Sci. USA 2007, 104, 10288–10293. [Google Scholar] [CrossRef]
  4. Henriques, S.T.; Borowiecki, K.J. The drivers of long-run CO2 emissions in Europe, North America and Japan since 1800. Energy Policy 2017, 101, 537–549. [Google Scholar] [CrossRef]
  5. Foley, J.A.; DeFries, R.; Asner, G.P.; Barford, C.; Bonan, G.; Carpenter, S.R.; Chapin, F.S.; Coe, M.T.; Daily, G.C.; Gibbs, H.K.; et al. Global consequences of land use. Science 2005, 309, 570–574. [Google Scholar] [CrossRef]
  6. Hood, W.W.; Wilson, C.S. The literature of bibliometrics, scientometrics, and informetrics. Scientometrics 2001, 52, 291–314. [Google Scholar] [CrossRef]
  7. Boyack, K.W.; Wylie, B.N.; Davidson, G.S. Information visualization, human-computer interaction, and cognitive psychology: Domain visualizations. In Visual Interfaces to Digital Libraries; Borner, K., Chen, C., Eds.; Lecture Notes in Computer Science; Springer: Berlin/Heidelberg, Germany, 2002; Volume 2539, pp. 145–158. [Google Scholar]
  8. van Eck, N.J.; Waltman, L.; Dekker, R.; van den Berg, J. A Comparison of Two Techniques for Bibliometric Mapping: Multidimensional Scaling and VOS. J. Am. Soc. Inf. Sci. Technol. 2010, 61, 2405–2416. [Google Scholar] [CrossRef]
  9. Chen, C. CiteSpace II: Detecting and visualizing emerging trends and transient patterns in scientific literature. J. Am. Soc. Inf. Sci. Technol. 2005, 57, 359–377. [Google Scholar] [CrossRef]
  10. Fujisaki, K.; Perrin, A.S.; Garric, B.; Balesdent, J.; Brossard, M. Soil organic carbon changes after deforestation and agrosystem establishment in Amazonia: An assessment by diachronic approach. Agric. Ecosyst. Environ. 2017, 245, 63–73. [Google Scholar] [CrossRef]
  11. Zhou, T.; Shi, P.; Wang, S. Impacts of climate change and human activities on soil carbon storage in China. Acta Geogr. Sin. 2003, 58, 727–734. [Google Scholar] [CrossRef]
  12. Lin, F.; Li, D.; Pan, G.; Xu, X.; Zhang, X.; Chi, C.; Li, Z. Organic carbon density of soil of wetland and its change after cultivation along the Yangtze River in Anhui Province, China. Wetl. Sci. 2008, 6, 192–197. [Google Scholar] [CrossRef]
  13. Gong, C.; Song, C.; Tan, W.; Zhang, J. Effects of marshland reclamation on soil microbial properties in the Sanjiang Plain, Northeast China. Ecol. Environ. Sci. 2015, 24, 972–977. [Google Scholar] [CrossRef]
  14. Tate, K.R.; Scott, N.A.; Ross, D.J.; Parshotam, A.; Claydon, J.J. Plant effects on soil carbon storage and turnover in a montane beech (Nothofagus) forest and adjacent tussock grassland in New Zealand. Aust. J. Soil Res. 2000, 38, 685–698. [Google Scholar] [CrossRef]
  15. Holmes, K.W.; Chadwick, O.A.; Kyriakidis, P.C.; de Filho, E.P.S.; Soares, J.V.; Roberts, D.A. Large-area spatially explicit estimates of tropical soil carbon stocks and response to land-cover change. Glob. Biogeochem. Cycles 2006, 20, Gb3004. [Google Scholar] [CrossRef]
  16. Pei, F.; Li, X.; Liu, X.; Wang, S.; He, Z. Assessing the differences in net primary productivity between pre- and post-urban land development in China. Agric. For. Meteorol. 2013, 171, 174–186. [Google Scholar] [CrossRef]
  17. Edmondson, J.L.; Davies, Z.G.; McHugh, N.; Gaston, K.J.; Leake, J.R. Organic carbon hidden in urban ecosystems. Sci. Rep. 2012, 2, 963. [Google Scholar] [CrossRef]
  18. Raciti, S.M.; Hutyra, L.R.; Finzi, A.C. Depleted soil carbon and nitrogen pools beneath impervious surfaces. Environ. Pollut. 2012, 164, 248–251. [Google Scholar] [CrossRef]
  19. Chen, H.; Wu, S.; Chen, D.; Zhou, S.; Li, B.; Shi, Y. Simulating effects of urban soil sealing on the soil organic carbon pool. Acta Ecol. Sin. 2017, 37, 2600–2610. [Google Scholar] [CrossRef]
  20. Post, W.M.; Kwon, K.C. Soil carbon sequestration and land-use change: Processes and potential. Glob. Change Biol. 2000, 6, 317–327. [Google Scholar] [CrossRef]
  21. Huang, J.; Song, C.; Song, Y.; Liu, D.; Wan, Z.; Liao, Y. Influence of freshwater marsh tillage on microbial biomass and dissolved organic carbon and nitrogen. Environ. Sci. 2008, 29, 1380–1387. [Google Scholar] [CrossRef]
  22. Poeplau, C.; Don, A. Sensitivity of soil organic carbon stocks and fractions to different land-use changes across Europe. Geoderma 2013, 192, 189–201. [Google Scholar] [CrossRef]
  23. Deng, L.; Kim, D.-G.; Peng, C.; Shangguan, Z. Controls of soil and aggregate-associated organic carbon variations following natural vegetation restoration on the Loess Plateau in China. Land Degrad. Dev. 2018, 29, 3974–3984. [Google Scholar] [CrossRef]
  24. Jiang, X.; Shen, W.; Bai, X. Response of net primary productivity to vegetation restoration in Chinese Loess Plateau during 1986–2015. PLoS ONE 2019, 14, e0219270. [Google Scholar] [CrossRef]
  25. Veldkamp, E.; Schmidt, M.; Powers, J.S.; Corre, M.D. Deforestation and reforestation impacts on soils in the tropics. Nat. Rev. Earth Environ. 2020, 1, 590–605. [Google Scholar] [CrossRef]
  26. Hong, S.; Yin, G.; Piao, S.; Dybzinski, R.; Cong, N.; Li, X.; Wang, K.; Peñuelas, J.; Zeng, H.; Chen, A. Divergent responses of soil organic carbon to afforestation. Nat. Sustain. 2020, 3, 694–700. [Google Scholar] [CrossRef]
  27. Pan, N.; Wang, S.; Liu, Y.; Hua, T.; Zhang, J.; Xue, F.; Fu, B. Quantifying responses of net primary productivity to agricultural expansion in drylands. Land Degrad. Dev. 2021, 32, 2050–2060. [Google Scholar] [CrossRef]
  28. Houghton, R.A.; Nassikas, A.A. Global and regional fluxes of carbon from land use and land cover change 1850–2015. Glob. Biogeochem. Cycles 2017, 31, 456–472. [Google Scholar] [CrossRef]
  29. Houghton, R.A.; Hackler, J.L. Sources and sinks of carbon from land-use change in China. Glob. Biogeochem. Cycles 2003, 17, 1034. [Google Scholar] [CrossRef]
  30. Lai, L.; Huang, X.; Yang, H.; Chuai, X.; Zhang, M.; Zhong, T.; Chen, Z.; Chen, Y.; Wang, X.; Thompson, J.R. Carbon emissions from land-use change and management in China between 1990 and 2010. Sci. Adv. 2016, 2, e1601063. [Google Scholar] [CrossRef]
  31. Zhang, X.; Mao, X.; Ke, K.; Huang, K. Carbon storage of land resources in regional land use conversion. China Popul. Resour. Environ. 2023, 33, 193–202. [Google Scholar] [CrossRef]
  32. Guo, X.; Chuai, X.; Zhang, M.; Liang, H.; Li, J.; Zuo, T. Spatio-temporal analysis of land-use change and the impact on terrestrial ecosystems carbon storage in Yangtze River city group. Resour. Environ. Yangtze Basin 2019, 28, 269–280. [Google Scholar] [CrossRef]
  33. Xu, Q.; Yang, R.; Dong, Y.; Liu, Y.; Qiu, L. The influence of rapid urbanization and land use changes on terrestrial carbon sources/sinks in Guangzhou, China. Ecol. Indic. 2016, 70, 304–316. [Google Scholar] [CrossRef]
  34. Zhang, M.; Lai, L.; Huang, X.; Chuai, X.; Tan, J. The carbon emission intensity of land use conversion in different regions of China. Resour. Sci. 2013, 35, 792–799. [Google Scholar]
  35. Zhu, E.; Deng, J.; Zhou, M.; Gan, M.; Jiang, R.; Wang, K.; Shahtahmassebi, A. Carbon emissions induced by land-use and land-cover change from 1970 to 2010 in Zhejiang, China. Sci. Total Environ. 2019, 646, 930–939. [Google Scholar] [CrossRef]
  36. Ge, Q.; Dai, J.; He, F.; Pan, Y.; Wang, M. Land use changes and their relations with carbon cycles over the past 300 a in China. Sci. China Ser. D Earth Sci. 2008, 51, 871–884. [Google Scholar] [CrossRef]
  37. Yang, X.; Jin, X.; Xiang, X.; Fan, Y.; Liu, J.; Shan, W.; Zhou, Y. Carbon emissions induced by farmland expansion in China during the past 300 years. Sci. China Earth Sci. 2019, 62, 423–437. [Google Scholar] [CrossRef]
  38. Yang, F.; He, F.; Li, S.; Li, M.; Wu, P. A new estimation of carbon emissions from land use and land cover change in China over the past 300 years. Sci. Total Environ. 2023, 863, 160963. [Google Scholar] [CrossRef]
  39. Angst, G.; Mueller, K.E.; Eissenstat, D.M.; Trumbore, S.; Freeman, K.H.; Hobbie, S.E.; Chorover, J.; Oleksyn, J.; Reich, P.B.; Mueller, C.W. Soil organic carbon stability in forests: Distinct effects of tree species identity and traits. Glob. Change Biol. 2019, 25, 1529–1546. [Google Scholar] [CrossRef]
  40. Zak, D.R.; Freedman, Z.B.; Upchurch, R.A.; Steffens, M.; Koegel-Knabner, I. Anthropogenic N deposition increases soil organic matteraccumulation without altering its biochemical composition. Glob. Change Biol. 2017, 23, 933–944. [Google Scholar] [CrossRef]
  41. Ekschmitt, K.; Kandeler, E.; Poll, C.; Brune, A.; Buscot, F.; Friedrich, M.; Gleixner, G.; Hartmann, A.; Kastner, M.; Marhan, S.; et al. Soil-carbon preservation through habitat constraints and biological limitations on decomposer activity. J. Plant Nutr. Soil Sci. 2008, 171, 27–35. [Google Scholar] [CrossRef]
  42. Lee, S.B.; Lee, C.H.; Jung, K.Y.; Do Park, K.; Lee, D.; Kim, P.J. Changes of soil organic carbon and its fractions in relation to soil physical properties in a long-term fertilized paddy. Soil Tillage Res. 2009, 104, 227–232. [Google Scholar] [CrossRef]
  43. Morugan-Coronado, A.; Garcia-Orenes, F.; Mataix-Solera, J.; Arcenegui, V.; Mataix-Beneyto, J. Short-term effects of treated wastewater irrigation on Mediterranean calcareous soil. Soil Tillage Res. 2011, 112, 18–26. [Google Scholar] [CrossRef]
  44. Chuai, X.; Huang, X.; Wang, W.; Zhao, R.; Zhang, M.; Wu, C. Land use, total carbon emission’s change and low carbon land management in Coastal Jiangsu, China. J. Clean. Prod. 2015, 103, 77–86. [Google Scholar] [CrossRef]
  45. Rong, T.; Zhang, P.; Zhu, H.; Jiang, L.; Li, Y.; Liu, Z. Spatial correlation evolution and prediction scenario of land use carbon emissions in China. Ecol. Inform. 2022, 71, 101802. [Google Scholar] [CrossRef]
  46. Xia, C.; Zhang, J.; Zhao, J.; Xue, F.; Li, Q.; Fang, K.; Shao, Z.; Li, S.; Zhou, J. Exploring potential of urban land-use management on carbon emissions-- A case of Hangzhou, China. Ecol. Indic. 2023, 146, 109902. [Google Scholar] [CrossRef]
  47. Zhang, M.; Chen, Y.; Zhou, H. Study on the relationship of the level of land intensive use and land use carbon emission based on panel data-- A case study of central cities in Hubei Province from 1996 to 2010. Resour. Environ. Yangtze Basin 2015, 24, 1464–1470. [Google Scholar] [CrossRef]
  48. Zhou, J.; Zhao, H.; Wu, J. Study on relationship and evolution characteristics of intensive land-use and carbon emission of Guanzhong urban agglomeration. China Land Sci. 2017, 31, 55–61. [Google Scholar] [CrossRef]
  49. Sun, H.; Liang, H.; Chang, X.; Cui, Q.; Tao, Y. Land use patterns on carbon emission and spatial association in China. Econ. Geogr. 2015, 35, 154–162. [Google Scholar] [CrossRef]
  50. Yang, J.; Zhang, M.; Duo, L.; Xiao, S.; Zhao, Y. Spatial pattern of land use carbon emissions and carbon balance zoning in Jiangxi Province. Res. Environ. Sci. 2022, 35, 2312–2321. [Google Scholar] [CrossRef]
  51. Guo, A.; Niu, L.; Liu, P.; Li, Y. Carbon emission from land use in urban agglomeration of the Yellow River Basin. Econ. Geogr. 2023, 43, 172–178. [Google Scholar] [CrossRef]
  52. Zhang, C.; Zhao, L.; Zhang, H.; Chen, M.; Fang, R.; Yao, Y.; Zhang, Q.; Wang, Q. Spatial-temporal characteristics of carbon emissions from land use change in Yellow River Delta region, China. Ecol. Indic. 2022, 136, 108623. [Google Scholar] [CrossRef]
  53. Zhang, J.; Zhang, A.; Dong, J. Carbon emission effect of land use and influencing factors decomposition of carbon emission in Wuhan urban agglomeration. Resour. Environ. Yangtze Basin 2014, 23, 595–602. [Google Scholar] [CrossRef]
  54. Ke, Y.; Xia, L.; Huang, Y.; Li, S.; Zhang, Y.; Liang, S.; Yang, Z. The carbon emissions related to the land-use changes from 2000 to 2015 in Shenzhen, China: Implication for exploring low-carbon development in megacities. J. Environ. Manag. 2022, 319, 115660. [Google Scholar] [CrossRef]
  55. Zhang, Y.; Chen, F.; Xu, X.; Xie, T.; Wu, B.; Wang, Y. Investigation on county-scale carbon emission effect of land use in Fujian Province. Res. Environ. Sci. 2023, 36, 1446–1456. [Google Scholar] [CrossRef]
  56. E, S.; Li, Q.; Zhang, L. Land use carbon emission pattern and carbon compensation in Three Gorges reservoir area During 1980–2021. Bull. Soil Water Conserv. 2023, 43, 300–306. [Google Scholar] [CrossRef]
  57. Lwasa, S.; Seto, K.C.; Bai, X.; Blanco, H.; Gurney, K.R.; Kılkış, Ş.; Lucon, O.; Murakami, J.; Pan, J.; Sharifi, A.; et al. Urban Systems and Other Settlements. In Climate Change 2022: Mitigation of Climate Change, Contribution of Working Group III to the Sixth Assessment Report of the Intergovernmental Panel on Climate Change; IPCC, Ed.; Cambridge University Press: Cambridge, UK, 2022; pp. 896–897. [Google Scholar]
  58. Lyu, B.; Liu, J. Toward low-carbon urban spatial growth. Urban Plann. Forum 2011, 55, 33–38. [Google Scholar] [CrossRef]
  59. Veneri, P.; Burgalassi, D. Questioning polycentric development and its effects. issues of definition and measurement for the Italian NUTS-2 regions. Eur. Plan. Stud. 2012, 20, 1017–1037. [Google Scholar] [CrossRef]
  60. Burgalassi, D.; Luzzati, T. Urban spatial structure and environmental emissions: A survey of the literature and some empirical evidence for Italian NUTS 3 regions. Cities 2015, 49, 134–148. [Google Scholar] [CrossRef]
  61. Lee, S.; Lee, B. The influence of urban form on GHG emissions in the US household sector. Energy Policy 2014, 68, 534–549. [Google Scholar] [CrossRef]
  62. Li, P.; Zhao, P.; Brand, C. Future energy use and CO2 emissions of urban passenger transport in China: A travel behavior and urban form based approach. Appl. Energy 2018, 211, 820–842. [Google Scholar] [CrossRef]
  63. Sun, B.; Han, S.; Li, W. Effects of the polycentric spatial structures of Chinese city regions on CO2 concentrations. Transp. Res. Part D Transp. Environ. 2020, 82, 102333. [Google Scholar] [CrossRef]
  64. Han, S.; Miao, C.; Li, Y. Effects of urban polycentric spatial structure on carbon emissions in the Yellow River Basin. Geogr. Res. 2023, 42, 936–954. [Google Scholar] [CrossRef]
  65. Fang, C.; Wang, S.; Li, G. Changing urban forms and carbon dioxide emissions in China: A case study of 30 provincial capital cities. Appl. Energy 2015, 158, 519–531. [Google Scholar] [CrossRef]
  66. Zhang, R.; Matsushima, K.; Kobayashi, K. Can land use planning help mitigate transport-related carbon emissions? A case of Changzhou. Land Use Policy 2018, 74, 32–40. [Google Scholar] [CrossRef]
  67. Falahatkar, S.; Rezaei, F. Towards low carbon cities: Spatio-temporal dynamics of urban form and carbon dioxide emissions. Remote Sens. Appl. Soc. Environ. 2020, 18, 100317. [Google Scholar] [CrossRef]
  68. Shi, K.; Xu, T.; Li, Y.; Chen, Z.; Gong, W.; Wu, J.; Yu, B. Effects of urban forms on CO2 emissions in China from a multi-perspective analysis. J. Environ. Manag. 2020, 262, 110300. [Google Scholar] [CrossRef]
  69. Zheng, S.; Huang, Y.; Sun, Y. Effects of urban form on carbon emissions in China: Implications for low-carbon urban planning. Land 2022, 11, 1343. [Google Scholar] [CrossRef]
  70. Cervero, R.; Kockelman, K. Travel demand and the 3Ds: Density, diversity, and design. Transp. Res. Part D Transp. Environ. 1997, 2, 199–219. [Google Scholar] [CrossRef]
  71. Ewing, R.; Cervero, R. Travel and the built environment. J. Am. Plan. Assoc. 2010, 76, 265–294. [Google Scholar] [CrossRef]
  72. Grazi, F.; van den Bergh, J.; van Ommeren, J.N. An empirical analysis of urban form, transport, and global warming. Energy J. 2008, 29, 97–122. [Google Scholar] [CrossRef]
  73. Clark, T.A. Metropolitan density, energy efficiency and carbon emissions: Multi-attribute tradeoffs and their policy implications. Energy Policy 2013, 53, 413–428. [Google Scholar] [CrossRef]
  74. Cervero, R.; Murakami, J. Effects of built environments on vehicle miles traveled: Evidence from 370 US urbanized areas. Environ. Plann. A Econ. Space 2010, 42, 400–418. [Google Scholar] [CrossRef]
  75. Cervero, R. Mixed land-uses and commuting: Evidence from the American housing survey. Transp. Res. Part A Policy Pract. 1996, 30, 361–377. [Google Scholar] [CrossRef]
  76. Huang, J.; Du, N.; Liu, P.; Han, S. An exploration of land use mix around residence and family commuting caused carbon emission: A case study of Wuhan City in China. Urban Plan. Int. 2013, 28, 25–30. [Google Scholar]
  77. Tong, K.; Ma, K. Significant impact of job-housing distance on carbon emissions from transport: A scenario analysis. Acta Ecol. Sin. 2012, 32, 2975–2984. [Google Scholar] [CrossRef]
  78. Hong, J.; Goodchild, A. Land use policies and transport emissions: Modeling the impact of trip speed, vehicle characteristics and residential location. Transp. Res. Part D Transp. Environ. 2014, 26, 47–51. [Google Scholar] [CrossRef]
  79. Li, T.; Wu, J.; Dang, A.; Liao, L.; Xu, M. Emission pattern mining based on taxi trajectory data in Beijing. J. Clean. Prod. 2019, 206, 688–700. [Google Scholar] [CrossRef]
  80. Chai, Y.; Xiao, Z.; Liu, Z. Low-carbon optimization strategies based on CO2 emission mechanism of household daily travels: A case study of Beijing. Geogr. Res. 2012, 31, 334–344. [Google Scholar] [CrossRef]
  81. Cao, X.; Mokhtarian, P.L.; Handy, S.L. The relationship between the built environment and nonwork travel: A case study of Northern California. Transp. Res. Part A Policy Pract. 2009, 43, 548–559. [Google Scholar] [CrossRef]
  82. Kaza, N. Understanding the spectrum of residential energy consumption: A quantile regression approach. Energy Policy 2010, 38, 6574–6585. [Google Scholar] [CrossRef]
  83. Wu, W.; Song, Y.; Hong, Z.; Lu, Y. Research of the influence of community form on residential energy consumption: A case study on Ningbo City. Urban Dev. Stud. 2018, 25, 15–20. [Google Scholar] [CrossRef]
  84. Yuan, Q.; Zhao, Y.; Leng, H. Energy consumption simulation of small town residential blocks from the perspective of typo-morphology. J. Harbin Inst. Technol. 2021, 53, 122–131. [Google Scholar] [CrossRef]
  85. van Minnen, J.G.; Strengers, B.J.; Eickhout, B.; Swart, R.J.; Leemans, R. Quantifying the effectiveness of climate change mitigation through forest plantations and carbon sequestration with an integrated land-use model. Carbon Balance Manag. 2008, 3, 3. [Google Scholar] [CrossRef]
  86. Thomson, A.M.; Izaurralde, R.C.; Smith, S.J.; Clarke, L.E. Integrated estimates of global terrestrial carbon sequestration. Glob. Environ. Change 2008, 18, 192–203. [Google Scholar] [CrossRef]
  87. Boysen, L.R.; Lucht, W.; Gerten, D. Trade-offs for food production, nature conservation and climate limit the terrestrial carbon dioxide removal potential. Glob. Change Biol. 2017, 23, 4303–4317. [Google Scholar] [CrossRef]
  88. Zhang, X.; Xu, D. Potential carbon sequestration in China’s forests. Environ. Sci. Policy 2003, 6, 421–432. [Google Scholar] [CrossRef]
  89. Bao, H.; Zhang, Y.; Wu, S. Low-carbon territorial space planning: Mechanism, approach and path. China Land Sci. 2022, 36, 1–10. [Google Scholar] [CrossRef]
  90. Chuai, X.; Huang, X.; Lai, L.; Wang, W.; Peng, J.; Zhao, R. Land use structure optimization based on carbon storage in several regional terrestrial ecosystems across China. Environ. Sci. Policy 2013, 25, 50–61. [Google Scholar] [CrossRef]
  91. Huang, X.; Zhang, X.; Lu, X.; Wang, P.; Qin, J.; Jiang, Y.; Liu, Z.; Wang, Z.; Zhu, A. Land development and utilization for carbon neutralization. J. Nat. Resour. 2021, 36, 2995–3006. [Google Scholar] [CrossRef]
  92. Chang, M.; Zeng, C.; Xie, P.; Liu, S. Land use simulation and characteristic analysis in multiple scenarios: A case study in Wuhan. J. Huazhong Agric. Univ. 2023, 42, 74–85. [Google Scholar] [CrossRef]
  93. You, H.; Zhang, J.; Xia, S. Structure and layout optimization of multi-objective land use based on carbon emission efficiency: A case study of Xiaoshan District in Hangzhou City. China Land Sci. 2023, 37, 74–83. [Google Scholar] [CrossRef]
  94. Yu, G.; Zhu, J.; Xu, L.; He, N. Technological approaches to enhance ecosystem carbon sink in China: Nature-based solutions. Bull. Chin. Acad. Sci. 2022, 37, 490–501. [Google Scholar] [CrossRef]
  95. Sun, T.; Ma, Z.; Huang, Z.; Wang, Z.; Chen, S.; Xiao, Y.; Xie, C.; Yue, C.; Jia, F.; Zhang, Q. Coastal ecosystem restoration strategy based on carbon storage change: A case study of the southeast coastal zone of Hainan Island. Trop. Geogr. 2023, 43, 443–458. [Google Scholar] [CrossRef]
  96. Zhang, B.; Li, L.; Xia, Q.; Dong, J. Land use change and its impact on carbon storage under the constraints of “three lines”: A case study of Wuhan City circle. Acta Ecol. Sin. 2022, 42, 2265–2280. [Google Scholar] [CrossRef]
  97. Li, L.; Huang, X.; Yang, H. Optimizing land use patterns to improve the contribution of land use planning to carbon neutrality target. Land Use Policy 2023, 135, 106959. [Google Scholar] [CrossRef]
  98. Cervero, R.; Day, J. Suburbanization and transit-oriented development in China. Transp. Policy 2008, 15, 315–323. [Google Scholar] [CrossRef]
  99. Pan, H.; Tang, Y.; Wu, J.; Lyu, Y.; Zhang, Y. Spatial planning strategy for “low carbon cities” in China. Urban Plann. Forum 2008, 52, 57–64. [Google Scholar] [CrossRef]
  100. Wright, L.; Fulton, L. Climate change mitigation and transport in developing nations. Transp. Rev. 2005, 25, 691–717. [Google Scholar] [CrossRef]
  101. Penazzi, S.; Accorsi, R.; Manzini, R. Planning low carbon urban-rural ecosystems: An integrated transport land-use model. J. Clean. Prod. 2019, 235, 96–111. [Google Scholar] [CrossRef]
  102. Zheng, D.; Wu, H.; Lin, C.; Weng, T. The formulation of urban carbon reduction unit and integrated planning methodology based on carbon accounting. Urban Plann. Forum 2021, 65, 43–50. [Google Scholar] [CrossRef]
  103. Compagnon, R. Solar and daylight availability in the urban fabric. Energy Build. 2004, 36, 321–328. [Google Scholar] [CrossRef]
  104. Hachem, C.; Athienitis, A.; Fazio, P. Investigation of solar potential of housing units in different neighborhood designs. Energy Build. 2011, 43, 2262–2273. [Google Scholar] [CrossRef]
  105. Oda, T.; Maksyutov, S. A very high-resolution (1 km × 1 km) global fossil fuel CO2 emission inventory derived using a point source database and satellite observations of nighttime lights. Atmos. Chem. Phys. 2011, 11, 543–556. [Google Scholar] [CrossRef]
  106. Gurney, K.R.; Mendoza, D.L.; Zhou, Y.; Fischer, M.L.; Miller, C.C.; Geethakumar, S.; Du Can, S.D. High resolution fossil fuel combustion CO2 emission fluxes for the United States. Environ. Sci. Technol. 2009, 43, 5535–5541. [Google Scholar] [CrossRef]
  107. Wang, J.; Cai, B.; Zhang, L.; Cao, D.; Liu, L.; Zhou, Y.; Zhang, Z.; Xue, W. High resolution carbon dioxide emission gridded data for China derived from point sources. Environ. Sci. Technol. 2014, 48, 7085–7093. [Google Scholar] [CrossRef]
  108. Cai, B.; Liang, S.; Zhou, J.; Wang, J.; Cao, L.; Qu, S.; Xu, M.; Yang, Z. China high resolution emission database (CHRED) with point emission sources, gridded emission data, and supplementary socioeconomic data. Resour. Conserv. Recycl. 2018, 129, 232–239. [Google Scholar] [CrossRef]
  109. Zhao, R.; Huang, X. Carbon emission and carbon footprint of different land use types based on energy consumption of Jiangsu Province. Geogr. Res. 2010, 29, 1639–1649. [Google Scholar] [CrossRef]
  110. Jiang, Y.; He, Y.; Mao, Q.; Chen, S.; He, D. City-level greenhouse gas emission inventory from a spatial planning perspective. City Plann. Rev. 2013, 37, 50–56. [Google Scholar]
  111. Wang, Y.; He, Y. Methods for low-carbon city planning based on carbon emission inventory. China Popul. Resour. Environ. 2015, 25, 72–80. [Google Scholar] [CrossRef]
  112. Xu, Y.; Li, T.; Xu, L. Greenhouse gas inventory model for territorial spatial master plans. Clim. Change Res. 2022, 18, 355–365. [Google Scholar] [CrossRef]
  113. Shan, Y.; Guan, D.; Liu, J.; Mi, Z.; Liu, Z.; Liu, J.; Schroeder, H.; Cai, B.; Chen, Y.; Shao, S.; et al. Methodology and applications of city level CO2 emission accounts in China. J. Clean. Prod. 2017, 161, 1215–1225. [Google Scholar] [CrossRef]
  114. Jing, Q.; Bai, H.; Luo, W.; Cai, B.; Xu, H. A top-bottom method for city-scale energy-related CO2 emissions estimation: A case study of 41 Chinese cities. J. Clean. Prod. 2018, 202, 444–455. [Google Scholar] [CrossRef]
  115. Doll, C.N.H.; Muller, J.P.; Elvidge, C.D. Night-time imagery as a tool for global mapping of socioeconomic parameters and greenhouse gas emissions. AMBIO 2000, 29, 157–162. [Google Scholar] [CrossRef]
  116. Raupach, M.R.; Rayner, P.J.; Paget, M. Regional variations in spatial structure of nightlights, population density and fossil-fuel CO2 emissions. Energy Policy 2010, 38, 4756–4764. [Google Scholar] [CrossRef]
  117. Chen, J.; Gao, M.; Cheng, S.; Hou, W.; Song, M.; Liu, X.; Liu, Y.; Shan, Y. County-level CO2 emissions and sequestration in China during 1997–2017. Sci. Data 2020, 7, 391. [Google Scholar] [CrossRef]
  118. Li, Y.; Yao, S.; Jiang, H.; Wang, H.; Ran, Q.; Gao, X.; Ding, X.; Ge, D. Spatial-temporal evolution and prediction of carbon storage: An integrated framework based on the MOP-PLUS-InVEST model and an applied case study in Hangzhou, east China. Land 2022, 11, 2213. [Google Scholar] [CrossRef]
  119. Nel, L.; Boeni, A.F.; Prohaszka, V.J.; Szilagyi, A.; Kovacs, E.T.; Pasztor, L.; Centeri, C. InVEST soil carbon stock modelling of agricultural landscapes as an ecosystem service indicator. Sustainability 2022, 14, 9808. [Google Scholar] [CrossRef]
  120. Wang, R.-Y.; Mo, X.; Ji, H.; Zhu, Z.; Wang, Y.-S.; Bao, Z.; Li, T. Comparison of the CASA and InVEST models’ effects for estimating spatiotemporal differences in carbon storage of green spaces in megacities. Sci. Rep. 2024, 14, 5456. [Google Scholar] [CrossRef]
  121. Wang, L.; Liu, D.; Wu, X.; Zhang, X.; Liu, Q.; Kong, W.; Luo, P.; Yang, S. Simulation analysis of land use change via the PLUS-GMOP coupling model. Land 2025, 14, 802. [Google Scholar] [CrossRef]
  122. Xu, L.; Liu, X.; Tong, D.; Liu, Z.; Yin, L.; Zheng, W. Forecasting urban land use change based on cellular automata and the PLUS model. Land 2022, 11, 652. [Google Scholar] [CrossRef]
  123. Piao, S.; Yue, C.; Ding, J.; Guo, Z. Perspectives on the role of terrestrial ecosystems in the ‘carbon neutrality’ strategy. Sci. China Earth Sci. 2022, 65, 1178–1186. [Google Scholar] [CrossRef]
  124. Houghton, R.A.; Byers, B.; Nassikas, A.K. A role for tropical forests in stabilizing atmospheric CO2. Nat. Clim. Change 2015, 5, 1022–1023. [Google Scholar] [CrossRef]
  125. Leng, H.; Zhao, Y.; Yuan, Q. The path toward carbon reduction through urban form control. Urban Plann. Forum 2023, 67, 54–61. [Google Scholar] [CrossRef]
Figure 1. The number of global publications on land use carbon emissions and low-carbon spatial planning from 2000 to 2024.
Land 14 01406 g001
Figure 2. Network map of articles by country.
Land 14 01406 g002
Figure 3. Keywords hotspot map.
Land 14 01406 g003
Figure 4. Keyword clustering map.
Land 14 01406 g004
Figure 5. The correspondence between key topics and research methods.
Land 14 01406 g005
Figure 6. Three routes to correlate carbon emissions to land: (a) upscale route – correlation by geographic coordinates; (b) homoscale route – direct linkage based on activity locations; (c) downscale route – allocation through regional activity levels.
Land 14 01406 g006
Table 1. Summary of the 16 clusters.
IDClustering LabelSizeSilhouette ScoreMean(Cite Year)
0land use change300.9342012
1soil carbon250.9012007
2built environment240.9112014
3land-use change240.9822012
4carbon emission180.9492019
5land use170.9482006
6stocks170.972013
7random forest170.9342020
8greenhouse gas emissions160.8422011
9carbon sequestration150.9112010
10carbon metabolism140.8982016
11patterns130.8882013
12carbon storage912015
13greenhouse gases90.9332012
14terrestrial ecosystems612009
15organic carbon40.9872000
Disclaimer/Publisher’s Note: The statements, opinions and data contained in all publications are solely those of the individual author(s) and contributor(s) and not of MDPI and/or the editor(s). MDPI and/or the editor(s) disclaim responsibility for any injury to people or property resulting from any ideas, methods, instructions or products referred to in the content.

