Abstract
Citizen science data are easily accessible, which has led to their wide use for scientific data collection such as mapping invasive plant species. However, the crowd-sourced nature of citizen science data has led to criticism over the quality of the data owing to the fragmented spatial distribution of the data collection points. Despite inherent limitations, an increasing collection of research indicates that, when appropriately corrected for data quality issues, the data collected by volunteers can serve as a reliable source for identifying and analysing biodiversity patterns. Prior to utilising citizen science data, it is essential to identify its inherent flaws and limitations to develop appropriate strategies for its effective application. One viable approach to validating such data is to compare it with datasets collected by experts, particularly in urban areas where volunteer participation is high. In our comparative analyses, we evaluated the usability of citizen science data (Global Biodiversity Information Facility (GBIF)) for mapping the occurrence density of five invasive plant species (Ailanthus altissima, Asclepias syriaca, Elaeagnus angustifolia, Robinia pseudoacacia, and Solidago spp.) in urban cores and fringes in Hungary by comparison to maps obtained from spatially homogeneous data (EUROSTAT Land Use and Coverage Area Frame Survey (LUCAS)) collected by experts. The results showed that the volunteers collected valuable data on Ailanthus altissima, which is specific to urban areas, but they underestimated Robinia pseudoacacia, which is often planted for economic benefits. In addition, the volunteers collected much more data closer to urban cores. These results suggest that citizen science data may be suitable for mapping urbanophilic species in urban environments. Our research contributes to the assessment and scientific applicability of volunteer-collected data for mapping the distribution of invasive plant species.
1. Introduction
Biological invasion is a worldwide natural hazard, being the second most serious conservation problem after the loss of natural habitats [1,2,3,4,5,6,7]. The financial costs associated with biological invasions are so extremely high that they equal or exceed those of natural disasters [8,9]. In addition, invasive plant species negatively affect human health [2,5,10] and cause serious economic damage such as crop losses [11] and flood risk [12]. Invasive plant species generally colonise in places that are subject to some kind of disturbance, freeing up an empty niche for them to fill [13]. They can also be seen as indicators of disturbed habitats.
It is often claimed that urban areas have limited ecological value. For example, the densely built-up urban core has extreme environmental conditions such as urban heat islands that do not support the survival of sensitive native species. Such areas only contain generalist urbanophilic species with a wide ecological spectrum that can make efficient use of limited resources [14,15]. However, urban areas can be very diverse in structure, have a wide range of ecosystems, and can be home to many native and endangered species [16,17,18,19,20].
The presence of invasive plant species in cities is also significant; even urban and suburban areas can be hotspots for the spread of invasive species because they are often disturbed by construction sites, and they are hubs for transport and freight forwarding routes [21]. In addition, the initial establishment and long-term survival of some invasive plant species are greatly facilitated by their planting as ornamentals [21]. Propagules can spread from cities along roads by clinging to roadside windbreaks or mud on car tyres [22,23] into natural ecosystems [24,25]. Here, invasive plants can easily appear around construction sites, which are subjected to extreme environmental conditions, pollution, and intensive disturbances that are more successfully tolerated by weeds and invasive plants than by native species. Thus, the protection of native species and the control of invasive species in cities and suburban areas are of paramount importance [13].
Citizen science involves the crowd-sourced collection of data by volunteers, and this approach has been gaining importance around the world [25,26,27]. Citizen science data can be very diverse, whether in terms of data origin, data collection process, spatial extent of occurrence, or usability in scientific research. Citizen science datasets may originate from diverse sources; non-exhaustive examples include the extraction of images from social media platforms (e.g., Flickr) [28,29], the mobilisation of volunteers for data collection, and the acquisition of comprehensive databases. Several authors identify Community-Based Monitoring (CBM) as a subset of citizen science data, in which volunteers not only engage in data collection but also contribute actively to the design of monitoring programmes, the interpretation of collected data, and the implementation of management interventions based on the monitoring results [30,31]. Several studies have demonstrated that the use of citizen science data for scientific purposes can be very valuable, including its use in research on species conservation [32,33,34,35]. The early detection of invasive species can play a key role in management, as it provides the opportunity for early response and rapid population control [35,36]. Early detection is often performed by civil volunteers rather than by professionals [35]. In addition, citizen science data often provide the only way to achieve the desired geographical coverage [32] and also reduce costs significantly [35]. The investigation of occurrence patterns at a landscape scale (such as across an entire country) requires the use of occurrence databases, as direct field sampling is often unfeasible. This limitation arises not only from financial constraints but also from practical considerations; for instance, it is typically not feasible for a small team of researchers to survey an entire national territory within a single growing season.
The usefulness of citizen science data for mapping species occurrence is influenced by a range of factors [37]. These include the difficulty of species identification [37,38], the accessibility of habitats to volunteers [39], the commitment and expertise of participating individuals [40], and the design of the project [38]. Much research has been devoted to optimising the design of citizen science initiatives and improving the quality of volunteer-collected data to ensure its suitability for scientific research [37,38]. Common approaches include providing targeted training for volunteers [37,38,41,42], implementing measures to avoid duplicate records, selecting appropriate sampling areas, and validating volunteer data against expert-collected datasets [43]. However, such validation is typically conducted within the framework of researcher-led, pre-designed projects, with tasks assigned to volunteers. In contrast, relatively little attention has been paid to assessing the agreement between data submitted to global citizen science databases and expert datasets across large spatial scales.
The Global Biodiversity Information Facility (GBIF; www.gbif.org) is one of the most prominent citizen science databases providing open access to biodiversity data. However, several studies have criticised the GBIF for its data quality [44,45,46]. The main problems with these data are the fragmented spatial distribution and the spatial bias [47]. Because more data are collected in larger cities, the distribution of the observed occurrences does not accurately represent the actual spatial distribution of invasive plant species and may be spatially biased in favour of more densely populated areas [48,49,50]. To minimise spatial bias, species distribution models are commonly employed to quantitatively estimate species distributions by relating the occurrence data to environmental variables (SDMs) [51,52,53,54].
In this study, we investigated the occurrence of five common invasive plants (Ailanthus altissima, Asclepias syriaca, Elaeagnus angustifolia, Robinia pseudoacacia, Solidago spp.) in the urban cores and fringes of 19 cities in Hungary. As volunteers tend to collect data in proximity to their place of residence, resulting in a higher data point density in urban areas, it can be assumed that raw citizen science data may be suitable for occurrence studies, particularly in the case of invasive species associated with urban environments. We compared the occurrence distributions of invasive plants obtained from fragmented raw citizen science data (Global biodiversity Information Facility (GBIF)) with those obtained from spatially homogeneous data collected by experts (i.e., EUROSTAT Land Use and Coverage Field Survey (LUCAS)). The objective was to address the following questions:
- To what extent do the occurrence data of invasive plants in urban and suburban areas differ when obtained from spatially fragmented citizen science data (GBIF) and from spatially homogeneous expert-collected data (LUCAS)?
- For which plant species and within which study areas can citizen science data be effectively utilised to investigate species occurrence?
- What are the limitations of citizen science data in investigating the occurrence of invasive plant species commonly found in Hungary, as compared with data collected by experts?
This analysis provides a unique opportunity to draw conclusions about the limitations of citizen science data without taking into account spatial bias and their usability in invasion biology research. We provide insights into which invasive plant species are preferentially recorded by volunteers working in and around urban areas. This is particularly relevant given that GBIF data are not collected within a defined sampling framework and lack a preplanned design. Building on the foundations of our research, the data collected by volunteers can be validated through comparison with expert-generated datasets, thereby enabling an assessment of their suitability for scientific applications in studies concerning the occurrence of invasive plant species.
2. Materials and Methods
2.1. Study Area
In this study, we focused on Hungarian cities with a population of more than 50,000 inhabitants and their urban fringes. Hungary is in Central Europe in the forest–steppe area of the Pannonian biogeographical region. It has a humid continental climate with an average annual temperature of 10.5 °C and an average annual precipitation of 550 mm [55]. The lowland regions of the Carpathian Basin are characterised by highly fertile chernozem soils being particularly dominant. The dominant land use type is arable land, while approximately 20% of the territory is forested areas. Black locust plantations, established primarily for their economic benefits, constitute a significant proportion of Hungary’s total area, accounting for approximately 5%. The effects of climate change are increasingly manifesting in the form of more frequent extreme weather events and an elevated risk of summer droughts. Furthermore, biological invasions have caused significant degradation of natural and semi-natural habitats, with 13.1% of these areas currently invaded by alien species [2].
2.2. Land Use and Land Cover Data
Urban Atlas is a database containing statistical and spatial data on land use and land cover (LULC) that was set up by the European Environment Agency to provide land use and population data for 788 European cities. The database has a minimum mapping unit of 0.25 ha and provides spatial data for 19 cities in Hungary (Békéscsaba, Budapest, Debrecen, Dunaújváros, Eger, Győr, Kaposvár, Kecskemét, Miskolc, Nyíregyháza, Pécs, Sopron, Szeged, Székesfehérvár, Szolnok, Szombathely, Tatabánya, Veszprém, Zalaegerszeg). Table 1 presents the LULC categories of the cities investigated in this study. The LULC categories were used to investigate the pressure from invasive plant species in the urban cores and fringes. As shown in Figure 1, the urban fringes were divided into three buffer zones with different radii: near (0–500 m), medium (500–1000 m), and far (1000–1500 m) from the urban core (built-up areas). The radius of the buffer zone was determined based on previous research [56,57,58]. The buffer zones were plotted around the aggregated LULC polygons of the urban cores created by using the software ArcGIS 10.7.

Table 1.
Core urban areas identified by the aggregation of LULC categories (Urban Atlas 2018).
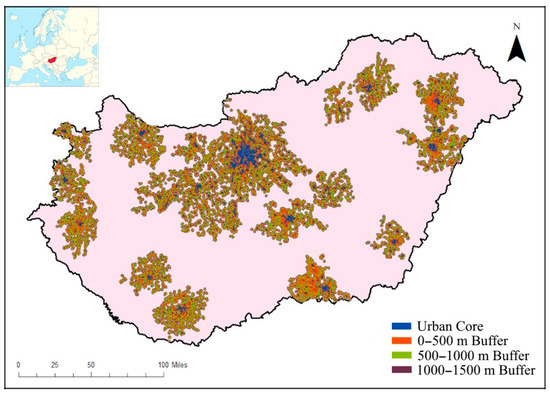
Figure 1.
Study area comprising the urban cores and fringes (divided into near (0–500 m), medium (500–1000 m), and far (1000–1500 m) buffer zones) of Hungarian cities (Urban Atlas 2018).
2.3. LUCAS-Based Data of the Investigated Plant Species
The EUROSTAT Land Use and Coverage Area Frame Survey (LUCAS) is a digital image database containing LULC data for the member states of the European Union. Data are collected over five years (2009, 2012, 2015, 2018, and 2022) during the vegetation period, when field photographs are taken along the four cardinal points at preselected geolocations with a homogeneous distribution. For the 2022 survey, it was introduced that not only the four cardinal points and the point of the survey were photographed but also the crop. This brings the total number of photos available for the 2022 survey to six. The advantages of LUCAS are that the sampling sites have a homogenous spatial distribution with an average grid spacing of 3 km, and the data are collected through a field survey based on uniform principles. In addition, LUCAS provides information not only on the presence of invasive species but also on their absence. Invasive plant species were identified by a trained biologist through the visual interpretation of LUCAS field photographs. In cases in which an invasive species was visually detected at a given point, that point was defined as invaded, as shown in Figure 2A. After the visual interpretation of more than 100,000 geotagged photographs of Hungary from LUCAS, we compiled the National GIS Database of Invasive Plant Species (INOTA), which included occurrence data on the five invasive plant species considered in this study: the tree of heaven (Ailanthus altissima), common milkweed (Asclepias syriaca), Russian olive (Elaeagnus angustifolia), black locust (Robinia pseudoacacia), and goldenrods (Solidago canadensis, Solidago gigantea). Although derived from a secondary source, the database was created through our own processing, validation, and structuring. At the time of data analysis, the INOTA database did not include the LUCAS data for 2022, so our present research only covers the LUCAS data for 2009, 2012, 2015, and 2018, spanning four years. The plant species studied in the research are currently the most aggressively spreading invasive species in Hungary, and their damage and environmental role is the most significant. These species are widely distributed across the country, occupying a broad range of habitat types and covering extensive areas. In addition, at all stages of their life cycle, they have physical properties that allow them to be recognised from landscape photographs with high efficiency by visual interpretation. Such physical characteristics include the pattern of the trunk, the colour and shape of the leaves and flowers, and the appearance of the species in the landscape.
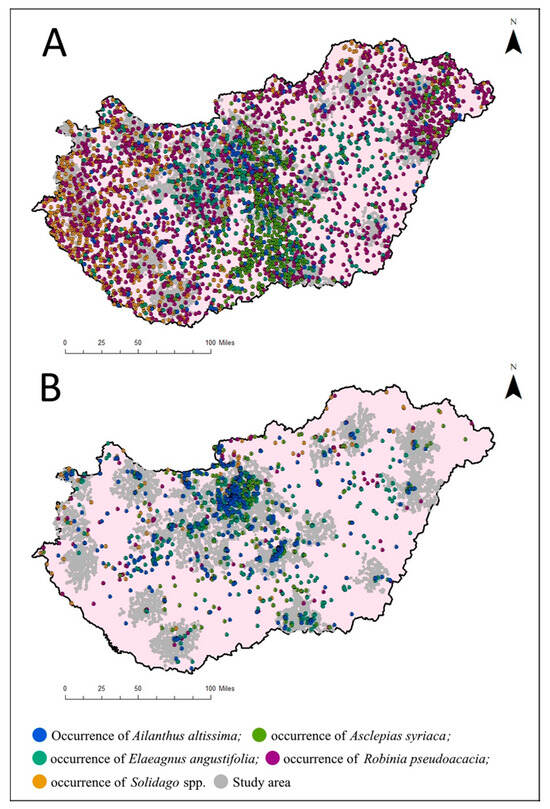
Figure 2.
Occurrence data of the invasive plant species considered in this study obtained from two data sources: (A) LUCAS and (B) GBIF.
2.4. Citizen Science-Based Data of the Investigated Plant Species
The Global Biodiversity Information Facility (GBIF) is a crowd-sourced, open-access database that provides worldwide information on the occurrence of plant and animal species. The origin of occurrence data can be very diverse. The data used in this study were only data from iNaturalist, collected by volunteers via the Plant.net web interface or mobile application. For the five invasive plant species we investigated, only these data were available for the territory of Hungary. The reliability of the occurrence data that we download is very high, because once uploaded, they can only be added to the database if they have been validated by volunteers from the Plant.net community and by artificial intelligence. The artificial intelligence-based image recognition algorithm that validates the data is under continuous development with the assistance of new inputs and volunteers. The advantages of GBIF are that it is free of charge and easily accessible, and it provides information on the presence of many plant and animal species. However, the disadvantages include that the data points are spatially fragmented, so the obtained occurrence distribution of a species may differ from that in reality. In addition, a large part of the data are not collected by professionals, and only information on the presence of species is provided not on their absence [59]. In this study, we downloaded the occurrence data of the five invasive plant species for the period of 2009–2022, as shown in Figure 2B. These data served as secondary data sources in our research.
2.5. Geostatistical Methods
The urban cores and buffer zones delineated according to the LULC data from Urban Atlas (Table 1) were merged with the two data sources. The occurrence counts were calculated from the number of invaded points within the urban core and each buffer zone using the LUCAS data and GBIF data separately. The occurrence densities were calculated by dividing the number of invaded points by the total area for the urban core and each buffer zone. The occurrence counts and densities obtained with each data source were then compared to clarify the differences between the GBIF data and the LUCAS data for the invasive plant species. A positive difference for a given area indicated that the GBIF data overestimated the occurrence of a species, while a negative difference indicated that the GBIF data underestimated it. A generalised linear model glm() was constructed using the software RStudio 4.0 compare the occurrence data from GBIF and LUCAS and to determine the dominance of each species in the urban core and each buffer zone. If the p-value < 0.05, the observed difference is considered statistically significant. The z-value provides information on both the direction (positive or negative) and the magnitude of the difference.
3. Results
3.1. Descriptive Statistics
Descriptive statistics were applied to compare the occurrence counts of the studied invasive plant species based on data from the two databases. In the urban core, the GBIF data overestimated both the occurrence count and density of A. altissima, A. syriaca, and E. angustifolia and underestimated the occurrence count and density of R. pseudoacacia. The GBIF data overestimated the occurrence count of Solidago spp. but underestimated its occurrence density. In the near buffer zone (0–500 m), the GBIF data overestimated the occurrence count and density of A. altissima and E. angustifolia and underestimated the occurrence count and density of the other species. In the middle buffer zone (500–1000 m), the GBIF data only overestimated the occurrence of A. altissima, while the others were underestimated. In the far buffer zone (1000–1500 m), the GBIF data underestimated both the occurrence count and density for all the investigated invasive plant species (Appendix A).
3.2. Comparative Analysis
The GLM-based comparison of the two data sources indicated substantial differences in the estimated occurrence density for some plant species. In the case of A. altissima and A. syriaca, there were no differences in the estimated occurrence densities with the GBIF and LUCAS data in either the urban core or buffer zones. For E. angustifolia, the GBIF data significantly overestimated the occurrence density in the urban core, but there were no differences in the buffer zones. For R. pseudoacacia, the GBIF data significantly underestimated the occurrence density in both the urban core and the buffer zones. For Solidago spp., the two data sources estimated similar occurrence densities in the urban core, but the GBIF data significantly underestimated the occurrence density in the buffer zones (Table 2).
Table 2.
The difference between the occurrence density of the investigated invasive plant species based on GBIF and LUCAS data in urban core areas and urban fringe zones of Hungary.
We compared the occurrence density values of the investigated plant species in the urban core area and in the urban fringes and found that, generally, the relationships of different species in these areas differ significantly from each other according to the sources of the datasets. In the case of the LUCAS database, the occurrence of different species inside each study areas (i.e., urban core and the near, middle, and far buffer zones) showed far more differences from each other in its densities than in the case of the GBIF database. Furthermore, while the LUCAS data had large spatial variations in the occurrence density of the plants in the buffer zones, the GBIF data showed significant species-dependent differences in occurrence density in the urban core. The GBIF data demonstrated no differences in the occurrence densities of A. altissima and E. angustifolia among the urban core and buffer zones, but these species had much higher occurrence densities than the other species in the urban core (Table 3).
Table 3.
The differences between the occurrence density of the investigated invasive plant species in relation to each other based on GBIF and LUCAS data in urban core areas and urban fringe zones of Hungarian cities.
Table 4 compares the differences in the estimated occurrence densities of the invasive plant species for a given area (i.e., urban core and buffer zones). The GBIF data resulted much more significant differences in occurrence density between different areas than the LUCAS data. The LUCAS data indicated a significant difference in the occurrence density of A. altissima only between the near and middle buffer zones. Interestingly, A. altissima had a higher occurrence density in the urban core and near buffer zone than in the middle buffer zone, which indicates the importance of urban fringes as an invasion hotspot for this species.
Table 4.
The difference between the occurrence density of the investigated invasive plant species between the urban core and different buffer zones of Hungarian cities based on GBIF and LUCAS data.
4. Discussion
Citizen science data can only be reliably utilised for scientific research if they meet high standards of quality [37]. There are various strategies available to enhance data quality, including the application of diverse statistical approaches, ranging from general linear models and mixed-effects models to deep learning techniques [60]. In addition, data quality can be improved through the development of standardised data collection tools [60] and the training of volunteers [41]. Several studies have demonstrated that, under appropriate conditions, volunteers can collect data of comparable quality to that gathered by professionals [37,38,43,61,62]. Volunteers identified species with up to 70–95% accuracy in the diversity of systems and taxa [38,63,64]. Task complexity plays a significant role in determining the accuracy of data collected by volunteers. For instance, identification accuracy can vary across different species [38]. The accuracy of data collected by volunteers can be substantially enhanced through experience and training [37,38,41]. However, moderately trained volunteers are more likely to misidentify rare species than those who consider themselves experts [42].
Accurate and reliable data collection is essential in invasive species management, and citizen science represents a valuable approach both for gathering such data and for promoting public engagement in scientific research. A. altissima, which is commonly associated with urban environments [14,65,66,67,68], poses significant challenges not only to nature conservation but also to the integrity of urban landscapes. Its presence contributes to the degradation of both the aesthetic and historical character of natural and cultural sites within cities [62]. Ref. [43] assessed the reliability of citizen science data by comparing it with control data collected by trained collaborators for three invasive plant species, including A. altissima. The study found that citizen science data accurately reflected the actual distribution of the examined species. This reliability was attributed to several factors: the species were relatively easy to identify; the instructions provided to volunteers were clearly formulated; and the survey itself was of a short duration. The latter likely contributed to a reduction in errors related to repeated or false reports [43]. Ref. [69] separately address nature conservation-related citizen science (NCCS). In their studies, they evaluated the performance of projects in Hungary with respect to science, nature conservation, and participants’ development. While the nature conservation outcomes were positive, neither the learning outcomes nor the changes in behaviour and attitudes were assessed in any of the projects [69]. Ref. [70] conducted field interviews to investigate anglers’ observations of alien aquatic plants in Hungarian lakes. Their study revealed that the anglers’ observations constitute an important source of information regarding alien aquatic organisms. However, several respondents admitted to having released alien species into the wild themselves [70].
The occurrence data collected by volunteers are a very valuable source of data for trend analysis used in biodiversity indicators. However, such projects are very flexible in terms of where and when the data collection takes place [33]. Our results indicated that raw citizen science data can be useful for investigating the occurrence of common invasive plant species in urban and suburban areas, but the reliability and accuracy of the data significantly differ between species. For A. altissima, we found no major differences in the occurrence densities estimated from the GBIF and LUCAS data. A. altissima is a distinctly urbanophilic species [14,65,66,68] with a much higher occurrence density in cities than in rural areas, which is supported by the results for both data sources (Table 1 and Table 2). This species is often planted in cities to absorb particulate matter and carbon dioxide [71]. In urban areas, the invaded points of A. altissima identified by LUCAS had a high probability of being found by volunteers as well. Thus, according to our results, the GBIF data may be suitable for studying the occurrence of A. altissima. This is evidenced by the fact that the GBIF data overestimated the occurrence of this species in the urban core and in the near and middle buffer zones when compared with the LUCAS data. In other words, the GBIF had more occurrence data available, which improved the estimation accuracy. This result is consistent with previous research showing that citizen science data are particularly valuable for assessing the presence/absence of species in urban areas [34].
Meanwhile, A. syriaca is a distinctly rural species that prefers sandy soils, fallow land, tree plantations, and disturbed areas [72]. Invaded points identified in the LUCAS data were also identified by the volunteers for GBIF. In contrast, the GBIF data greatly overestimated the occurrence of E. angustifolia in urban cores. This species is found in saline soils, and it is often planted for soil sequestration and roadside buffer strips [24,73]. Its overestimation in the GBIF data can likely be attributed to the plant’s unique silvery colour, olive-like fruit, and occurrence in urban parks. In the case of R. pseudoacacia, the GBIF data greatly underestimated its occurrence density in all urban and suburban areas. This species is a very common woody stalked plant in Hungary, and it is well known for its economic value. Thus, volunteers may not have collected data for the GBIF on this plant because of its well-known nature. In addition, LUCAS includes invaded points within plantations, but volunteers can safely be assumed to have not collected data on invaded points in plantations. The GBIF data also underestimated Solidago spp. in the urban fringe. Similar to A. syriaca, Solidago pp. is a typical rural species, but it prefers cool and moist habitats and is most likely to invade habitats close to water bodies such as rivers and streams [74,75]. The results for A. syriaca, E. angustifolia, and Solidago spp. serve as examples of the weaknesses of citizen science data.
The effective monitoring and management of the global distribution of invasive species necessitates accurate spatial and temporal tracking of their occurrences [76]. Early detection and the prevention of biological invasions are considerably more cost effective than subsequent eradication efforts [77,78,79]. Species presence data are derived from a wide range of sources [76], including citizen science initiatives. The use of such data has been widely endorsed by previous research, particularly given that standardised field surveys conducted by experts are often prohibitively expensive [80]. When data quality concerns are adequately addressed, citizen science data can serve as a robust resource for describing global biodiversity patterns, as well as for identifying the underlying mechanisms driving changes within ecosystems, communities, and species distributions [60].
Our results obtained for the particularly urbanophilic A. altissima were similar for the two compared occurrence databases (which indicated the high reliability of the citizen science data) and the GBIF had more data available in urban areas because volunteers are more likely to collect data close to their homes [34]. Thus, citizen science data can be assumed reliable for studying urbanophilic invasive species specifically because the larger amount of data can provide a more reliable view of the actual occurrence of the species. In addition, citizen science data can still be used as a complement for data collected by experts [81]. This can be advantageous because volunteers may detect elements that escape an expert’s attention, such as data collected from the courtyards of apartment buildings or from their own gardens. Citizen science data are particularly useful for investigating the occurrence of urbanophilic species because local residents know well the area in which they live. Our findings support the use of citizen science data for monitoring invasive plant species, Accordingly, volunteer-collected data on this species can be recommended for use in monitoring its urban distribution. Provided that the target species and sampling areas are carefully selected and the implementation of the data collection process is appropriately designed and executed.
5. Conclusions
Citizen science databases have come in for a lot of criticism, especially regarding spatial bias. Our results indicate that citizen science data can be useful for investigating the occurrence of invasive plant species, especially urbanophilic plants. This may be attributed to the large amount of data collected by volunteers around their homes in urban areas. The results demonstrate that the occurrence density of A. altissima (a species associated with urban environments) did not differ significantly between datasets derived from volunteer observations and those collected by experts. Thus, volunteer-collected observations of this species are deemed reliable for monitoring its presence in urban environments. However, such usefulness varies according to species. In general, citizen science data are particularly useful for investigating the occurrence of anthropophilic invasive plant species in urban areas. However, for invasive plant species that are common, frequently established and of economic benefit across the country, there is a clear need to eliminate spatial bias or to include expert data in addition to citizen science data.
In the present study, we evaluated data provided by the GBIF to examine the distribution of commonly occurring invasive plant species. However, in addition to invasive species, mapping the occurrence of endangered species also represents a research priority. In regions in which a species is known to occur in high densities, we recommend involving volunteers in occurrence mapping efforts even for endangered species, as this approach can enhance both time and cost efficiency. Such data may subsequently be integrated with presence–absence data collected by experts or, if data quality is deemed sufficient, may be used independently.
Author Contributions
Conceptualization, G.V.V.; Methodology, P.S.; Validation, G.V.V.; Formal analysis, G.V.V.; Investigation, G.V.V. and P.S.; Resources, P.S.; Data curation, G.V.V.; Writing—original draft, G.V.V.; Writing—review & editing, P.S.; Visualization, G.V.V.; Project administration, P.S. All authors have read and agreed to the published version of the manuscript.
Funding
This research was funded by the University of Szeged Open-Access Fund, Grant ID: 7817. Project No. TKP2021-NVA-09 has been implemented with the support provided by the Ministry of Culture and Innovation of Hungary from the National Research, Development and Innovation Fund, financed under the TKP2021-NVA funding scheme.
Data Availability Statement
Hungarian GIS Database of Invasive Plant Species http://earth.geo.u-szeged.hu/invasive/index_en.html (accessed on 1 June 2025). The data that support the findings of this study are available from the corresponding author upon reasonable request.
Conflicts of Interest
The authors declare that they have no known competing financial interests or personal relationships that could have appeared to influence the work reported in this paper.
Appendix A
Table A1.
Descriptive statistics for the occurrence count and occurrence density of invasive plant species in the urban core and urban fringe of Hungarian cities according to GBIF and LUCAS data.
Table A1.
Descriptive statistics for the occurrence count and occurrence density of invasive plant species in the urban core and urban fringe of Hungarian cities according to GBIF and LUCAS data.
 |  |  |  | |||||
| Investigated Plant Species | Urban Core | 0–500 m Buffer | 500–1000 m Buffer | 1000–1500 m Buffer | ||||
|---|---|---|---|---|---|---|---|---|
| Urban Fringe | ||||||||
| Occurrence Count | Occurrence Density | Occurrence Count | Occurrence Density | Occurrence Count | Occurrence Density | Occurrence Count | Occurrence Density | |
| Ailanthus altissima | 107 | 0.125 | 60 | 0.092 | 5 | 0.014 | −4 | −0.008 |
| Asclepias syriaca | 14 | 0.059 | −56 | −0.076 | −33 | −0.058 | −37 | −0.084 |
| Elaeagnus angustifolia | 146 | 0.465 | 76 | 0.112 | −25 | −0.079 | −27 | −0.058 |
| Robinia pseudoacacia | −100 | −0.634 | −488 | −0.749 | −304 | −0.599 | −215 | −0.555 |
| Solidago spp. | 1 | −0.039 | −130 | −0.258 | −140 | −0.313 | −81 | −0.238 |
| The GBIF database overestimates the occurrence count of a given invasive plant species. | ||||||||
| The GBIF database underestimates the occurrence count of a given invasive plant species. | ||||||||
References
- Bayliss, H.R.; Schindler, S.; Adam, M.; Essl, F.; Rabitsch, W. Evidence for Changes in the Occurrence, Frequency or Severity of Human Health Impacts Resulting from Exposure to Alien Species in Europe: A Systematic Map. Environ. Evid. 2017, 6, 21. [Google Scholar] [CrossRef]
- Csiszár, Á.; Kézdy, P.; Korda, M.; Bartha, D. Occurrence and Management of Invasive Alien Species in Hungarian Protected Areas Compared to Europe. Folia Oecologica 2020, 47, 178–191. [Google Scholar] [CrossRef]
- Constán-Nava, S.; Soliveres, S.; Torices, R.; Serra, L.; Bonet, A. Direct and Indirect Effects of Invasion by the Alien Tree Ailanthus altissima on Riparian Plant Communities and Ecosystem Multifunctionality. Biol. Invasions 2015, 17, 1095–1108. [Google Scholar] [CrossRef]
- Montagnani, C.; Gentili, R.; Smith, M.; Guarino, M.F.; Citterio, S. The Worldwide Spread, Success, and Impact of Ragweed (Ambrosia spp.). Crit. Rev. Plant Sci. 2017, 36, 139–178. [Google Scholar] [CrossRef]
- Nguyen, N.A.; Eskelson, B.N.I.; Gergel, S.E.; Murray, T. The Occurrence of Invasive Plant Species Differed Significantly across Three Urban Greenspace Types of Metro Vancouver, Canada. Urban For. Urban Green. 2021, 59, 126999. [Google Scholar] [CrossRef]
- Pyšek, P.; Hulme, P.E.; Simberloff, D.; Bacher, S.; Blackburn, T.M.; Carlton, J.T.; Dawson, W.; Essl, F.; Foxcroft, L.C.; Genovesi, P.; et al. Scientists’ Warning on Invasive Alien Species. Biol. Rev. 2020, 95, 1511–1534. [Google Scholar] [CrossRef] [PubMed]
- Rasmussen, K.; Thyrring, J.; Muscarella, R.; Borchsenius, F. Climate-Change-Induced Range Shifts of Three Allergenic Ragweeds (Ambrosia L.) in Europe and Their Potential Impact on Human Health. PeerJ 2017, 5, e3104. [Google Scholar] [CrossRef] [PubMed]
- Turbelin, A.J.; Cuthbert, R.N.; Essl, F.; Haubrock, P.J.; Ricciardi, A.; Courchamp, F. Biological Invasions Are as Costly as Natural Hazards. Perspect. Ecol. Conserv. 2023, 21, 143–150. [Google Scholar] [CrossRef]
- Welsh, M.J.; Turner, J.A.; Epanchin-Niell, R.S.; Monge, J.J.; Soliman, T.; Robinson, A.P.; Kean, J.M.; Phillips, C.; Stringer, L.D.; Vereijssen, J.; et al. Approaches for Estimating Benefits and Costs of Interventions in Plant Biosecurity across Invasion Phases. Ecol. Appl. 2021, 31, e2319. [Google Scholar] [CrossRef]
- D’Amato, G.; Cecchi, L.; Bonini, S.; Nunes, C.; Annesi-Maesano, I.; Behrendt, H.; Liccardi, G.; Popov, T.; Van Cauwenberge, P. Allergenic Pollen and Pollen Allergy in Europe. Allergy Eur. J. Allergy Clin. Immunol. 2007, 62, 976–990. [Google Scholar] [CrossRef]
- Pauková, Ž.; Knápeková, M.; Hauptvogl, M. Mapovanie Výskytu Populácií Cudzích Druhov Asclepias Syriaca a Fallopia Japonica v Poľnohospodárskej Krajine. J. Cent. Eur. Agric. 2014, 15, 12–22. [Google Scholar] [CrossRef]
- Kiss, T.; Nagy, J.; Fehérváry, I.; Vaszkó, C. (Mis) Management of Floodplain Vegetation: The Effect of Invasive Species on Vegetation Roughness and Flood Levels. Sci. Total Environ. 2019, 686, 931–945. [Google Scholar] [CrossRef] [PubMed]
- Alvey, A.A. Promoting and Preserving Biodiversity in the Urban Forest. Urban For. Urban Green. 2006, 5, 195–201. [Google Scholar] [CrossRef]
- Sladonja, B.; Sušek, M.; Guillermic, J. Review on Invasive Tree of Heaven (Ailanthus altissima (Mill.) Swingle) Conflicting Values: Assessment of Its Ecosystem Services and Potential Biological Threat. Environ. Manag. 2015, 56, 1009–1034. [Google Scholar] [CrossRef] [PubMed]
- Sultana, M.; Corlatti, L.; Storch, I. Are the Same Factors Determining Biodiversity in Cities across Different Regions? Comparing Drivers of Urban Bird Richness Patterns in Southern Asia vs. Western Europe. Urban Ecosyst. 2023, 26, 1545–1557. [Google Scholar] [CrossRef]
- Ives, C.D.; Lentini, P.E.; Threlfall, C.G.; Ikin, K.; Shanahan, D.F.; Garrard, G.E.; Bekessy, S.A.; Fuller, R.A.; Mumaw, L.; Rayner, L.; et al. Cities Are Hotspots for Threatened Species. Glob. Ecol. Biogeogr. 2016, 25, 117–126. [Google Scholar] [CrossRef]
- Kantsa, A.; Tscheulin, T.; Junker, R.R.; Petanidou, T.; Kokkini, S. Urban Biodiversity Hotspots Wait to Get Discovered: The Example of the City of Ioannina, NW Greece. Landsc. Urban Plan. 2013, 120, 129–137. [Google Scholar] [CrossRef]
- Rebelo, A.G.; Holmes, P.M.; Dorse, C.; Wood, J. Impacts of Urbanization in a Biodiversity Hotspot: Conservation Challenges in Metropolitan Cape Town. S. Afr. J. Bot. 2011, 77, 20–35. [Google Scholar] [CrossRef]
- Schwartz, M.W.; Jurjavcic, N.L.; O’Brien, J.M. Conservation’s Disenfranchised Urban Poor. BioScience 2002, 52, 601–606. [Google Scholar] [CrossRef]
- Soanes, K.; Lentini, P.E. When Cities Are the Last Chance for Saving Species. Front. Ecol. Environ. 2019, 17, 225–231. [Google Scholar] [CrossRef]
- Francis, R.A.; Chadwick, M.A. Urban Invasions: Non-Native and Invasive Species in Cities. Geography 2015, 100, 144–151. [Google Scholar] [CrossRef]
- Tait, C.J.; Daniels, C.B.; Hill, R.S. Changes in Species Assemblages within the Adelaide Metropolitan Area, Australia, 1836–2002. Ecol. Appl. 2005, 15, 346–359. [Google Scholar] [CrossRef]
- Szilassi, P.; Szatmári, G.; Pásztor, L.; Árvai, M.; Szatmári, J.; Szitár, K.; Papp, L. Understanding the Environmental Background of an Invasive Plant Species (Asclepias syriaca) for the Future: An Application of Lucas Field Photographs and Machine Learning Algorithm Methods. Plants 2019, 8, 593. [Google Scholar] [CrossRef]
- Szilassi, P.; Soóky, A.; Bátori, Z.; Hábenczyus, A.A.; Frei, K.; Tölgyesi, C.; van Leeuwen, B.; Tobak, Z.; Csikós, N. Natura 2000 Areas, Road, Railway, Water, and Ecological Networks May Provide Pathways for Biological Invasion: A Country Scale Analysis. Plants 2021, 10, 2670. [Google Scholar] [CrossRef]
- Bonney, R.; Shirk, J.L.; Phillips, T.B.; Wiggins, A.; Ballard, H.L.; Miller-Rushing, A.J.; Parrish, J.K. Next Steps for Citizen Science: Strategic Investments and Coordination Are Needed for Citizen Science to Reach Its Full Potential. Science 2014, 343, 1436–1437. [Google Scholar] [CrossRef] [PubMed]
- Dickinson, J.L.; Zuckerberg, B.; Bonter, D.N. Citizen Science as an Ecological Research Tool: Challenges and Benefits. Annu. Rev. Ecol. Evol. Syst. 2010, 41, 149–172. [Google Scholar] [CrossRef]
- Dickinson, J.L.; Shirk, J.; Bonter, D.; Bonney, R.; Crain, R.L.; Martin, J.; Phillips, T.; Purcell, K. The Current State of Citizen Science as a Tool for Ecological Research and Public Engagement. Front. Ecol. Environ. 2012, 10, 291–297. [Google Scholar] [CrossRef]
- Edwards, T.; Jones, C.B.; Perkins, S.E.; Corcoran, P. Passive Citizen Science: The Role of Social Media in Wildlife Observations. PLoS ONE 2021, 16, e0255416. [Google Scholar] [CrossRef] [PubMed]
- Hartmann, M.C.; Schott, M.; Dsouza, A.; Metz, Y.; Volpi, M.; Purves, R.S. A Text and Image Analysis Workflow Using Citizen Science Data to Extract Relevant Social Media Records: Combining Red Kite Observations from Flickr, EBird and INaturalist. Ecol. Inform. 2022, 71, 101782. [Google Scholar] [CrossRef]
- Danielsen, F.; Burgess, N.D.; Jensen, P.M.; Pirhofer-Walzl, K. Environmental Monitoring: The Scale and Speed of Implementation Varies According to the Degree of Peoples Involvement. J. Appl. Ecol. 2010, 47, 1166–1168. [Google Scholar] [CrossRef]
- Kennett, R.; Danielsen, F.; Silvius, K.M. Citizen Science Is Not Enough on Its Own. Nature 2015, 521, 161. [Google Scholar] [CrossRef] [PubMed]
- Browning, E.; Freeman, R.; Boughey, K.L.; Isaac, N.J.B.; Jones, K.E. Accounting for Spatial Autocorrelation and Environment Are Important to Derive Robust Bat Population Trends from Citizen Science Data. Ecol. Indic. 2022, 136, 108719. [Google Scholar] [CrossRef]
- Pocock, M.J.O.; Adriaens, T.; Bertolino, S.; Eschen, R.; Essl, F.; Hulme, P.E.; Jeschke, J.M.; Roy, H.E.; Teixeira, H.; de Groot, M. Citizen Science Is a Vital Partnership for Invasive Alien Species Management and Research. iScience 2024, 27, 108623. [Google Scholar] [CrossRef]
- Rae, M.; Miró, A.; Hall, J.; O’Brien, K.; O’Brien, D. Evaluating the Validity of a Simple Citizen Science Index for Assessing the Ecological Status of Urban Drainage Ponds. Ecol. Indic. 2019, 98, 1–8. [Google Scholar] [CrossRef]
- Roe, A.D.; Greenwood, L.F.; Coyle, D.R. Catching Invasives with Curiosity: The Importance of Passive Biosecurity Surveillance Systems for Invasive Forest Pest Detection. Environ. Entomol. 2024, 53, 881–893. [Google Scholar] [CrossRef]
- Nahrung, H.F.; Liebhold, A.M.; Brockerhoff, E.G.; Rassati, D. Forest Insect Biosecurity: Processes, Patterns, Predictions, Pitfalls. Annu. Rev. Entomol. 2023, 68, 211–229. [Google Scholar] [CrossRef]
- Kosmala, M.; Wiggins, A.; Swanson, A.; Simmons, B. Assessing Data Quality in Citizen Science. Front. Ecol. Environ. 2016, 14, 551–560. [Google Scholar] [CrossRef]
- Swanson, A.; Kosmala, M.; Lintott, C.; Packer, C. A Generalized Approach for Producing, Quantifying, and Validating Citizen Science Data from Wildlife Images. Conserv. Biol. 2016, 30, 520–531. [Google Scholar] [CrossRef]
- Amano, T.; Lamming, J.D.L.; Sutherland, W.J. Spatial Gaps in Global Biodiversity Information and the Role of Citizen Science. BioScience 2016, 66, 393–400. [Google Scholar] [CrossRef]
- Crall, A.W.; Newman, G.J.; Stohlgren, T.J.; Holfelder, K.A.; Graham, J.; Waller, D.M. Assessing Citizen Science Data Quality: An Invasive Species Case Study. Conserv. Lett. 2011, 4, 433–442. [Google Scholar] [CrossRef]
- Danielsen, F.; Jensen, P.M.; Burgess, N.D.; Altamirano, R.; Alviola, P.A.; Andrianandrasana, H.; Brashares, J.S.; Burton, A.C.; Coronado, I.; Corpuz, N.; et al. A Multicountry Assessment of Tropical Resource Monitoring by Local Communities. BioScience 2014, 64, 236–251. [Google Scholar] [CrossRef]
- Farmer, R.G.; Leonard, M.L.; Horn, A.G. Observer Effects and Avian-Call-Count Survey Quality: Rare-Species Biases and Overconfidence. Auk 2012, 129, 76–86. [Google Scholar] [CrossRef]
- Luigi Nimis, P.; Pittao, E.; Altobelli, A.; De Pascalis, F.; Laganis, J.; Martellos, S. Mapping Invasive Plants with Citizen Science. A Case Study from Trieste (NE Italy). Plant Biosyst. 2019, 153, 700–709. [Google Scholar] [CrossRef]
- Foster-Smith, J.; Evans, S.M. The Value of Marine Ecological Data Collected by Volunteers. Biol. Conserv. 2003, 113, 199–213. [Google Scholar] [CrossRef]
- Graham, C.H.; Elith, J.; Hijmans, R.J.; Guisan, A.; Townsend Peterson, A.; Loiselle, B.A.; Anderson, R.P.; Dudk, M.; Ferrier, S.; Huettmann, F.; et al. The Influence of Spatial Errors in Species Occurrence Data Used in Distribution Models. J. Appl. Ecol. 2008, 45, 239–247. [Google Scholar] [CrossRef]
- Yesson, C.; Brewer, P.W.; Sutton, T.; Caithness, N.; Pahwa, J.S.; Burgess, M.; Gray, W.A.; White, R.J.; Jones, A.C.; Bisby, F.A.; et al. How Global Is the Global Biodiversity Information Facility? PLoS ONE 2007, 2, e1124. [Google Scholar] [CrossRef] [PubMed]
- Buckland, S.T.; Johnston, A. Monitoring the Biodiversity of Regions: Key Principles and Possible Pitfalls. Biol. Conserv. 2017, 214, 23–34. [Google Scholar] [CrossRef]
- Botts, E.A.; Erasmus, B.F.N.; Alexander, G.J. Geographic Sampling Bias in the South African Frog Atlas Project: Implications for Conservation Planning. Biodivers. Conserv. 2011, 20, 119–139. [Google Scholar] [CrossRef]
- Isaac, N.J.B.; Pocock, M.J.O. Bias and Information in Biological Records. Biol. J. Linn. Soc. 2015, 115, 522–531. [Google Scholar] [CrossRef]
- Martin, L.J.; Blossey, B.; Ellis, E. Mapping Where Ecologists Work: Biases in the Global Distribution of Terrestrial Ecological Observations. Front. Ecol. Environ. 2012, 10, 195–201. [Google Scholar] [CrossRef]
- Beck, J.; Böller, M.; Erhardt, A.; Schwanghart, W. Spatial Bias in the GBIF Database and Its Effect on Modeling Species’ Geographic Distributions. Ecol. Inform. 2014, 19, 10–15. [Google Scholar] [CrossRef]
- Costello, M.J.; Michener, W.K.; Gahegan, M.; Zhang, Z.Q.; Bourne, P.E. Biodiversity Data Should Be Published, Cited, and Peer Reviewed. Trends Ecol. Evol. 2013, 28, 454–461. [Google Scholar] [CrossRef] [PubMed]
- Elith, J.; Leathwick, J.R. Species Distribution Models: Ecological Explanation and Prediction across Space and Time. Annu. Rev. Ecol. Evol. Syst. 2009, 40, 677–697. [Google Scholar] [CrossRef]
- Guralnick, R.; Hill, A. Biodiversity Informatics: Automated Approaches for Documenting Global Biodiversity Patterns and Processes. Bioinformatics 2009, 25, 421–428. [Google Scholar] [CrossRef] [PubMed]
- Kocsis, K. (Ed.) National Atlas of Hungary: Natural Environment. Hungarian Academy of Sciences, Research Centre for Astronomy and Earth Sciences, Budapest. 2018. Available online: https://www.nemzetiatlasz.hu/MNA/2.html (accessed on 1 June 2025).
- McKinney, M.L. Urbanization as a Major Cause of Biotic Homogenization. Biol. Conserv. 2006, 127, 247–260. [Google Scholar] [CrossRef]
- Vakhlamova, T.; Rusterholz, H.P.; Kanibolotskaya, Y.; Baur, B. Changes in Plant Diversity along an Urban-Rural Gradient in an Expanding City in Kazakhstan, Western Siberia. Landsc. Urban Plan. 2014, 132, 111–120. [Google Scholar] [CrossRef]
- Wang, Z.; Yang, J. Urbanization Strengthens the Edge Effects on Species Diversity and Composition of Woody Plants in Remnant Forests. For. Ecosyst. 2022, 9, 100063. [Google Scholar] [CrossRef]
- Johnson, B.A.; Mader, A.D.; Dasgupta, R.; Kumar, P. Citizen Science and Invasive Alien Species: An Analysis of Citizen Science Initiatives Using Information and Communications Technology (ICT) to Collect Invasive Alien Species Observations. Glob. Ecol. Conserv. 2020, 21, e00812. [Google Scholar] [CrossRef]
- Bird, T.J.; Bates, A.E.; Lefcheck, J.S.; Hill, N.A.; Thomson, R.J.; Edgar, G.J.; Stuart-Smith, R.D.; Wotherspoon, S.; Krkosek, M.; Stuart-Smith, J.F.; et al. Statistical Solutions for Error and Bias in Global Citizen Science Datasets. Biol. Conserv. 2014, 173, 144–154. [Google Scholar] [CrossRef]
- Delaney, D.G.; Sperling, C.D.; Adams, C.S.; Leung, B. Marine Invasive Species: Validation of Citizen Science and Implications for National Monitoring Networks. Biol. Invasions 2008, 10, 117–128. [Google Scholar] [CrossRef]
- Sladonja, B.; Poljuha, D. Citizen Science as a Tool in Biological Recording-A Case Study of Ailanthus altissima (Mill.) Swingle. Forests 2018, 9, 31. [Google Scholar] [CrossRef]
- Fuccillo, K.K.; Crimmins, T.M.; de Rivera, C.E.; Elder, T.S. Assessing Accuracy in Citizen Science-Based Plant Phenology Monitoring. Int. J. Biometeorol. 2015, 59, 917–926. [Google Scholar] [CrossRef] [PubMed]
- Gardiner, M.M.; Allee, L.L.; Brown, P.M.J.; Losey, J.E.; Roy, H.E.; Smyth, R.R. Lessons from Lady Beetles: Accuracy of Monitoring Data from US and UK Citizenscience Programs. Front. Ecol. Environ. 2012, 10, 471–476. [Google Scholar] [CrossRef]
- Kowarik, I.; Säumel, I. Biological Flora of Central Europe: Ailanthus altissima (Mill.) Swingle. Perspect. Plant Ecol. Evol. Syst. 2007, 8, 207–237. [Google Scholar] [CrossRef]
- Kowarik, I. Novel Urban Ecosystems, Biodiversity, and Conservation. Environ. Pollut. 2011, 159, 1974–1983. [Google Scholar] [CrossRef] [PubMed]
- Paź-Dyderska, S.; Ladach-Zajdler, A.; Jagodziński, A.M.; Dyderski, M.K. Landscape and Parental Tree Availability Drive Spread of Ailanthus altissima in the Urban Ecosystem of Poznań, Poland. Urban For. Urban Green. 2020, 56, 126868. [Google Scholar] [CrossRef]
- Zisenis, M. Alien Plant Species: A Real Fear for Urban Ecosystems in Europe? Urban Ecosyst. 2015, 18, 355–370. [Google Scholar] [CrossRef]
- Aguirre, J.M.S.; Szép, T.; Váczi, O.; Halpern, B.; Biró, M.; Szentirmai, I.; Juhász, E.; Károlyi, B.; Soltész, Z.; Czeglédi, A.; et al. Citizen Science for Nature Conservation in Hungary A Three-Dimensional Approach. Citiz. Sci. Theory Pract. 2024, 9, 39. [Google Scholar] [CrossRef]
- Nagy, A.; Neményi, Z.; Hagyó, A.; Lukács, B.A.; Vitál, Z.; Mozsár, A.; Reynolds, S.J.; Nagy, J.; Löki, V. The Knowledge and Perceptions of Recreational Anglers Related to Alien Plant Species in Freshwater Ecosystems: A Case Study From Hungary. Aquat. Conserv. Mar. Freshw. Ecosyst. 2025, 35, e70082. [Google Scholar] [CrossRef]
- Przemysław, B.; Czekalski, M. Distribution of Tree-of-Heaven, Ailanthus altissima (Mill.) Swingle, in Wrocław, Lower Silesia, Poland. Acta Sci. Polonorum. Hortorum Cultus 2005, 4, 45–57. [Google Scholar]
- Botta-Dukat, Z.; Balogh, L.; Feher, A. The Most Important Invasive Plants in Hungary; Hungarian Academy of Sciences: Boedapest, Hongarije, 2008; ISBN 9789638391421. [Google Scholar]
- Lundgren, M.R.; Small, C.J.; Dreyer, G.D. Influence of Land Use and Site Characteristics on Invasive Plant Abundance in the Quinebaug Highlands of Southern New England. Northeast. Nat. 2004, 11, 313–332. [Google Scholar] [CrossRef]
- Priede, A. Invasive Non-Native Solidago Species in Latvia:Expansion History and Current Distribution. Proc. Latv. Acad. Sci. Sect. B Nat. Exact Appl. Sci. 2008, 62, 78–83. [Google Scholar] [CrossRef]
- Pyšek, P.; Lambdon, P.W.; Arianoutsou, M.; Kühn, I.; Pino, J.; Winter, M. Alien Vascular Plants of Europe. In Handbook of Alien Species in Europe; Springer: Dordrecht, The Netherlands, 2009; pp. 43–61. [Google Scholar] [CrossRef]
- Saffer, A.; Worm, T.; Takeuchi, Y.; Meentemeyer, R. GIATAR: A Spatio-Temporal Dataset of Global Invasive and Alien Species and Their Traits. Sci. Data 2024, 11, 991. [Google Scholar] [CrossRef]
- Cuthbert, R.N.; Diagne, C.; Hudgins, E.J.; Turbelin, A.; Ahmed, D.A.; Albert, C.; Bodey, T.W.; Briski, E.; Essl, F.; Haubrock, P.J.; et al. Biological Invasion Costs Reveal Insufficient Proactive Management Worldwide. Sci. Total Environ. 2022, 819, 153404. [Google Scholar] [CrossRef]
- Martinez, B.; Reaser, J.K.; Dehgan, A.; Zamft, B.; Baisch, D.; McCormick, C.; Giordano, A.J.; Aicher, R.; Selbe, S. Technology Innovation: Advancing Capacities for the Early Detection of and Rapid Response to Invasive Species. Biol. Invasions 2020, 22, 75–100. [Google Scholar] [CrossRef]
- Mastin, A.J.; Van Den Bosch, F.; Van Den Berg, F.; Parnell, S.R. Quantifying the Hidden Costs of Imperfect Detection for Early Detection Surveillance. Philos. Trans. R. Soc. B Biol. Sci. 2019, 374, 3–8. [Google Scholar] [CrossRef] [PubMed]
- Peterson’, A.T.; Navarro-Siguenza, A.G.; Benítez-Díaz, H. The Need for Continued Scientific Collecting; a Geographic Analysis of Mexican Bird Specimens. Ibis 1998, 140, 288–294. [Google Scholar] [CrossRef]
- Beck, J.; Ballesteros-Mejia, L.; Nagel, P.; Kitching, I.J. Online Solutions and the “Wallacean Shortfall”: What Does GBIF Contribute to Our Knowledge of Species’ Ranges? Divers. Distrib. 2013, 19, 1043–1050. [Google Scholar] [CrossRef]


Disclaimer/Publisher’s Note: The statements, opinions and data contained in all publications are solely those of the individual author(s) and contributor(s) and not of MDPI and/or the editor(s). MDPI and/or the editor(s) disclaim responsibility for any injury to people or property resulting from any ideas, methods, instructions or products referred to in the content. |
© 2025 by the authors. Licensee MDPI, Basel, Switzerland. This article is an open access article distributed under the terms and conditions of the Creative Commons Attribution (CC BY) license (https://creativecommons.org/licenses/by/4.0/).