Article

Coupling Relationship Between Transportation Corridors and Ecosystem Service Value Realization in Giant Panda National Park

1
School of Management, Minzu University of China, Beijing 100081, China
2
School of Economics, Minzu University of China, Beijing 100081, China
3
School of Architecture and Design, Beijing Jiaotong University, Beijing 100044, China
*
Authors to whom correspondence should be addressed.
These authors contributed equally to this work.
Land 2025, 14(7), 1385; https://doi.org/10.3390/land14071385
Submission received: 30 May 2025 / Revised: 24 June 2025 / Accepted: 30 June 2025 / Published: 1 July 2025
(This article belongs to the Section Land Planning and Landscape Architecture)

Abstract

As critical zones for ecological conservation, national parks necessitate integrated management of transportation corridors (TCs) and ecosystem service value (ESV) to advance ecological civilisation. This study investigates the TC-ESV mutual construction mechanism in the Giant Panda National Park (GPNP). This research employs the TOPSIS method to measure the development level of TCs, applies the equivalent factor method to calculate the ESV, and uses a coupling coordination model and local spatial autocorrelation analysis to evaluate their interaction patterns. The results show that TC development in the GPNP has been increasing, accompanied by a significant rise in ESV. A coupling coordination relationship exists between TCs and ESV, with notable spatial differentiation. TCs not only increase the market ESV by reducing distribution costs and facilitating the outward flow of ESV, they also improve the accessibility of national parks, promote ecotourism and cultural services, facilitate the movement of people and the exchange of knowledge, and enhance the ability of local populations and migrants to realise the ESV in the long term. However, challenges persist, including ESV conversion difficulties and TC construction’s potential impacts on ESV realisation. Therefore, we propose optimised green transport corridors and differentiated ecological compensation mechanisms, and by analysing the interaction between them, the innovation of this paper is to provide an innovative framework for sustainable spatial governance of ESV conversion and TC development in national parks, enriching the interdisciplinary approach.

1. Introduction

Under the global context of ecological governance and sustainable development, ecological conservation has emerged as a core strategic imperative. Confronted by the climate governance frameworks established through international agreements such as the Kyoto Protocol, and driven by China’s domestic goals of carbon peaking and neutrality, China actively embraces the scientific concept that “lucid waters and lush mountains are invaluable assets [1]”. This concept profoundly reveals and vividly demonstrates the inherently unified and mutually reinforcing relationship between ecological protection and economic growth. National parks, as protected areas with unique natural resource attributes [2], are critical regions for ecosystem service value (ESV) realisation. A multi-layered mutual-construction relationship exists between transportation corridors (TCs) and ESV. On one hand, TCs act as physical mediators, connecting ecosystem service providers and beneficiaries [3]. Xi Jinping’s famous saying, “lucid waters and lush mountains are invaluable assets,” advocates transforming environmental advantages into economic gains, highlighting the unity of ecology and economy [4]. They provide multi-dimensional support in this value conversion process. Rational planning of TC layouts and the construction of green corridors help to reduce ecological disturbances, enhance the circulation efficiency and market accessibility of ecosystem services, expand the spatial scope and economic potential of ESV realisation, and promote coordinated development between national parks and surrounding regions. On the other hand, the exploitation and utilisation of ecosystem services drive the planning and construction of TCs, expanding transportation network coverage and market space. This not only fosters synergistic development within the transportation industry chain but also achieves coordinated progress in ecological conservation and economic growth through optimised resource allocation and reduced environmental pressures, thereby meeting ecological sustainability requirements and forming a virtuous-cycle development model. Therefore, in-depth research into the mutual construction mechanisms between TCs and ESV in national parks holds significant theoretical and practical importance for achieving sustainable national park development and advancing ecological civilisation.
TCs serve as a prerequisite for ecological civilisation construction [5], where the completeness of their planning, construction, management, and operational systems directly determines the feasibility of ESV realisation [3], reflecting a dual impact mechanism between TCs and ESV [6]. First, TCs positively contribute to ESV realisation by facilitating regional economic growth and resource flows while enhancing ESV through improved liquidity of ecosystem service value. Well-planned TCs promote ecosystem service marketization and sustainable development by optimising spatial connectivity [7]. However, ESV realisation faces challenges such as an underdeveloped transportation infrastructure and incomplete transaction markets, which hinder ecosystem service circulation [8]. Addressing supply–demand mismatches requires prioritising infrastructure optimisation [9]. Enhanced transportation networks reduce logistical and temporal costs of ecosystem services, improve accessibility to ecological landscapes, and increase market transaction frequency [10]. Second, a negative correlation exists between improved transportation accessibility and ESV [11]. While TC construction promotes regional integration and balances ecological service supply–demand dynamics, it risks environmental degradation, including habitat fragmentation and biodiversity loss. Anthropogenic activities near transportation hubs further intensify ecosystem pressures, diminishing ESV [12]. Consequently, TC development necessitates rigorous assessment of ecological carrying capacity to reconcile economic–regional synergies with ecosystem sustainability, ensuring that ESV enhancement aligns with ecological conservation imperatives.
Existing studies predominantly focus on macro-scale transportation–ecology interactions [13], emphasising unidirectional impacts of transportation on ecosystems, yet lack systematic exploration of TC-ESV mutual-construction mechanisms. Empirical gaps persist in understanding bidirectional interactions in factor flows, value conversion, and coupling coordination effects. This study addresses these gaps by analysing TC-ESV mutual-construction mechanisms in the Giant Panda National Park (GPNP), measuring the ESV and TC development levels from 2018 to 2022 through coupling coordination models and local spatial autocorrelation analysis. These findings aim to advance theoretical frameworks and practical strategies for ESV realisation, supporting green development and ecological civilisation goals.

2. Materials and Methods

2.1. Geographic Location

The GPNP (Figure 1) spans Sichuan, Shaanxi, and Gansu provinces, encompassing the Minshan, Qionglai-Daxiangling, Qinling, and Baishujiang sectors. Its geographic coordinates range from 102°11′10″ E to 108°30′52″ E longitude and 28°51′03″ N to 34°10′07″ N latitude, with a total area of 27,134 km2. Sichuan Province accounts for 74.36% of the park’s area, covering 7 prefectures (states) and 20 counties (cities/districts); Shaanxi Province constitutes 16.16%, involving 4 cities and 8 counties; Gansu Province occupies 9.48%, spanning 1 city and 2 districts. The park exhibits a northwest-high, southeast-low topography, with a maximum elevation of 5588 m. It lies within a continental monsoon climate zone, transitioning from northern subtropical to warm temperate zones, situated at the eastern edge of the Tibetan Plateau and the transitional alpine–gorge region between the Sichuan Basin and the Tibetan Plateau. This unique geographic positioning establishes the park as a critical ecological nexus connecting multiple ecosystems, playing an irreplaceable role in maintaining regional ecological balance and biodiversity. The park hosts diverse ecosystems and land cover types, with forest coverage reaching 72.07%. This provides optimal habitats for numerous wildlife species, serving as both a refuge for endangered species and vital migration corridors.

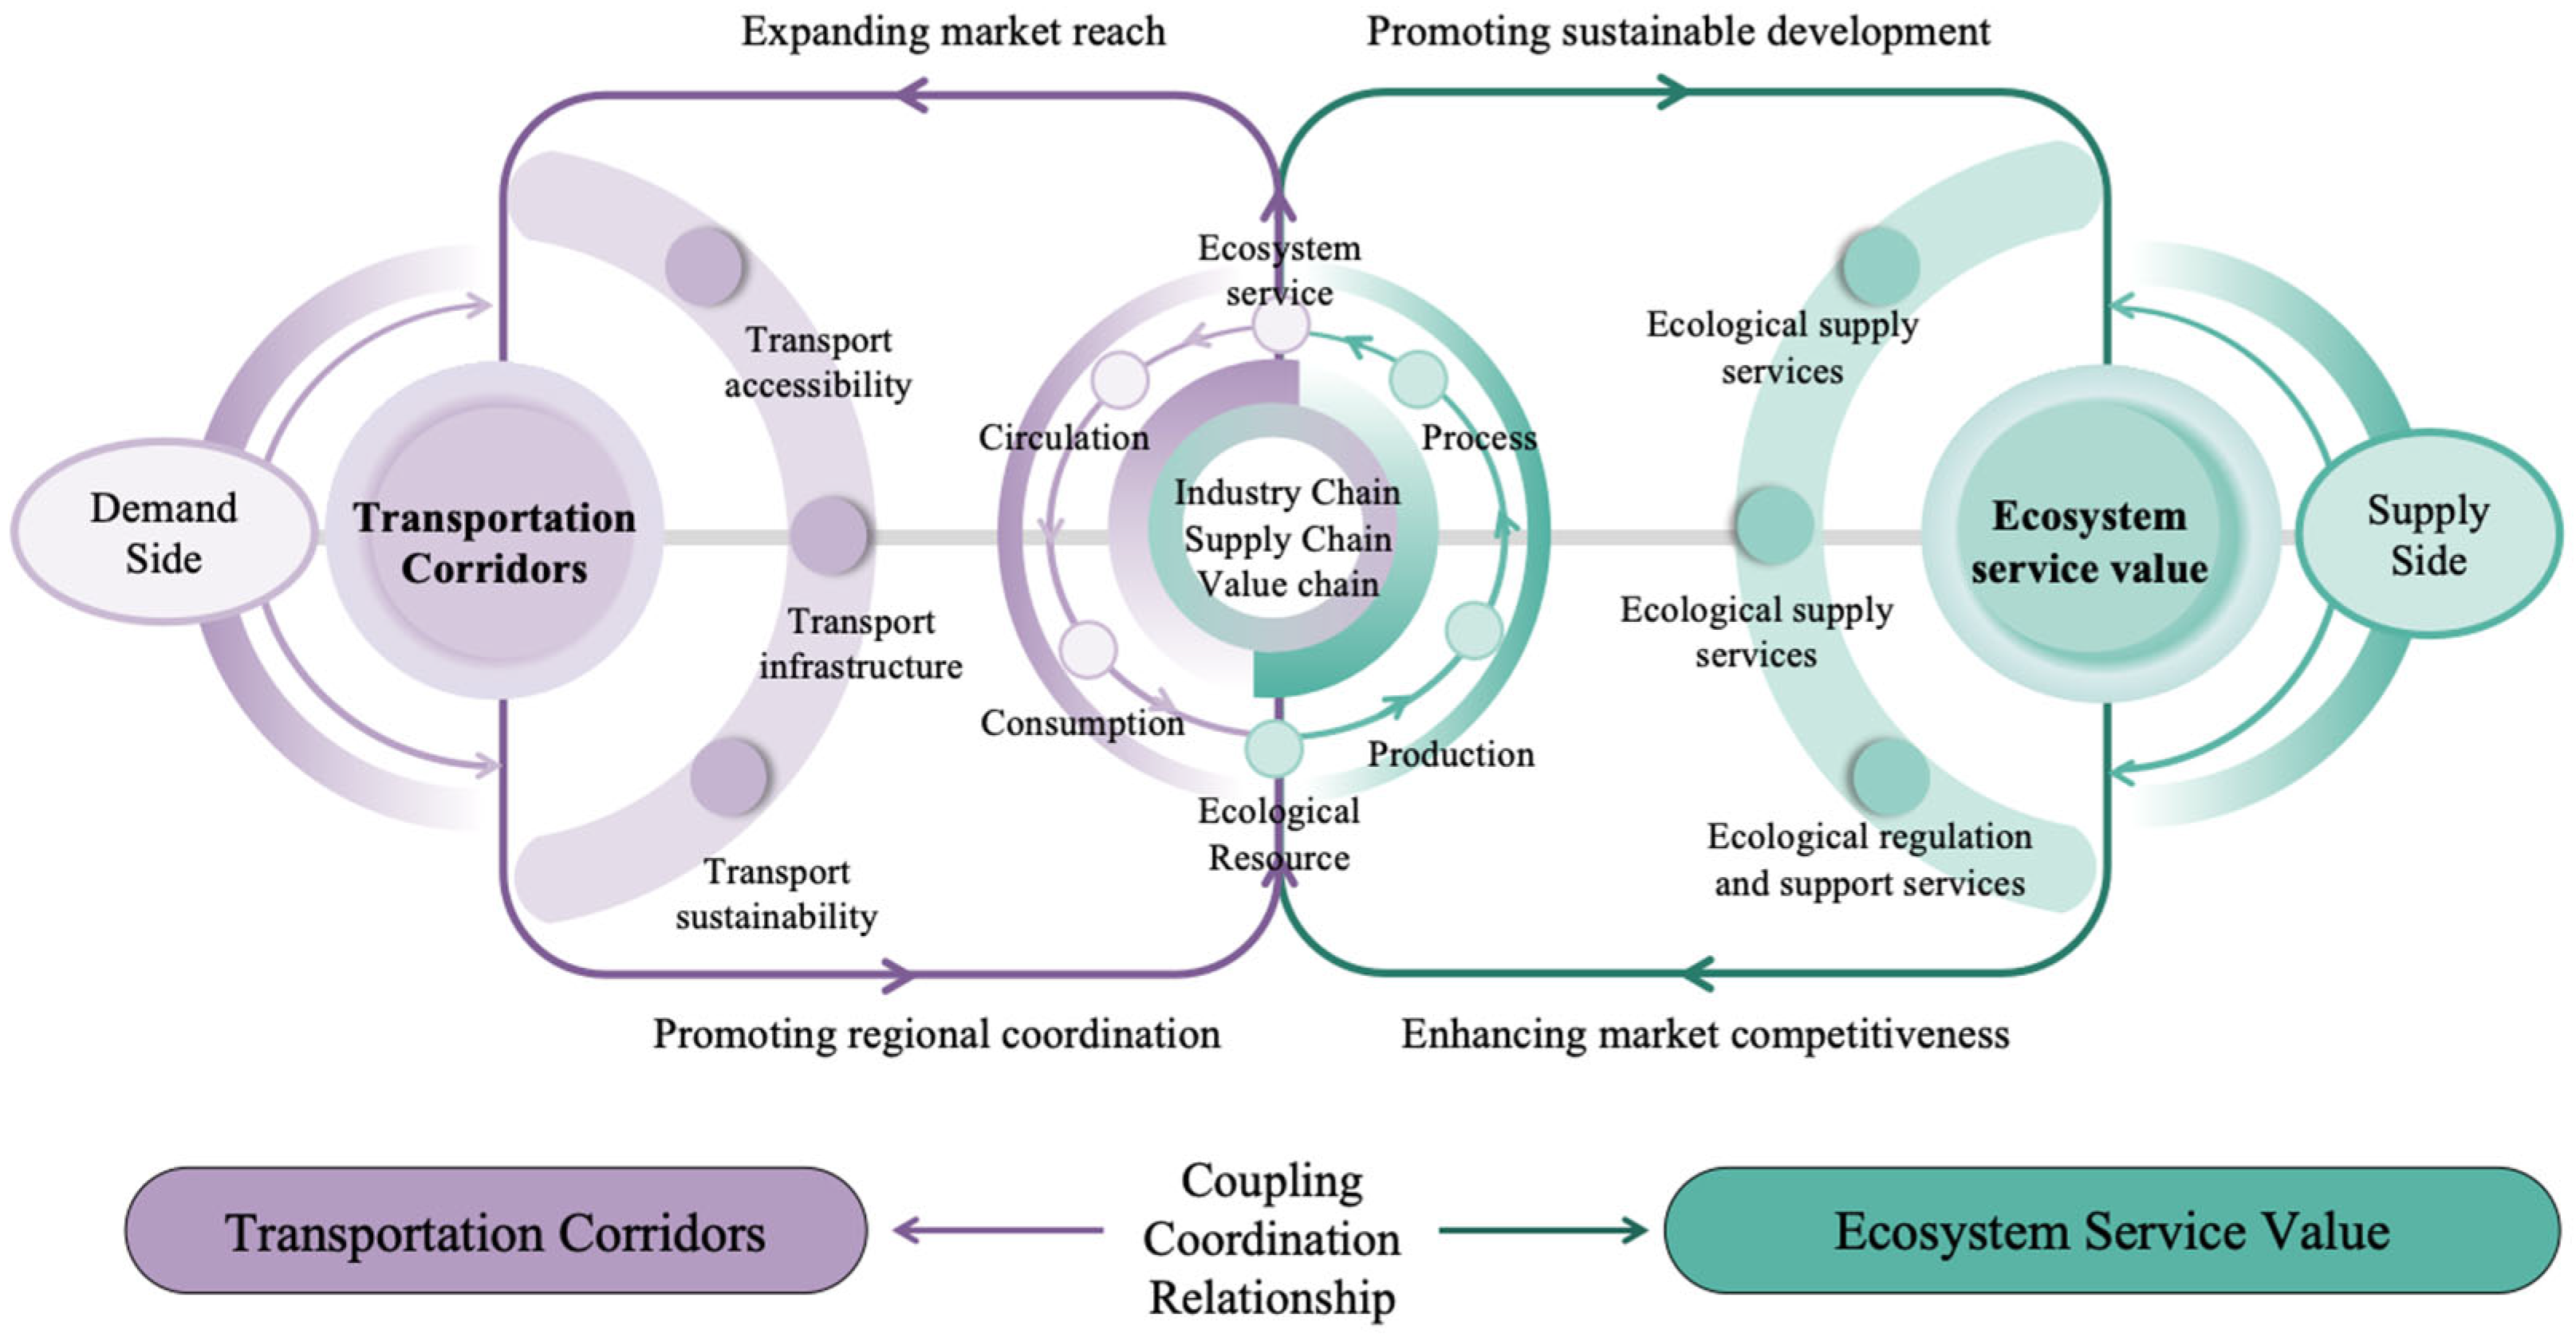
2.2. Theoretical Analysis

The intrinsic linkage between transportation systems and ecosystem services is widely recognised in academia [14]. Grounded in New Economic Geography and Spatial Economics theories [15], the TC-ESV relationship manifests in two dimensions.
Firstly, TCs play a crucial role in enhancing ESV. As networks facilitating the flow of key production factors, TCs are strategic national assets [16]. They serve as efficient physical carriers and information conduits for the production, processing, circulation, consumption, and value transformation of provisioning, cultural, and regulating services [17], facilitating the rapid transfer of ecosystem services from production areas to consumption markets. TCs support the efficient conversion of ecological resources into provisioning ecosystem services. The smooth flow of resource elements is essential to the input and output of ecosystem services [18]. National parks leverage these corridors as key media to integrate various stages—production, processing, logistics, and consumption—embedding ecosystem services within industrial, supply, and value chains [19]. The efficiency and cost constraints of these corridors are key factors in enhancing value realisation [20]. New Economic Geography emphasises transportation costs as a core variable in industrial location choices [21]. Efficient corridors reduce time–space distance and temporal costs, thereby improving circulation efficiency and market competitiveness [22]. Moreover, TCs unlock the potential and transmission effects of cultural ecosystem services [23]. Improved accessibility to ecotourism destinations allows more individuals to encounter and perceive ecological culture, adding new layers of value and promoting the inheritance and development of ecological culture within national parks. This shift transforms ecological cultural resources from static stock into dynamic assets. Improved accessibility creates opportunities for tourists, investors, and cultural enterprises. According to Spatial Interaction Theory [24], the relationship among interaction, distance, and regional attractiveness is central. TCs reduce “distance friction,” facilitating the flow of people, capital, and information into ecologically rich areas [25]. This boosts interaction frequency and promotes the capitalisation of resources. Given that ecological cultural resources are non-rival and non-excludable [26], regional transport networks help break spatial barriers, enabling the transmission of these resources to meet cultural demand and foster interactive exchanges, thereby optimising the cultural ecosystem service system of national parks [27]; Meanwhile TCs also enhance the supply efficiency and restoration capacity of regulating services. Green TCs reduce carbon emissions and noise pollution [28], thus improving ecosystem regulation. Eco-protective measures implemented during corridor construction—such as ecological bridges and wildlife migration corridors—enhance ecosystem connectivity and maintain biodiversity. These corridors serve as the “lifelines” of biodiversity and the “conveyor belts” for regulating services [28,29]. Through such corridors, species in national parks can effectively disperse and migrate [30], increasing the supply capacity of regulating services. TCs promote regional ecological cooperation and the establishment of optimised ecological compensation mechanisms. According to the Coase Theorem, market mechanisms can achieve optimal resource allocation. Ecological compensation can be achieved through the property rights definition of carbon sinks and interregional market transactions [31]. Efficient logistics and information flow further support the quantitative assessment and sustainable supply of regulatory ecosystem services.
Secondly, ESV significantly influences TCs and supports the coordinated development of the economy, society, and environment [32]. Economically, as ESV increases, there is a positive correlation with the expansion and upgrading of the transport industry chain. For example, increased demand for the upstream transport of ecological agricultural products drives the development of supporting industries such as cold-chain logistics. In the middle reaches, TCs enhance the accessibility and ecotourism value of the national parks, and ecotourism and experiential education stimulate new forms of business and modes of transport, such as passenger lines and sightseeing buses; in the lower reaches, ecotourism and experiential education stimulate new forms of business and modes of transport, such as passenger lines and sightseeing buses [33]. Downstream, the value chain relies on efficient logistics networks to enhance brand recognition and value-added services. The demand for ecotourism services also fosters diversified transport business formats, creating multiple points of economic growth. Socially, ESV contributes to improving livelihoods along TCs and enhances the comprehensive quality of the residents and permanent population of the national parks, and also strengthens the security capacity for value transformation. The production and transportation of ecosystem services stimulate the growth of related industries, provide employment opportunities [34], reduce the urban–rural income gap [35], and improve living standards [36]. As ESV increases, it further drives improvements in infrastructure and public services in corridor areas, offering more convenient travel and higher-quality living conditions, thereby enhancing regional connectivity and integration and significantly increasing residents’ quality of life and sense of well-being. Ecologically, the core of sustainable development theory lies in balancing economic growth with ecological protection, requiring development within the framework of conservation [37]. With the restoration and enhancement of ecosystem functions, transportation is shifting toward greener modes [38]. This includes the development of electric vehicles and rail transport to reduce carbon emissions and limit disturbance in ecologically fragile areas, thereby lowering land development intensity and expanding ecological spaces. The construction of ecological corridors and buffer zones protects wildlife habitats and migration routes [39], enhancing ecosystem carrying capacity and ensuring the sustainable supply of ecosystem services [40].
In conclusion, there is a tightly coupled, bidirectional co-constructive relationship between TCs and ESV. They mutually reinforce and co-evolve, jointly driving the sustainable development of national parks and the construction of ecological civilisation. The research framework illustrating this co-constructive relationship is shown in Figure 2.

2.3. Case Study on the Realisation of ESV in GPNP

The GPNP, as a landmark project in the construction of China’s ecological civilisation, embeds ecological resources in the value chain and industrial chain through transport corridors, transforming them into supply, cultural, regulatory, and support services. This achieves a virtuous cycle between ecological conservation and economic development [41], providing robust support for GPNP’s sustainability while setting new benchmarks for ecological civilisation.

2.3.1. Ecological Supply Services: TCs Contribute to the Upgrading of the Specialty Agricultural Industry Chain

The GPNP enhances standardised management and brand development, forming ecological industry clusters. Nine ecosystem services in its Chengdu sector—including loquat tea, “Chuan Panda” bamboo shoots, and Baoshan Ancient Shu black tea—have received “GPNP Original Ecosystem Service” certification. Leveraging natural resources, the GPNP develops high-value ecological supply services that efficiently reach markets via TCs, reducing logistic costs and transit time. For example, Pengzhou’s “Chuan panda” bamboo shoots generate a 40% profit increase through value-added processing. Concurrently, improved TCs facilitate product processing and distribution. In the Pingwu sector, the G8513 Expressway and rural logistics systems have reduced honey transportation time from mountainous areas to Chengdu from 3 days to 8 h, resolving logistical bottlenecks. These practices demonstrate that TCs, by integrating production, processing, circulation, and consumption chains, enable the efficient distribution of ecological agricultural products and handicrafts, drive sustainable local industries, and significantly enhance market competitiveness and economic returns of ecological supply services.

2.3.2. Ecological Regulation and Support Services: TCs Facilitate Low-Carbon Ecological Service System Development

The low-carbon transition of TCs is critical to realising the value of ecological regulation and support services. The GPNP advances low-carbon ecological service systems through multiple approaches. By constructing ecological corridors, the GPNP connects 33 fragmented wildlife habitats, enabling gene flow across geographic barriers. For instance, the original National Highway 108 once separated the Qionglai and Daxiangling giant panda populations, severely disrupting their activities. Through rerouting and tunnel construction, the GPNP has restored 68 km2 of vegetation across six corridors since 2020. These corridors enhance carbon sequestration capacity via vegetation restoration and soil conservation while promoting population connectivity. Additionally, green transportation initiatives positively impact GPNP ecosystems. In the Chengdu sector, traditional fuel vehicles previously contributed to air pollution. To reduce emissions, the sector has progressively adopted new energy vehicles, lowering exhaust emissions and improving air quality, thereby providing greener habitats for giant pandas and other wildlife. The GPNP leverages its natural carbon sink advantages to explore ESV conversion mechanisms. For example, Baoxing County developed a 4467 km2 forest carbon sink project, projected to generate 3.312 million tons of emission reductions over 27 years, with an annual revenue reaching 20 million yuan. These practices show that the GPNP has made significant progress in ecological regulation and support for value realisation.

2.3.3. Ecological Cultural Services: Accessibility Reshapes the Ecotourism Experience

The optimiatsion of transportation accessibility in the GPNP has reshaped ecological tourism experiences, driving a transition from traditional resource-dependent industries to eco-friendly models. Through the construction of special ecotourism routes, viewing platforms, and cultural experience facilities, tourists are able to gain a deeper understanding of the unique eco-culture and natural landscape of the GPNP, which enhances the dissemination and influence of ecological cultural services. Leveraging the Giant Panda IP, premium ecological landscapes, and improved TCs, the GPNP pioneers an integrated “ecology + cultural tourism” development model. For instance, Chengdu’s Panda Xiangshan Scenic Area integrates mountain and water resources to develop family friendly experiences and mountain sports, boosting local agricultural sales by 25%. Dujiangyan Area develops forest recreation and special lodging, launches study tourism projects, and receives more than 500,000 tourists annually. Collaborations with cultural tourism groups in Chengdu advance projects that blend nature education and ecotourism. The data show that by 2024, the annual output of ecological tourism exceeded 3 billion yuan, demonstrating the efficacy of diversified strategies for ESV realisation.
GPNP’s practices prove that optimised and innovative TCs enable deep mutual construction between transportation networks and ecosystems. TCs are not merely physical connectors but vital mediators for ESV conversion. By accurately matching the logistical needs of provisioning services, the low-carbon requirements of regulating and supporting services, and the experiential characteristics of ecological and cultural services, it not only enhances the transformation efficiency of the value of ecosystem services, but also provides valuable experience and innovative ideas for the ecological protection and sustainable development of national parks around the world.

2.4. Data Sources and Collections

This study focuses on 27 counties within the GPNP from 2018 to 2022. Beichuan, Anzhou, and parts of the Wudu district were excluded due to data unavailability. Land use data were obtained from the China Land Cover Dataset (CLCD) by Wuhan University, categorised into cultivated land, forest, grassland, shrubland, wetland, water bodies, and bare land. Transportation data were sourced from the China County Statistical Yearbook (2018–2022) and the official website of the Ministry of Transport. Agricultural product prices, cultivation areas, and related data were collected from the China Statistical Yearbook (2018–2022) and provincial statistical yearbooks of Sichuan, Shaanxi, and Gansu.

2.5. Construction of the Indicator System

The TC indicator system is constructed across three dimensions: transport accessibility, transport infrastructure, and transport sustainability (as detailed in Table 1).In the dimension of traffic accessibility, it focuses on the road network density and the distance from the provincial capital city to measure the degree of regional traffic convenience; the dimension of traffic infrastructure covers the road area, land for road infrastructure, land for logistics and warehousing, reflecting the ability to support the hardware; the dimension of traffic sustainability focuses on the evaluation of the level of green traffic and low-carbon development through the indicators of carbon emission intensity, greening coverage rate, pm2.5,. The three dimensions support each other, forming a comprehensive evaluation system that takes into account efficiency, quality, and ecology, and provides a scientific basis for optimising transport corridor planning [42,43,44,45]. The TOPSIS entropy weighting method was applied to calculate indicator weights (Table 1).

2.6. Research Methods

2.6.1. TOPSIS Entropy Weighting Method

This study employs the TOPSIS entropy weighting method to measure TC development levels. This improved approach combines entropy weighting to objectively determine indicator weights, avoiding subjective bias, with the TOPSIS method to rank evaluation objects based on their proximity to ideal solutions, generating comprehensive evaluation results. All statistical analyses and indicator calculations were performed using Stata 16.0. The calculation steps are as follows.
Carry out data standardisation and normalise the evaluation indicators through the method of extreme value standardisation, i.e., express the difference between the actual value of the evaluation indicator and the lowest value of the indicator and the ratio of the extreme difference of the indicator, and the ratio obtained can reflect the relative position of the actual value of the evaluation indicator in its weights. The calculation formula is:
Y i j = X i j min X i j max X i j min X i j
Y i j = max X i j X i j max X i j min X i j
In Equations (1) and (2), (1) is the formula used for calculating positive indicators; (2) is the formula used for calculating negative indicators; X i j and Y i j denote the original and standardised evaluation indicators, respectively; and max X i j and min ( X i j ) denote the maximum and minimum values of X i j , respectively. After the standardisation process, the matrix W is constructed.
Determine the weights of the indicators and construct the entropy weight decision matrix. Determine the indicator weights using the entropy weighting method, and determine the weights of each indicator W = ( W 1 , W 2 , …, W j ). Creating a weighted normalisation matrix:
V = B  ×  W ,   V = v 11 V 12 v 1 n v m 1 V m 2 v m n
Determining Positive Ideal Solutions and Negative Ideal Solutions
Positive Ideal Solution:
V + = max V ij | i = 1,2 , , n = V 1 + , V 2 + , , V n +
Negative Ideal Solution:
V = min V ij | i = 1,2 , , n = V 1 , V 2 , , V n
Calculate the Euclidean distance of each indicator to the positive and negative ideal solutions, where the Euclidean distance of the indicator to the positive ideal solution V +   is D j + , and the distance to the negative ideal solution V is D j .
D j + = i = 1 m V i + V ij 2
D j = i = 1 m V i V ij 2
Calculate the degree of proximity, often expressed as T j , which characterises the degree of proximity of the indicator to the optimal solution, with a value in the range of [0, 1], so that the size of the transport corridor can be ranked and evaluated according to this index.
T j = D j D j + + D j

2.6.2. Accounting for the Value of Ecosystem Services

Building on Costanza et al.’s foundational work [46], Xie Gaodi et al. [25] established China’s ESV equivalent table through surveys of over 200 Chinese ecologists. This study adopts Xie’s ecosystem service classification system, categorising services into four types: provisioning, regulating, supporting, and cultural services. These are further subdivided into 11 functional categories: food production, raw material production, water supply, gas regulation, climate regulation, environmental purification, hydrological regulation, soil retention, nutrient cycling maintenance, biodiversity, and aesthetic landscapes.
There are differences between the 2018–2022 CLCD land use data from Wuhan University used in this study and the ecosystem classification criteria proposed by Xie Gao Di et al. Therefore, the land use types were reclassified (Table 2). Impervious surfaces were excluded due to data unavailability. Snow/ice and water systems, whose ecological service values align closely with water bodies, were assigned equivalent coefficients based on the mean values of secondary ecosystem value coefficients [47]. Additionally, equivalent coefficients and standardised values in the model were adjusted to reflect regional conditions.
According to Xie Gao Di’s unit area value equivalent factor method and combined with the geographical characteristics and actual situation of the GPNP, this paper adopts the net value of grain, which is the actual value of grain minus the value of the production costs. After calculation, it is defined as 1/7 of the value of the grain yield, which is adjusted to the economic value of the sown area and production value of rice, maize, and wheat in the GPNP area, taking into account the importance of the crops in the park. The economic value of a specific unit area of grain output is calculated, as shown in (9):
E t = 1 7 × T t X t
E t Indicates the economic value of food production per unit area; T t Indicates the total annual value of food in the study area.
X t Indicates the annual area sown with grain in the study area. Apply Formula (9)’s statistics to get the statistical table of economic value per unit area of the GPNP from 2018 to 2022, which is shown in Table 3.
In this paper, we consider the correction of regional variability coefficients at the regional scale, using the net primary production potential (NPP) instead of biomass, and the ratio of the natural vegetation NPP value of a certain type of vegetation in the bioproductivity indicator to the average NPP of all types of vegetation for the coefficients of regional variability of ecosystem services ( Q t ) with the following specific formulae.
Q t = N P P N P P m e a n
Q t Indicates the regional coefficient of variation for year t; NPP indicates the net primary production potential of natural vegetation; N P P m e a n represents the average net primary productivity (NPP) of all vegetation types. Predictions of the NPP were made using the Thornthwaite Memorial model.
NPP = 3000 1 e 0.000969 Z 20
Z = 1.05 R 1 + ( 1 + 1.05 R / H ) 2
H = 3000 + 25 t + 0.05 t 3
Z denotes the actual evapotranspiration in the study area in one year; e denotes the natural constant; H denotes the average evapotranspiration in the study area in one year; t denotes the average air temperature in the study area in one year; and R denotes the total precipitation in the study area in one year. Based on Equations (11)–(13) and the actual evapotranspiration, average temperature, and annual precipitation in the GPNP in 2018, the NPP values and regional coefficients of variation in the GPNP were calculated, as shown in Table 4.
According to Wilson et al. [48], the size of the value is closely related to the stage of social and economic development. The coefficient of the social development stage reflects the relative level of people’s willingness to pay for ecological value under the socio-economic level and people’s living standards. Therefore, this paper proposes to use the social development stage coefficient to modify the measurement of ecological service value for the GPNP. The development process of the social development stage coefficient is very similar to that of the biological growth process, so the Peel growth curve (S curve) model can be used to characterise this development trend, and the specific calculation formula is as follows.
l = L 1 + e 1 E n 3
L denotes the coefficient of the social development stage related to the real willingness to pay; L denotes people’s willingness to pay in the case of extreme wealth, which will take the value of 1; e is a natural constant; E n denotes the Engel’s coefficient. When calculating the coefficient of Engel’s coefficient, and then its corresponding urban development stage coefficient and rural development stage coefficient, then, the comprehensive development coefficient of the GPNP is:
l = l 1 W 1 + l 2 W 2
l 1 represents the coefficient of social development of towns and cities. W 1 denotes the share of the urban population. l 2 Indicates the coefficient of rural social development. W 2 denotes the proportion of the rural population. According to the social development coefficient Equations (14) and (15), to calculate the social development stage coefficient of the GPNP and calculate the social development correction coefficient of the GPNP, see Table 5.
In 2018–2022, the average food production in the GPNP was 531.89 kg/ h m 2 , and the average food price was RMB 2.319/kg, so the value of one ecosystem service in the GPNP equivalent factor is RMB 0.15/ h m 2 . The formula for calculating the value of ecosystem service in the GPNP is:
ESV = A k · V C k · D t · Q t
E S V f = A k · V C k · D t · Q t
V C k = ( V C f k )
ESV represents the total ecosystem service value of the study area, and A k is the area of land use type k. VC k is the coefficient of the ecosystem service value per unit area for land use type k. E S V f is the value of ecosystem service function f. V C f k is the value coefficient of the fth service function for land use type k (Table 6). Table A1 shows the value of the ecosystem service within the GPNP area.

2.6.3. Coupling Coordination Degree Evaluation Model

Drawing on Zi Tang et al.’s research [49], this study employs a coupling coordination degree model to evaluate the coordinated development between TCs and ESV. The model comprises two components: a coupling degree model and a coordination degree model. The coupling degree model quantifies the intensity of interactions between systems but cannot distinguish whether such interactions occur at high or low developmental levels. Thus, the coordination degree model is introduced to reflect both the interaction intensity and the synergistic development level. The coupling degree is calculated as:
C = 2 U 1 × U 2 ( U 1 + U 2 ) 2
C represents the degree of coupling; U 1 , U 2 ,   represents the level of TC development and the level of ESV, respectively. The value range of the coupling degree is [0, 1]; the more the index tends to be close to 1, which indicates that the higher the degree of coupling between the two, and vice versa, indicating that the lower the degree of correlation between the development of the two and the emergence of disordered development trend. The coordination degree calculation formula is:
D = C × T     T = α U 1 × β U 2
T represents the comprehensive coordination index of TCs and ESV; a and β are the coefficients to be determined. This paper considers that the development of TCs and the realisation of ESV are equally important, so it makes α = β = 0.5; D represents the degree of coordination of the two systems coupling, and the range of the value is [0, 1]; the higher the value of D, the higher the degree of coordination of the coupling and the more coordinated development of the two systems, and vice versa.
The TC-ESV coupling coordination is categorised into four phases: (1) Dysregulation Phase (0 ≤ D < 0.4): Low coordination with potential mutual constraints. (2) Transition Phase (0.4 ≤ D < 0.6): Moderate coordination with emerging synergies. (3) Adaptation Phase (0.6 ≤ D < 0.8): Balanced coordination with stable interactions. (4) Harmonisation Phase (0.8 ≤ D ≤ 1): High coordination, achieving an ideal state of mutual reinforcement.

2.6.4. Local Spatial Autocorrelation

Tobler’s First Law of Geography states that spatial attributes exhibit dependence [49], manifesting as clustered, random, or regular patterns. Local spatial autocorrelation analysis identifies localised spatial dependencies of specific variables. To examine the spatial clustering of TC-ESV coupling coordination, this study applies the local Moran’s I index, which quantifies the correlation between each spatial unit and its neighbours. This method reveals whether high- or low-coordination values cluster spatially [50], providing insights into regional heterogeneity. The local Moran’s I is calculated as:
I i = y i y ¯ j = 1 n ( y i y ) ¯ S 2
S   2 represents the sample variance; n represents the number of regions; W i j represents the spatial weight matrix. In this paper, we adopt the 0–1 neighbour matrix; if region i and region j have a common boundary or node, W i j = 1; conversely, W i j = 0. When I i   is positive, it means that the high (low) value of region i is surrounded by the surrounding high (low) values; conversely, a negative I i indicates spatial dissimilarity, where high-value regions are primarily surrounded by low -value neighbors (high-low clustering), or low-value regions are mainly adjacent to high-value areas (low-high clustering).

3. Results and Analysis

3.1. Spatio-Temporal Characterisation of the Level of Development of TCs in GPNP

The 2018–2022 heatmap of TCs in the GPNP (Figure 3) visually depicts the spatial-temporal variations in transportation activity density and frequency. In the time dimension, the transport access level scores of the districts and counties within the GPNP show an increasing trend from 2018–2022, indicating gradual improvements in overall TC infrastructure and enhanced transportation capacity. The evolution shows phased characteristics: rapid growth from 2018 to 2020, followed by stabilisation from 2020 to 2022. Since the GPNP’s formal establishment in 2021, TC levels surged overall, though regional fluctuations persisted. For example, Dujiangyan City’s score dropped from 0.613 in 2020 to 0.564 in 2021 before slightly recovering to 0.568 in 2022, which was likely influenced by annual variations in infrastructure project progress and policy implementation efficacy. Similarly, Chongzhou City experienced a decline from 0.523 in 2020 to 0.458 in 2021, with subsequent recovery failing to reach prior peaks. The growth rates also varied significantly: Pengzhou City achieved a notable increase of 0.084 from 2018 to 2022, while Pingwu County saw relatively limited growth, rising from 0.120 to 0.128, reflecting disparities in regional TC investment and outcomes.
In the spatial dimension, there are significant differences in the ratings between counties in each of the years 2018–2022. Economically developed regions generally exhibited higher TC scores than underdeveloped areas. For instance, Mianzhu, Pengzhou, Shifang, Chongzhou, Dayi, and Dujiangyan consistently maintained high scores during 2018–2022, reflecting their robust economic development, larger populations, abundant tourism resources, advanced infrastructure, and strong regional attractiveness, which likely contributed to superior transportation infrastructure and service capabilities. Conversely, 21 underdeveloped counties, like Qingchuan and Ningshan, scored lower, indicating lagging TC development due to constraints such as geographic barriers, weak economic foundations, and inadequate transportation infrastructure. Proximity to provincial capitals or major transport hubs also correlated with higher TC levels. For example, districts and counties close to Chengdu, such as Dayi County and Chongzhou City, have higher ratings than Songpan County and Jiuzhaigou County, which are far away from the centre of the city, for the period 2018–2022. Industrial-oriented counties (e.g., Pengzhou) demonstrated higher and more stable TC growth, while ecotourism-dependent counties (e.g., Jiuzhaigou) showed gradual but comparatively lower improvements. Overall, most counties in the GPNP have achieved relatively sound TC development, where enhanced transportation conditions facilitate ESV realisation across the production, processing, circulation, and marketing stages, effectively converting ecological resources into ecosystem services and advancing ecological civilisation.

3.2. Characterisation of the ESV of GPNP

The ESV of the GPNP in 2018–2022 was 1.957, 1.978.0, 2.079.8, 2.053.9, and 2.059 million yuan, respectively. Among them, it increased by 1.22 million yuan from 2018 to 2020, peaked in 2020, and increased by 60,000 yuan from 2021 to 2022, showing a trend of growth followed by a decline. The increase in the ESV of the GPNP from 2018 to 2022 indicates that during the five-year period, the national park’s active implementation of pollution control measures, ecological protection policies, and ecological compensation mechanisms has led to gradual environmental improvement and stabilized development trends. Calculated by dimension (Table 7), supply services increased by 5.0% in 2022 compared to 2018, regulating services increased by 5.0%, support services increased by 5.8%, and cultural services increased by 5.7%. In 2018–2022, regulating services formed the largest share of ecosystem service value in the GPNP, with climate regulation, water regulation, environmental purification, and gas regulation collectively representing about 70% of total ESV and showing the fastest growth rates. Among them, climate regulation and water regulation grew by about 5.8 per cent and 3.4 per cent, respectively. Support services continued to strengthen, with soil conservation, nutrient cycling, and biodiversity growing by nearly 8%, reflecting the park’s increasing investment in ecological restoration and protection. Provisioning and cultural services have steadily improved, and the value of provisioning services and aesthetic landscapes, though accounting for a relatively small proportion, reflects the potential of ecotourism and special agricultural and forestry products for ecological industrialisation and utilisation.

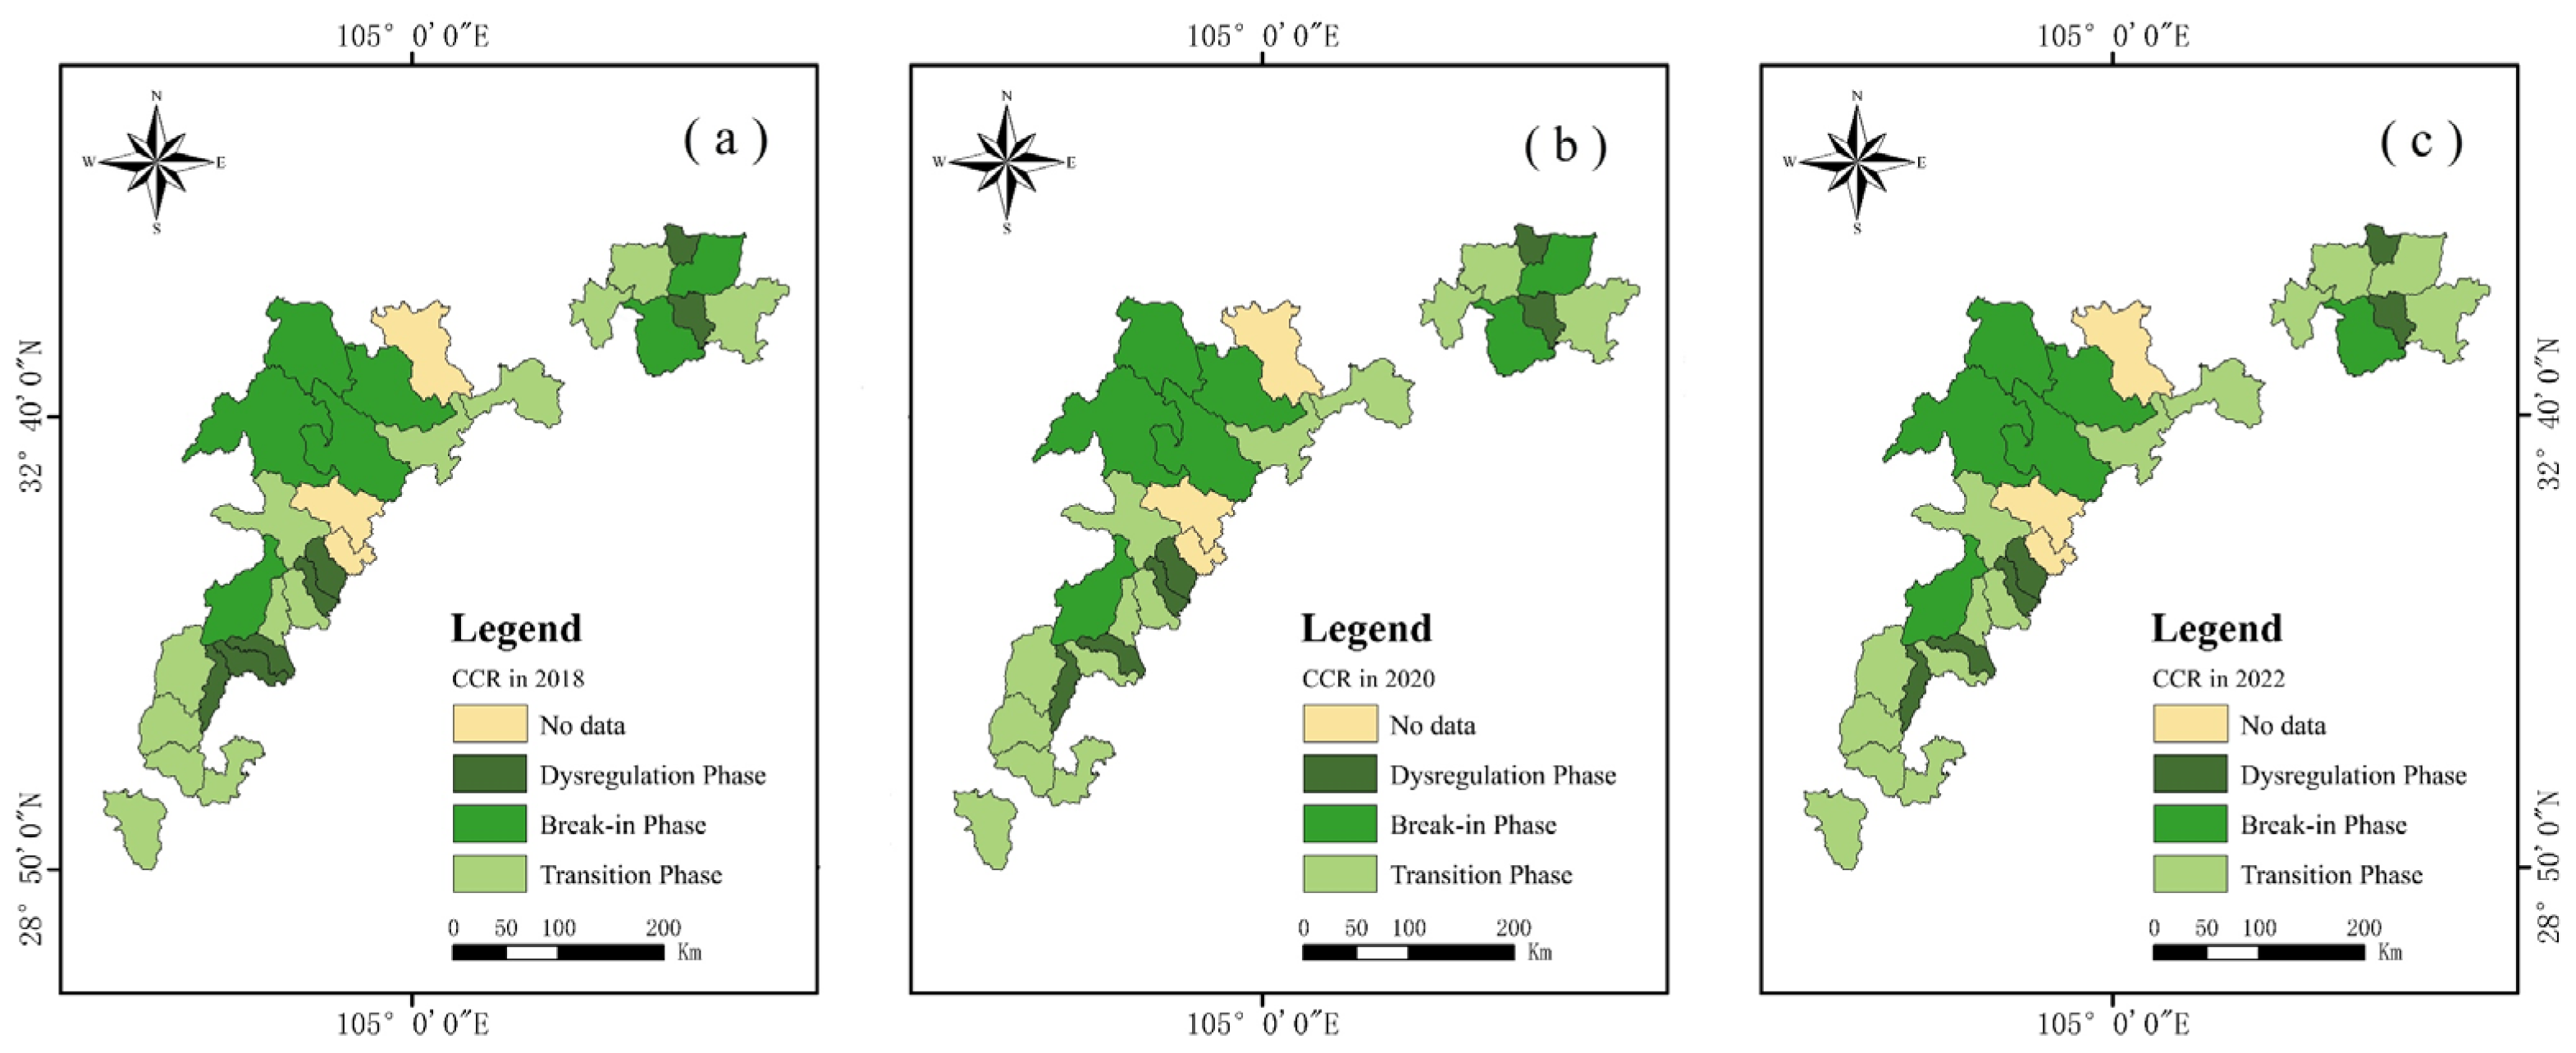
3.3. Characterisation of the Spatial and Temporal Coordination of the Coupling of TCs and ESV

The coupling coordination between TCs and ESV in the GPNP evolved from significant misalignment to fundamental coordination during 2018–2022. From 2018 to 2019, during the initial phase of ecological conservation investments, transportation networks were underdeveloped, resulting in widespread dysregulation between TCs and ESV. Between 2020 and 2022, the commissioning of major highways and high-speed rail lines triggered exponential growth in coupling degrees, with an increasing number of counties transitioning into the harmonisation phase. This progression underscores the emergence of synergistic effects, marking the initial formation of a coordinated development framework between ecological and transportation systems. All spatial analyses and mapping were performed using ArcGIS ArcMap 10.8.
According to the evaluation model of the coupled coordination degree of TCs and ESV in the GPNP, the results of the coupled coordination degree of TCs and ESV in the GPNP were calculated (Figure 4). Overall, there is a close relationship between TCs and ESV, and ESV is the key driver of coordination, and it is easier to achieve coordination in high ecological score districts and counties. Transport monopole development districts and counties have a low degree of coordination and need to balance development and protection.
In the time dimension, between 2018 and 2022, the coupling coordination degree of TCs and ESV showed significant differences in different districts and counties. The number of districts, counties, and municipalities in the dislocation stage decreased from 7 in 2018 to 6 in 2022, and most districts and counties are still in the transition stage. The districts and counties in the dislocation stage are mainly located in the northeastern and southwestern regions of the GPNP, and the districts and counties in the dislocation stage were mainly distributed in the northeastern and southwestern regions in 2018. The areas in the dislocation stage include Chongzhou City, Dayi County, Foping County, Lushan County, Meixian County, Mianzhu City, and Shifang City. Dayi County stepped out of the dislocation stage into the transition stage in five years; the regions that were already in the transition stage in 2018 remained basically unchanged in the three years of 2018, 2020, and 2022, with no stage breakthroughs into the next stage, and were still in the transition stage; and the regions that were in the transition stage in 2018 and after 2020 still did not have breakthroughs into the next stage. The areas in the breakthrough stage are distributed in the central, northwestern, and northeastern parts of the GPNP, mainly Songpan County, Jiuzhaigou County, Pingwu County, Wen County, Wenchuan County, and Yang County, which belong to the Minshan Area (Sichuan Province), the Baishuijiang Area (Gansu Province), and the Qinling Area (Shaanxi Province), the coordination level remained stable during 2018, 2020, and 2022. Notably, Zhouzhi County, which was in a largely coordinated state in both 2018 and 2020, fluctuated in 2022, retreating to a transition state on the verge of dissonance. Songpan County, as a typical high-coordination region, had an ecological value score close to 1 over five years, and the TC score increased from 0.170 to 0.181, with the balanced development of the two maintaining a ‘basically coordinated’ state, and the synergistic development of ecological protection and TCs is relatively satisfactory. In contrast, Meixian County, which has a weak ecological foundation, has long been in ‘serious dislocation’, with its ecological value score never exceeding 0.0062, and fluctuating slightly over the five-year period, but not much, and decreasing and then increasing, and ultimately falling slightly short of the base year of 2018. For Meijian County, lagging ecological protection severely constrains coordination improvement. Some districts and counties have achieved improvements through policy interventions, such as the increase in the ecological value score of Wen County from 0.506 to 0.518, which verifies the effectiveness of ecological restoration measures. However, in Shifang City, the degree of coordination is always at a low level, and two showed significant imbalance, with consistently near-zero ecological scores but substantially higher TC scores, and it will still be at the ‘extremely out-of-phase’ stage in 2022, which may be due to the more developed industrial economy in the area and the more serious ecological damage, which highlights the arduousness of ecological restoration.
In the spatial dimension, the degree of coupling coordination shows obvious regional differences. In the western mountainous areas, such as Songpan, Jiuzhaigou, and Pingwu counties, relying on high ecological value and moderately developed transport systems, an ‘ecologically oriented’ coordination pattern is formed, with the coordination stage stabilised at ‘basic coordination’ or ‘barely coordinated’. The coordination stage is stable at ‘basic coordination’ or ‘barely coordinated’. The eastern plains and some hilly areas and counties are exposed to outstanding problems: Pengzhou City’s transport access score in 2022 was as high as 0.722, but its ecological score was only 0.045, and the overdevelopment of transport has led to a long-term ‘near-disorder’. Yangxian County, Wenchuan County and other regions have achieved ‘barely coordinated’ coordination through the simultaneous improvement of transport and ecological scores. Yangxian County and Wenchuan County have achieved ‘barely coordinated’ through the simultaneous improvement of transport and ecological scores, indicating the feasibility of a balanced development path. In contrast, fluctuations in coordination in Zhouzhi County and other districts and counties reveal the potential threat of ecosystem vulnerability to long-term coordination. Songpan and Jiuzhaigou counties, located in the ecological priority zone, should maintain the existing ecological protection efforts and moderately optimise transport facilities. Baoxing County and Dujiangyan City, located in the transition zone, should strengthen the synergy between ecological restoration and transport planning to avoid overdevelopment. Meixian County and Shifang City, which are located in the dislocation zone, should prioritise the enhancement of ecological values, adjust the layout of TCs, and introduce green development policies.
The coordination level of districts and counties within the GPNP varies significantly, and ecological value is the core factor determining the coordination level. In the future, it is necessary to formulate differentiated strategies for districts and counties at different stages of coordination, and to promote a dynamic balance between ecological protection and infrastructure construction.

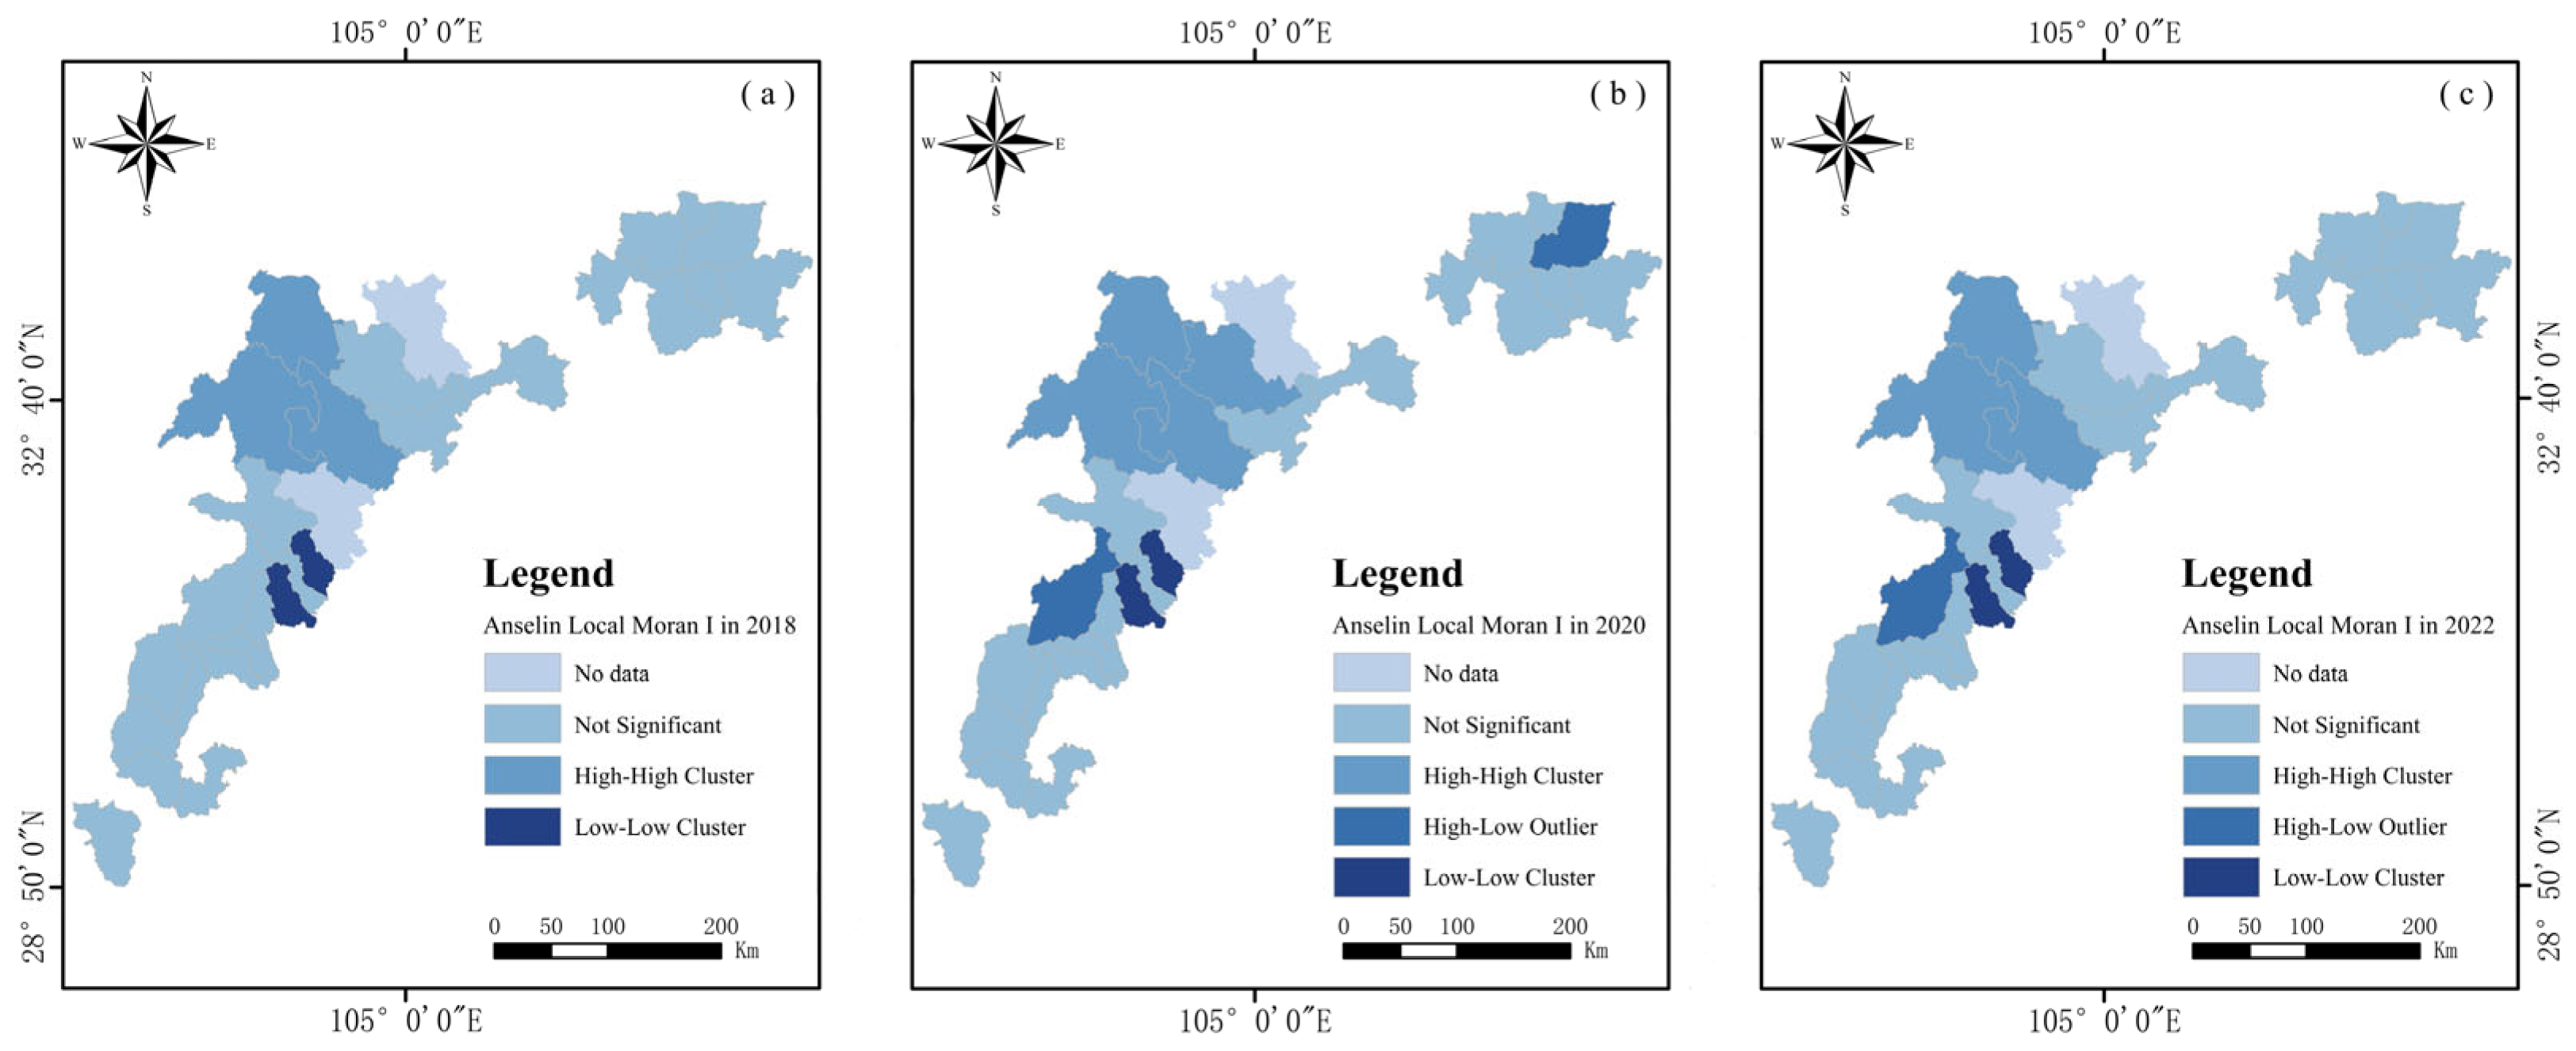
3.4. Local Spatial Autocorrelation Analysis

To further investigate the localised spatial relationships of TC-ESV coupling coordination, local spatial autocorrelation analysis was applied to assess the spatial patterns within the GPNP. According to the test results of local Moran’s I (Figure 5), for the degree of coordination of the coupling of TCs and ESV in the GPNP, the high-high agglomeration area was mainly concentrated in the central area of the GPNP, covering Pingwu County, Songpan County, Jiuzhaigou County, and Wen County. The first three counties maintained stable coordination levels throughout 2018-2022, while Wen County exhibited significant coordination only in 2020. The high–low catchment area showd significant variations across these three years: in 2018, there is no high–low catchment area; in 2020, the high–low catchment area is distributed in the northeastern and southwestern regions of the GPNP, covering Zhouzhi County and Wenchuan County; in 2022, the high–low catchment area was distributed in the southwestern region of the GPNP, covering Wenchuan County. In these three years, there is no low–high agglomeration area in the coupled coordination of TCs and ESV in the GPNP. The low–low agglomeration area is distributed in the south-central region of the GPNP, covering Pengzhou City and Mianzhu City, and it has not changed in these three years, indicating that the coordination capacity between TCs and ESV in these two areas has changed slightly. Except for the above catchment areas, all other counties were non-significant areas in these three years, indicating that the coupling coordination degree of these areas had no obvious spatial correlation with that of the neighbouring areas.
An analysis of the 2018–2022 local spatial autocorrelation results in the GPNP reveals distinct mechanisms across three cluster types: First, high–high (H-H) clusters, such as Pingwu, Songpan, Jiuzhaigou, and Wen counties, benefit from the radiation-driven effects of major 5A-level natural attractions like the Jiuzhaigou Scenic Area, where strong ecological conservation measures result in significantly higher coverage of cultivated land, forests, and shrubland compared to other counties, yielding a superior ESV. Tourism development, supported by robust TC infrastructure, reinforces the H-H clustering, necessitating strategic expansion of cultural tourism industries to consolidate these clusters. Second, high–low (H-L) clusters, exemplified by Zhouzhi and Wenchuan counties, exhibit moderate ESV and TC performance, creating spatial disparities with neighbouring regions. External shocks (e.g., ecological or infrastructural disruptions) may exacerbate these gaps, hindering coupling coordination. Third, low–low (L-L) clusters, concentrated in Pengzhou and Mianzhu counties, suffer from chronic low TC-ESV coordination due to imbalanced development priorities. Key transport infrastructure, such as the Chengdu-Pengzhou Expressway, Chengdu-Mianyang Expressway Expansion, and Chengdu-Mianyang-Leshan Intercity Railway, enhances connectivity but intensifies urban–ecological conflicts, suppressing ESV and hindering synergies between TC development and ecological value realisation. These findings underscore the need for differentiated strategies to address spatial heterogeneity in TC-ESV coordination.

4. Discussion

4.1. Discussion of the Multiple Relationships Between TCs and the Realisation of ESV

TCs play a dual role in the realisation of ESV, not only as a physical vehicle for the circulation of ecological services, but also as an important medium for the interaction between ecological value transformation and ecosystem protection. Different national parks around the world show diverse patterns of interaction, which are mainly influenced by geographic conditions, policy orientation, and development stages. TCs enhance the accessibility and ecotourism value of national parks. In Yellowstone National Park in the United States, there is a synergistic relationship between TCs and ecotourism. With the help of an efficient transport system, the park improves accessibility and diverts visitor pressure, thus reducing disturbance to core ecological areas. Driven by the increasing demand for ecotourism, green transport facilities are also optimised, realising a virtuous circle where ecotourism feeds back the green transformation of the transport system, presenting a model of value transformation and transport upgrading in the context of sustainable development [51,52].
TCs for the outward transport of ecosystem services. The Norwegian Fjords National Park, on the other hand, demonstrates the path of ecological protection and value realisation, driven by technological innovation. With green technology at its core, the region has built intelligent, low-impact transport networks, such as glacier-viewing railways and glass ferries, which have successfully transformed natural landscapes into high-value-added cultural tourism products. For example, the Flåmsbana railway, which uses toothed-rail railway technology to traverse steep gorges, receives more than 1 million visitors a year and drives the development of peripheral industries such as B&Bs and handicrafts. The electric ferry Hareid-Sulesund reduces carbon emissions by 7000 tonnes a year [53], balancing environmental protection with the visitor experience [54].
The practice of the GPNP reflects a unique logic of interaction. As China’s first national park that focuses on a single flagship species while also taking into account the protection of the ecosystem and optimisation of the transport network in the whole region, the process of realising the value of its ecosystem services is highly dependent on the accessibility of TCs and the environmental friendliness of these corridors. Giant panda habitats are mostly located in the Minshan-Qionglai mountain system, with fragmented terrain and poor traffic. In addition, TCs of the GPNP promote the exchange of personnel, enhance the comprehensive quality of the residents and permanent population of the national park, and strengthen the guaranteed capacity of value transformation. In this context, transport access is not only the key guarantee for ecological resource protection, but also the basic support for ESV realisation. Through the adaptive design of infrastructure to achieve a dynamic balance between ecological protection and value transformation, it directly affects the market transformation capacity of ecological resources and the balance of regional development.

4.2. Discussion of the Results of the Study on the Value of TC and Ecosystem Services

We calculated the value of the ecosystem services and the development level of TCs in the GPNP, as well as the coupling and coordination relationship between the two. It can be found that the value of the ecosystem services and the development level of TCs are closely linked and influence each other. It is possible to dig deeper: areas with high ESV are often in more economically developed and conveniently accessible counties, while in remote and economically backward areas, ecological resources are limited by transport bottlenecks, making it difficult to efficiently enter the market. For example, poor transport constrains the development of ecotourism, and the sightseeing, experiential, and cultural transformation functions of ecological resources are not fully unleashed, leading to less efficient realisation of ESV. In addition, transport infrastructure development may also often be skewed in favour of areas with better economic conditions, making remote regions less involved in the supply chain of ecosystem services, reflecting the increased spatial mismatch between the supply and consumption of ecosystem services. This pattern of imbalance is not conducive to synergistic regional development and weakens the ability of national parks, as a whole, to sustain the output of ecosystem services.

4.3. Discussion on Limitations and Future Research Prospects

This study provides an important empirical foundation for the synergistic development of ESV and TCs in the GPNP, but it needs to further break through the limitations of data, methods, and mechanism analyses. In terms of data, this study is based on data from 2018–2022, which may not adequately capture the long-term dynamic changes in the interaction between TCs and ESV, especially since the impacts of policy adjustments or unexpected environmental events are not included. In terms of research methodology, ESV accounting relies on the equivalent factor method, which is universal but may underestimate regional specificity. In terms of spatial heterogeneity, local autocorrelation analysis revealed spatial differentiation, but it did not explore the driving factors in depth, limiting the precise guidance of regional synergistic strategies. The scope of this study focused on the interior of the GPNP and did not comparatively analyse the spillover effect of the linkage between the trans-regional TC and the neighbouring economic zones on the transformation of ESV.
In the future, we should expand the multi-case comparative study between the GPNP and other types of national parks (e.g., Sanjiangyuan and Wuyishan), to reveal the common and different laws of TCs and value transformation in different ecological function areas. This can be achieved by developing a transport network model with cross-regional connectivity and investigating the synergistic mechanism of ecosystem service flows between national park clusters and urban agglomerations. We can also integrate the market pricing method, the conditional value assessment (CVA) method, and other multi-accounting methods to improve the accuracy and practical guidance of ESV assessment and promote the transformation of ‘green mountains’ to ‘silver mountains’ in a refined and dynamic governance strategy.

5. Conclusions and Policy Recommendations

5.1. Conclusions

In nations prioritizing ecological restoration and protection, the establishment of the Giant Panda National Park (GPNP) achieves a dual balance between enhancing regional ecosystem service value (ESV) realization and meeting green corridor development demands [55]. The inter-constructive relationship between TCs and ESV shows ‘mutual promotion and co-evolution’, which is of far-reaching significance to the promotion of the construction of ecological civilisation. Based on the above research, the following conclusions are drawn.
(1) The development level of TCs in the GPNP from 2018 to 2022 has continued to improve, and the development trend is relatively stable. During the study period, the regional transport efficiency, transport accessibility, and transport sustainability of the GPNP grew significantly, showing obvious regional differentiation characteristics. The level of transport access in economically developed regions is generally higher than that in less developed regions. For example, the ratings of six cities, including Mianzhu City, remained consistently high during 2018–2022, and districts and counties close to provincial capital cities or transport hubs had relatively high levels of transport access.
(2) The ESV of the GPNP demonstrated consistent growth, with a 5.3% increase between 2018 and 2022. Regulating services constituted the dominant component, rising from 13.055 million yuan (66.8%) to 14.330 million yuan (69.6%). Supporting services grew from 4.489 million yuan (22.9%) to 4.840 million yuan (23.5%), while provisioning services increased from 1.133 million yuan to 1.880 million yuan, maintaining a stable proportion of approximately 5.8%. Cultural services increased from 890,000 to 951,000, with the share remaining stable at 4.6%. The quantitative results show that the regulating and supporting functions, such as climate regulation, water purification, and ecological restoration, contribute the most to the ecological value, and the supply and cultural services continue to increase in value with the support of upgrading the transport network and market-oriented operation, which together, promote the coordinated and sustainable development of the park’s ecological protection and regional economy.
(3) From 2018 to 2022, the coupling and coordination of TCs and ecosystem services in the GPNP generally improved, but it is still in the transition stage. This study found that the 27 districts in the GPNP were in a basically stable and improving stage of coupling coordination during 2018–2022. The number of districts, counties, and cities in the dislocation stage in 2018 was reduced from seven to six in 2022, with a smaller fluctuation trend, and most districts and counties are still in the transition stage. The coupling coordination degree of TCs and ESV showed significant differences in different districts and counties between 2018 and 2022.
The spatial distribution characteristics of the coupling coordination degree of TCs and ESV within the GPNP were revealed by the local Moran’s I test. The high–high agglomeration area was in the central part of the GPNP, and the coupling coordination aspect of TCs and ESV had a higher level and stronger regional synergy. The high–low agglomeration area fluctuates in different years, and there is no high–low agglomeration area in 2018. In 2020, the high–low agglomeration area was mainly distributed in the northeastern and southwestern regions of the GPNP, and in 2022, the high–low agglomeration area was only distributed in the southwestern region. The low–low agglomeration area was mainly distributed in the south-central region of the GPNP, which did not change in the three years. This suggests that the coordination between TCs and ESV is low in these two regions and has changed minimally over the study period. The coupling coordination of the other areas exhibited no statistically significant spatial correlation with adjacent regions.

5.2. Policy Applications

Based on the results of the research on the mechanism of mutual construction of TCs and ESV in the GPNP, this paper combines empirical results and puts forward specific policy recommendations from the following three aspects in order to promote the synergistic development of the realisation of the value of ecosystem service and the construction of TCs.
(1) Promote the construction of a sustainable ecological transport network: The TCs of the GPNP need to be based on ecological protection and a balance of transport and ecological functions. In the planning stage, ecological routing techniques should be applied to avoid ecologically sensitive areas as much as possible [56]. For areas that cannot be avoided, animal migration corridors and ecological corridors need to be constructed to reduce the damage to the natural ecosystem. In addition, differentiated transport strategies should be developed according to the characteristics of different regions. In the central high-coordination area, the focus is on optimising the ecological compatibility of the existing road network and promoting the construction of green corridors; in the southern low-coordination area, priority is given to repairing the ecological damage caused by traffic construction and balancing the needs for development and protection through the restoration of vegetation and the construction of animal corridors.
(2) Establish a market-based trading and compensation mechanism for ecosystem services supported by TCs: The efficient connectivity of TCs provides important support for the market-based trading of ecosystem services. Firstly, a market-oriented trading platform should be built based on the network advantages of TCs, and an integrated online and offline ecosystem service trading platform should be constructed to clarify the property rights and standards of ecosystem service, simplify the trading process, and promote the accurate docking of supply and demand. Secondly, improve the differentiated ecological compensation mechanism, and give economic compensation to areas that undertake ecological protection functions and restrict industrial development. In addition, the government should strengthen its key leading role in realising the value of ecosystem services in the GPNP [57], and compensate areas and residents whose ecological protection has been damaged due to TCs by means of financial transfers, so as to mobilise their enthusiasm to participate in ecological protection [58].
(3) Promoting the embedding of TCs in the construction of ecological product industry chains: The efficient logistics network of TCs provides a basic guarantee for the development of the whole industry chain of ecological products. Firstly, we should make full use of the logistics advantages of TCs to build an integrated network of production, processing, circulation, and consumption, so as to open up the ‘last kilometre’ of ESV realisation, and to enhance the brand influence and added value of the products. Secondly, promote the integrated development of ‘transport + culture and tourism’, and enhance the accessibility and ecotourism value of national parks. The layout of ecological and cultural experience centres around transport hubs, transforming TCs into ‘ecological and cultural display corridors’, effectively attracting passenger flow and driving the growth of sales of agricultural products in the vicinity.
The realisation of ESV in the GPNP and the construction of TCs is a systematic project that requires the concerted efforts of the government, the market, and society. By building a sustainable ecological transport network, improving the market-based trading and compensation mechanism, and promoting the integrated development of the whole industry chain, it can effectively promote the benign interaction between ecological protection and economic development, and provide strong support for the sustainable development of the national park.

Author Contributions

L.L.: Formal analysis, Writing—original draft, and Supervision. R.D.: Investigation and Writing—original draft. Q.M.: Methodology and Conceptualization. G.Z.: Conceptualization and Data curation. H.Z.: data curation. All authors have read and agreed to the published version of the manuscript.

Funding

This work has been partially supported by the National Social Science Fund of China (No. 24BMZ025) and the National Natural Science Foundation of China (No. 42471119).

Data Availability Statement

The original contributions presented in the study are included in the article; further inquiries can be directed to the corresponding author.

Acknowledgments

The authors would like to thank the anonymous reviewers for their valuable time and effort in reviewing this manuscript.

Conflicts of Interest

The authors declare no conflicts of interest.

Abbreviations

The following abbreviations are used in this manuscript:
GPNPGiant Panda National Park
ESVEcosystem service value
TCTransportation corridors

Appendix A

Table A1. Accounting for the value of ecosystem service in GPNP, 2018–2022.
20182019202020212022
Zhouzhi county64,542.6266,410.8172,814.3274,743.5378,573.63
Yang County70,456.1272,905.6480,591.8083,046.7687,502.38
Xingjing County45,934.0747,271.0451,624.0853,043.2655,597.15
Wenchuan County106,358.34108,635.69118,112.78120,503.00125,210.91
Wenxian119,213.18122,314.61133,474.74137,116.35144,901.80
Tianquan County59,624.7261,117.2766,712.7068,509.4071,879.22
Taibai County71,524.41735,48.7180,584.1882,732.2486,966.93
Songpan County182,761.08186,496.86203,484.63208,752.77218,373.77
Asbestos County69,934.8172,072.6178,959.0881,089.8484,832.70
Shifang12,480.5412,944.5414,198.6714,559.8315,211.50
Qingchuan County83,181.7086,357.8194,822.7797,373.92101,216.53
Pingwu County150,735.34155,498.01170,556.46175,107.32183,154.34
Pengzhou20,323.4920,944.8022,993.6623,532.3624,451.23
Ningxia County98,790.7610,1553.15111,165.27114,111.53119,954.06
Ningqiang County74,886.0977,401.5184,978.2287,452.5991,989.92
Mianzhu19,643.2220,212.2722,115.9222,671.9923,703.33
Meixian13,527.6513,949.5815,282.0015,688.1616,435.01
Mao County96,677.1199,202.21108,317.47111,085.78116,634.93
Lushan County29,784.6130,560.7833,340.1034,237.0035,852.60
Liuba County52,264.4753,694.6858,826.2060,397.6563,456.70
Jiuzhaigou County122,912.43126,162.35137,990.13141,605.89148,681.93
Hongya County41,814.1743,178.9347,056.1448,422.5350,636.10
Foping County33,894.5934,832.2638,140.0039,165.5341,318.34
Dujiangyan22,403.9923,072.6825,098.1525,633.4026,549.88
Dayi County22,328.9823,172.1125,285.3426,009.5526,640.31
Chongzhou16,318.7716,804.4618,259.3318,719.9718,967.53
Baoxing County77,434.7079,837.4787,434.4089,746.7293,840.34

References

  1. Bai, Y.; Wang, Q.; Yang, Y. From Pollution Control Cooperation of Lancang-Mekong River to “Two Mountains Theory”. Sustainability 2022, 14, 2392. [Google Scholar] [CrossRef]
  2. He, S.; Su, Y.; Wang, L.; Gallagher, L.; Cheng, H. Taking an Ecosystem Services Approach for a New National Park System in China. Resour. Conserv. Recycl. 2018, 137, 136–144. [Google Scholar] [CrossRef]
  3. Lu, Y.; Xu, X.; Zhu, G.; Peng, Y.; Li, Y.; Zhao, X. Land Space and High-Speed Transportation Coordinated Development Evaluation in the Beijing–Tianjin–Hebei Urban Agglomeration of China. Land 2024, 13, 1693. [Google Scholar] [CrossRef]
  4. Meng, F.; Guo, J.; Guo, Z.; Lee, J.C.K.; Liu, G.; Wang, N. Urban Ecological Transition: The Practice of Ecological Civilization Construction in China. Sci. Total Environ. 2021, 755, 142633. [Google Scholar] [CrossRef]
  5. Yang, S.; Zhu, G.; Liu, J.; Xu, H. The Research Progress of the Traffic Ecological Effects under the Perspective of “Pattern-Process-Function”. Ecol. Environ. 2022, 31, 634. [Google Scholar]
  6. Hong, J.; Chu, Z.; Wang, Q. Transport Infrastructure and Regional Economic Growth: Evidence from China. Transportation 2011, 38, 737–752. [Google Scholar] [CrossRef]
  7. Hlatshwayo, T.I.; Zungu, M.M.; Collinson-Jonker, W.J.; Downs, C.T. Mainstreaming Ecological Connectivity and Wildlife Needs in Green Road Transport Infrastructure Planning in South Africa. J. Environ. Manag. 2024, 371, 123062. [Google Scholar] [CrossRef] [PubMed]
  8. Huang, Y.; Ma, R.; Zhou, W.; Yuan, Y.; Ren, J.; Cao, Y. Risk Assessment and Regulation between the Supply and Demand of Ecological Products: A Comprehensive Framework and Case Study. Ecol. Indic. 2023, 154, 110617. [Google Scholar] [CrossRef]
  9. Stratan, A. Infrastructure as a Determinant of the National Competitiveness. ACROSS 2024, 3, 31–38. [Google Scholar] [CrossRef]
  10. Li, L.; Fan, Z.; Xiong, K.; Shen, H.; Guo, Q.; Dan, W.; Li, R. Current Situation and Prospects of the Studies of Ecological Industries and Ecological Products in Eco-Fragile Areas. Environ. Res. 2021, 201, 111613. [Google Scholar] [CrossRef]
  11. Chen, W.; Bian, J.; Liang, J.; Pan, S.; Zeng, Y. Traffic Accessibility and the Coupling Degree of Ecosystem Services Supply and Demand in the Middle Reaches of the Yangtze River Urban Agglomeration, China. J. Geogr. Sci. 2022, 32, 1471–1492. [Google Scholar] [CrossRef]
  12. Chen, W.; Zeng, Y.; Zeng, J. Impacts of Traffic Accessibility on Ecosystem Services: An Integrated Spatial Approach. J. Geogr. Sci. 2021, 31, 1816–1836. [Google Scholar] [CrossRef]
  13. Chen, Y.; Liu, Y.; Yang, S.; Liu, C. Impact of Land-Use Change on Ecosystem Services in the Wuling Mountains from a Transport Development Perspective. Int. J. Environ. Res. Public Health 2023, 20, 1323. [Google Scholar] [CrossRef] [PubMed]
  14. Coffin, A.W. From Roadkill to Road Ecology: A Review of the Ecological Effects of Roads. J. Transp. Geogr. 2007, 15, 396–406. [Google Scholar] [CrossRef]
  15. Fujita, M. The Evolution of Spatial Economics: From Thünen to the New Economic Geography. Jpn. Econ. Rev. 2010, 61, 1–32. [Google Scholar] [CrossRef]
  16. Schwedes, O.; Hoor, M. Integrated Transport Planning: From Supply-to Demand-Oriented Planning. Considering the Benefits. Sustainability 2019, 11, 5900. [Google Scholar] [CrossRef]
  17. Costanza, R. Ecosystem Services: Multiple Classification Systems Are Needed. Biol. Conserv. 2008, 141, 350–352. [Google Scholar] [CrossRef]
  18. Zheng, H.; Wu, T.; Ouyang, Z.; Polasky, S.; Ruckelshaus, M.; Wang, L.; Xiao, Y.; Gao, X.; Li, C.; Daily, G.C. Gross Ecosystem Product (GEP): Quantifying Nature for Environmental and Economic Policy Innovation. Ambio 2023, 52, 1952–1967. [Google Scholar] [CrossRef]
  19. Wei, H.; Zhao, S. Construction on the System Model of the Ecological Industry Chain in the Nature Reserves. Ecol. Econ. 2014, 30, 38–41. [Google Scholar]
  20. Zhang, Z.; Xiong, K.; Chang, H.; Zhang, W.; Huang, D. A Review of Eco-Product Value Realization and Ecological Civilization and Its Enlightenment to Karst Protected Areas. Int. J. Environ. Res. Public Health 2022, 19, 5892. [Google Scholar] [CrossRef]
  21. Lang, C. Heterogeneous Transport Costs and Spatial Sorting in a Model of New Economic Geography. Pap. Reg. Sci. 2010, 89, 191–203. [Google Scholar] [CrossRef]
  22. He, M.; Shen, J.; Wu, X.; Luo, J. Logistics Space: A Literature Review from the Sustainability Perspective. Sustainability 2018, 10, 2815. [Google Scholar] [CrossRef]
  23. Hopkins, D. Sustainable Mobility at the Interface of Transport and Tourism: Introduction to the Special Issue on ‘Innovative Approaches to the Study and Practice of Sustainable Transport, Mobility and Tourism’. J. Sustain. Tour. 2020, 28, 129–143. [Google Scholar] [CrossRef]
  24. Chai, Y.; Tan, Y.; Shen, Y.; Kwan, M. Space-Behavior Interaction Theory: Basic Thinking of General Construction. Geogr. Res. 2017, 36, 1959–1970. [Google Scholar]
  25. Xie, G.; Zhang, C.; Zhang, L.; Chen, W.; Li, S. Improvement of the Evaluation Method for Ecosystem Service Value Based on per Unit Area. J. Nat. Resour. 2015, 30, 1243–1254. [Google Scholar]
  26. Felipe-Lucia, M.R.; Martín-López, B.; Lavorel, S.; Berraquero-Díaz, L.; Escalera-Reyes, J.; Comín, F.A. Ecosystem Services Flows: Why Stakeholders’ Power Relationships Matter. PLoS ONE 2015, 10, e0132232. [Google Scholar] [CrossRef]
  27. Yuan, Y.; Bai, Z.; Zhang, J.; Huang, Y. Investigating the Trade-Offs between the Supply and Demand for Ecosystem Services for Regional Spatial Management. J. Environ. Manag. 2023, 325, 116591. [Google Scholar] [CrossRef]
  28. Abdul Mutalib, N.H.; Mashros, N.; Aminudin, E.; Zakaria, R.; Haron, Z.; Abd Talib, M.H.; Abdul Hamid, A.R. Disturbance of Traffic Noise: Evaluation on the Effects and Management on Road Corridors. IOP Conf. Ser. Earth Environ. Sci 2018, 143, 12049. [Google Scholar] [CrossRef]
  29. Zhao, W. Beginning: China’s National Park System. Natl. Sci. Rev. 2022, 9, nwac150. [Google Scholar] [CrossRef]
  30. Hou, Q.; Du, Y.; Dong, W.; Zeng, Z.; Zhang, L.; Duan, Y.; Hou, X. Smart City Oriented Ecological Corridor Layout of Sanshui River Basin in Arid Area of Loess Plateau. Sustain. Energy Technol. Assess. 2021, 44, 100993. [Google Scholar] [CrossRef]
  31. Jian, P.; Huijuan, Z.; Yanxu, L.; Jiansheng, W.U. Research Progress and Prospect on Regional Ecological Security Pattern Construction. Geogr. Res. 2017, 585–597. [Google Scholar]
  32. Deryugina, T.; Moore, F.; Tol, R.S. Environmental Applications of the Coase Theorem. Environ. Sci. Policy 2021, 120, 81–88. [Google Scholar] [CrossRef]
  33. Daily, G.C. Introduction: What Are Ecosystem Services. Nature’s Serv. Soc. Depend. Nat. Ecosyst. 1997, 1–10. [Google Scholar]
  34. Yu, P.; Zhang, J.; Wang, Y.; Wang, C.; Zhang, H. Can Tourism Development Enhance Livelihood Capitals of Rural Households? Evidence from Huangshan National Park Adjacent Communities, China. Sci. Total Environ. 2020, 748, 141099. [Google Scholar] [CrossRef] [PubMed]
  35. Crowley, K. Jobs and Environment: The “Double Dividend” of Ecological Modernisation? Int. J. Soc. Econ. 1999, 26, 1013–1027. [Google Scholar] [CrossRef]
  36. Wen, J.; Chen, H. Green Innovation and the Urban–Rural Income Gap: Empirical Evidence from China. Sustainability 2025, 17, 2106. [Google Scholar] [CrossRef]
  37. Bastiaanssen, J.; Johnson, D.; Lucas, K. Does Transport Help People to Gain Employment? A Systematic Review and Meta-Analysis of the Empirical Evidence. Transp. Rev. 2020, 40, 607–628. [Google Scholar] [CrossRef]
  38. Michałowski, A. System Aspects Research of Ecosystem Services in the Economy for Sustainable Development. Probl. Ekorozwoju 2014, 9, 71–80. [Google Scholar]
  39. Luo, H.; Sun, G.; Zhou, W.; Lian, J.; Sun, Y.; Hu, Y. Promoting Rural Revitalization via Natural Resource Value Realization in National Parks: A Case Study of Baishanzu National Park. Land 2025, 14, 298. [Google Scholar] [CrossRef]
  40. Gregory, A.; Spence, E.; Beier, P.; Garding, E. Toward Best Management Practices for Ecological Corridors. Land 2021, 10, 140. [Google Scholar] [CrossRef]
  41. Simmonds, H.; Gazley, A. Impact Value and Sustainable, Well-Being Centred Service Systems. Eur. J. Mark. 2021, 55, 593–617. [Google Scholar] [CrossRef]
  42. Zhang, W.; Wang, H.; Cao, K.; He, S.; Shan, L. Ecological Conservation–and Economic Development–Based Multiobjective Land-Use Optimization: Case Study of a Rapidly Developing City in Central China. J. Urban Plan. Dev. 2019, 145, 05018023. [Google Scholar] [CrossRef]
  43. Wang, D.; Wang, K.; Wang, Z.; Fan, H.; Chai, H.; Wang, H.; Long, H.; Gao, J.; Xu, J. Spatial-Temporal Evolution and Influencing Mechanism of Traffic Dominance in Qinghai-Tibet Plateau. Sustainability 2022, 14, 11031. [Google Scholar] [CrossRef]
  44. Tian, T.; Ma, Y. Interactive Effect and Spatial Characteristics of Agricultural Development Level and Transport Superiority Degree in Main Grain-Producing Areas of the Central Jilin Province, China. Chin. Geogr. Sci. 2022, 32, 643–664. [Google Scholar] [CrossRef]
  45. Li, S.; Wang, H.; Liu, X.; Yang, Z. The Evolution and Economic and Social Effects of the Spatial and Temporal Pattern of Transport Superiority Degree in Southern Xinjiang, China. Land 2024, 13, 216. [Google Scholar] [CrossRef]
  46. Costanza, R.; d’Arge, R.; De Groot, R.; Farber, S.; Grasso, M.; Hannon, B.; Limburg, K.; Naeem, S.; O’neill, R.V.; Paruelo, J. The Value of the World’s Ecosystem Services and Natural Capital. Nature 1997, 387, 253–260. [Google Scholar] [CrossRef]
  47. Sutton, P.C.; Duncan, S.L.; Anderson, S.J. Valuing Our National Parks: An Ecological Economics Perspective. Land 2019, 8, 54. [Google Scholar] [CrossRef]
  48. Wilson, M.A.; Carpenter, S.R. Economic Valuation of Freshwater Ecosystem Services in the United States: 1971–1997. Ecol. Appl. 1999, 9, 772–783. [Google Scholar]
  49. Tang, Z. An Integrated Approach to Evaluating the Coupling Coordination between Tourism and the Environment. Tour. Manag. 2015, 46, 11–19. [Google Scholar] [CrossRef]
  50. Tobler, W.R. A Computer Movie Simulating Urban Growth in the Detroit Region. Econ. Geogr. 1970, 46, 234–240. [Google Scholar] [CrossRef]
  51. Mathur, M. Spatial Autocorrelation Analysis in Plant Population: An Overview. J. Appl. Nat. Sci. 2015, 7, 501. [Google Scholar] [CrossRef]
  52. Youngs, Y.L.; White, D.D.; Wodrich, J.A. Transportation Systems as Cultural Landscapes in National Parks: The Case of Yosemite. Soc. Nat. Resour. 2008, 21, 797–811. [Google Scholar] [CrossRef]
  53. Haines, A.L. Yellowstone National Park: Its Exploration and Establishment; US National Park Service: Washington, DC, USA, 1974.
  54. Choni, D.; Blomvik, R.F.; Nordgård, B.A. Hvordan Kan Den Operasjonelle Driften På En Ferge Automatiseres? Bachelor’s Thesis, Norwegian University of Science and Technology, Trondheim, Norway, 2017. [Google Scholar]
  55. James, S. Right of Way: Cruise Tourism in Fiordland, New Zealand. Doctoral dissertation, University of Waikato, Hamilton, New Zealand, 2003. [Google Scholar]
  56. Pu, M.; Zhao, Y.; Ni, Z.; Huang, Z.; Peng, W.; Zhou, Y.; Liu, J.; Gong, Y. Spatial-Temporal Evolution and Driving Forces of NDVI in China’s Giant Panda National Park. Int. J. Environ. Res. Public Health 2022, 19, 6722. [Google Scholar] [CrossRef] [PubMed]
  57. Xu, Y.; Liu, R.; Xue, C.; Xia, Z. Ecological Sensitivity Evaluation and Explanatory Power Analysis of the Giant Panda National Park in China. Ecol. Indic. 2023, 146, 109792. [Google Scholar] [CrossRef]
  58. Sun, Y.; Zhao, J.; Qiao, Q.; Lin, Z.; Zhang, W. Unlocking the Value of Nature: A Deep Dive into China’s Ecological Product Realization and Its Driving Mechanisms. Forests 2024, 16, 37. [Google Scholar] [CrossRef]
Figure 1. Geographic location map of the Giant Panda National Park (GPNP): (a) China map showing the national context; (b) Provincial-scale location within Sichuan, Shaanxi, and Gansu; (c) Topographic map of the study area. Note: This map is based on the standard map with approval number GS (2024)0650, and the base map has not been modified.
Land 14 01385 g001
Figure 2. The mutual construction relationship between transportation corridors (TCs) and ecosystem service value (ESV).
Land 14 01385 g002
Figure 3. Heat map of changes in transport access scores by county for GPNP, 2018–2022.
Land 14 01385 g003
Figure 4. Coupled coordination between TCs and ESV realisation in GPNP: 2018 (a), 2020 (b), and 2022 (c) (CCR).
Land 14 01385 g004
Figure 5. Local autocorrelation analysis of GPNP in 2018 (a), 2020 (b), and 2022 (c).
Land 14 01385 g005
Table 1. Indicators and weights of the TC.
EcosystemsIndicator Weight
AccessibilityRoad density0.068
Distance to the province0.037
InfrastructureRoad area0.266
Traffic land0.267
Logistics land0.282
Sustainabilityco2 emission0.015
Green coverage0.022
pm250.038
Table 2. Ecosystem service value (ESV) equivalent factor table for GPNP (2018).
EcosystemsCroplandForestsGrasslandsShrubsWetlandsWatershedsBare Ground
Supply
Services
Food Production1.110.270.230.190.510.80
Raw material production0.250.630.340.430.50.230
Water supply−1.310.330.190.222.598.290
Regulatory
Services
Gas regulation0.892.071.211.411.90.770.02
Climate regulation0.476.23.194.233.62.290
Purification of the environment0.141.81.051.283.65.550.1
Hydrology1.53.862.343.3524.23102.240.03
Support
Services
Soil conservation0.522.521.471.722.310.930.02
Maintaining nutrient cycles0.160.190.110.130.180.070
Biodiversity0.172.31.341.577.872.550.02
Cultural
Services
Aesthetic landscape0.081.010.590.694.731.890.01
Table 3. Economic value of ecosystem production per unit area of farmland in GPNP, 2018–2022.
20182019202020212022
Cultivation area11491131112811381149
Economic output per unit area0.1510.1540.1560.1560.154
An equivalent factor value0.1420.1440.1510.1490.150
Table 4. Table of regional coefficients of variation for GPNP.
IndexGPNPNationwide
Annual mean temperature12.6310.1
Annual precipitation267,25263,937
Net primary productivity28882877
Regional difference coefficient11
Table 5. Social development coefficients for GPNP.
20182019202020212022
Social development coefficients (K)0.940.930.970.950.97
Table 6. Individual ESV coefficients for land use types in GPNP.
EcosystemsCroplandForestsGrasslandsShrubsWetlandsWatershedsBare Ground
Supply
Services
Food Production0.170.04−0.20.130.070.020.23
Raw material production0.040.090.050.310.930.270.58
Water supply0.030.050.030.180.480.160.35
Regulatory
Services
Gas regulation0.030.060.030.210.640.190.5
Climate regulation0.080.080.390.290.540.543.65
Purification of the environment0.120.031.250.120.350.8415.41
Hydrology000000.020
Support
Services
Soil conservation0.170.04−0.20.130.070.020.23
Maintaining nutrient cycles0.040.090.050.310.930.270.58
Biodiversity0.030.050.030.180.480.160.35
Cultural
Services
Aesthetic landscape0.030.060.030.210.640.190.5
Table 7. Value of ecosystem services (million), 2018–2022.
Service Category20182019202020212022
Supply Service113.3114.4120.2118.7119
Regulatory Services1305.51318.61385.91368.21371
Support Services448.9454.1478472.3474.8
Cultural Services909195.894.695.1
Disclaimer/Publisher’s Note: The statements, opinions and data contained in all publications are solely those of the individual author(s) and contributor(s) and not of MDPI and/or the editor(s). MDPI and/or the editor(s) disclaim responsibility for any injury to people or property resulting from any ideas, methods, instructions or products referred to in the content.

