Article

Geospatial Explainable AI Uncovers Eco-Environmental Effects and Its Driving Mechanisms—Evidence from the Poyang Lake Region, China

1
Architecture and Design College, Nanchang University, Nanchang 330031, China
2
Division of Sustainable Energy and Environmental Engineering, Graduate School of Engineering, Osaka University, 2-1 Yamadaoka, Suita 565-0871, Osaka, Japan
*
Author to whom correspondence should be addressed.
Land 2025, 14(7), 1361; https://doi.org/10.3390/land14071361 (registering DOI)
Submission received: 3 May 2025 / Revised: 18 June 2025 / Accepted: 26 June 2025 / Published: 27 June 2025

Abstract

Intensified human activities and changes in land-use patterns have led to numerous eco-environmental challenges. A comprehensive understanding of the eco-environmental effects of land-use transitions and their driving mechanisms is essential for developing scientifically sound and sustainable environmental management strategies. However, existing studies often lack a comprehensive analysis of these mechanisms due to methodological limitations. This study investigates the eco-environmental effects of land-use transitions in the Poyang Lake Region over the past 30 years from the perspective of the production-living-ecological space (PLES) framework. Additionally, a geographically explainable artificial intelligence (GeoXAI) framework is introduced to further explore the mechanisms underlying these eco-environmental effects. The GeoXAI framework effectively addresses the challenges of integrating nonlinear relationships and spatial effects, which are often not adequately captured by traditional models. The results indicate that (1) the conversion of agricultural space to forest and lake spaces is the primary factor contributing to eco-environmental improvement. Conversely, the occupation of forest and lake spaces by agricultural and residential uses constitutes the main driver of eco-environmental degradation. (2) The GeoXAI demonstrated excellent performance by incorporating geographic variables to address the absence of spatial causality in traditional machine learning. (3) High-altitude and protected water areas are more sensitive to human activities. In contrast, geographic factors have a greater impact on densely populated urban areas. The results and methodology presented here can serve as a reference for eco-environmental assessment and decision-making in other areas facing similar land-use transformation challenges.

1. Introduction

The eco-environment provides the essential foundation for human survival and underpins social development [1]. Land-use transformation is a major driver of regional eco-environmental change [2,3]. Changes in land-use functions can exert both beneficial and adverse effects on the quality of local eco-environment and ecosystem processes [4,5,6]. Over time, these effects accumulate and ultimately influence global ecological quality [7,8]. The prevailing development paradigm, characterized by prioritizing production and construction at the expense of ecological protection, has profoundly shaped land-use transformation [5,9]. This has led to a range of environmental challenges, including climate warming, wetland loss, biodiversity decline, and deforestation, each of which poses severe threats to human survival and development [10,11,12]. Concurrently, the advancement of industrialization and urbanization in China has resulted in profound changes in land-use patterns and spatial organization, especially regarding the functional transition of production–living–ecological spaces. These transformations have affected regional land-use efficiency and have had lasting implications for the eco-environment [13]. Environmental issues such as ecological fragility, widespread pollution, and rising disaster risks are major barriers to sustainable urban development in China. These challenges increase environmental management costs, harm public health and productivity, hinder industrial upgrading, and raise the risk of economic and social instability. The World Bank estimates that environmental problems cost China about 10% of its annual GDP [14]. Rapid expansion of production and residential areas has worsened regional ecological degradation, causing soil erosion on 20% of the land. In response, China has placed significant emphasis on territorial spatial planning to mitigate the adverse impacts of eco-environmental issues. The overarching objective is to establish efficient production spaces, livable residential spaces, and well-preserved ecological spaces. Accordingly, comprehensively assessing the eco-environmental effects of land-use transitions is crucial for supporting the advancement of ecological civilization [15,16].
Eco-environmental quality is used to assess the overall health of natural systems and the services they provide. The eco-environmental effects refer to the impact of land-use changes on eco-environmental quality, a topic that has garnered growing academic interest in recent years. For instance, Mo et al. (2024) examined how distinct urban functional zones contribute to the urban heat island effect, highlighting the differential roles of various land-use types [17]. Zhou et al. (2024) assessed land-use transitions in Nanjing, China, between 2003 and 2023, and demonstrated a significant correlation between these transitions and eco-environment quality [18]. Similarly, Zhang et al. (2024) integrated land-use types into analytical frameworks to reveal spatial heterogeneity in carbon emissions, suggesting that understanding this relationship is critical for achieving sustainable and low-carbon development [19]. Wang et al. (2022) observed that regions with favorable vegetation, such as grasslands and forests, tend to exhibit higher eco-environment quality [20]. In contrast, reductions in ecological land and increased landscape heterogeneity due to human activities negatively affect local ecological carrying capacity, underscoring the influence of land-use types on eco-environment quality [20].
In studies of eco-environmental effects, the eco-environmental quality index (EQI) quantifies changes in environmental conditions resulting from land-use transformation [21,22]. This allows for a more accurate characterization of the spatial evolution of the eco-environmental effect of regional land-use transition. Moreover, various factors can influence EQI to varying degrees. To explore these complex relationships, researchers commonly employ a range of analytical methods. From a geographical perspective, the methods currently applied can be classified into spatial models and traditional models. Spatial models, such as spatial autocorrelation and spatial econometric models [23], including multiscale geographically weighted regression (MGWR) and geographically weighted regression (GWR), have been introduced and widely adopted in eco-environment research [24,25]. For example, Pang et al. (2022) utilized the MGWR model to identify the driving factors and spatial differentiation patterns of eco-environment effects within the study area [12]. Wang et al. (2023) employed the GWR model to analyze the spatial effects of key factors influencing eco-environment quality in the Qilian Mountains [26]. The study examined the spatial heterogeneity of these effects and evaluated the varying strengths of different influencing factors [26]. Zhang et al. (2024) employed spatial statistical methods, including the Spatial Lag Model (SLM) and the Spatial Error Model, to conduct comparative analyses of the driving factors of eco-environment quality in the Beijing green belts [23]. However, these spatial statistical approaches face challenges in processing high-dimensional and complex data, and often fail to accurately capture the nonlinear relationships inherent in real-world systems [27]. Consequently, traditional machine learning models have been introduced, and the advent of explainable artificial intelligence has significantly advanced research in this field [28,29]. Zhang et al. (2024) employed the random forest model to characterize the nonlinear relationships between multiple factors and eco-environment quality [13]. In contrast, machine learning methods such as the random forest model are highly effective at capturing higher-order nonlinear and complex relationships among variables. However, these models do not explicitly account for spatial autocorrelation or spatial proximity [30].
Although previous studies have made significant contributions to understanding the eco-environmental effects of land-use transitions and their driving mechanisms, there remain notable gaps in analyzing the mechanisms underlying eco-environmental effects, particularly regarding the integration of spatial effects and nonlinear relationships. Traditional spatial statistical methods predominantly rely on linear regression, which limits their ability to capture the complex nonlinear relationships present in real-world scenarios. In contrast, machine learning methods are capable of identifying nonlinear features but often overlook spatial factors. However, spatial variables and their interactions play a critical role in shaping eco-environments. Ke et al. (2024) proposed a novel GeoXAI-based framework to investigate how geographic factors influence flood mechanisms [31]. Similarly, Ehsan Foroutan et al. (2025) applied GeoXAI to examine how geographic location influences factors associated with heat-related emergency department visits (EDVs) in both urban and rural areas of Texas [32]. The GeoXAI framework can integrate various machine learning models with explainable artificial intelligence techniques, effectively addressing the spatial challenges faced by traditional models and the nonlinear challenges encountered in spatial models. As a result, GeoXAI enables a more accurate and realistic representation of the driving mechanisms underlying eco-environmental effects. Furthermore, the geographic factors identified by the GeoXAI framework exhibit significant and region-specific impacts on eco-environmental quality across different subregions.
To address these shortcomings, this study intends to integrate multi-source data and the GeoXAI framework to elucidate the eco-environmental effects of land-use and its driving mechanisms. The main contributions of this research are as follows: (1) Land-use transition patterns in the Poyang Lake region from 1990 to 2020 are examined, and the impacts of these transitions on eco-environmental quality are clarified. (2) The GeoXAI framework is employed to interpret the driving mechanisms of eco-environmental effects. (3) The dominant factors influencing eco-environmental quality in different regions are visualized, supporting region-specific decision-making. This research offers a more comprehensive understanding of eco-environmental mechanisms, advances methodological approaches, and provides practical recommendations for improving eco-environments and optimizing land-use policies.

2. Materials and Methods
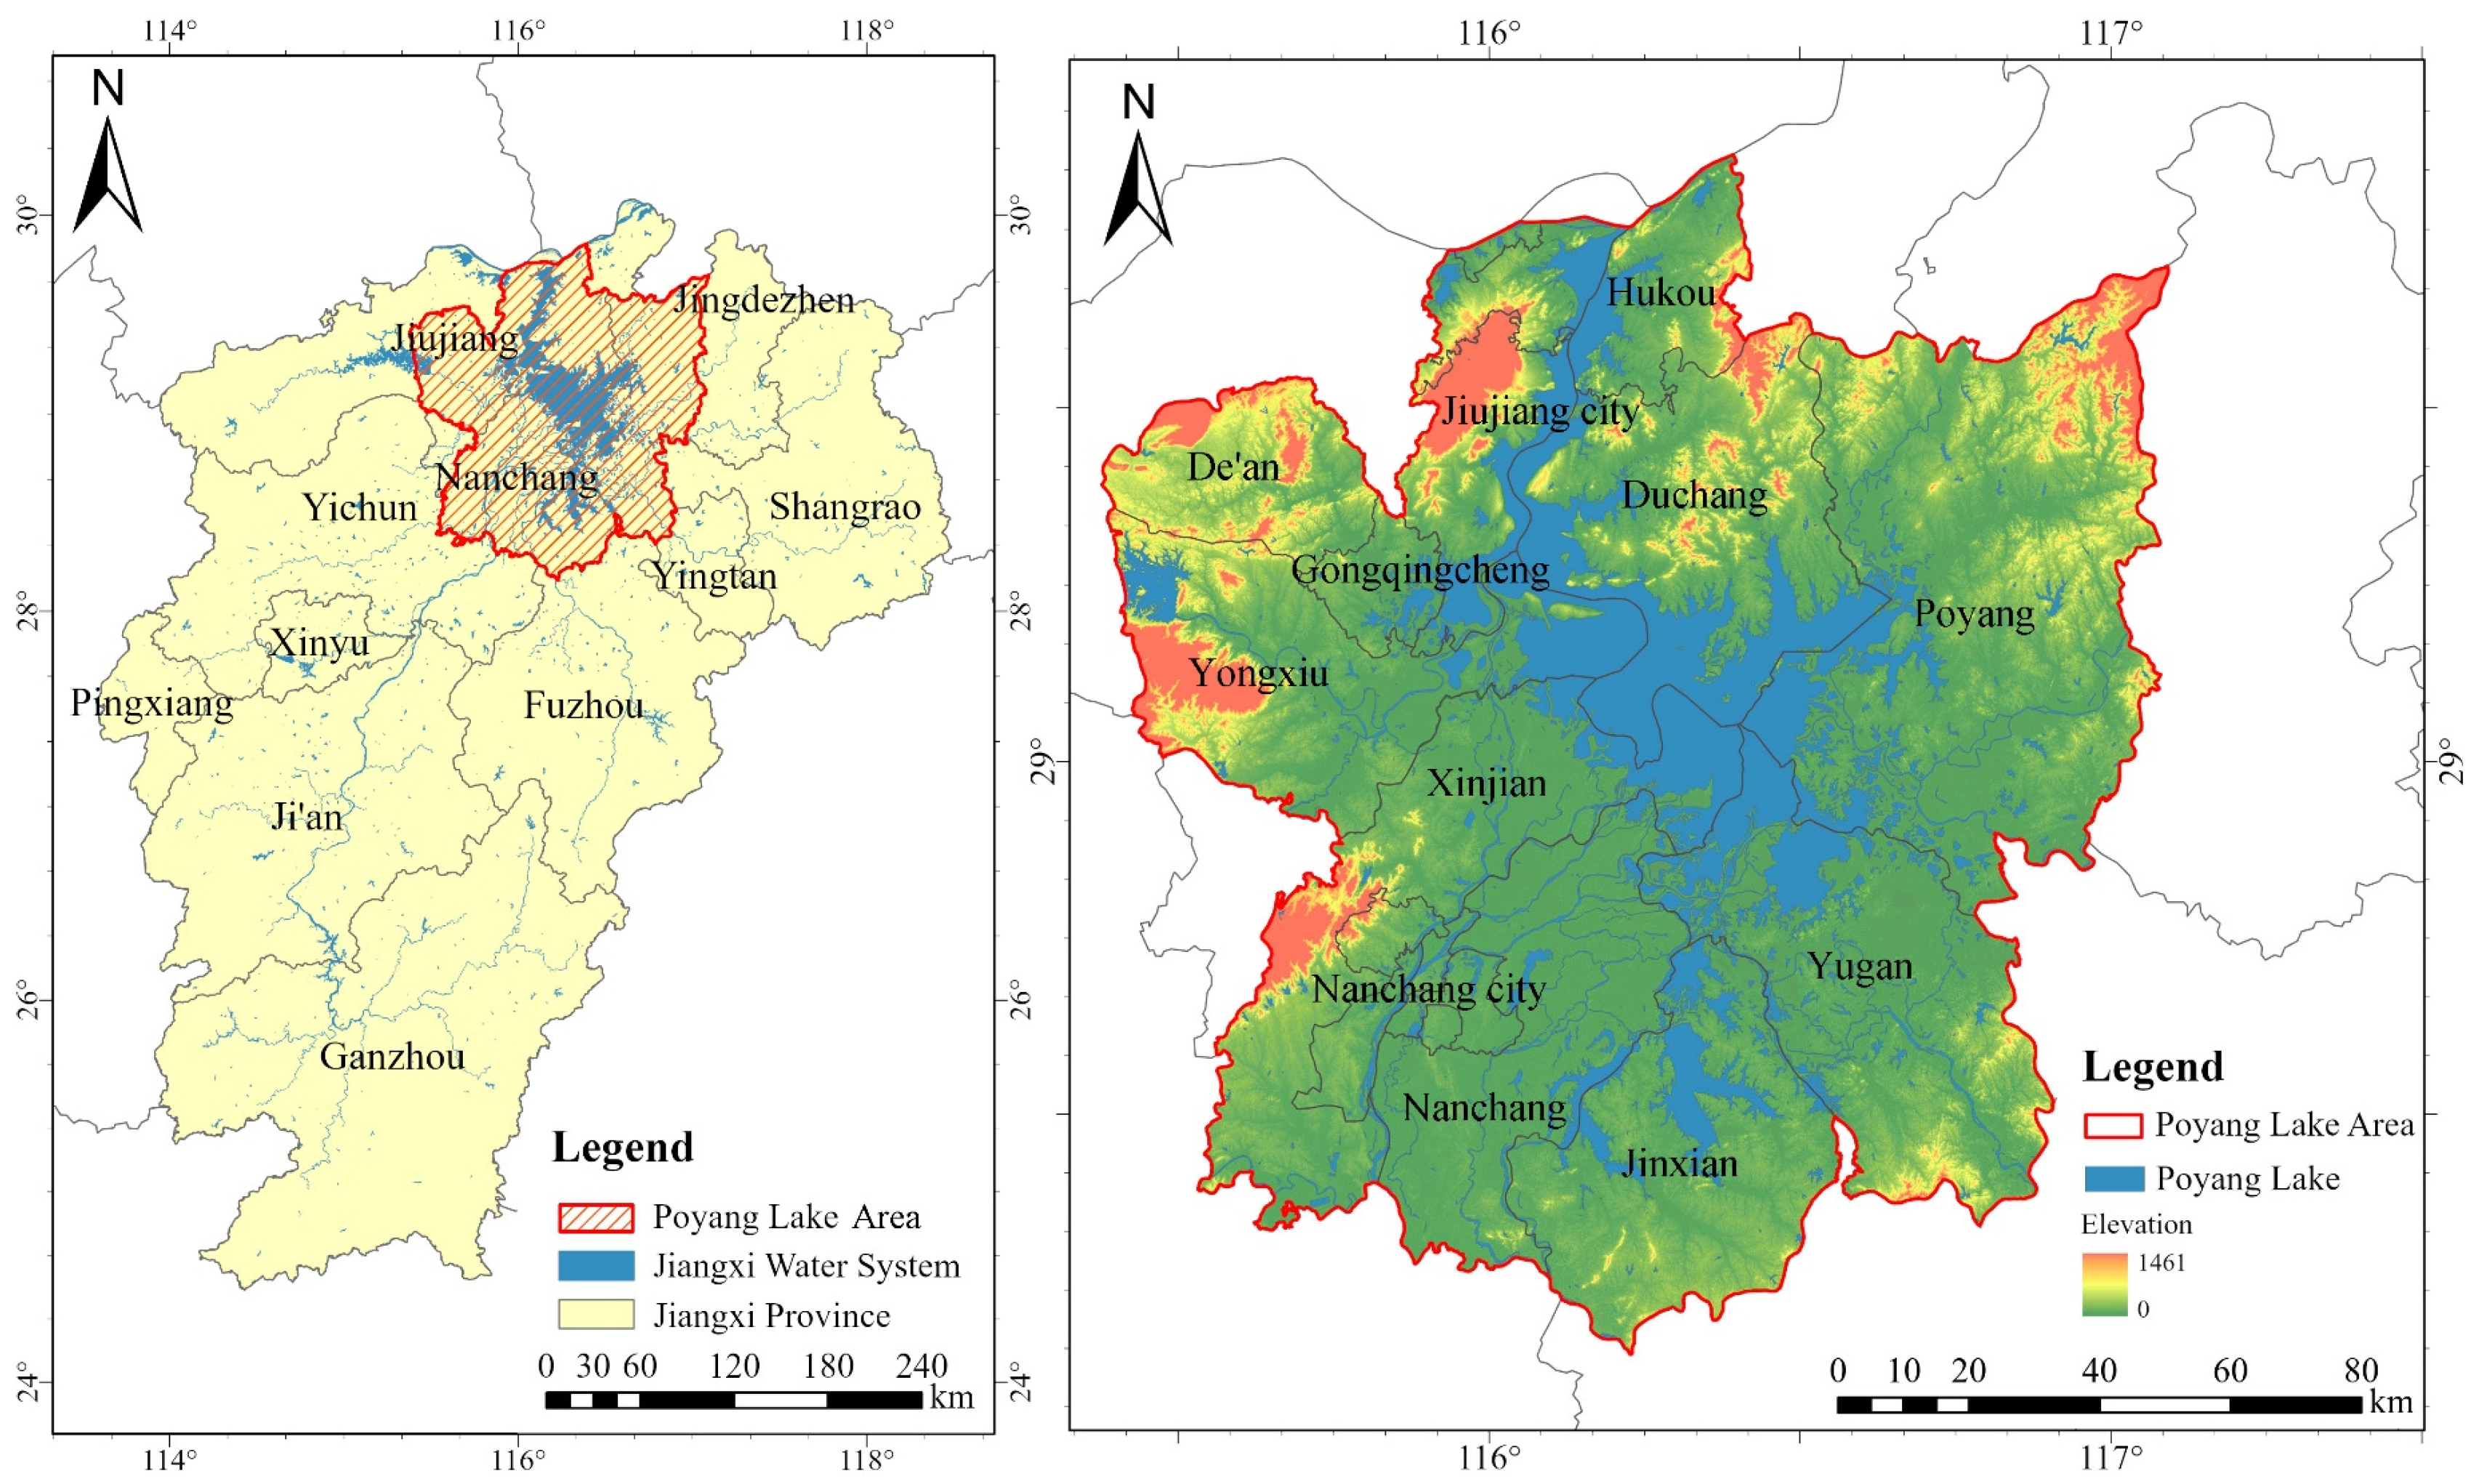
2.1. Study Area

Poyang Lake (28°11′–29°51′ N, 115°31′–117°06′ E), situated in northern Jiangxi Province, China, is the largest freshwater lake in the country and a critical water body. Functioning as a typical seasonal inflow-outflow lake, Poyang Lake discharges approximately 1.457 × 10¹¹ cubic meters of water annually into the Yangtze River, contributing 15.6% of its annual runoff [33]. Poyang Lake plays a vital role in regulating the Yangtze River’s water levels, mitigating floods and droughts, enhancing the regional climate, and preserving the ecological balance of its surrounding environment [34]. Covering 12 counties and urban areas, including Nanchang, Jiujiang, and Shangrao (Figure 1), the Poyang Lake region is situated in a subtropical humid monsoon climate zone. It experiences an annual average temperature ranging from 16.8 °C to 17.8 °C, with annual precipitation between 1426.4 mm and 1542 mm [24]. Winters and springs are cold, while summers and autumns are typically rainy. The region’s topography is characterized by plains and hills, with low-lying terrain around the lake. The northern and western areas are predominantly hilly, supported by extensive water systems and rich agricultural and fishery resources [35].

2.2. Data Sources and Processing

Land-use data for 1990, 2000, 2010, and 2020 in the study area were sourced from the Resource and Environment Science and Data Center, Chinese Academy of Sciences (https://www.resdc.cn, accessed on 12 January 2025), with a spatial resolution of 30 m. In the Poyang Lake region, land-use is classified into 6 primary categories, including cropland, forest, grassland, water bodies, residential land, and unused land. These primary categories are further subdivided into 19 secondary categories.
Based on studies of the dominant functions of land-use types and the current land-use patterns in the Poyang Lake region [36,37], we developed a linkage table to systematically relate the PLES functional structure to specific land-use types. Subsequently, following the methodology proposed by Li et al., we identified the EQI for each secondary land-use type of the land-use classification system [38]. The EQI for each secondary land-use type under the dominant PLES functional classification was then calculated using an area-weighted approach. For each secondary land-use types under the dominant PLES functional classification listed in Table 1, the EQI value corresponds to Ri in Equation (2).
Given the considerable size of the Poyang Lake region and the need for methodological rigor in calculating the EQI. The excessively large evaluation units led to a loss of spatial detail. In contrast, extremely small units were overly influenced by individual land-use types, resulting in increased noise and substantially higher computational demands. Therefore, we divided the study area into 7243 regular hexagonal units, each with a side length of 1 km. The EQI for each evaluation unit was then calculated using Equation (2). Subsequently, the spatial distribution of the EQI was generated for the entire study area by applying the Kriging interpolation method to the EQI values of all evaluation units.
The eco-environmental quality of a region is determined by various factors. In this study, two primary indices were identified: natural environment factors and socio-economic factors. These were further divided into 7 secondary indices and 13 specific indices (Table 2). Altitude, river, and road data were obtained from the Geospatial Data Cloud platform (http://www.gscloud.cn, accessed on 10 January 2025). Temperature, precipitation, sunshine, population density, night lights, and GDP data were sourced from the Resource and Environment Science Data Center (https://www.resdc.cn/, accessed on 12 January 2025). NDVI and NPP data were derived from the National Ecosystem Science Data Center (https://www.nesdc.org.cn/, accessed on 15 January 2025).
Topographic factors play a decisive role in shaping the spatial distribution of eco-environment quality [39]. Climatic factors exert substantial influence on land-use changes across broad spatial and temporal scales [12]. Hydrological factors reflect the critical role of water resource supply in ecosystems, directly influencing vegetation growth and biodiversity. Additionally, NDVI and NPP, as important indicators of vegetation factors, respectively, represent the status of vegetation coverage and ecosystem productivity, directly impacting the stability and health of regional ecosystems [40].
Socio-economic indices have the most dynamic impact on eco-environmental quality [41]. Population density, as the core index of population factors, reflects the intensity of human activity and its direct disturbance to ecosystems. In densely populated regions, higher human demand for land resources often leads to alterations in natural ecological landscapes [42]. Economic indicators play a crucial role in evaluating regional development levels and their impacts on eco-environmental quality. Night lights data and GDP are widely used proxies for measuring the intensity and vitality of economic activities [43]. Regions with higher levels of nighttime illumination and GDP typically exhibit more active industrial and commercial sectors, which often correspond to greater anthropogenic pressures on the environment [13]. In addition, the percentage of agricultural land reflects the extent of agricultural production. Together, these three indicators comprehensively capture the influence of industrial, commercial, and agricultural activities on eco-environmental quality. Furthermore, the transportation index represents regional accessibility and connectivity, providing an effective measure of the degree of human disturbance to land-use patterns [44].

2.3. Methodology

2.3.1. Land-Use Transfer Matrix Model

The land-use transfer matrix is a widely used analytical tool for examining and visualizing changes in land-use over a given period. It effectively illustrates the direction and magnitude of changes in land-use types within a specific region from the beginning to the end of the study period [45]. The mathematical formula is presented as follows:
S i j = S 11 S 12 S 1 n S 21 S 22 S 2 n S n 1 S n 2 S n n ,
where S represents the area; i and j represent different land-use types in the early and late stages of the study, respectively; and n represents the number of land-use types. To further illustrate its application and facilitate interpretation, Table 3 presents a simple example of a land-use transition matrix. In this example, each cell represents the area converted from one land-use type to another during the study period, which helps clarify how land-use changes are tracked and analyzed.

2.3.2. Eco-Environmental Quality Index

The EQI is a comprehensive indicator used to evaluate the overall eco-environmental quality of a specific region. It is calculated by considering the eco-environmental quality of various land-use types within the region as well as their proportional areas. This index provides a quantitative representation of the overall ecological status of the region [22,41]. The mathematical formula is presented as follows:
E V i = i = 1 N A k i A k R i ,
where E V i is the EQI of evaluation unit i , k is the evaluation unit, A k i is the area of functional land type i in the k t h evaluation unit, and A k is the total land area of the k t h evaluation unit. Additionally, R i is the EQI of functional land class i and N is the number of land resource types, based on PLES. According to existing studies and Natural Breaks, it objectively identifies breakpoints by minimizing within-class variance and maximizing between-class variance [46]. This approach reflects the inherent distribution characteristics of the data and reduces the influence of outliers, making the classification results more representative and interpretable. The EQI is classified as high quality (0.6068 < EQI < 0.7700), medium–high quality (0.5248 < EQI < 0.6068), medium quality (0.4481 < EQI < 0.5247), medium–low quality (0.3549 < EQI < 0.4480), and low quality (EQI < 0.3548).

2.3.3. Ecological Contribution Rate of Land-Use Transitions

The ecological contribution rate (ECR) of land-use transformation is a quantitative indicator used to measure the impact of specific land-use type conversions on regional EQI. This metric aims to evaluate the positive or negative effects of changes in land-use types on eco-environmental quality during the transformation process. Additionally, it reveals the roles of different land-use types in driving regional ecological changes [47]. The mathematical formula is presented as follows:
L E I = L E t + 1 L E t L A T A ,
where L E I is the ecological contribution rate of land-use transitions, L E t + 1 and L E t represent the EQI of PLES land-use at the end and beginning of the change, respectively; L A is the area of the change type; and T A is the total area of the region.

2.3.4. Geographic Explainable Artificial Intelligence

In this study, GeoXAI was employed to analyze the factors influencing EQI [31]. GeoXAI is grounded in the principles of explainable artificial intelligence (XAI), aiming to enhance both the predictive power and interpretability of geospatial analyses. This approach uses a regression-explanation framework, which consists of a regression module, GeoMLR, and an interpretation module, Geoshapley. The regression module models the complex relationships between multiple variables and EQI. The interpretation module provides a quantitative explanation of these relationships. Compared with traditional machine learning and linear spatial statistical methods, the GeoXAI framework addresses two major limitations: (1) traditional machine learning models often neglect spatial characteristics, while (2) linear spatial statistical methods struggle to capture nonlinear relationships inherent in real-world environments.
XGBoost is a highly efficient, tree-based ensemble learning algorithm that excels at modeling complex nonlinear relationships and is widely used in both regression and classification tasks. In geospatial research, traditional machine learning regression often fails to account for spatial characteristics. Spatial statistical methods based on linear regression also have difficulty capturing the nonlinear relationships present in real-world environments. To address these limitations, GeoMLR was applied by including geographic coordinates (X and Y) as predictors in the XGBoost regression model. To evaluate the feasibility of this approach, the R2, MSE, and MAE values were compared with those from traditional machine learning models.
Shap is a method used to interpret the outputs of machine learning models. It quantifies the contribution of each individual feature to the model’s prediction, thereby providing both global and local interpretability. The Shapley value for feature i is calculated as follows:
S H A P i x = S { 1 , , n } \ { i } S { 1 , , n } 1 ! f S i f S ,
where SHAP i x is the contribution of the i th feature to the prediction for instance x , S is the subset of all features except i , S is the number of features in subset S , { 1 , . . . , n } is the total number of features, f S is the value predicted by the model given the feature subset S , and f S { i } is the value predicted by the model given the feature subset S plus the i feature.
Geoshapley is an extension of the Shap method that enables the quantification of the importance of spatial variables and their interactions with other features. This approach addresses the limitation of traditional Shapley methods, which cannot capture overall spatial characteristics [48]. The method is implemented through the open-source Python 3.11.7 package Geoshapley, as provided by Li (2024) [49]. The final Geoshapley value is calculated as the sum of four components, as expressed below:
y ^ = ϕ 0 + ϕ G E O + j = 1 p ϕ j + j = 1 p ϕ G E O , j ,
where y ^ is the Geoshapley value, ϕ 0 is the global baseline, defined as the mean prediction over the background data and serving as the model’s intercept, ϕ G E O is a vector with size n capturing the fixed location effects, and for each non-location feature j , ϕ j is a vector with size n representing its location-invariant effect. ϕ G E O , j is a vector with size n for each non-location feature j , capturing its spatially varying interaction effect.

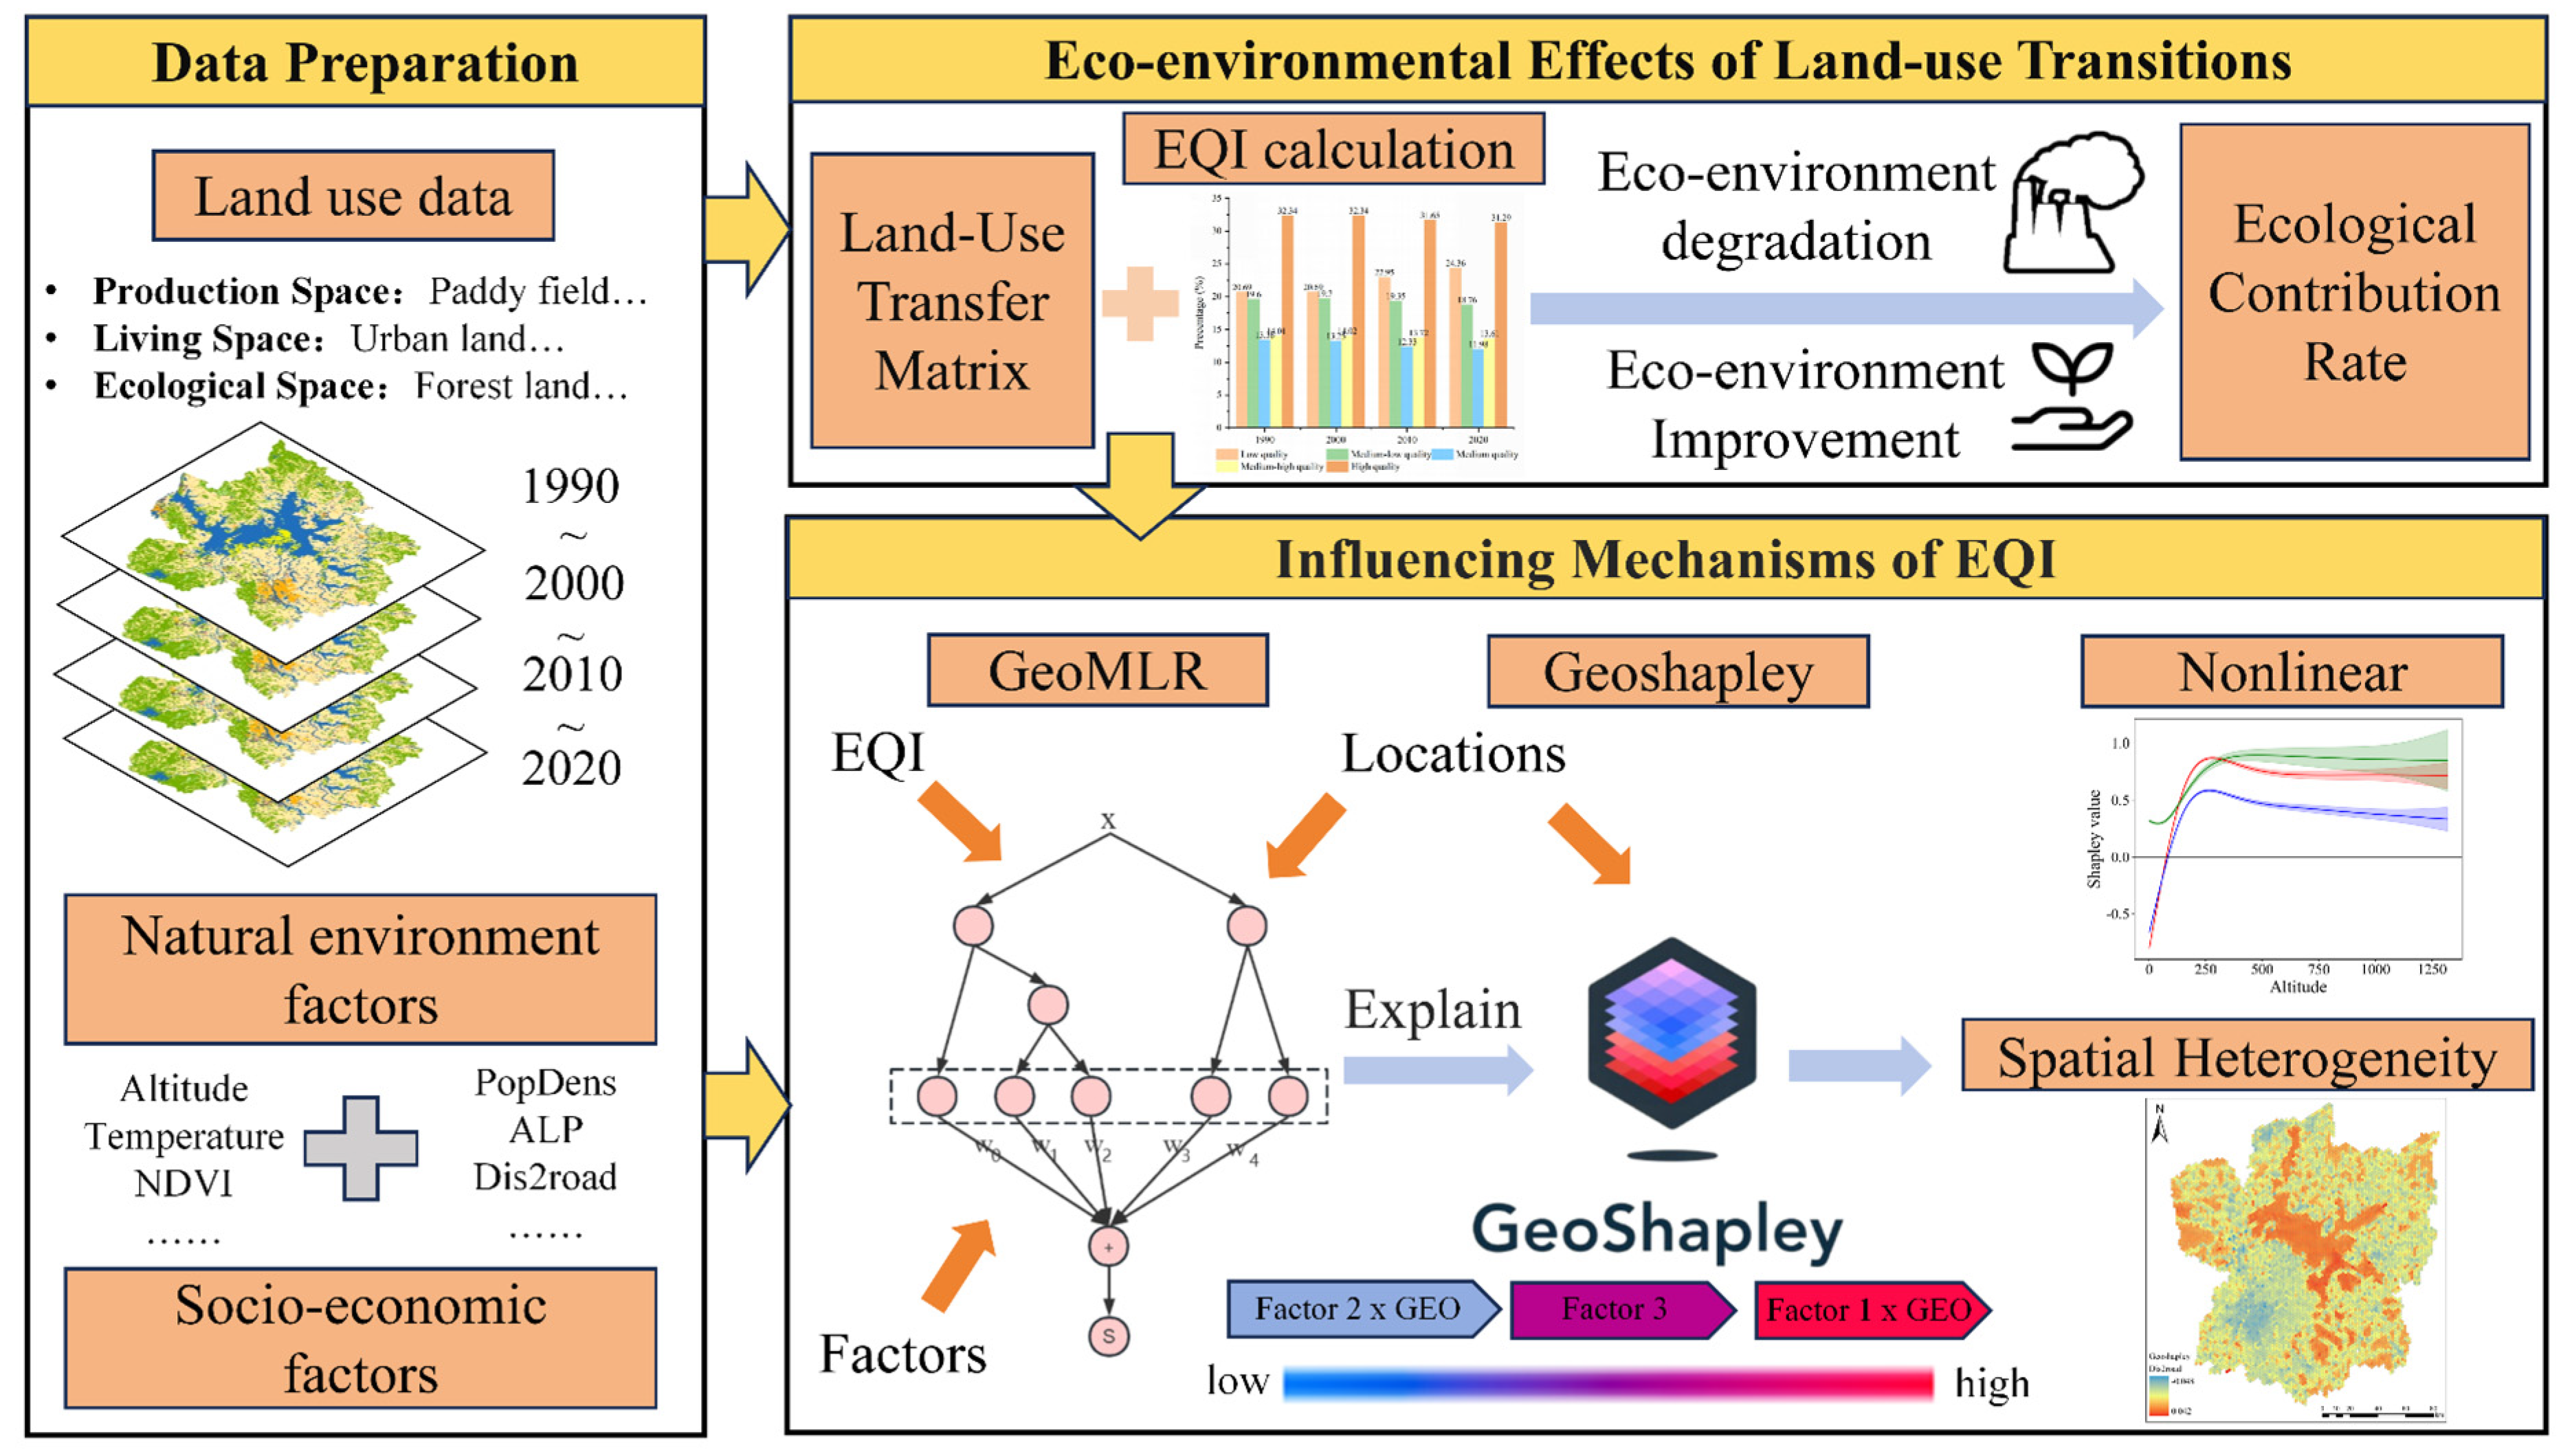
2.4. Research Framework

The research framework adopted in this study is illustrated in Figure 2 and comprises three main components. (1) Land-use data and multi-source datasets were collected to establish a comprehensive database. (2) The spatial distribution of EQI and land-use transitions over the study period were analyzed. The eco-environmental effects of land-use transitions were further investigated. (3) The GeoMLR model was applied to integrate multi-source data and EQI, incorporating the geographic attributes of each spatial unit. Subsequently, Geoshapley was employed to interpret the results. This approach enabled the assessment of the interactions between multi-source data and geographic factors, and their nonlinear and spatially heterogeneous impacts on EQI.

3. Results

3.1. Eco-Environmental Effects of Land-Use Function Evolution

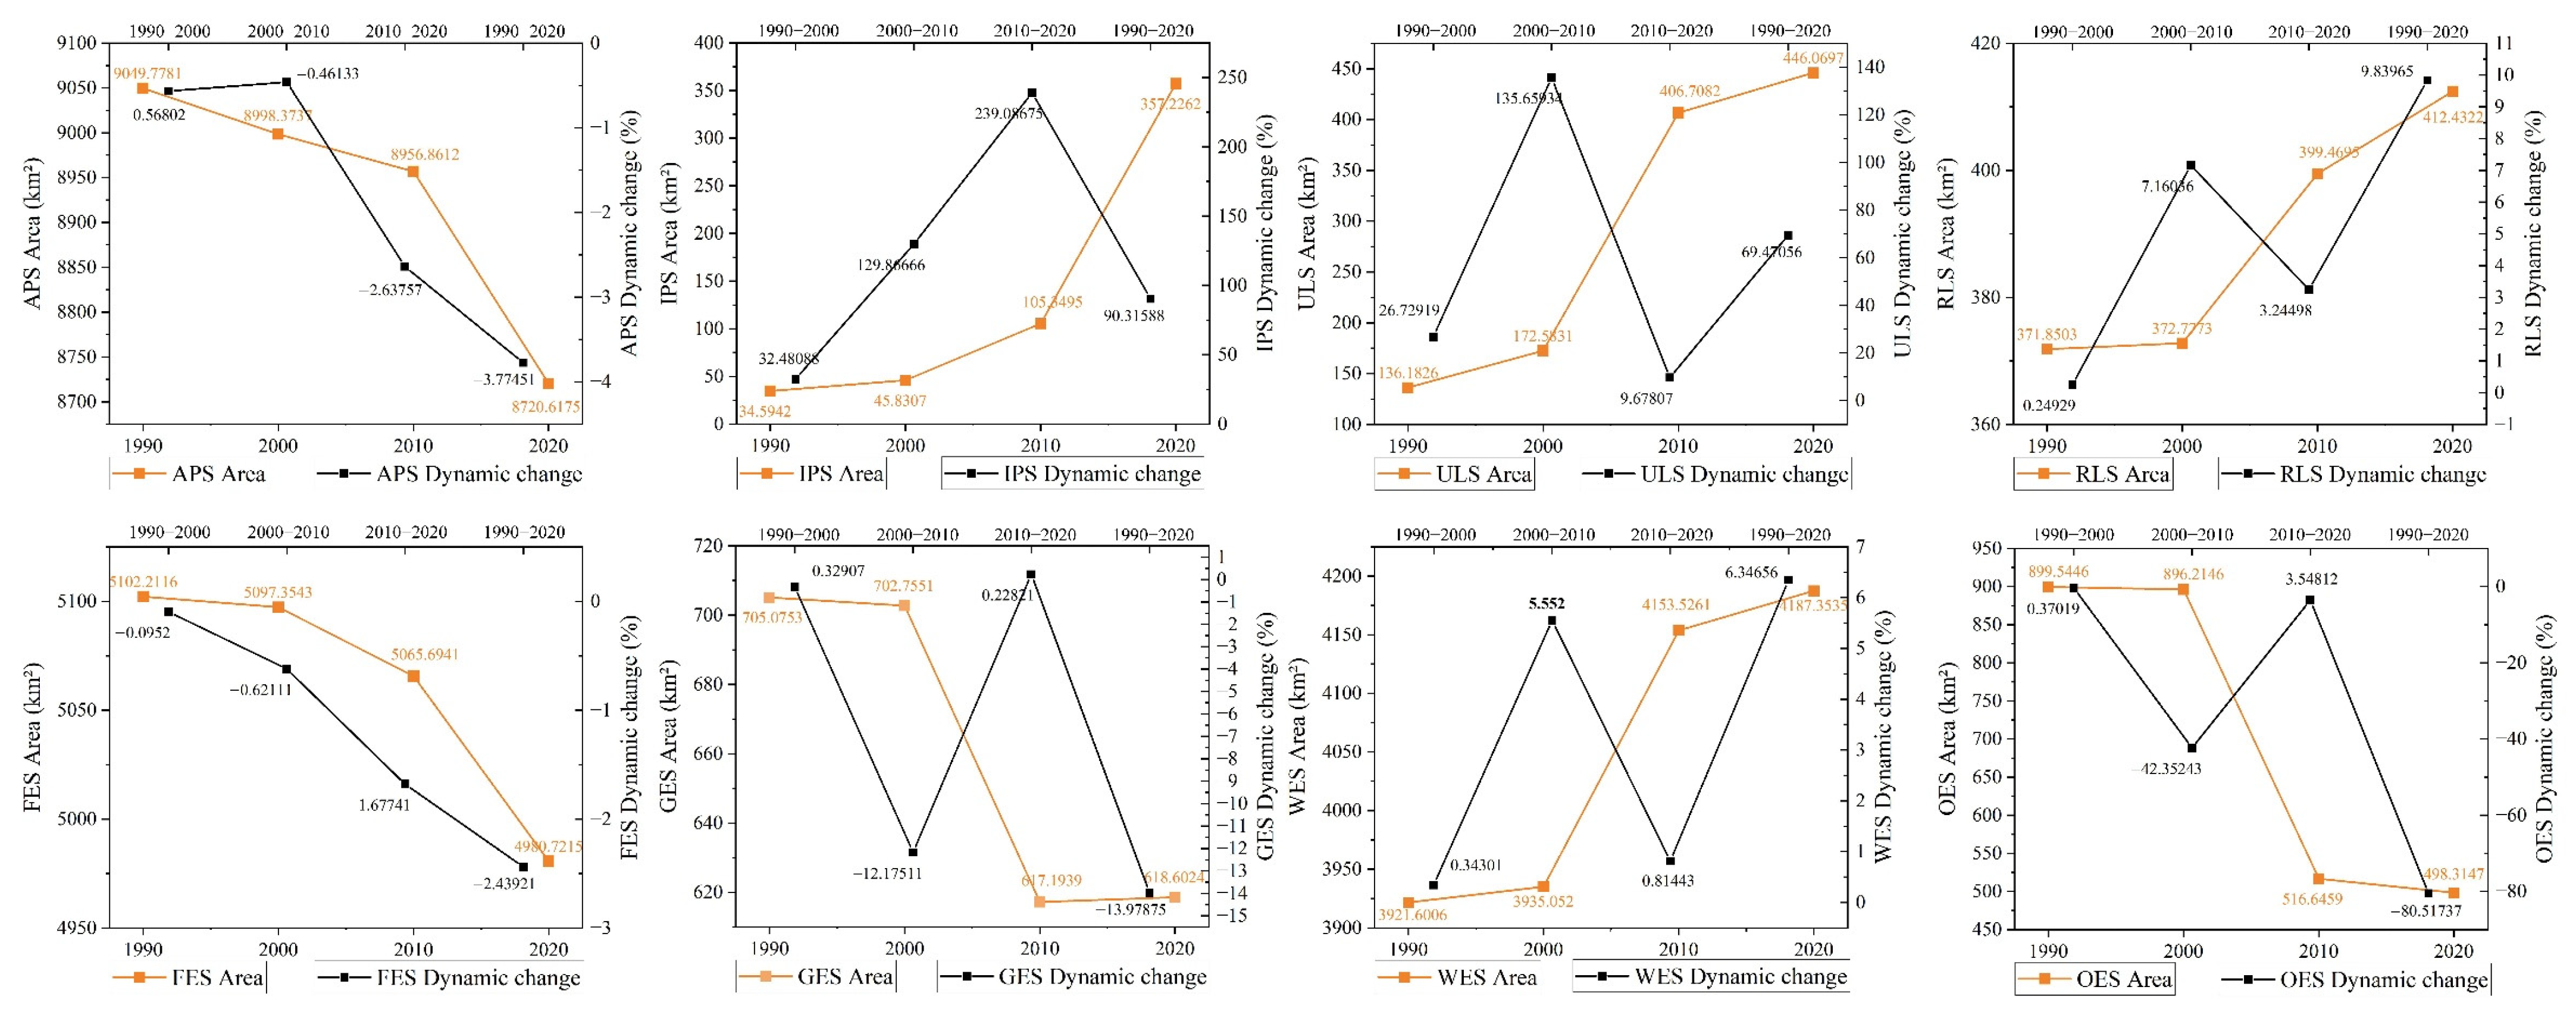
3.1.1. Spatiotemporal Dynamics of PLES Land-Use

The spatiotemporal changes in PLES land-use across the Poyang Lake region from 1990 to 2020 are illustrated in Figure 3 and Figure 4. Over the past 30 years, the area of living space increased by 350.47 km2, exhibiting a continuous expansion trend. Specifically, ULS was concentrated in the central urban areas of each county, with major distributions in southwestern Nanchang, northern Jiujiang, as well as Yugan and Poyang counties. The integration of the regional economies of Nanchang and Jiujiang also promoted urban development along transportation corridors, such as Yongxiu and Dean counties. RLS was scattered around the central urban areas, being more common in the southern plains and northeastern hills but rarely found in the higher western mountains. Between 2000 and 2010, China experienced rapid urbanization. A significant portion of ecological space was converted to production and living spaces, mainly due to urban construction and farmland reclamation, which adversely affected ecological functions.
In Production Space, APS continuously decreased, with the largest loss over the past 30 years, totaling 933.176 km2. Most of this land was converted to living space and IPS, amounting to 552.428 km2. Industrialization and urbanization were the main drivers of agricultural land reduction. IPS continuously expanded. Some APS was also converted to FES and WES, totaling 356.644 km2, largely due to reforestation and wetland restoration policies in the Poyang Lake region. Similarly, the main increases in APS originated from FES and WES, indicating that deforestation and land reclamation from wetlands contributed to agricultural expansion during this period. IPS was mainly distributed on the outskirts of urban areas. With the development of the Changjiu Industrial Corridor, IPS expanded linearly along this corridor. From 2010 to 2020, a large amount of farmland was converted to IPS. This period was characterized by rapid industrial growth and a slowdown in urban construction.
Overall, Ecological Space showed a declining trend, decreasing by 343.44 km2. It was mainly distributed along water systems such as Poyang Lake and Ganjiang River, as well as in hilly and mountainous areas like Meiling, Lushan, and Jiuhuashan. Specifically, FES, GES, and OES all declined, while WES gradually increased. The main sources of WES expansion were APS and OES, with swampland being the dominant type in OES. These changes were closely related to the implementation of wetland restoration policies and were also influenced by fluctuations in Poyang Lake water levels during remote sensing image acquisition [50]. This trend reflects the effectiveness of ecological restoration policies and the dynamic changes in hydrological conditions of Poyang Lake. Between 2010 and 2020, ecological protection projects facilitated the conversion of APS to ecological space, resulting in positive impacts on the regional eco-environment.

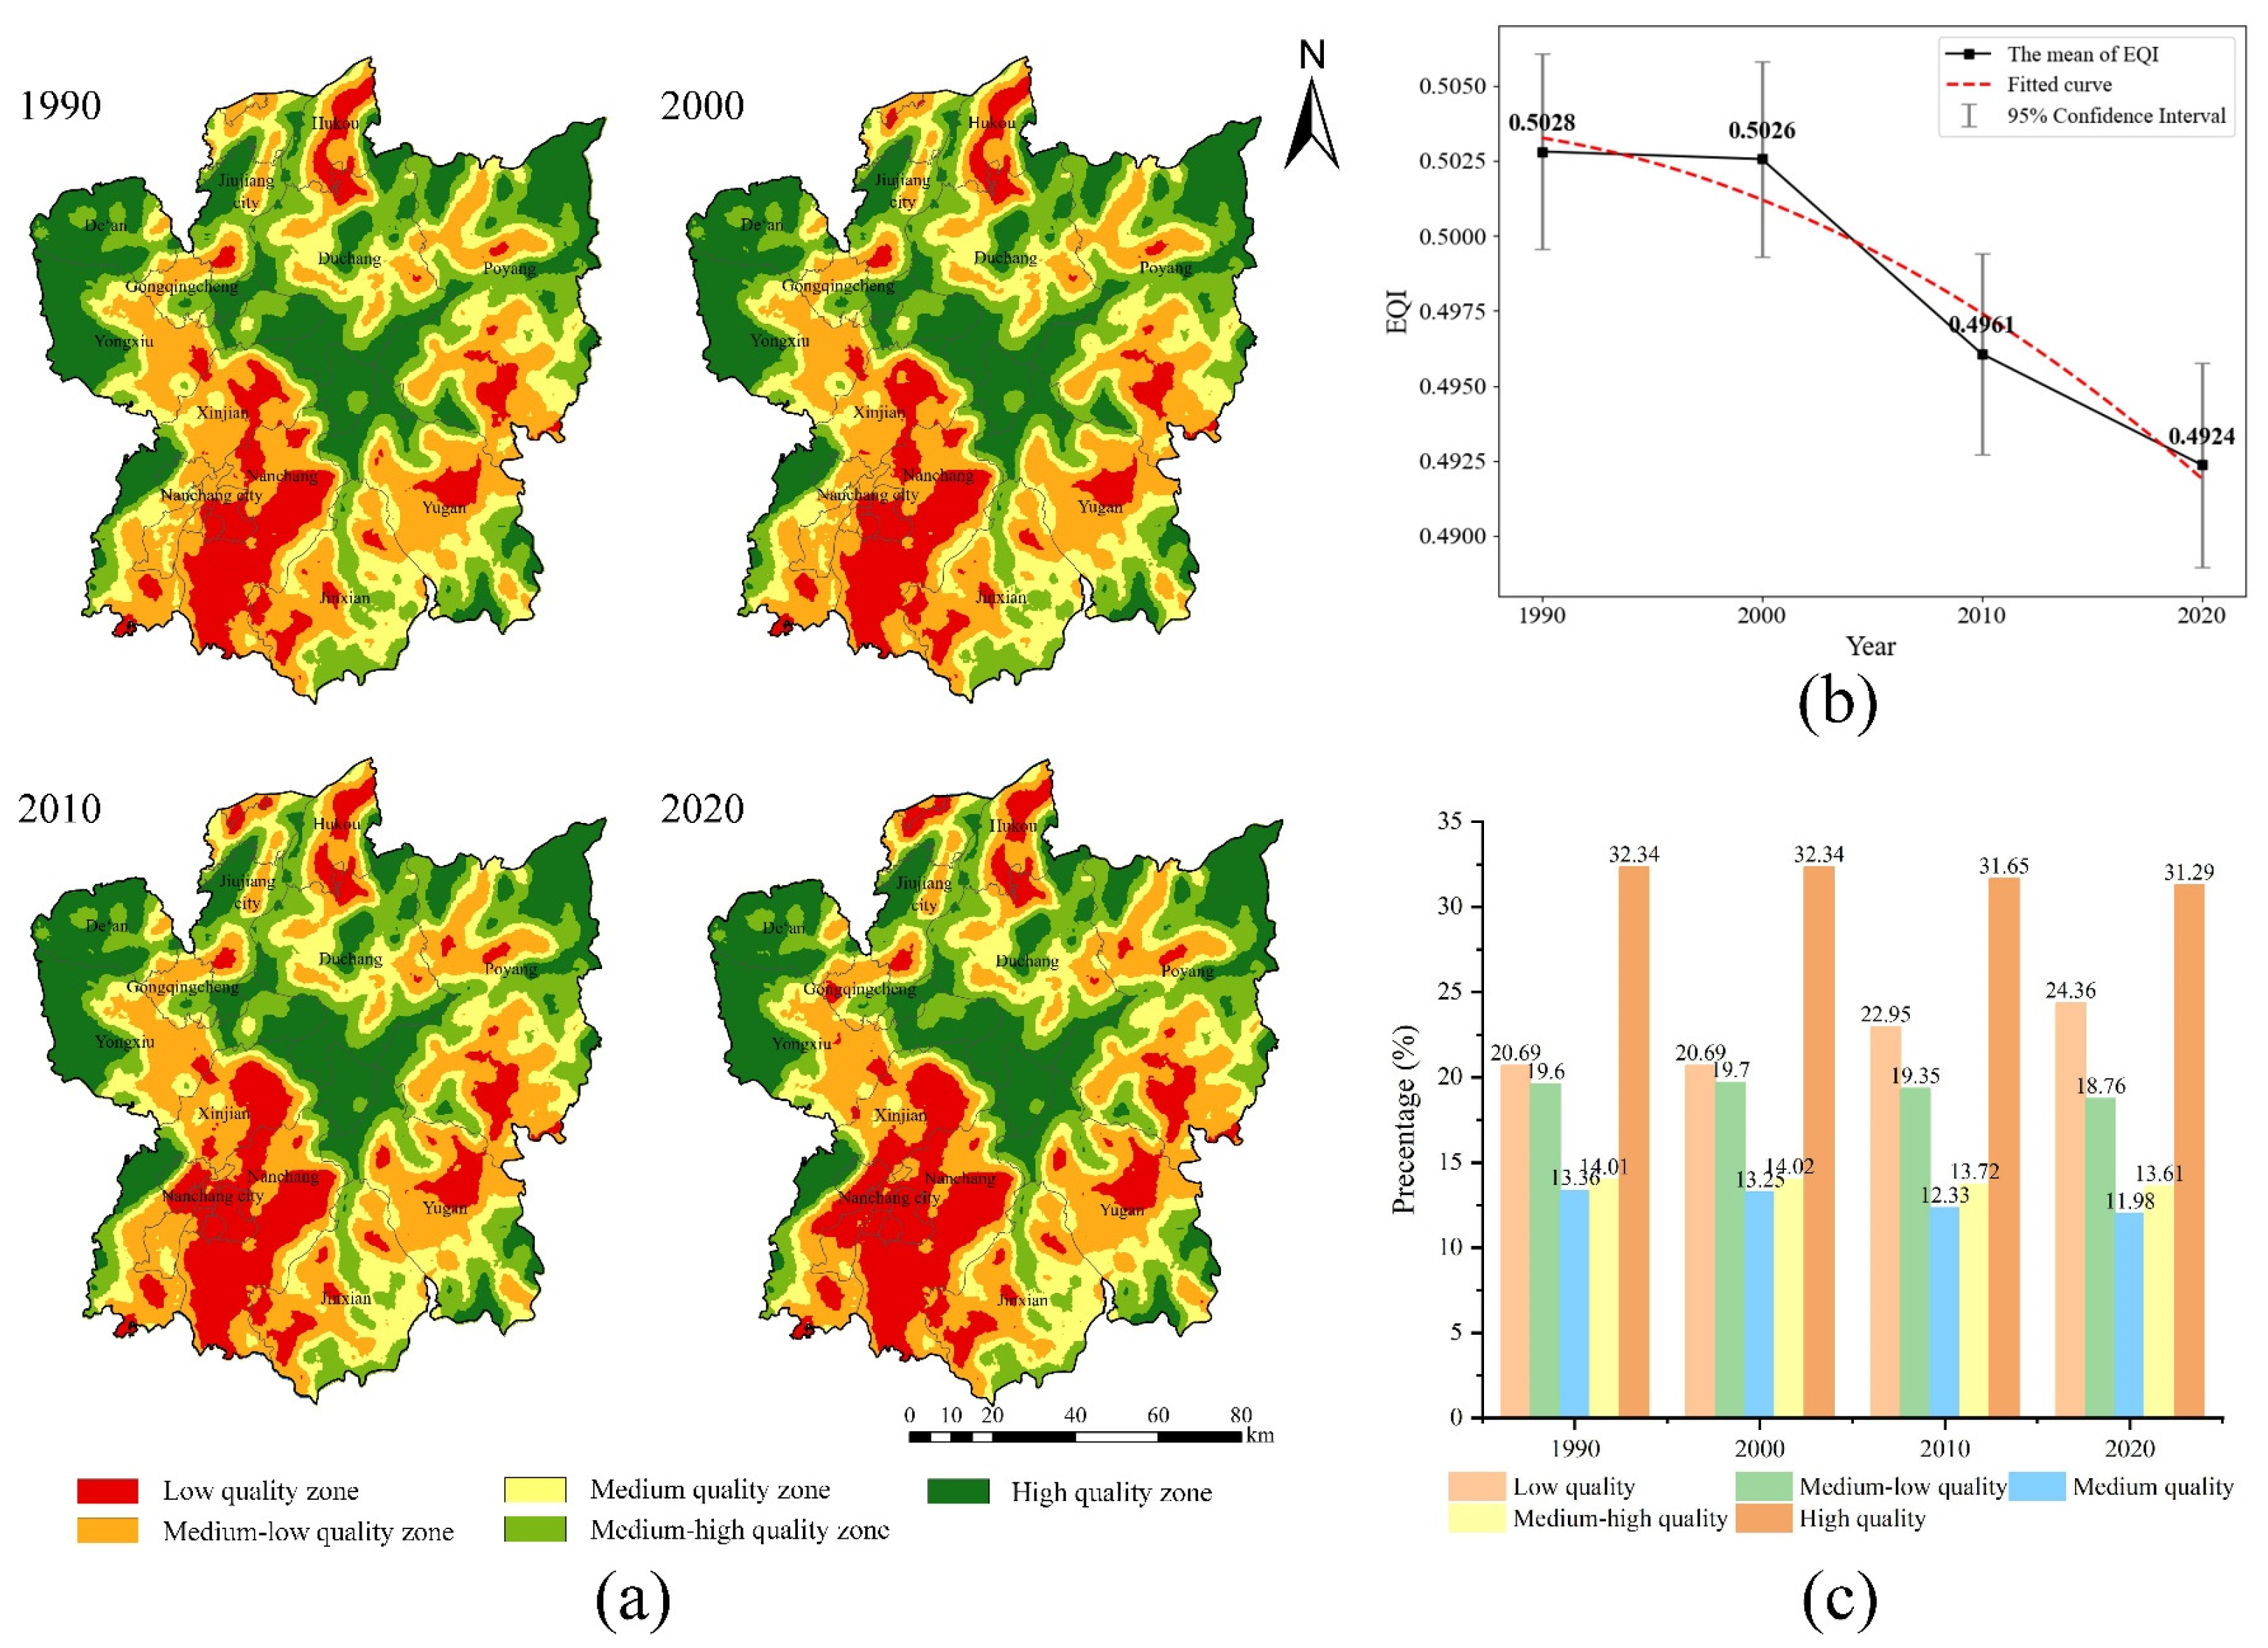
3.1.2. Spatiotemporal Patterns of the EQI

From 1990 to 2020, the EQI in the study area exhibited a consistent downward trend, with the most significant decline observed between 2000 and 2010 (Figure 5). The spatial distribution of the EQI displayed notable heterogeneity, forming a concentric pattern: high values were concentrated in the central region, lower values in the surrounding areas, and relatively higher values in the outermost zones. High-quality zones were predominantly distributed in the central Poyang Lake region, the high-altitude mountainous areas in the west, and the hilly regions in the northeast. Medium–high quality zones were mainly distributed around high-quality zones, forming a clear gradient pattern.
Low-quality and medium–low quality zones showed a continuous spatial distribution, primarily influenced by urban built-up areas and rural production and living activities, which contributed to the formation of low-quality ecological clusters. Over the past thirty years, the proportion of low quality zones has consistently increased, primarily at the expense of medium–low quality zones. In contrast, high quality zones have experienced a marked decline. Notably, low quality zones in Nanchang have expanded northward and westward, aligning with the city’s urban development trajectory.

3.1.3. Impacts of Land-Use Transitions on Eco-Environmental Quality

Land-use functional transitions demonstrate both improvement and degradation trends in regional eco-environmental quality. These opposing effects tend to offset each other, maintaining the overall quality at a relatively stable level. The ECR results (Table 4) reveal that the conversion of APS to WES and FES serves as the primary driver of Eco-environmental improvement. Specifically, during 1990–2000, the transition from APS to WES accounted for 68.39% of the total improvement, while APS to FES contributed 24.32%. Over the entire study period (1990–2020), APS to FES and APS to WES transitions contributed 47.54% and 31.96%, respectively, to eco-environment improvement.
Conversely, the conversion of WSE and FES to APS, along with the transition of APS and FES to IPS and ULS, constitutes the primary drivers of eco-environmental degradation. In each period, the conversion of other land types to APS accounted for the largest share among all land-use changes. This indicates that persistent land reclamation remained the most significant factor contributing to ecological degradation throughout the entire study period. The dominant drivers varied across periods. Urban expansion was the primary factor during the first two decades, while rapid industrialization became predominant in the last decade. From 1990 to 2000, 28.03% of other land types were converted to ULS, compared to 11.39% to IPS. From 2000 to 2010, 16.63% were converted to ULS and 4.46% to IPS. However, between 2010 and 2020, 31.1% of other land types were converted to IPS, far exceeding the conversion to ULS, which was less than 2%.
Therefore, implementing policies such as farmland-to-forest and farmland-to-lake conversion in the Poyang Lake region represents a critical strategy for ecological conservation. Simultaneously, stricter regulations on land-use for industrial and urban expansion should be enforced, alongside the optimization of land-use structures and the implementation of stringent farmland protection policies to improve regional eco-environmental quality. In future territorial spatial planning, the principle of ecological prioritization should be upheld to harmonize ecological protection with socio-economic development, thereby promoting regional sustainability.

3.2. Nonlinear Analysis of the Influencing Factors on EQI

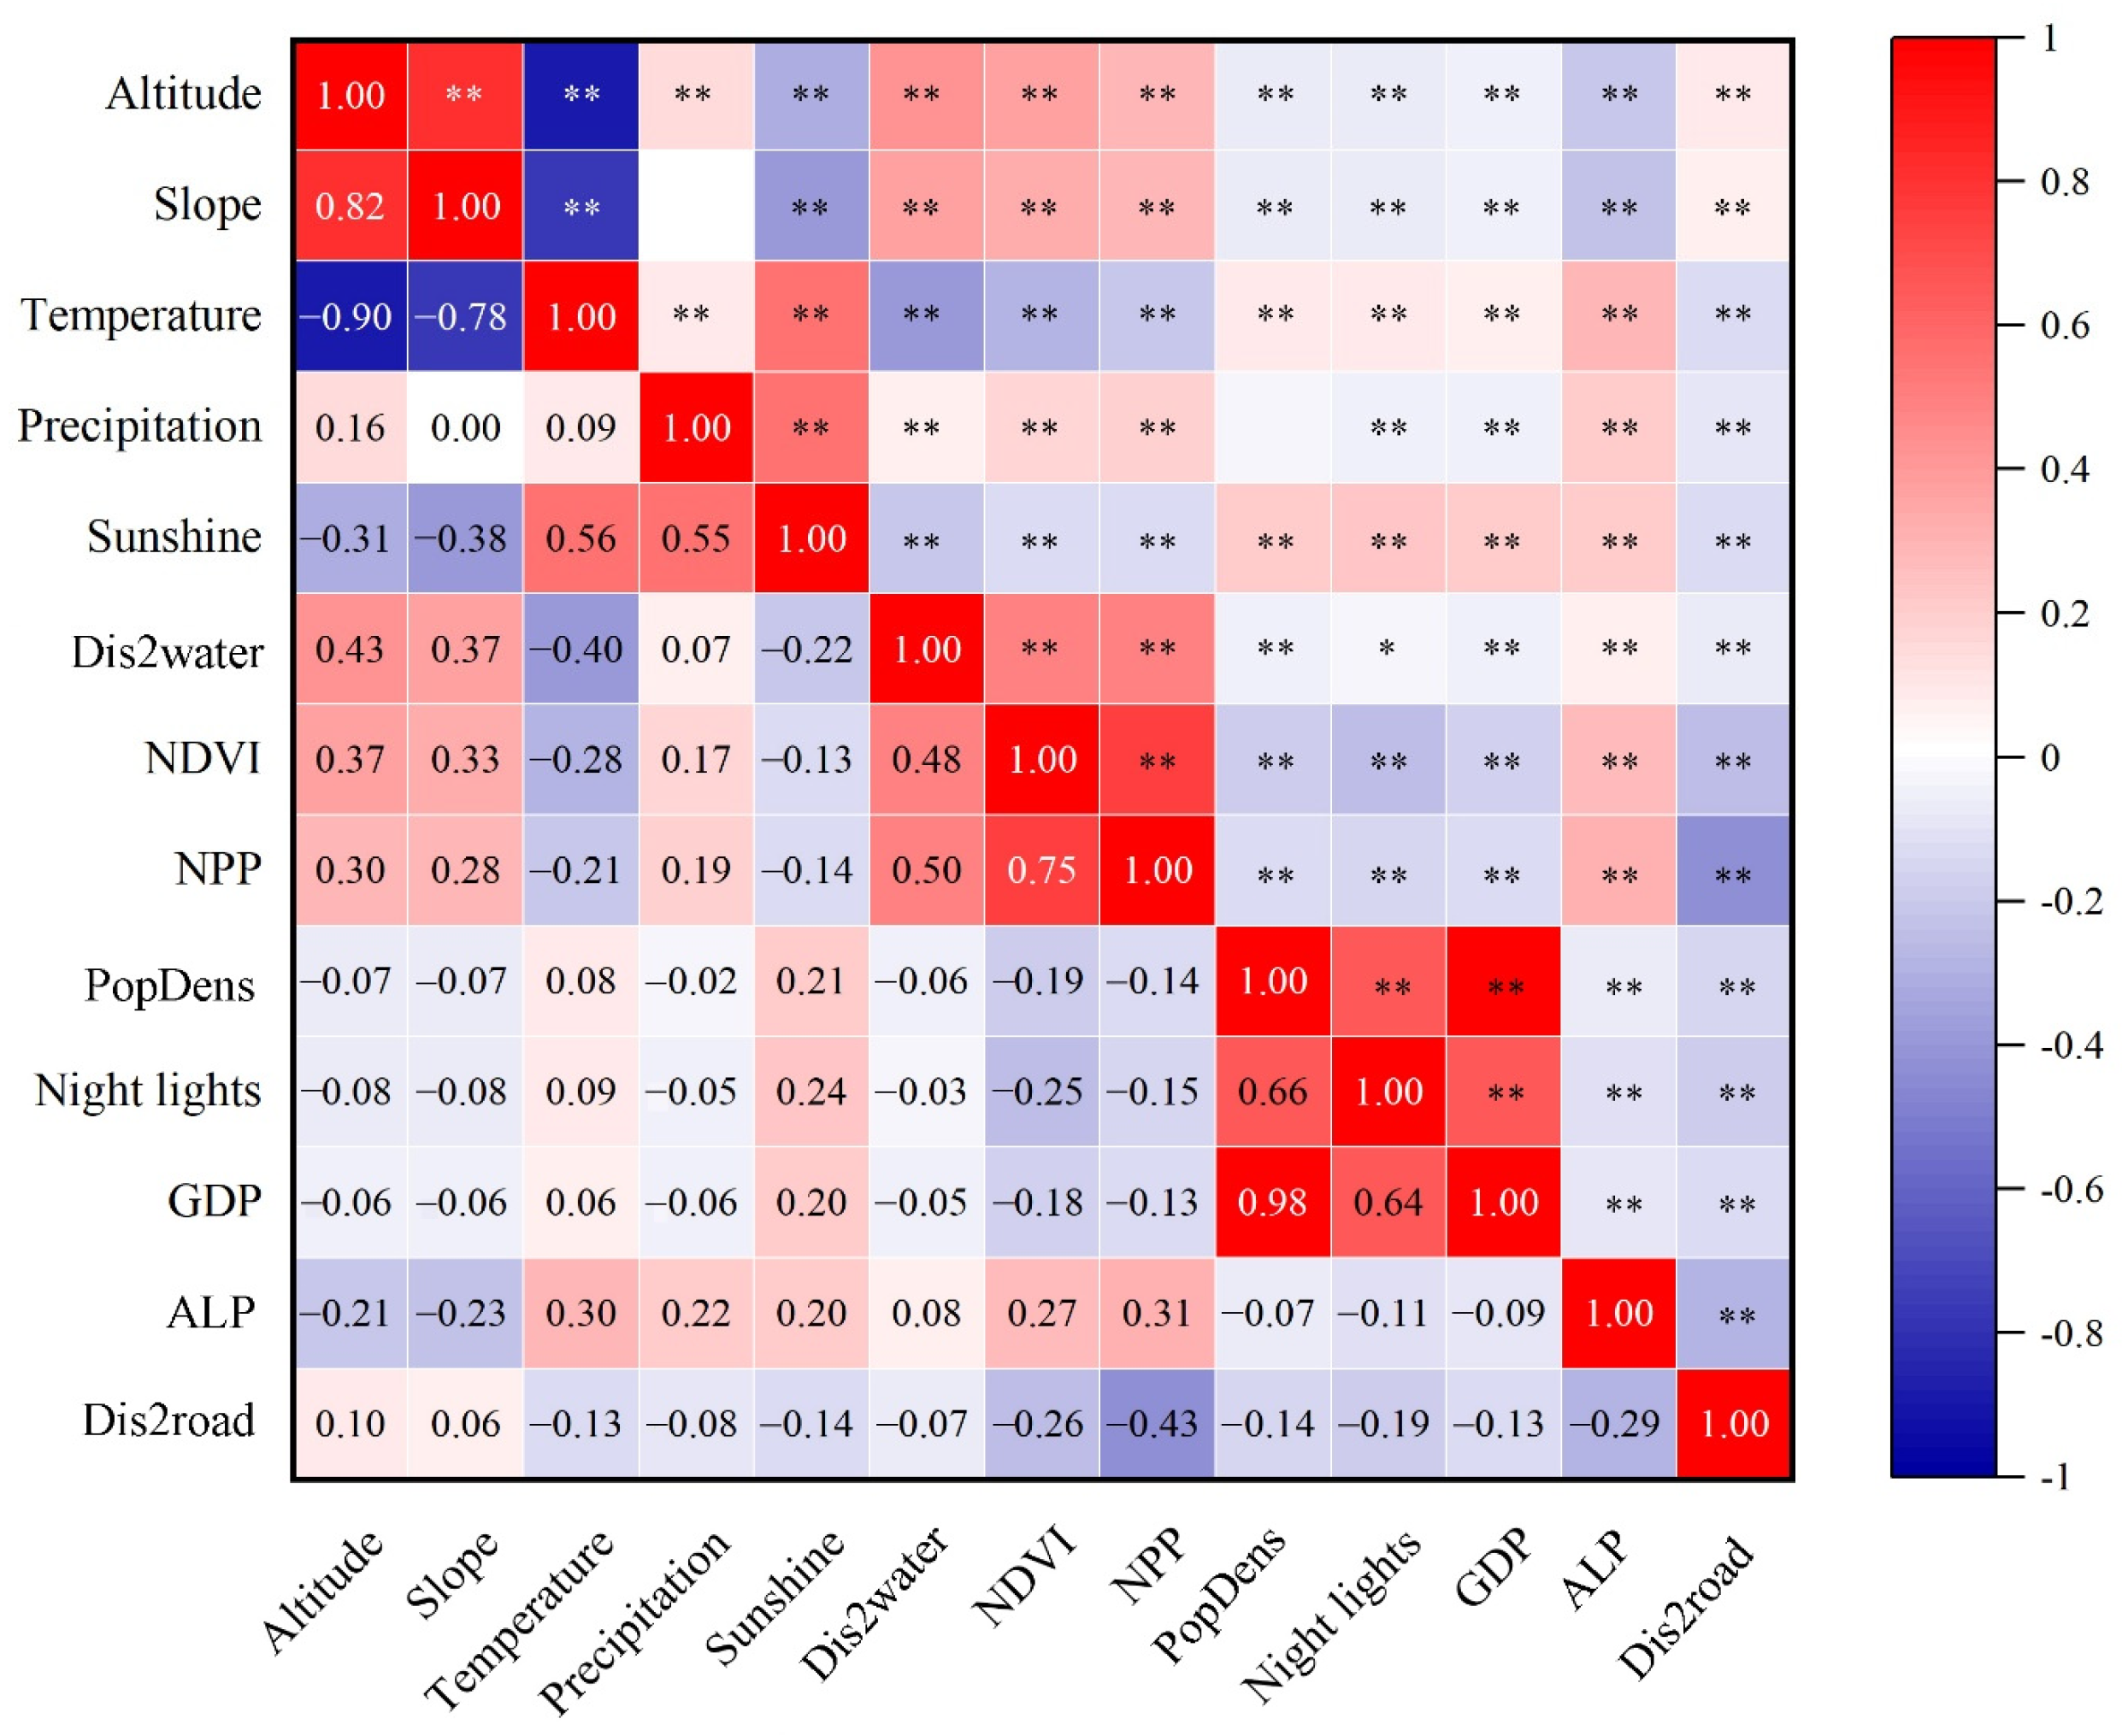
3.2.1. Factor Selection and Model Performance Evaluation

Prior to constructing the machine learning regression models, Pearson correlation coefficient analysis (Figure 6) and VIF checks were performed to avoid multicollinearity among the predictors. Although some machine learning algorithms, such as XGBoost, are less sensitive to multicollinearity compared to traditional linear models, severe multicollinearity can still negatively impact model stability, feature importance interpretation, and generalization performance. Variables with VIF values greater than 10 and excessively high correlation coefficients were eliminated, resulting in the removal of GDP and temperature. Ultimately, eleven predictors were retained. After addressing multicollinearity, both GeoMLR and XGBoost models were trained (Table 5), and their performances were compared. The results indicate that the GeoMLR model outperformed XGBoost, demonstrating superior capability in EQI prediction. Additionally, a spatial autocorrelation analysis of EQI was conducted, yielding a Moran’s I of 0.7512 and a Z-score of 108.91. These findings suggest a significant spatial clustering of EQI in the Poyang Lake Region.

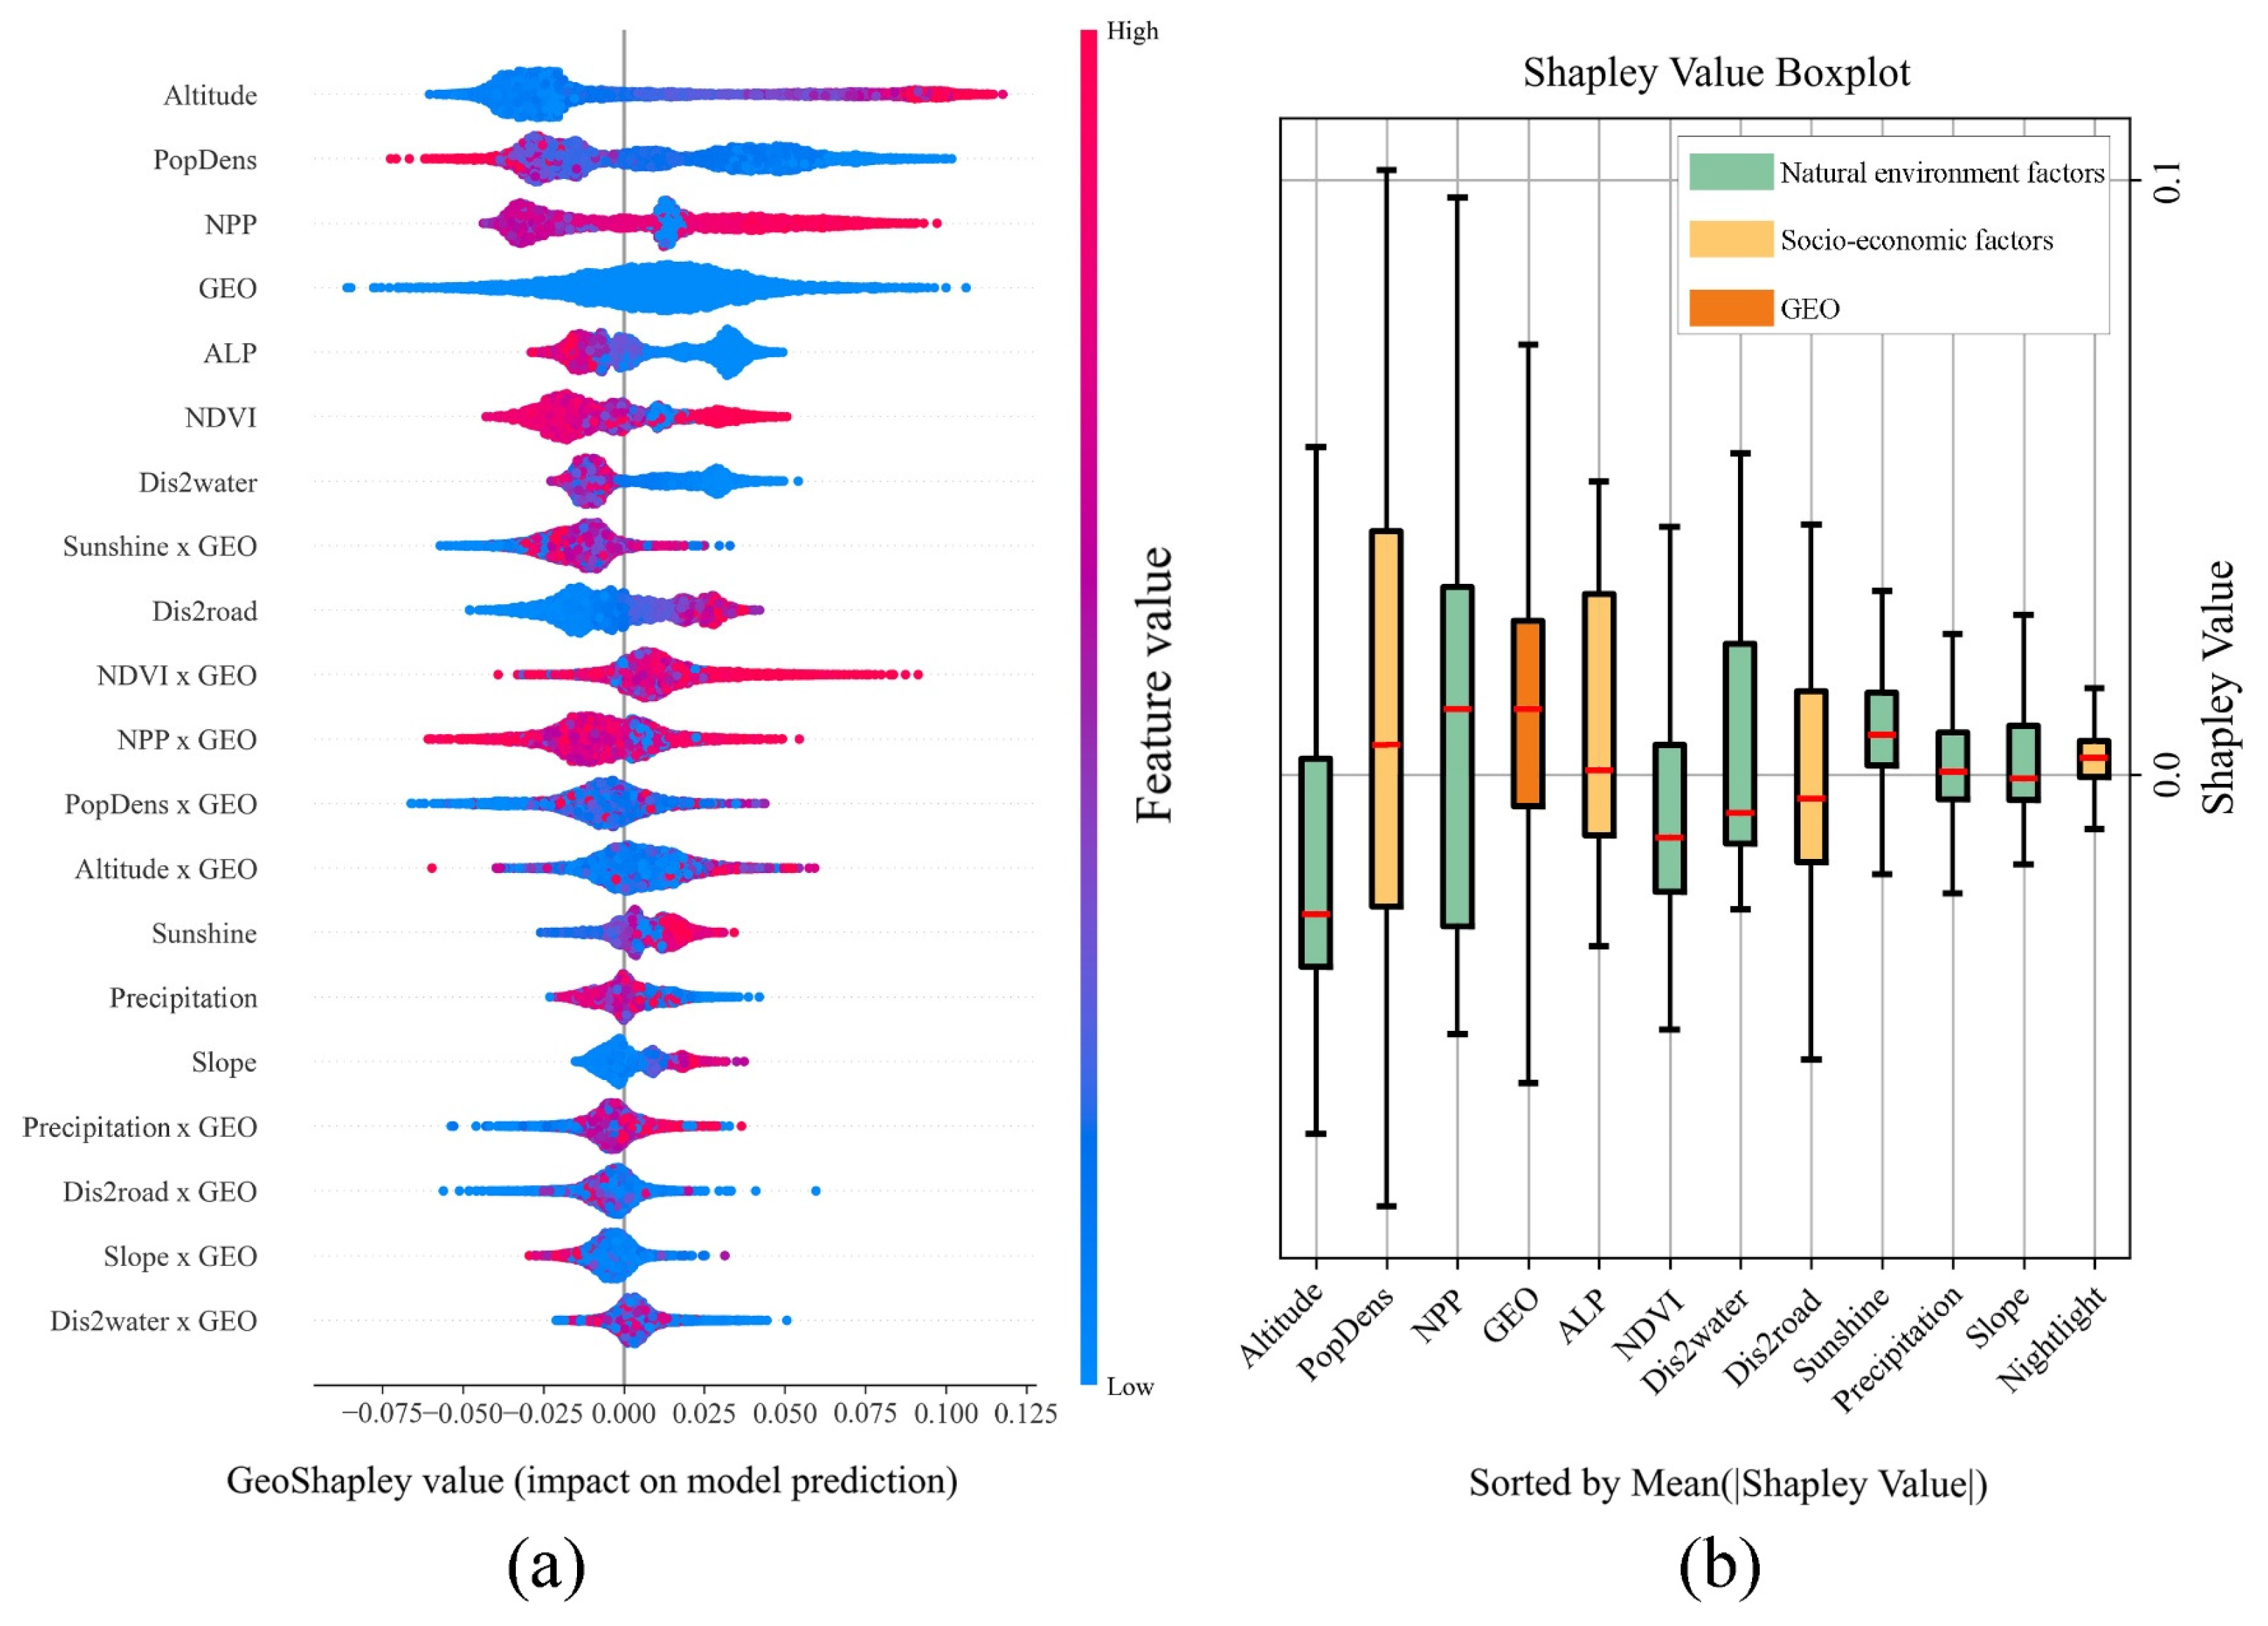
3.2.2. Global Importance and Nonlinear Effects of Factors Influencing EQI

As shown in Figure 7, the Geoshapley summary plot incorporates GEO as a geographic feature and includes the interactions between GEO and other factors in the ranking. GEO represents the combined contribution of geographic coordinates (X and Y) among the input features. However, these contributions also reflect the presence of potential geospatial variables within the complex regional environment that may influence the EQI. Due to the complexity of ecological environments, not all influencing factors can be fully quantified. Although some variables are not explicitly included in the model, their effects can still be indirectly captured through geographic contributions.
The boxplots display the distribution of Shapley values for GEO and the other predictors, which are arranged from left to right according to their global contributions. The results indicate that Altitude, PopDens and NPP exert the greatest influence on the EQI. The central area of the Poyang Lake region is situated on a flat lacustrine plain, encircled by hills and high-altitude mountains including Lushan and Jiuling. This complex topography leads to spatial heterogeneity in vegetation abundance, and the transitional zones between plains and mountains are characterized by significant conflicts between human activities and ecological conservation efforts. Additionally, the Poyang Lake region is one of the most densely populated areas in Jiangxi Province, encompassing major cities such as Nanchang and Jiujiang, and functioning as a critical transportation nexus for urban agglomerations. The flat terrain facilitates extensive urban development and infrastructure construction, which substantially impact the local ecological environment. Slope influences the ecological environment by limiting human activities and shaping local microclimates. Solar radiation and precipitation directly affect plant productivity and regulate the ecosystem’s carbon and water cycling. However, in the Poyang Lake region, the impacts of these three factors are relatively minor due to the predominance of low-elevation plains, limited slope variation, and the relatively uniform distribution of solar radiation and precipitation. Furthermore, the GEO variable is also among the leading contributors to EQI. These findings underscore the critical role of geographical factors in shaping EQI and emphasize the importance of spatial context in geographic modeling and interpretation.
Figure 8 presents the dependence plots of influencing factors derived from three regression models: GWR, XGBoost, and GeoMLR. The GWR model is a spatial statistical linear approach, XGBoost is a machine learning algorithm capable of capturing nonlinear relationships, and GeoMLR integrates geospatial information with nonlinear modeling capabilities. The dependency curves generated by these models elucidate the varying modes and magnitudes by which major influencing factors affect the prediction outcomes.
For the primary influencing factors, namely altitude and population density, all three models demonstrate a consistent pattern of response. The dependency curve for altitude indicates that as altitude increases, its effect on the EQI is initially negative but subsequently becomes positive, peaking at approximately 250 m, after which the positive effect slightly diminishes. In the Poyang Lake region, variations in altitude result in vertical stratification of vegetation types. The central low-altitude zones are predominantly occupied by urban settlements and arable land. As altitude rises, the landscape transitions into hilly terrain where human activities are restricted, and evergreen broad-leaved forests become prevalent, thereby enhancing ecological benefits and improving environmental quality. However, in the northwestern mountainous areas, excessively high altitudes lead to a shift toward mixed coniferous-broadleaf forests and grasslands, which diminishes their positive contributions to ecological quality.
Similarly, the GeoMLR model captures a trend for vegetation factors such as NPP and the NDVI, which initially decrease and subsequently increase. This phenomenon can be attributed to the extensive water coverage in the Poyang Lake region, where low vegetation cover signifies the positive ecological influence of wetlands. As vegetation abundance rises, the area transitions from wetlands to plain construction zones and subsequently to mountainous and hilly regions, thereby exhibiting a decreasing-then-increasing trend. In contrast, this pattern is not captured by either the XGBoost or GWR models.
The dependency curve for ALP in the GeoMLR model reveals an extremum at a value of three, corresponding to the agricultural development restriction zone adjacent to the Poyang Lake wetland protection area. This suggests a balance between agricultural expansion and ecological preservation. The XGBoost model, however, only identifies the negative impact of agricultural development on ecological quality. The GWR model, on the other hand, yields an anomalous trend, suggesting that extensive agricultural development enhances ecological quality. This finding contradicts previous results, which indicate that the conversion of forests and water bodies to agricultural land is a primary driver of ecological degradation. Furthermore, the GWR model also suggests that increased nighttime lighting enhances ecological quality. However, nighttime lighting is generally indicative of intensified urban development, which typically exerts a negative influence on ecological quality.
Overall, the GeoMLR model aligns more closely with real-world conditions and offers more plausible interpretations of the results. Although XGBoost produces similar general trends, it fails to capture finer distinctions among influencing factors. By incorporating geospatial effects, GeoMLR generally exhibits stronger effect sizes compared to XGBoost. The significant spatial correlation among factors further enhances the model’s realism. In contrast, GWR, which is based on linear modeling, can only reflect simple linear relationships and occasionally demonstrates anomalous patterns.

3.3. Spatial Heterogeneity Analysis of Influencing Factors on EQI

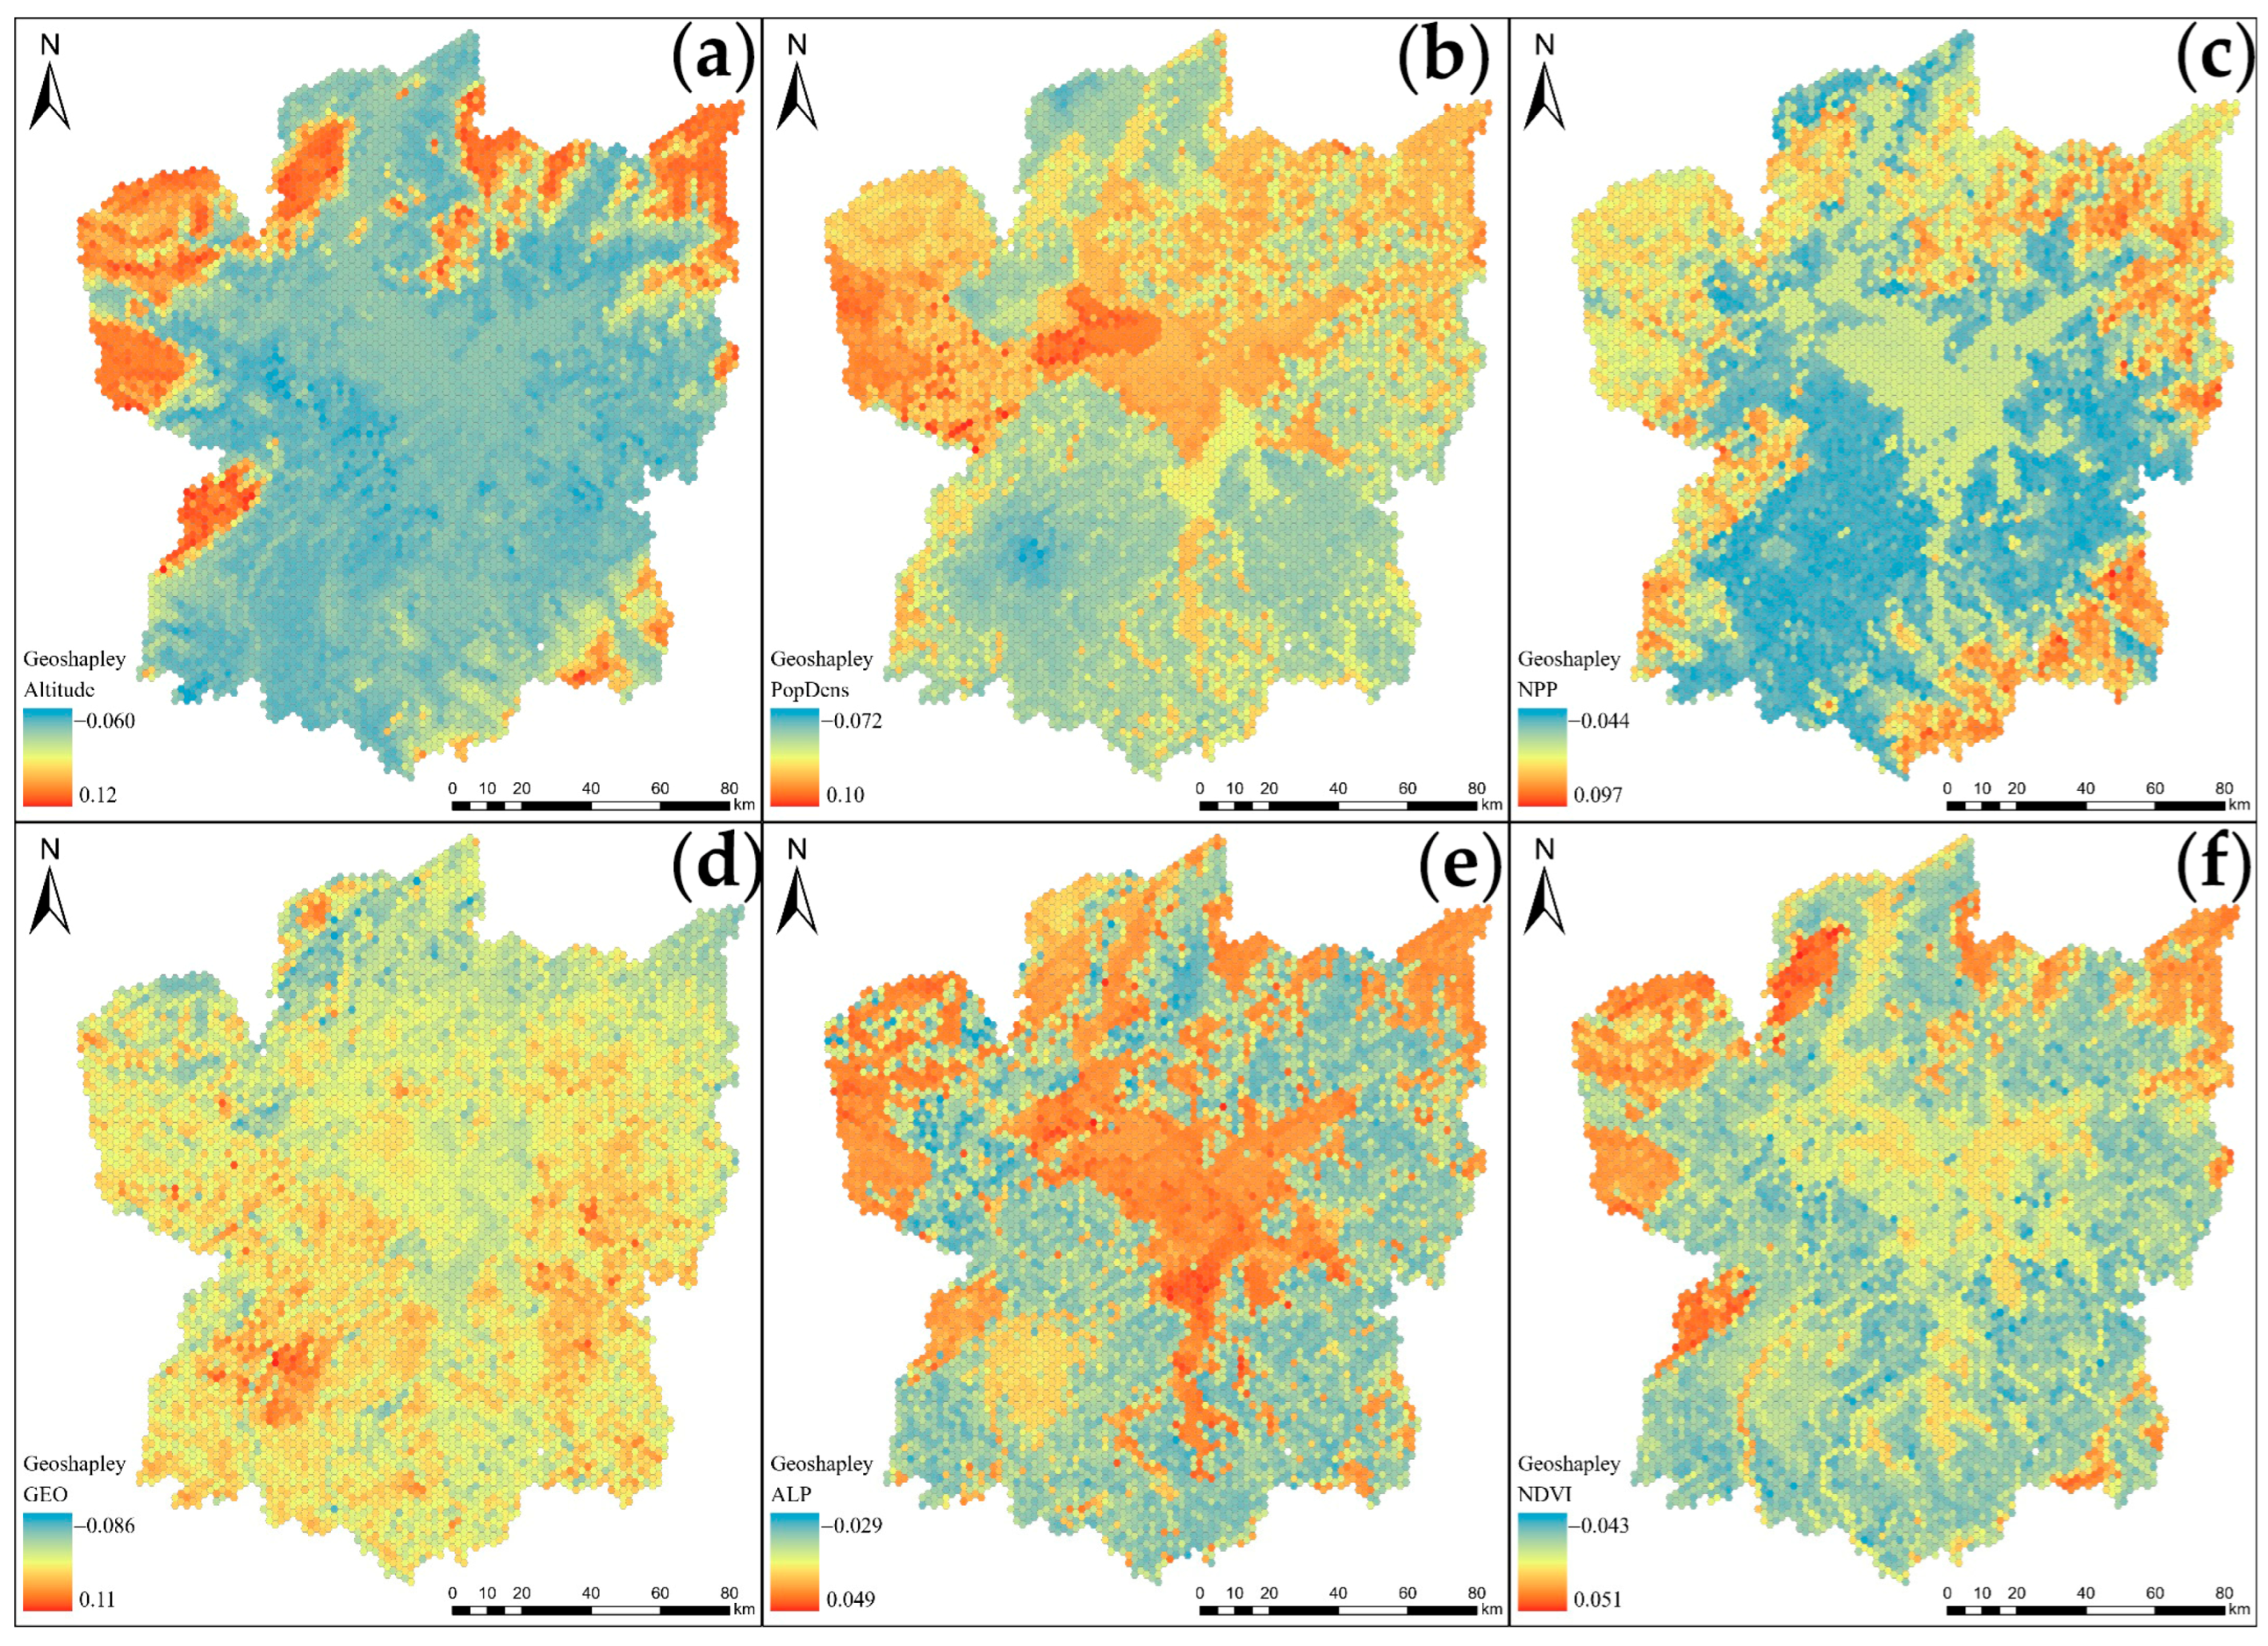
3.3.1. Spatial Distribution of the Geoshapley Values of the Top Six Factors

To better reveal the spatial heterogeneity of factor effects on EQI, we visualized the spatial distribution of Geoshapley values for the top six contributing factors (Figure 9). The results indicate that the spatial patterns of these contributions are largely shaped by the underlying terrain. PopDens and the ALP display comparable spatial distribution patterns, with both variables predominantly concentrated in the Poyang Lake wetland protection area in the central region and the mountainous and hilly areas in the north. These regions are characterized by restrictions on human activities, suggesting that the establishment of the Poyang Lake Wetland Protection Area in Jiangxi Province, which limits agricultural expansion, has contributed positively to ecological conservation in these areas. The spatial distribution of vegetation factors, including NPP and NDVI, is strongly influenced by topographic variation. High NDVI values are primarily observed in mountainous and hilly regions. However, NPP demonstrates a more significant effect in hilly areas at mid-altitudes. As discussed in the previous section, hilly regions are characterized by more diverse and productive vegetation types. These highly productive vegetation types not only enhance regional carbon sequestration but also improve soil retention and water conservation, collectively contributing to improved ecological quality. Additionally, GEO exhibits substantial contributions in the southwestern and southeastern regions, corresponding to urban areas with high population densities. Urban environments are inherently complex and encompass numerous unquantified factors that may indirectly influence ecological conditions through geographic contributions.

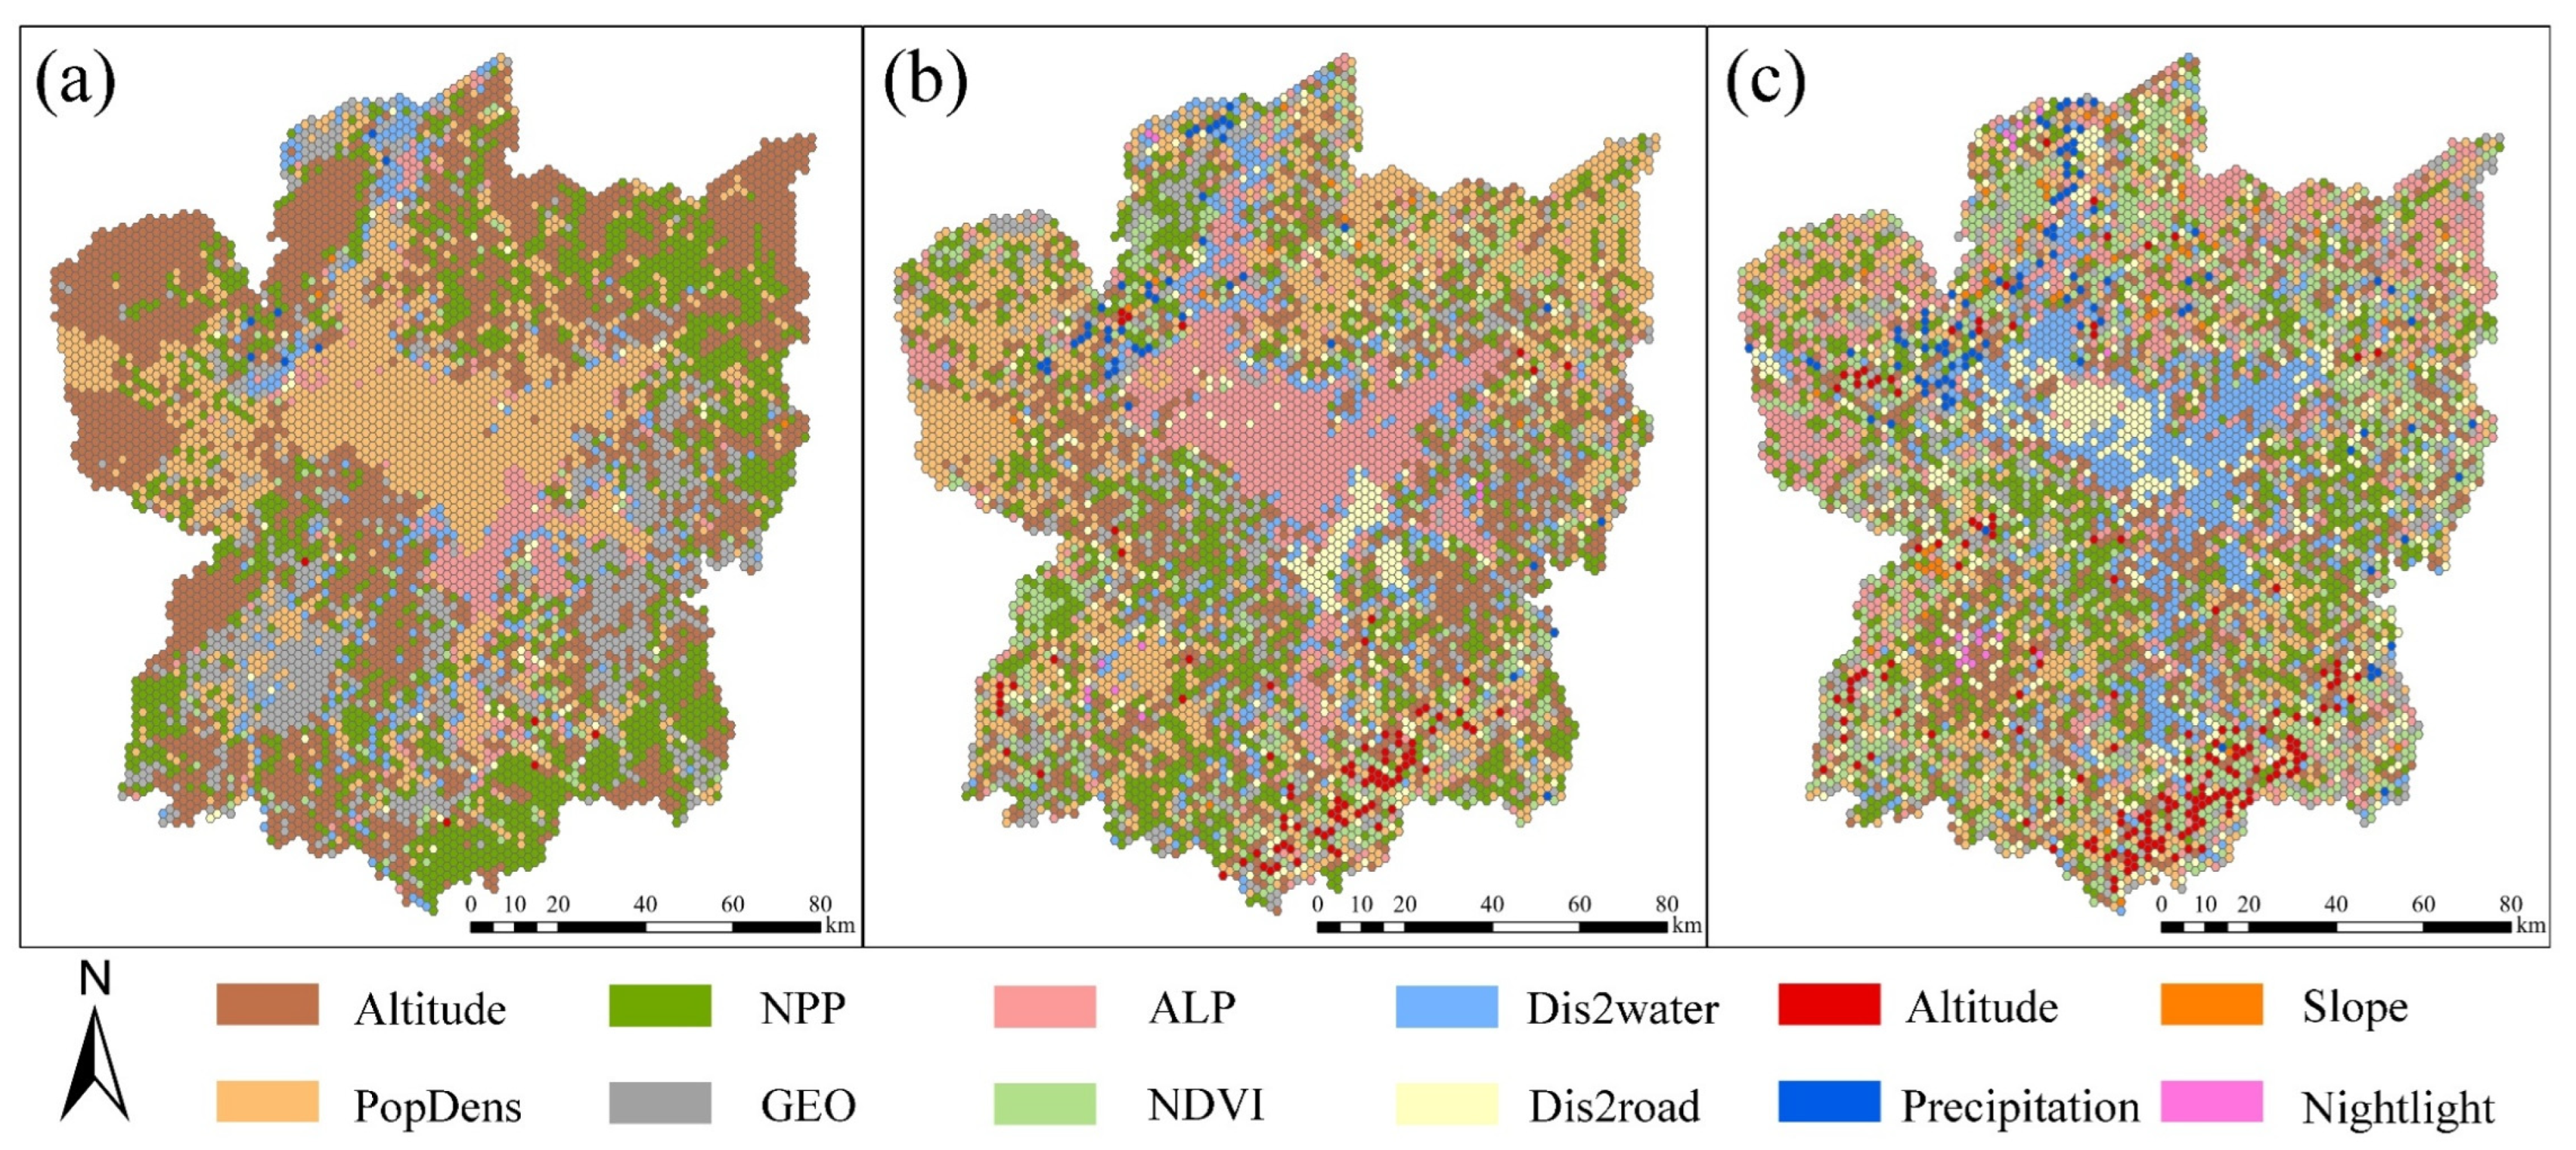
3.3.2. Analysis of Dominant Factors in Different Regions

To formulate more region-specific strategies for sustainable ecological environment protection, the three most influential factors affecting the EQI in each sample were identified and visualized (Figure 10). The results indicate that in high-EQI regions, such as the Poyang Lake area, PopDens and ALP are the two primary determinants. Therefore, for the protection of the Poyang Lake wetland, it is essential to regulate human activities and restrict agricultural expansion to optimize ecological conditions. In the adjacent high-altitude mountainous regions, altitude and NPP are the predominant factors, with population density playing a secondary role. In these areas, where geomorphological features strongly influence ecological quality, human activities are particularly sensitive to environmental changes. Thus, maintaining vegetation with high ecological effectiveness and implementing continuous ecological monitoring are recommended. In densely populated urban areas, GEO has the most significant impact on EQI. Despite the high population density, it is the underlying geological factors, rather than population density, that predominantly influence ecological quality. This finding suggests that in complex urban environments, latent geographical factors can substantially affect EQI. Urban development should prioritize increasing green space coverage, promoting green infrastructure, reducing impervious surfaces, and enhancing ecological resilience. These insights provide important directions for future research on urban ecological environments.

4. Discussion

4.1. Land-Use Transition and Eco-Environmental Effects

This study examines the dynamic patterns of land-use transition and their eco-environmental impacts in the Poyang Lake region from 1990 to 2020, focusing on the interrelations between these changes. The findings indicate a general decline in the overall EQI, with the extent of this change remaining relatively moderate. Land-use transition, influenced by urbanization, industrialization, and ecological restoration policies, demonstrates the dual effects of human activities on eco-environmental quality [51]. Specifically, the transformation of forests and water bodies into agricultural land, urban spaces, and industrial zones is identified as the key driver of ecological degradation. Between 2000 and 2010, the significant expansion of urban residential areas corresponds to findings from studies on China’s rapid urbanization during this phase [52,53]. From 2010 to 2020, industrial production areas experienced noticeable growth as China shifted focus to its “new-type urbanization” strategy [54,55]. The deceleration of urbanization diminished the demand for urban construction, whereas the maturation of industrial sectors facilitated the establishment of industrial parks and corridors [56]. This transition underscores the evolving factors contributing to ecological degradation over distinct timeframes.
The Poyang Lake Plain, as a key agricultural production base in China, exhibits heightened sensitivity to ecological degradation driven by agricultural reclamation activities [57]. Analysis of the proportion of the ECR indicates that converting agricultural land into forest ecological space is most effective for optimizing the EQI. This pattern is consistent with results observed in humid and semi-humid regions, such as the mountainous areas of Chongqing and the Liaoning Urban Agglomeration [12,13]. In contrast, in the arid regions of Northwest China, transforming Gobi and barren land into grassland proves to be the most beneficial approach for ecological restoration [58]. Notably, in large freshwater lake regions such as Poyang Lake and Dongting Lake, converting agricultural land into water bodies is a critical factor for optimizing the EQI. These regions have undergone extensive land reclamation from lakes, leading to significant reductions in lake area, loss of wetlands, and heightened flood risks [59]. Following the catastrophic flood in the Yangtze River Basin in 1998, the “Returning Farmland to Lakes” policy was initiated in the Poyang Lake Basin [60]. Over the past two decades, this policy has yielded remarkable outcomes. In 2020, despite experiencing a once-in-a-century flood, 86% of the rice cultivation area (approximately 3400 km2) in the Poyang Lake Basin remained unaffected by flood damage. Compared to 1998, the total area of inundated rice fields decreased by 58%, substantially mitigating regional economic losses from extreme flooding events and concurrently restoring wetland habitats [61]. This initiative has also generated substantial ecosystem service value. Ni et al. (2012) estimated that the ecological service benefits produced by the “Returning Farmland to Lakes” policy in the Poyang Lake region increased by an average of 66,000 yuan per hectare per year [62]. Furthermore, scenario simulations conducted by Liu et al. (2020) demonstrated that appropriately regulating agricultural development can further enhance ecosystem service value [63]. Therefore, habitat conservation strategies in the Poyang Lake area should prioritize water bodies as the core, expand outward, and establish a rigorous farmland monitoring system to ensure the sustained ecological value of Poyang Lake.

4.2. Exploration of Factors Influencing the EQI

Eco-environmental quality is typically determined by the combined effects of multiple factors. Understanding the mechanisms underlying these influences forms the basis for effective regional ecological management [64]. Previous studies have often relied on spatial statistical methods based on linear regression, which are limited in their ability to capture the complex nonlinear relationships present in real-world systems [12,59]. Alternatively, machine learning approaches have been used, but they frequently neglect spatial characteristics, resulting in a lack of clarity regarding the specific mechanisms involved. To address these gaps, this study introduces the GeoXAI framework, which integrates GeoMLR with Geoshapley to resolve spatial issues inherent in machine learning models.
GeoXAI demonstrates superior performance and provides more realistic and interpretable explanations compared to XGBoost and GWR models. As shown in Section 3.2.2, all three models exhibit consistency in identifying elevation and population density as primary influencing factors. In terms of vegetation, GeoXAI captures realistic patterns specific to the Poyang Lake wetland, revealing that areas with low vegetation cover within the wetland still contribute positively to ecological quality. Additionally, GeoXAI identifies thresholds in balancing agricultural development and ecological protection, suggesting that appropriate utilization can further enhance ecological optimization. However, these critical relationships are not detected by XGBoost and GWR. Therefore, when developing wetland agriculture, urban construction, and traditional farming, the environmental carrying capacity of the Poyang Lake region must be fully considered. Optimizing the spatial distribution of these activities can facilitate the efficient use of wetland resources and promote a spatial pattern conducive to the coordinated development of ecology and agriculture [65].
GeoXAI also provides spatial rankings of dominant factor contributions and quantifies the influence of geographical location. As indicated in Section 3.3, ecologically sensitive regions such as the Poyang Lake water area and high-altitude zones are particularly vulnerable to human activities and agricultural expansion. Areas such as Meiling and Lushan, which are renowned tourist destinations, have experienced growth in the service sector due to tourism, but this has also resulted in significant anthropogenic disturbances [66]. Excessive tourism and human activities may cause irreversible damage to local ecosystems. GEO has the greatest impact in urban areas, highlighting the unique contribution of underlying geographical conditions in complex urban environments. This provides a foundation for future research to explore additional influencing factors. These capabilities demonstrated by GeoXAI are not present in traditional machine learning models such as Random Forest or spatial statistical models like MGWR [12,13].

4.3. Reflection and Prospect of Research

In this study, we innovatively combined the quantitative assessment of land-use transitions with the investigation of the driving mechanisms underlying eco-environmental changes. By introducing advanced GeoXAI methods, we achieved a comprehensive and in-depth analysis of the ecological characteristics of the Poyang Lake region. Furthermore, we proposed several methodological approaches that may benefit future management and conservation of eco-environmental quality. These findings provide both theoretical support and practical guidance for the ecological protection and sustainable development of Poyang Lake and similar regions.
Nevertheless, several limitations should be acknowledged in this study. First, the analysis did not incorporate certain detailed eco-environmental indicators, such as primary industry output and public service levels, due to constraints in data availability and indicator quantification. Future studies should seek to include a broader range of refined indicators as data accessibility improves. In addition, the quantification of policy-related factors was insufficient, limiting a comprehensive assessment of policy impacts on the eco-environment. Future research should employ a wider array of policy indicators and analytical approaches to better evaluate policy feasibility and effectiveness. Finally, the GeoXAI framework requires further refinement, particularly in investigating latent geographical variables. Future work should integrate advanced models and methodologies to enhance explanatory power and extend the application of GeoXAI to other types of ecosystems.

5. Conclusions

This study establishes an innovative framework for evaluating eco-environmental quality using multi-source remote sensing data. We quantitatively analyzed the effects of land-use transitions on eco-environmental quality in the Poyang Lake Region from 1990 to 2020. The GeoXAI method was introduced to investigate the nonlinear and spatially heterogeneous driving mechanisms underlying eco-environmental quality in this region. This approach enabled the visualization of region-specific dominant factors. The main conclusions are as follows:
  • From 1990 to 2020, both APS and ecological space in the Poyang Lake Region continuously declined, while IPS and living space increased substantially. The distribution of the EQI exhibited significant spatial heterogeneity, characterized by higher values in the central region, lower values in the surrounding areas, and relatively higher values at the outermost periphery, forming a concentric pattern. During the study period, the EQI showed a persistent downward trend. The conversion of APS to WES and FES was identified as the main factor contributing to ecological improvement. This finding confirms the ecological benefits of policies such as returning farmland to forest and restoring wetlands in the Poyang Lake Region. In contrast, the encroachment of agricultural and urban residential land on ecological land was the primary cause of ecological degradation.
  • GeoXAI accurately modeled nonlinear spatial relationships and provided geographic variables to detect previously overlooked spatial drivers. Latent geographic factors had a significant impact on eco-environmental quality. Altitude and PopDens were identified as the most influential features, both demonstrating threshold effects. Socio-economic factors consistently exerted negative impacts. The effects of vegetation factors were complex, generally showing an initial decline followed by an increase.
  • Population density was the dominant influencing factor for both high-altitude areas and aquatic environments in the Poyang Lake Region. These areas exhibited high-quality but fragile ecological characteristics and were particularly sensitive to human activities. GEO had a pronounced effect on urban areas. Agricultural development and population aggregation demonstrated threshold effects on ecological quality, indicating that rational allocation can contribute to ecological improvement. The ecological regulatory function of vegetation depended on its ecological benefits, with mid-altitude regions being especially affected.
In summary, this study employed the GeoXAI approach to systematically examine the eco-environmental effects and underlying driving mechanisms in the Poyang Lake region. Based on the analytical results, we proposed targeted strategies for ecological optimization. The findings provide valuable insights for the ecological management of wetland freshwater lake regions such as Poyang Lake, contributing to informed decision-making for sustainable development. Furthermore, the GeoXAI methodology is applicable to other regions, offering novel perspectives for advancing sustainable development in a broader range of developing areas.

Author Contributions

Conceptualization, M.L. and Z.Z.; methodology, M.L., Z.Z. and Y.L.; software, M.L., Z.Z. and J.D.; formal analysis, Z.Z., M.L. and J.D.; data curation, Z.Z.; writing—original draft preparation, M.L., Z.Z. and J.D.; writing—review and editing, J.Z.; supervision, M.L. All authors have read and agreed to the published version of the manuscript.

Funding

This work was supported by the General Project of Humanities and Social Sciences of Universities in Jiangxi Province (Grant No. JC24203) and the Youth Fund Project of the Natural Science Foundation of Jiangxi Province (Grant No. 20242BAB20223).

Data Availability Statement

The data and materials are available from the authors upon request.

Acknowledgments

The authors thank the anonymous reviewers for their valuable comments and suggestions on this article.

Conflicts of Interest

The authors declare that they have no conflicts of interest or personal relationships that could have appeared to influence the work reported in this paper.

References

  1. Yang, Y.; Cai, Z. Ecological Security Assessment of the Guanzhong Plain Urban Agglomeration Based on an Adapted Ecological Footprint Model. J. Clean. Prod. 2020, 260, 120973. [Google Scholar] [CrossRef]
  2. Yang, Y. Evolution of Habitat Quality and Association with Land-Use Changes in Mountainous Areas: A Case Study of the Taihang Mountains in Hebei Province, China. Ecol. Indic. 2021, 129, 107967. [Google Scholar] [CrossRef]
  3. Long, H. Land Use Policy in China: Introduction. Land Use Policy 2014, 40, 1–5. [Google Scholar] [CrossRef]
  4. Winkler, K.; Fuchs, R.; Rounsevell, M.; Herold, M. Global Land Use Changes Are Four Times Greater than Previously Estimated. Nat. Commun. 2021, 12, 2501. [Google Scholar] [CrossRef] [PubMed]
  5. Tian, F.; Li, M.; Han, X.; Liu, H.; Mo, B. A Production–Living–Ecological Space Model for Land-Use Optimisation: A Case Study of the Core Tumen River Region in China. Ecol. Model. 2020, 437, 109310. [Google Scholar] [CrossRef]
  6. Wang, A.; Liao, X.; Tong, Z.; Du, W.; Zhang, J.; Liu, X.; Liu, M. Spatial-Temporal Dynamic Evaluation of the Ecosystem Service Value from the Perspective of “Production-Living-Ecological” Spaces: A Case Study in Dongliao River Basin, China. J. Clean. Prod. 2022, 333, 130218. [Google Scholar] [CrossRef]
  7. Lambin, E.F.; Meyfroidt, P. Global Land Use Change, Economic Globalization, and the Looming Land Scarcity. Proc. Natl. Acad. Sci. USA 2011, 108, 3465–3472. [Google Scholar] [CrossRef]
  8. Hanaček, K.; Rodríguez-Labajos, B. Impacts of Land-Use and Management Changes on Cultural Agroecosystem Services and Environmental Conflicts—A Global Review. Glob. Environ. Change 2018, 50, 41–59. [Google Scholar] [CrossRef]
  9. Lin, G.; Jiang, D.; Fu, J.; Cao, C.; Zhang, D. Spatial Conflict of Production–Living–Ecological Space and Sustainable-Development Scenario Simulation in Yangtze River Delta Agglomerations. Sustainability 2020, 12, 2175. [Google Scholar] [CrossRef]
  10. Newbold, T.; Hudson, L.N.; Hill, S.L.L.; Contu, S.; Lysenko, I.; Senior, R.A.; Börger, L.; Bennett, D.J.; Choimes, A.; Collen, B.; et al. Global Effects of Land Use on Local Terrestrial Biodiversity. Nature 2015, 520, 45–50. [Google Scholar] [CrossRef]
  11. Polasky, S.; Nelson, E.; Pennington, D.; Johnson, K.A. The Impact of Land-Use Change on Ecosystem Services, Biodiversity and Returns to Landowners: A Case Study in the State of Minnesota. Environ. Resour. Econ. 2011, 48, 219–242. [Google Scholar] [CrossRef]
  12. Pang, R.; Hu, N.; Zhou, J.; Sun, D.; Ye, H. Study on Eco-Environmental Effects of Land-Use Transitions and Their Influencing Factors in the Central and Southern Liaoning Urban Agglomeration: A Production–Living–Ecological Perspective. Land 2022, 11, 937. [Google Scholar] [CrossRef]
  13. Zhang, S.; Liu, S.; Zhong, Q.; Zhu, K.; Fu, H. Assessing Eco-Environmental Effects and Its Impacts Mechanisms in the Mountainous City: Insights from Ecological–Production–Living Spaces Using Machine Learning Models in Chongqing. Land 2024, 13, 1196. [Google Scholar] [CrossRef]
  14. Zhou, Q.; Zhu, M.; Qiao, Y.; Zhang, X.; Chen, J. Achieving Resilience through Smart Cities? Evidence from China. Habitat Int. 2021, 111, 102348. [Google Scholar] [CrossRef]
  15. Li, J.; Sun, W.; Li, M.; Meng, L. Coupling Coordination Degree of Production, Living and Ecological Spaces and Its Influencing Factors in the Yellow River Basin. J. Clean. Prod. 2021, 298, 126803. [Google Scholar] [CrossRef]
  16. Wang, D.; Jiang, D.; Fu, J.; Lin, G.; Zhang, J. Comprehensive Assessment of Production–Living–Ecological Space Based on the Coupling Coordination Degree Model. Sustainability 2020, 12, 2009. [Google Scholar] [CrossRef]
  17. Mo, Y.; Bao, Y.; Wang, Z.; Wei, W.; Chen, X. Spatial Coupling Relationship between Architectural Landscape Characteristics and Urban Heat Island in Different Urban Functional Zones. Build. Environ. 2024, 257, 111545. [Google Scholar] [CrossRef]
  18. Zhou, Y.; Cao, W.; Zhou, J. Land-Use Transfer and Its Ecological Effects in Rapidly Urbanizing Areas: A Case Study of Nanjing, China. Sustainability 2024, 16, 10615. [Google Scholar] [CrossRef]
  19. Zhang, Y.; Lin, W.; Ren, E.; Yu, Y. Evaluation of Spatial Distribution of Carbon Emissions from Land Use and Environmental Parameters: A Case Study in the Yangtze River Delta Demonstration Zone. Ecol. Indic. 2024, 158, 111496. [Google Scholar] [CrossRef]
  20. Wang, A. Spatiotemporal Variation of Ecological Carrying Capacity in Dongliao River Basin, China. Ecol. Indic. 2022, 135, 108548. [Google Scholar] [CrossRef]
  21. Zhang, L.; Zhang, H.; Xu, E. Information Entropy and Elasticity Analysis of the Land Use Structure Change Influencing Eco-Environmental Quality in Qinghai-Tibet Plateau from 1990 to 2015. Environ. Sci. Pollut Res. 2022, 29, 18348–18364. [Google Scholar] [CrossRef] [PubMed]
  22. Wu, X.; Ding, J.; Lu, B.; Wan, Y.; Shi, L.; Wen, Q. Eco-Environmental Effects of Changes in Territorial Spatial Pattern and Their Driving Forces in Qinghai, China (1980–2020). Land 2022, 11, 1772. [Google Scholar] [CrossRef]
  23. Zhang, H.; Zhou, Q.; Yang, J.; Xiang, H. Change and Driving Factors of Eco-Environmental Quality in Beijing Green Belts: From the Perspective of Nature-Based Solutions. Ecol. Indic. 2024, 166, 112581. [Google Scholar] [CrossRef]
  24. Li, H.; Fang, C.; Xia, Y.; Liu, Z.; Wang, W. Multi-Scenario Simulation of Production-Living-Ecological Space in the Poyang Lake Area Based on Remote Sensing and RF-Markov-FLUS Model. Remote Sens. 2022, 14, 2830. [Google Scholar] [CrossRef]
  25. Hu, J.; Zhang, J.; Li, Y. Exploring the Spatial and Temporal Driving Mechanisms of Landscape Patterns on Habitat Quality in a City Undergoing Rapid Urbanization Based on GTWR and MGWR: The Case of Nanjing, China. Ecol. Indic. 2022, 143, 109333. [Google Scholar] [CrossRef]
  26. Wang, H.; Liu, C.; Zang, F.; Liu, Y.; Chang, Y.; Huang, G.; Fu, G.; Zhao, C.; Liu, X. Remote Sensing-Based Approach for the Assessing of Ecological Environmental Quality Variations Using Google Earth Engine: A Case Study in the Qilian Mountains, Northwest China. Remote Sens. 2023, 15, 960. [Google Scholar] [CrossRef]
  27. Vachon, J.; Kerckhoffs, J.; Buteau, S.; Smargiassi, A. Do Machine Learning Methods Improve Prediction of Ambient Air Pollutants with High Spatial Contrast? A Systematic Review. Environ. Res. 2024, 262, 119751. [Google Scholar] [CrossRef]
  28. He, H.; Wang, J.; Ding, J.; Wang, L. Spatial Downscaling of Precipitation Data in Arid Regions Based on the XGBoost-MGWR Model: A Case Study of the Turpan–Hami Region. Land 2024, 13, 448. [Google Scholar] [CrossRef]
  29. Zhang, J.; Li, Y.; Fukuda, T.; Wang, B. Urban Safety Perception Assessments via Integrating Multimodal Large Language Models with Street View Images. Cities 2025, 165, 106122. [Google Scholar] [CrossRef]
  30. Cutler, D.R.; Edwards, T.C.; Beard, K.H.; Cutler, A.; Hess, K.T.; Gibson, J.; Lawler, J.J. Random Forests for Classification in Ecology. Ecology 2007, 88, 2783–2792. [Google Scholar] [CrossRef]
  31. Ke, E.; Zhao, J.; Zhao, Y. Investigating the Influence of Nonlinear Spatial Heterogeneity in Urban Flooding Factors Using Geographic Explainable Artificial Intelligence. J. Hydrol. 2025, 648, 132398. [Google Scholar] [CrossRef]
  32. Foroutan, E.; Hu, T.; Li, Z. Revealing Key Factors of Heat-Related Illnesses Using Geospatial Explainable AI Model: A Case Study in Texas, USA. Sustain. Cities Soc. 2025, 122, 106243. [Google Scholar] [CrossRef]
  33. Chen, Q.; Xu, X.; Wu, M.; Wen, J.; Zou, J. Assessing the Water Conservation Function Based on the InVEST Model: Taking Poyang Lake Region as an Example. Land 2022, 11, 2228. [Google Scholar] [CrossRef]
  34. Wu, H.; Huang, Q.; Fu, C.; Song, F.; Liu, J.; Li, J. Stable Isotope Signatures of River and Lake Water from Poyang Lake, China: Implications for River–Lake Interactions. J. Hydrol. 2021, 592, 125619. [Google Scholar] [CrossRef]
  35. Zhu, Z.; Huai, W.; Yang, Z.; Li, D.; Wang, Y. Assessing Habitat Suitability and Habitat Fragmentation for Endangered Siberian Cranes in Poyang Lake Region, China. Ecol. Indic. 2021, 125, 107594. [Google Scholar] [CrossRef]
  36. Zhang, J.; Laghari, A.A.; Guo, Q.; Liang, J.; Kumar, A.; Liu, Z.; Shen, Y.; Wei, Y. Evolution of Land Use and Its Hydrological Effects in the Fenhe River Basin Under the Production–Living–Ecological Space Perspective. Sustainability 2024, 16, 11170. [Google Scholar] [CrossRef]
  37. Su, X.; Wang, M.; Zeng, Y.; Gong, J. Land Use Transformation Based on Production-Living-Ecological Space and Associated Eco-Environment Effects: Evidence from the Upper Reaches of the Yangtze River, China. Res. Sq. 2023. [Google Scholar] [CrossRef]
  38. Li, X.; Fang, C.; Huang, J.; Mao, H. The Urban Land Use Transformations and Associated Effects on Eco-Environment in Northwest China Arid Region: A Case Study in Hexi Region, Gansu Province. Quat. Sci. 2003, 23, 280–290. [Google Scholar]
  39. Wang, S.; Liu, Z.; Chen, Y.; Fang, C. Factors Influencing Ecosystem Services in the Pearl River Delta, China: Spatiotemporal Differentiation and Varying Importance. Resour. Conserv. Recycl. 2021, 168, 105477. [Google Scholar] [CrossRef]
  40. Li, P.; Wang, J.; Liu, M.; Xue, Z.; Bagherzadeh, A.; Liu, M. Spatio-Temporal Variation Characteristics of NDVI and Its Response to Climate on the Loess Plateau from 1985 to 2015. Catena 2021, 203, 105331. [Google Scholar] [CrossRef]
  41. Li, K.; Zhang, B.; Xiao, W.; Lu, Y. Land Use Transformation Based on Production–Living–Ecological Space and Associated Eco-Environment Effects: A Case Study in the Yangtze River Delta Urban Agglomeration. Land 2022, 11, 1076. [Google Scholar] [CrossRef]
  42. Wang, H. Regional Ecological Risk Assessment with Respect to Human Disturbance in the Poyang Lake Region (PYLR) Using Production–Living–Ecology Analysis. J. Indian Soc. Remote Sens. 2021, 49, 449–460. [Google Scholar] [CrossRef]
  43. Yang, W.; Li, Y.; Liu, Y.; Fan, P.; Yue, W. Environmental Factors for Outdoor Jogging in Beijing: Insights from Using Explainable Spatial Machine Learning and Massive Trajectory Data. Landsc. Urban Plan. 2024, 243, 104969. [Google Scholar] [CrossRef]
  44. Wei, L.; Liu, Z. Transportation Infrastructure and Eco-Environmental Quality: Evidence from China’s High-Speed Rail. PLoS ONE 2023, 18, e0290840. [Google Scholar] [CrossRef]
  45. Cao, J.; Li, T. Analysis of Spatiotemporal Changes in Cultural Heritage Protected Cities and Their Influencing Factors: Evidence from China. Ecol. Indic. 2023, 151, 110327. [Google Scholar] [CrossRef]
  46. Shen, Z.; Gong, J. Spatial–Temporal Changes and Driving Mechanisms of Ecological Environmental Quality in the Qinghai–Tibet Plateau, China. Land 2024, 13, 2203. [Google Scholar] [CrossRef]
  47. Hou, Y.; Chen, Y.; Ding, J.; Li, Z.; Li, Y.; Sun, F. Ecological Impacts of Land Use Change in the Arid Tarim River Basin of China. Remote Sens. 2022, 14, 1894. [Google Scholar] [CrossRef]
  48. Liu, L. An Ensemble Framework for Explainable Geospatial Machine Learning Models. Int. J. Appl. Earth Obs. Geoinf. 2024, 132, 104036. [Google Scholar] [CrossRef]
  49. Li, Z. GeoShapley: A Game Theory Approach to Measuring Spatial Effects in Machine Learning Models. Ann. Am. Assoc. Geogr. 2024, 114, 1365–1385. [Google Scholar] [CrossRef]
  50. Wang, W.; Yang, P.; Xia, J.; Zhang, S.; Hu, S. Changes in the Water Environment and Its Major Driving Factors in Poyang Lake from 2016 to 2019, China. Environ. Sci. Pollut. Res. 2023, 30, 3182–3196. [Google Scholar] [CrossRef]
  51. Pan, F.; Shu, N.; Wan, Q.; Huang, Q. Land Use Function Transition and Associated Ecosystem Service Value Effects Based on Production–Living–Ecological Space: A Case Study in the Three Gorges Reservoir Area. Land 2023, 12, 391. [Google Scholar] [CrossRef]
  52. Ge, Y.; Dou, W.; Wang, X.; Chen, Y.; Zhang, Z. Identifying Urban–Rural Differences in Social Vulnerability to Natural Hazards: A Case Study of China. Nat. Hazards 2021, 108, 2629–2651. [Google Scholar] [CrossRef]
  53. Zhang, H.; Chen, M.; Liang, C. Urbanization of County in China: Spatial Patterns and Influencing Factors. J. Geogr. Sci. 2022, 32, 1241–1260. [Google Scholar] [CrossRef]
  54. Xu, C.; Qian, C.; Yang, W.; Li, B.; Kong, L.; Kong, F. Spatiotemporal Pattern of Urban-Rural Integration Development and Its Driving Mechanism Analysis in Hangzhou Bay Urban Agglomeration. Int. J. Environ. Res. Public Health 2022, 19, 8390. [Google Scholar] [CrossRef]
  55. Li, R.; Huang, X.; Liu, Y. Spatio-Temporal Differentiation and Influencing Factors of China’s Urbanization from 2010 to 2020. Acta Geogr. Sin 2023, 78, 777–791. [Google Scholar]
  56. Zhao, D.; Liu, K.; Li, J.; Zhai, J. Spatial Reconstruction and Determinants of Industrial Land in China’s Urban Expansion: A Theoretical Framework. Land 2025, 14, 213. [Google Scholar] [CrossRef]
  57. Jiang, L.; Wu, S.; Liu, Y. Change Analysis on the Spatio-Temporal Patterns of Main Crop Planting in the Middle Yangtze Plain. Remote Sens. 2022, 14, 1141. [Google Scholar] [CrossRef]
  58. Lu, X.; Chen, Y.; Fan, X.; Liu, X. Effects of Land Use Transition on Regional Ecological Environment—A Case Study of Zhaosu County, Xinjiang. Land 2024, 13, 2149. [Google Scholar] [CrossRef]
  59. Wang, Z.Y.; Wan, D.; Liao, J.J.; Lu, J.T.; Wu, F.; Wang, L.K. Ecological Environment Effect and Driving Factors of Transformation of Production-Living-Ecological Space in Dongting Lake Eco-Economic Zone. Sci. Technol. Eng 2023, 23, 3876–3888. [Google Scholar]
  60. Wang, C.; Xie, W.; Li, T.; Wu, G.; Wu, Y.; Wang, Q.; Xu, Z.; Song, H.; Yang, Y.; Pan, X. Analysis of Spatial and Temporal Variation in Water Coverage in the Sub-Lakes of Poyang Lake Based on Multi-Source Remote Sensing. Remote Sens. 2023, 15, 2788. [Google Scholar] [CrossRef]
  61. Liu, R.; Dong, J.; Jiang, L.; Ge, Y.; Fan, C.; Yang, T.; Zhang, G. Agricultural Flood Resistance Enhanced after Returning Farmlands to Lakes. Proc. Natl. Acad. Sci. USA 2024, 121, e2410967121. [Google Scholar] [CrossRef]
  62. Ni, C.-Y.; Wang, W.-Q.; Zeng, H.; Huang, H.-P. The Study on Eco-Compensation of the Returning Field in Lakeside Areas to Poyang Lake (II)–Assessment of Compensation Standards for the Double-Returned Areas in Poyang Lake Wetlands. J. Jiangxi Norm. Univ. (Nat. Sci. Ed.) 2010, 34, 541–546. [Google Scholar]
  63. Liu, H.; Zheng, L.; Wu, J.; Liao, Y. Past and Future Ecosystem Service Trade-Offs in Poyang Lake Basin under Different Land Use Policy Scenarios. Arab. J. Geosci. 2020, 13, 46. [Google Scholar] [CrossRef]
  64. Xu, Y.; Li, P.; Pan, J.; Zhang, Y.; Dang, X.; Cao, X.; Cui, J.; Yang, Z. Eco-Environmental Effects and Spatial Heterogeneity of “Production-Ecology-Living” Land Use Transformation: A Case Study for Ningxia, China. Sustainability 2022, 14, 9659. [Google Scholar] [CrossRef]
  65. Wu, B.; Liu, M.; Wan, Y.; Song, Z. Evolution and Coordination of Cultivated Land Multifunctionality in Poyang Lake Ecological Economic Zone. Sustainability 2023, 15, 5307. [Google Scholar] [CrossRef]
  66. Rao, J.; Ouyang, X.; Pan, P.; Huang, C.; Li, J.; Ye, Q. Ecological Risk Assessment of Forest Landscapes in Lushan National Nature Reserve in Jiangxi Province, China. Forests 2024, 15, 484. [Google Scholar] [CrossRef]
Figure 1. Geographical location of the Poyang Lake region.
Land 14 01361 g001
Figure 2. Research framework.
Land 14 01361 g002
Figure 3. PLES land-use distribution and transitions in the Poyang Lake region during 1980–2020. (a) PLES land-use distribution; (b) Chord diagram of the land-use transition matrix; (c) Percentage composition of PLES land-use.
Land 14 01361 g003
Figure 4. Area (1990, 2000, 2010, 2020) and dynamic changes (1990–2000, 2000–2010, 2010–2020, 1990–2020) of PLES land-use.
Land 14 01361 g004
Figure 5. Spatiotemporal changes in EQI in the Poyang Lake region during 1980–2020. (a) Spatial pattern of EQI; (b) Mean value of EQI; (c) Percentage of EQI at different levels.
Land 14 01361 g005
Figure 6. Pearson correlation coefficient analysis of influencing factors. ** p < 0.01.
Land 14 01361 g006
Figure 7. Geoshapley summary plot (a) and boxplots (b) of GeoMLR.
Land 14 01361 g007
Figure 8. Dependence plots for all factors across the three models. The red line represents GeoMLR, the blue line represents XGboost, and the green line represents GWR. The shaded area represents the 95% confidence interval.
Land 14 01361 g008
Figure 9. Spatial distribution of Geoshapley values for the top six contributing factors in the GeoMLR model. (a) Altitude; (b) PopDens; (c) NPP; (d) GEO; (e) ALP; (f) NDVI.
Land 14 01361 g009
Figure 10. Spatial distribution of the first (a), second (b), and third (c) dominant factors affecting EQI, In the Poyang Lake and high-altitude mountainous areas, where EQI is higher, the dominant factors contributing to EQI are primarily PopDens, ALP and Altitude.
Land 14 01361 g010
Table 1. Spatial classification of PLES and its EQI in Poyang Lake region.
Dominant Function Classification of PLES Land-UseLand-Use Classification System Secondary Land TypeEco-Environmental Quality Index
Primary TypeSecondary Type
Production spaceAgricultural production space (APS)Paddy field, dry land0.29
Industrial production space (IPS)Industrial and transport construction land0.15
Living spaceUrban living space (ULS)Urban land0.20
Rural living space (RLS)Rural residential land0.20
Ecological spaceForest ecological space (FES)Forest land, shrub forest land, sparse forest land, other forest land0.77
Grass ecological space (GES)High coverage grassland, medium coverage grassland, low coverage grassland0.60
Water ecological space (WES)Canals, lakes, reservoirs, shoals0.62
Other ecological space (OES)Swampland, bare land, bare rocky land0.65
Table 2. Selection of influencing factors.
Primary IndexSecondary IndexSpecific IndexesTime/ResolutionDescription
Natural environmental factorsTopographic factorsAltitude2020/30 mExpressing the impact of topography on eco-environmental quality
Slope2020/30 m
Climatic factorsTemperature2020/30 mExpressing the impact of climate on eco-environmental quality
Precipitation2020/30 m
Sunshine2020/30 m
Hydrological factorsDistance to river2020/30 mExpressing the impact of hydrological conditions on eco-environment quality
Vegetation factorsNDVI2020/30 mExpressing the impact of vegetation purification on eco-environmental quality
NPP2020/30 m
Socio-economic factorsPopulation factorsPopulation density2020/0.1 kmExpressing the impact of land-use demand on eco-environmental quality
Economic factorsNight lights2020/30 mExpressing the impact of human activities, economic development, and industrialization on eco-environmental quality
GDP2020/1 km
Agricultural land percentage2020/30 m
Transportation factorsDistance to road2020/30 mExpressing the impact of regional human flow and logistics on eco-environmental quality
Table 3. Example of a land-use transition matrix.
APS in 2020ULS in 2020FES in 2020Total
APS in 2010801010100
ULS in 20105905100
FES in 20102395100
Total87103110300
Table 4. The main land-use transformation and ECR that affect the EQI.
Change Trend1990–20002000–2010
Land-Use Function TransformationECRContribution ProportionLand-Use Function TransformationECRContribution Proportion
Eco-environmental improvementAPS~WES0.00070868.39%APS~WES0.00175141.02%
APS~FES0.00025224.32%APS~FES0.00137932.30%
APS~GES0.0000085.18%GES~FES0.0003548.29%
GES~FES0.0000540.80%APS~OES0.0001333.11%
WES~FES0.0000050.52%WES~FES0.0001252.93%
OES~FES0.0000030.28%IPS~WES0.0000841.96%
APS~GES0.0000771.80%
WES~OES0.0000741.74%
total0.00103099.49%total0.00397693.14%
Eco-environment degradationWES~APS0.00048638.24%WES~APS0.00411036.33%
FES~APS0.00018914.89%FES~APS0.00209718.54%
FES~ULS0.00018514.52%APS~ULS0.0007826.91%
APS~ULS0.0001199.34%OES~WES0.0006345.61%
FES~IPS0.0000907.11%GES~APS0.0006135.42%
APS~IPS0.0000544.28%FES~ULS0.0005665.00%
WES~ULS0.0000534.17%WES~ULS0.0005344.72%
FES~GES0.0000403.16%FES~IPS0.0005044.46%
total0.00121795.71%total0.00984286.98%
Change Trend2010–20201990–2020
Land-Use Function TransformationECRContribution ProportionLand-Use Function TransformationECRContribution Proportion
Eco-environmental improvementAPS~FES0.00376762.93%APS~FES0.00428047.54%
APS~WES0.00125020.88%APS~WES0.00287831.96%
APS~GES0.0002434.06%GES~FES0.0004745.27%
RLS~APS0.0001522.54%IPS~WES0.0002723.02%
GES~FES0.0001111.86%APS~GES0.0002632.93%
WES~FES0.0000851.42%RLS~APS0.0001651.83%
RLS~FES0.0000721.20%WES~FES0.0001481.65%
RLS~WES0.0000611.03%APS~OES0.0001261.40%
total0.00574195.90%total0.00860695.59%
Eco-environmental degradationFES~APS0.00390340.06%FES~APS0.00508725.59%
FES~IPS0.00179718.44%WES~APS0.00462223.25%
APS~IPS0.00123412.66%FES~IPS0.00237211.93%
WES~APS0.0009009.24%APS~IPS0.0016118.11%
WES~IPS0.0002702.77%APS~ULS0.0010515.29%
GES~APS0.0002382.44%FES~ULS0.0008064.06%
APS~RLS0.0002112.16%GES~APS0.0007923.98%
FES~GES0.0001952.00%OES~WES0.0006693.37%
total0.00874789.78%total0.01700985.57%
Table 5. Comparison of the performance of GeoMLR and XGBoost models.
Model IndicatorsMSEMAE
GeoMLR0.86340.00300.0398
XGBoost0.85180.00860.0671
Disclaimer/Publisher’s Note: The statements, opinions and data contained in all publications are solely those of the individual author(s) and contributor(s) and not of MDPI and/or the editor(s). MDPI and/or the editor(s) disclaim responsibility for any injury to people or property resulting from any ideas, methods, instructions or products referred to in the content.

