Article

Spatiotemporal Patterns and Drivers of Urban Traffic Carbon Emissions in Shaanxi, China

1
School of Traffic and Transportation, Lanzhou Jiaotong University, Lanzhou 730070, China
2
Operations Branch, Xi’an Rail Transit Group Company-Limited, Xi’an 710016, China
3
School of Architecture and Urban Planning, Lanzhou Jiaotong University, Lanzhou 730070, China
4
Beijing Institute of Ecological Geology, Beijing 100120, China
5
Institute of Geographic Sciences and Natural Resources Research, Chinese Academy of Sciences, Beijing 100101, China
*
Authors to whom correspondence should be addressed.
Land 2025, 14(7), 1355; https://doi.org/10.3390/land14071355
Submission received: 28 May 2025 / Revised: 23 June 2025 / Accepted: 24 June 2025 / Published: 26 June 2025

Abstract

Mitigating traffic-related carbon emissions is pivotal for achieving carbon peaking targets and advancing sustainable urban development. This study employs spatial autocorrelation and high-low clustering analyses to analyze the spatial correlation and clustering patterns of urban road traffic carbon emissions in Shaanxi Province. The spatiotemporal evolution and structural impacts of emissions are quantified through a systematic framework, while the GTWR (Geographically Weighted Temporal Regression) model uncovers the multidimensional and heterogeneous driving mechanisms underlying carbon emissions. Findings reveal that road traffic CO2 emissions in Shaanxi exhibit an upward trajectory, with a temporal evolution marked by distinct phases: “stable growth—rapid increase—gradual decline”. Emission dynamics vary significantly across transport modes: private vehicles emerge as the primary emission source, taxi/motorcycle emissions remain relatively stable, and bus/electric vehicle emissions persist at low levels. Spatially, the province demonstrates a pronounced high-carbon spillover effect, with persistent high-value clusters concentrated in central Shaanxi and the northern region of Yan’an City, exhibiting spillover effects on adjacent urban areas. Notably, the spatial distribution of CO2 emissions has evolved significantly: a relatively balanced pattern across cities in 2010 transitioned to a pronounced “M”-shaped gradient along the north–south axis by 2015, stabilizing by 2020. The central urban cluster (Yan’an, Tongchuan, Xianyang, Baoji) initially formed a secondary low-carbon core, which later integrated into the regional emission gradient. By focusing on the micro-level dynamics of urban road traffic and its internal structural complexities—while incorporating built environment factors such as network layout, travel behavior, and infrastructure endowments—this study contributes novel insights to the transportation carbon emission literature, offering a robust framework for regional emission mitigation strategies.

1. Introduction

The carbon emissions generated from the consumption of fossil energy are widely recognized as a significant factor contributing to global warming. Reducing the dependence of socio-economic development on fossil energy has become a focal concern for countries around the world [1]. In socio-economic activities, the transportation sector not only serves as a carrier for the flow and allocation of resources but also represents a key domain of energy consumption. In 2024, carbon emissions from transportation accounted for 23% of the global total, while energy consumption in this sector reached 34.8%, clearly making it one of the major sources of carbon emissions [2]. Therefore, carbon reduction in transportation is a critical pathway to achieving the “dual carbon” goals. Policymakers can unlock substantial emission reduction potential through technological innovation and structural optimization, thereby synergistically advancing greenhouse gas control and air quality improvement [3].
Under the impetus of China’s Belt and Road Initiative, the demand for energy consumption and the potential for carbon emissions growth in the Northwest region are tremendous, with the conflict between regional economic growth centered around Shaanxi and energy conservation and emission reduction becoming increasingly acute. Regarding the spatiotemporal evolution of carbon emissions, previous studies have conducted in-depth investigations across various sectors such as transportation [4], agriculture [5], and industry [6]. The results indicate significant disparities in carbon emission levels among regions and that spatial heterogeneity exhibits characteristic fluctuations over time [7]. Other scholars have focused on evolutionary processes at the national, provincial, and urban agglomeration levels, seeking coordinated and integrated carbon reduction strategies through the interaction between administrative regions. The mainstream approaches to such studies are the “top-down” and “bottom-up” methods [8]. Among them, the long-term energy alternative planning system approach [9,10] is more suitable for low-carbon pathway and energy consumption demand research [11,12]; LISA spatio-temporal transition and spatial Markov chain are more widely applied in the research on evolutionary mechanisms of road traffic carbon emissions [13]. However, similar methods are mostly confined to analyzing spatiotemporal characteristic evolution and seldom focus on the spatiotemporal migration patterns of carbon emissions.
With regard to the identification of carbon emission influencing factors, there are relatively more studies on provinces, cities, and counties [14,15,16]. Based on the characteristics of the EKC curve [17] between GDP per capita and carbon emissions, Xu concluded that the energy consumption in Shaanxi Province over the years has been “increasing year by year—declining to the trough—rising sharply—fluctuating up and down” [18]. Based on this, the extended EKC spatial test model in the precise test of the relationship between the transportation economy and CO2 emissions confirms that there is a long-term inverted “N” relationship between the two, and the benign energy structure and energy-saving technologies can inhibit CO2 emissions [19]. However, the EKC study is limited to the relationship between economy and carbon emissions, ignoring the influence of other factors [20]. For this reason, Wang et al. [21] included influencing factors such as the private car ownership rate and per capital road area into the study, and they used ESDA and geographically weighted regression (GWR) methods [22] to analyze the spatial distribution pattern and evolutionary characteristics of transportation carbon emissions. Thereafter, studies expanded the temporal dimension T based on the GWR model [23,24], using GTWR to account for the spatiotemporal heterogeneity of development levels in northwestern county clusters. Research shows that the region has generally formed a spatial pattern of circular expansion in high-value clusters, with obvious axial expansion along the Hexi Corridor. Notably, in the urban built environment of roads, apart from factors such as road traffic facilities and road network density [25,26], urban morphology [27,28] also exerts a strong driving effect on traffic carbon emissions. Urban spatial structure directly influences CO2 emissions by affecting road traffic characteristics and travel behavior. Existing research lacks investigation into factors of the urban built road environment, which serves as the research focus of this paper.
In summary, although current studies have engaged in intense discussions on transportation carbon emissions, the following issues remain urgent to address: (1) research subjects predominantly reflect the transportation industry at a macro-level, lacking microscopic refinement at the level of urban road traffic and even its internal structural layers; (2) in exploring influencing mechanisms, prior studies have neglected the impact of objective factors such as the urban road built environment—including urban road network layout, residents’ travel behaviors, and road traffic facilities; (3) current research on the spatiotemporal evolution patterns of carbon emissions lacks investigation into the spatiotemporal migration processes and largely focuses on developed regions such as the Beijing–Tianjin–Hebei area, with insufficient attention paid to the Northwest region along the extension of the new land–sea corridor in Western China.
In light of this, firstly, this paper constructs a multidimensional measurement system for urban road transportation by integrating the long-term energy alternative planning system approach with the emission factor method. Second, it, respectively, analyzes the spatio-temporal evolution characteristics and migration trends of road traffic carbon emissions at the provincial and municipal levels. Then, by combining traditional regression analysis with spatio-temporal geographically weighted regression, while taking into account the built environment of urban roads, this study identifies the driving factors and core influencing factors and explores the intrinsic impact mechanism of road traffic carbon emissions. Lastly, the KNN (K-Nearest Neighbors) model was used to predict the total carbon emissions from road traffic in Shaanxi Province over the next 35 years, enabling the forecast of carbon peaking, thus forming a complete analytical system integrating “accounting”, “impact mechanism”, and “prediction”.

2. Methodology and Data
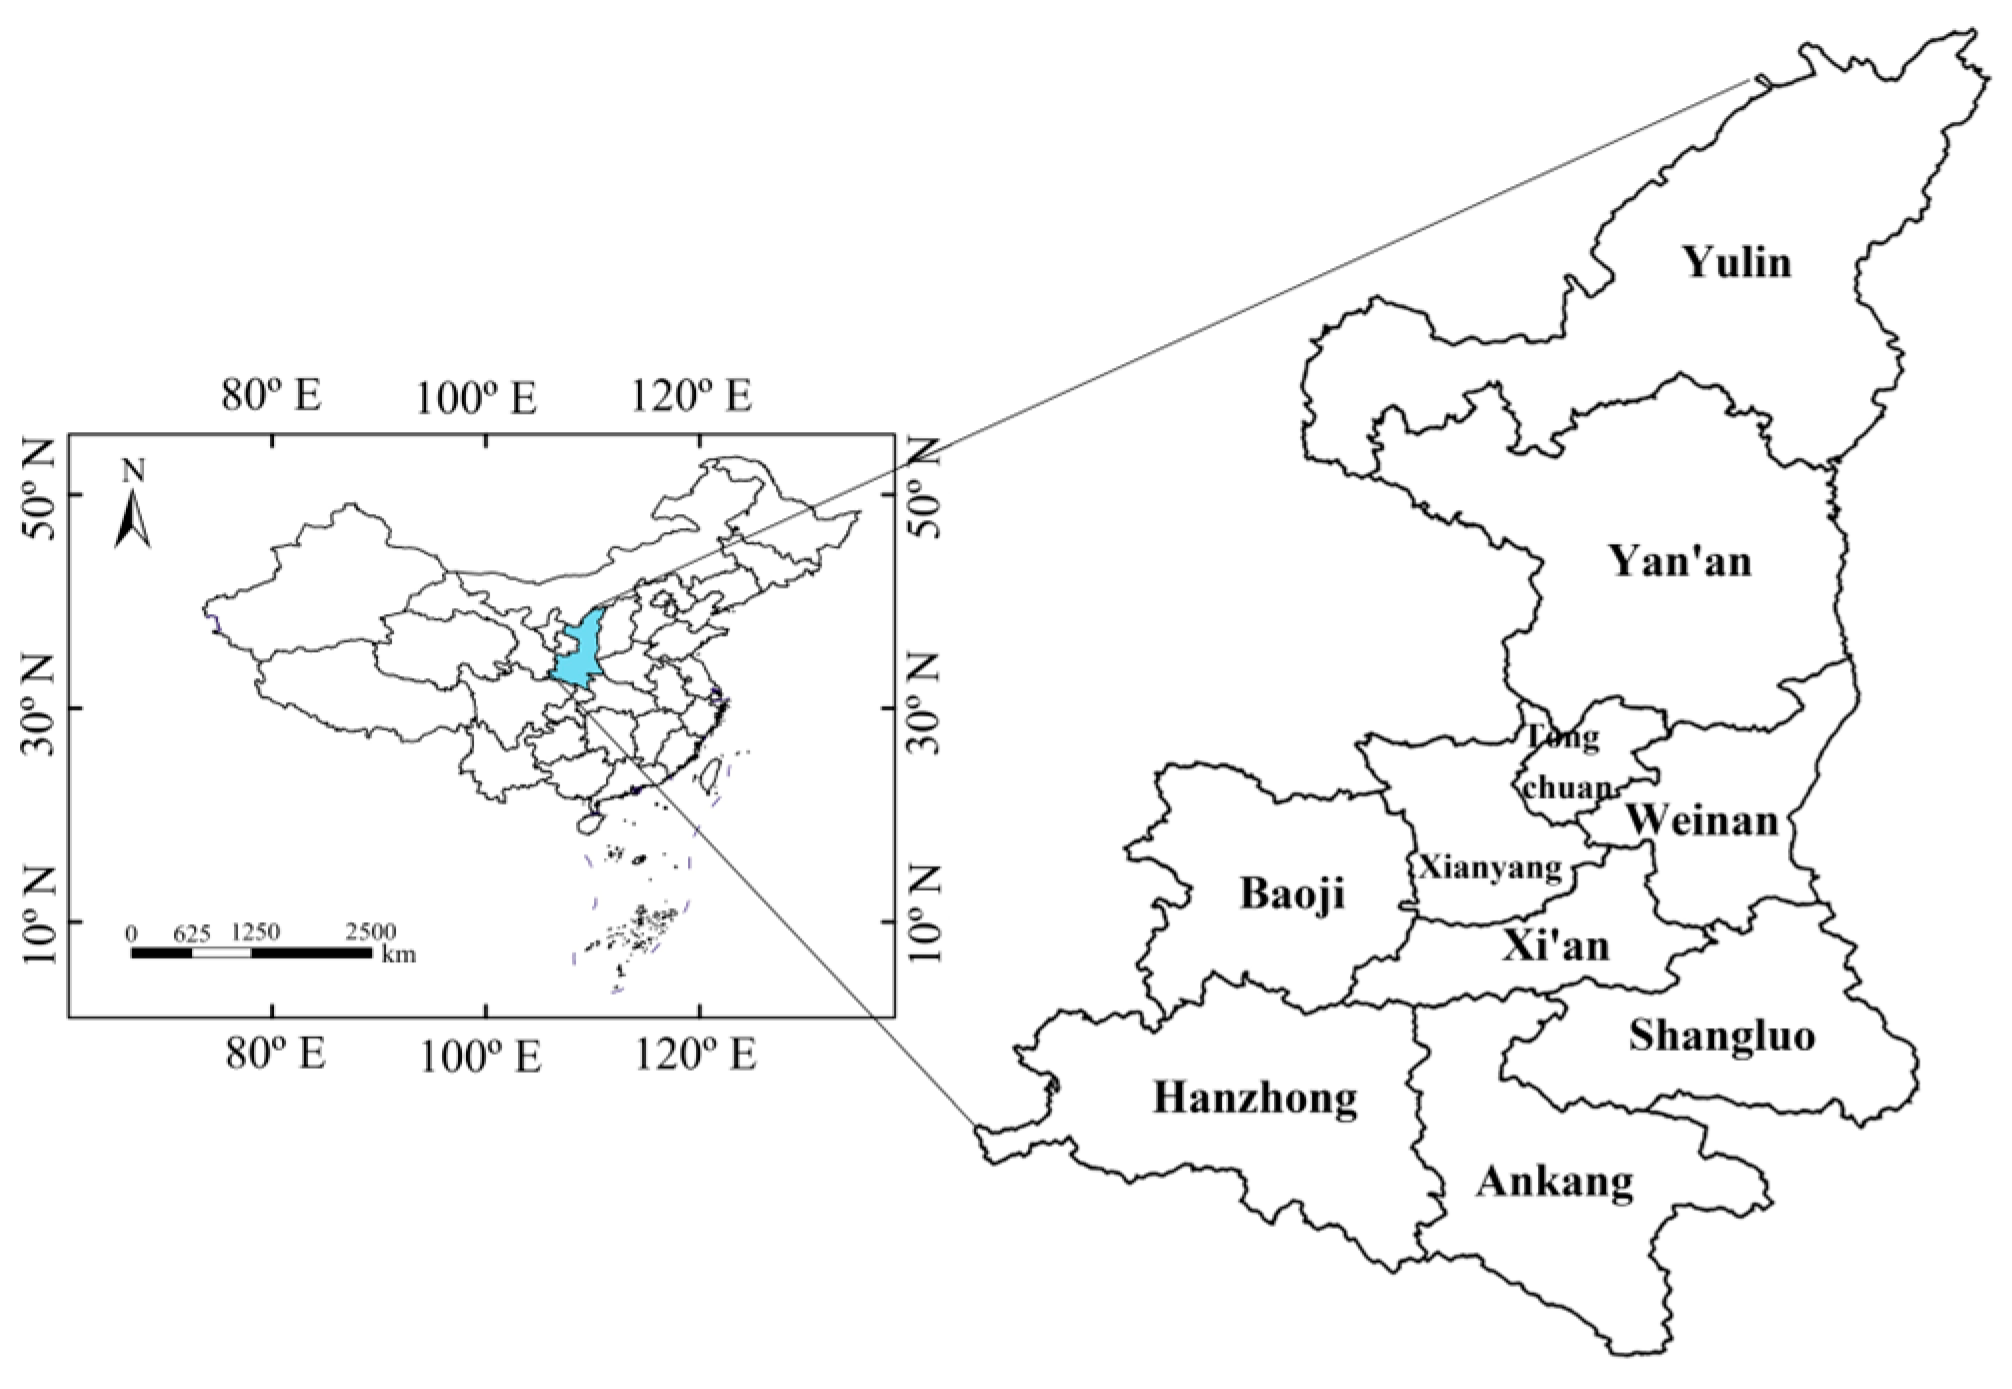
2.1. Study Area

Shaanxi Province includes 10 prefectural-level cities, including Xi’an, Hanzhong, Xianyang, Baoji, Tongchuan, Weinan, Yulin, Ankang, Shangluo, and Yan’an (Figure 1). With the advancement of the Western development strategy, Shaanxi road transportation has been developing rapidly. There is a large space for carbon emission growth, and the differences in the development of economy, energy, and urban form among the municipalities have gradually appeared. Grasping the development trend and evolution characteristics of road transportation carbon emissions in Shaanxi Province and cities, we can find the best combination point for the regional economic development strategy.

2.2. Data Sources

The geographic scope of the data covers Shaanxi Province and its municipal areas. Due to missing data in yearbooks from some regions, the study period is set as 2010–2020. Energy consumption data were referenced from the National Bureau of Statistics and the China Urban Statistical Yearbook. The transportation levels, vehicle types, fuel types, and energy consumption rates of various transportation modes were obtained from the literature [29,30,31], the China Automotive Market Yearbook, and the Urban Transportation Operation Report. CO2 calculation coefficients (energy emission factors, carbon oxidation rates, carbon content per unit calorific value, etc.) are referenced from the IPCC National Greenhouse Gas Inventory [32,33]. Both energy consumption and CO2 calculation results are converted into standard coal [34]. Socio-economic data were obtained from the National Bureau of Statistics and the Shaanxi Statistical Yearbook. Administrative division data and road network data were acquired through the National Geospatial Information Public Service Platform. The acquired road data at all levels underwent processing such as topological relationship verification, error correction, street attribute connection and integration, and buffer zone linking. All vector data underwent spatial calibration and projection transformation.

2.3. Estimation of Traffic Carbon Emissions

2.3.1. Energy Consumption Calculation

According to the geographical characteristics of Shaanxi Province city, the road transportation main body is defined as 2 categories of passenger transportation and freight transportation in the city. The carbon sources of passenger transportation are cabs, buses and electric cars, private cars, and motorcycles, and the energy consumption model [35] fully integrates the activity level and energy utilization rate of the main body of transportation.
E t , k = ( E km , a , k × D a × N a ) + ( E km , b , k × Q b )
where Et,k represents the consumption demand (tce) for fuel k in year t; Ekm,a,k, Da, and Na denote the energy consumption per 100 km (tce) of passenger transport vehicle a, average transportation distance (km), and standard operational fleet size (standard units), respectively; Qb and Ekm,b,k represent the turnover volume (t·km) of freight transport vehicle and the energy consumption per unit turnover (tce/(t·km)), respectively.

2.3.2. CO2 Emission Calculation

The IPCC inventory method is based on the emission coefficients [16,36] of various types of energy sources and calculates the total amount of CO2 produced by energy consumption through statistics and conversion [4].
C t , i = k = 1 m C O 2 i , t , k = k = 1 m E t , i , k × ( 1 S k ) × O k × N C V k × C C k × 44 12
where Ct,i, CO2i,t,k, and Et,i,k denote the total CO2 emissions (tce), CO2 emissions (tce), and energy consumption (tce) of city i in year t, respectively. Sk , Ok , NCVk, and CCk represent the non-combustion proportion of energy k, carbon oxidation rate, average lower heating value, and unit heat emission, respectively.

2.4. Spatio-Temporal Geographically Weighted Regression Model (GTWR)

The GWR lacks the time dimension and cannot accurately analyze the cross-section data of long time series, and the parameter estimation results are not robust. Under the premise of verifying the strong spatial correlation of CO2 emissions, the spatio-temporal geographically weighted regression model [37] was used to study the mechanism of carbon emission impacts, and the model is as follows:
W i = β 0 ( u i ,   v i ,   t i ) + j = 1 p β j ( u i ,   v i ,   t i ) ·   m i j + ε i · i =   1 ,   2 ,   3 ,   4 , ,   n
where Wi is the explanatory variable, referring to the total CO2 emissions in city i; mij is the j explanatory variable in city i; ui and vi are the latitude and longitude coordinates of the geometric center of gravity in city i; (ui, vi, ti) are the spatial and temporal coordinates of city; β0(ui, vi, ti) is the intercept term; and βj(ui, vi, ti) is the estimated coefficient of the j explanatory variable at city i.
Existing explorations of influence mechanisms mostly focus on explaining the differences in the impact of explanatory variables on road traffic carbon emissions [38] while rarely paying attention to the effects of cities’ own dynamic transportation built environments, road textures, development scales, and other factors on the spatio-temporal evolution patterns of carbon emissions [39]. Urban expansion and changes in built environments are particularly complex [40,41]. Once spatial forms are established, the impact of road traffic environments on the spatial patterns of carbon emissions will increase steadily over time [42]. Road texture (i.e., the construction of transportation service facilities) determines the accessibility of built environments and has positive or negative driving effects on residents’ travel carbon emissions [43,44]. The improvement of urban development scale will largely change the transportation structure, and the demand for road transportation will directly affect carbon emissions through human-induced, systematic adjustments [45]. Based on this, a multidimensional driving factor indicator system was constructed (Table 1).

2.5. K-NN (K-Nearest Neighbor) Predictive Model

Due to the non-linearity and complexity of carbon emission data, the KNN (K-Nearest Neighbors) prediction method—a non-parametric regression approach—offers stronger data mining capabilities than other prediction models. It does not rely on any prior information or numerous parameters, and its prediction accuracy improves as the amount of historical data increases. Therefore, using the KNN algorithm to predict the future total carbon emissions from road traffic in Shaanxi Province is reasonable and feasible.
When predicting carbon emissions Ct+1 in the new phase, the KNN algorithm searches for K closest datasets to Ct+1 within the specified training dataset and classifies Ct+1 into the category with the highest sample count in this dataset. The prediction process consists of four stages: determining distance metrics, setting state vectors, defining the number of neighbors K, and establishing the prediction model. Its core components and traditional modeling steps are as follows:
(1)
Data Preprocessing: After preprocessing, determine the training set and prediction set for carbon emission data.
(2)
Calculate the Euclidean distance Di between each training sample and test sample of carbon emissions, then sort the distances.
(3)
Set K minimum Di corresponding to the sample data Ct+1.
(4)
Perform attribute decision making and classification on the K sample datasets Ct+1.
C t + 1 = t = 1 K β i C t + 1 h i t = 1 K β i
where βi represents the weight coefficient under the i-th group of Di; K denotes the number of selected nearest neighbors; C 1 h i t + is the CO2 emissions in the next year of historical data; Ct+1 is the predicted value.

3. Spatiotemporal Patterns of Urban Traffic Carbon Emissions

3.1. Carbon Emission Trends by Transportation Mode

The order of ownership of each carbon source vehicle is in the following order: private car > motorcycle > taxi > bus electric vehicle (Table 2). Overall, the road traffic travel structure in Shaanxi Province has gone through a development stage in which non-motorized (walking + non-motorized) travel is the main orientation, and multi-modal transportation is gradually integrated and optimized, with a continuous surge in the ownership of the main carbon source vehicles (urban public transport electric vehicles, cabs, private cars, and motorcycles) during the first five years of the study period and then slowing down during the second five years.
In 2015, 15,501 standard units of public transportation were operated, with a growth rate of 27.3% compared with 2010, and the growth rate realized in 2020 compared with 2015 was 45.39%. This shows that, with the gradual improvement of the urban public transportation system and the continuous improvement of the service level, the CO2 emission level of the public transportation electric vehicles also rises. The number of cabs operating in Shaanxi Province has been kept at a stable level in the past ten years due to strict control of the number of cabs operated by the management department. Carbon emissions from private cars account for the largest proportion in the whole urban road traffic carbon emission system. In the past decade, residents’ travel in Shaanxi Province has shown characteristics of long-distance, diversification, and complexity. Private cars account for the largest proportion of carbon-emitting vehicles in urban road traffic. The ownership of private cars reached as high as 81.41% in 2017, and the total number of private cars reached 6.0921 million in 2020 (5.5 times that of 2010). The number of private cars will tend to stabilize after 2020.

3.2. Temporal Evolution of Urban Traffic Carbon Emissions in Shaanxi

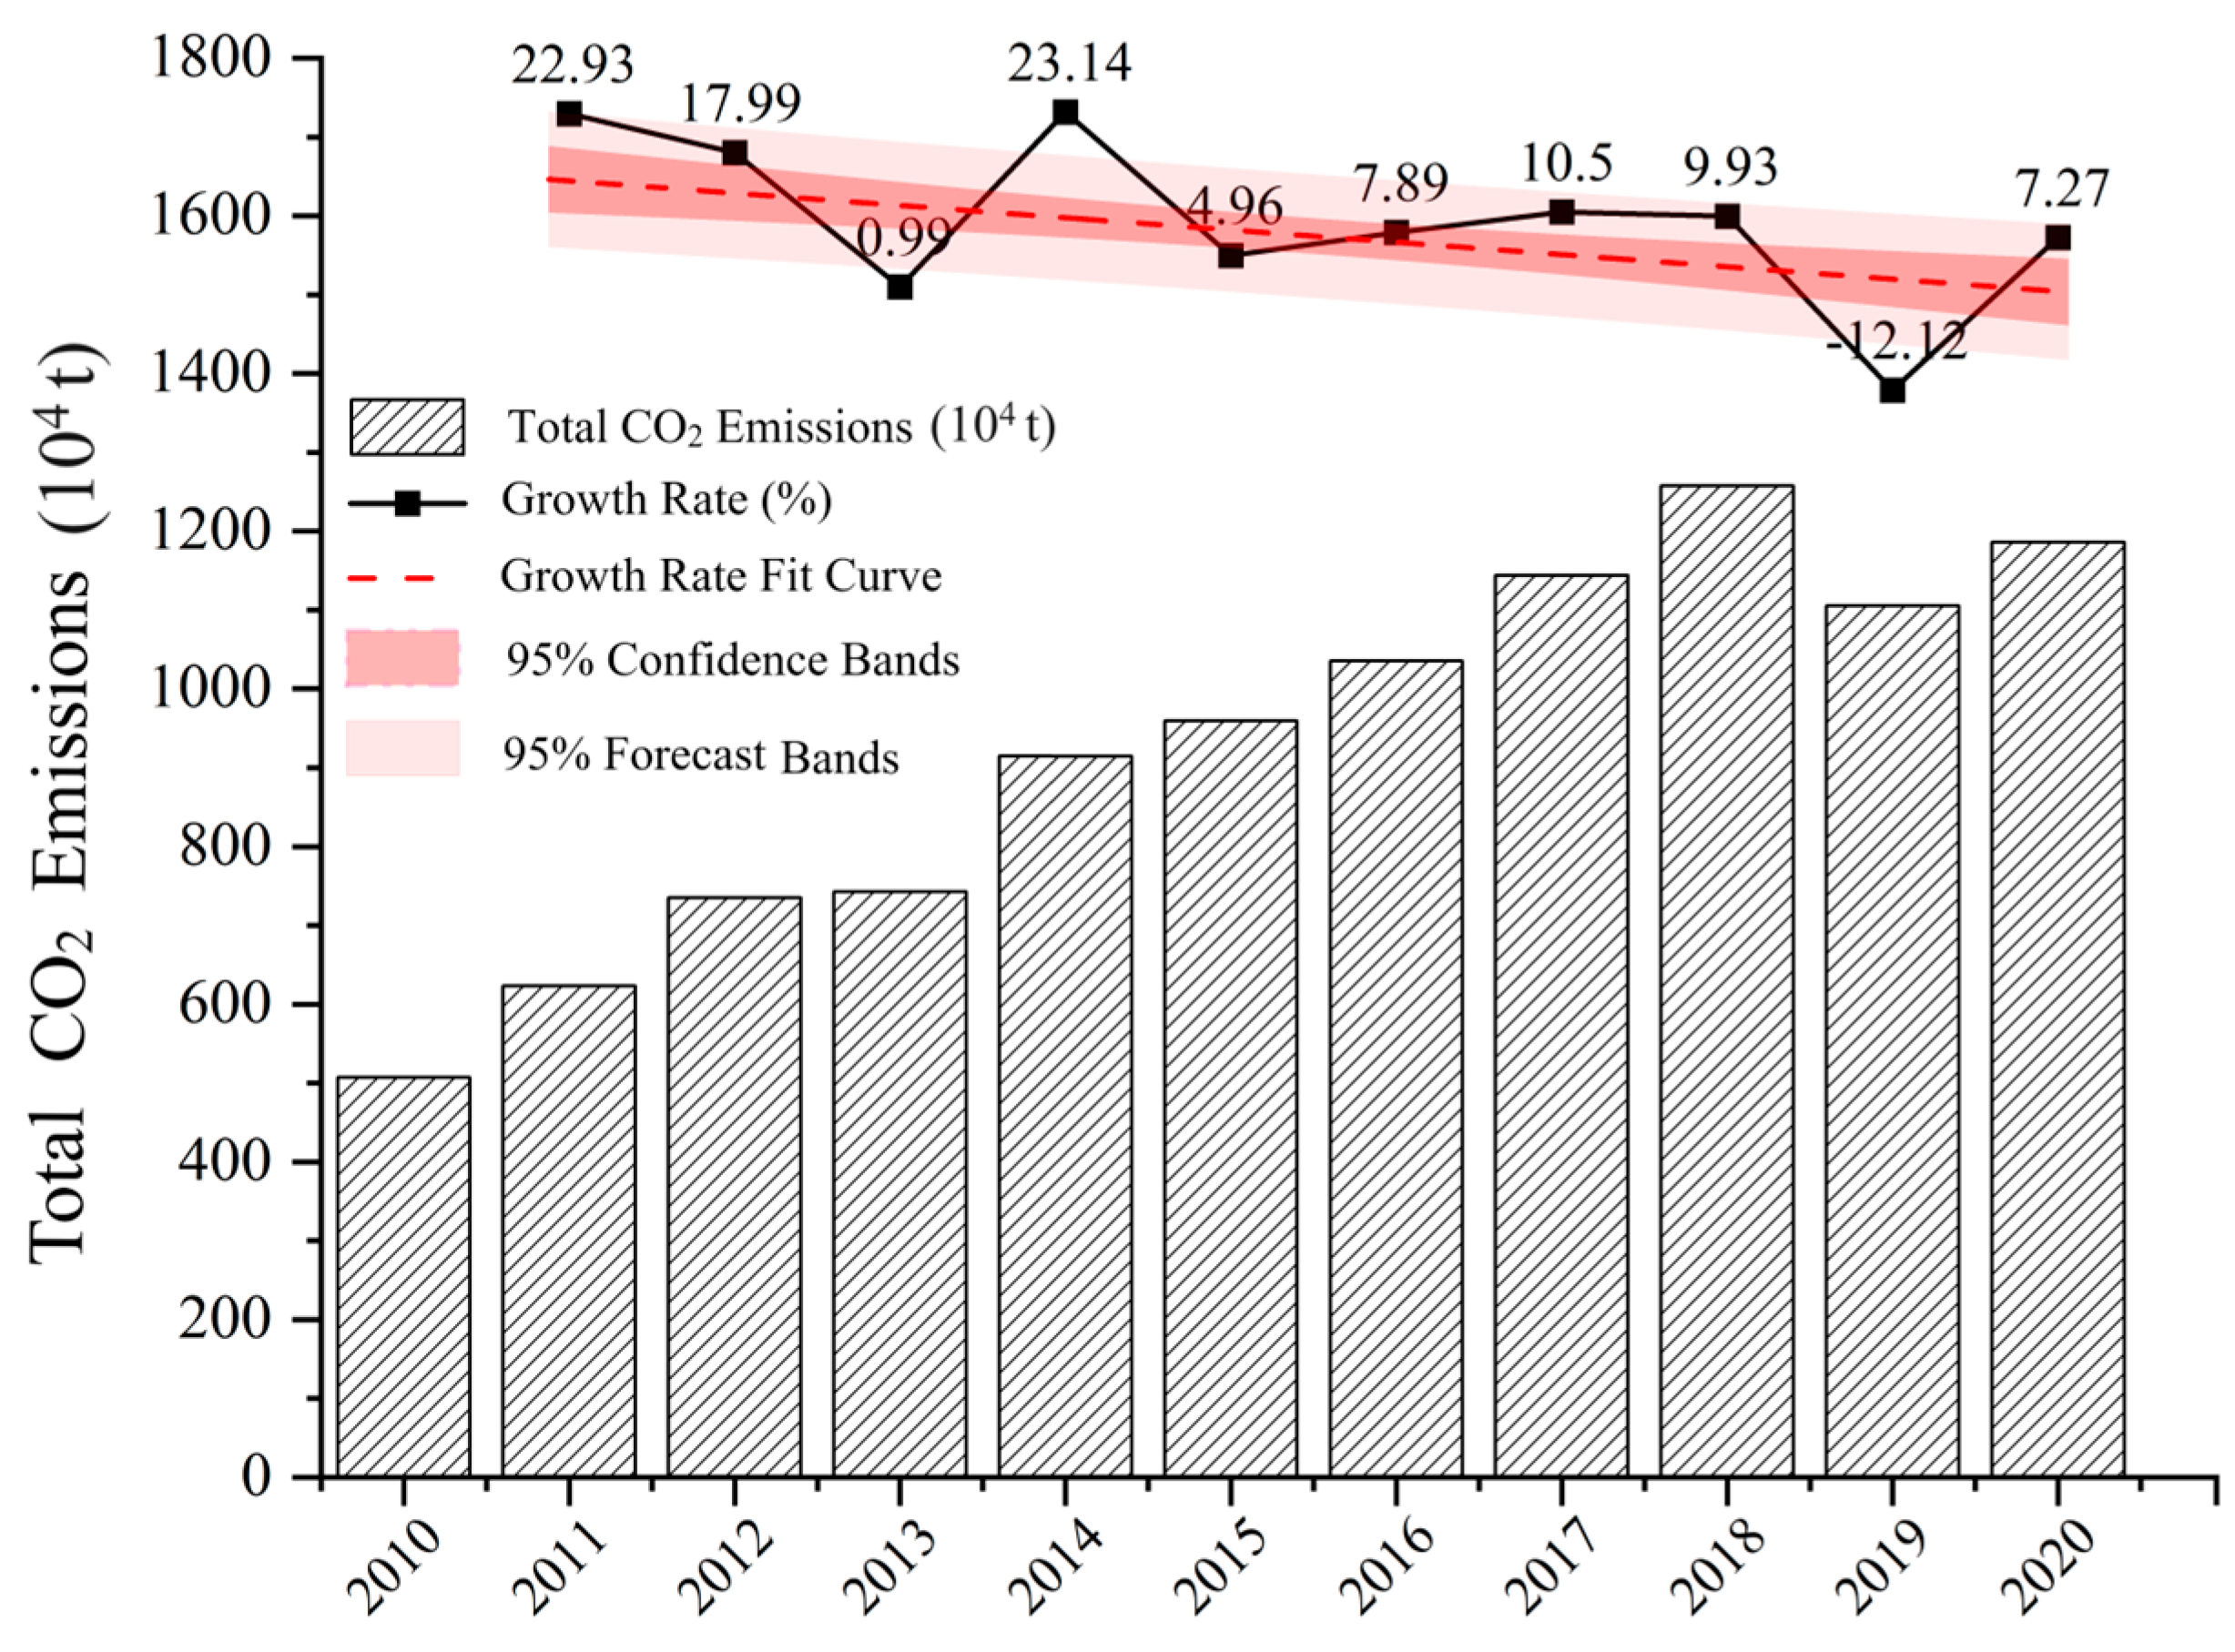
3.2.1. Total Traffic Carbon Emission Trends in Shaanxi

CO2 emissions from road transportation in Shaanxi showed a linear upward trend during the study period, with an average annual increase rate of 8.87%. Individually, it can be categorized into three development stages based on the growth characteristics (Figure 2).
The years 2010–2013 are a period of stable development. CO2 emissions rose from 5,068,300 tons to 7,424,400 tons, with an average annual growth rate of 13.57%, and the growth rate in the same period was basically the same in 2011 and 2012 and decreased to 0.99% in 2013.
The years 2014–2018 are a period of rapid growth. The average annual rate of increase is 8.30%, with the greatest rise in 2014, up 23.14% year-on-year. Since the implementation of the Western development strategy, Shaanxi’s industrialization and urbanization development has been steadily promoted, the urban economic level has been continuously improved, the number of private automobiles has continued to surge, road transportation facilities have been gradually improved, and various factors have contributed to the rapid rise in energy demand and the consequent increase in CO2 emissions.
The period of 2018–2020 is the declining phase. Total CO2 emissions dropped from 12,576,100 tons in 2018 to 11,856,800 tons, with an average annual growth rate of −2.90%. The reason for this is that, on the one hand, under the influence of the new crown epidemic, the overall vehicles on the urban road network plummeted, and the activity of passenger and freight transportation and private transportation dropped sharply. On the other hand, Shaanxi Province has promoted the exchange and progress of energy-saving and environmental protection technologies in various cities by various measures, for instance, strengthening the implementation of policies such as energy conservation and emission reduction, industrial upgrading, and energy structure optimization. This has alleviated the pressure of high energy consumption and emissions from road traffic.

3.2.2. Temporal Evolution of Carbon Emissions by Transportation Mode

Since 2010, the structural changes in road traffic carbon emissions in Shaanxi Province have been remarkable (Figure 3). The primary growth source has consistently been private cars, while emissions from taxis and motorcycles have remained largely stable, and carbon emissions from public electric buses have stayed at low levels. The trends in carbon emissions across transportation modes indicate the following:
Taxi emissions have significantly exceeded those of buses and motorcycles over the past decade, with a steady fluctuating trend. Except for motorcycles, the emission shares of buses and taxis plummeted after 2019, and the growth rate of private car emissions decreased significantly. This can be attributed to three factors: socioeconomic transformation, the COVID-19 pandemic, and population changes. The overall level of urbanization has outpaced the growth rate of carbon emissions, leading to a slowdown in emission trends.
In the early stage, the contribution rates of carbon emissions from private cars, taxis, and motorcycles to passenger traffic were relatively close. However, the incremental emissions from private cars increased rapidly after 2012. By the end of the study period, private car emissions were over 100 times higher than those of taxis and motorcycles, contributing the most to total emissions (89.5%). This is closely linked to rapid socioeconomic development and the expansion of travel demand.
As the total road traffic carbon emissions increased rapidly, CO2 emissions from public electric buses showed a downward trend (with a 35.4% decline in 2020). Although the facilities, equipment, and operational levels of public electric buses have been continuously optimized, the rapid development of urban rail transit and new energy vehicles supported by new energy technologies better meet the diversified travel modes and needs of residents.

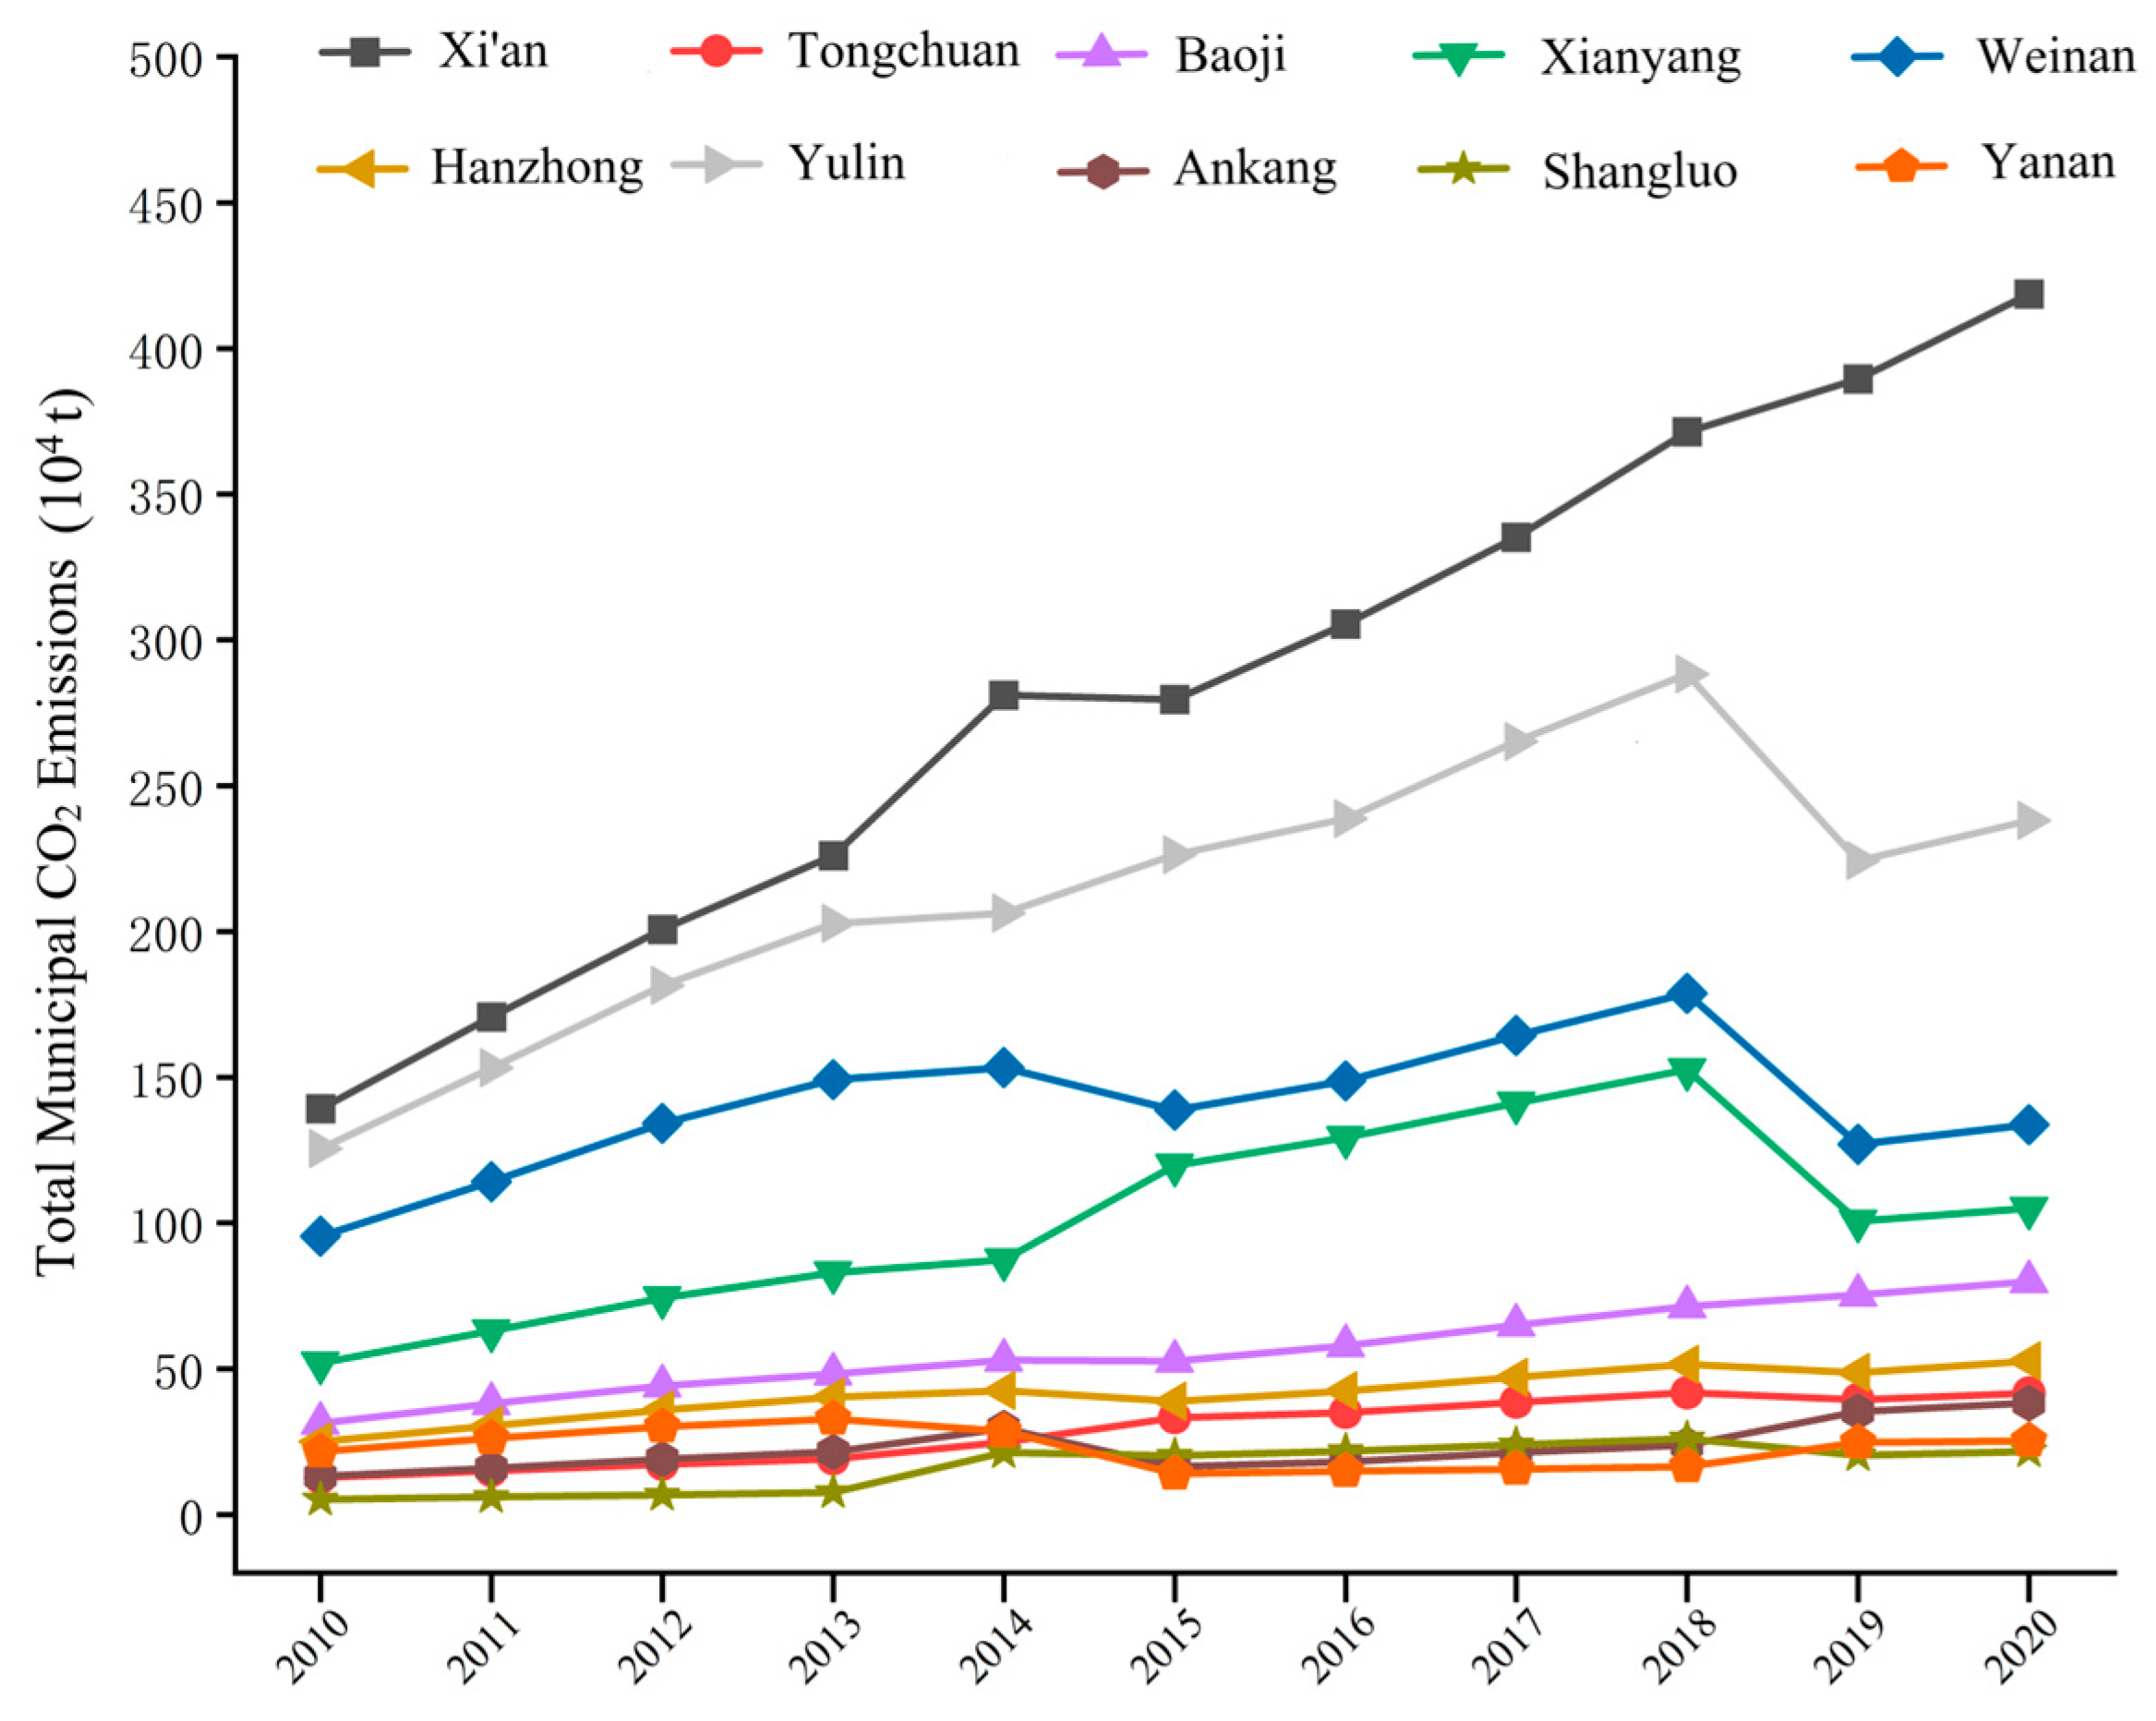
3.2.3. City-Scale Temporal Evolution of Urban Traffic Carbon Emissions

Xi’an road traffic carbon emissions showed a rapid growth trend (Figure 4). Throughout the decade it has been in a straight-line upward trend, the fastest growth rate in 10 cities, with the most emissions—road traffic carbon emissions rose from 1,391,800 tons in 2010 to 4,187,000 tons in 2020—and the average annual growth rate of up to 11.64%. Weinan City, Xianyang City, and Yulin City, three cities in 2015 after the CO2 emissions change trend became consistent and synchronized, all in 2018 reached the mid-year peak, followed by two years of sharp decline and a slowly rising trend. Yan’an City and Shangluo City road traffic carbon emissions during the 10-year period have been at the end of the crossover state, and Hanzhong City emission changes have been stable, from 250,600 tons in 2010 to 527,000 tons (2020), with an average annual growth rate of 7.71%.

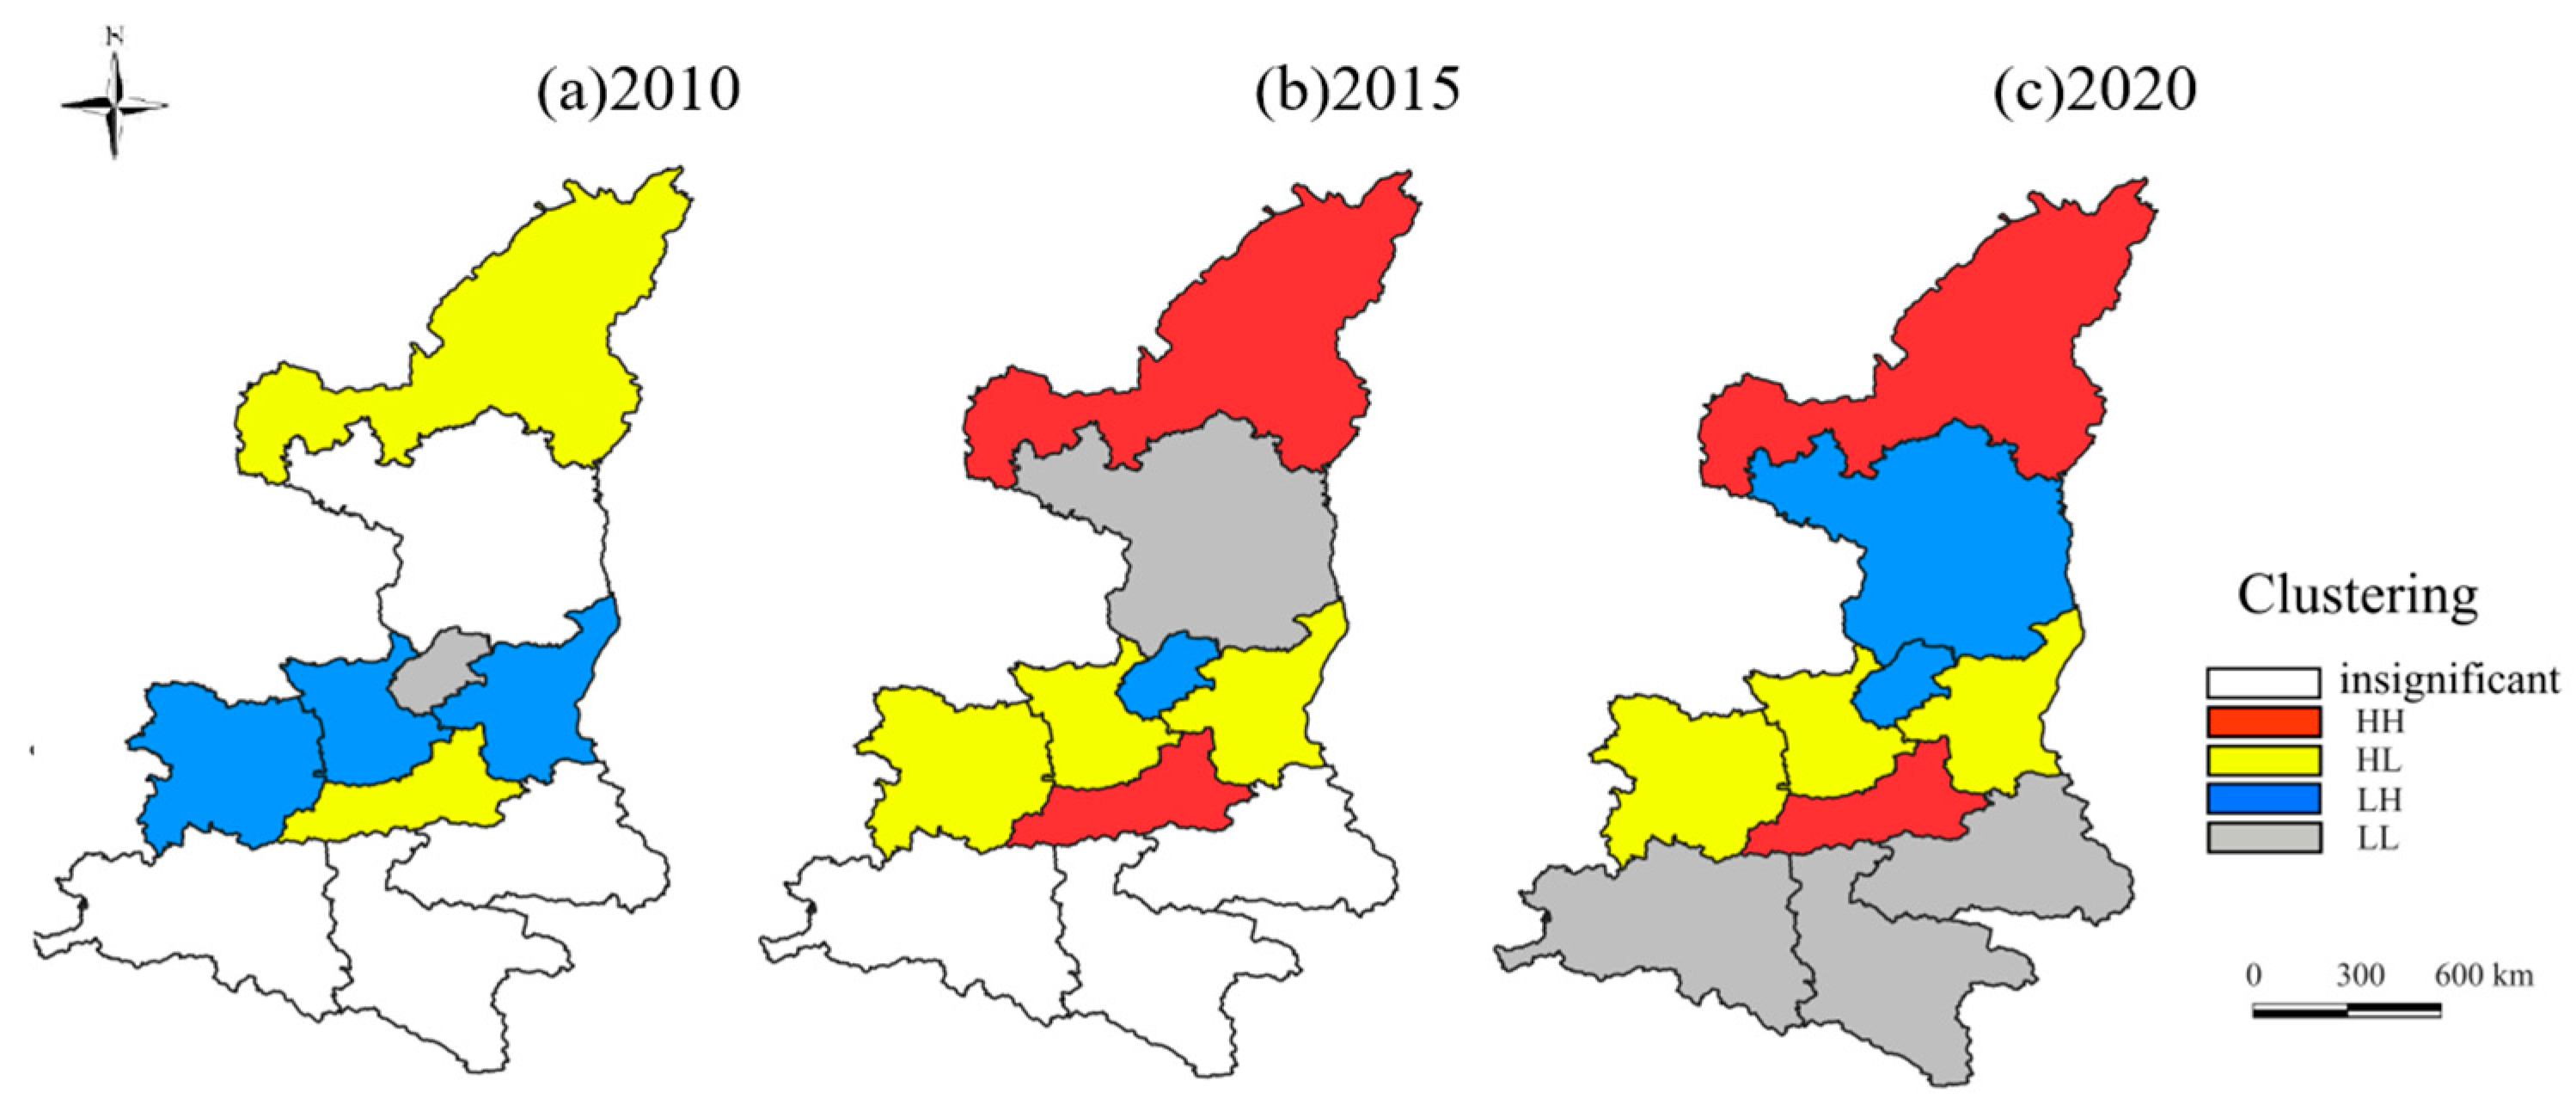
3.3. Spatial Patterns of Urban Traffic Carbon Emissions in Shaanxi

3.3.1. Validation of Spatial Correlation

Using the inverse distance spatial weight matrix with Euclidean distance as a measure, the distribution of carbon emissions in 2010, 2015, and 2020 in each city was analyzed for clustering and outliers using GeoDA1.18.0 (Figure 5). They were categorized according to the size of aggregation differences: high–high agglomeration (HH), high–low agglomeration (HL), low–high agglomeration (LH), and low–low agglomeration (LL).
The road traffic carbon emissions in each municipal area show characteristics of negative spatial agglomeration. In 2010, Xi’an and Yulin were located in the HL (high–low) zone, Weinan, Xianyang, and Baoji in the LH (low–high) zone, Tongchuan in the LL (low–low) zone, while the other four cities showed no obvious agglomeration characteristics. By 2015, both the LH and LL zones had transitioned to the next lower clustering zone. Overall, the central region of Shaanxi Province maintained a stable agglomeration status by 2020.
Spatially, clustering is more significant around 2015, and the clustering phenomenon is basically stable in 2020. The significance of all three clustering regions, HH, HL, and LH, has changed: (1) HH regions are mainly concentrated in Central and Northern Shaanxi, with Xi’an City and Yulin City consistently maintaining a high potential for polarization after 2010. (2) HL is distributed in Central Shaanxi and shows a trend of gradual evolution from north to east. (3) The LH zone is spatially shifted gradually from Central Shaanxi to the north, and the municipal aggregation belt gradually changes from horizontal to compact vertical distribution. Among them, the evolution progress of Yan’an City lags behind and finally forms the LH agglomeration together with Tongchuan City in 2020.

3.3.2. Spatial Evolution of Total Traffic CO2 Emissions

Using the natural breaks method (Jenks classification) in QGIS 3.34.8, the spatial hierarchy of total CO2 emissions in each city was divided into four emission levels (Figure 6).
Emissions show a significant high-carbon spillover effect. The high-agglomeration area centered on Xi’an in the central region diffused to adjacent cities, leading to a marked expansion of the low-emission areas around Xi’an after 2015. Road traffic CO2 emissions in each city have shown a significant upward trend. The overall emission level presents a “double-humped” spatial layout with low emissions in the south and high emissions in the central and northern regions. Low-emission areas are distributed in Southern Shaanxi, mid-emission areas are mainly concentrated north of the central region, and high-emission areas have always been distributed in the central and northern regions.
In terms of spatial evolution, it can be found that (1) In 2010, the distribution of CO2 emissions in various cities of Shaanxi was balanced, and the overall low-carbon emission level (Level II) was dominated by the “central cluster” composed of Yan’an, Tongchuan, Xianyang, and Baoji. (2) In 2015, the spatial distribution of CO2 emissions in various cities was unbalanced, showing an “M”-shaped spatial pattern from north to south, and the mid-aggregation area of CO2 gradually moved northward from the central region. (3) In 2020, the agglomeration pattern of CO2 emissions in various cities tended to stabilize, and the low-agglomeration areas gradually moved southward from the western part of Shaanxi.

4. Driving Factors and Their Spatiotemporal Heterogeneity of Traffic Carbon Emissions

4.1. Results Based on OLS Estimation

In the results of the regression equation correlation assessment (Table 3), except for industrial structure and economic density, the driving direction of each variable on road transportation carbon emissions in Shaanxi is positive as a whole. Among them, the main drivers are energy intensity, road network integration, industrial structure, and economic density. The significance of energy intensity on total carbon emissions is at the 0.001 level, with a regression coefficient of 0.738, which is the largest positive driver of CO2 emissions among all explanatory variables. Industrial structure and road network integration are significant at the 0.01 level, with one negative and one positive regression coefficient, presenting a strong inhibitory and promotional effect on CO2 emissions, respectively, and for every 1-unit increase in both, CO2 emissions from road transportation in Shaanxi are reduced by 37.5% and enhanced by 61.4%, respectively. Economic density corresponds to a significance level α of 0.05, which shows a significant linear relationship with CO2 emissions, and has a particularly significant effect on suppressing CO2 emissions.
In addition, the goodness-of-fit R2 and the adjusted R2 of the four factors, namely, energy intensity, road network integration, industrial structure, and economic density, are all close to 1, indicating that the regression models derived from Shaanxi’s CO2 emissions and the explanatory variables are well fitted. Among them, the explanatory power of changes in energy intensity on CO2 emissions is up to more than 87.9%, and the remaining probability is caused by random errors. There is no significant relationship between the other variables and the total CO2 emissions.
To avoid the interference of multicollinearity on the results, based on the results of the above traditional linear regression analysis, the four drivers of energy intensity, road network integration, industrial structure, and economic density were retained and correlation tested. Additionally, it was found that VIF was less than 8, and the results did not have multicollinearity interference. In order to verify the fitting effect of the GTWR model, the AIC criterion was used to determine the automatic optimization bandwidth, set the ratio of the temporal and spatial distance parameters to 1, and regressively measure the four key explanatory variables. The model evaluation results of OLS, GWR, and TWR were also added, and the AIC criterion was selected as the model confidence evaluation index (Table 4).
The results of AIC, R2, and corrected R2 tests show that the explanatory power of the three schemes of GTWR, TWR, and GWR is better than that of the OLS model, while the GTWR model has the largest R2 and corrected value, the smallest AIC value, and the best fitting effect. It indicates that there are spatial and temporal differences in the effect of each explanatory variable on CO2 emissions from road transportation in Shaanxi, and the GTWR model, which takes into account spatial heterogeneity and temporal smoothness, is more suitable for the study of the influence mechanism.

4.2. Results Based on GTWR

The results of the GTWR evaluation (Table 5) show that the regression coefficients of energy intensity are all positive, and the minimum value is 0.179, which is significantly positively correlated with CO2 emissions in different spatio-temporal geographies. The coefficients of road network integration are both positive and negative, which indicates that the positive and negative effects of the road built environment on CO2 emissions coexist and vary significantly in time and space. The median and mean are both greater than zero, indicating that the overall positive contribution to carbon emissions is dominant. However, the lower quartile is negative, indicating that the negative value also occupies a certain proportion, probably because the triple pressure of socio-economic transformation, the irrational layout of urban roads, and the new crown epidemic suppressed the upward trend of carbon emission.
The coefficients of industrial structure and economic density are overall negative. The industrial structure can reduce carbon emissions by improving production processes. As the economic growth mode gradually transitions to an intensive, low-carbon sustainable development model, the effect of inhibiting carbon intensity has become increasingly evident.

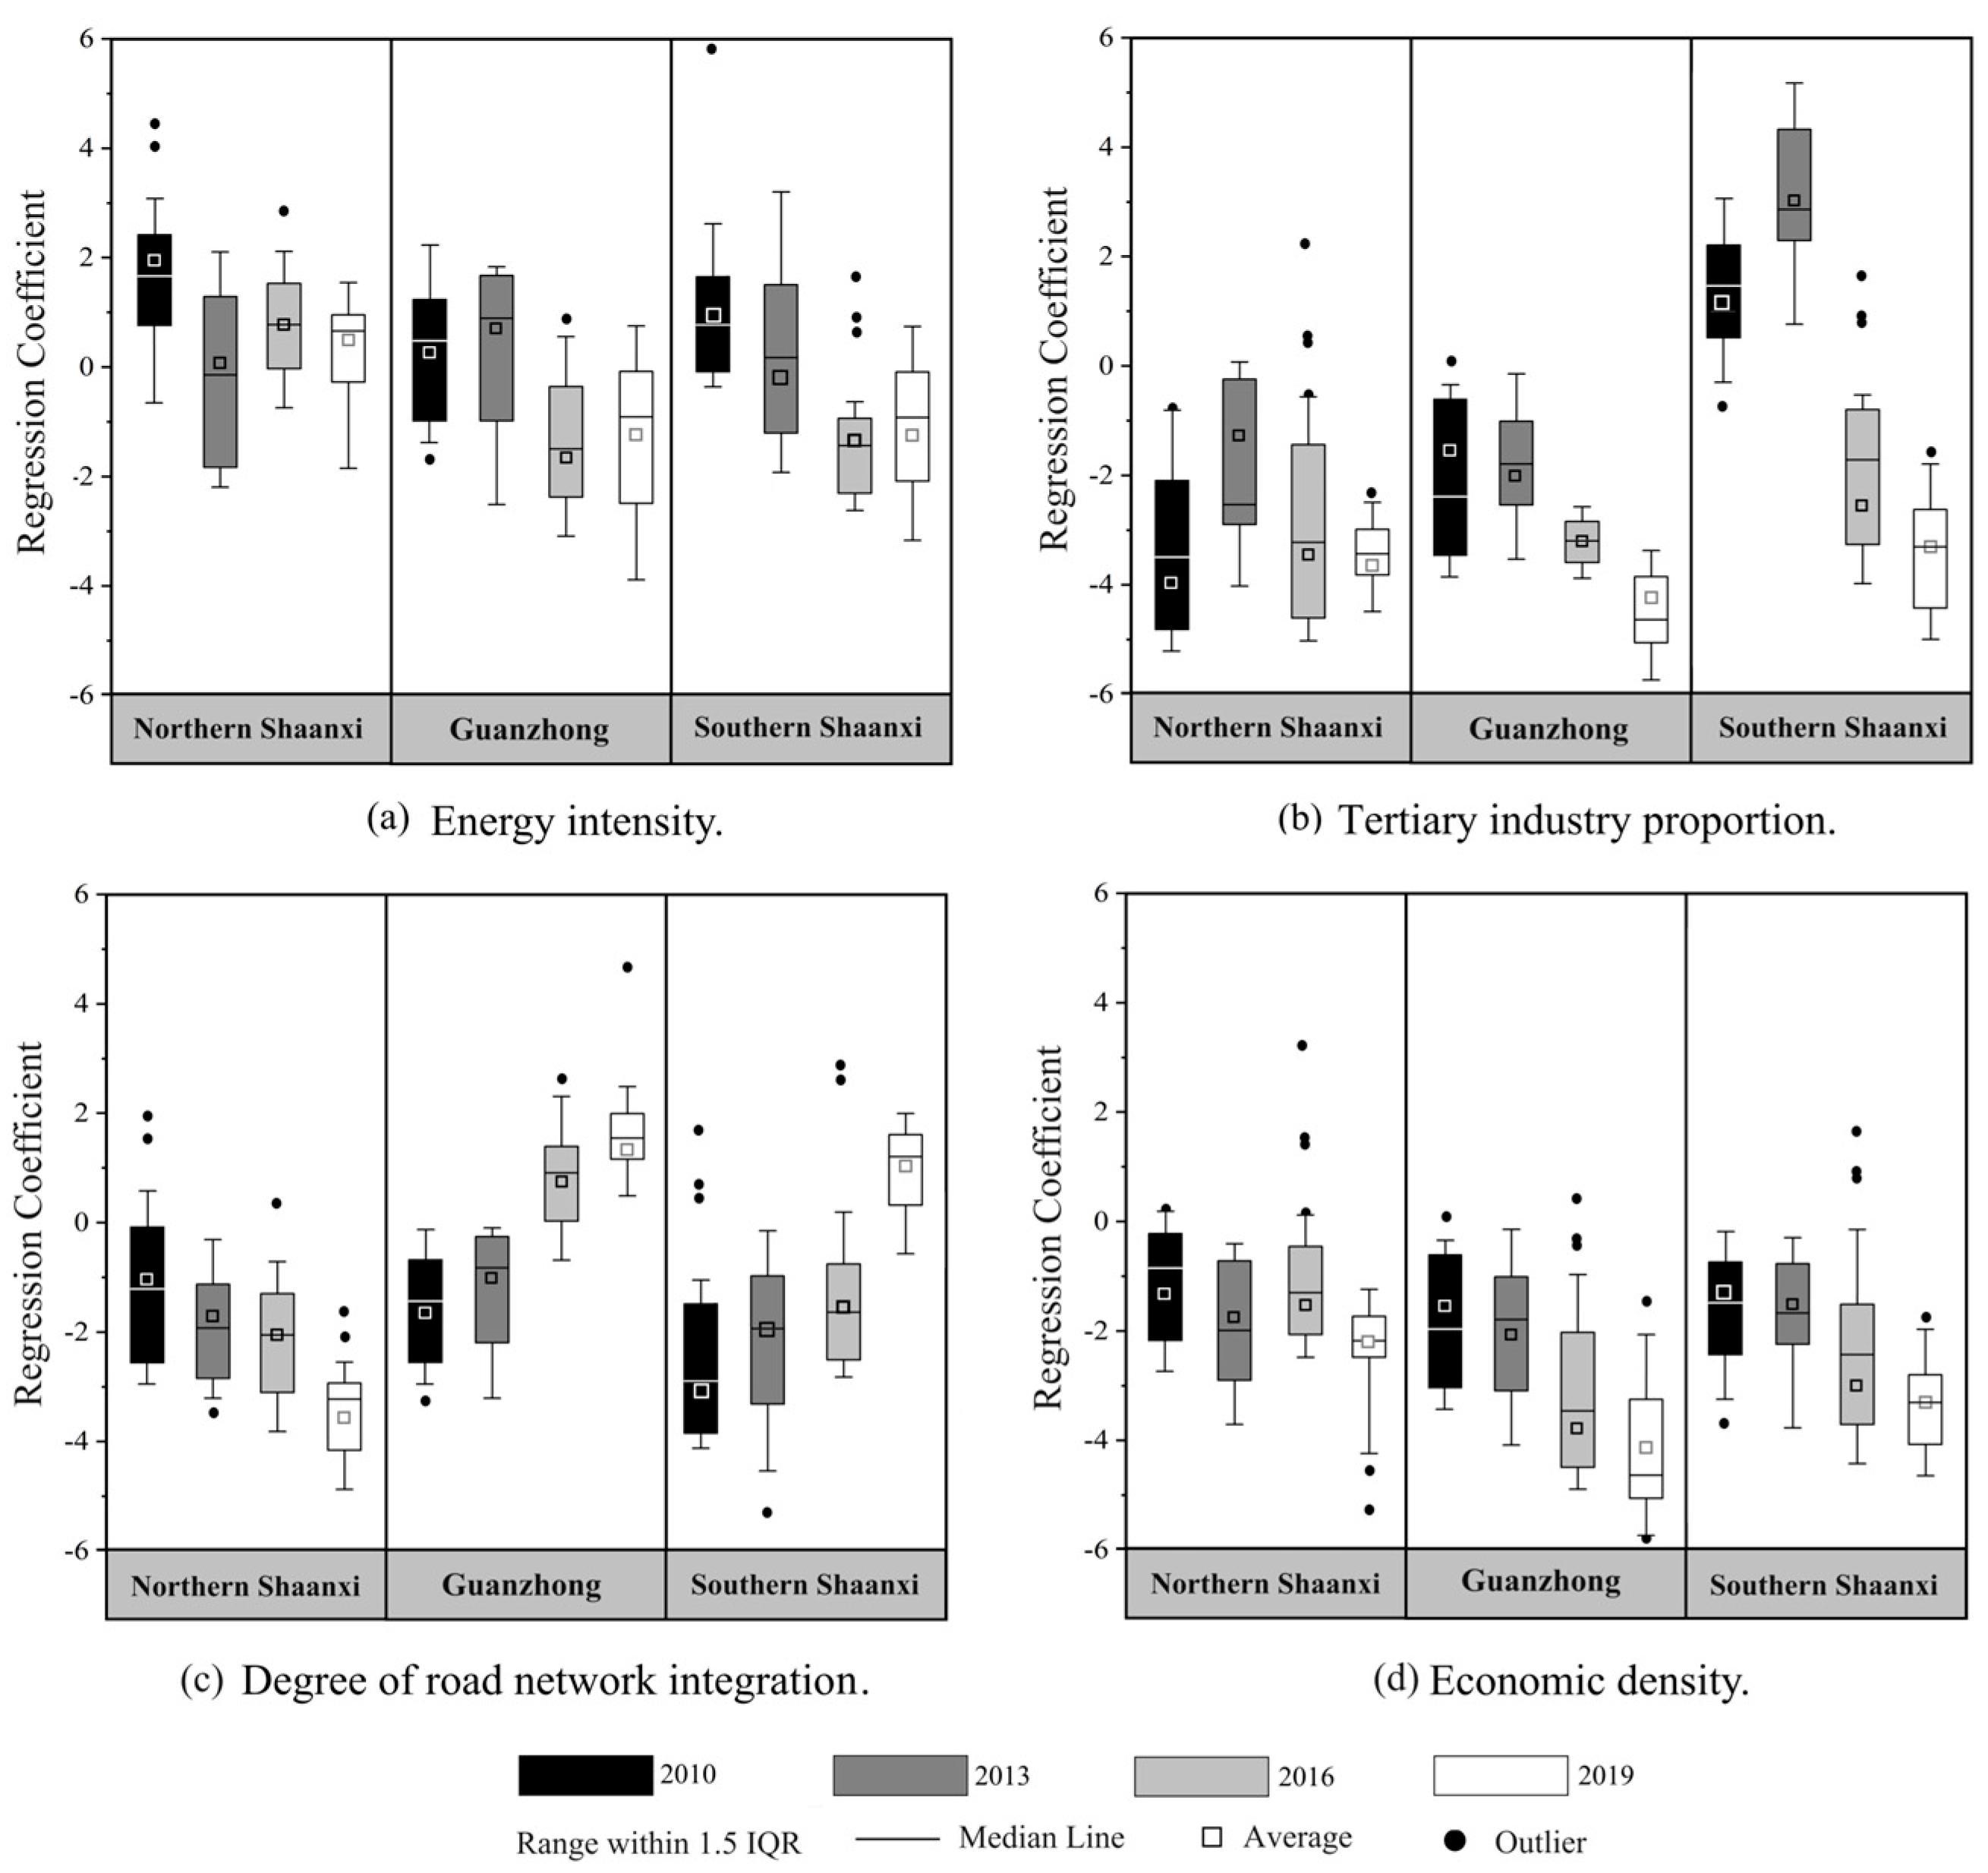
4.3. Spatiotemporal Heterogeneity in the Effects of Factors on Traffic CO2 Emissions

Overall, the regression coefficients of energy intensity, road network integration, industrial structure, and economic density are highly variable, and there is obvious variability among the carbon emission influencing factors in each city, which needs to be analyzed locally to analyze the spatio-temporal heterogeneity of carbon emission influencing factors.
(1)
Spatiotemporal Heterogeneity of Energy Intensity’s Impact on Carbon Emissions
The literature [46] shows that private cars are the main carbon-emitting vehicles and driving CO2 emission growth in Shaanxi Province (accounting for 84.8% in 2020), leading to a linear surge in gasoline fuel consumption and total carbon emissions (CO2 emissions in 2020 were about 2.34 times that in 2010). Diesel-dominated freight transport emissions remain stable, and trucks have always been a stable source of carbon emissions. It is mainly due to the significant increase in the ownership of natural gas vehicles (mainly buses and taxis); the rapid promotion of CNG and LNG vehicles can significantly reduce emissions. LPG was the fuel for a very small number of public electric vehicles in the early stage of this study. The overall proportion and consumption of LPG vehicles were the lowest (at the 10−6 level), reflecting the low acceptance of LPG buses by policies and the market in a specific period.
The regression coefficient of energy intensity showed a significant overall decline in the later stage of this study, serving as the primary driving force for road traffic carbon emissions. This aligns with the technological synergistic effects during the implementation period of the Belt and Road Initiative: cities optimized their energy consumption structures through complementary advantages and energy-saving technology assistance, weakening the positive correlation between energy intensity and carbon emissions.
In the Guanzhong and Southern Shaanxi regions, the regression coefficients of energy intensity shifted from positive to negative (after 2018), revealing the carbon emission offset effect of economic growth rates on energy consumption expansion. Particularly under the policy intervention to reduce energy consumption intensity in 2019, these two regions achieved a dynamic balance of energy intensity, forming an evolutionary path of “technical optimization—structural convergence—coefficient convergence.” The energy base attributes of Northern Shaanxi determined its unique transformation challenges: its coefficient was initially high (2.15) in the sample period, approaching zero in the mid-to-late stage. After capacity reduction in Northern Shaanxi, breakthroughs were urgently required in emission reduction bottlenecks through non-energy-efficiency measures such as carbon capture technology.
(2)
Spatiotemporal Heterogeneity of Tertiary Industry Proportion Impact on Carbon Emissions
The regression coefficient of tertiary industry proportion in Southern Shaanxi showed a brief positive value at the initial stage of this study before remaining negative (Figure 7b), indicating that the carbon inhibition effect triggered by internal structural upgrading was gradually strengthening. The coefficient in Northern Shaanxi experienced fluctuations of “increase—continuous decrease,” reflecting periodic volatility in the carbon emission reduction effects of internal structural upgrading. In the Guanzhong region, the regression coefficient plummeted after 2016 and formed a negative high-value area. The implementation of national strategies such as rural revitalization has accelerated the improvement of industrial structure and carbon emission reduction effectiveness.
(3)
Spatiotemporal Heterogeneity of Road Network Integration’s Impact on Carbon Emissions
The regression coefficients of the three major regions generally showed a decreasing trend, and Guanzhong and Southern Shaanxi successively showed positive inflection points in 2016 (Figure 7c), indicating that the road network carbon lock-in effect gradually dissipated with the urbanization process. Taking Xiying Road-Jixiang Road in the central district of Xi’an as an example, the measured road network integration degree has been declining year by year. Travelers passing through the signal machines on this section during off-peak hours generate an average of 2–5 min of green light waiting time. In this process, CO2 emissions from traffic congestion originated, on the one hand, from motor vehicles idling in queues [47] and on the other hand, from excessive travel time, travel distance, and number of turns caused by avoiding congested areas [48].
Specifically, the road network integration coefficient in Southern Shaanxi has undergone a complete negative-to-positive transformation process (−0.8→1.7). After 2016, the positive driving force for road traffic carbon emissions originated from urban form expansion triggered by the “Belt and Road” urban construction, the road network load rate exceeding the threshold, traffic infrastructure networking, and the enhancement of road traffic status. In Northern Shaanxi, a stable negative correlation was maintained. The declining trend of population density led to the road utilization rate consistently remaining below 0.4, causing a decrease in carbon emissions per unit road network.
(4)
Spatiotemporal Heterogeneity of Economic Density’s Impact on Carbon Emissions
Economic density and carbon emissions showed a trend of strengthened decoupling (Figure 7d), with the carbon inhibition effect of improved economic growth quality continuously increasing. This negative correlation originated from the transformation of the economic structure toward intensiveness—by 2018, the proportion of the tertiary industry in Shaanxi gradually increased by 8.8 percentage points, and the energy consumption per unit output value of above-scale areas decreased by 6.61 percentage points.
The Guanzhong region formed a significant inhibition core, with the absolute value of its average coefficient 34% and 58% higher than those of Southern and Northern Shaanxi, respectively, mainly benefiting from industrial chain upgrading (advanced manufacturing accounted for 29.8%) and energy efficiency improvements. The inhibition intensity of Northern and Southern Shaanxi on road traffic carbon emissions was 12.6 percentage points lower than that of Guanzhong, due to the lagging transformation of resource-dependent economies, particularly the dominance of energy extraction (Northern Shaanxi) and primary processing (Southern Shaanxi).

5. Discussion

5.1. Carbon Emission Prediction of Road Transportation in Shaanxi Province

The years 2010~2020 are set as the base years for CO2 emission prediction, and the years 2021~2060 are the target years for prediction. The training samples are selected from the existing CO2 emissions in Shaanxi Province (2010~2011, 2012~2013, 2014~2015, 2016~2017, 2018~2019), and the test set is (2011~2012, 2013~2014, 2015~2016, 2017~2018, 2019~ 2020) five time periods and cross with the training set. The prediction idea is to use the training set to predict the future data, then use the test set to verify the MAPE, MAE, and RMSE with the future data, and finally obtain the optimal prediction value.
The undulating trend of the future CO2 emission curve of road transportation in Shaanxi Province (Figure 8) shows that the evolution of the period of 2021–2060 is characterized by obvious features (the average annual growth rate reaches 1.17%), which is divided into a steady growth phase (2024–2035), a smooth emission phase (2036–2045), and a slow decline phase (2046–2060).
The annual average growth rate of road traffic CO2 emissions in Shaanxi Province during the first future decade (2025–2035) will increase by 10.04% compared with that in 2010–2020, and it is expected to reach the peak in 2035 (24.504 million tons), which is five years later than China’s scheduled target and 11.9279 million tons (about 1.95 times) higher than the baseline year peak. In the second future decade, carbon emissions will gradually stabilize. During this period, Shaanxi Province will complete exchanges, cooperation, and complementary advantages with neighboring provinces in the fields of economy and trade, carbon market, ecology, etc., which will undoubtedly play a great role in relieving local carbon emission pressure. In the third future decade (2045–2055), CO2 emissions will decrease year by year, dropping to 18.1985 million tons in 2060 (a decrease of 25.02%). After years of capacity reduction and structural adjustment in this period, the policies and technologies of the road traffic industry in Shaanxi Province will be more effective in achieving carbon neutrality. In contrast, at present, the density of railway and highway networks in Shaanxi Province is low, and carbon emissions are growing slowly. If the government takes strong measures in the field of urban road traffic, such as improving fuel economy, promoting transportation modes, optimizing and upgrading transportation equipment, and increasing the coverage rate of new energy vehicles, the growth of CO2 emissions in the road traffic industry will be further slowed down, and the peak is expected to be reached in 2030.

5.2. The Literature Comparison

This study shows that the positive driving forces for road traffic carbon emissions originate from urban form expansion triggered by the “Belt and Road” urban construction, the road network load rate exceeding the threshold, traffic infrastructure networking, and the enhancement of road traffic status, which are all consistent with previous research conclusions [49]. The difference lies in that Western studies lack the spatiotemporal heterogeneity analysis of economic density, urbanization rate, and municipal road carbon emissions, which may be closely related to the unique development policies and differentiated regional characteristics of Shaanxi Province [50]. Compared with the development level of other foreign regions, Shaanxi Province shares the following commonalities:
(1)
In terms of urban development level, Shaanxi Province is in the mid-stage of rapid urbanization (urbanization rate of approximately 66.14%). Its high-density urban agglomeration development is highly similar to that of the Lombardy Region [51], and the polycentric urban expansion model is comparable to that of the Greater London Urban Agglomeration in the UK [52]. The commonality of such regions is that the growth rate of urbanization is higher than that of road traffic carbon emissions.
(2)
In terms of transportation service level, urban road traffic in Shaanxi presents the characteristics of “highway-dominated and railway-supplemented”, similar to the structure in the early transformation stage of Ontario, Canada [53], and the Ruhr Industrial Zone in Germany [54].
(3)
From the perspective of the strategic status of traffic carbon emissions, as a key link in the Silk Road Economic Belt, Shaanxi Province connects the Asia-Pacific economic circle in the east and the European economic circle in the west, serving as an important transportation hub of the New Western Land–Sea Corridor. Its proportion of traffic carbon emissions (approximately 10.4%) is on par with the domestic average and lower than the global traffic emission baseline.

5.3. Policy Implications

Based on the above discussion, in terms of urban development level, transportation facility service level, and the strategic status of transportation carbon emissions, other regions such as the Lombardy Region in Italy and the Greater London Urban Agglomeration in the UK share similarities with Shaanxi Province. However, Shaanxi Province has obvious regional differences: Northern Shaanxi is rich in energy and minerals but suffers from serious population loss; Guanzhong has developed advanced manufacturing industries such as new energy vehicles and electronic information; and Southern Shaanxi has ecological advantages for the concentrated development of organic agricultural product processing and eco-tourism transportation services. Therefore, when formulating regional carbon emission reduction strategies, the government needs to adopt measures adapted to local conditions [55] to achieve the transnational exchange of advanced carbon emission reduction technologies and the sharing of emission reduction strategies.
(1)
GTWR tests show that energy intensity has a positive stimulating effect on road traffic CO2 emissions. To continuously weaken the positive effect of energy intensity on CO2 emission growth, future energy policies in central and eastern regions should prioritize advanced technical equipment and technological innovation incentive mechanisms. Improving energy consumption regulatory systems can ensure that energy intensity in road traffic is reduced to expected levels in the coming years.
(2)
Due to the significant spatiotemporal differences in the impact of road network integration on carbon emissions in Shaanxi Province, targeted strategies must be implemented based on the characteristics of different built environments. In densely populated areas similar to Southern Shaanxi, efforts should focus on controlling the trend of excessive road network compactness and promoting a spatial optimization model of “moderately compact road network + bus priority.” This approach avoids excessive CO2 emissions caused by long-distance detours due to overcrowded road networks. In regions with insufficient road network accessibility, such as the Guanzhong urban agglomeration, the priority is to plan and improve the traffic efficiency of main road sections. This can be achieved by adding variable lanes and optimizing traffic light timing to dynamically allocate and adjust the green light duration for peak traffic flows, thereby reducing CO2 emissions from idling vehicles. In areas with population loss like Northern Shaanxi, implementing “low-efficiency road function transformation” is necessary. This involves converting redundant roads into logistic distribution hubs or green corridors while densifying public transportation networks in key towns to guide a low-carbon travel structure.
(3)
The changing trend of industrial structure regression coefficients indicates that industrial structure upgrading with large transformation space brings significant carbon reduction effects. Systematically adjusting the industrial structure of Shaanxi Province, an industrially developed region, has certain representativeness and universal value for tapping carbon emission reduction potential in similar regions globally. For example, strategies such as reducing the proportion of tertiary industry, optimizing the internal industrial structure, establishing strict market access systems, and vigorously cultivating low-energy-consuming and high-output emerging industries can drive economic growth while gradually shifting the development focus to the tertiary industry, ensuring that the tertiary industry declines to an optimal proportion within the planned period.
(4)
The significant positive correlation between energy intensity and CO2 emissions in different spatiotemporal geographies also indirectly confirms the need to optimize the energy structure dominated by coal and oil. First, policymakers should take measures to restrict the use of high-carbon energy, continuously reducing the road traffic industry’s dependence on oil products through promoting green travel concepts, public transportation, and new energy vehicles. Additionally, in regions rich in solar, wind, and natural gas resources, making full use of these renewable energy sources to replace coal and oil is the optimal path. Second, accelerating the closure of small thermal power plants and integrating/recycling power plants is crucial; enhancing technical exchange and sharing on power plant transformation with other pioneering countries can increase the proportion of renewable power generation and thermal power efficiency.

6. Conclusions

This paper starts from the microscopic perspective of urban road transportation within the transportation industry. It innovatively integrates traditional CO2 emission accounting methods with novel energy consumption models to analyze the spatiotemporal evolution characteristics of road traffic CO2 emissions and the influencing mechanisms including road built environment factors, forming a comprehensive “accounting—impact mechanism—forecasting” analytical framework. Shaanxi Province and its cities play a pivotal role in China’s geographical location and economic development. This framework can not only provide references for green emission reduction strategies in similar regions but also offer research ideas and data support for the subsequent literature to analyze the growth mechanism of CO2 emissions. The research conclusions are as follows:
(1)
CO2 emissions across Shaanxi’s urban systems exhibit pronounced spatiotemporal autocorrelation and high-carbon spillover dynamics. This is characterized by the expansive growth of high-emission clusters: centering on the central region, these clusters radiate to adjacent areas, triggering a hierarchical leapfrog effect in emission intensity gradients.
(2)
The impact of the built environment on road traffic CO2 emissions exhibits stage-specific characteristics. In the early sample period, highly accessible road networks with simplistic built environments and low utilization rates constrained primary emission sources. However, as urban populations, economic activities, production factors, and road networks evolved toward compact configurations, the coupled effects of extended travel distances and exacerbated traffic congestion paradoxically amplified CO2 emissions.
(3)
Technological R & D and the improvement of per capita economic level all have negative inhibitory effects on carbon emissions. On one hand, the transportation sector can reduce carbon emissions by upgrading automobile production processes to improve efficiency. On the other hand, with rapid economic development, regional economic models are gradually transitioning to intensive, low-carbon, and sustainable development patterns through continuous adjustment, and their effect in reducing carbon intensity is becoming increasingly prominent.
(4)
The future road traffic CO2 emissions in Shaanxi Province are divided into three stages: steady growth, stable emission, and slow decline. It is expected to reach a peak in 2035, exceeding the baseline year peak by 11.93 million tons, which is five years later than China’s scheduled target. If the government takes measures such as improving fuel economy, optimizing and upgrading transportation equipment, and increasing the coverage rate of new energy vehicles, the peak is expected to be reached in 2030.

Author Contributions

Conceptualization, Y.Q. and W.H.; data curation, X.W.; formal analysis, Y.Q., W.H., and J.Z.; funding acquisition, Y.Q.; investigation, W.H. and H.L.; methodology, J.Z.; software, X.W.; validation, J.Z., H.L., and M.Y.; writing—original draft, W.H.; writing—review and editing, W.H., H.L., and Z.Z. All authors have read and agreed to the published version of the manuscript.

Funding

This research was funded by Double First-Class Major Research Programs of the Educational Department of Gansu Province (Grant No: GSSYLXM—04), the Philosophy and social science planning project of Gansu Province (Grant No: 2021YB058), the Higher Education Innovation Fund project of Gansu Province (Grant No: 2020B—113), and the National Social Science Foundation of China (Grant No: 15BJY037).

Informed Consent Statement

Informed consent was obtained from all subjects involved in this study.

Data Availability Statement

The original contributions presented in this study are included in the article. Further inquiries can be directed to the corresponding authors.

Conflicts of Interest

Author Wenqiang Hao was employed by the company Xi’an Rail Transit Group Company-Limited. The remaining authors declare that the research was conducted in the absence of any commercial or financial relationships that could be construed as a potential conflict of interest.

References

  1. Wahab, S.; Imran, M.; Ahmed, B. Navigating environmental concerns: Unveiling the role of economic growth, trade, resources and institutional quality on greenhouse gas emissions in OECD countries. J. Clean. Prod. 2024, 434, 139851. [Google Scholar] [CrossRef]
  2. Speizer, S.; Fuhrman, J.; Aldrete Lopez, L. Integrated assessment modeling of a zero-emissions global transportation sector. Nat. Commun. 2024, 15, 4439. [Google Scholar] [CrossRef]
  3. Zhang, Z.; Zhu, J.; Yang, L. Toward dual carbon targets: Spatial correlation on comprehensive carbon emission index in urban agglomerations based on a new evaluation model. J. Clean. Prod. 2024, 458, 142507. [Google Scholar] [CrossRef]
  4. Li, L.; Wu, Q. Characterization of spatial and temporal analysis of carbon emission intensity of transportation—The case of Northwest China along the “Belt and Road”. J. Dalian Univ. Technol. (Soc. Sci. Ed.) 2018, 39, 44–52. [Google Scholar]
  5. Chi, M.; Guo, Q.; Mi, L. Spatial distribution of agricultural eco-efficiency and agriculture high-quality development in China. Land 2022, 11, 722. [Google Scholar] [CrossRef]
  6. Gao, B.; Huang, Z.; Zhang, T. Exploring the impact of industrial land price distortion on carbon emission intensity: Evidence from China. Land 2022, 12, 92. [Google Scholar] [CrossRef]
  7. Zheng, R.; Wu, G.; Cheng, Y. How does digitalization drive carbon emissions? The inverted U-shaped effect in China. Environ. Impact Assess. Rev. 2023, 102, 107203. [Google Scholar] [CrossRef]
  8. Hu, H.; Zu, W.; Xu, S. Study on the decoupling effect and driving factors of transportation and energy carbon emissions in the Yangtze River Economic Zone. Yangtze River Basin Resour. Environ. 2022, 31, 862–877. [Google Scholar]
  9. Hong, J.H.; Kim, J.; Son, W. Long-term energy strategy scenarios for South Korea: Transition to a sustainable energy system. Energy Policy 2019, 127, 425–437. [Google Scholar] [CrossRef]
  10. Hossain, M.S.; Basak, S.M.; Amin, M.N. Social-ecological systems approach for adaptation to climate change. Sustain. Dev. 2024, 32, 2766–2778. [Google Scholar] [CrossRef]
  11. Luo, X.; Cai, C.; Zhao, H. Study on the Evolutionary Characteristics of Spatial and Temporal Patterns and Decoupling Effect of Urban Carbon Emissions in the Yangtze River Delta Region Based on Neural Network Optimized by Aquila Optimizer with Nighttime Light Data. Land 2024, 14, 51. [Google Scholar] [CrossRef]
  12. Yang, S.; Huang, Y.; Jiao, J.; Liao, C. Analysis of energy consumption and air pollutant emissions in Guangzhou transportation sector based on LEAP model. New Energy Prog. 2021, 9, 69–75. [Google Scholar]
  13. Gu, H.; Chen, X.; Sun, H. How Does Land Urbanization Affect Carbon Emissions in China? Evidence from 209 Cities and Three Heterogeneous Regions in the East of the Hu Line of China. Land 2025, 14, 910. [Google Scholar] [CrossRef]
  14. Hussain, Z.; Marcel, B.; Majeed, A. Effects of transport–carbon intensity, transportation, and economic complexity on environmental and health expenditures. Environ. Dev. Sustain. 2024, 26, 16523–16553. [Google Scholar] [CrossRef]
  15. Minarta, R.R.; Ko, J. What are the stimulants on transportation carbon dioxide emissions?: A nation-level analysis. Energy 2024, 296, 131179. [Google Scholar] [CrossRef]
  16. Present, E.; Gagnon, P.; Wilson, E.J.H. Choosing the Best Carbon Factor for the Job: Exploring Available Carbon Emissions Factors and the Impact of Factor Selection; National Renewable Energy Laboratory (NREL): Golden, CO, USA, 2024. [Google Scholar]
  17. Thio, E.; Tan, M.X.; Li, L. The estimation of influencing factors for carbon emissions based on EKC hypothesis and STIRPAT model: Evidence from top 10 countries. Environ. Dev. Sustain. 2022, 24, 11226–11259. [Google Scholar] [CrossRef]
  18. Xu, H.; Wang, Y. Empirical study on economic growth and carbon emissions in Shaanxi under the perspective of EKC. Res. World 2021, 1, 54–59. [Google Scholar]
  19. Zhao, X.; Zhang, S.; Yuan, C. A spatial econometric test of the environmental Kuznets curve for transportation carbon emissions in China. Stat. Decis. Mak. 2021, 37, 23–26. [Google Scholar]
  20. Naseem, S.; Kashif, U.; Rasool, Y. The impact of financial innovation, green energy, and economic growth on transport-based CO2 emissions in India: Insights from QARDL approach. Environ. Dev. Sustain. 2024, 26, 28823–28842. [Google Scholar] [CrossRef]
  21. Wang, H.; Zhang, X. Spatial heterogeneity of factors influencing transportation CO2 emissions in Chinese cities: Based on geographically weighted regression model. Air Qual. Atmos. Health 2020, 13, 977–989. [Google Scholar] [CrossRef]
  22. Abulibdeh, A. Geospatial assessment of the carbon footprint of water and electricity consumption in residential buildings in Doha, Qatar. J. Clean. Prod. 2024, 445, 141262. [Google Scholar] [CrossRef]
  23. Vachon, J.; Kerckhoffs, J.; Buteau, S. Do machine learning methods improve prediction of ambient air pollutants with high spatial contrast? A systematic review. Environ. Res. 2024, 262, 119751. [Google Scholar] [CrossRef]
  24. Sun, S.; Xie, Y.; Li, Y. Analysis of Dynamic Evolution and Spatial-Temporal Heterogeneity of Carbon Emissions at County Level along “The Belt and Road”—A Case Study of Northwest China. Int. J. Environ. Res. Public Health 2022, 19, 13405. [Google Scholar] [CrossRef]
  25. Zhang, H.; Zhang, J.; Wang, R.; Ya, M.; Peng, J.Y. Mechanisms of the built environment in small cities on carbon emissions from residential travel and transportation. Urban Issues 2020, 4–10+20. [Google Scholar] [CrossRef]
  26. Wang, S.; Liu, X.; Zhou, C. Examining the impacts of socioeconomic factors, urban form, and transportation networks on CO2 emissions in China’s megacities. Appl. Energy 2017, 185, 189–200. [Google Scholar] [CrossRef]
  27. Hong, S.; Hui, E.; Lin, Y. Relationship between urban spatial structure and carbon emissions: A literature review. Ecol. Indic. 2022, 144, 109456. [Google Scholar] [CrossRef]
  28. Kim, H.M.; Thai, H.M.H. The spatial mismatch between foreign direct investment and street networks: Evidence from Hanoi, Vietnam. Habitat Int. 2024, 151, 103152. [Google Scholar] [CrossRef]
  29. Xiong, H.; Xu, Y.; Yan, H. Optimizing electric vehicle routing under traffic congestion: A comprehensive energy consumption model considering drivetrain losses. Comput. Oper. Res. 2024, 168, 106710. [Google Scholar] [CrossRef]
  30. Belloni, M.; Tarsitano, D.; Sabbioni, E. A Comprehensive Analysis of Energy Consumption in Battery-Electric Buses Using Experimental Data: Impact of Driver Behavior, Route Characteristics, and Environmental Conditions. Electronics 2025, 14, 735. [Google Scholar] [CrossRef]
  31. Sun, B.; Hu, L.; Fan, Z. Evaluation indicators for road traffic energy consumption: A review and prospect. Environ. Sci. Pollut. Res. 2024, 31, 22243–22257. [Google Scholar] [CrossRef]
  32. Filonchyk, M.; Peterson, M.P.; Yan, H. Greenhouse gas emissions and reduction strategies for the world’s largest greenhouse gas emitters. Sci. Total Environ. 2024, 944, 173895. [Google Scholar] [CrossRef]
  33. Ke, L.; Ren, Z.; Wang, Q. Transport Carbon Emission Measurement Models and Spatial Patterns Under the Perspective of Land–Sea Integration–Take Tianjin as an Example. Sustainability 2025, 17, 3095. [Google Scholar] [CrossRef]
  34. Kim, M.W.; Kim, G.M.; Jeon, C.H. Low-carbon fuel reburning for CO2 and NOx reduction in pulverized coal firing system. J. Energy Inst. 2024, 114, 101638. [Google Scholar] [CrossRef]
  35. Ma, H.; Sun, W.; Wang, S. Structural contribution and scenario simulation of highway passenger transit carbon emissions in the Beijing-Tianjin-Hebei metropolitan region, China. Resour. Conserv. Recycl. 2019, 140, 209–215. [Google Scholar] [CrossRef]
  36. Herlina, L.; Rani, D.S.; Susantoro, T.M. Indonesia’s country-specific CO2 emission factor based on gas fuels for greenhouse gas inventory in the energy sector. Environ. Pollut. 2025, 368, 125749. [Google Scholar] [CrossRef]
  37. Lv, K.; Wang, Q.; Shi, X. Multi-Scale Mapping of Energy Consumption Carbon Emission Spatiotemporal Characteristics: A Case Study of the Yangtze River Delta Region. Land 2025, 14, 95. [Google Scholar] [CrossRef]
  38. Jia, H.; Li, W.; Tian, R. Spatio-Temporal Influencing Factors of the Coupling Coordination Degree Between China’s New-Type Urbanization and Transportation Carbon Emission Efficiency. Land 2025, 14, 623. [Google Scholar] [CrossRef]
  39. Liu, H.; Xiong, J.; Hong, S. Social, economic, and environmental development in China through the lens of synergies and trade-offs. J. Clean. Prod. 2025, 509, 145634. [Google Scholar] [CrossRef]
  40. Zhang, M.; Kafy, A.A.; Xiao, P. Impact of urban expansion on land surface temperature and carbon emissions using machine learning algorithms in Wuhan, China. Urban Clim. 2023, 47, 101347. [Google Scholar] [CrossRef]
  41. Liu, H.; Lu, J.; Li, X. Evaluating human-nature relationships at a grid scale in China, 2000–2020. Habitat Int. 2025, 156, 103282. [Google Scholar] [CrossRef]
  42. Zhang, H.; Peng, J.; Wang, R. Spatial planning factors that influence CO2 emissions: A systematic literature review. Urban Clim. 2021, 36, 100809. [Google Scholar] [CrossRef]
  43. Chang, C.; Yang, C.; Lin, T. Carbon dioxide emissions evaluations and mitigations in the building and traffic sectors in Taichung metropolitan area, Taiwan. J. Clean. Prod. 2019, 230, 1241–1255. [Google Scholar] [CrossRef]
  44. Rasool, Y.; Zaidi, S.A.H.; Zafar, M.W. Determinants of carbon emissions in Pakistan’s transport sector. Environ. Sci. Pollut. Res. 2019, 26, 22907–22921. [Google Scholar] [CrossRef] [PubMed]
  45. Mun, H.; Jung, J. Impact of Compact City on Carbon Emission Reduction Based on Urban Size: A Spatial Analysis Using Satellite Imagery. Sustain. Cities Soc. 2025, 126, 106326. [Google Scholar] [CrossRef]
  46. Hao, W. Spatial-Temporal Evolution Pattern of Urban Road Traffic Carbon Emission and Driving Mechanism in Northwest Economic Zone; Lanzhou Jiaotong University: Lanzhou, China, 2024; p. 000396. [Google Scholar]
  47. Wu, K.; Ding, J.; Lin, J. Big-data empowered traffic signal control could reduce urban carbon emission. Nat. Commun. 2025, 16, 2013. [Google Scholar] [CrossRef] [PubMed]
  48. Saxena, D.; Singh, N.; Gupta, K. An Intelligent Multi-Depot Vehicle Routing and Management Model for Smart Cities. IEEE Trans. Intell. Transp. Syst. 2025, 26, 7740–7754. [Google Scholar] [CrossRef]
  49. Li, X.; Zhang, C.; Pan, T. The Impact of Urban Form on Carbon Emission Efficiency Under Public Transit-Oriented Development: Spatial Heterogeneity and Driving Forces. Land 2025, 14, 1172. [Google Scholar] [CrossRef]
  50. Ghaffarpasand, O.; Pope, F.D. Telematics data for geospatial and temporal mappping of urban mobility: New insights into travel characteristics and vehicle specific power. J. Transp. Geogr. 2024, 115, 103815. [Google Scholar] [CrossRef]
  51. Algieri, B.; Füg, O.; Lombardo, R. The Italian Journey: Carbon dioxide emissions, the role of tourism and other economic and climate drivers. J. Clean. Prod. 2022, 375, 134144. [Google Scholar] [CrossRef]
  52. Qiao, Q.; Eskandari, H.; Saadatmand, H. An interpretable multi-stage forecasting framework for energy consumption and CO2 emissions for the transportation sector. Energy 2024, 286, 129499. [Google Scholar] [CrossRef]
  53. Haider, A. The determinants of greenhouse gas emissions: Empirical evidence from Canadian Provinces. Sustainability 2024, 16, 2498. [Google Scholar] [CrossRef]
  54. Reichert, A.; Holz-Rau, C.; Scheiner, J. GHG emissions in daily travel and long-distance travel in Germany–Social and spatial correlates. Transp. Res. Part D: Transp. Environ. 2016, 49, 25–43. [Google Scholar] [CrossRef]
  55. Liu, H.; Wang, X.; Wang, Z. Does digitalization mitigate regional inequalities? Evidence from China. Geogr. Sustain. 2024, 5, 52–63. [Google Scholar] [CrossRef]
Figure 1. Administrative divisions of Shaanxi Province and its location in China.
Land 14 01355 g001
Figure 2. Total CO2 emissions from whole road transportation in Shaanxi Province, 2010–2020.
Land 14 01355 g002
Figure 3. Temporal characteristics of CO2 emissions by transportation mode in Shaanxi Province, 2010–2020.
Land 14 01355 g003
Figure 4. Temporal evolution of carbon emissions from road transportation in 10 cities in Shaanxi, 2010–2020.
Land 14 01355 g004
Figure 5. LISA clustering of CO2 emissions by city.
Land 14 01355 g005
Figure 6. Evolution of spatial and temporal patterns of CO2 emissions from road transportation by city.
Land 14 01355 g006
Figure 7. Boxplot of regression coefficients for each driver.
Land 14 01355 g007
Figure 8. Forecast results of CO2 emissions from road transportation in Shaanxi Province, 2020–2060.
Land 14 01355 g008
Table 1. Description of explanatory variables for urban traffic carbon emissions.
DimensionsVariable IndicatorsInterpretation (Units)
Level of Transportation Eervices
(1)
Road network density
(2)
Percentage of land used for transportation facilities
(3)
Density of public transportation stations
(1)
Length of road network per unit of urban area (km·km−2)
(2)
Utility land area/small urban area (%)
(3)
Number of stations per unit of urban area (stations·km−2)
Road Network Spatial Pattern
(1)
Road network integration (Integi)
(2)
Road network depth values (Depthi)
(3)
Urban fragmentation (NP)
(1)
Degree of dispersion or convergence of a single road transportation network node with all road network nodes
(2)
The shortest distance from the current spatial location to the destination
(3)
The higher number of patches indicates the higher degree of landscape fragmentation; value range: NP ≥ 1
Level of Urban Development
(1)
Urbanization rate (UR)
(2)
Population intensity (PI)
(3)
Energy intensity (EI)
(1)
Proportion of urban population to total population (%)
(2)
Number of resident population per unit construction land area (tens of thousands·km−2)
(3)
Energy consumption per unit of GDP (t CO2/CNY billion)
Socio-economic Base
(1)
Total economy (GDP)
(2)
Industrial structure (RSF)
(3)
Economic density (PGDP)
(1)
Quantity of GDP (CNY billion)
(2)
Ratio of value added of tertiary industry to value added of secondary industry (%)
(3)
Per capita GDP (CNY million/person)
Table 2. Vehicle ownership of carbon sources for road traffic in Shaanxi Province (104 vehicles).
Particular YearMass TransitRental CarPrivate CarMotorcycleSubtotal
20101.22 3.17 110.51 177.68 292.59
20111.32 3.41 146.01 197.62 348.37
20121.36 3.44 186.85 205.66 397.31
20131.47 3.44 233.92 212.13 450.96
20141.49 3.57 283.56 244.23 532.85
20151.55 3.60 336.33 284.23 625.71
20161.64 3.62 392.47 231.74 629.47
20171.69 3.60 446.75 237.77 689.80
20181.86 3.57 503.44 281.32 790.19
20192.05 3.80 558.01 250.84 814.71
20202.25 3.98 609.21 283.99 899.42
Table 3. Model results based on OLS estimation.
Secondary IndicatorsStandard ErrorRegression CoefficientGoodness of Fit R2Adjusted R2
Energy Intensity0.060.513 ***0.8710.879
Road Network Density0.370.2910.5030.512
Depth Value0.410.6400.3100.302
Crushability0.470.7990.4750.401
Bus Stop Density0.140.6470.4120.436
Degree of Road Network Integration0.120.614 **0.7720.741
Urbanization Rate0.190.2590.3250.331
Population Density0.600.1370.2610.191
Economic Aggregate0.370.2450.5010.549
Industrial Structure0.18−0.375 **0.7800.773
Economic Density0.14−0.336 *0.8090.816
Percentage of Land Used for Transportation Facilities0.380.5010.2880.312
Note: *** Denotes significance level p < 0.001; ** Denotes significance level p < 0.01; * Denotes significance level p < 0.05.
Table 4. Comparison of different model performances.
Parameters/ModelsGTWRTWRGWROLS
AIC142.31164.37174.93206.12
R20.8370.4030.4200.339
Adjusted R20.8420.4170.461-
Note: AIC is the Modified Akaike Information Criterion. The lower the value of AIC, the better the model fit.
Table 5. Descriptive statistics of GTWR parameters.
ParametersMinimumLower QuartileUpper QuartileUpper QuartileMean ValueMean SE
Energy Intensity0.1790.2471.4582.1362.8310.037
Degree of Road Network Integration−1.584−1.2990.8712.1342.30.0229
Industrial Structure−2.659−1.884−0.958−0.731−0.6410.035
Economic Density−1.718−1.131−0.81−1.079−1.0270.047
R20.840
Adjusted R20.848
Disclaimer/Publisher’s Note: The statements, opinions and data contained in all publications are solely those of the individual author(s) and contributor(s) and not of MDPI and/or the editor(s). MDPI and/or the editor(s) disclaim responsibility for any injury to people or property resulting from any ideas, methods, instructions or products referred to in the content.

