Abstract
Investigating soil temperature and the heat transfer process is essential for understanding water–heat changes and energy balance in farmland. The conversion from upland fields (UFs) to paddy fields (PFs) alters the land cover, irrigation regimes, and soil properties, leading to differences in soil temperature, thermal properties, and heat fluxes. Our study aimed to quantify the effects of converting UFs to PFs on soil temperature and heat transfer processes, and to elucidate its underlying mechanisms. A long-term cultivated UF and a newly developed PF (converted from a UF in May 2015) were selected for this study. Soil water content (SWC) and temperature were monitored hourly over two years (June 2017 to June 2019) in five soil horizons (i.e., 10, 20, 40, 60, and 90 cm) at both fields. The mean soil temperature differences between the UF and PF at each depth on the annual scale varied from −0.1 to 0.4 °C, while they fluctuated more significantly on the seasonal (−0.9~1.8 °C), monthly (−1.5~2.5 °C), daily (−5.6~4.9 °C), and hourly (−7.3~11.3 °C) scales. The SWC in the PF was significantly higher than that in the UF, primarily due to differences in tillage practices, which resulted in a narrower range of soil temperature variation in the PF. Additionally, the SWC and soil physicochemical properties significantly altered the soil’s thermal properties. Compared with the UF, the volumetric heat capacity (Cs) at the depths of 10, 20, 40, 60, and 90 cm in the PF changed by 8.6%, 19.0%, 5.5%, −4.3%, and −2.9%, respectively. Meanwhile, the thermal conductivity (λθ) increased by 1.5%, 18.3%, 19.0%, 9.0%, and 25.6%, respectively. Moreover, after conversion from the UF to the PF, the heat transfer direction changed from downward to upward in the 10–20 cm soil layer, resulting in a 42.9% reduction in the annual average soil heat flux (G). Furthermore, the differences in G between the UF and PF were most significant in the summer (101.9%) and most minor in the winter (12.2%), respectively. The conversion of the UF to the PF increased the Cs and λθ, ultimately reducing the range of soil temperature variation and changing the direction of heat transfer, which led to more heat release from the soil. This study reveals the effects of farmland use type conversion on regional land surface energy balance, providing theoretical underpinnings for optimizing agricultural ecosystem management.
1. Introduction
Soil temperature is a critical factor in evaluating the storage and distribution of heat in the soil [1]. It is crucial for regulating the balance of surface energy [2,3], soil carbon storage [4], and soil nutrient cycling [5]. Among them, soil heat transfer is closely related to the exchange of matter and energy between the land surface and the atmosphere, thereby exerting a profound influence on the water, energy, and carbon cycles of agricultural ecosystems [4,6,7]. Studying soil heat transfer processes is essential for understanding the soil heat balance and the water–heat transport processes in the agricultural ecosystem [8].
Soil temperature is mainly influenced by meteorological factors [7,9], land cover [10], and soil properties [2]. The most direct meteorological factors affecting soil temperature are air temperature and solar radiation [5]. Air temperature accounts for about 94% of the variation in soil temperature [3], while solar radiation drives soil temperature fluctuations on daily, monthly, and seasonal scales [1]. However, the land cover reflects solar radiation and resists the energy reaching the surface [11,12]. It was reported that the soil temperature increases by an average of 4 °C when the albedo is reduced by 37% [13]. In addition, the land cover can effectively block longwave radiation emitted from the soil surface. The increase in vegetation enhances transpiration and shading [14], affecting the soil temperature afterward [15]. Zhang et al. [10] found that the soil temperature reduced from 1.5 to 0.5 °C when the leaf area index (LAI) value increased from 1.0 to 2.0. Additionally, differences in soil properties can affect soil thermal properties (i.e., volumetric heat capacity (Cs), thermal conductivity (λθ), and thermal diffusivity) [16,17], which in turn affect temperature variations [18]. An increase in Cs can slow down the rate of temperature change, while an increase in λθ can accelerate the heat transfer process [19]. Firanj Sremac [2] found that sandy soils typically cool down faster than clay soils due to their lower Cs and higher λθ. Similarly, a 1.0% reduction in soil water content (SWC) results in a decrease in both Cs and λθ, leading to an increase in soil surface temperature by 0.1–0.4 °C [10].
Soil heat flux (G) is a crucial factor in studying changes in heat transfer, which characterizes the energy transfer processes among different soil layers [20]. Quantifying soil heat flux is essential for predicting the dynamics of soil temperature [21]. Generally, a greater soil temperature gradient between two layers leads to faster heat transfer [22]. Ju and Hu [23] found that the warming air temperature depressed the upward G by 42.4–50.1% in the winter, attributed to a decrease in the temperature gradient between the surface soil layer and the atmosphere. Conversely, the warming air temperature increased the downward G by 5.5–12.3% in the spring. Apart from the temperature gradient, thermal properties influence heat transfer processes [24]. Soil thermal properties are mainly influenced by organic matter content, texture, bulk density, porosity, and SWC [25,26]. For example, Mengistu [16] found that Cs increased by 42.0% when the SWC changed from 0 to 0.39 cm3 cm−3. Additionally, Qiao et al. [27] indicated that soil bulk density and sand content significantly affected soil λθ. Ju and Hu [23] observed that warming air temperatures cause a reduction in SWC, leading to a decrease in both Cs and λθ. Consequently, this resulted in a decline in the upward G. Furthermore, the G was affected by the land surface cover characteristics, which were attributed to changes in surface soil temperature variations [27]. Similarly, Gan et al. [28] showed that the sparser vegetation cover in tall fescue than Leymus chinensis led to a higher G.
In recent years, land surface systems have undergone significant anthropogenic disturbances, resulting in frequent shifts in land use types and agricultural cropping patterns [29,30]. These conversions altered the vegetation characteristics of the land surface and soil properties [31], affecting heat input and leading to differences in soil thermal properties. Haruna [25] found that Cs was 23.0% higher while λθ was 11.0% lower in winter wheat fields than in the bare ground. Similarly, Zhao et al. [32] found that Cs in the corn field was 19.9% higher than in the wheat field during the growing period. Moreover, the thermal properties can further alter the thermal storage and conductivity of the entire soil profile, which may ultimately affect soil temperature and heat transfer processes [18]. Studies have shown that Cs was 21.9% higher while λθ was 17.1% lower in grasslands than in bare soils [33]. These changes contributed to a 1–2 h delay in the maximum daily temperature of shallow soils in grasslands, resulting in a larger variation range of G in bare ground compared to grasslands [34]. Some scholars have also discovered that the variation range of G and soil temperature in forests (16.3–21.4 W m−2, 25.9–24.0 °C) was significantly smaller than that in grasslands (32.0–167.1 W m−2, 33.1–23.7 °C) in the same study area [35]. In addition, Alberto et al. [36] noted that irrigation events affected the soil temperature. In detail, soil temperatures were significantly lower during the day than in non-irrigated fields, particularly when the depth of the hydrostatic layer in irrigated fields was 3–5 cm, whereas this was reversed at night.
Driven by economic interests and the comprehensive implementation of land consolidation projects, there has been widespread conversion of upland fields (UFs) to paddy fields (PFs) in China in recent decades [37]. The main areas where farmland conversion from UFs to PFs occurs are the Sanjiang Plain, the North China Plain, and the Sichuan Basin, among others. For example, from 2000 to 2015, the area of converting UFs to PFs in the Sanjiang Plain accounted for 68.2% of the total agricultural land area [38]. The conversion of UFs to PFs affects soil temperature and heat transfer processes by changing crop types, irrigation systems, and soil properties. However, there are still deficiencies in the research on the mechanism of action. Furthermore, its quantitative effect has not yet been clarified.
The objectives of this study were as follows: (1) to quantify the effects of farmland conversion from UFs to PFs on soil temperature, thermal properties, and G, and (2) to reveal the mechanisms of meteorological factors, soil properties, and vegetation cover changes on heat transfer processes.
2. Materials and Methods
2.1. Study Site
The experimental area is located in the Jianghan Plain Agro-Ecosystem Field Scientific Observation and Research Station of Central China Normal University (29°26′–31°37′ N, 111°14′–114°36′ E) in Gong’an County, Jingzhou City, Hubei Province, China. The main farmland types are UFs, PFs, and integrated rice–crayfish farming fields. The climate is a subtropical monsoon, with an average annual temperature of 15–17 °C, an average annual precipitation of 1100–1300 mm, and an average daily net solar radiation of 10 MJ m−2 d−1, respectively.
A long-term cultivated UF (longer than 60 years) and a newly developed PF (converted from a UF in 2015) were selected for this study (Figure 1). The UF was planted with cotton from May to November 2017, followed by a long fallow period. Then, soybeans were sowed in early June and harvested in late August 2018. After a fallow period, the winter wheat was planted in October 2018 and harvested in May 2019. The PF was planted with single-season rice from mid-May to late September and was irrigated 7–9 times during this period. Furthermore, the PF was kept fallow in other periods.
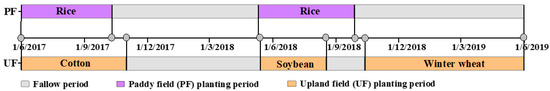
Figure 1.
Time axis of cultivation in upland field (UF) and paddy field (PF).
2.2. Soil Sampling and Physicochemical Properties Analysis
Before soil sampling, five random points were selected in the UF and PF to observe the soil profile characteristics with a soil auger. After that, one representative site was chosen for excavating a 100 cm deep soil profile for soil sampling. Three disturbed and eight undisturbed soil samples (100 cm3) were collected for physicochemical properties analysis in each soil layer. Disturbed soil samples were air-dried, sieved, and used for soil organic matter content (potassium dichromate oxidation method) and particle composition determination (pipette method). The undisturbed soil samples were used for bulk density determination (oven drying method) and total porosity [39]. We then measured and calculated the average value of the physical and chemical properties of each soil layer. The soil physicochemical properties of the PF and UF are shown in Table 1.

Table 1.
Soil physical and chemical properties of the upland field (UF) and paddy field (PF). Different bold letters above the table denote significant differences between the paddy field (PF) and the upland field (UF). One-way ANOVA (p < 0.05) was used.
2.3. Field Data Monitoring
Five 5TM soil moisture–temperature sensors (Decagon Devices, Pullman, Washington State, USA) were installed at different soil depths (10, 20, 40, 60, and 90 cm) in the UF and PF, respectively. The sensor calculates the soil volumetric water content (VWC) by measuring the dielectric function of the soil, which is converted from the Topp standard formula [40,41]:
Then, they were connected to an EM50 data logger (Decagon Devices, Pullman, Washington State, USA) for recording SWC and temperature data at hourly intervals from 1 June 2017 to 1 June 2019. During the monitoring period from 6 May 2018 to 27 May 2018, there were some data gaps in the measurements of SWC and temperature in the UF (60 cm) and PF (10 cm) due to the damage of these probes; the missing values were deleted during the analysis.
Specified soil temperature and SWC measurement calibration of 5TM sensors were conducted in this study [42]. These probes were placed at the same temperature conditions before the experiment to calibrate the temperature measurement. Meanwhile, soil samples were collected using a soil auger under various soil moisture conditions during the monitoring period, and their SWC was determined by the oven drying method. Liner relationships were established between the oven-dried measured SWC and the EM50 data logger-recorded SWC, which was used to calibrate the SWC data measured by the sensors.
During the study period, the LAI was monitored at 15–45 days intervals using an LAI-2200C canopy analyzer (LI-COR, Lincoln, NE, USA), and the groundwater level was measured hourly with the piezometer (U20-001-04, Onset, Bourne, MA, USA). Meteorological data, including precipitation and air temperature (Figure 2), were obtained from the Jingzhou Meteorological Station of the National Meteorological Bureau, located approximately 40 km away from the study area.
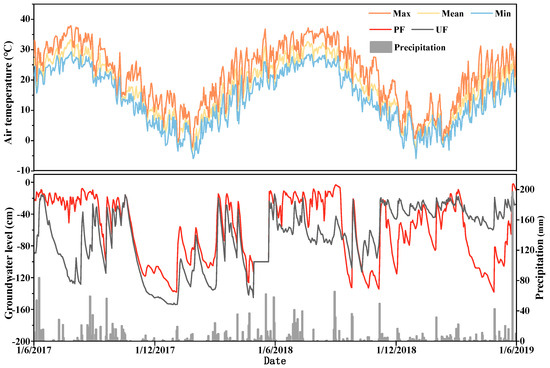
Figure 2.
Dynamics of meteorological factors and groundwater level (b) in upland field (UF) and paddy field (PF).
2.4. Data Analysis and Calculation
2.4.1. Soil Temperature
Because the hourly data is more volatile, it can better capture the differences among the research targets. Therefore, the temperature difference between the PF and UF was calculated on various time scales (annual, seasonal, monthly, and daily) using hourly recorded soil temperature data.
2.4.2. Soil Thermal Properties
Based on the specific soil properties at the study site [43], Cs and λθ were calculated using the method proposed by De Vries and van Wijk (1966) and Campbell (1985) [44,45], which utilizes the measured soil physicochemical properties and SWC. Cs refers to the amount of heat that needs to be absorbed or released for a 1 m3 soil core to rise or fall by 1 K. Zhao et al. [46] proposed that the Campbell model calculation would lead to a decrease in Cs and an overestimation of λθ:
where (θ) is the volumetric heat capacity (MJ m−3 K−1); 0.46 and 0.6 are the volumetric heat capacity of the soil minerals and organic matter (MJ m−3 K−1); θ is the volumetric SWC (m3 m−3); Φ is the total soil porosity (%); m0 is the organic matter content (g kg−1).
λθ is an indicator that measures the soil’s ability to conduct heat. It was estimated using the empirical model proposed by Campbell (1985) [45]:
where λθ is the thermal conductivity (W m−1 k−1), and the parameters of A, B, C, D, and E are the soil property coefficients, Mengistu, et al. (2017) [16], which were calculated as follows:
where ρb is the soil bulk density (g cm−3); mc is the soil clay content (%).
2.4.3. Soil Heat Flux (G)
G describes the heat transfer between different soil layers. A positive value indicates heat transfer from the surface to deeper soil layers, indicating a heat sink; conversely, it suggests a heat source. G at 10–20, 20–40, 40–60, and 60–90 cm were calculated using the following formula:
where G(θ,T) is the soil heat flux (W m−2), dT and dZ are the temperature difference (K) and depth difference (m) between different soil depths, and λ(θ)eq is the equivalent thermal conductivity (W m−1 k−1) between different soil depths; the formula is as follows (Gan (2012) [28]):
where Z1 and Z2 are the soil thickness (m), and λ(θ)1 and λ(θ)2 are the soil thermal conductivity (W m−1 k−1) at different depths.
2.5. Statistical Analysis and Plotting
The data were processed using Excel software. Additionally, a Pearson correlation analysis was conducted among the environmental factors, soil thermal properties, and G using SPSS 22.0 software, and graphs were generated using Origin 2021 software. Independent samples t-tests were employed to assess the differences in thermal properties and G between the UF and PF within each soil layer (p < 0.05).
3. Results
3.1. Soil Temperature Dynamics and Its Statistical Characteristics in PF and UF
The contour map of soil temperature (Figure 3) revealed that the soil temperature in both the PF and UF fluctuated over time during the monitoring period, with the highest temperatures occurring in the summer and the lowest temperatures in the winter. As the soil depth increased, the soil temperature decreased during the summer and autumn but increased during the winter and spring. The magnitude of soil temperature fluctuations in the PF and UF decreased with increasing soil depth.
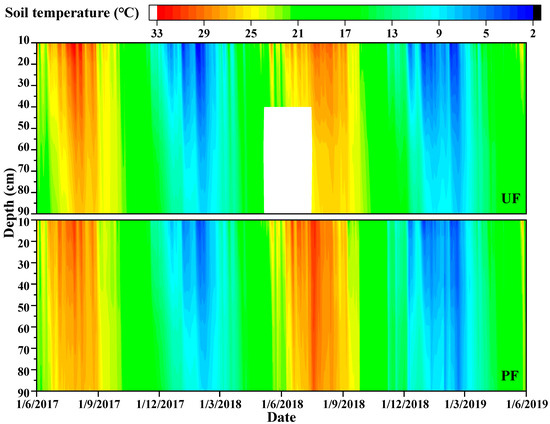
Figure 3.
Variations in soil temperature in the upland field (UF) and paddy field (PF) during the study period. (The white part represents the missing data).
The two-year average temperature differences between the PF and UF in the same soil layer were less than 0.4 °C, which is obviously lower than the discrepancies in the highest or lowest temperatures (Table 2). In the 10 cm soil layer, the highest temperature in the UF was 1.6 °C higher than that in the PF, while the lowest temperature in the UF was 1.6 °C lower than that in the PF. Although the difference in the highest temperature between the UF and PF at a 20 cm depth was minor, the lowest temperature in the UF (2.9 °C) was much lower than that in the PF (4.6 °C). The difference in the highest or lowest temperatures between the PF and UF at a 40 cm depth was relatively slight, with a difference of 0.9 °C and 0.6 °C, respectively. At a 60 cm soil depth, the highest temperature in the PF was 2.3 °C higher than that in the UF, while the lowest temperature was 1.1 °C lower than that in the UF. At a depth of 90 cm, the differences in the highest and lowest temperatures between the PF and UF were the largest, with differences of 2.9 °C and 2.0 °C, respectively. The temperature fluctuated range in both the PF and UF decreased with increasing depth. However, the temperature variation range in the UF was more extensive compared with the PF at 10 and 20 cm depths, while it was reversed at 40, 60, and 90 cm depths.
Table 2.
Descriptive statistical parameters of soil temperature in the upland field (UF) and paddy field (PF).
3.2. Differences in Soil Temperature Between PF and UF on Different Time Scales
3.2.1. Seasonal Scale
The difference in soil temperature between the PF and UF at the seasonal scales is shown in Figure 4a. The temperature difference between the PF and UF at various soil layers ranged from −0.9 to 1.8 °C, with a more pronounced difference in the summer than in other seasons. In the spring, the temperature in the PF was lower than that in the UF along the soil profile, except for the 60 cm soil layer. However, the soil temperature in the PF was higher than in the UF along the soil profile, except for the 10 cm soil layer in the summer, with the most pronounced differences (>1.5 °C) at 60 and 90 cm soil depths. In contrast, the temperature difference between the PF and UF at different soil depths in the autumn (PF < UF) was smaller than in other seasons. In the winter, higher soil temperatures were identified in the PF than in the UF at the 10 and 20 cm soil layers, whereas this was reversed in the deeper soil layers.
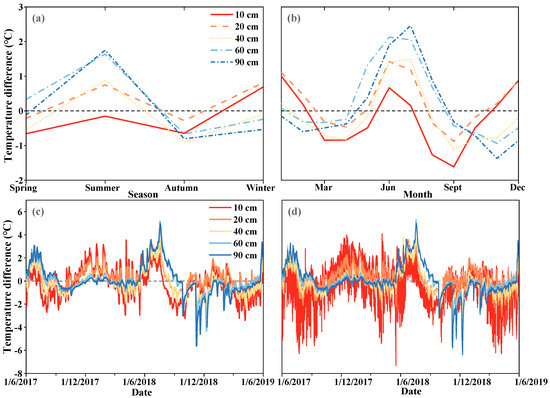
Figure 4.
Differences in soil temperature between paddy fields and upland fields at various time scales, including seasonal (a), monthly (b), daily (c), and hourly (d) scales.
3.2.2. Monthly Scale
On a monthly scale, the temperature difference between different soil layers in the PF and UF ranged from −1.5 to 2.5 °C, exhibiting a “W” shaped pattern from January to December (Figure 4b). In particular, for the 10 cm soil depths, the temperature in the PF was 0.7–1.0 °C higher than that in the UF in January, June, and December. The difference was minor (i.e., 0.1–0.2 °C) in February, July, and November. However, the temperature in the PF was obviously lower (i.e., 0.3–1.6 °C) than that in the UF during other months. For the 20 cm soil depths, the temperature of the PF was much higher (0.9–1.4 °C) than that of the UF in January, June, July, and December, while it was lower (0.3–0.9 °C) than that of the UF in March, April, August, and September. For the 40 cm soil depth, June and July showed apparently higher temperatures (1.4–1.5 °C) in the PF than in the UF, whereas significantly lower temperatures (0.3–1.0 °C) in the PF were identified from February to April and August to December compared to the UF. For the 60 and 90 cm soil depths, the temperature of the PF was much higher (0.5–2.5 °C) than that of the UF from May to August, while it was lower than that of the UF from February to April (0.2–0.9 °C) and September to December (0.3–1.4 °C).
3.2.3. Daily Scale
The daily temperature difference (Figure 4c) showed that the fluctuation range of soil temperature varied with increasing soil depth. The temperature difference fluctuation range of deep soil was more extensive than that of shallow soil. In detail, the fluctuation ranges of the soil temperature difference at 10, 20, 40, 60, and 90 cm soil depths on a daily scale were −3.4–3.5, −2.5–3.2, −4.0–3.5, −4.4–5.1, and −5.6–4.9 °C, respectively, which is much larger than on seasonal and monthly scales. In addition, the variation in soil temperature difference during various periods also differed. It showed a gradual increase in temperature difference with increasing soil depth from early June to mid-October. However, the soil temperature difference between the PF and UF along the soil profile from June to August 2018 was obviously higher (1.8–2.5 °C) than in 2017. From mid-October to the following March, the temperature difference gradually decreased with increasing depth. Compared with November 2017, the temperature difference between the PF and UF in 40, 60, and 90 cm soil layers in November 2018 was reduced by 1.3, 1.7, and 2.1 °C, respectively.
3.2.4. Hourly Scale
As shown in Figure 4d, the difference in soil temperature between the PF and UF on the hourly scale was similar to that on the daily scale. However, the fluctuations in the differences were much sharper on an hourly than on a daily scale. Specifically, the range of temperature differences between the PF and UF at depths of 10, 20, 40, 60, and 90 cm is −7.3–7.5, −3.1–8.2, −4.2–8.9, −4.6–10.3, and −6.4–11.3 °C, respectively.
3.3. Dynamics of Soil Thermal Properties in UF and PF
3.3.1. Volumetric Heat Capacity (Cs)
As shown in Figure 5, the Cs at all soil depths in both the PF and UF fluctuated with time during the monitoring period. The fluctuation range of Cs in the surface layer was more significant than in deep soil. However, the apparent difference in Cs was observed between the UF and PF in the same soil layer. The Cs at 10, 20, and 40 cm depths in the PF were 8.6%, 19.0%, and 5.5% higher than in the UF, respectively. In contrast, the Cs levels at 60 and 90 cm depths in the PF were 4.3% and 2.9% lower, respectively, than in the UF. Moreover, the difference in Cs between the UF and PF was most remarkable in the summer (9.6%), followed by the autumn (4.4%) and winter (4.1%), while the slightest difference was identified in the spring (2.6%).
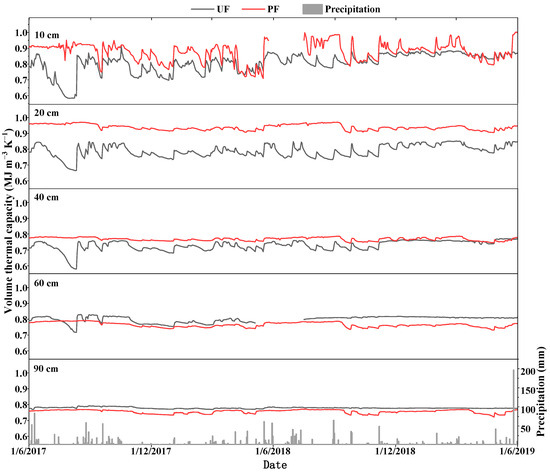
Figure 5.
Dynamics of daily volumetric heat capacity at different soil depths in the upland field (UF) and paddy field (PF).
3.3.2. Thermal Conductivity (λθ)
Like the Cs, the λθ at all soil depths in both the PF and UF fluctuated with time during the study period (Figure 6). The λθ in both the UF and PF intensity fluctuated at the 10 cm soil depth, while it variated more gently with increasing soil depths. The maximum λθ in the UF (1.2 W m−1 k−1) and PF (1.4 W m−1 k−1) were found in the 20 cm soil layer, and the minimum λθ were identified in the 10 cm soil layer (0.6 and 0.7 W m−1 k−1). Also, the λθ in the PF was always higher than that in the UF along the soil profile. Detailly, the λθ at 10, 20, 40, 60, and 90 cm soil depths in the PF were 1.5%, 18.3%, 19.0%, 9.0%, and 25.6% higher than that in the UF, respectively. In addition, the difference in λθ between the UF and PF varied with the seasons, with the most significant difference in the summer (19.6%), followed by the autumn (14.0%) and winter (13.6%), and the slightest difference in the spring (12.1%).
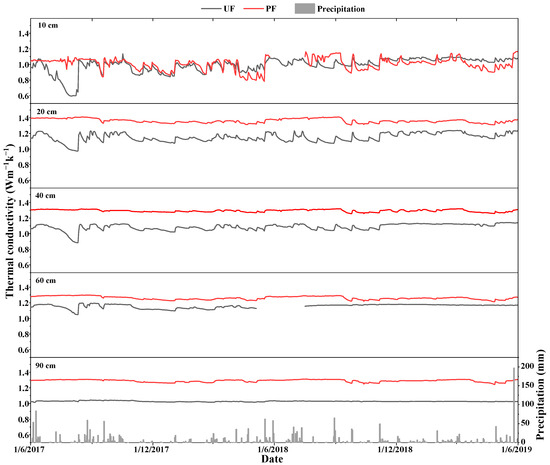
Figure 6.
Dynamics of daily thermal conductivity at different soil depths in upland field (UF) and paddy field (PF).
3.4. Soil Heat Flux (G)
As shown in Figure 7, the G variations in both the UF and PF were consistent with air temperature changes, and their fluctuation amplitudes rapidly decreased with increasing soil depth. For 10–20, 20–40, 40–60, and 60–90 cm soil layers, the G fluctuation ranges were −38.4–35.4, −12.4–13.6, −13.8–11.9, −6.7–6.0 W m−2 in the PF, while they were −37.7–36.9, −19.7–12.8, −16.7–12.6, −6.4–5.2 W m−2 in the UF, respectively. Differences in G values were observed between the UF and PF in the same soil layers, with the most considerable difference occurring in the 10–20 cm soil layers. The directions of G between the UF and PF were opposite in the 10–20 cm (2.8 and −2.1 W m−2) and 20–40 cm (−1.5 and 1.0 W m−2) soil layers. However, the directions of G in both the UF and PF were upward for the 40–60 cm (−0.8 and −3.0 W m−2) and 60–90 cm soil layers (−0.9 and −0.6 W m−2). Furthermore, there was a significant seasonal variation in G in both the UF and PF, indicating that the soil acted as a heat sink (i.e., G > 0 W m−2) in the spring and summer and a heat source (i.e., G < 0 W m−2) in the autumn and winter. Meanwhile, the most significant difference in G between the UF and PF was observed in the summer (101.9%), followed by the spring (30.5%) and autumn (20.0%), and the minimum difference in the winter (11.9%). Moreover, except for August and September (G > 0 W m−2 in the UF and G < 0 W m−2 in the PF), the direction of G was the same in other months at the 10–20 cm soil layer.
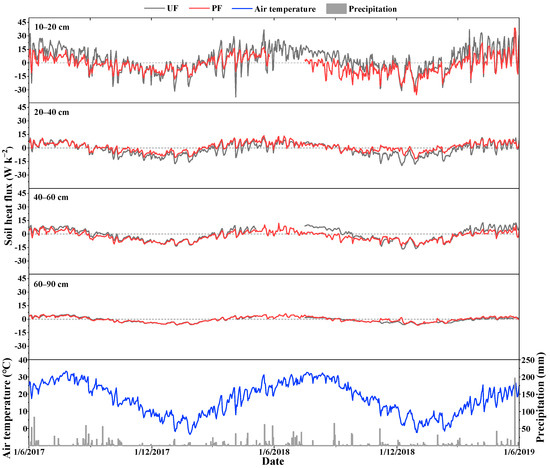
Figure 7.
Dynamics of daily soil heat flux at different soil depths in upland field (UF) and paddy field (PF).
4. Discussion
4.1. Similarities in Soil Temperature, Thermal Properties, and Heat Flux in PF and UF
Due to the same meteorological conditions in the UF and PF, the characteristics of the soil temperature, thermal properties, and G were somewhat similar during the study period. The soil temperature range in the surface soil temperature between the PF and UF is lower, indicating that the self-regulating ability of the UF is weaker (Table 2). Both the UF and PF showed higher soil temperatures during the day and lower temperatures at night. The temperature in the summer decreased with increasing soil depth, and vice versa in the winter. Additionally, the G in both the UF and PF acted as a heat sink in the spring and summer, and as a heat source in the autumn and winter, which is consistent with other studies [36,47,48]. There are also interannual differences in soil temperatures between the PF and UF. The soil temperature difference between the PF and UF in the summer of 2018 was higher than that in other years (Figure 4c). In this study, the rainfall in the summer of 2017 was higher than that in 2018 (Figure 2), and the groundwater level of the UF was higher. In 2019, a new integrated rice–crayfish farming field was developed near the UF, which led to an increase in the groundwater level and, consequently, affected the differences in thermal characteristics, resulting in a reduction in temperature differences.
Additionally, the changes in soil thermal parameters are closely related to meteorological factors. The results of the correlation analysis indicate that atmospheric temperature has a significant impact on soil heat flux, with its influence on the surface layer being particularly pronounced. In addition, saturated vapor pressure, wind speed, and net solar radiation are also significantly positively correlated with G (Table 3). Meteorological factors affect soil temperature and heat transfer processes in the vertical direction [9]. Solar radiation that reaches the land surface is absorbed by the soil, causing changes in surface temperature and transferring heat to deeper layers with time [27]. According to Figure 8, the maximum soil temperature appearance in the 20 cm soil layer in the UF (22:00) was 5 h later than in the 10 cm soil layer (17:00), similar to the observations in the PF. At the same time, the continuous attenuation of heat transfer with increasing soil depth resulted in a significantly weaker variation in soil temperature in the deeper layers compared to the shallow layers. In addition, as the soil depth increased, the soil temperature difference between adjacent soil layers decreased, resulting in a decrease in G afterward. Similarly, the fluctuation range of G in the deeper soil layers was significantly smaller than in the upper layers, which is consistent with the findings of Liu et al [8,13].
Table 3.
The Pearson correlation coefficients between the soil thermal parameters and meteorological factors (rainfall, mean temperature, relative humidity, saturated vapor pressure, wind speed, and net solar radiation) in the upland field and paddy field. * Correlation is significant at 0.05 level; ** correlation is significant at 0.01 level.
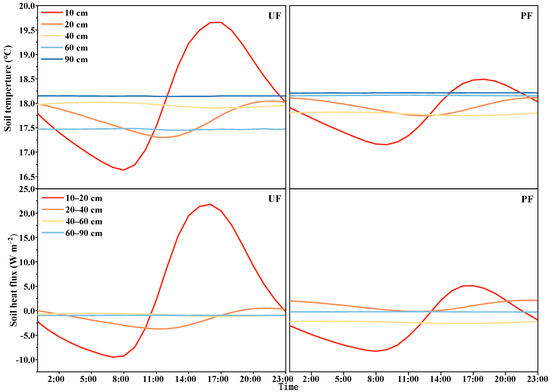
Figure 8.
The annual hourly temperature and heat flux dynamics at different soil depths in the upland field (UF) and paddy field (PF).
Rainfall and evapotranspiration significantly influenced the SWC, which subsequently affected thermal properties and heat transfer processes [49]. Correlation analysis revealed that Cs and λθ in both the PF and UF at a 10 cm depth are positively correlated (p < 0.05) with the rainfall amount, with higher correlations in the UF than in the PF, as the SWC in the PF was also influenced by irrigation events [50]. The drastic variation in SWC in the shallow soil layers led to apparent changes in Cs and λθ at these soil depths. Like the SWC distribution along the soil profile, Cs and λθ gradually became smoother with increasing depth in the UF and PF [18,28]. In the summer, intense soil radiation and vigorous plant growth lead to pronounced evapotranspiration [20], resulting in a sharp decrease in SWC in the UF during the non-rainfall period. Consequently, the lowest Cs and λθ were observed simultaneously (Figure 5 and Figure 6). The most pronounced differences in both volumetric Cs and λθ between the UF and PF occur during the summer, primarily due to continuous flooding in the PF, which sustains elevated SWC. In contrast, the lowest SWC of the PF was observed during the fallow period, which occurred without irrigation and with limited rainfall, resulting in low Cs and λθ simultaneously. These findings were in agreement with Ju and Hu [23], who reported that the decline in soil thermal properties in the spring was primarily attributed to the decrease in SWC due to a limited rainfall amount. The surface λθ of the UF fluctuates significantly, which may be due to the instantaneous increase in SWC caused by heavy rainfall or irrigation in the summer. In this study, the Campbell formula was used to calculate Cs and λθ. Previous studies have shown that this formula may lead to a lower Cs [43] and a higher λθ [46], but overall, the error is relatively small.
Furthermore, rainfall events affected heat transfer processes on an hourly scale [27]. The G of the UF and PF was significantly negatively correlated with rainfall (p < 0.05). Compared to sunny days, the soil temperature and G in the 10 cm soil layer on rainy days were much lower, and their fluctuations were gentler (Figure 9). Scholars [35] have discovered that the G in a forest on sunny days (177.1 W m−2) was significantly higher than that on rainy days (58.4 W m−2). These findings suggested that precipitation partially impeded the transfer of existing G [28]. These results suggest that research on soil heat transfer and energy balance should conduct monitoring work with high time resolution, especially during rainy days.
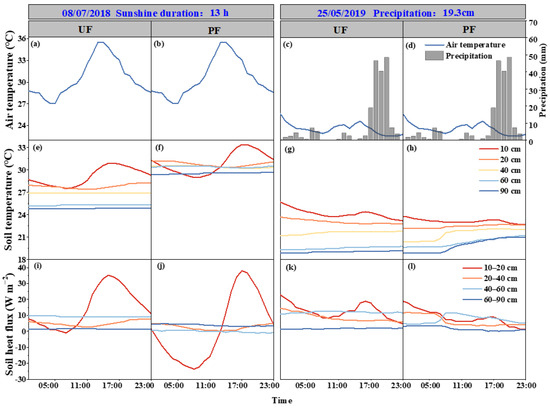
Figure 9.
The daily hourly dynamics of referred metrological factors, soil temperature, and heat flux at various soil depths in the upland field (UF) and paddy field (PF) under typical rainy and sunny days. (a,b) are the typical daily changes in air temperature on typical sunny days; (c,d) show the daily variations in air temperature and precipitation on typical rainy days. (e–h) are the changes in soil temperature at different soil depths in upland fields (UF) and paddy fields (PF) on typical sunny and rainy days; (i–l) are the changes in soil heat flux at various soil depths in upland fields (UF) and paddy fields (PF) on typical sunny and rainy days.
4.2. Mechanism of Differences in Soil Thermal Properties Between UF and PF
Distinct cultivation practices resulted in some differences in soil properties and SWC between the UF and PF, consequently impacting soil thermal properties [51,52]. A correlation analysis showed that Cs was significantly positively correlated with soil organic matter (p < 0.01). The λθ was extremely significantly positively correlated with the soil bulk density (p < 0.001) and significantly negatively correlated with total soil porosity (p < 0.01) (Figure 10). The bulk density of the PF bottom layer was considerably higher than that of the UF (p < 0.05). This is because the PF bears heavier mechanical compaction than the UF, resulting in fewer large pores and a lower total porosity below the plow bottom layer [53]. Furthermore, it may also be due to the heterogeneity of the soil itself, which causes significant differences in bulk density. Moreover, the more intense anaerobic conditions (i.e., higher SWC) and more straw input in the PF resulted in a higher organic matter content than in the UF for the shallow soil layers. Therefore, both the Cs and λθ of the PF are higher than those of the UF. During the rice growing period (i.e., May to September), frequent irrigation in the PF increased the SWC by 6% to 50% compared to the UF, resulting in a larger Cs and λθ in the PF. Meanwhile, ascribing to the gentle variations in SWC in the PF, the fluctuations in the thermal properties in the PF were smaller than in the UF.
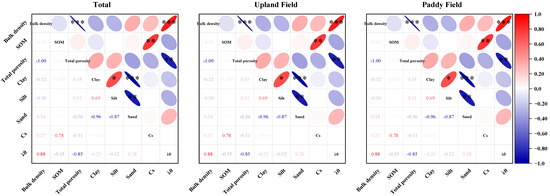
Figure 10.
The Pearson correlation coefficient between soil thermal characteristics and soil properties in the upland field and paddy field. The orientation of the ellipse indicates positive or negative correlation, while its eccentricity represents the strength of the correlation—the greater the eccentricity, the stronger the correlation. *, **, and *** denote significance correlation at p < 0.05, p < 0.01, and p < 0.001 probability levels, respectively.
Changes in soil properties affected the soil infiltration rate and water-holding capacity [27], ultimately leading to differences in soil thermal properties between the UF and PF. The increase in soil bulk density and the reduction in macropores under the plow layer in the PF resulted in its relatively low permeability [53]. As a result, more water was conserved in the upper soil layers in the PF than in the UF, leading to a higher SWC afterward. Compared to the UF, the higher SWC in the 10, 20, and 40 cm soil layers of the PF resulted in a larger Cs, with the most significant difference observed in the 20 cm soil layer. However, the higher organic matter and clay contents at 60 and 90 cm soil depths in the UF led to a higher Cs than in the PF. Unlike Cs, the λθ at all soil depths in the PF were higher than in the UF, mainly attributed to the higher SWC in the PF and the more critical effects of water on λθ than air [51,52,54]. It was predictable that these differences in soil thermal properties between the UF and the new PF increased with time, as the soil properties in the PF evoluted continuously.
Additionally, the difference in groundwater levels between the PF and UF also affects the soil’s thermal properties. The groundwater level was positively correlated with Cs and λθ (Figure 2, Figure 5, and Figure 6). From November 2018 to June 2019, a shallower groundwater level was observed in the UF compared to the PF, as a newly developed integrated rice–crayfish farming field was established near the UF. The groundwater level primarily affects the heat transfer process by influencing soil evapotranspiration [55]. These findings highlight that anthropogenic activities have a profound and rapid impact on soil thermal properties, which should be taken seriously in studying soil thermal properties.
4.3. Mechanism of Differences in Soil Temperature and G Between UF and PF
The differences in vegetation type and density affected the download solar radiation reaching and upward longwave radiation leaving the land surface, causing changes in soil temperature and further altering G [56]. In this study, the divergence in LAI between the UF and PF was negatively correlated with the difference in soil temperature at a 10 cm depth. Also, the response of LAI to soil temperature was most pronounced from June to September in both the UF and PF. In July 2017, the LAI (2.8) in the PF was greater than in the UF (0.8), resulting in a lower soil temperature at a 10 cm depth in the PF (30.3 °C) compared to the UF (32.4 °C). In contrast, the LAI in the UF (5.0) surpassed the PF (1.7) in July 2018, resulting in a higher soil temperature at a 10 cm depth in the PF (28.9 °C) compared to the UF (27.8 °C). Also, Zhang [10] found that the temperature increment reached nearly 1.0 °C when the LAI was reduced by 50%. The land surface cover also affected the soil temperature during the cold season. From the winter of 2017 to the spring of 2018, the shallow soil temperature in the PF was apparently higher than in the UF, as the surface of the PF was covered with paddy straw while the UF was bare. This phenomenon has also been identified by Wang et al. [57], who explained that the straw residue covering the surface of the PF acted as a thermal protective coating, inhibiting heat loss from the soil surface. This finding implied that straw coverage maintained a stable soil temperature, which benefited seed germination and crop growth during the cold seasons. In contrast, from the winter of 2018 to the spring of 2019, the difference in shallow soil temperature between the UF and PF was significantly reduced compared to the previous year, as the winter wheat cultivated in the UF also counteracted the soil heat loss and temperature decrease [58].
Vegetation cover affected the direction and intensity of G by influencing the soil temperature gradient [10]. In this study, the surface soil G values of the UF and PF were positive in the summer and negative in the winter, which differed from some studies [59]. This indicates that heat continues to be stored deep in the soil during the summer, while it is released during the winter [60]. Notably, the average G in the PF changed from positive to negative in August and September, while it kept the same in the UF. During this period, the vigorous growth of rice in the PF blocked the solar radiation that reached the soil surface, resulting in less downward heat transfer in the PF than in the UF. The larger LAI fluctuation range in the UF compared to the PF led to a more extensive range of soil temperature variation in the UF (31.5 °C) than in the PF (28.4 °C) at a 10 cm soil depth. Consequently, the range of G in the 10 cm soil layer of the UF (−28.8–32.6 W m−2) was much greater than that of the PF (−25.7–20.7 W m−2), which is consistent with the results of [61]. In addition, straw or crop residues were characterized by a low λθ [57], which inhibited soil heat transfer and further reduced G. The straw cover on the surface of the PF in the winter resulted in a much narrower range of G (−21.3–0.3 W m−2) at the 10 cm soil depth compared to that in the UF (−31.4–7.0 W m−2). During the study period, the absolute values of both maximum and minimum G in the UF were greater than those in the PF, indicating that the conversion from the UF to the PF reduced the input and output of heat, thus maintaining stable soil temperatures. In agricultural production, straw mulching can be considered in the winter to minimize heat loss.
The irrigation event also changed the direction and intensity of G. During the summer, the frequent irrigation events in the PF led to a higher SWC than in the UF, and a significant amount of energy was absorbed by the surface water layer in the PF [47]. Also, the higher SWC resulted in a large Cs and λθ, which reduced the soil temperature changes and decreased the temperature gradient across the soil profile further [19], ultimately reducing the PF’s G. Generally, the higher the air temperature, the more significant the observed difference in soil temperature and G between the UF and PF. After converting the UF to the PF, the difference in soil temperature and G was much greater in the summer than in other seasons. In addition, the irrigation water on the surface of the PF absorbs a significant amount of heat, further reducing the downward heat transfer. This finding suggests that the transition from the UF to the PF on the seasonal scale significantly affects soil heat transfer, with a shift in the direction of heat transfer from the deeper soil to the surface. This land use conversion further affected heat transfer on the year-round scale, resulting in increased heat release from the soil after converting the UF to the PF.
5. Conclusions
This study quantified the soil temperature, thermal properties, and G differences between old UFs and newly developed PFs. The temporal variation tendency of soil temperature and G were somewhat similar, and their fluctuation amplitude decreased with increasing soil depth in both fields. Moreover, the higher SWC and bulk density in PFs result in higher λθ for all soil layers compared to UFs, and greater Cs at the 10, 20, and 40 cm soil layers than in UFs. Meanwhile, the lower porosity and organic matter content led to lower Cs in PFs than in UFs at the 60 and 90 cm soil layers. Influenced by irrigation, tillage, and vegetation cover, the conversion from UFs to PFs led to a decrease in average soil temperature at the surface soil layers and an increase in average soil temperature at the deep soil layers in the summer, while it was reversed in the winter. These changes resulted in the most significant difference in G between UFs and PFs in the summer and the slightest difference in the winter. The conversion from UFs to PFs also caused the direction of annual mean G to shift upward for the 10–20 cm soil layer. In contrast, the annual mean G in the 20–40 cm soil layer shifted downward due to the changes in λθ and temperature gradient. In summary, converting from UFs to PFs significantly narrowed the range of soil temperature variation, increased Cs and λθ, and altered the direction of soil heat transfer in the shallow soil layers. It is expected that a water–heat combined model will be established in future work to quantify further the land-use conversion from UFs to PFs in the farmland energy balance.
Author Contributions
J.Y. and M.X.: Conceptualization, Data Curation, Methodology, and Writing—Original Draft. H.Z. and Y.W.: Investigation, Writing—Review and Editing, Supervision, Project Administration, Funding Acquisition. Q.R., M.L. and Y.F.: Investigation and Supervision. S.L.: Methodology. H.N.: Data Curation. Q.L. and X.N.: Formal Analysis and Methodology. All authors have read and agreed to the published version of the manuscript.
Funding
This work was supported by the National Natural Science Foundation of China (U21A2039, 52209021, 41931293), the Nature Science Foundation of Hubei Province (2023AFB916), and the Fundamental Research Funds for the Central Universities (CCNU25ai002, CCNU24JCPT012, CCNU24JCPT012).
Data Availability Statement
The data supporting the results of this study are available upon reasonable request to the corresponding author.
Conflicts of Interest
The authors declare that they have no known competing financial interests or personal relationships that could have appeared to influence the work reported in this manuscript.
References
- Jia, M.H.; Dai, C.L.; Yu, M.; Yang, H.N.; Li, R.T.; Feng, X. Characteristics of Soil Temperature Change in Lhasa in the Face of Climate Change. Atmosphere 2024, 15, 450. [Google Scholar] [CrossRef]
- Firanj Sremac, A.; Lalic, B.; Cuxart, J.; Marcic, M. Maximum, Minimum, and Daily Air Temperature Range in Orchards: What Do Observations Reveal? Atmosphere 2021, 12, 1279. [Google Scholar] [CrossRef]
- Ogunjo, S.T.; Fuwape, I.; Babatunde Rabiu, A.; Oluyamo, S.S. Multifractal analysis of air and soil temperatures. Chaos Interdiscip. J. Nonlinear Sci. 2021, 31, 033110. [Google Scholar] [CrossRef] [PubMed]
- Hansen, P.M.; Even, R.; King, A.E.; Lavallee, J.; Schipanski, M.; Cotrufo, M.F. Distinct, direct and climate-mediated environmental controls on global particulate and mineral-associated organic carbon storage. Glob. Change Biol. 2024, 30, 15. [Google Scholar] [CrossRef]
- Guo, C.R.; Zhao, R.X.; Jiang, H.T.; Qu, W.J. Climate Factors Dominate the Spatial Distribution of Soil Nutrients in Desert Grassland. Atmosphere 2024, 15, 1524. [Google Scholar] [CrossRef]
- Liu, S.; Li, J.; Zhang, X. Simulations of Soil Water and Heat Processes for No Tillage and Conventional Tillage Systems in Mollisols of China. Land 2022, 11, 417. [Google Scholar] [CrossRef]
- Feng, X.; Qu, J.; Fan, Q.; Tan, L.; Dun, Y. Response of soil water content and temperature to rangeland desertification in an alpine region with seasonally frozen soil and plateau pika (Ochotona curzoniae) burrows. J. Soils Sediments 2020, 20, 3722–3732. [Google Scholar] [CrossRef]
- Wu, S.; Wei, Z.; Li, X.; Wang, H.; Guo, S. Variation characteristics of soil temperature, moisture, and heat flux in the understorey of evergreen broadleaf forest in South China. Theor. Appl. Climatol. 2022, 150, 929–940. [Google Scholar] [CrossRef]
- Costa, J.M.; Egipto, R.; Aguiar, F.C.; Marques, P.; Nogales, A.; Madeira, M. The role of soil temperature in mediterranean vineyards in a climate change context. Front. Plant Sci. 2023, 14, 1145137. [Google Scholar] [CrossRef]
- Zhang, Z.; Chen, X.; Pan, Z.; Zhao, P.; Zhang, J.; Jiang, K.; Wang, J.; Han, G.; Song, Y.; Huang, N.; et al. Quantitative Estimation of the Effects of Soil Moisture on Temperature Using a Soil Water and Heat Coupling Model. Agriculture 2022, 12, 1371. [Google Scholar] [CrossRef]
- Qi, L.H.; Hao, T.L.; Chen, K.; Zheng, L.X.; Guan, H.J.; Zhou, W.Q.; Yang, J.J.; Guan, C.F. Soil temperature elevation enhances phenanthrene phytoremediation by maize through improvement of plant growth and soil microbial activity. Plant Physiol. Biochem. 2025, 223, 109844. [Google Scholar] [CrossRef] [PubMed]
- Zhang, M.M.; Tan, S.K.; Zhang, C.; Chen, E.Q. Machine learning in modelling the urban thermal field variance index and assessing the impacts of urban land expansion on seasonal thermal environment. Sust. Cities Soc. 2024, 106, 105345. [Google Scholar] [CrossRef]
- Liu, Y.; Yang, S.; Lu, H.; Wang, Y. Effects of biochar on spatial and temporal changes in soil temperature in cold waterlogged rice paddies. Soil Tillage Res. 2018, 181, 102–109. [Google Scholar] [CrossRef]
- Zhu, H.J.; Wang, A.; Wang, P.T.; Hu, C.G.; Zhang, M.M. Spatiotemporal Dynamics and Response of Land Surface Temperature and Kernel Normalized Difference Vegetation Index in Yangtze River Economic Belt, China: Multi-Method Analysis. Land 2025, 14, 598. [Google Scholar] [CrossRef]
- Jiao, Y.X.; Chen, C.; Li, G.C.; Fu, H.Q.; Mi, X. Research on the variation patterns and predictive models of soil temperature in a solar greenhouse. Sol. Energy 2024, 270, 112267. [Google Scholar] [CrossRef]
- Mengistu, A.G.; van Rensburg, L.D.; Mavimbela, S.S.W. The effect of soil water and temperature on thermal properties of two soils developed from aeolian sands in South Africa. CATENA 2017, 158, 184–193. [Google Scholar] [CrossRef]
- Li, S.; Sun, F.; Chamizo, S.; Xiao, B. Towards moss-dominated biocrust effects on soil temperature across seasons in drylands: Insight from continuous measurements of soil thermal properties and solar radiation. Geoderma 2022, 421, 115911. [Google Scholar] [CrossRef]
- Vidana Gamage, D.N.; Biswas, A.; Strachan, I.B. Spatial variability of soil thermal properties and their relationships with physical properties at field scale. Soil Tillage Res. 2019, 193, 50–58. [Google Scholar] [CrossRef]
- Kharel, G.; Dhakal, M.; Deb, S.K.; Slaughter, L.C.; Simpson, C.; West, C.P. Effect of Long-Term Semiarid Pasture Management on Soil Hydraulic and Thermal Properties. Plants 2023, 12, 1491. [Google Scholar] [CrossRef]
- Chen, D.; Huang, X.; Chen, L. Analysis of Soil Heat Flux Characteristics at Different Time Scales in PaddyFields in the Middle and Lower Reaches of the Yangtze River. Res. Soil Water Conserv. 2021, 28, 151–158. [Google Scholar]
- Cross, J.F.; Drewry, D.T. Ensemble machine learning for interpretable soil heat flux estimation. Ecol. Inform. 2024, 82, 102697. [Google Scholar] [CrossRef]
- Liang, A.Z.; Xie, C.K.; Qin, Y.F.; Wang, J.; Wu, H.; Che, S.Q. Multi-scale temporal and spatial variations of soil heat flux under varying riparian forests: From a day to a year. J. Environ. Manag. 2025, 373, 123825. [Google Scholar] [CrossRef]
- Ju, Z.; Hu, C. Experimental warming alters soil hydro-thermal properties and heat flux in a winter wheat field. Arch. Agron. Soil Sci. 2018, 64, 718–730. [Google Scholar] [CrossRef]
- Gao, Z.Y.; Zhang, C.M.; Liu, W.Y.; Niu, F.J.; Wang, Y.B.; Lin, Z.J.; Yin, G.A.; Ding, Z.K.; Shang, Y.H.; Luo, J. Extreme degradation of alpine wet meadow decelerates soil heat transfer by preserving soil organic matter on the Qinghai-Tibet Plateau. J. Hydrol. 2025, 653, 132748. [Google Scholar] [CrossRef]
- Haruna, S. Influence of winter wheat on soil thermal properties of a Paleudalf. Int. Agrophysics 2019, 33, 389–395. [Google Scholar] [CrossRef] [PubMed]
- Tian, Y.X.; Liu, Z.W.; Fan, Y.W.; Li, Y.Y.; Tao, H.; Han, C.T.; Ao, X.M.; Chen, R.S. Patterns and Drivers of Surface Energy Flux in the Alpine Meadow Ecosystem in the Qilian Mountains, Northwest China. Plants 2025, 14, 155. [Google Scholar] [CrossRef]
- Qiao, C.; Zongxing, L.; Qi, F.; Baijuan, Z.; Juan, G. Soil bulk density and altitude are primary drivers of soil water content and soil temperature in the Three Rivers Headwaters Region, China. Soil Use Manag. 2023, 39, 1364–1387. [Google Scholar] [CrossRef]
- Gan, L.; Peng, X.; Peth, S.; Horn, R. Effects of grazing intensity on soil thermal properties and heat flux under Leymus chinensis and Stipa grandis vegetation in Inner Mongolia, China. Soil Tillage Res. 2012, 118, 147–158. [Google Scholar] [CrossRef]
- Guo, Z.Q.; Yan, Z.J.; He, R.; Yang, H.; Ci, H.; Wang, R. Impacts of Land Use Conversion on Soil Erosion in the Urban Agglomeration on the Northern Slopes of the Tianshan Mountains. Land 2024, 13, 550. [Google Scholar] [CrossRef]
- Chen, T.D.; Chen, Y.L.; Wang, L.L.; Mei, X.S.; Wei, W.; Zhao, W.T.; Ma, X.W.; Deji, S. Spatiotemporal Variations and Socio-Economic Influencing Factors of Soil Erosion at Different Spatial Scales in Key Agricultural Areas of the Qinghai-Tibet Plateau from 2000 to 2022: A Case Study of the Huangshui River Basin. Water 2025, 17, 88. [Google Scholar] [CrossRef]
- Fan, Z.P.; Li, X.M.; Yang, C.W.; Zhang, H.; Guo, X.L.; Lai, S.H.; Sha, J.M. Does land use change decline the regional ecosystem health maintenance? Case study in subtropical coastal region, Fuzhou, China. J. Environ. Manag. 2025, 373, 123631. [Google Scholar] [CrossRef] [PubMed]
- Zhao, J.; Ren, T.; Zhang, Q.; Du, Z.; Wang, Y. Effects of Biochar Amendment on Soil Thermal Properties in the North China Plain. Soil Sci. Soc. Am. J. 2016, 80, 1157–1166. [Google Scholar] [CrossRef]
- Haruna, S.; Anderson, S.; Nkongolo, N.; Reinbott, T.; Zaibon, S. Soil Thermal Properties Influenced by Perennial Biofuel and Cover Crop Management. Soil Sci. Soc. Am. J. 2017, 81, 1147–1156. [Google Scholar] [CrossRef]
- Bryś, K.; Bryś, T.; Sayegh, M.A.; Ojrzyńska, H. Characteristics of heat fluxes in subsurface shallow depth soil layer as a renewable thermal source for ground coupled heat pumps. Renew. Energy 2020, 146, 1846–1866. [Google Scholar] [CrossRef]
- Alvalá, R.C.S.; Gielow, R.; da Rocha, H.R.; Freitas, H.C.; Lopes, J.M.; Manzi, A.O.; von Randow, C.; Dias, M.A.F.S.; Cabral, O.M.R.; Waterloo, M.J. Intradiurnal and seasonal variability of soil temperature, heat flux, soil moisture content, and thermal properties under forest and pasture in Rondônia. J. Geophys. Res. Atmos. 2002, 107, LBA 10-1–LBA 10-20. [Google Scholar] [CrossRef]
- Alberto, M.C.R.; Wassmann, R.; Hirano, T.; Miyata, A.; Kumar, A.; Padre, A.; Amante, M. CO2/heat fluxes in rice fields: Comparative assessment of flooded and non-flooded fields in the Philippines. Agric. For. Meteorol. 2009, 149, 1737–1750. [Google Scholar] [CrossRef]
- Xie, Z.-j.; Zhu, D.; Wei, W.-w.; Ye, C.; Wang, H.; Li, C.-h. Phosphorus leaching risk from black soil increased due to conversion of arid agricultural land to paddy land in northeast China. Chem. Biol. Technol. Agric. 2023, 10, 59. [Google Scholar] [CrossRef]
- Zhang, L.; Wang, Z.; E, S.; Du, G.; Chen, Z. Analysis of Climatic Basis for the Change of Cultivated Land Area in Sanjiang Plain of China. Front. Earth Sci. 2022, 10, 862141. [Google Scholar] [CrossRef]
- Cheng, D.; Zhang, Y. Soil Physics Experiment Instruction; China Water Power Press: Beijing, China, 2012. [Google Scholar]
- Xu, X.T.; Zhang, W.D.; Wang, Y.T. Measuring and modeling the dielectric constant of soil during freezing and thawing processes: An application on silty clay. Acta Geotech. 2022, 17, 3867–3886. [Google Scholar] [CrossRef]
- Topp, G.C.; Davis, J.L.; Annan, A.P. Electromagnetic determination of soil water content: Measurements in coaxial transmission lines. Water Resour. Res. 1980, 16, 574–582. [Google Scholar] [CrossRef]
- Satoh, Y.; Kakiuchi, H. Calibration method to address influences of temperature and electrical conductivity for a low-cost soil water content sensor in the agricultural field. Agric. Water Manag. 2021, 255, 107015. [Google Scholar] [CrossRef]
- Wang, S.; Wang, Q.; Fan, J.; Wang, W. Soil thermal properties determination and prediction model comparison. Trans. Chin. Soc. Agric. Eng. 2012, 28, 78–84. [Google Scholar]
- De Vries, D.A.; van Wijk, W.R. Thermal properties of soils. In Physics of Plant Environment; Van Wijk, W.R., Ed.; North Holland Publishing Company: Amsterdam, The Netherlands, 1966. [Google Scholar]
- Campbell, G.S. Soil Physics with BASIC-Transport Models for Soil-Plant Systems; Elsevier: Amsterdam, The Netherlands, 1985; p. 150. [Google Scholar]
- Zhao, T.Y.; Liu, S.C.; Xu, J.; He, H.L.; Wang, D.; Horton, R.; Liu, G. Comparative analysis of seven machine learning algorithms and five empirical models to estimate soil thermal conductivity. Agric. For. Meteorol. 2022, 323, 109080. [Google Scholar] [CrossRef]
- Sauer, T.J.; Peng, X. Soil Temperature and Heat Flux. Agroclimatol. Link. Agric. Clim. 2020, 60, 73–93. [Google Scholar]
- López-Vicente, M.; Pereira-Rodríguez, L.; da Silva-Dias, R.; Raposo-Díaz, X.; Wu, G.L.; Paz-González, A. Role of cultivars and grass in the stability of soil moisture and temperature in an organic vineyard. Geoderma Reg. 2023, 33, e00631. [Google Scholar] [CrossRef]
- Zhang, P.; Zheng, D.H.; van der Velde, R.; Wen, J.; Su, Z.B. Impact of model physics, meteorological forcing, and soil property data on simulating soil moisture and temperature profiles on the Tibetan Plateau. J. Hydrol. 2025, 654, 132809. [Google Scholar] [CrossRef]
- Zhang, M.; Wen, Z.; Li, D.; Chou, Y.; Zhou, Z.; Zhou, F.; Lei, B. Impact process and mechanism of summertime rainfall on thermal–moisture regime of active layer in permafrost regions of central Qinghai–Tibet Plateau. Sci. Total Environ. 2021, 796, 148970. [Google Scholar] [CrossRef] [PubMed]
- Ju, Z.; Lu, S.; Guo, K.; Liu, X. Changes in the thermal conductivity of soil with different salts. J. Soils Sediments 2023, 23, 3376–3383. [Google Scholar] [CrossRef]
- Usowicz, B.; Lipiec, J. The effect of exogenous organic matter on the thermal properties of tilled soils in Poland and the Czech Republic. J. Soils Sediments 2020, 20, 365–379. [Google Scholar] [CrossRef]
- Najera, F.; Dippold, M.A.; Boy, J.; Seguel, O.; Koester, M.; Stock, S.; Merino, C.; Kuzyakov, Y.; Matus, F. Effects of drying/rewetting on soil aggregate dynamics and implications for organic matter turnover. Biol. Fertil. Soils 2020, 56, 893–905. [Google Scholar] [CrossRef]
- Liu, Z.; Xu, J.; Li, X.; Wang, J. Mechanisms of biochar effects on thermal properties of red soil in south China. Geoderma 2018, 323, 41–51. [Google Scholar] [CrossRef]
- Zhang, X.M.; Zhang, Z.Y.; Wang, W.K.; Wang, Z.F. Experimental and Numerical Analysis of Evaporation Processes in a Semi-Arid Region. Water 2025, 17, 1113. [Google Scholar] [CrossRef]
- Yu, L.; Liu, Y.; Bu, K.; Wang, W.J.; Zhang, S. Soil temperature mitigation due to vegetation biophysical feedbacks. Glob. Planet. Change 2022, 218, 103971. [Google Scholar] [CrossRef]
- Wang, W.; Wang, W.; Wang, P.; Wang, X.; Wang, L.; Wang, C.; Zhang, C.; Huo, Z. Impact of straw return on soil temperature and water during the freeze-thaw period. Agric. Water Manag. 2023, 282, 108292. [Google Scholar] [CrossRef]
- Xiao, B.B.; Hu, Y.; Liu, Y.P.; Jia, S.Y.; Zhang, T.T.; Yin, S.Y.; Xiao, C.X.; Jiang, J.; Wang, L.; Yang, C.W. Physiological and transcriptional analysis provides insights into responses of a spring wheat variety to combination of salt and heat stresses. Physiol. Plant. 2025, 177, e70154. [Google Scholar] [CrossRef]
- Mohammed, A.A.A.; Tsubo, M.; Kurosaki, Y.; Ibaraki, Y. Characterization of the Energy Balance of Wheat Grown under Irrigation in the Hot, Arid Environment of Sudan. Atmosphere 2024, 15, 18. [Google Scholar] [CrossRef]
- Zheng, H.; Sun, Y.C.; Bao, H.; Niu, P.P.; Jin, Z.; Niu, Z.G. Drought effects on evapotranspiration and energy exchange over a rain-fed maize cropland in the Chinese Loess Plateau. Agric. Water Manag. 2024, 293, 108711. [Google Scholar] [CrossRef]
- Maruyama, A.; Kuwagata, T. Coupling land surface and crop growth models to estimate the effects of changes in the growing season on energy balance and water use of rice paddies. Agric. For. Meteorol. 2010, 150, 919–930. [Google Scholar] [CrossRef]
Disclaimer/Publisher’s Note: The statements, opinions and data contained in all publications are solely those of the individual author(s) and contributor(s) and not of MDPI and/or the editor(s). MDPI and/or the editor(s) disclaim responsibility for any injury to people or property resulting from any ideas, methods, instructions or products referred to in the content. |
© 2025 by the authors. Licensee MDPI, Basel, Switzerland. This article is an open access article distributed under the terms and conditions of the Creative Commons Attribution (CC BY) license (https://creativecommons.org/licenses/by/4.0/).