

How to Improve Blue–Green–Gray Infrastructure to Optimize River Cooling Island Effect on Riparian Zone for Outdoor Activities in Summer


Abstract
1. Introduction
2. Materials and Methods
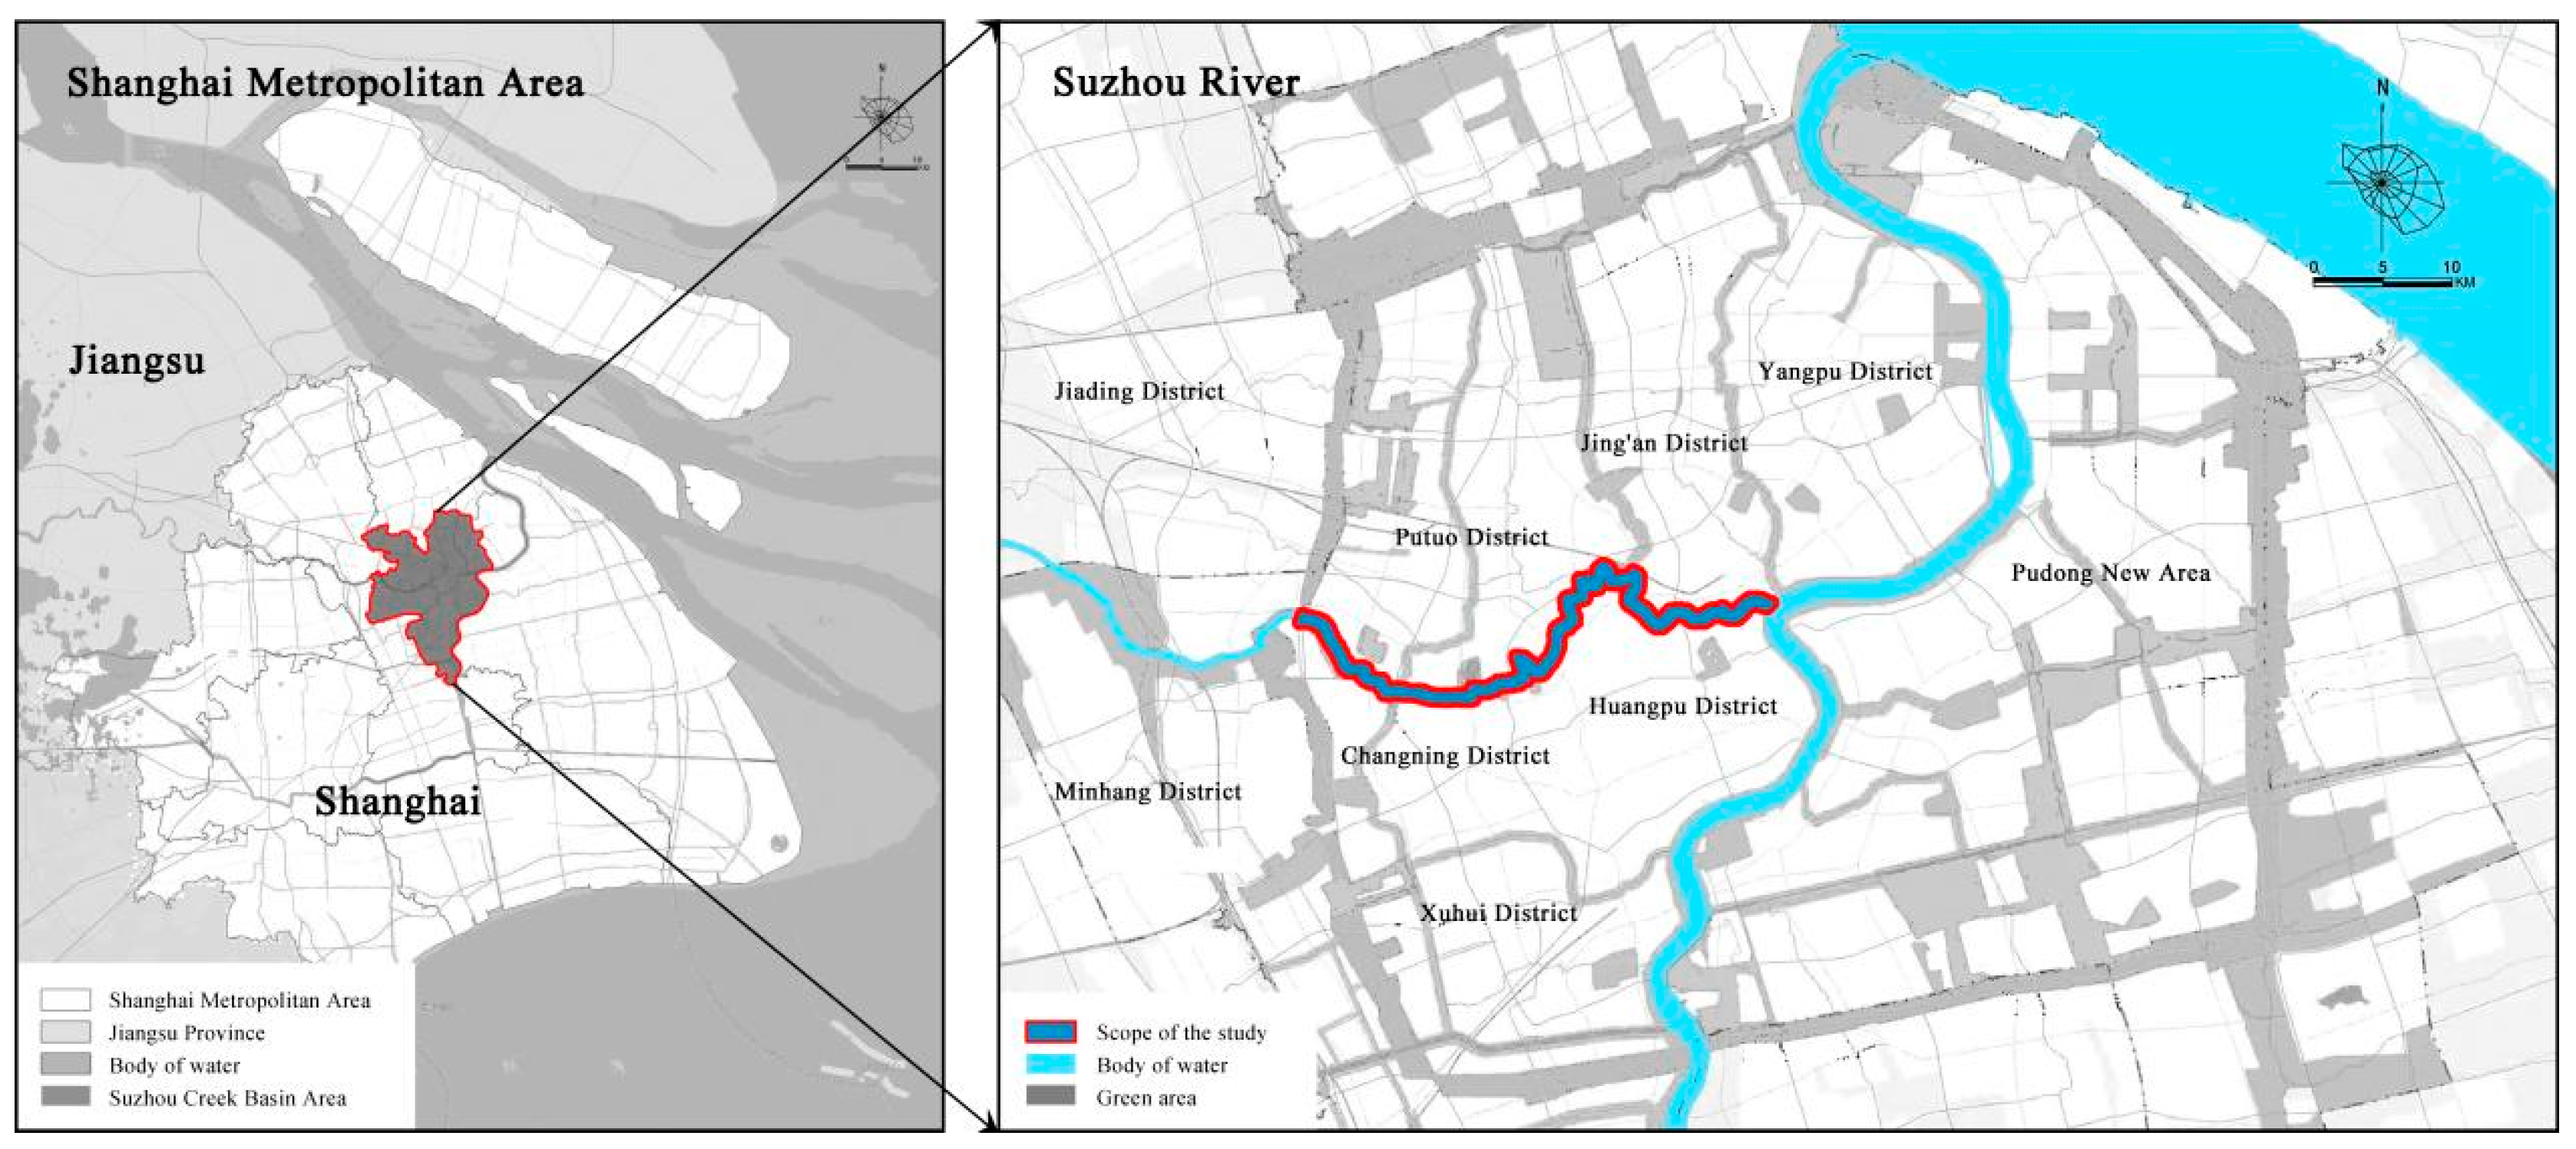
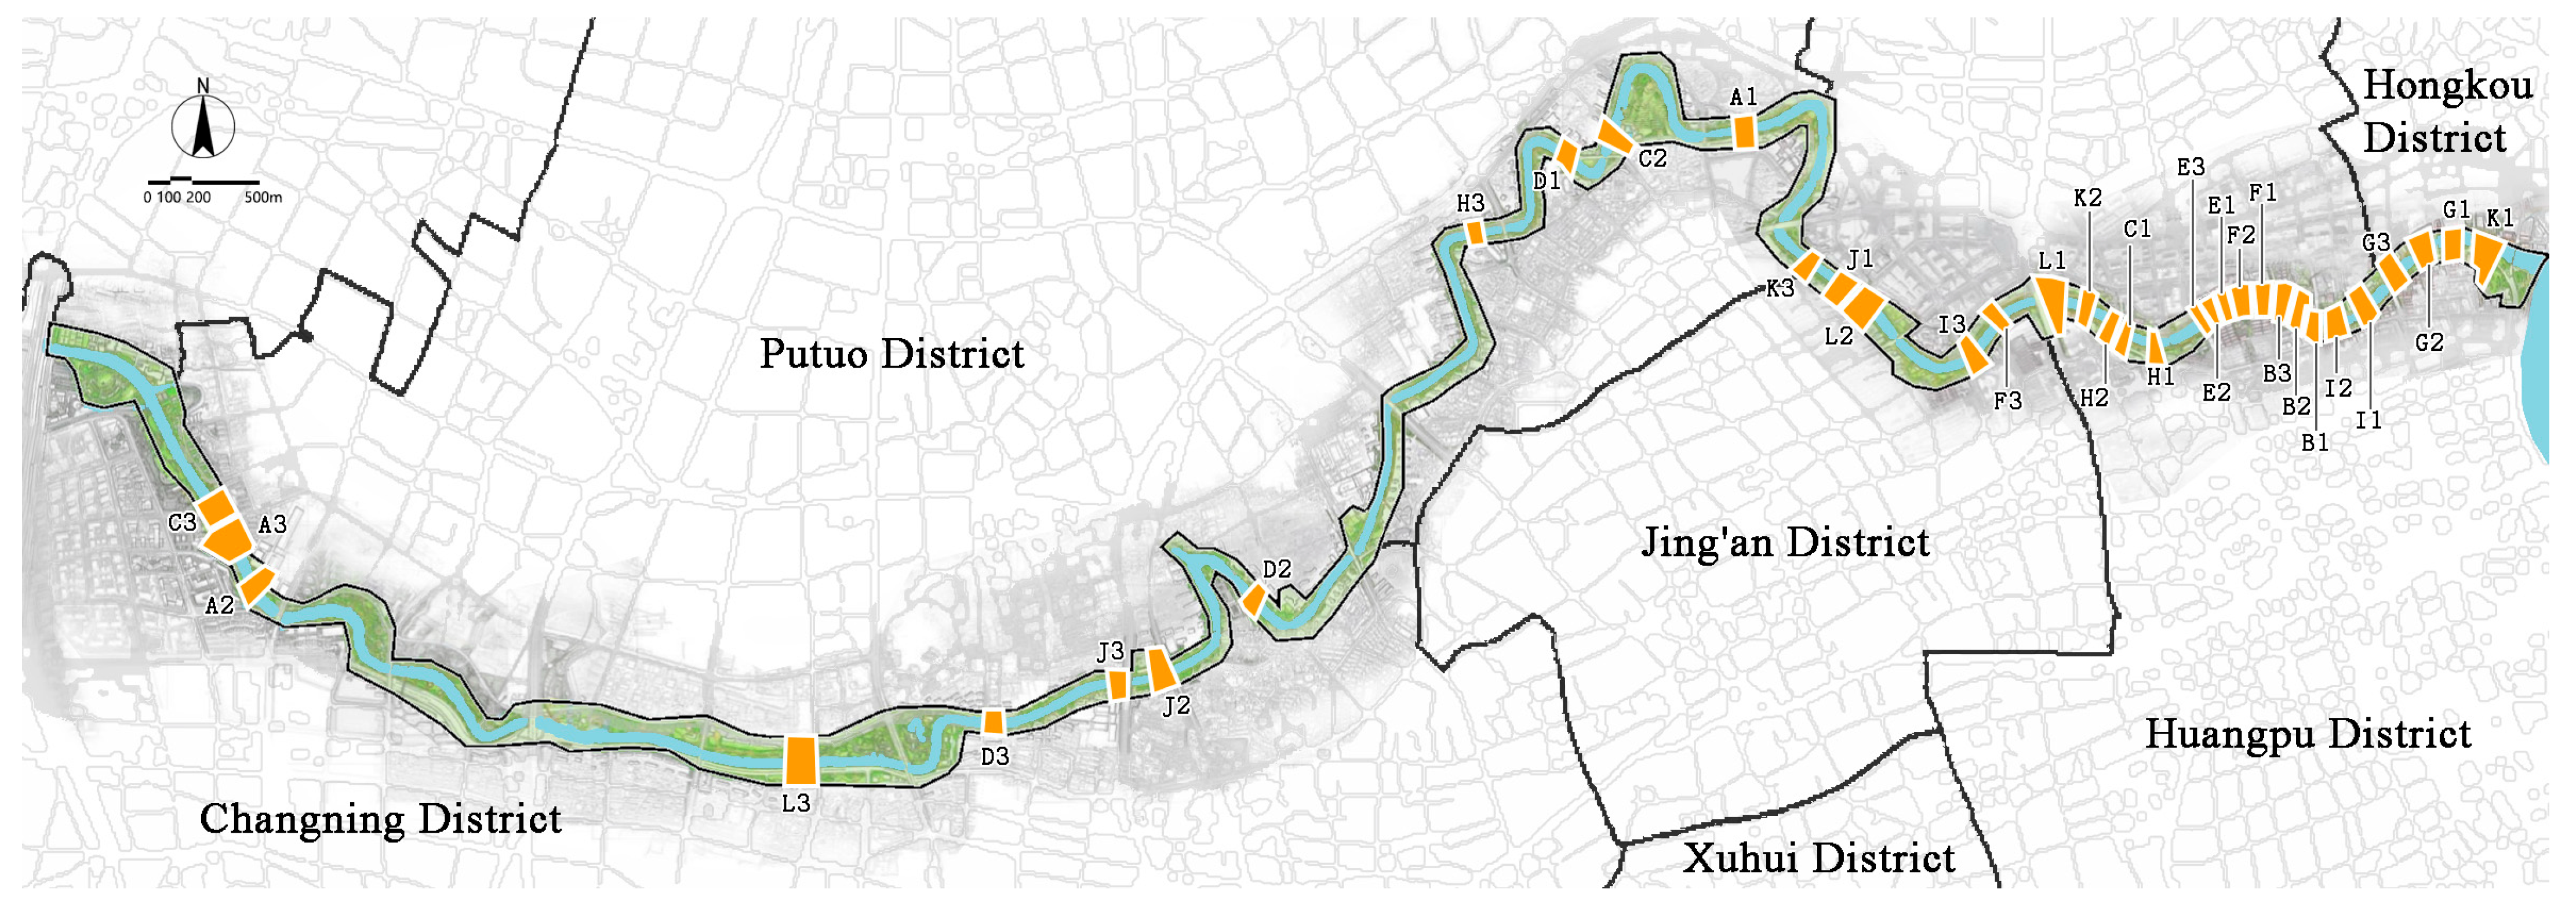
2.1. Research Objects
2.2. Blue-Green-Gray Infrastructure Index
2.3. Thermal Comfort and ENVI-Met
2.3.1. Thermal Comfort Index
2.3.2. Simulation Settings
2.3.3. Reliability Test
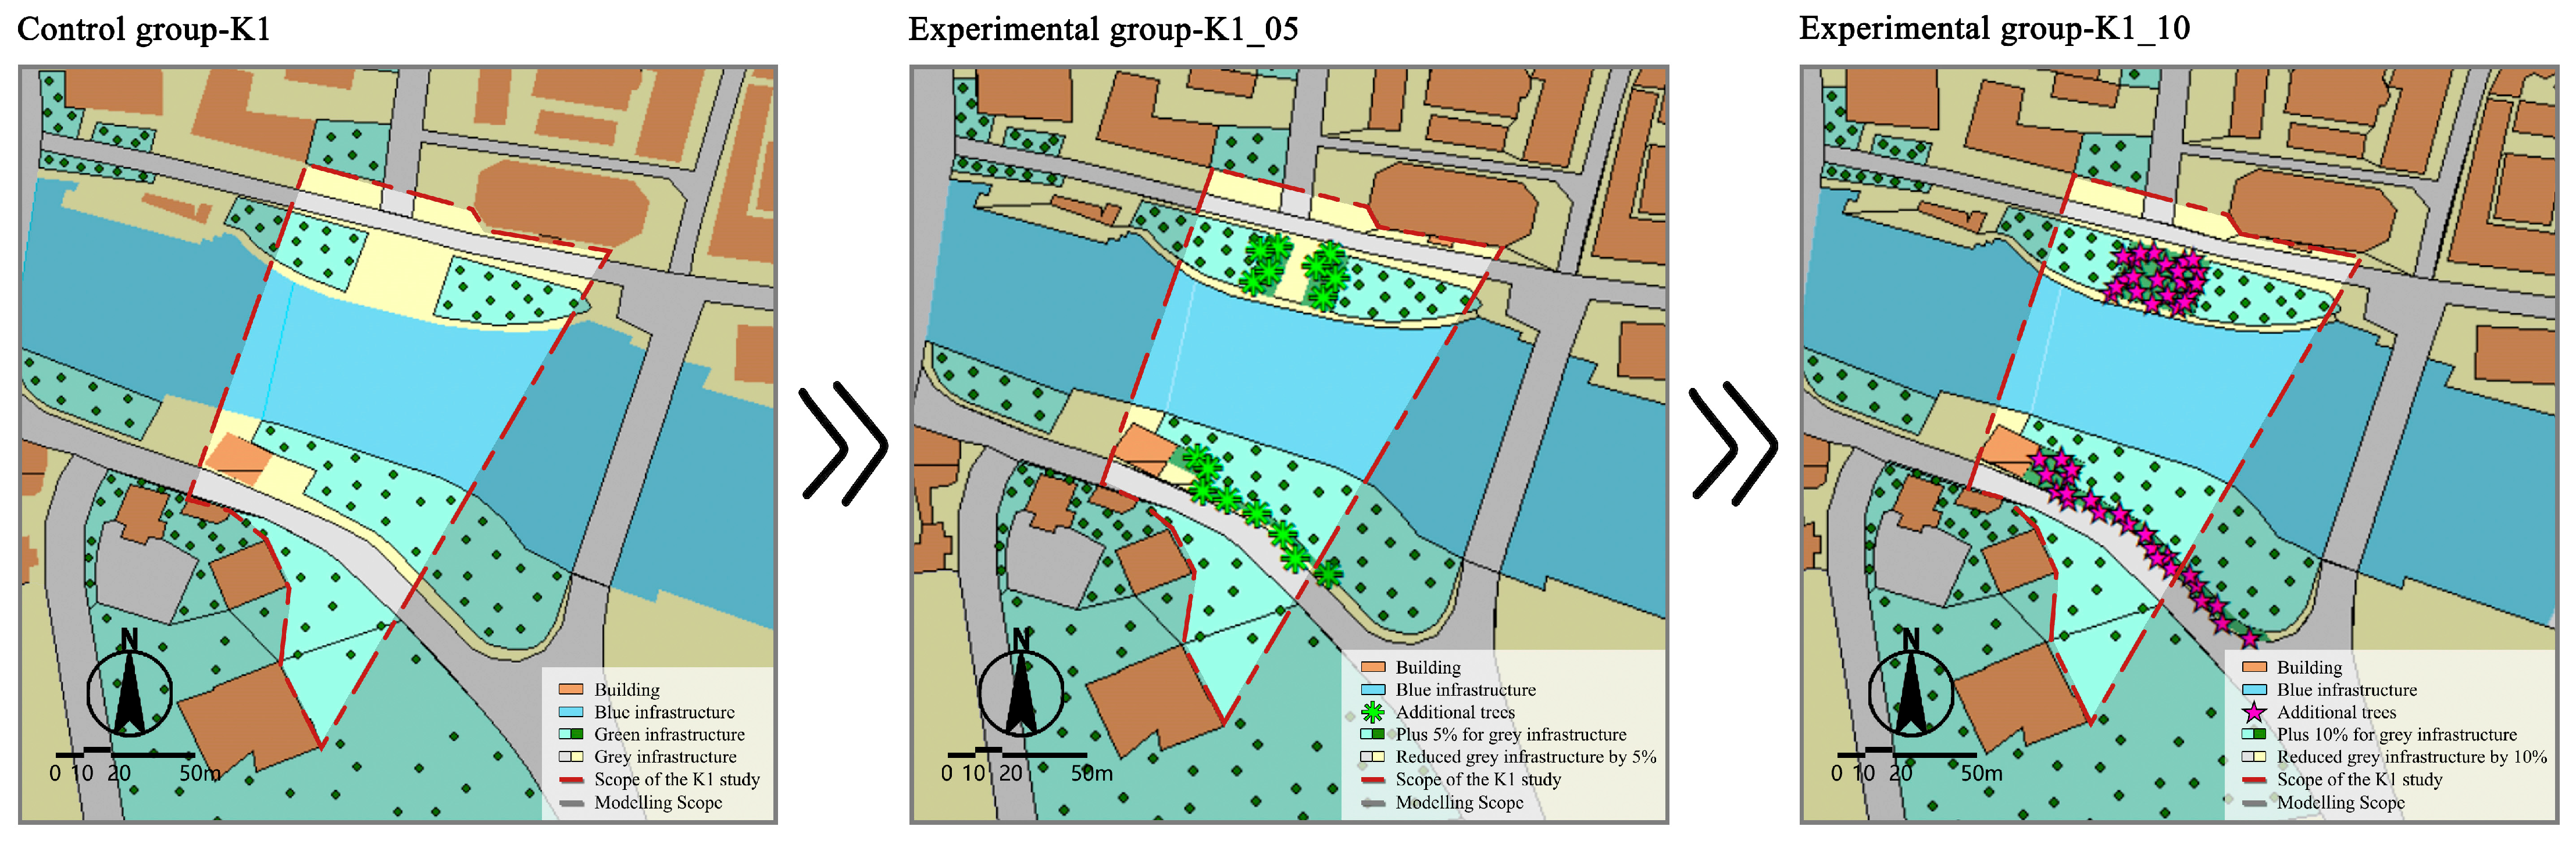
2.4. Experimental Design
2.5. Analytical Models: RDA and BRT
3. Results
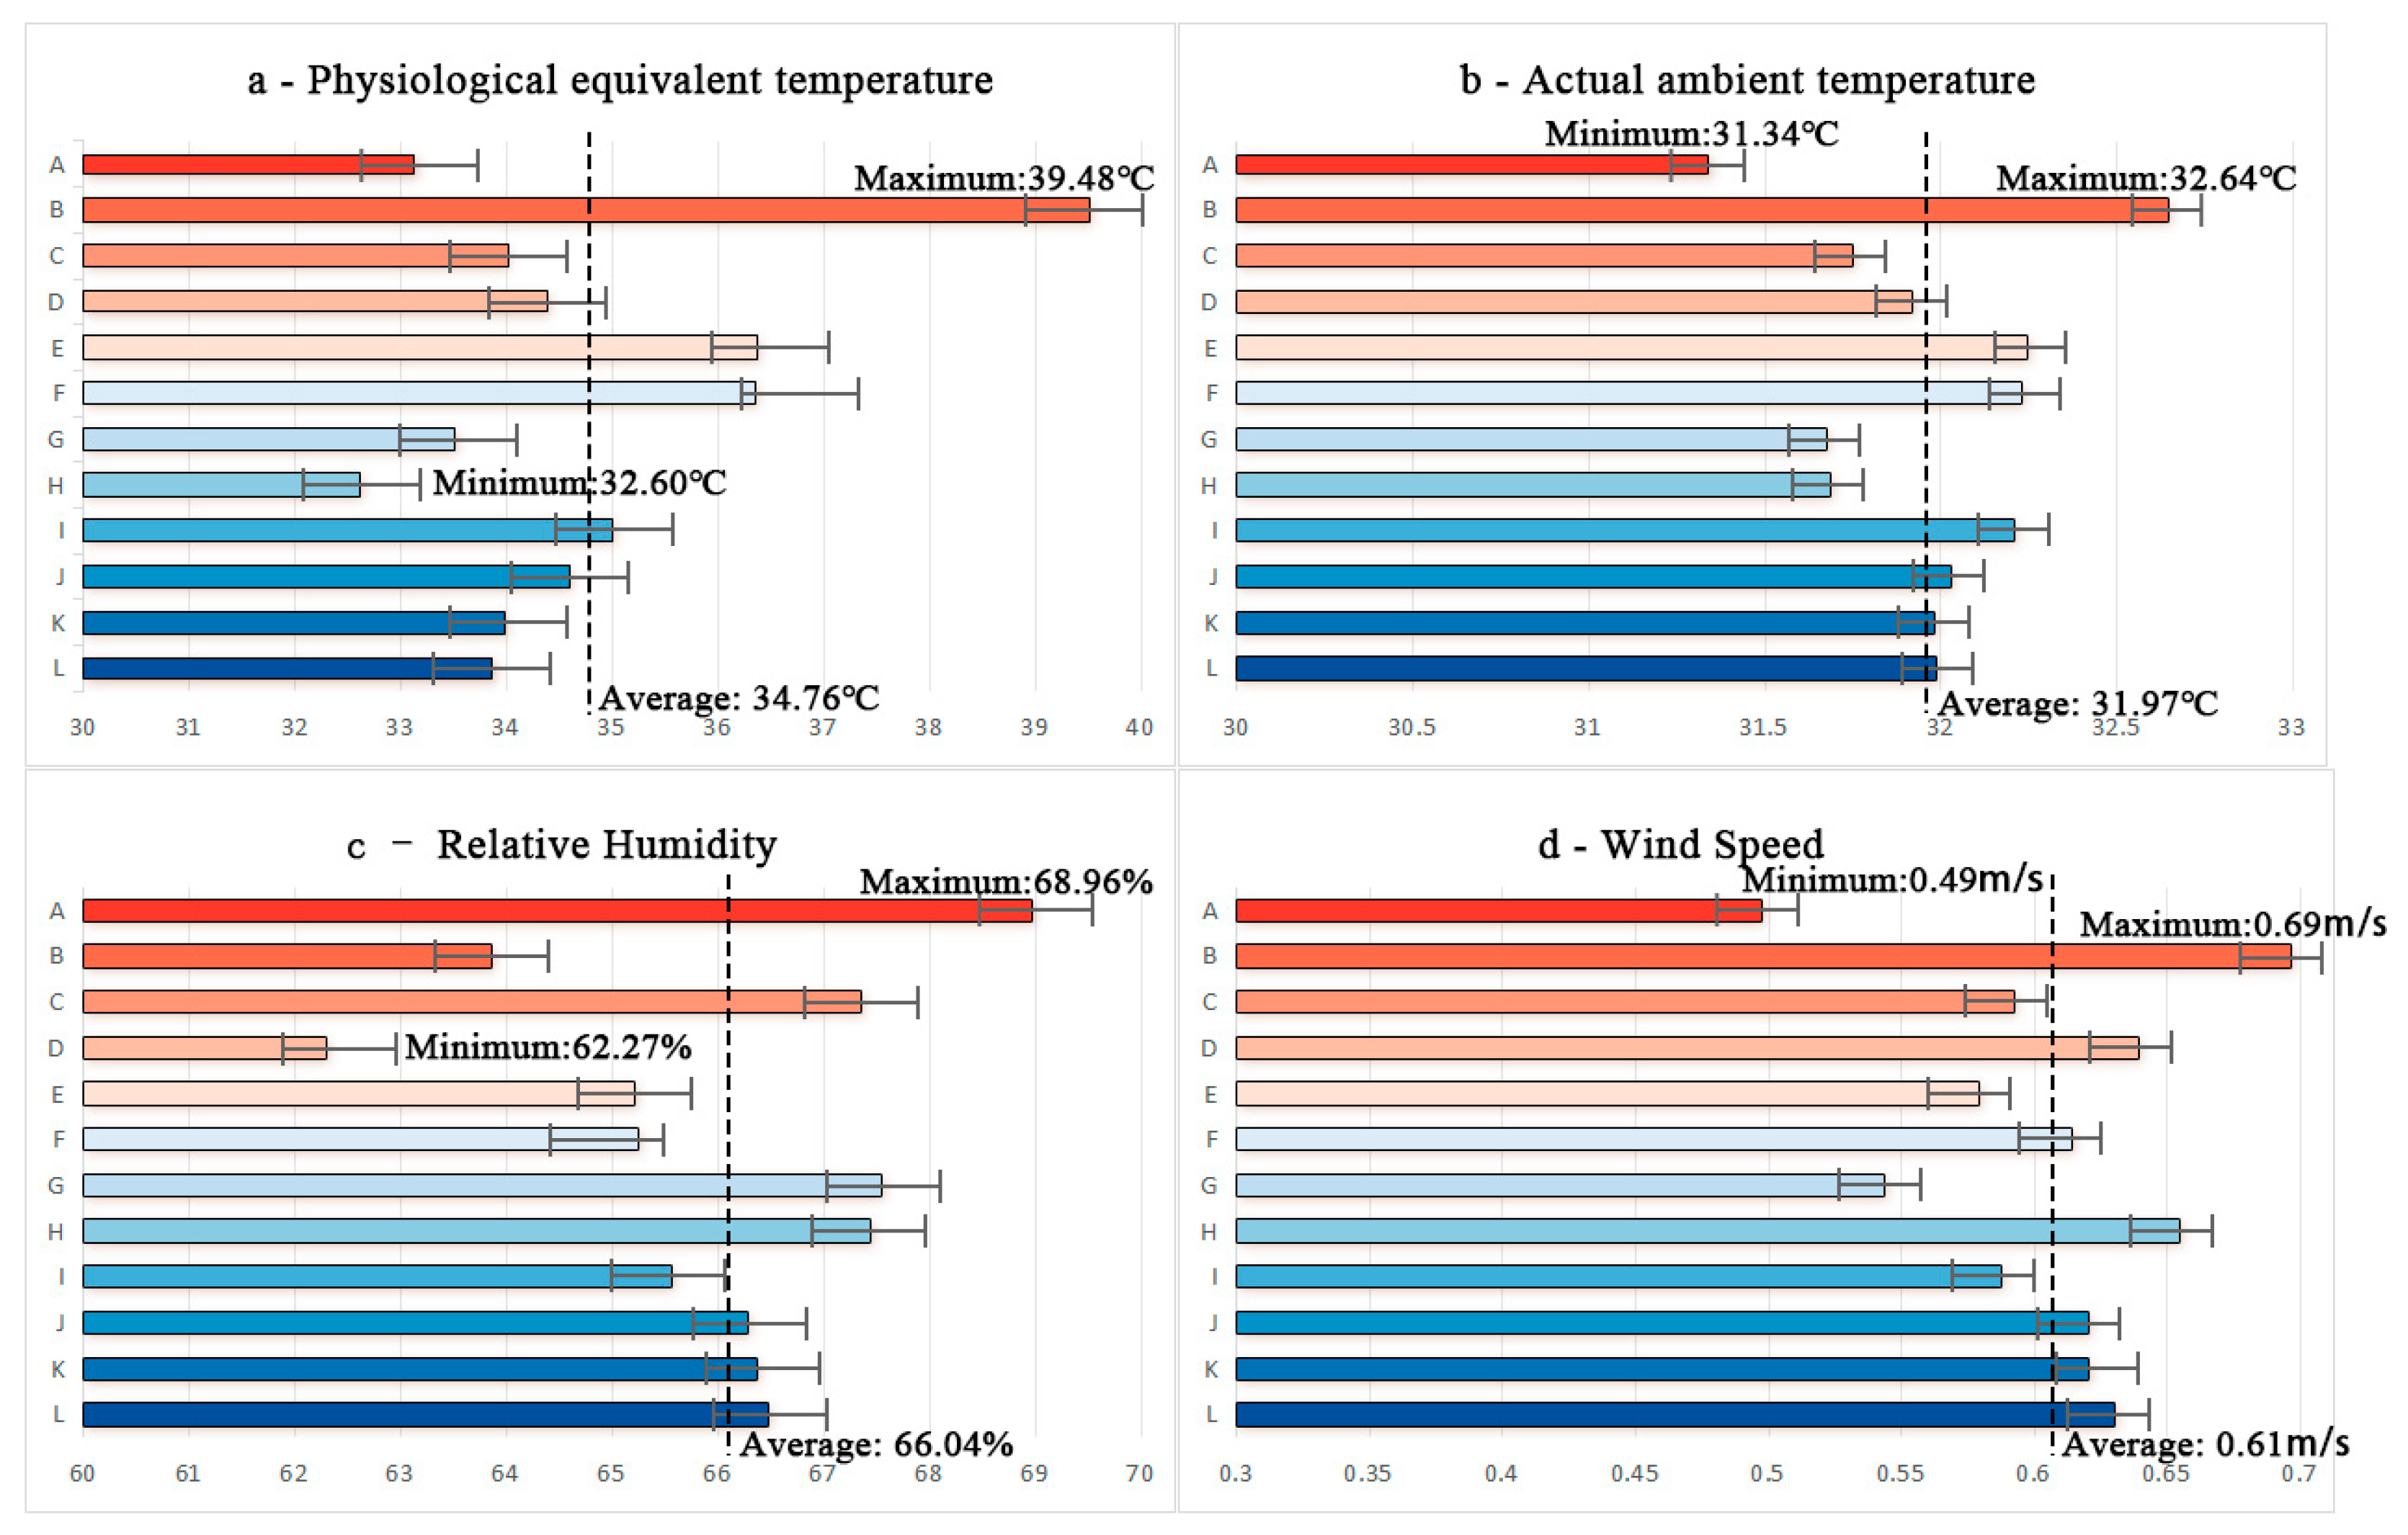
3.1. Thermal Comfort Simulation Results
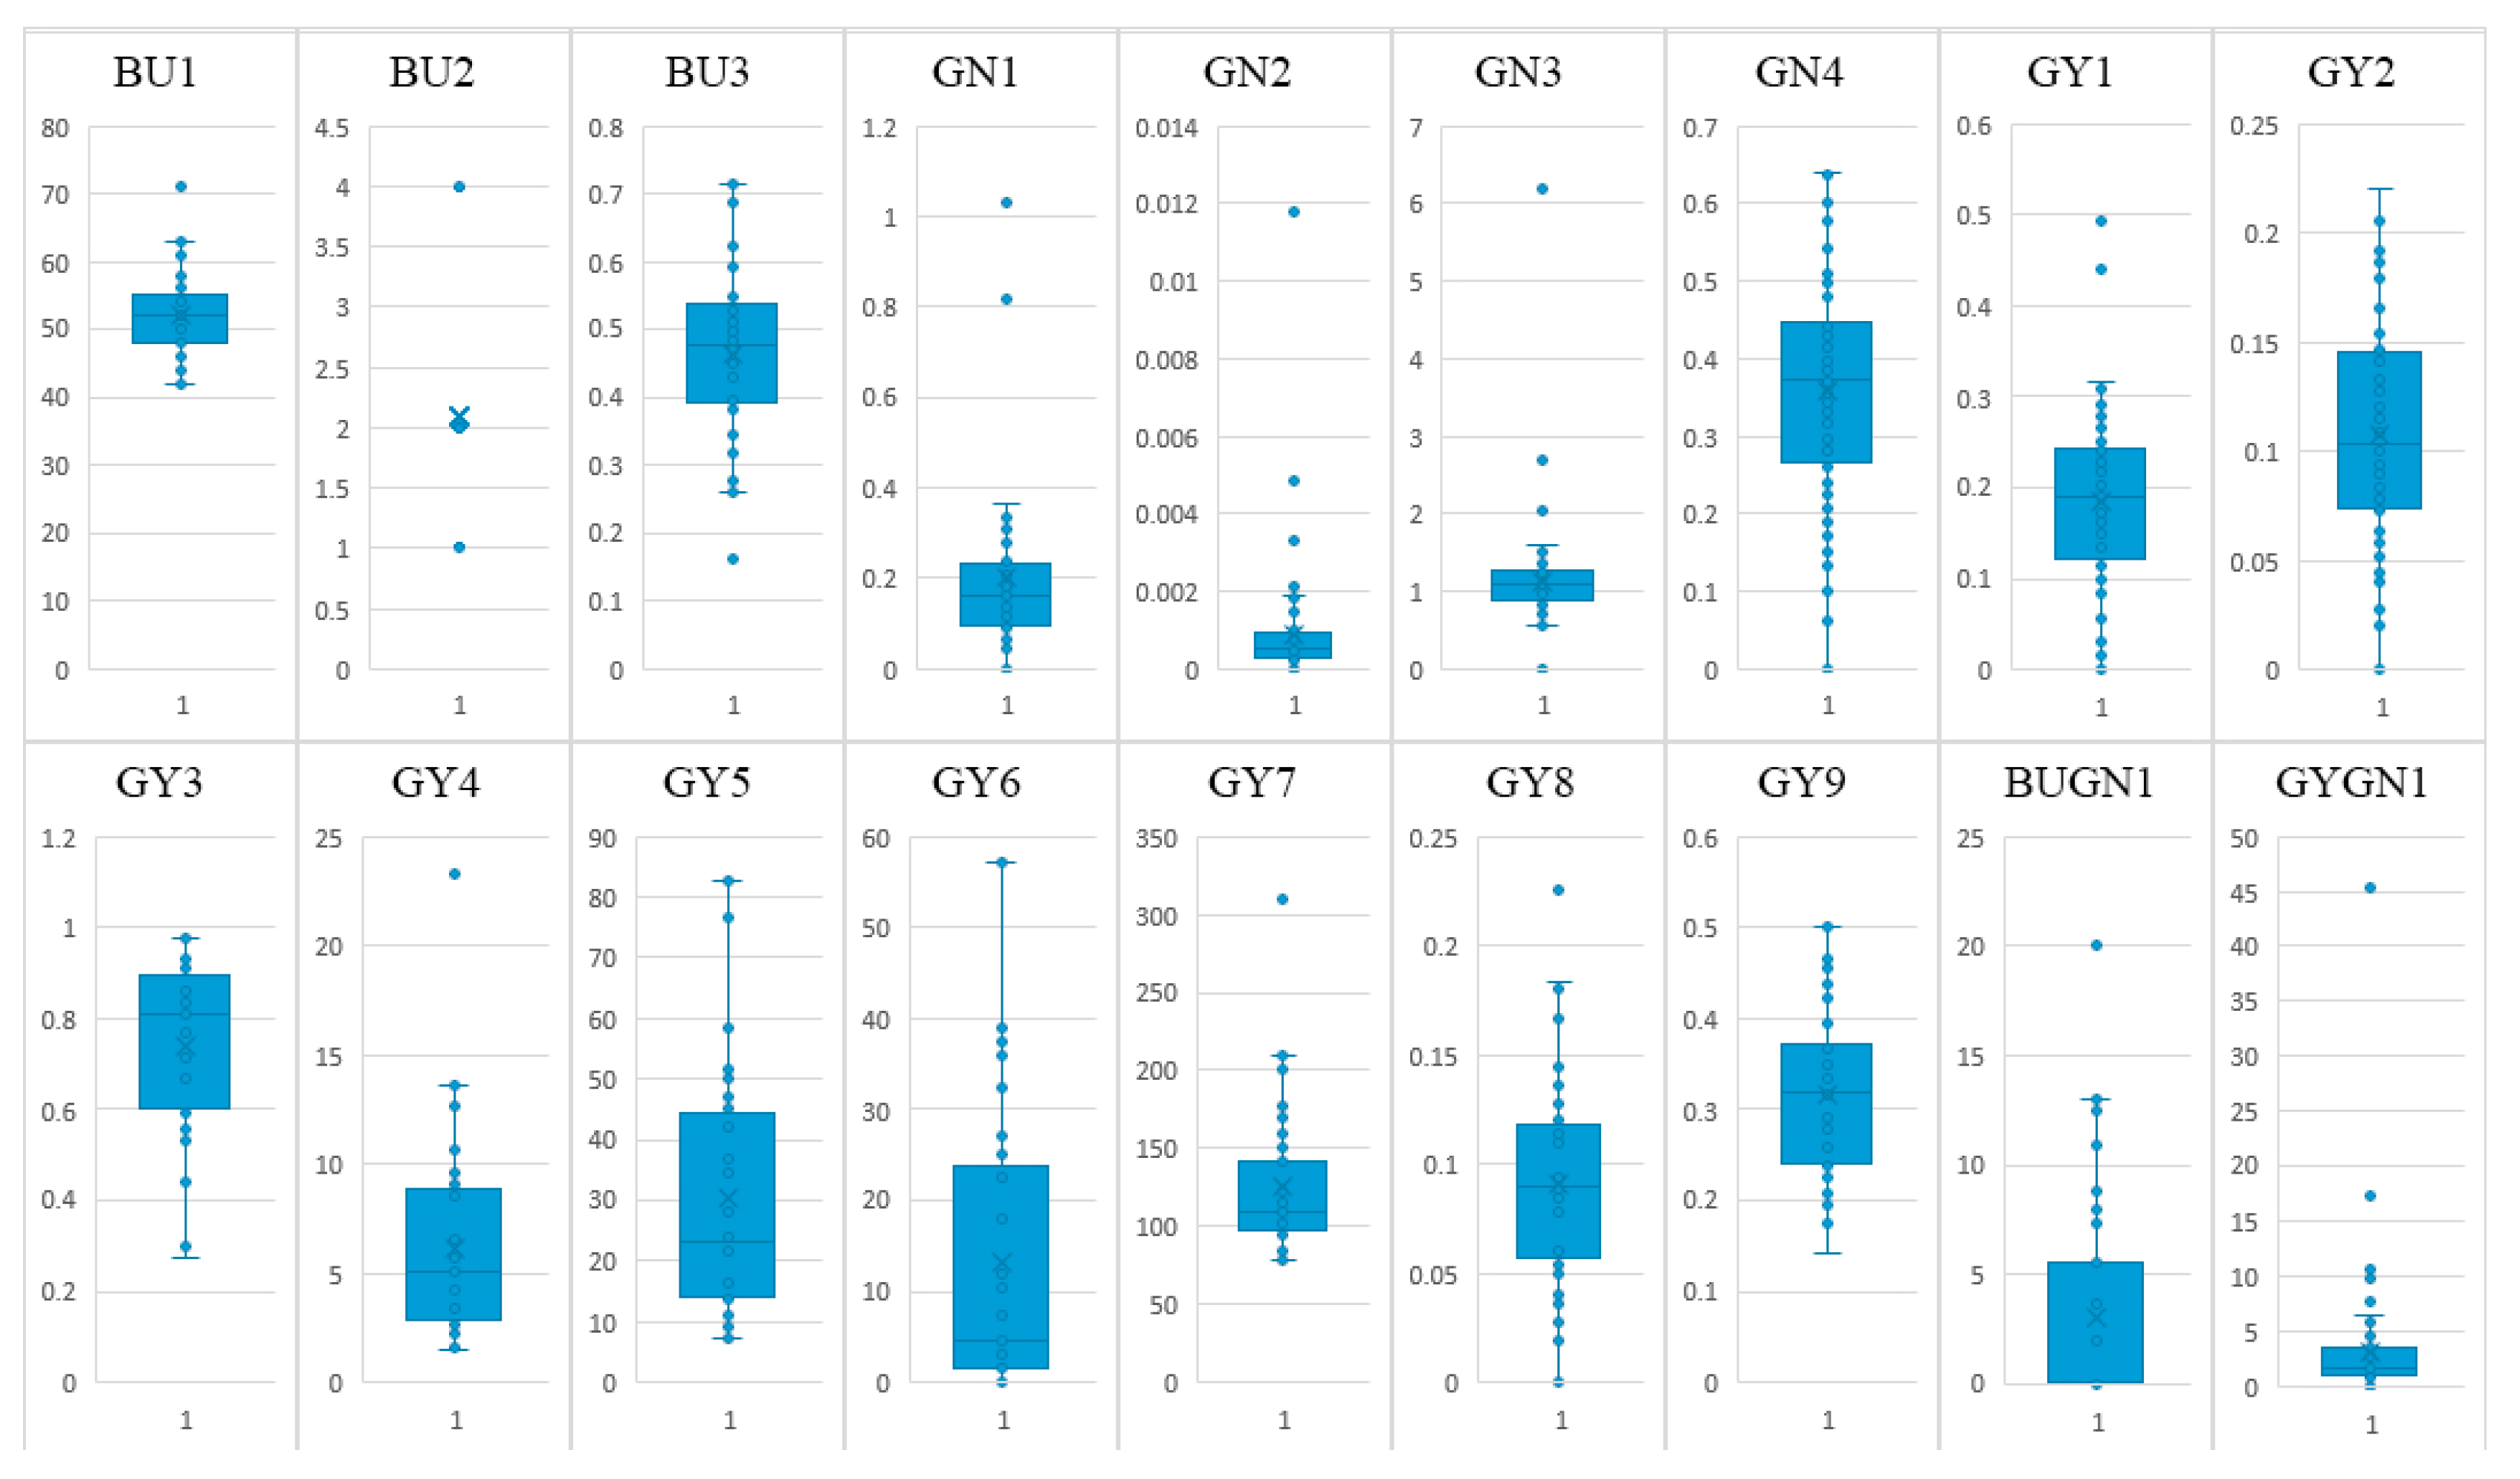
3.2. BGGI Results
3.3. Effect of BGGI on Thermal Comfort
3.3.1. Correlation Analysis: RDA
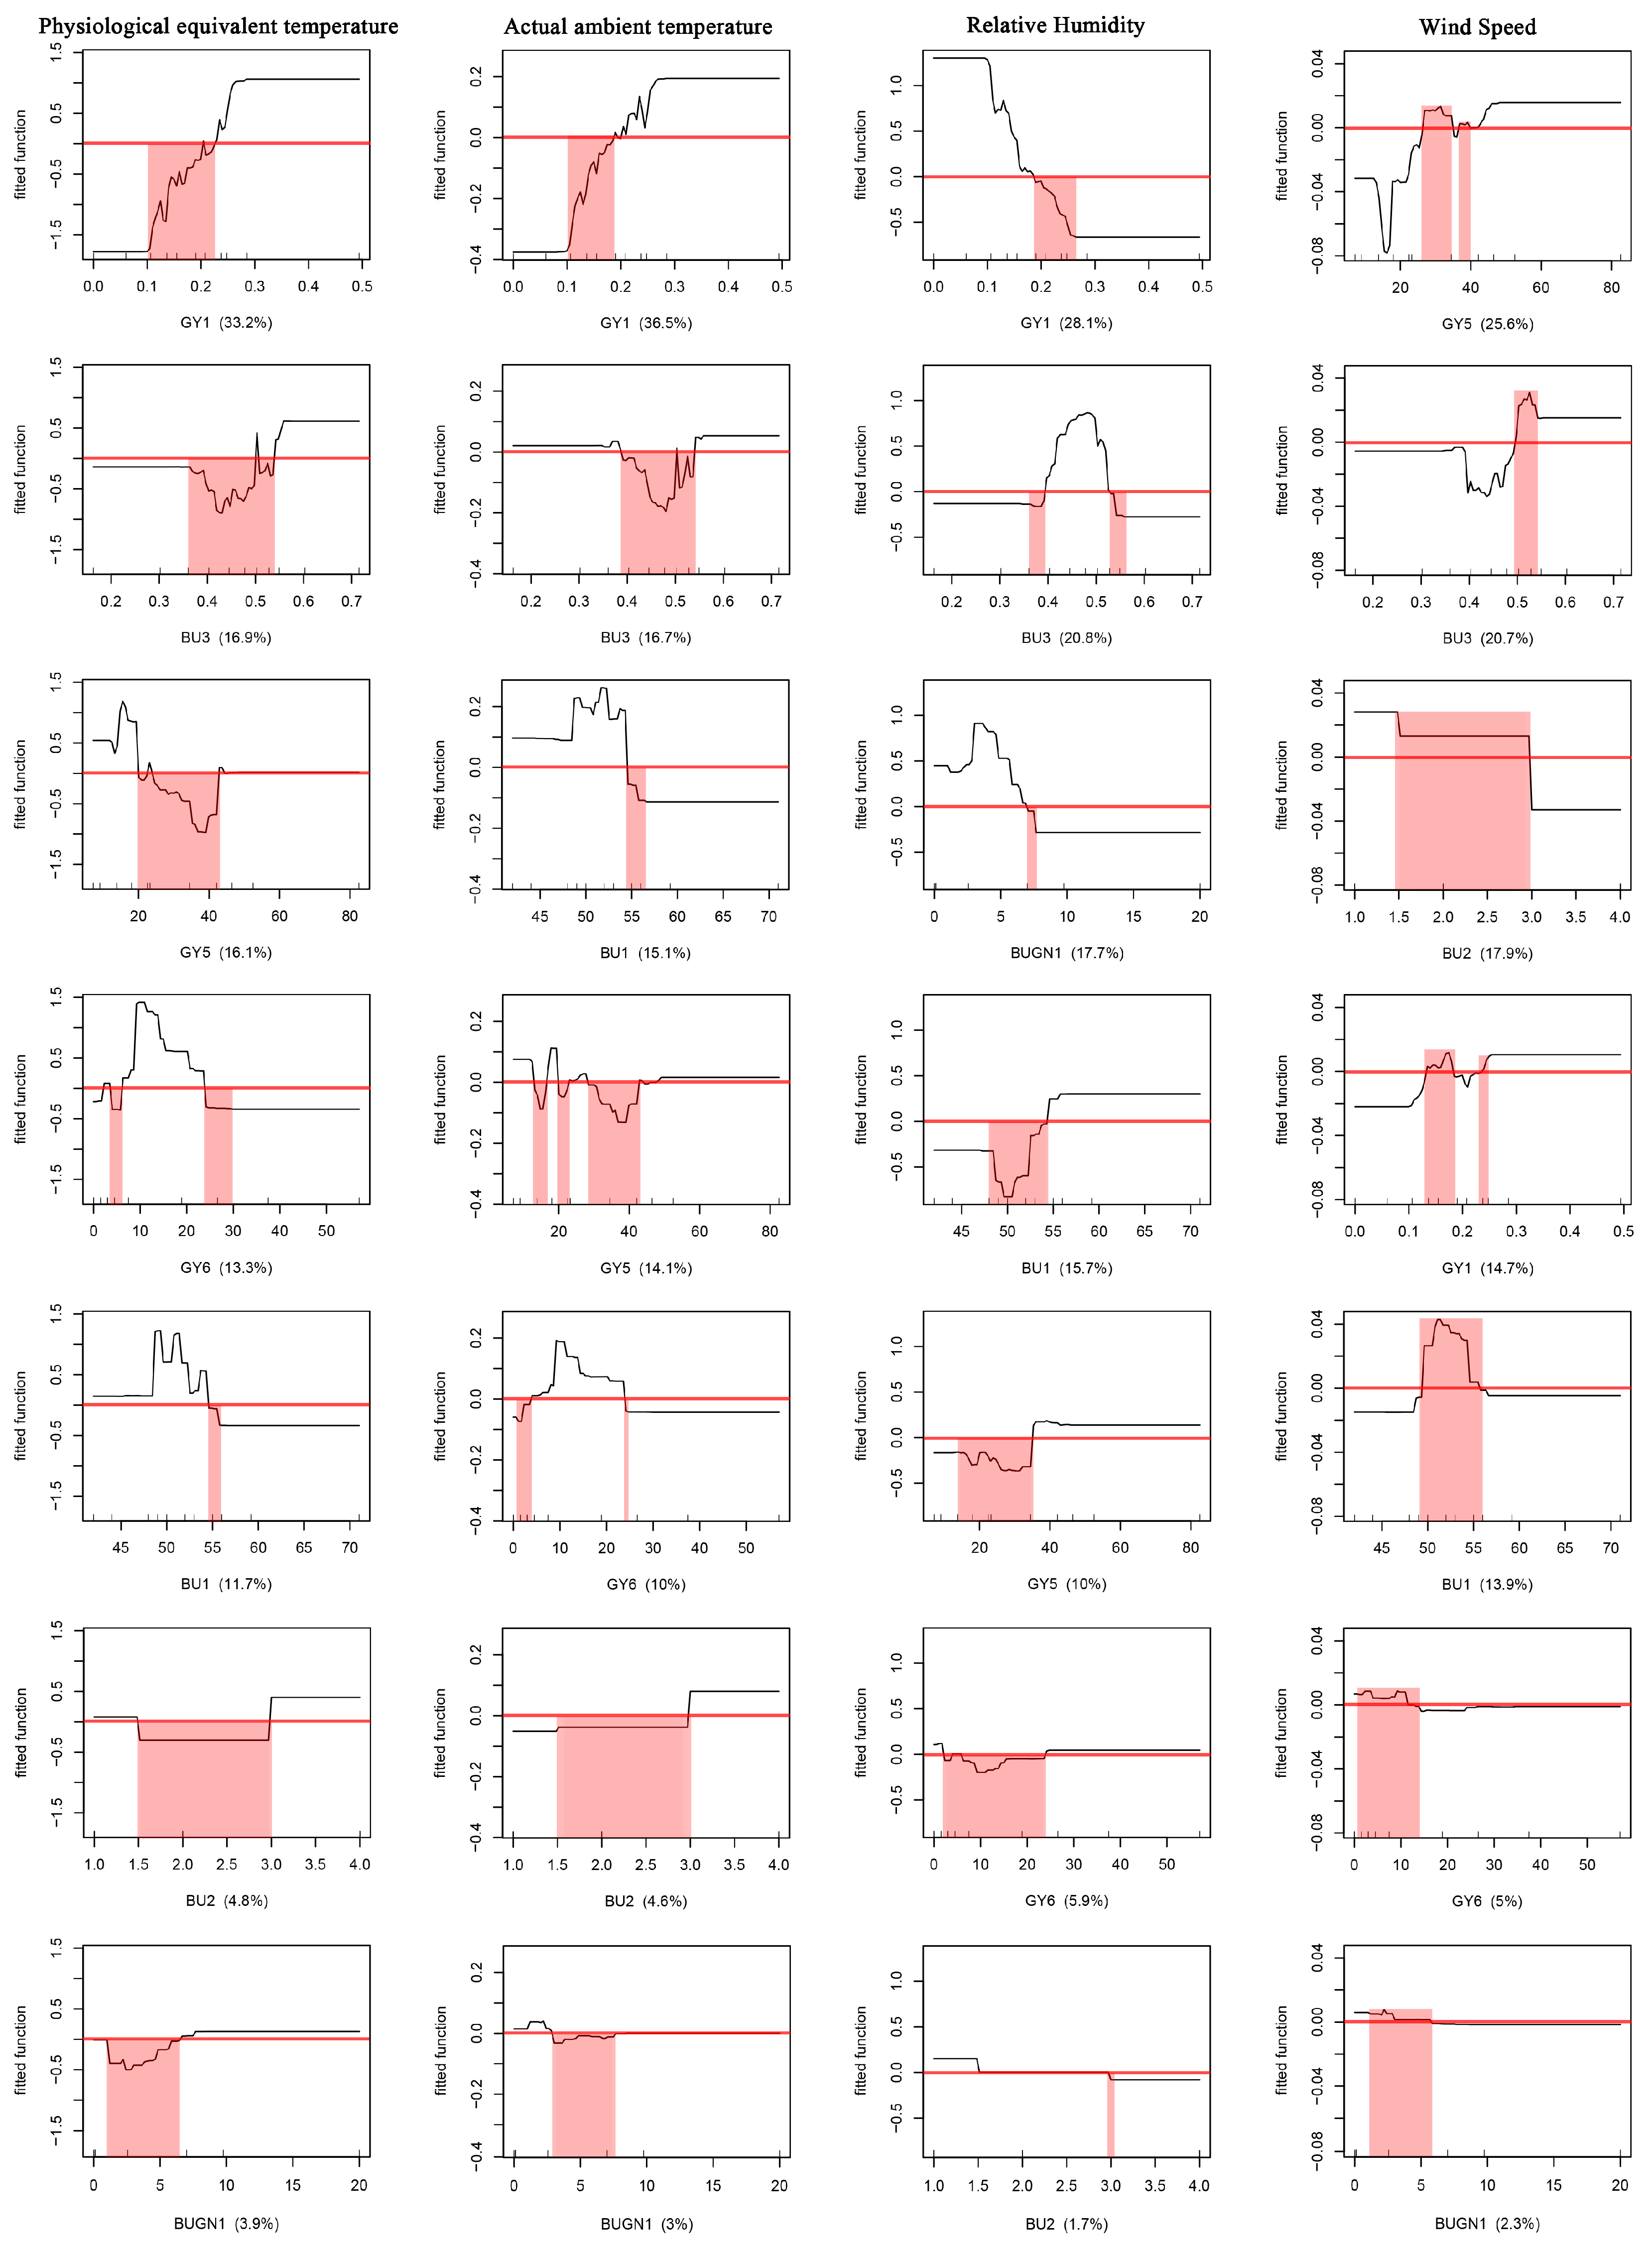
3.3.2. Contribution and Threshold Analysis: BRT
4. Discussion
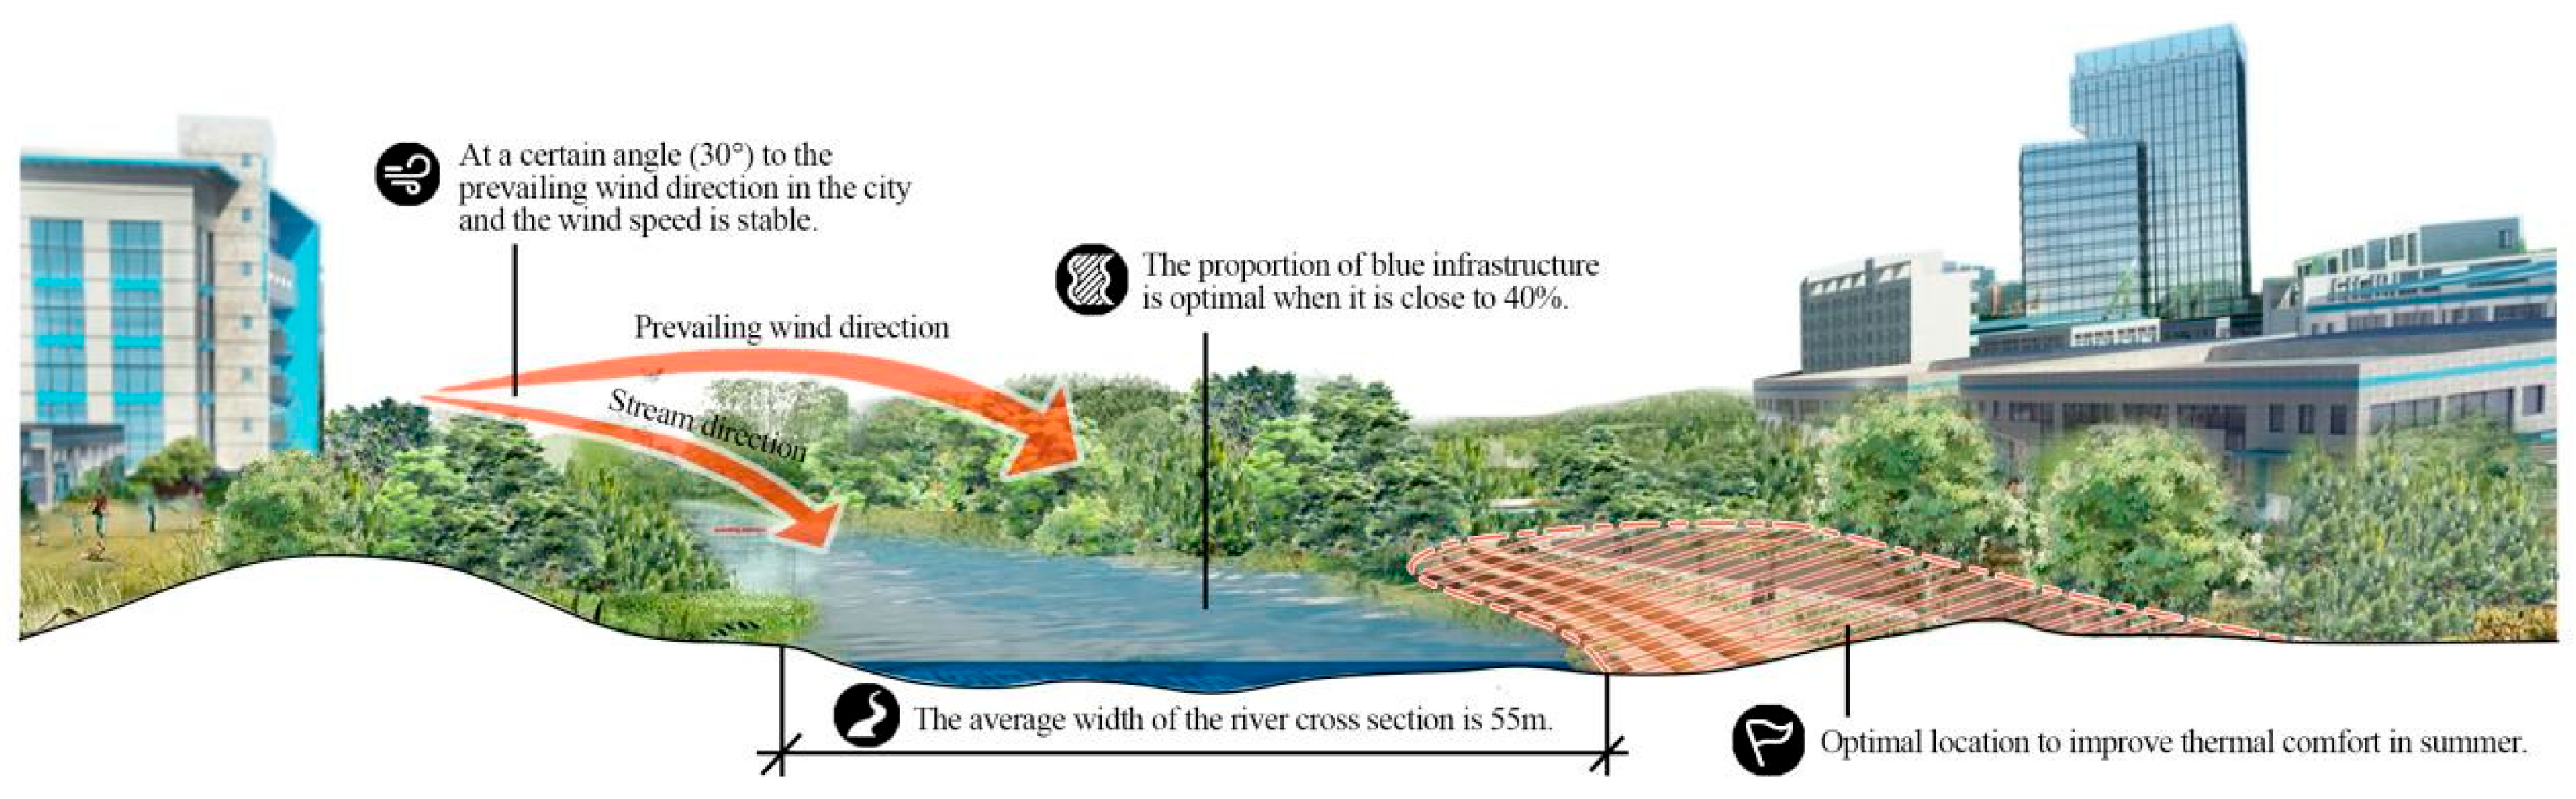
4.1. Optimal Configuration
4.2. Optimal Location to Improve Thermal Comfort in Summer
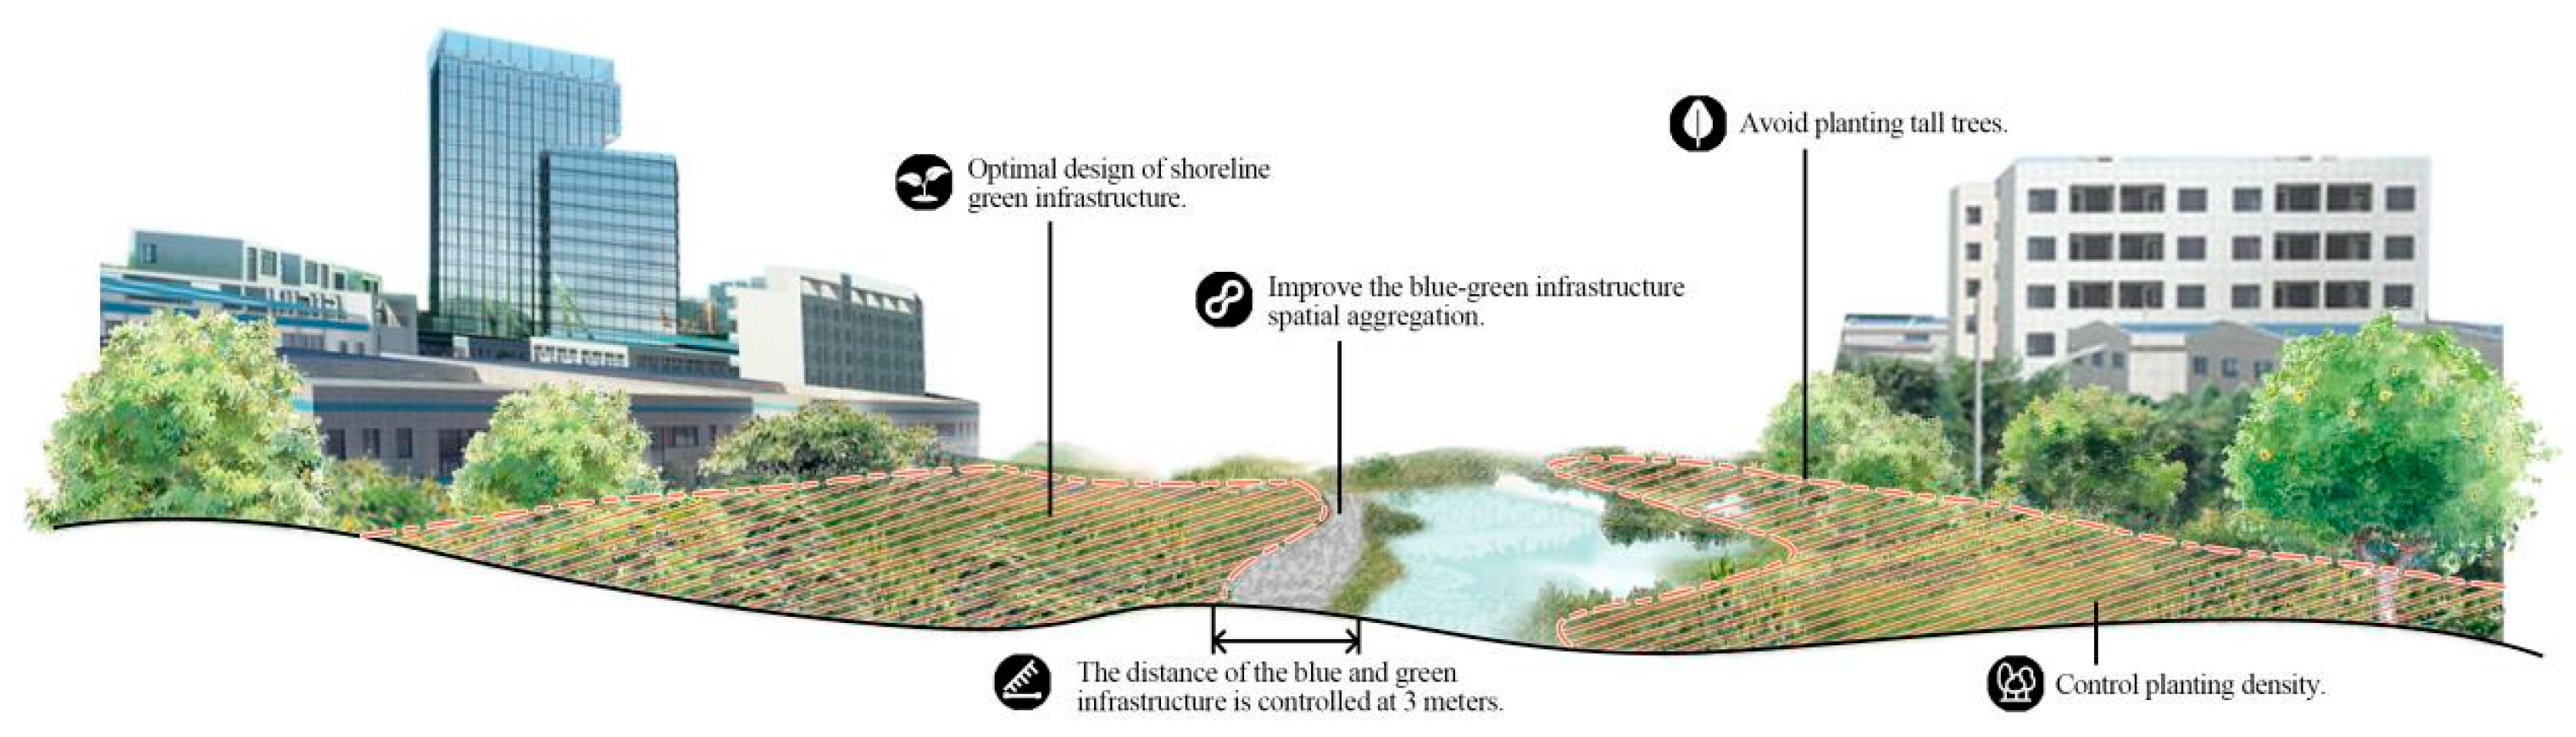
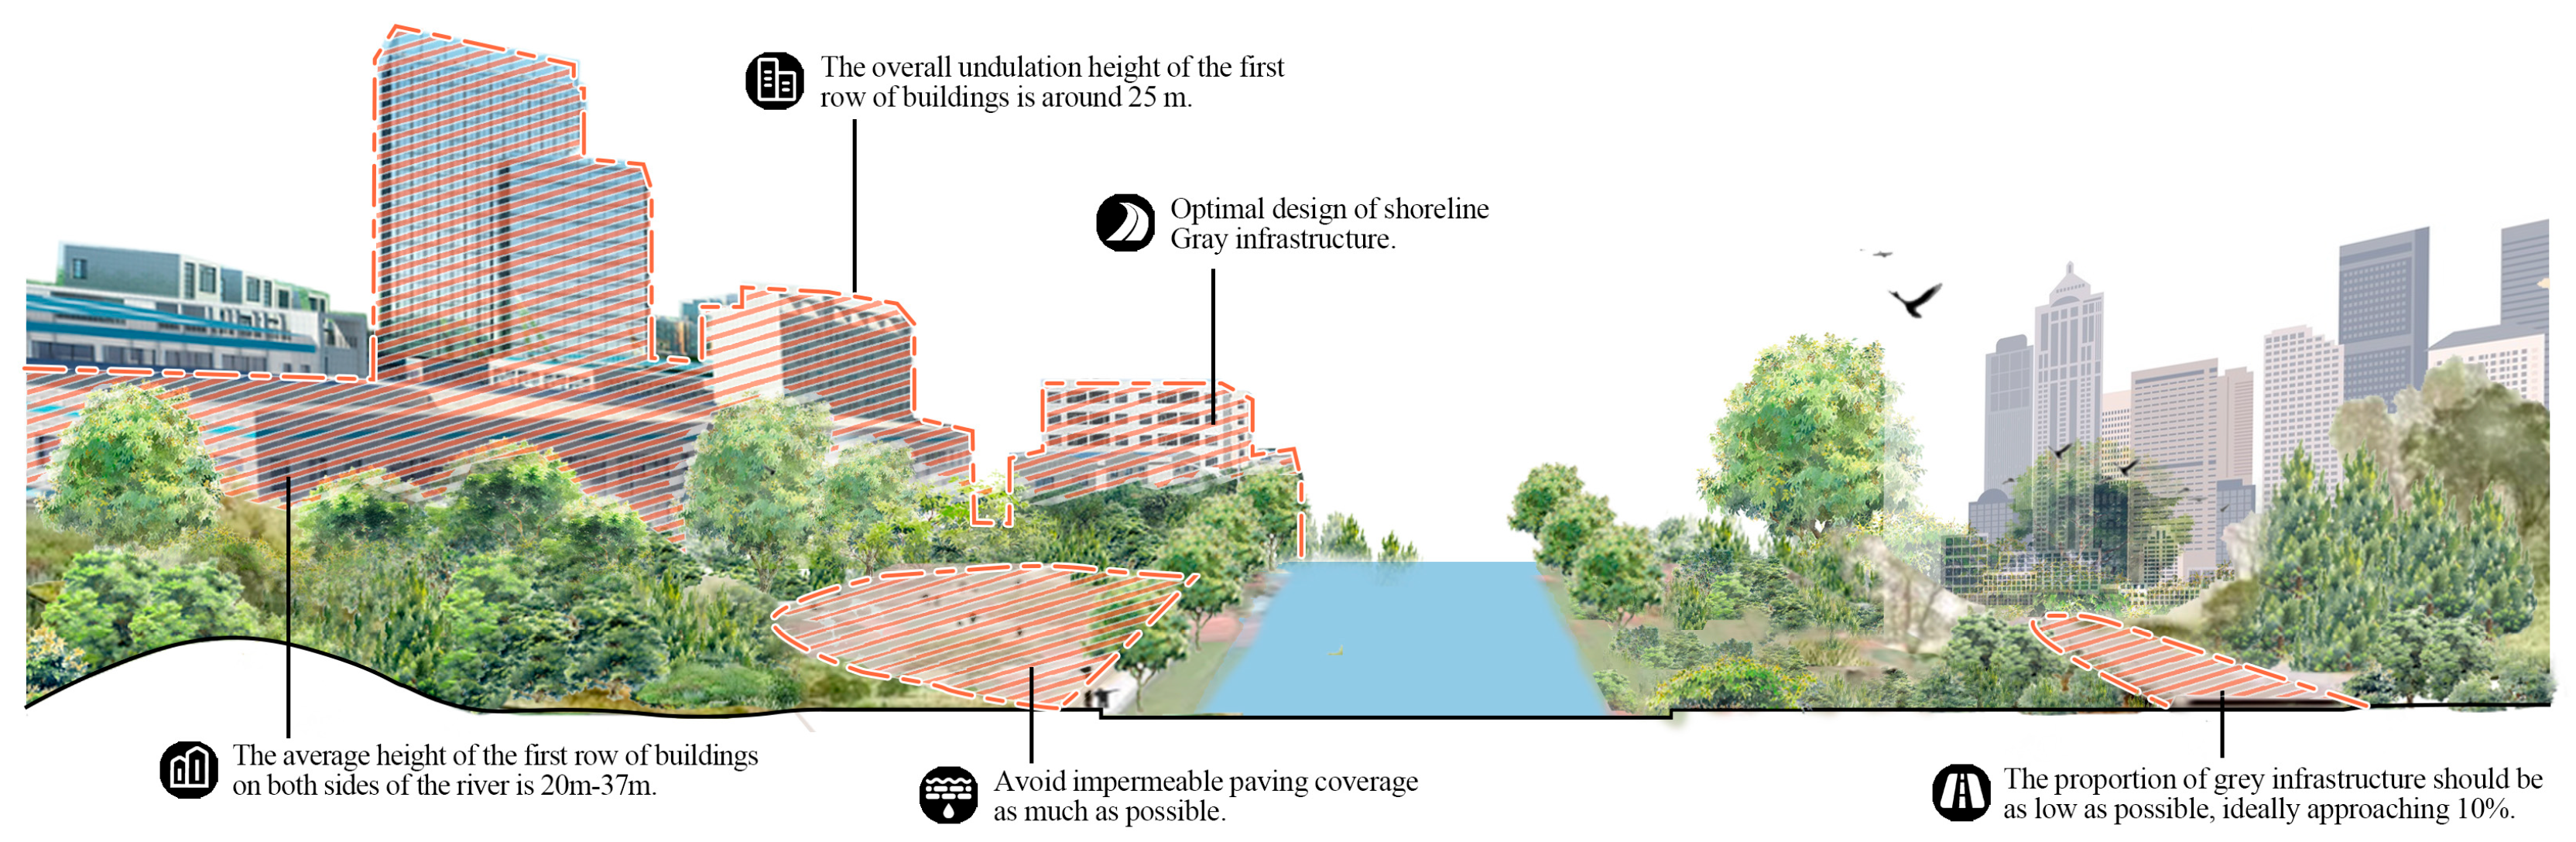
4.3. Optimization Recommendations of Shoreline Green Infrastructure
4.4. Optimization Recommendations of Shoreline Gray Infrastructure
4.5. Discussion on Design Application
4.6. Limitations of This Study and Suggested Future Research
5. Conclusions
Author Contributions
Funding
Data Availability Statement
Conflicts of Interest
Appendix A
| Times | Measured Temperature | Simulated Temperature | ||||
| AT (°C) | RH (%) | WS (m/s) | AT (°C) | RH (%) | WS (m/s) | |
| 5:00 | 29.0 | 81 | 0.5 | 27.90 | 85.58 | 0.36 |
| 6:00 | 28.9 | 82 | 0.3 | 27.51 | 87.66 | 0.26 |
| 7:00 | 29.2 | 81 | 0.5 | 28.36 | 84.75 | 0.39 |
| 8:00 | 30.8 | 72 | 0.6 | 30.44 | 73.72 | 0.52 |
| 9:00 | 32.1 | 63 | 1.1 | 32.22 | 62.61 | 0.86 |
| 10:00 | 33.7 | 59 | 0.6 | 34.42 | 56.96 | 0.57 |
| 11:00 | 35.2 | 55 | 0.7 | 36.40 | 51.77 | 0.62 |
| 12:00 | 36.3 | 53 | 0.7 | 37.80 | 49.10 | 0.63 |
| 13:00 | 36.8 | 50 | 0.8 | 38.38 | 49.26 | 0.65 |
| 14:00 | 36.9 | 51 | 0.5 | 38.30 | 47.59 | 0.50 |
| 15:00 | 36.5 | 53 | 0.7 | 37.69 | 49.89 | 0.81 |
| 16:00 | 35.9 | 54 | 1.0 | 36.53 | 45.70 | 0.81 |
| 17:00 | 34.6 | 61 | 0.8 | 34.81 | 60.09 | 0.66 |
| 18:00 | 33.5 | 65 | 1.7 | 33.28 | 65.53 | 0.53 |
| 19:00 | 32.6 | 67 | 0.5 | 32.05 | 68.74 | 0.44 |
| 20:00 | 31.9 | 71 | 0.3 | 31.09 | 73.67 | 0.37 |
| 21:00 | 31.4 | 73 | 0.7 | 30.65 | 75.62 | 0.63 |
| 22:00 | 31.0 | 75 | 1.0 | 30.19 | 77.77 | 0.79 |
Appendix B
| Samples | Average Value from 7:00 to 9:00 | Average Value from 18:00 to 20:00 | ||||||
| AT (°C) | RH (%) | WS (m/s) | PET (°C) | AT (°C) | RH (%) | WS (m/s) | PET (°C) | |
| A1 | 37.30 | 31.48 | 65.51 | 0.43 | 29.02 | 31.61 | 70.61 | 0.94 |
| A2 | 38.38 | 31.36 | 66.90 | 0.62 | 28.84 | 30.94 | 73.00 | 0.30 |
| A3 | 36.51 | 31.45 | 65.77 | 0.38 | 28.66 | 31.21 | 71.94 | 0.32 |
| B1 | 48.92 | 33.23 | 58.99 | 1.01 | 32.81 | 32.81 | 66.13 | 0.55 |
| B2 | 48.06 | 32.52 | 61.36 | 0.80 | 29.63 | 32.43 | 67.51 | 0.43 |
| B3 | 48.02 | 32.45 | 61.51 | 0.90 | 29.47 | 32.41 | 67.54 | 0.48 |
| C1 | 39.36 | 31.82 | 64.04 | 0.85 | 28.67 | 31.71 | 70.05 | 0.39 |
| C2 | 39.54 | 32.09 | 63.73 | 0.80 | 29.59 | 31.87 | 69.51 | 0.33 |
| C3 | 37.35 | 31.54 | 65.54 | 0.78 | 29.32 | 31.44 | 71.19 | 0.40 |
| D1 | 40.93 | 31.95 | 63.65 | 0.90 | 29.46 | 32.16 | 68.47 | 0.44 |
| D2 | 38.35 | 31.74 | 64.57 | 0.79 | 29.00 | 31.85 | 69.62 | 0.38 |
| D3 | 38.98 | 31.89 | 37.81 | 0.89 | 29.44 | 31.90 | 69.51 | 0.43 |
| E1 | 43.26 | 32.09 | 62.82 | 0.76 | 28.96 | 32.22 | 68.26 | 0.41 |
| E2 | 42.33 | 32.03 | 63.05 | 0.74 | 28.91 | 32.29 | 68.03 | 0.40 |
| E3 | 45.76 | 32.32 | 62.05 | 0.75 | 29.68 | 32.57 | 66.98 | 0.42 |
| F1 | 43.87 | 32.61 | 61.17 | 0.85 | 29.17 | 32.44 | 67.51 | 0.42 |
| F2 | 43.67 | 32.01 | 63.22 | 0.81 | 28.77 | 32.11 | 68.72 | 0.43 |
| F3 | 45.15 | 32.50 | 61.52 | 0.68 | 30.20 | 32.50 | 67.32 | 0.32 |
| G1 | 37.51 | 31.66 | 64.78 | 0.82 | 28.18 | 31.19 | 71.76 | 0.40 |
| G2 | 38.83 | 31.77 | 64.43 | 0.71 | 29.02 | 31.63 | 70.50 | 0.35 |
| G3 | 38.25 | 32.23 | 62.97 | 0.65 | 29.19 | 31.54 | 70.71 | 0.33 |
| H1 | 37.39 | 31.58 | 65.07 | 0.90 | 28.40 | 31.53 | 70.79 | 0.41 |
| H2 | 38.19 | 31.99 | 63.37 | 0.96 | 28.72 | 31.97 | 69.18 | 0.45 |
| H3 | 34.42 | 31.49 | 65.38 | 0.84 | 28.49 | 31.54 | 70.79 | 0.37 |
| I1 | 40.66 | 32.28 | 62.31 | 0.74 | 29.99 | 32.39 | 67.74 | 0.35 |
| I2 | 41.09 | 32.37 | 62.04 | 0.82 | 29.04 | 32.28 | 68.08 | 0.38 |
| I3 | 39.62 | 32.04 | 63.48 | 0.83 | 29.50 | 31.88 | 69.58 | 0.40 |
| J1 | 41.58 | 32.26 | 62.86 | 0.81 | 29.46 | 31.97 | 69.14 | 0.39 |
| J2 | 38.13 | 31.94 | 63.80 | 0.85 | 30.07 | 32.09 | 68.87 | 0.39 |
| J3 | 39.12 | 31.88 | 63.87 | 0.87 | 29.12 | 32.02 | 69.04 | 0.40 |
| K1 | 40.70 | 32.22 | 62.61 | 0.86 | 29.83 | 32.05 | 68.74 | 0.44 |
| K2 | 38.89 | 32.08 | 63.28 | 0.78 | 29.41 | 31.99 | 69.22 | 0.41 |
| K3 | 36.23 | 31.74 | 64.41 | 0.87 | 28.73 | 31.76 | 69.94 | 0.39 |
| L1 | 37.10 | 32.04 | 63.38 | 0.82 | 29.46 | 32.01 | 69.11 | 0.36 |
| L2 | 35.64 | 31.65 | 64.84 | 0.92 | 29.12 | 31.70 | 70.27 | 0.43 |
| L3 | 41.22 | 32.30 | 62.72 | 0.83 | 30.59 | 32.20 | 68.46 | 0.41 |
References
- Zhang, F.; Qian, H. A comprehensive review of the environmental benefits of urban green spaces. Environ. Res. 2024, 252, 118837. [Google Scholar] [CrossRef]
- Wang, C.; Wang, Z.-H.; Kaloush, K.E.; Shacat, J. Cool pavements for urban heat island mitigation: A synthetic review. Renew. Sustain. Energy Rev. 2021, 146, 111171. [Google Scholar] [CrossRef]
- Buccolieri, R.; Carlo, O.S.; Rivas, E.; Santiago, J.L.; Salizzoni, P.; Siddiqui, M.S. Obstacles influence on existing urban canyon ventilation and air pollutant concentration: A review of potential measures. Build. Environ. 2022, 214, 108905. [Google Scholar] [CrossRef]
- Rajagopal, P.; Priya, R.S.; Senthil, R. A review of recent developments in the impact of environmental measures on urban heat island. Sustain. Cities Soc. 2023, 88, 104279. [Google Scholar] [CrossRef]
- Liu, X.; Liu, J.; Afthanorhan, A.; Hao, Y. Heating up the divide: Climate change and the quest for inclusive growth in urban China. J. Environ. Manag. 2024, 369, 122269. [Google Scholar] [CrossRef]
- Sun, Y.; Zhang, X.; Ren, G.; Zwiers, F.W.; Hu, T. Contribution of urbanization to warming in China. Nat. Clim. Change 2016, 6, 706–709. [Google Scholar] [CrossRef]
- Rezaei, T.; Shen, X.; Chaiyarat, R.; Pumijumnong, N. Effective cooling networks: Optimizing corridors for urban heat island mitigation. Remote Sens. Appl. Soc. Environ. 2024, 36, 101372. [Google Scholar] [CrossRef]
- Mathew, A.; Arunab, K.S.; Sharma, A.K. Revealing the urban heat island: Investigating spatiotemporal surface temperature dynamics, modeling, and interactions with controllable and non-controllable factors. Remote Sens. Appl. Soc. Environ. 2024, 35, 101219. [Google Scholar] [CrossRef]
- Jiang, J.; Pan, W.; Zhang, R.; Hong, Y.; Wang, J. Thermal comfort study of urban waterfront spaces in cold regions: Waterfront skyline control based on thermal comfort objectives. Build. Environ. 2024, 256, 111515. [Google Scholar] [CrossRef]
- Alinasab, N.; Mohammadzadeh, N.; Karimi, A.; Mohammadzadeh, R.; Gál, T. A measurement-based framework integrating machine learning and morphological dynamics for outdoor thermal regulation. Int. J. Biometeorol. 2025, 69, 1645–1662. [Google Scholar] [CrossRef]
- Sun, L.; Xie, C.; Qin, Y.; Zhou, R.; Wu, H.; Che, S. Study on temperature regulation function of green spaces at community scale in high-density urban areas and planning design strategies. Urban For. Urban Green 2024, 101, 128511. [Google Scholar] [CrossRef]
- Fricke, L.; Legg, R.; Kabisch, N. Impact of blue spaces on the urban microclimate in different climate zones, daytimes and seasons—A systematic review. Urban For. Urban Green 2024, 101, 128528. [Google Scholar] [CrossRef]
- Zhou, Y.; Lu, Y.; Zhou, X.; An, J.; Yan, D. Numerical study on the coupling effect of river attributes and riverside building forms on the urban microclimate: A case study in nanjing, China. Sustain. Cities Soc. 2024, 107, 105459. [Google Scholar] [CrossRef]
- Fang, Y.; Zhao, L. Exploring the supply-demand match and drivers of blue-green spaces cooling in wuhan metropolis. Urban Clim. 2024, 58, 102194. [Google Scholar] [CrossRef]
- Lu, Y.; Hu, Y.; He, T.; Yue, W.; Shan, Z.; Chen, Y. How does urban form explain water cooling effect heterogeneity: A case study in wuhan, China. Build. Environ. 2024, 265, 111973. [Google Scholar] [CrossRef]
- Xiao, Y.; Piao, Y.; Pan, C.; Lee, D.; Zhao, B. Using buffer analysis to determine urban park cooling intensity: Five estimation methods for nanjing, China. Sci. Total Environ. 2023, 868, 161463. [Google Scholar] [CrossRef]
- Tan, J.; Kuang, W.; Yu, D.; Zhou, W.; Li, X.; Liu, Q.; He, L. Investigating the cooling effects of land cover and landscape patterns surrounding rivers: Insights from the subtropical city of changsha, China. Urban Clim. 2024, 55, 101975. [Google Scholar] [CrossRef]
- Li, Y.; Feng, Z.; Ma, C.; Yang, T.; Qiao, F.; Kang, P.; Sun, Y.; Wang, L. Intra-annual variations and determinants of canopy layer urban heat island in China using remotely sensed air temperature and apparent temperature. Ecol. Indic. 2024, 166, 112512. [Google Scholar] [CrossRef]
- Xiang, Y.; Zheng, B.; Bedra, K.B.; Ouyang, Q.; Liu, J.; Zheng, J. Spatial and seasonal differences between near surface air temperature and land surface temperature for urban heat island effect assessment. Urban Clim. 2023, 52, 101745. [Google Scholar] [CrossRef]
- Jiang, L.; Liu, S.; Liu, C.; Feng, Y. How do urban spatial patterns influence the river cooling effect? A case study of the huangpu riverfront in shanghai, China. Sustain. Cities Soc. 2021, 69, 102835. [Google Scholar] [CrossRef]
- Wang, Y.; Yin, L.; Dong, Q.; Fei, F.; Yao, W.; Sun, J.; Jiang, Z. From thermal demand characterization to accurate evaluation: Exploring seasonal differences in outdoor thermal comfort of the elderly in China’s communities. Urban Clim. 2024, 58, 102220. [Google Scholar] [CrossRef]
- Jiang, Y.; Li, C.; Li Xiaolin Li Xianghua Song, T.; Liu, Y. Exploring the adaptive spatial patterns and impact factors for the cooling effect of park green spaces in riverfront area. Urban Clim. 2024, 55, 101900. [Google Scholar] [CrossRef]
- Faragallah, R.N.; Ragheb, R.A. Evaluation of thermal comfort and urban heat island through cool paving materials using ENVI-met. Ain Shams Eng. J. 2022, 13, 101609. [Google Scholar] [CrossRef]
- Li, J.; Wang, Y.; Ni, Z.; Chen, S.; Xia, B. An integrated strategy to improve the microclimate regulation of green-blue-grey infrastructures in specific urban forms. J. Clean. Prod. 2020, 271, 122555. [Google Scholar] [CrossRef]
- Wang, Y.; Liu, X.; Xie, R.; Wang, J.; Dong, Q.; Yao, W.; Lin, D. Thermal comfort and urban microclimate response: A new thermal environment assessment model for waterfront spaces in historic ancient towns. Energy Build. 2025, 331, 115393. [Google Scholar] [CrossRef]
- Hathway, E.A.; Sharples, S. The Interaction of Rivers and Urban Form in Mitigating the Urban Heat Island Effect: A UK Case Study. Build. Environ. 2012, 58, 14–22. [Google Scholar] [CrossRef]
- Wang, Y.; Ouyang, W.; Zhan, Q.; Zhang, L. The Cooling Effect of an Urban River and Its Interaction with the Littoral Built Environment in Mitigating Heat Stress: A Mobile Measurement Study. Sustainability 2022, 14, 11700. [Google Scholar] [CrossRef]
- Gao, D.; Li, G.; Li, Y. Government cooperation, market integration, and energy efficiency in urban agglomerations—Based on the quasi-natural experiment of the Yangtze River Delta Urban Economic Coordination Committee. Energy Environ. 2021, 33, 1679–1694. [Google Scholar] [CrossRef]
- Wang, W.; He, J.; Wang, X. Quantitatively comparing the morphological influences on the cool island effect in urban waterfront blue-green spaces across six cities near 30°N. Urban Clim. 2024, 56, 102076. [Google Scholar] [CrossRef]
- Mandjoupa, L.K.; Roman, K.K.; Azam, H.; Denis, M. Analyzing Urban Microclimate (UMC) Parameters and Comprehensive Review of UHI and Air Quality Interconnections. Environments 2025, 12, 104. [Google Scholar] [CrossRef]
- Zhou, X.; Zhang, S.; Zhu, D. Impact of urban water networks on microclimate and PM2.5 distribution in downtown areas: A case study of wuhan. Build. Environ. 2021, 203, 108073. [Google Scholar] [CrossRef]
- Angradi, T.R.; Williams, K.C.; Hoffman, J.C.; Bolgrien, D.W. Goals, beneficiaries, and indicators of waterfront revitalization in Great Lakes Areas of Concern and coastal communities. J. Great Lakes Res. 2019, 45, 851–863. [Google Scholar] [CrossRef]
- Cheung, D.M.-W.; Tang, B.-S. Social order, leisure, or tourist attraction? The changing planning missions for waterfront space in Hong Kong. Habitat Int. 2015, 47, 231–240. [Google Scholar] [CrossRef]
- Kumar, P.; Debele, S.E.; Khalili, S.; Halios, C.H.; Sahani, J.; Aghamohammadi, N.; Andrade Mde, F.; Athanassiadou, M.; Bhui, K.; Calvillo, N.; et al. Urban heat mitigation by green and blue infrastructure: Drivers, effectiveness, and future needs. Innovation 2024, 5, 100588. [Google Scholar] [CrossRef]
- Chen, X. A Globalizing City on the Rise: Shanghai’s Transformation in Comparative Perspective. 2009. Available online: https://www.researchgate.net/publication/280840563_A_Globalizing_City_on_the_Rise_Shanghai (accessed on 7 May 2025).
- Zhu, Y.; Li, Z. “Sharing” as a Critical Framework for Waterfront Heritage Regeneration: A Case Study of Suzhou Creek, Shanghai. Land 2024, 13, 1280. [Google Scholar] [CrossRef]
- Gao, D.; Mo, X.; Xiong, R.; Huang, Z. Tax policy and total factor carbon emission efficiency: Evidence from China’s VAT reform. Int. J. Environ. Res. Public Health 2022, 19, 9257. [Google Scholar] [CrossRef] [PubMed]
- Alderman, D.H. Place, Naming and the Interpretation of Cultural Landscapes. 2008. Available online: https://www.researchgate.net/publication/286121765_Place_Naming_and_the_Interpretation_of_Cultural_Landscapes (accessed on 7 May 2025).
- Che, Y.; Yang, K.; Wu, E. Assessing the Health of an Urban Stream: A Case Study of Suzhou Creek in Shanghai, China. 2012. Available online: https://www.researchgate.net/publication/221737992_Assessing_the_health_of_an_urban_stream_A_case_study_of_Suzhou_Creek_in_Shanghai_China (accessed on 7 May 2025).
- Li, X.; Lin, K.; Cheng, D.; Zou, H.; Shu, Y.; Jin, Z.; Zhu, J. Meteorological effects of ventilation corridor in central urban areas: A case study of wuhan. Sustain. Cities Soc. 2024, 114, 105752. [Google Scholar] [CrossRef]
- Zhang, X.; Liu, Y.; Chen, Y.; Liu, J. Identification and integration of ventilation corridors in shijiazhuang city, China. Sustain. Cities Soc. 2024, 112, 105543. [Google Scholar] [CrossRef]
- Luo, Y.; Wu, Z.; Wong, M.S.; Yang, J.; Jiao, Z. Simulating the impact of ventilation corridors for cooling air temperature in local climate zone scheme. Sustain. Cities Soc. 2024, 115, 105848. [Google Scholar] [CrossRef]
- Chun, C.; Tamura, A. Thermal comfort in urban transitional spaces. Build. Environ. 2005, 40, 633–639. [Google Scholar] [CrossRef]
- Elshaer, I.A.; Sobaih, A.E.E.; Aliedan, M.; Azazz, A.M.S. The effect of green human resource management on environmental performance in small tourism enterprises: Mediating role of pro-environmental behaviors. Sustainability 2021, 13. [Google Scholar] [CrossRef]
- Zhang, L.; Bagan, H.; Chen, C.; Yoshida, T. Exploring the impact of urban morphology on river cooling effects: A case study of the Arakawa River in Tokyo. Ecol. Indic. 2025, 172, 113288. [Google Scholar] [CrossRef]
- Dai, X.; Wang, L.; Tao, M.; Huang, C.; Sun, J.; Wang, S. Assessing the ecological balance between supply and demand of blue-green infrastructure. J. Environ. Manag. 2021, 288, 112454. [Google Scholar] [CrossRef] [PubMed]
- Sheng, S.; Wang, Y. Configuration characteristics of green-blue spaces for efficient cooling in urban environments. Sustain. Cities Soc. 2024, 100, 105040. [Google Scholar] [CrossRef]
- Ying, X.; Gao, J.; Liu, Z.; Qin, X.; Chen, J.; Shen, L.; Han, X. Investigation of pedestrian-level wind environment with skyline quantitative factors. Buildings 2022, 12, 792. [Google Scholar] [CrossRef]
- Liu, Y.; Xuan, C.; Xu, Y.; Fu, N.; Xiong, F.; Gan, L. Local climate effects of urban wind corridors in beijing. Urban Clim. 2022, 43, 101181. [Google Scholar] [CrossRef]
- Su, Y.; Wu, Z.; Gao, W.; Wang, C.; Zhao, Q.; Wang, D.; Li, J. Summer outdoor thermal comfort evaluation of urban open spaces in arid-hot climates. Energy Build. 2024, 321, 114679. [Google Scholar] [CrossRef]
- Jing, W.; Qin, Z.; Mu, T.; Ge, Z.; Dong, Y. Evaluating thermal comfort indices for outdoor spaces on a university campus. Sci. Rep. 2024, 14, 21253. [Google Scholar] [CrossRef]
- Liu, T.; Wang, Y.; Zhang, L.; Xu, N.; Tang, F. Outdoor thermal comfort research and its implications for landscape architecture: A systematic review. Sustainability 2025, 17, 2330. [Google Scholar] [CrossRef]
- Pompei, L.; Nardecchia, F.; Gugliermetti, L.; Cinquepalmi, F. Design of three outdoor combined thermal comfort prediction models based on urban and environmental params. Energy Build. 2024, 306, 113946. [Google Scholar] [CrossRef]
- Vurro, G.; Carlucci, S. Contrasting the features and functionalities of urban microclimate simulation tools. Energy Build. 2024, 311, 114042. [Google Scholar] [CrossRef]
- Liu, M.; Yang, C.; Fan, Z.; Yuan, C. Prediction approach on pedestrian outdoor activity preference under factors of public open space integrated microclimate. Build. Environ. 2023, 244, 110761. [Google Scholar] [CrossRef]
- Huang, X.; Zhang, W.; Li, J.; Niu, Z. Interannual variations in surface urban heat island intensity and associated drivers in China. J. Environ. Manag. 2018, 222, 86–94. Available online: https://www.sciencedirect.com/science/article/pii/S0301479718305498 (accessed on 7 May 2025).
- Salvia, M.; Olazabal, M.; Fokaides, P.A.; Tardieu, L.; Simoes, S.G.; Geneletti, D.; De Gregorio Hurtado, S.; Viguié, V.; Spyridaki, N.-A.; Pietrapertosa, F.; et al. Climate mitigation in the Mediterranean Europe: An assessment of regional and city-level plans. J. Environ. Manag. 2021, 295, 113146. [Google Scholar] [CrossRef] [PubMed]
- Chen, L.; Wen, Y.; Zhang, L.; Xiang, W.-N. Studies of thermal comfort and space use in an urban park square in cool and cold seasons in Shanghai. Build. Environ. 2015, 94, 644–653. [Google Scholar] [CrossRef]
- Okeke, C.A.U.; Uno, J.; Academe, S.; Emenike, P.C.; Tamunoene, K.S.A.; Omole, D.O. An Integrated Assessment of Land Use Impact, Riparian Vegetation and Lithologic Variation on Streambank Stability in a Peri-Urban Watershed (Nigeria). Sci. Rep. 2022, 12, 10989. Available online: https://www.nature.com/articles/s41598-022-15008-w (accessed on 7 May 2025). [CrossRef]
- Mutlu, B.E.; Yılmaz, S. Evaluation of the effect of green areas on thermal comfort in urban areas with microscale ENVI-Met software. In Proceedings of the International Congress Phenomenological Aspects of Civil Engineering (PACE 2021), Erzurum, Türkiye, 20–23 June 2021; Available online: https://avesis.atauni.edu.tr/yayin/db0118cd-a568-4009-a7aa-f07f8524572b/evaluation-of-the-effect-of-green-areas-on-thermal-comfort-in-urban-areas-with-microscale-envi-met-software (accessed on 7 May 2025).
- Bhavsar, Y.G.; Kandya, A. A case study for Ahmedabad City, India using Envi_met model to evaluate the urban climate and thermal sensation in a high-density urban environment. In Integrating Resiliency into Future Sustainable Cities. Advances in Science, Technology & Innovation, Proceedings of the RRAU 2023, Auckland, New Zealand, 20–22 April 2023; Shamout, S., Bradbury, M., Altan, H., Patel, Y., McPherson, P., Eds.; Springer: Cham, Switzerland, 2023; pp. 243–258. [Google Scholar] [CrossRef]
- ter Braak, C.J.F. Redundancy analysis includes analysis of variance-simultaneous component analysis (ASCA) and outperforms its extensions. Chemom. Intell. Lab. Syst. 2023, 240, 104898. [Google Scholar] [CrossRef]
- Huang, J.; Zhang, Y.; Dong, X.; Zhou, X.; Liu, Z.; Chen, Q.; Chen, F.; Shen, Y. Insights into the process of fish diversity pattern changes and the current status of spatiotemporal dynamics in the Three Gorges Reservoir Area using eDNA. Fishes 2025, 10, 295. [Google Scholar] [CrossRef]
- Legendre, P.; Gallagher, E.D. Ecologically meaningful transformations for ordination of species data. Oecologia 2001, 129, 271–280. [Google Scholar] [CrossRef]
- Han, D.; An, H.; Wang, F.; Xu, X.; Qiao, Z.; Wang, M.; Sui, X.; Liang, S.; Hou, X.; Cai, H.; et al. Understanding seasonal contributions of urban morphology to thermal environment based on boosted regression tree approach. Build. Environ. 2022, 226, 109770. [Google Scholar] [CrossRef]
- Zhao, Z.; Li, H.; Wang, S. Machine learning-based surrogate models for fast impact assessment of a new building on urban local microclimate at design stage. Build. Environ. 2024, 266, 112142. [Google Scholar] [CrossRef]
- Elith, J.; Leathwick, J.R.; Hastie, T. A working guide to boosted regression trees. J. Anim. Ecol. 2008, 77, 802–813. [Google Scholar] [CrossRef] [PubMed]
- Tanoori, G.; Soltani, A.; Modiri, A. Machine learning for urban heat island (UHI) analysis: Predicting land surface temperature (LST) in urban environments. Urban Clim. 2024, 55, 101962. [Google Scholar] [CrossRef]
- Gai, Z.; Yin, H.; Kong, F.; Su, J.; Shen, Z.; Sun, H.; Yang, S.; Liu, H.; Middel, A. How does shade infrastructure affect outdoor thermal comfort during hot, humid summers? Evidence from Nanjing, China. Build. Environ. 2025, 267, 112320. [Google Scholar] [CrossRef]
- Wang, R.; Lu, S.; Feng, W. A three-stage optimization methodology for envelope design of passive house considering energy demand, thermal comfort and cost. Energy 2020, 192, 116723. [Google Scholar] [CrossRef]
- Zeng, H.; Liu, H.; Wang, J.; Zhu, Y.; Wang, H.; Zhu, Z.; Wang, C.; Sun, Z. Characteristics and influencing factors of taxonomic and functional diversity of butterflies in urban green spaces. Urban Urban Green 2025, 104, 128662. [Google Scholar] [CrossRef]
- Qi, X.; Chen, J.; Wang, J.; Liu, H.; Ding, B. The impact of urbanization on the alleviation of energy poverty: Evidence from China. Cities 2024, 151, 105130. [Google Scholar] [CrossRef]
- Sharmin, T.; Steemers, K.; Humphreys, M. Outdoor thermal comfort and summer PET range: A field study in tropical city Dhaka. Energy Build. 2019, 198, 149–159. [Google Scholar] [CrossRef]
- Gunawardena, K.R.; Wells, M.J.; Kershaw, T. Utilising green and bluespace to mitigate urban heat island intensity. Sci. Total Environ. 2017, 584–585, 1040–1055. [Google Scholar] [CrossRef]
- Voskamp, I.M.; Van de Ven, F.H.M. Planning support system for climate adaptation: Composing effective sets of blue-green measures to reduce urban vulnerability to extreme weather events. Build. Environ. 2015, 83, 159–167. [Google Scholar] [CrossRef]
- Liu, X.; Zhu, Z.; Jin, L.; Wang, L.; Huang, C. Measuring patterns and mechanism of greenway use—A case from guangzhou, China. Urban For. Urban Green 2018, 34, 55–63. [Google Scholar] [CrossRef]
- Guan, S.; Zhang, X.; Zhang, T.; Hu, H. Considering the supply and demand of urban heat island mitigation: A study on the construction of “source-flow-sink” cooling corridor network of blue and green landscape. Ecol. Indic. 2025, 174, 113448. [Google Scholar] [CrossRef]
- Cuce, P.M.; Cuce, E.; Santamouris, M. Towards sustainable and climate-resilient cities: Mitigating urban heat islands through green infrastructure. Sustainability 2025, 17, 1303. [Google Scholar] [CrossRef]
- Orak, N.H.; Smail, L. A Bayesian network model to integrate blue-green and gray infrastructure systems for different urban conditions. J. Environ. Manag. 2025, 375, 124293. [Google Scholar] [CrossRef]
- Abd-Elmabod, S.K.; Gui, D.; Liu, Q.; Liu, Y.; Al-Qthanin, R.N.; Jiménez-González, M.A.; Jones, L. Seasonal environmental cooling benefits of urban green and blue spaces in arid regions. Sustain. Cities Soc. 2024, 115, 105805. [Google Scholar] [CrossRef]
- Wu, Q.; Huang, Y.; Irga, P.; Kumar, P.; Li, W.; Wei, W.; Shon, H.K.; Lei, C.; Zhou, J.L. Synergistic control of urban heat island and urban pollution island effects using green infrastructure. J. Environ. Manag. 2024, 370, 122985. [Google Scholar] [CrossRef]
- Huang, R.; Hou, H.; Li, J.; Estoque, R.C.; Murayama, Y.; Chen, L.; Zhang, X.; Hu, T. Investigating the cooling effect of urban lakes from the perspective of their characteristics and surrounding landscapes: A case study of 82 urban lakes in China. Sci. Total Environ. 2025, 969, 178925. [Google Scholar] [CrossRef]
- He, J.; Tang, Y.; Guo, X.; Chen, H.; Guo, W.; Sun, Y. Assessment of coupling coordination and spatial distribution characteristics between urbanization and ecosystem health in the Yellow River basin. Land Use Policy 2025, 154, 107572. [Google Scholar] [CrossRef]
- Yin, M.; He, B.-J. Performance-based urban ventilation corridor for actual achievement of environmental benefits. Build. Environ. 2025, 270, 112536. [Google Scholar] [CrossRef]
- Han, L.; Zhao, J.; Zhang, T.; Zhang, J. Urban ventilation corridors exacerbate air pollution in central urban areas: Evidence from a Chinese city. Sustain. Cities Soc. 2022, 87, 104129. [Google Scholar] [CrossRef]
- Ren, C.; Yang, R.; Cheng, C.; Xing, P.; Fang, X.; Zhang, S.; Wang, H.; Shi, Y.; Zhang, X.; Kwok, Y.T.; et al. Creating breathing cities by adopting urban ventilation assessment and wind corridor plan—The implementation in Chinese cities. J. Wind. Eng. Ind. Aerodyn. 2018, 182, 170–188. [Google Scholar] [CrossRef]
- Liu, X.; Huang, B.; Li, R.; Zhang, J.; Gou, Q.; Zhou, T.; Huang, Z. Wind environment assessment and planning of urban natural ventilation corridors using GIS: Shenzhen as a case study. Urban Clim. 2022, 42, 101091. [Google Scholar] [CrossRef]
- Jiang, Y.; Huang, J.; Shi, T.; Wang, H. Interaction of urban rivers and green space morphology to mitigate the urban heat island effect: Case-based comparative analysis. Int. J. Environ. Res. Public Health 2021, 18, 11404. [Google Scholar] [CrossRef]
- Manteghi, G.; Lamit, H.; Shukri, S.M. Street Geometry and River Width as Design Factors to Improve Thermal Comfort in Melaka City. Available online: https://www.researchgate.net/publication/336253142_Street_Geometry_and_River_Width_as_Design_Factors_to_Improve_Thermal_Comfort_in_Melaka_City (accessed on 4 June 2025).
- Mun, D.; Kang, G.; Yang, M.; Kim, J. How trees’ drag and cooling effects influence airflow and temperature distributions around a street canyon. Build. Environ. 2024, 264, 111913. [Google Scholar] [CrossRef]
- Su, W.; Zhang, W.; Chang, Q. Tailored green and blue infrastructure for heat mitigation under renewal planning of urban blocks in Beijing. Sci. Total Environ. 2025, 967, 178759. [Google Scholar] [CrossRef]
- Marquez-Torres, A.; Kumar, S.; Aznarez, C.; Jenerette, G.D. Assessing the cooling potential of green and blue infrastructure from twelve US cities with contrasting climate conditions. Urban For. Urban Green 2025, 104, 128660. [Google Scholar] [CrossRef]
- Dashti, A.; Mohammadsharifi, N.; Shokuhi, M.; Matzarakis, A. A comprehensive study on wintertime outdoor thermal comfort of blue-green infrastructure in an arid climate: A case of isfahan, iran. Sustain. Cities Soc. 2024, 113, 105658. [Google Scholar] [CrossRef]
- Jiang, Y.; Huang, J.; Shi, T.; Li, X. Cooling island effect of blue-green corridors: Quantitative comparison of morphological impacts. Int. J. Environ. Res. Public Health 2021, 18, 11917. [Google Scholar] [CrossRef] [PubMed]
- Barghchi, M.; Grace, B.; Edwards, N.; Bolleter, J.; Hooper, P. Park thermal comfort and cooling mechanisms in present and future climate scenarios. Urban For. Urban Green 2024, 101, 128533. [Google Scholar] [CrossRef]
- Xiong, Y.; Zhang, J.; Xu, X.; Yan, Y.; Sun, S.; Liu, S. Strategies for improving the microclimate and thermal comfort of a classical Chinese garden in the hot-summer and cold-winter zone. Energy Build. 2020, 215, 109914. [Google Scholar] [CrossRef]
- Armson, D.; Stringer, P.; Ennos, A.R. The effect of tree shade and grass on surface and globe temperatures in an urban area. Urban For. Urban Green 2012, 11, 245–255. [Google Scholar] [CrossRef]
- Murugadoss, D.; Singh, H.; Thakur, P. Urban forests and microclimate regulation. In Urban Forests and Microclimate Regulation; Springer: Cham, Switzerland, 2025. [Google Scholar]
- Fan, X.; Ge, M.; Tan, W.; Li, Q. Impacts of coexisting buildings and trees on the performance of rooftop wind turbines: An idealized numerical study. Renew. Energy 2021, 177, 164–180. [Google Scholar] [CrossRef]
- Chen, C.; Wang, J.; Zhang, H.; Xu, X.; Hinkle, L.E.; Chao, X.; Shi, Q. Dual impacts of solar-reflective façades in high-density urban areas on building energy use and outdoor thermal environments. Energy Build. 2024, 324, 114926. [Google Scholar] [CrossRef]
- Tudor, E.M.; Kristak, L.; Barbu, M.C.; Gergeľ, T.; Němec, M.; Kain, G.; Réh, R. Acoustic properties of larch bark panels. Forests 2021, 12, 887. [Google Scholar] [CrossRef]
- Vos, E.E.; de Bruin, S.R.; van der Beek, A.J.; Proper, K.I. It’s like juggling, constantly trying to keep all balls in the air: A qualitative study of the support needs of working caregivers taking care of older adults. Int. J. Environ. Res. Public Health 2021, 18, 5701. [Google Scholar] [CrossRef] [PubMed]
- Liu, L.; Wu, J.; Liang, Z.; Gao, J.; Hang, J.; Liu, J.; Liu, L. Spatio-temporal analysis of local thermal environment in waterfront blocks along the both sides of pearl river in guangzhou, China. Case Stud. Therm. Eng. 2024, 53, 103875. [Google Scholar] [CrossRef]
- Li, W.; Mak, C.M.; Fu, Y.; Cai, C.; Tse, K.T.; Niu, J.; Wong, S.H.Y. Pedestrian-level wind environment surrounding two tandem non-identical height elevated buildings under the influence of twisted wind flows. Sustain. Cities Soc. 2024, 112, 105641. [Google Scholar] [CrossRef]
- Wang, Y.; Qi, M.; Lu, Y. A parametric study of urban ventilation corridors for improving air quality in compact cities. J. Clean. Prod. 2025, 500, 145219. [Google Scholar] [CrossRef]
- Tsang, C.W.; Kwok, K.C.S.; Hitchcock, P.A. Wind tunnel study of pedestrian level wind environment around tall buildings: Effects of building dimensions, separation and podium. Build. Environ. 2012, 49, 167–181. [Google Scholar] [CrossRef]
- Tang, G.; Du, X.; Wang, S. Impact mechanisms of 2D and 3D spatial morphologies on urban thermal environment in high-density urban blocks: A case study of Beijing’s core area. Sustain. Cities Soc. 2025, 123, 106285. [Google Scholar] [CrossRef]
- Qiu, X.; Kil, S.-H.; Jo, H.-K.; Park, C.; Song, W.; Choi, Y.E. Cooling effect of urban blue and green spaces: A case study of Changsha, China. Int. J. Environ. Res. Public Health 2023, 20, 2613. [Google Scholar] [CrossRef] [PubMed]
- Shi, Y.; Zheng, Y.; Chen, D.; Yang, J.; Cao, Y.; Cui, A. Research on the correlation between the dynamic distribution patterns of urban population density and land use morphology based on human–land big data: A case study of the Shanghai central urban area. Land 2024, 13, 1547. [Google Scholar] [CrossRef]
- Almaaitah, T.; Appleby, M.; Rosenblat, H.; Drake, J.; Joksimovic, D. The potential of blue-green infrastructure as a climate change adaptation strategy: A systematic literature review. Blue-Green Syst. 2021, 3, 223–248. [Google Scholar] [CrossRef]
- Zhou, W.; Wu, T.; Tao, X. Exploring the spatial and seasonal heterogeneity of cooling effect of an urban river on a landscape scale. Sci. Rep. 2024, 14, 8327. [Google Scholar] [CrossRef]
- Xu, Y.; Tian, L.; Cui, T.; Zhang, J.; Zhang, H.; Wang, Y.; Wang, R. Spatiotemporal characteristics of universal thermal climate index during five-year return period extreme heat events in the Beijing–Tianjin–Hebei region. Atmos. Ocean. Sci. Lett. 2025, 18, 100612. [Google Scholar] [CrossRef]
- Karimi, A.; Mohammad, P.; Gachkar, S.; Gachkar, D.; García-Martínez, A.; Moreno-Rangel, D.; Brown, R.D. Surface urban heat island assessment of a cold desert city: A case study over the Isfahan metropolitan area of Iran. Atmosphere 2021, 12, 1368. [Google Scholar] [CrossRef]


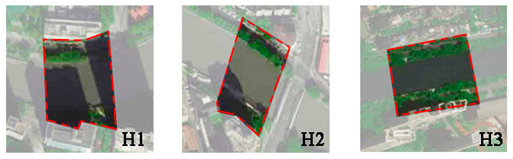
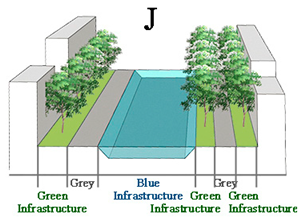
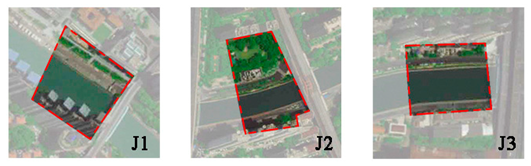
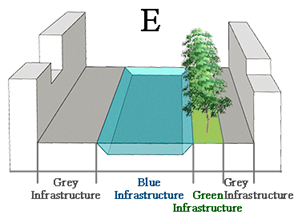
| Composite Feature Type | Research Sample | Composite Feature Type | Research Sample |
|---|---|---|---|
 |  |  |  |
 |  |  |  |
 |  |  |  |
 |  |  |  |
 |  |  | 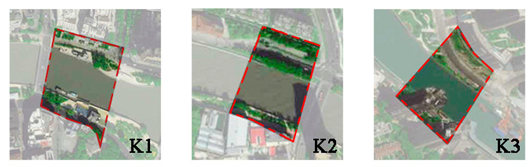 |
 | 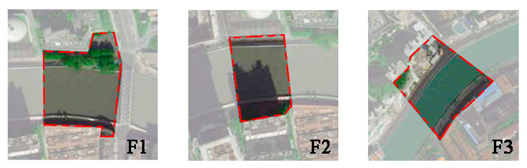 |  |  |
| Indicator Name | Meaning of the Indicator | Formula | Description of Calculations | |
|---|---|---|---|---|
| Blue infrastructure | River cross-section width (BU1) | Width of water bodies in spatial units | BU1 = Ai/L | Ai is the area of the water body in square i (m2); L is the length of the water body in square i (m) |
| Direction of flow (BU2) | A description of the plot orientation of the green space, reflecting in particular the influence of the orientation of the linear waterfront green space corridor on microclimatic effects | —— | Category variables: 1 = Southeast; 2 = East; 3 = South; 4 = Northeast | |
| Percentage of blue infrastructure (BU3) | Percentage of blue infrastructure in cell area | BU3 = Ai/A | Ai is the total area of blue infrastructure in sample i (m2); A is the total area of sample i (m2) | |
| Green infrastructure | Percentage of green infrastructure (GN1) | As a simple indicator of the complexity of the overall shape, the perim-to-area ratio is smallest when the shape is a circle; the longer the strip, the greater the perim-to-area ratio | GN1 = Ci/Si | Ci is the perim of the green infrastructure and Ai is the area of the green infrastructure (m2) |
| Green infrastructure fragmentation (GN2) | The degree of fragmentation of the landscape, reflecting the complexity of the spatial structure of the landscape and, to some extent, the degree of human intervention in the landscape | GN2 = Ni/Ai | Ni is the number of green infrastructure patches (nos.) in sample i and Ai is the total area of green infrastructure in sample i (m2) | |
| Tree closure (GN3) | Ratio of tree cover to total green area | GN3 = Ai/A | Ai is the total area of tree cover in sample i (m2); A is the total area of green infrastructure in sample i (m2) | |
| Tree coverage (GN4) | Ratio of the area covered by trees to the total area of the unit | GN4 = Ai/A | Ai is the total area covered by trees in sample i (m2); A is the total area of sample i (m2) | |
| Gray infrastructure | Percentage of gray infrastructure (GY1) | Percentage of gray infrastructure in cell area | GY1 = Ai/A | Ai is the total area of green infrastructure in sample i (m2); A is the total area of study sample i (m2) |
| Impervious paving coverage (GY2) | Percentage of asphalt paved area | GY2 = Ai/A | Ai is the total area of impervious paving in sample square i (m2); A is the total area of study sample square i (m2) | |
| Building interface continuity (GY3) | Openness of streets; the higher the ratio, the tidier the streets | GY3 = B/L × 100% | B is the length of the building elevation line (m); L is the length of the building control line (m) | |
| Valley width-to-height ratio (GY4) | A param used to distinguish between wide river valleys and deep canyons | GY4 = 2 Vfw/[(Eld − Esc) + (Erd − Esc)] | Vfw is the width of the valley floor, Esc is the elevation value of the valley floor, and Eld and Erd are the left and right watersheds of the valley, respectively | |
| Average building height (GY5) | Average height of the first row of buildings in the river valley area | GY5 = (∑Ai + ∑Bx)/2 | Ai is the height (m) of the first row of building i in the sample square; Bx is the height (m) of the first row of building x on the other side of the sample square | |
| Building undulation (GY6) | The difference between the tallest and lowest building patches, indicating the extent to which building patches within a given area differ in height | GY6 = (Amax − Amin) − (Bmax − Bmin)/2 | Amax is the maximum height of the first row of buildings on one side of the sample (m); Amin is the minimum height of the first row of buildings on one side of the sample (m); Bmax is the maximum height of the first row of buildings on the other side of the sample (m); Bmin is the minimum height of the first row of buildings on the other side of the sample (m) | |
| Building spacing on both sides of the river (GY7) | Distance between buildings in the first row of the river valley area | —— | —— | |
| Building staggering (GY8) | Expressed as the ratio of the standard deviation of building patch heights to the average patch height; this can reflect the degree of variation in building landscape heights within a given range, i.e., the higher the value, the more pronounced the building height gradient | GY8 = √(1/n∑(Hi − H−))/H− | Hi is the height (m) of building i in the sample square; n is the sum of the number of buildings on both banks (n) | |
| Highest building index (GY9) | Expressed as the ratio of the height of the highest point in a building patch to the total height of the landscape, which is used to reflect the height characteristics and spatial congestion of the core building landscape within a given area | GY9 = Hmax/∑Hi | Hmax is the height of the tallest building in the sample (m); Hi is the height of building i in the sample (m) | |
| Blue–green–gray infrastructure | Green infrastructure to water distance (BUGN1) | Vertical average distance from near-water green infrastructure to watershed | —— | —— |
| Percentage of gray–green infrastructure (GYGN1) | Measures the total percentage of gray and green infrastructure in the spatial unit | GYGN1 = (ai + bi)/Ai | ai is the area of gray infrastructure in sample i (m2); bi is the area of green infrastructure in sample i (m2); Ai is the area of gray–green infrastructure in sample i (m2) | |
| Control Group | Experimental Group | |
|---|---|---|
| 5% | 10% | |
| A1 | / | / |
| A2 | / | / |
| A3 | / | / |
| B1 | / | / |
| B2 | / | / |
| B3 | / | / |
| C1 | C1_05 | C1_10 |
| C2 | C2_05 | / |
| C3 | C3_05 | / |
| D1 | D1_05 | D1_10 |
| D2 | D2_05 | / |
| D3 | D3_05 | / |
| E1 | E1_05 | / |
| E2 | E2_05 | / |
| E3 | E3_05 | / |
| F1 | F1_05 | / |
| F2 | F2_05 | / |
| F3 | F3_05 | F3_10 |
| G1 | G1_05 | G1_10 |
| G2 | G2_05 | / |
| G3 | G3_05 | G3_10 |
| H1 | H1_05 | H1_10 |
| H2 | H2_05 | H2_10 |
| H3 | H3_05 | / |
| I1 | I1_05 | / |
| I2 | I2_05 | I2_10 |
| I3 | I3_05 | / |
| J1 | J1_05 | / |
| J2 | J2_05 | / |
| J3 | J3_05 | / |
| K1 | K1_05 | K1_10 |
| K2 | K2_05 | K2_10 |
| K3 | K3_05 | / |
| L1 | L1_05 | L1_10 |
| L2 | L2_05 | / |
| L3 | L3_05 | / |
| Configuration Indicator | VIF Value | Tolerance Value | |
|---|---|---|---|
| Blue infrastructure | BU1 | 1.917 | 0.522 |
| BU2 | 2.081 | 0.481 | |
| BU3 | 9.997 | 0.183 | |
| Green infrastructure | GN1 | 4.191 | 0.239 |
| GN2 | 9.018 | 0.111 | |
| GN3 | 9.116 | 0.11 | |
| GN4 | 9.707 | 0.173 | |
| Gray infrastructure | GY1 | 8.925 | 0.112 |
| GY2 | 4.052 | 0.247 | |
| GY3 | 1.916 | 0.522 | |
| GY5 | 4.743 | 0.211 | |
| GY6 | 2.483 | 0.403 | |
| GY7 | 7.01 | 0.143 | |
| GY8 | 2.255 | 0.443 | |
| GY9 | 2.064 | 0.484 | |
| GY4 | 4.195 | 0.238 | |
| Blue-green-gray infrastructure | BUGN1 | 1.529 | 0.654 |
| GNGY1 | 1.723 | 0.58 | |
| Name | Explains | F | P |
|---|---|---|---|
| GY1 | 34.8 | 40 | 0.002 |
| BU2 | 8.9 | 11.6 | 0.002 |
| BU3 | 2.9 | 4.6 | 0.014 |
| BUGN1 | 2.8 | 3.9 | 0.016 |
| GY5 | 2.5 | 3.5 | 0.024 |
| GY6 | 1.9 | 2.7 | 0.058 |
| BU1 | 1.7 | 2.5 | 0.07 |
| GY2 | 1.4 | 2.1 | 0.112 |
| GY7 | 1.1 | 1.7 | 0.12 |
| GY4 | 1 | 1.7 | 0.148 |
| GNGY1 | 0.7 | 1.1 | 0.24 |
| GY3 | 0.7 | 1.1 | 0.304 |
| GN4 | 0.7 | 1.1 | 0.352 |
| GN1 | 0.5 | 0.7 | 0.434 |
| GY8 | 0.4 | 0.6 | 0.572 |
| GN3 | 0.4 | 0.7 | 0.388 |
| GY9 | 0.4 | 0.6 | 0.566 |
| GN2 | <0.1 | <0.1 | 0.982 |
Disclaimer/Publisher’s Note: The statements, opinions and data contained in all publications are solely those of the individual author(s) and contributor(s) and not of MDPI and/or the editor(s). MDPI and/or the editor(s) disclaim responsibility for any injury to people or property resulting from any ideas, methods, instructions or products referred to in the content. |
© 2025 by the authors. Licensee MDPI, Basel, Switzerland. This article is an open access article distributed under the terms and conditions of the Creative Commons Attribution (CC BY) license (https://creativecommons.org/licenses/by/4.0/).
Share and Cite
Wang, M.; Su, Y.; Wang, J. How to Improve Blue–Green–Gray Infrastructure to Optimize River Cooling Island Effect on Riparian Zone for Outdoor Activities in Summer. Land 2025, 14, 1330. https://doi.org/10.3390/land14071330
Wang M, Su Y, Wang J. How to Improve Blue–Green–Gray Infrastructure to Optimize River Cooling Island Effect on Riparian Zone for Outdoor Activities in Summer. Land. 2025; 14(7):1330. https://doi.org/10.3390/land14071330
Chicago/Turabian StyleWang, Min, Yuqing Su, and Jieqiong Wang. 2025. "How to Improve Blue–Green–Gray Infrastructure to Optimize River Cooling Island Effect on Riparian Zone for Outdoor Activities in Summer" Land 14, no. 7: 1330. https://doi.org/10.3390/land14071330
APA StyleWang, M., Su, Y., & Wang, J. (2025). How to Improve Blue–Green–Gray Infrastructure to Optimize River Cooling Island Effect on Riparian Zone for Outdoor Activities in Summer. Land, 14(7), 1330. https://doi.org/10.3390/land14071330