Article

Assessment of Urban Flood Resilience Under a Novel Framework and Method: A Case Study of the Taihu Lake Basin

1
The National Key Laboratory of Water Disaster Prevention, Nanjing Hydraulic Research Institute, Nanjing 210029, China
2
Hydrological Bureau (Information Center), Huaihe River Water Resources Commission, Bengbu 233001, China
3
Jiangsu Province Hydrology and Water Resources Investigation Bureau (Suzhou Branch), Suzhou 215006, China
*
Authors to whom correspondence should be addressed.
Land 2025, 14(7), 1328; https://doi.org/10.3390/land14071328
Submission received: 19 May 2025 / Revised: 9 June 2025 / Accepted: 21 June 2025 / Published: 22 June 2025
(This article belongs to the Special Issue Building Resilient and Sustainable Urban Futures)

Abstract

Urban flooding poses escalating threats to socioeconomic stability and human safety, exacerbated by urbanization and climate change. While urban flood resilience (UFR) has emerged as a critical framework for flood risk management, existing studies often overlook the systemic integration of post-disaster recovery capacity and multidimensional interactions in UFR assessment. This study develops a novel hazard–vulnerability–exposure–defense capacity–recovery capacity (HVEDR) framework to address research gaps. We employ a hybrid game theory combined weight method (GTCWM)-TOPSIS approach to evaluate UFR in China’s Taihu Lake Basin (TLB), a region highly vulnerable to monsoon- and typhoon-driven floods. Spanning 1999–2020, the analysis reveals three key insights: (1) weight allocation via GTCWM identifies defense capacity (0.224) and hazard (0.224) as dominant dimensions, with drainage pipeline density (0.091), flood-season precipitation (0.087), and medical capacity (0.085) ranking as the top three weighted indicators; (2) temporal trends show an overall upward trajectory in UFR, interrupted by a sharp decline in 2011 due to extreme hazard events, with Shanghai and Hangzhou exhibiting the highest UFR levels, contrasting Zhenjiang’s persistently low UFR; (3) spatial patterns reveal stronger UFR in southern and eastern areas and weaker resilience in northern and western regions. The proposed HVEDR framework and findings provide valuable insights for UFR assessments in other flood-prone basins and regions globally.

1. Introduction

Urban flooding is one of the most widespread and destructive natural disasters, causing significant socioeconomic losses in many cities worldwide over the past few decades and posing a serious threat to human health and safety [1,2,3]. Even more concerning is that urbanization and climate change are expected to exacerbate the scale and intensity of urban flooding [4,5]. The increasing risk of urban flooding poses new challenges for city managers in flood prevention and hinders the sustainable development of urban ecosystems [6]. These negative impacts have led to the adoption of sustainable stormwater management strategies worldwide [7,8]. Among these, the concept of resilience offers new perspectives and innovative approaches for managing urban flood disasters. Resilience provides a practical framework to prevent and mitigate the impacts of various disasters faced by modern cities [9].
The concept of “resilience” originates from the fields of physics and mechanics, where it refers to the property of a material to return to its original state after undergoing elastic deformation [10]. In the 1950s, the term “resilience” began to be used in psychology and gained popularity in the late 1980s to describe recovery from psychological trauma [11]. In 1973, Canadian biologist Holling summarized and defined resilience in the context of ecosystems, introducing the concept into the ecological domain to describe an ecosystem’s ability to maintain or restore its original functions after being disturbed [12]. Since then, resilience has been widely applied across various disciplines [13,14,15]. When applied to the field of urban flood disasters, the concept of urban flood resilience (UFR) naturally emerges [13,16,17,18,19,20,21].
UFR refers to the capacity of urban systems to withstand the impacts of flood disasters through a combination of engineering and non-engineering measures, enabling continuous operation, minimizing the extent and duration of destructive events, and restoring normal functioning after disasters [22]. Among these, recovery capacity is a key consideration in UFR. Current research on UFR primarily focuses on framework construction, quantitative assessment, and influencing factors. Many scholars analyze the pressure, state, and response processes of urban flood systems based on the pressure–state–response (PSR) framework and use this to build flood resilience assessment systems [23,24]. For instance, Xiao et al. [25] developed a multidimensional and multiprocess indicator system within the PSR framework to measure UFR levels. In terms of resilience assessment, commonly used methods include the composite index method, machine learning, GIS-based analysis, and functional modeling approaches. Examples of recent studies include Liang et al. [26], which combined the analytic hierarchy process (AHP) and the entropy weighting method (EWM) to evaluate and analyze the spatial–temporal evolution of UFR in Nanjing from 2015 to 2020. Zhu et al. [27] utilized the Geodetector model to analyze the spatial–temporal evolution characteristics and driving factors of UFR in the Yangtze River Delta. Xu et al. [28] proposed a method for quantifying the resilience value of urban floods based on the “4R” theory of resilience by coupling urban rainfall and flood models to simulate urban floods. Wang et al. [19] proposed the Cellular Automata Dual-DraInagE Simulation (CADDIES) model based on two-dimensional cellular automata to simulate flood risk during storm events and proposed a method for evaluating the flood recovery capability of high-resolution grid cells. Zhang et al. [21] identified a flood resilience assessment method that quantifies infrastructure and environmental vulnerability using GIS and quantifies social and economic recoverability using the technique for order preference by similarity to ideal solution (TOPSIS).
The composite index method remains the main approach for resilience assessment [27,29]. The comprehensive index method remains the primary approach for resilience assessment. However, most existing studies utilize the PSR framework and rarely consider the impact of urban systems’ recovery capacity on UFR. Alternatively, they calculate UFR merely through mathematical combinations of sub-dimensions such as social and economic aspects [30,31]. In fact, the assessment of UFR requires a comprehensive consideration of disaster-causing factors, vulnerable elements, protective measures, and post-disaster recovery. It must encompass various aspects, including social, economic, infrastructure, community, and environmental factors [32]. Therefore, it is essential to establish a holistic, systematic framework that incorporates post-disaster recovery to evaluate UFR effectively.
The Taihu Lake Basin (TLB), located in the core region of the Yangtze River Delta, is one of the most economically developed areas in China. The basin is influenced by the East Asian monsoon, typhoons, and local strong convective weather, making the flood season prone to heavy rainfall and frequent historical flood disasters [24,33]. Additionally, under the combined effects of urban development and climate change, cities in the TLB face severe threats from flood disasters, which have significant impacts on economic and social development. There is an urgent need to measure the UFR and explore strategies for responding to flood disasters. Therefore, this study focuses on cities in the TLB, which are highly representative, and has high theoretical and practical value for studying the measurement and enhancement of UFR.
Building on this foundation, this study establishes a UFR assessment framework structured around five dimensions—hazard, vulnerability, exposure, defense capacity, and recovery capacity (HVEDR)—to evaluate major cities within the TLB. The objectives are to (1) explore the spatiotemporal patterns of UFR, (2) identify its dominant influencing factors, and (3) determine critical pathways for resilience enhancement. The findings will provide policymakers with targeted and actionable recommendations to inform urban flood management strategies, ensuring their alignment with local risk profiles and resource constraints.
This study first constructs a UFR assessment framework encompassing hazard, vulnerability, exposure, defense capacity, and recovery capacity. Based on this framework, 32 indicators were preliminarily selected, and redundancy was reduced through independence testing to finalize the UFR evaluation indicator system. The game theory combined weight method (GTCWM) was applied to determine integrated weighting coefficients combining the AHP and EWM. These weights were then used with the TOPSIS method to calculate UFR values for individual cities. The results were analyzed to uncover spatiotemporal evolution patterns of UFR. Finally, targeted recommendations for improving UFR were proposed based on the five criteria layers and critical indicators. The evaluation framework is shown in Figure 1.

2. Data and Methodology

2.1. Study Area

The TLB is located in the eastern part of the Yangtze River Delta in China, between 30 °N to 32.5 °N latitude and 119 °E to 122 °E longitude. Covering an area of 36,895 square kilometers, the basin features relatively flat terrain and is a typical plain river network region in China, with plains accounting for approximately 80% of the total basin area [33]. With rapid socioeconomic development, the basin has gradually evolved into a world-class urban cluster centered around the megacity of Shanghai. It stands as one of China’s most densely populated, industrially concentrated, economically developed, and highly urbanized regions. Despite occupying only 0.4% of the nation’s land area, it supports 4.8% of the population and generates 10% of the national GDP, with an urbanization rate reaching 85%. However, frequent flood disasters have emerged as a critical constraint on the sustainable socioeconomic development of the TLB [24]. The basin primarily encompasses eight cities: Shanghai; Suzhou, Wuxi, Changzhou, and Zhenjiang in Jiangsu Province; and Hangzhou, Huzhou, and Jiaxing in Zhejiang Province (Figure 2).

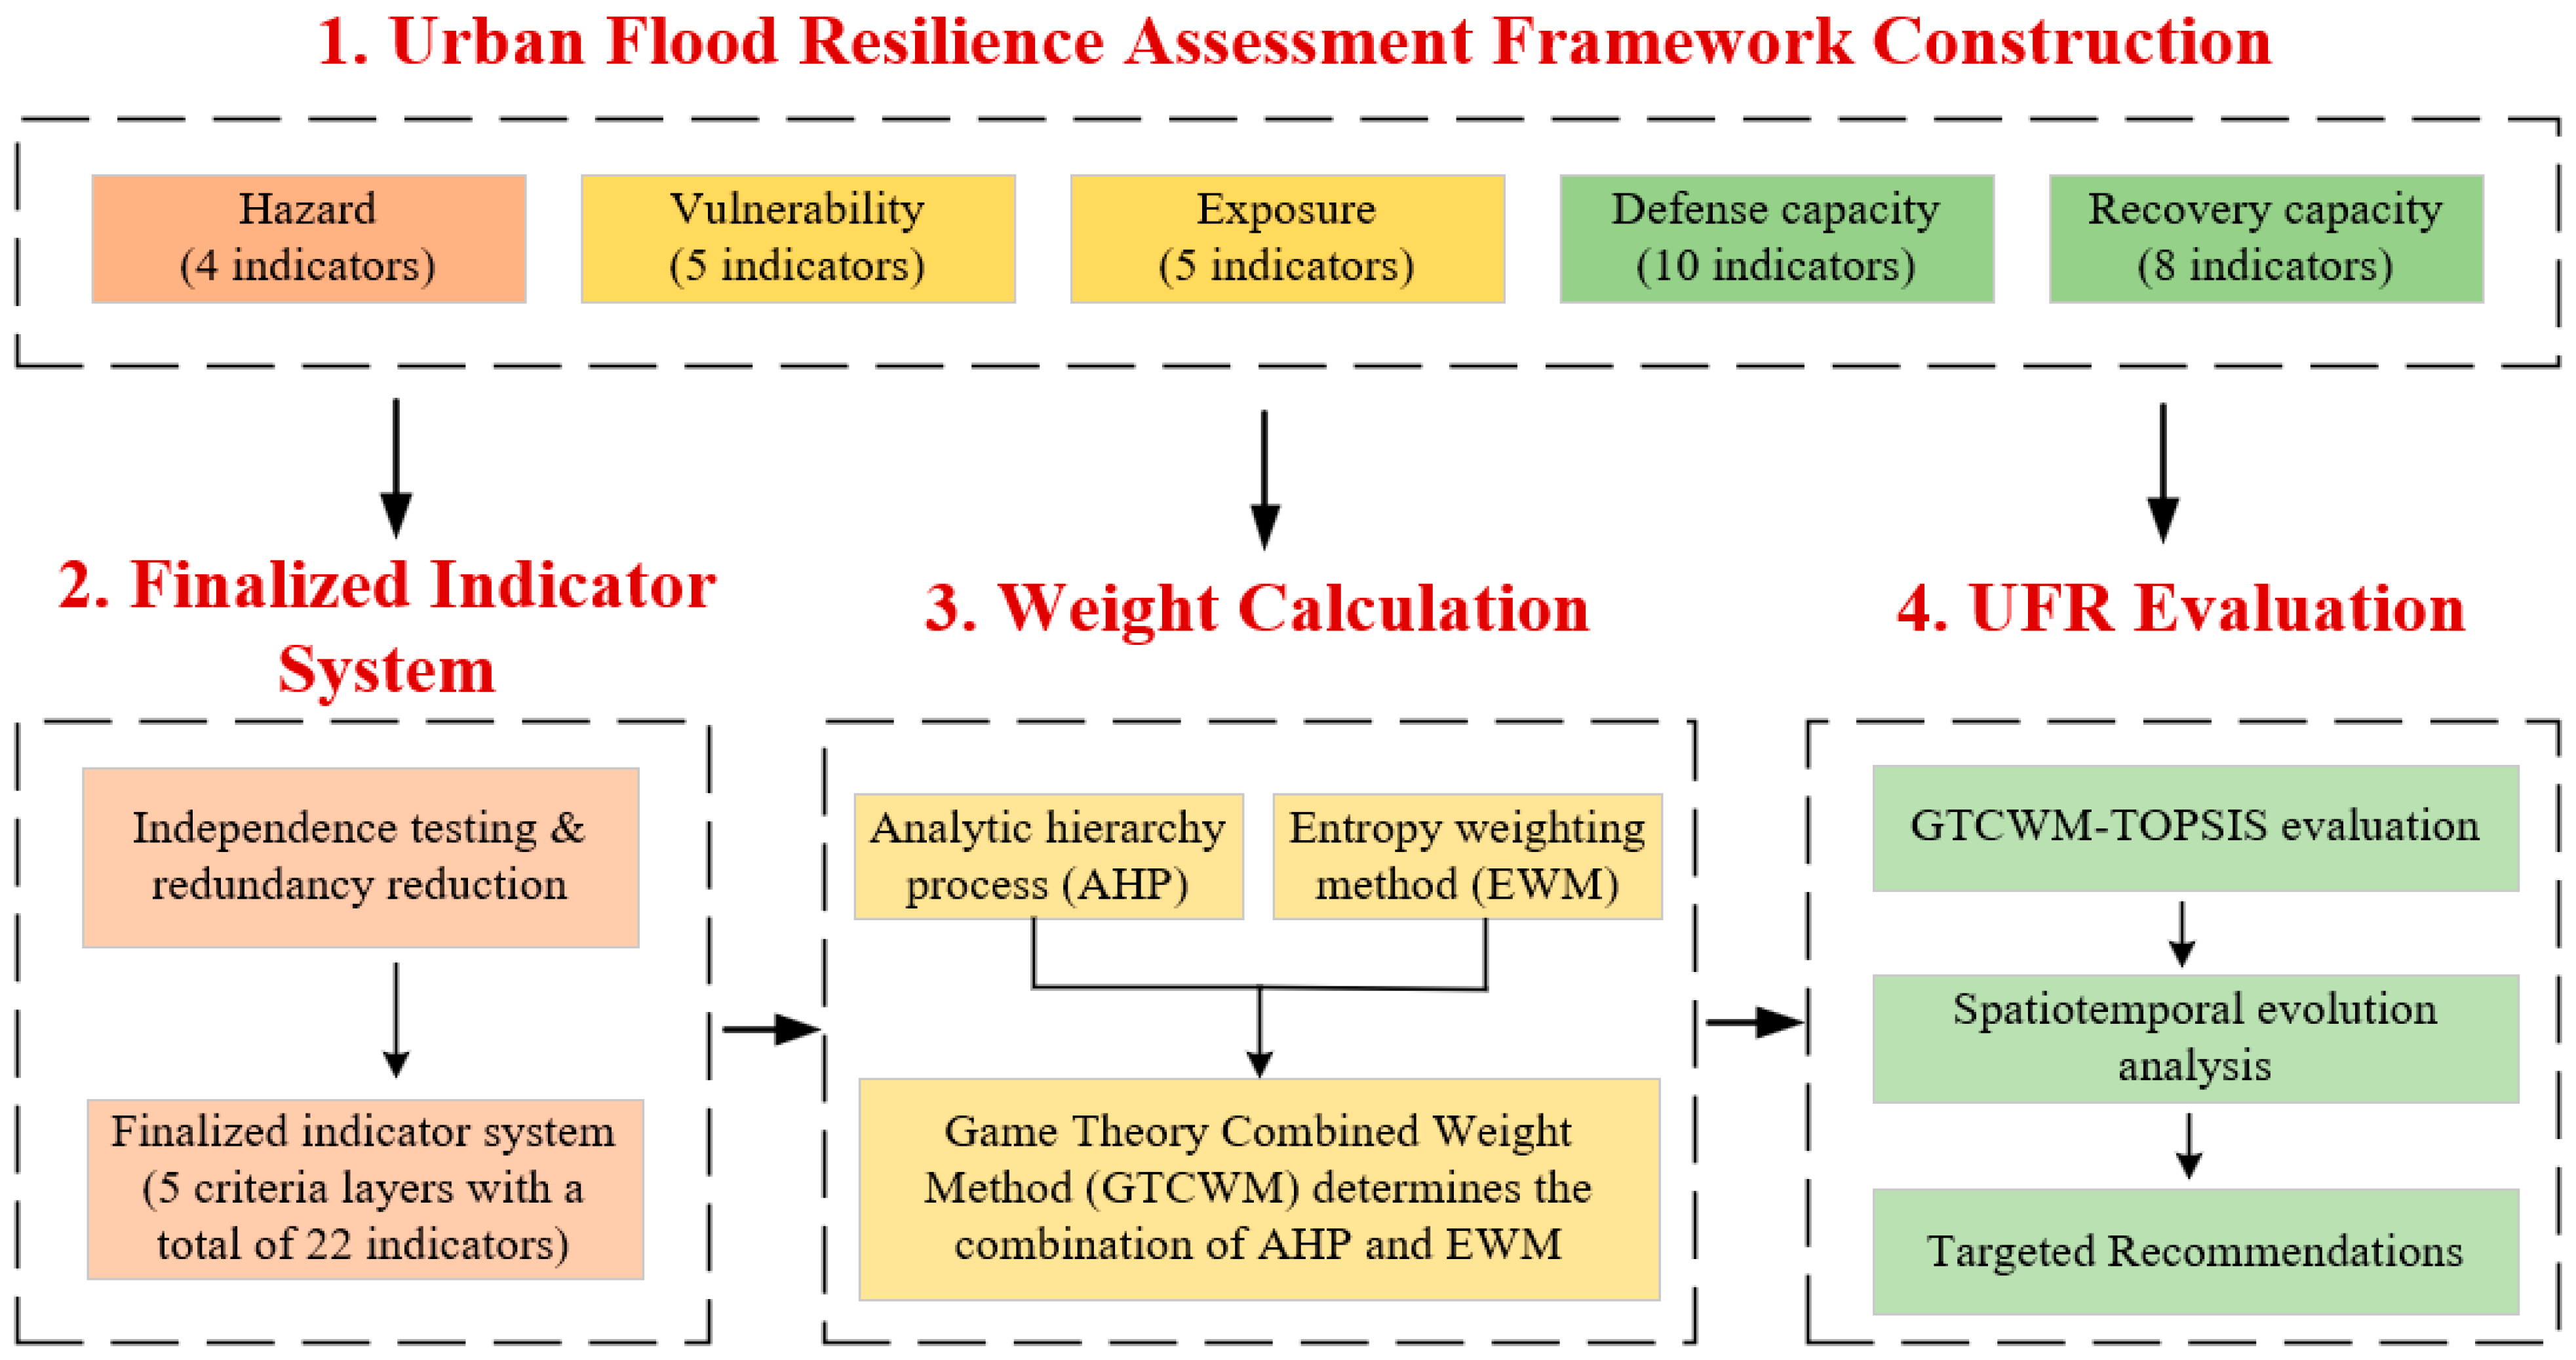
2.2. Evaluation Framework

This study developed a UFR assessment framework structured around the five dimensions of HVEDR, with selected indicators encompassing social, economic, environmental, and infrastructural aspects [34,35]. The selection of appropriate indicators is crucial for objectively, accurately, and comprehensively evaluating flood response resilience. Therefore, the selection process must adhere to principles of scientific rigor, comprehensiveness, hierarchical structure, and operability [36]. Based on the HVEDR UFR evaluation framework, and in accordance with these principles, 32 preliminary indicators have been selected to evaluate UFR in the TLB (Table 1). These indicators are classified as positive or negative based on their enhancing or inhibiting effects on UFR.
Hazard intensity is primarily driven by precipitation, with factors such as total rainfall, concentration, and spatial coverage contributing to urban flood disasters [37]. This study selected four indicators to represent hazard intensity: flood-season precipitation, precipitation concentration degree, frequency of heavy rainfall, and coverage of heavy rainfall.
Vulnerability refers to the susceptibility of a system, region, or society to damage or adverse impacts when exposed to flood disasters due to its inherent characteristics or conditions [17]. In this study, vulnerability is represented by five indicators: population age structure, education level, proportion of population affected by disasters, proportion of economic losses caused by disasters, land development intensity.
Exposure refers to the elements of life and property subjected to hazard factors [18]. According to the “Technical Specification for Rainstorm and Flood Disaster Risk Assessment (DB51/T 2829-2021)” [38], exposure is defined as the quantity and value of elements exposed to natural disasters, including population, property, economy, farmland, and infrastructure. In this study, the exposure dimension is represented by the following indicators: urbanization rate, population density, building density, economic density, crop planting area.
Defense capacity refers to the implementation of engineering and non-engineering measures during both the pre-occurrence and occurrence phases of flood disasters to reduce the likelihood of such disasters and mitigate their impacts on human lives, property, society, and the environment [39,40]. This study characterizes the defensive capacity using 10 indicators: actual flood control capacity, actual drainage capacity, drainage pipeline density, water resource regulation and storage capacity, meteorological and flood monitoring capabilities, early warning issuance capacity, lifeline engineering mitigation capacity, emergency command and control capabilities, smart water conservancy development capacity, network coverage.
Recovery capacity refers to the ability of a city or region to swiftly restore normal operations following a flood disaster. It encompasses the capability to effectively and rapidly repair, rebuild, and adapt across social, economic, infrastructural, and environmental domains post-disaster, thereby minimizing negative impacts and returning to pre-disaster or near-pre-disaster conditions [39,41]. In this study, eight indicators are selected to represent recovery capacity: emergency management capability, emergency material support capacity, medical capacity, social service capacity, residents’ economic status, road network density, coverage rate of basic medical insurance, and coverage rate of disaster insurance.
Table 1. Preliminary indicators for evaluating URF.
CategoryIndicatorsDescriptionUnitEffectReferences
HazardN1 Flood-season precipitationTotal rainfall in the region during the flood season.mmNegative[13,15]
N2 Precipitation concentration degreeThe degree of concentration of precipitation throughout the year.-Negative[42]
N3 Frequency of heavy rainfallThe number of days with daily rainfall reaching 50 mm or more.DaysNegative[23]
N4 Coverage of heavy rainfallThe proportion of monitoring stations experiencing heavy rainfall compared to the total number of stations.%Negative[43]
VulnerabilityN5 Population age structureThe percentage of vulnerable populations (e.g., 0–14 years old and 65+ years old) relative to the total population.%Negative[44,45]
N6 Education levelThe percentage of the employed population with a junior college degree or higher relative to the total employed population.%Positive[46]
N7 Proportion of population affected by disastersThe proportion of people affected by flood disasters annually relative to the total population.%Negative[47,48]
N8 Proportion of economic losses caused by disastersTotal direct economic losses caused by flood disasters as a percentage of the region’s GDP.%Negative[48,49]
ExposureN9 Land development intensityThe percentage of urban construction land relative to the total area of the region.%Negative[15]
N10 Urbanization rateThe proportion of permanent urban residents relative to the total population of the region.%Negative[50]
N11 Population densityThe number of people per unit of land area.%Negative[23]
N12 Building densityThe percentage of the region’s total area covered by buildings.%Negative[51]
N13 Economic densityThe region’s GDP per unit area.CNY/km2Negative[17]
N14 Crop planting areaThe total sown area of crops in the region.km2Positive[17]
Defense capacityN15 Actual flood control capacityThe flood control capacity achievable through the coordination of levees, reservoirs, sluices, and other flood control projects.-Positive[52]
N16 Actual drainage capacityThe drainage capacity achievable through the coordination of pipelines, pump stations, and other drainage projects.m3/sPositive[10,53]
N17 Drainage pipeline densityThe length of drainage pipelines per unit urban area.km/km2Positive[53]
N18 Water resource regulation and storage capacityRepresented by river network density.%Positive[15]
N19 Meteorological and flood monitoring capabilitiesThe ability to forecast and monitor key water safety elements such as precipitation, water levels, and flow rates.Units/m²Positive[15,24]
N20 Early warning issuance capacityThe ability to quickly issue and release flood warnings.-Positive[54]
N21 Lifeline engineering mitigation capabilityThe redundancy level of utilities such as gas, electricity, water supply, communication, and transportation.-Positive[55,56]
N22 Emergency command and control capabilitiesThe ability to effectively manage and coordinate on-site disaster response activities through unified and structured mechanisms.-Positive[48,51]
N23 Smart water conservancy development capacityThe level of digitalization and intelligence in water resource management.-Positive[34,54]
N24 Network coverageThe proportion of the population with access to mobile phones and broadband internet.%Positive[34]
Recovery capacityN25 Emergency management capabilityThe ability to formulate emergency management policies, guidelines, and contingency plans.-Positive[10,57]
N26 Emergency material support capacityThe ability to identify, allocate, store, deploy, mobilize, and transport resources.-Positive[58]
N27 Medical capacityThe ability to provide medical assistance during flood disasters.-Positive[17]
N28 Social service capacityLocal public budget expenditures.CNYPositive[53]
N29 Residents’ economic statusThe total of final consumption expenditures and discretionary savings of urban and rural residents.CNYPositive[59]
N30 Road network densityThe ratio of urban road area to the total regional area.%Positive[17]
N31 Coverage rate of basic medical insuranceThe percentage of the population covered by basic medical insurance.%Positive[27]
N32 Coverage rate of disaster insurancePremiums for commercial and personal accident insurance as a percentage of the city’s GDP.%Positive[24,60]

2.3. Data Source

The precipitation data in this study were sourced from the National Meteorological Center, while all other indicator data originated from official statistical bulletins—including water resource reports, environmental bulletins, and statistical yearbooks—published by the eight municipalities within the study area. The dataset spans 1999 to 2020 with annual temporal resolution, using individual municipalities as spatial units for analysis. Based on the constructed metric system for assessing UFR, all indicators can be divided into three categories: statistical indicators, computational indicators, and qualitative evaluation indicators [35,61].
Statistical indicators refer to those that can be directly obtained by querying statistical data or information already published at the national, provincial, or local levels. This category includes six indicators: N3, N11, N14, N15, N28, and N29. Computational indicators are derived indirectly from published statistical data or information through methods such as mathematical or geographic calculations. This category includes 22 indicators: N1, N2, N4–N10, N12, N13, N16–N19, N21, N24, N26, N27, and N30–N32. Qualitative evaluation indicators refer to those metrics that cannot be quantified through statistical or computational methods. These indicators require subjective judgment, incorporating local policies and current development status, and are assessed using the capability maturity model integration (CMMI) framework [62], with maturity levels assigned to a 1–5 scale informed by expert evaluations. This category includes four indicators: N20, N22, N23, and N25.

2.4. Methodology

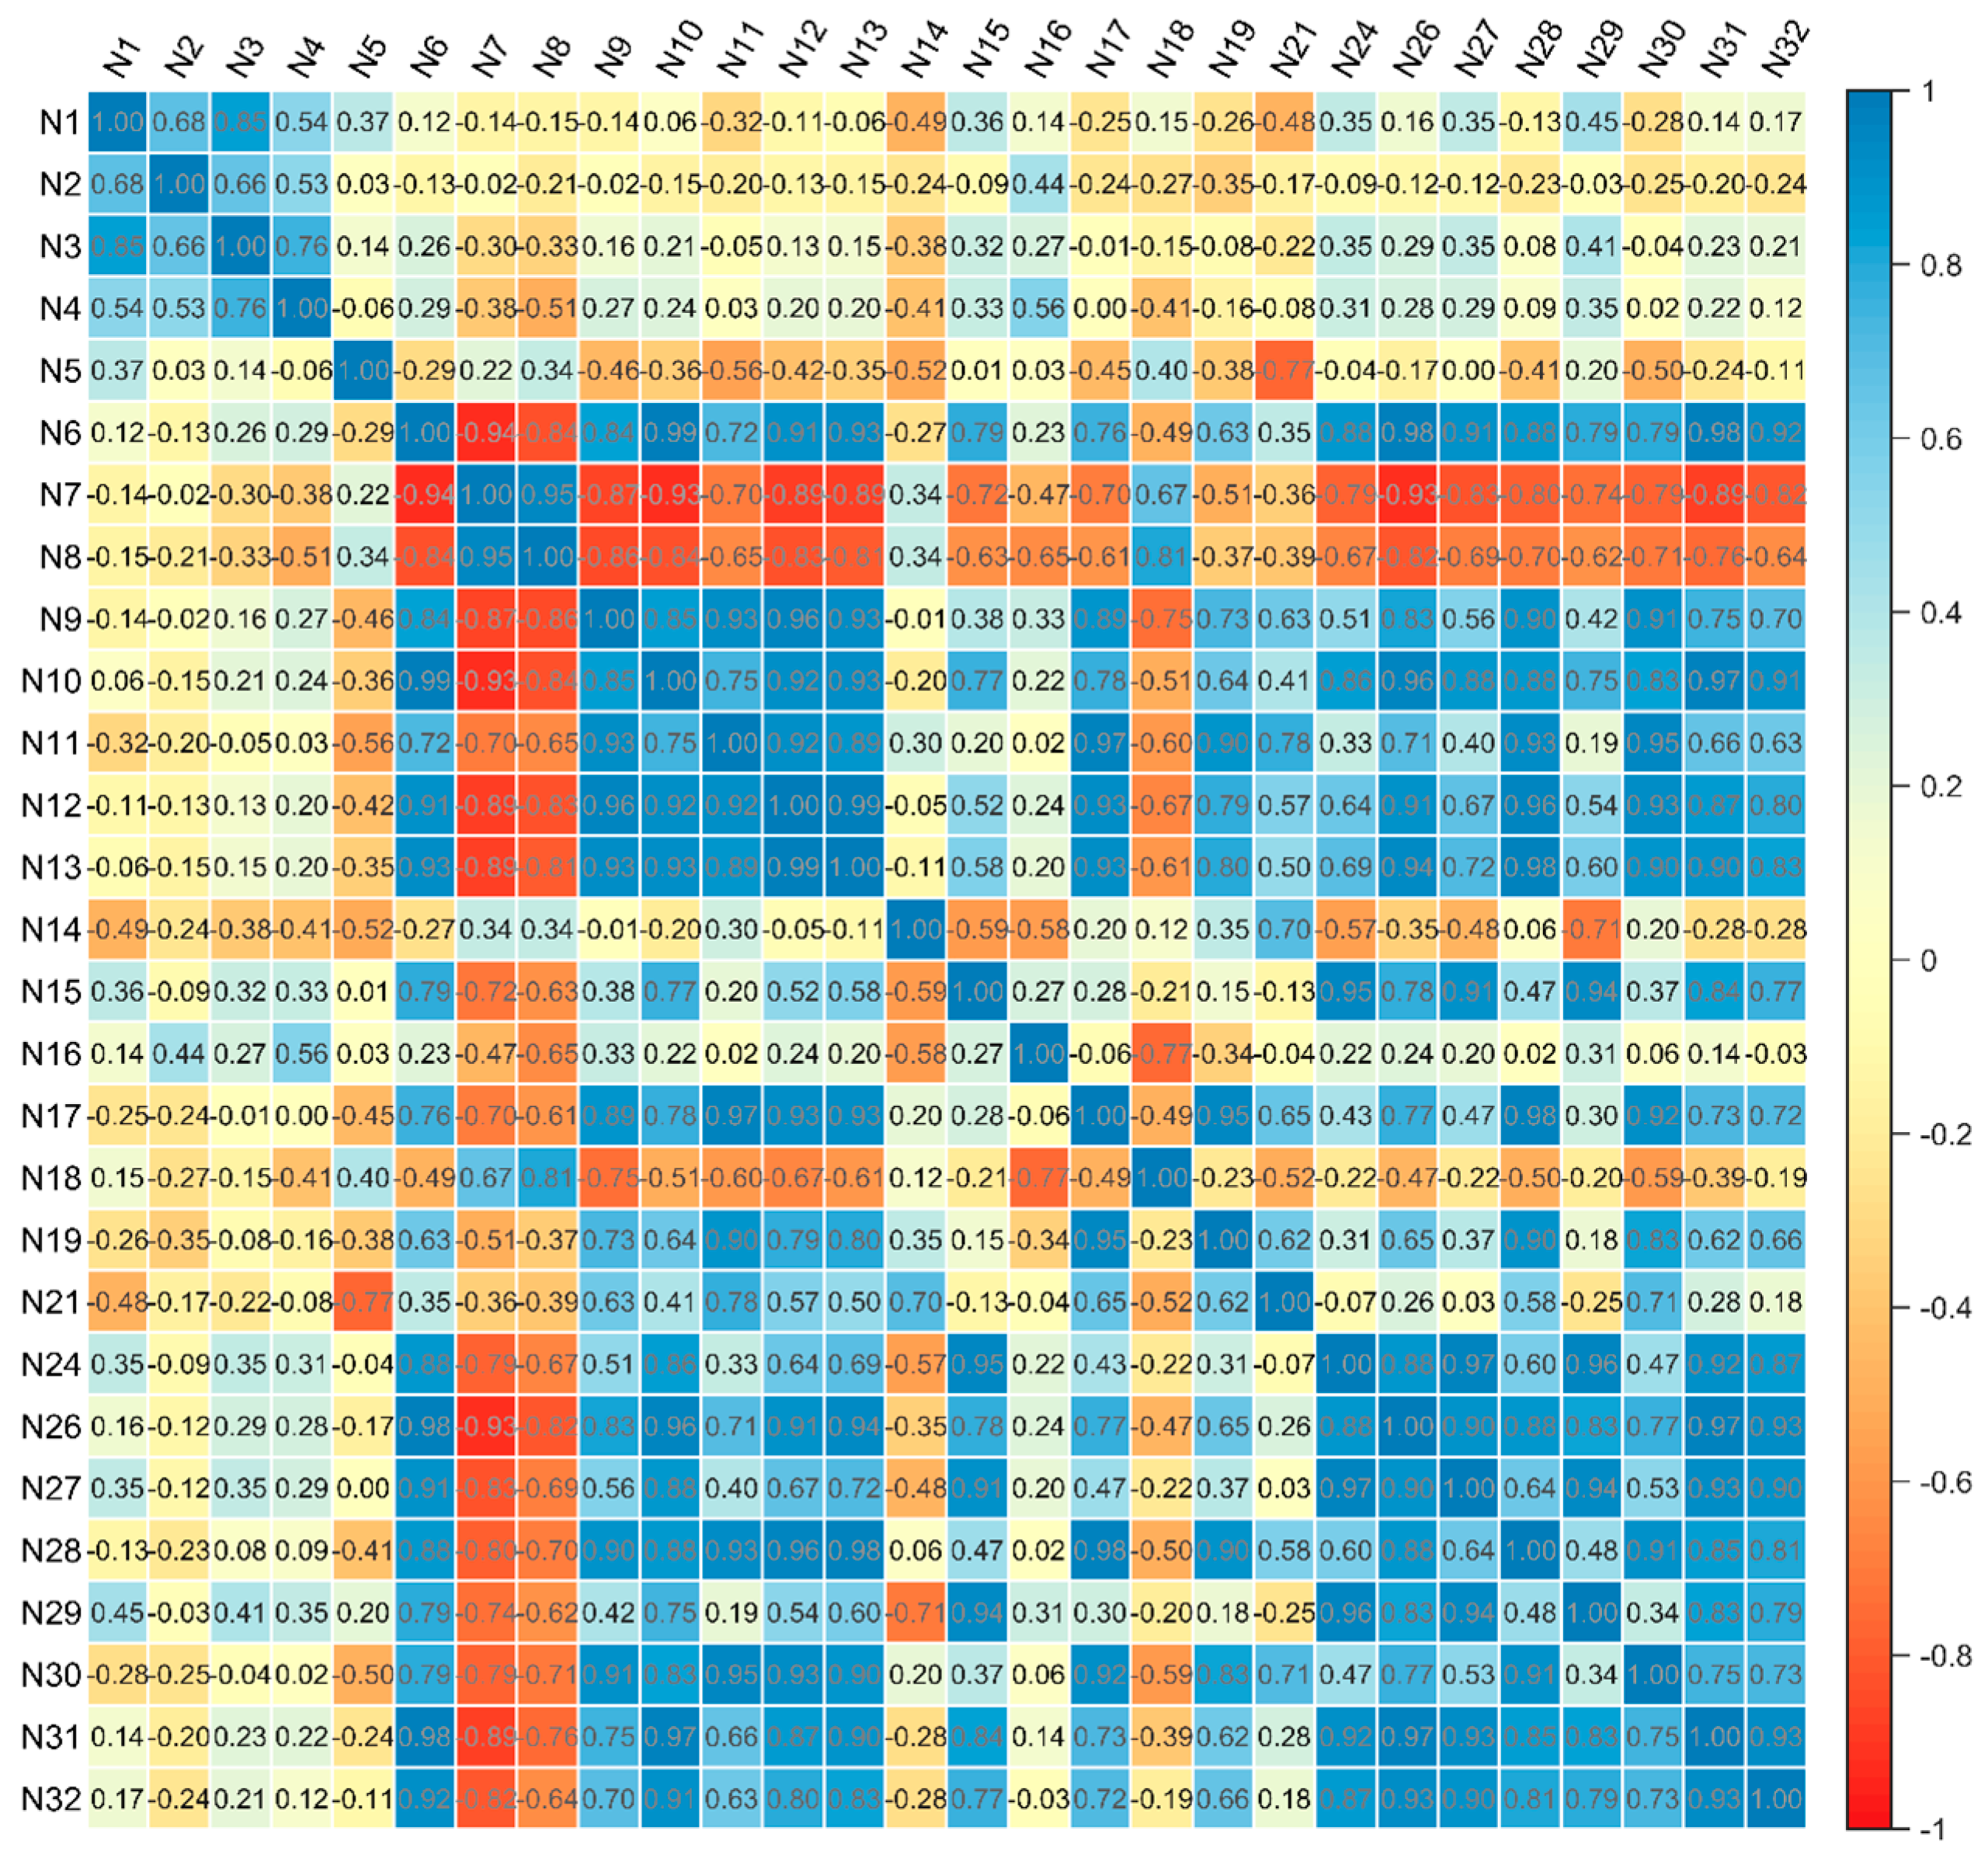
2.4.1. Indicator Independence Testing

After determining the metric system for urban flood resilience, it is necessary to conduct an independence test for specific indicators based on the characteristics of the measured cities. The stronger the independence of the indicators, the lower their correlation, and the more reasonable the metric system [63].
Indicators from different categories, especially those related to economic structure and industrial development, often exhibit high interdependence. Economic cycles (e.g., periods of boom or recession) commonly affect multiple categories of indicators simultaneously. For instance, during the economic boom period in China from 2000 to 2020, indicators such as consumption, investment, production, and import/export all showed synchronized growth. This synchronization occurs because cyclical economic fluctuations often lead to overall increases or decreases in economic activity, thereby influencing performance across multiple domains [64,65].
As a result, when constructing the indicator system, a relatively high correlation is observed among certain indicators. Based on existing studies [20,50] and the characteristics of indicator data collected from various cities in the TLB, the finalized indicators were required to meet the condition of having a correlation coefficient below 0.90, indicating an independence greater than 0.1. The correlation between indicators is determined using Spearman’s correlation coefficient, which ranges from −1 to 1. The greater the absolute value, the stronger the correlation [50,66].

2.4.2. Data Standardization

The min–max normalization method optimally preserves relative relationships within data, mitigates distortion from outliers, and operates without distributional assumptions—ensuring data retains its intrinsic characteristics within a defined range [67]. This study employs min–max normalization to standardize raw indicator data, eliminating the effects of disparate measurement units across indicators on screening outcomes [34].
For positive indicators, the formula for standardization is:
Y i = x i M i n x i M a x x i M i n x i
For negative indicators, the formula for standardization is:
Y i = M a x x i x i M a x x i M i n x i
where: x i is the original value, Y i is the standardized value of the indicator, M i n x i and M i n x i are the minimum and maximum values of the indicator data, respectively.

2.4.3. Determination of Weighting Coefficients

This study employs a combination of subjective and objective weighting methods to determine the weights of the indicators. Subjective weighting is performed using the AHP, while objective weighting is conducted using the EWM.
AHP is a structured decision-making technique commonly used for ranking and prioritizing multiple criteria or alternatives. First, the overall objective must be established, and a hierarchical structure is constructed. This structure comprises five criterion layers: hazard, vulnerability, exposure, defensive capability, and resilience, along with indicators under each criterion layer. Next, pairwise comparison matrices are created. Using the expert scoring method, indicators at each level are compared pairwise based on their relative importance using a 1–9 scale. Finally, a consistency check is conducted through the consistency ratio (CR) to evaluate data quality. A CR value less than 0.1 indicates acceptable judgment consistency [50]. The final indicator weights ( w A H P ) calculated by the AHP method are thereby obtained.
The EWM is a relatively objective method for determining indicator weights using a judgment matrix formed by evaluation indicators. It helps to avoid the subjectivity and uncertainty issues associated with expert-assigned weights [68]. First, construct a judgment matrix based on the evaluation objects and indicators. Then, calculate the entropy value for each evaluation indicator. Finally, use the information entropy difference coefficient to compute the entropy weight ( w E W M ) for each indicator. The steps for this process are as follows:
(1) Constructing the judgment matrix. Consider m evaluation objects and n evaluation indicators. Let x i j represent the value of the j -th evaluation indicator ( j = 1 , 2 , 3 , , n ) for the i -th evaluation object ( i = 1 , 2 , 3 , , m ) . This data is used to establish a normalized evaluation matrix x i j m × n .
(2) Calculating the entropy value of evaluation indicators.
e j = 1 ln m i = 1 m p i j ln p i j
p i j = x i j i = 1 m x i j
where e j denotes the entropy value and m represents the number of evaluation objects.
(3) Computing the information entropy divergence coefficient.
d j = 1 e j
where d j is the divergence coefficient.
(4) Determining the entropy weight of evaluation indicators.
w E W M = d j j = 1 n d j
where n indicates the total evaluation indicators and w E W M represents the entropy weight.
Finally, the game theory combined weight method (GTCWM) is used to determine the proportion between the weights derived from the AHP and the EWM. In the subjective–objective weighting approach, decision-makers typically assign weights to various criteria to reflect their relative importance. Compared to traditional combination weighting methods, the GTCWM adapts better to the complexity of multidimensional data. For multidimensional decision-making problems involving multiple factors, this method effectively considers both subjective and objective influences for each dimension without increasing the model’s complexity, making it suitable for handling diverse variables in complex systems [69]. Moreover, the GTCWM is widely applicable in multicriteria decision making (MCDM), comprehensive evaluations, risk analyses, and other decision analysis scenarios. It enhances the quality and accuracy of decisions across various practical applications [70].
The GTCWM involves linearly fitting weights obtained from different methods to derive more reasonable indicator weights. The steps for this process are as follows:
(1) Calculate the set of weight vectors w k = w k 1 ,   w k 2 , , w k m , ( k = 1,2 , n ) using different weighting methods, where n is the number of weighting methods and m is the number of indicators. The linear combination of weight vectors is shown in Equation (7).
w = k = 1 n α k w k T , w k > 0
where: α k represents the coefficients of the AHP and the EWM and w k represents the weights obtained from the AHP and the EWM, with n = 2.
(2) Utilize GTCWM to introduce different weight vectors into negotiation and compromise. By optimizing the linear combination coefficients α k , the goal of minimizing the deviation between w and w k is achieved.
m i n k = 1 n α k w k T c i T 2 ( i = 1,2 , n )
Based on the differential properties of matrices, the first-order derivative condition for optimizing the above formula is:
k = 1 n α k w i w k T = w i w i T
The corresponding linear equation for the above condition is:
w 1 · w 1 T w 1 · w n T w n · w 1 T w n · w n T α 1 α n = w 1 · w 1 T w n · w n T
(3) Normalize the linear combination coefficients.
α k = α k k = 1 n α k
where: α k represents the normalized coefficients for the AHP and the EWM.
(4) Calculate the combined weights.
The GTCWM’s formula is expressed as follows:
w G = k = 1 n α k w k T
where: w G represents the final indicator weights determined by the GTCWM.

2.4.4. TOPSIS

TOPSIS is an MCDM method used to rank and select a set of alternatives based on their distance to an ideal solution. It is widely used in various decision-making fields to evaluate and prioritize alternatives [70,71]. The calculation is described below.
(1) Determine the evaluation criteria and weights: Identify the criteria used to assess the alternatives and assign a weight to each criterion (i.e., the indicator weights determined by the GTCWM) to reflect the importance of each criterion.
(2) Construct the judgment matrix: Based on the performance of each alternative with respect to each criterion, construct a judgment matrix ( X = x i j m × n ).
(3) Normalize the judgment matrix: Divide each value in the judgment matrix by the square root of the sum of squares of its column to ensure that the comparisons between columns are reasonable. The normalized value is calculated using the following formula, resulting in a dimensionless decision matrix Z = z i j m × n derived from the original matrix X = x i j m × n .
z i j = x i j i = 1 m   x i j 2
The weighted decision matrix V = v i j m × n is obtained using the following formula:
v i j = w i · z i j
(4) Determine the ideal and negative ideal solutions: Based on the maximum and minimum values for each criterion, determine the positive ideal solution A i + and the negative ideal solution A i .
A i + = m a x 1 j n   v i j   ( i = 1,2 , , m ) A i = m i n 1 j n   v i j   ( i = 1,2 , , m )
(5) Calculate similarity: By calculating the distance of each alternative from the positive ideal solution and the negative ideal solution, determine the similarity between each alternative and the ideal solution ( A d j + ) as well as the negative ideal solution ( A d j ).
A d j + = i = 1 m   A i + v i j 2 ( j = 1,2 , , n ) A d j = i = 1 m   A i v i j 2 ( j = 1,2 , , n )
(6) Determine the optimal solution: Based on the similarity of each alternative to the ideal solution and the negative ideal solution, calculate the overall similarity indicator, known as the TOPSIS value. The final TOPSIS value represents the UFR index and is denoted by R j :
R j = A d j A d j + + A d j   ( j = 1,2 , , n )
In the formula, R j represents the relative closeness of the alternative to the ideal solution. The closer R j is to 1, the closer the alternative is to the positive ideal solution, indicating a better evaluation result. Conversely, a smaller R j indicates a worse evaluation result.

2.4.5. Urban Flood Resilience Index

Finally, the calculated R j values are used to reflect the UFR index, while R j also represents the intensity of each criteria layer. Based on the characteristics of the five criteria layers, they are classified into three categories: hazard (negatively affecting UFR, influenced solely by climate change and beyond human intervention), vulnerability and exposure (VAE, negatively affecting UFR but amenable to human intervention), and defense capacity and recovery capacity (DAR, positively affecting UFR and subject to human intervention).
Using the K-means [21] clustering algorithm in cluster analysis, the UFR index and the three categories mentioned above are divided into five levels: very high, high, medium, low, and very low. The specific levels and corresponding index ranges are detailed in Table 2.

3. Results

3.1. Selection of Indicators

Initially, 32 indicators were selected based on the HVEDR framework (Table 1), followed by an independence test to screen these indicators. Specifically, Pearson correlation coefficients were calculated between pairs of the 6 statistical indicators and 22 computational indicators, and a correlation heatmap was generated (Figure 3). The results revealed high correlation coefficients among indicators N6–N13, N15, N19, N24, and N26–N31, indicating significant informational overlap. Consequently, 10 indicators—N7, N10, N11, N12, N15, N19, N24, N26, N28, and N31—were removed. Ultimately, 22 indicators were selected and renumbered as C1–C22 to form the UFR assessment framework for the TLB’s UFR.

3.2. Indicator Weighting Results

The subjective and objective weights of the selected 22 indicators were calculated using the AHP and the EWM, respectively. Subsequently, GTCWM was employed to determine the linear combination coefficients for AHP and the EWM, which were 0.966 and 0.043, respectively. The results from GTCWM indicate that the AHP method holds a significantly larger proportion. After normalization, the weights of AHP and the EWM were 0.96 and 0.04, respectively. The final comprehensive weighted results for each indicator derived through GTCWM are presented in Table 3.
At the criterion level, hazard and defense capacity account for the largest weights (both 0.224), followed by recovery capacity (0.202) and exposure (0.179), while vulnerability has the smallest weight of only 0.170. At the indicator level, drainage pipeline density (C12), flood-season precipitation (C1), and medical capacity (C19) were the three indicators with the highest weights, with weights of 0.091, 0.087, and 0.085, respectively.

3.3. The Interannual Variability of UFR

3.3.1. Hazard

Figure 4 illustrates the changes in hazard, vulnerability and exposure, defensiveness and recovery, and urban flood resilience in the TLB and eight cities from 1999 to 2020. At the regional level, the hazard of the TLB showed a significant decline in 2000 (Figure 4a), primarily due to the high flood season precipitation of 1171 mm in 1999 combined with elevated precipitation concentration, leading to heightened hazard that year. From 2000 to 2020, hazard exhibited a fluctuating upward trend, driven mainly by increased variability in flood-season precipitation and higher precipitation concentration, which amplified hazard risks. Notably, a peak in hazard occurred in 2011, attributed to persistent heavy rainfall caused by Typhoon Muifa, the 9th super typhoon of that year. According to statistics, Typhoon Muifa affected 35 counties (cities, districts), 144 towns, and 1.74 million people in provinces and municipalities such as Zhejiang, Shanghai, and Jiangsu. It damaged 101,000 hectares of crops and caused direct economic losses nearing CNY 3 billion.
At the city level, most cities followed trends similar to the overall TLB, with marked increases in hazard observed in 2011. Specifically, cities in Jiangsu Province—including Suzhou, Wuxi, Changzhou, and Zhenjiang—and cities in Zhejiang Province—such as Jiaxing, Huzhou, and Hangzhou—experienced significant rises in hazard in 2015 and 2016. These increases were primarily triggered by the super El Niño event, which generated heightened flood-season precipitation and greater precipitation concentration.

3.3.2. Vulnerability and Exposure

At the regional level, the VAE of the TLB showed an overall downward trend from 1999 to 2010 but shifted to an upward trend from 2010 to 2020 (Figure 4b). This shift was primarily driven by changes in the population age structure. Before 2010, the influx of migrant populations led to a higher proportion of young and middle-aged individuals. However, after 2010, the proportion of young and middle-aged populations began to decline, and aging issues became more pronounced.
At the city level, trends in VAE aligned with those of the broader TLB. Overall, cities in Zhejiang Province (Hangzhou, Jiaxing, and Huzhou) exhibited relatively lower VAE compared to cities in Jiangsu Province (Suzhou, Wuxi, Changzhou, and Zhenjiang). This disparity was mainly due to Zhejiang’s lower average population density, lower economic density, and healthier population age structure. In 2005 and 2013, Zhejiang experienced significant increases in VAE, largely caused by severe flooding events that resulted in substantial casualties and economic losses.
Shanghai, with its significantly higher and continuously growing land development intensity, population density, and economic density compared to Jiangsu and Zhejiang, showed an overall upward trend in VAE. Notably, Hangzhou maintained the lowest VAE levels from 1999 to 2020. This achievement stemmed from its relatively low population density coupled with high urbanization rates. Additionally, Hangzhou’s favorable talent policies attracted a large number of young migrants, leading to a healthier population age structure compared to other cities. In contrast, Zhenjiang exhibited the highest VAE, primarily due to its high land development intensity and poor population age structure.

3.3.3. Defense Capacity and Recovery Capacity

The DAR of the entire TLB exhibited a continuously strengthening trend from 1999 to 2020 (Figure 4c). This improvement was primarily driven by upward trends in critical indicators such as drainage pipeline density and medical capacity across provinces and cities. After 2010, the growth rate accelerated, primarily due to faster improvements in medical capacity across most cities in the TLB post-2010. Trends in DAR at the city level aligned closely with those of the broader TLB, maintaining a consistent upward trajectory. Overall, the three cities in Zhejiang Province demonstrated higher DAR compared to the four cities in Jiangsu Province, mainly attributable to Zhejiang’s stronger water resource regulation capabilities, higher medical standards, and better economic conditions among residents.
Shanghai exhibited the highest DAR, owing to its superior drainage pipeline density, favorable economic conditions of residents, and extensive road network density. However, Shanghai experienced a notable decline in DAR in 2007, primarily due to a significant reduction in road network density. Hangzhou ranked second in DAR after Shanghai. While Hangzhou’s drainage pipeline density was relatively low, it performed well in other indicators, particularly in medical capacity, lifeline engineering disaster reduction capabilities, and disaster insurance coverage. Zhenjiang had the lowest DAR among the eight cities, mainly due to its inadequate drainage pipeline density and weaker medical capacity.

3.3.4. Urban Flood Resilience

Figure 4d illustrates the trends in UFR of the TLB and its cities from 1999 to 2020. From a regional perspective, the UFR of the TLB demonstrated a significant upward trend over the 22-year period. This improvement is attributed to the continuous strengthening of defensiveness and recovery within the basin. Calculated results indicate that the UFR index for the TLB rose from 0.385 in 1999 to 0.513 in 2020. Except for 1999, which exhibited low resilience levels, most years fell within the medium resilience range. The UFR index sharply declined in 2011, dropping from 0.511 in 2010 to 0.427 in 2011, primarily due to a significant increase in hazard that year. From 2012 to 2020, the UFR index fluctuated between 0.482 and 0.541, reaching its peak in 2018.
Among the eight cities in the TLB, most displayed UFR trends similar to the broader basin, with an overall upward trajectory from 1999 to 2020. In 2011, the UFR across all cities markedly decreased, likely influenced by Typhoon Muifa, the 9th super typhoon of that year. Typhoon Muifa brought persistent heavy rainfall to the entire TLB, triggering severe flooding in cities such as Shanghai, Zhejiang, and Jiangsu, resulting in substantial losses and reduced restorative capacity that year. Similar UFR reductions occurred in 2015 and 2016 due to the super El Niño event, variably impacting UFR in cities across Jiangsu and Zhejiang provinces.
The three cities in Zhejiang Province (Hangzhou, Jiaxing, and Huzhou) generally exhibited higher UFR levels over the 22-year period compared to the four cities in Jiangsu Province (Suzhou, Wuxi, Changzhou, and Zhenjiang). Suzhou, Wuxi, and Changzhou, owing to their geographical proximity and similar development conditions, showed comparable upward trends in UFR. The same pattern applied to Hangzhou, Jiaxing, and Huzhou. Within Jiangsu Province, Wuxi and Suzhou ranked higher in UFR, while Zhenjiang remained the lowest. In Zhejiang Province, Hangzhou had the highest UFR, followed by Huzhou, with Jiaxing having the lowest.
Overall, Shanghai and Hangzhou consistently ranked highest in UFR indices, occupying the top two positions in most years since 1999, with resilience ranges of 0.448–0.568 and 0.405–0.572, respectively. Shanghai’s high UFR can be attributed to its strong defensive and restorative capacities, reflected in its high drainage pipeline density, advanced medical capacity, and extensive disaster insurance coverage. Hangzhou’s elevated resilience stems from its low vulnerability, low exposure, and robust defensive and restorative capacities, underpinned by a favorable population age structure, advanced medical capabilities, and high disaster insurance coverage. In contrast, Zhenjiang exhibited the lowest UFR levels, primarily due to its poor population age structure, low urban drainage pipeline density, and inadequate medical insurance coverage, resulting in high exposure, high vulnerability, and weak defensive and restorative capacities.

3.4. Spatial Distribution of UFR

Figure 5 illustrates the spatial patterns and evolution of UFR and the intensity of criterion layers in the TLB over the past 20 years. From the perspective of hazard, the intensity of hazard susceptibility in most cities showed an increasing trend. In 2015, cities in the northwest region (Zhenjiang, Changzhou, and Wuxi) exhibited stronger hazard susceptibility, reaching relatively high or higher levels. From the perspective of VAE, overall, most cities experienced a “V”-shaped fluctuation in VAE, initially decreasing and then increasing. Among them, southern cities (such as Hangzhou) had the lowest VAE, while northwestern cities (Zhenjiang, Changzhou, and Wuxi) and eastern cities (Shanghai) had higher VAE. From the perspective of DAR, all cities generally showed an upward trend. By 2020, the DAR of all cities had reached moderate or higher levels, with eastern cities (Shanghai) demonstrating the strongest DAR.
Given that hazard, vulnerability, and exposure exert negative impacts on UFR, while defense capacity and recovery capacity have positive effects, the UFR of cities in the TLB exhibited a fluctuating upward trend from 1999 to 2020 under the combined influence of hazard, vulnerability, exposure, defense capacity, and recovery capacity factors. By 2020, all eight cities had achieved moderate or higher UFR levels. The number of cities with high and very high UFR levels increased from 2 to 5. Specifically, Shanghai, Hangzhou, Huzhou, Changzhou, and Wuxi reached high or extremely high UFR values, while Suzhou, Jiaxing, and Zhenjiang maintained moderate levels. This indicates that, under the integrated effects of hazard, vulnerability, exposure, defense capacity, and recovery capacity, the UFR of TLB cities demonstrated a fluctuating yet upward trajectory. The high defense capacity and recovery capacity are key contributing factors to Shanghai’s and Hangzhou’s elevated UFR levels, which are primarily attributed to their robust economic development and advanced infrastructure. These advantages are specifically manifested in high drainage pipeline density, advanced medical capacity, and extensive disaster insurance coverage.
In terms of spatial distribution, cities in the south (such as Hangzhou) and east (such as Shanghai) demonstrated higher UFR levels, while cities in the north (such as Zhenjiang) demonstrated a lower UFR level. The spatial variation in UFR levels among cities was also quite pronounced, showing a pattern of stronger resilience in the south and east and weaker resilience in the north and west. Additionally, the spatial connectivity of resilience remained strong across different periods.

4. Discussion

4.1. Further Analysis on the Key Driving Factors

During the research, we observed that the urban flood resilience (UFR) of major cities in the TLB is predominantly influenced by three indicators: drainage pipeline density (C12), flood-season precipitation (C1), and medical capacity (C19). These results align with findings from Zheng and Huang [72], Chen, Li, Wang, and Deng [48], Park et al. [73], and Wang et al. [74]. To mitigate urban flooding induced by short-duration heavy rainfall, it is imperative to expand urban drainage infrastructure and strengthen medical facilities, thereby enhancing safety for affected populations and improving UFR.
From a criteria-layer perspective, the analysis underscores that defense capacity, recovery capacity, and hazard are critical determinants of UFR. Given that hazard (e.g., climate-driven extreme events) cannot be directly regulated, priority must be placed on optimizing defense capacity and recovery capacity. Cities with high defense capacity can resist larger-scale flood events, while robust recovery capacity enables rapid post-disaster reconstruction and restoration of urban functionality following flood disruptions.
Although the vulnerability and exposure dimensions contribute minimally to UFR overall, three sub-indicators—population age structure, education levels, and land development intensity—exhibit significant influence within these categories. This aligns with conclusions from Ji et al. [34] and Zhu et al. [27]. Improving urban demographic structures (e.g., balancing age distribution), elevating educational attainment, and regulating land-use intensity (e.g., avoiding overdevelopment in flood-prone zones) would further bolster UFR.
Additionally, we have also observed that certain indicators exert a dual impact on UFR. For instance, land development intensity functions as a negative indicator for UFR from the perspectives of vulnerability and exposure. At the same time, land development intensity reflects higher infrastructure quality (e.g., better-constructed buildings, drainage systems, emergency services), thereby acting as a positive indicator for UFR. However, several other indicators used in this study—including drainage pipeline density, emergency command and control capabilities, emergency management capability, and social service capacity—can all demonstrate the positive impact of enhanced infrastructure quality on UFR. Therefore, in our research, greater emphasis was placed on treating land development intensity primarily as a negative indicator.

4.2. Implications of UFR Research in the TLB

According to the evaluation results, all cities in the TLB have shown significant improvements in urban flood resilience (UFR), yet 38% remained at moderate levels by 2020. As highlighted by Zhou and Liu [75], although the TLB is one of China’s most economically advanced regions, there remains substantial potential for further development. The key drivers for enhancing resilience lie in improving defense capacity and recovery capacity. From a temporal perspective, hazard, vulnerability, and exposure in most cities have exhibited upward trends in recent years due to climate change and urbanization [76], collectively exerting negative impacts on UFR. These dimensions now represent critical weaknesses in resilience enhancement. On one hand, cities in the TLB should continue to expand enterprise incentive policies to stimulate corporate vitality and promote high-quality economic development. On the other hand, governments must prioritize strengthening defense capacity and recovery capacity by increasing urban drainage pipeline density, boosting investments in medical infrastructure, and implementing rational land development planning.
Spatially, cities in the eastern (e.g., Shanghai) and southern (e.g., Hangzhou) regions of the TLB demonstrate higher UFR levels (Figure 5), primarily due to their developed economies, comprehensive infrastructure, and higher societal capabilities. This aligns with findings from Ji, Fang, Chen, and Ding [34] and Cao, Xu, Zhang, and Kong [20], which indicate that economically prosperous cities tend to achieve higher UFR. The concentration of high UFR in core metropolises like Shanghai and provincial capitals like Hangzhou reflects both socioeconomic progress and spatial disparities in resource allocation across the basin [46]. Such imbalances necessitate greater investments in cities with lower UFR, particularly those in the northwest (e.g., Zhenjiang). For these cities, strategies should focus on reducing vulnerability and exposure while enhancing defense capacity and recovery capacity. Measures include expanding talent subsidy policies to attract skilled professionals, optimizing urban land-use planning, accelerating sponge city initiatives (e.g., stormwater–sewage diversion systems and drainage pipe upgrades), and increasing medical infrastructure funding. Additionally, strengthening the spillover effects of high-UFR cities like Shanghai and Hangzhou to drive development in neighboring regions is essential for achieving balanced resilience across the TLB.

4.3. Suggestions for Improving UFR

To enhance UFR, the primary focus should be on strengthening defense capacity and recovery capacity. This includes upgrading urban drainage systems through stormwater–sewage diversion retrofits, with priority given to cities exhibiting low UFR levels (such as Zhenjiang), where smart drainage gates and high-capacity pumping stations should be installed. Simultaneously, buffers should be established by planting vegetation such as reeds and willows to mitigate flood impacts and ensure the ecological conservation function of TLB wetlands. Within urban areas, sponge city infrastructure can be constructed by retrofitting roads with more water-permeable materials. Establishing municipal-level emergency supply hubs equipped with IoT-based monitoring systems is critical to restoring critical infrastructure within 24 h post-disaster. Additionally, healthcare and social safeguards must be reinforced in cities with limited medical resources, such as Zhenjiang and Jiaxing, through the construction of Grade IIIA hospital branches, stockpiling emergency medical supplies, and guaranteeing universal access to basic medical insurance.
Next, efforts must focus on reducing urban vulnerability and exposure. This requires integrating flood-risk management training into vocational education curricula to enhance the adaptive capacity of vulnerable groups, such as low-income residents and the elderly. Concurrently, strict enforcement of flood risk redline zones is critical, prohibiting land development and infrastructure projects within floodways to minimize exposure to hazards. Additionally, cities should expand talent incentive policies by adopting more proactive, open, and effective strategies to attract, cultivate, and retain skilled professionals, particularly in fields critical to resilience building, such as urban planning and disaster response engineering.
Simultaneously, enhancing predictive capabilities for hazards is essential. This involves developing a digital twin basin platform that integrates topographic data with real-time hydrological monitoring to simulate disaster propagation pathways under extreme rainfall scenarios. Additionally, establishing a regional climate–hydrology coupled model tailored to the TLB—which combines global climate frameworks like CMIP6 with localized meteorological data—will improve the prediction accuracy of extreme rainfall events. Complementing these efforts, an AI-driven flood scenario simulation system should be deployed to achieve dynamic, high-resolution simulations of potential inundation areas over a 72 h horizon, enabling proactive risk mitigation and resource allocation. All the aforementioned measures require substantial financial investment, and government departments need to ensure coordinated planning of these economic commitments.

4.4. Limitations and Future Work

This study’s assessment of UFR in the TLB relied solely on the established indicator framework, neglecting cross-jurisdictional interactions between neighboring cities. In practice, development in advanced cities like Shanghai generates spillover effects on surrounding areas, consequently influencing their UFR. Quantifying these intercity dynamics warrants dedicated research. Methodologically, the GTCWM determined weights for AHP and EWM. Results revealed AHP-dominated weighting at 96%, indicating final coefficients disproportionately reflected AHP calculations. This necessitates developing more objective methodologies to better reconcile subjective–objective weighting balances. Lastly, confinement to eight TLB cities limits spatial applicability. Future studies should expand to broader geographical scales for large-scale regional analysis.

5. Conclusions

This study proposes a hazard–vulnerability–exposure–defense capacity–recovery capacity (HVEDR) framework for assessing urban flood resilience (UFR) and establishes a UFR indicator system for the TLB. Using the GTCWM-TOPSIS evaluation approach, the UFR of the TLB from 1999 to 2020 was analyzed. Key findings and conclusions are as follows:
(1) Weight allocation: GTCWM determined the proportions of the EWM and AHP as 0.04 and 0.96, respectively. At the criteria layer, the weights of hazard, vulnerability, exposure, defense capacity, and recovery capacity were 0.224, 0.170, 0.179, 0.224, and 0.202, respectively. At the indicator layer, drainage pipeline density (0.091), flood-season precipitation (0.087), and medical capacity (0.085) emerged as the top three weighted indicators.
(2) Temporal trends: UFR in cities across the TLB generally exhibited an upward trend during the study period. However, a significant decline occurred in 2011 due to heightened hazard. Shanghai and Hangzhou recorded the highest UFR values, while Zhenjiang had the lowest.
(3) Spatial patterns: UFR displayed a distinct spatial pattern characterized by stronger resilience in the south and east and weaker resilience in the north and west. Southern cities (e.g., Hangzhou) and eastern cities (e.g., Shanghai) demonstrated higher UFR, whereas northwestern cities (e.g., Zhenjiang) exhibited lower UFR.
The proposed HVEDR framework and GTCWM-TOPSIS evaluation method were proven robust and effective in objectively assessing UFR conditions in the TLB. The combined weighting approach integrating the AHP and EWM through GTCWM successfully reduced uncertainties in multicriteria decision making. Finally, this study provides targeted management and policy recommendations addressing hazard, vulnerability, exposure, defensiveness, and recovery to mitigate flood risks and enhance UFR. This framework and research findings provide valuable insights for assessing UFR and other disasters (such as drought) in other regions.

Author Contributions

Conceptualization, K.L., Y.L., Y.W. and T.C.; Methodology, K.L., Y.L., Y.W. and T.C.; Software, K.L., Y.L., J.Z., Z.Z. and X.G.; Validation, K.L. and Y.L.; Formal analysis, K.L.; Resources, K.L., T.C., Z.Z. and X.G.; Data curation, K.L., J.Z., Z.Z. and X.G.; Writing—original draft, K.L. and J.Z.; Writing—review & editing, K.L., Y.L. and Y.W.; Visualization, K.L.; Funding acquisition, Y.L., Y.W. and T.C. All authors have read and agreed to the published version of the manuscript.

Funding

The National Key Research and Development Program of China (2022YFC3202802, 2021YFC3000101) and the special funded project for basic scientific research operation expenses of the Central Public Welfare Scientific Research Institutes of China (Y523010, Y524017) financially supported this work.

Data Availability Statement

The raw data supporting the conclusions of this article will be made available by the authors on request. The data presented in this study are available on request from the corresponding author. The data are not publicly available due to privacy and legal.

Conflicts of Interest

The authors declare no conflict of interest.

References

  1. Luo, Z.; Tian, J.; Zeng, J.; Pilla, F. Resilient landscape pattern for reducing coastal flood susceptibility. Sci. Total Environ. 2023, 856, 159087. [Google Scholar] [CrossRef]
  2. Venkataramanan, V.; Packman, A.I.; Peters, D.R.; Lopez, D.; McCuskey, D.J.; McDonald, R.I.; Miller, W.M.; Young, S.L. A systematic review of the human health and social well-being outcomes of green infrastructure for stormwater and flood management. J. Environ. Manag. 2019, 246, 868–880. [Google Scholar] [CrossRef]
  3. Wu, W.; Jamali, B.; Zhang, K.; Marshall, L.; Deletic, A. Water Sensitive Urban Design (WSUD) Spatial Prioritisation through Global Sensitivity Analysis for Effective Urban Pluvial Flood Mitigation. Water Res. 2023, 235, 119888. [Google Scholar] [CrossRef] [PubMed]
  4. Liu, W.; Feng, Q.; Engel, B.A.; Yu, T.; Zhang, X.; Qian, Y. A probabilistic assessment of urban flood risk and impacts of future climate change. J. Hydrol. 2023, 618, 129267. [Google Scholar] [CrossRef]
  5. Woodruff, J.D.; Irish, J.L.; Camargo, S.J. Coastal flooding by tropical cyclones and sea-level rise. Nature 2013, 504, 44–52. [Google Scholar] [CrossRef] [PubMed]
  6. Eggert, A.L.; Löwe, R.; Arnbjerg-Nielsen, K. Identifying barriers and potentials of integrated assessments of sustainable urban development and adaptation to rising sea levels. Ecol. Indic. 2023, 148, 110078. [Google Scholar] [CrossRef]
  7. Kong, Z.; Shao, Z.; Shen, Y.; Zhang, X.; Chen, M.; Yuan, Y.; Li, G.; Wei, Y.; Hu, X.; Huang, Y.; et al. Comprehensive evaluation of stormwater pollutants characteristics, purification process and environmental impact after low impact development practices. J. Clean. Prod. 2021, 278, 123509. [Google Scholar] [CrossRef]
  8. Yin, D.; Zhang, X.; Cheng, Y.; Jia, H.; Jia, Q.; Yang, Y. Can flood resilience of green-grey-blue system cope with future uncertainty? Water Res. 2023, 242, 120315. [Google Scholar] [CrossRef]
  9. Schelfaut, K.; Pannemans, B.; van der Craats, I.; Krywkow, J.; Mysiak, J.; Cools, J. Bringing flood resilience into practice: The FREEMAN project. Environ. Sci. Policy 2011, 14, 825–833. [Google Scholar] [CrossRef]
  10. Liao, K.-H. A Theory on Urban Resilience to Floods—A Basis for Alternative Planning Practices. Ecol. Soc. 2012, 17, 48. [Google Scholar] [CrossRef]
  11. Lazarus, R.S. From Psychological Stress to the Emotions: A History of Changing Outlooks. Annu. Rev. Psychol. 1993, 44, 1–22. [Google Scholar] [CrossRef] [PubMed]
  12. Wang, Y.; Cai, Y.; Xie, Y.; Chen, L.; Zhang, P. An integrated approach for evaluating dynamics of urban eco-resilience in urban agglomerations of China. Ecol. Indic. 2023, 146, 109859. [Google Scholar] [CrossRef]
  13. Wang, P.; Li, Y.; Zhang, Y. An urban system perspective on urban flood resilience using SEM: Evidence from Nanjing city, China. Nat. Hazards 2021, 109, 2575–2599. [Google Scholar] [CrossRef]
  14. Tang, D.; Li, J.; Zhao, Z.; Boamah, V.; Lansana, D.D. The influence of industrial structure transformation on urban resilience based on 110 prefecture-level cities in the Yangtze River. Sustain. Cities Soc. 2023, 96, 104621. [Google Scholar] [CrossRef]
  15. Ruan, J.; Chen, Y.; Yang, Z. Assessment of temporal and spatial progress of urban resilience in Guangzhou under rainstorm scenarios. Int. J. Disaster Risk Reduct. 2021, 66, 102578. [Google Scholar] [CrossRef]
  16. Wang, Y.; Meng, F.; Liu, H.; Zhang, C.; Fu, G. Assessing catchment scale flood resilience of urban areas using a grid cell based metric. Water Res. 2019, 163, 114852. [Google Scholar] [CrossRef]
  17. Sun, R.; Shi, S.; Reheman, Y.; Li, S. Measurement of urban flood resilience using a quantitative model based on the correlation of vulnerability and resilience. Int. J. Disaster Risk Reduct. 2022, 82, 103344. [Google Scholar] [CrossRef]
  18. Tayyab, M.; Zhang, J.; Hussain, M.; Ullah, S.; Liu, X.; Khan, S.N.; Baig, M.A.; Hassan, W.; Al-Shaibah, B. GIS-Based Urban Flood Resilience Assessment Using Urban Flood Resilience Model: A Case Study of Peshawar City, Khyber Pakhtunkhwa, Pakistan. Remote Sens. 2021, 13, 1864. [Google Scholar] [CrossRef]
  19. Wang, Y.; Zhang, C.; Chen, A.S.; Wang, G.; Fu, G. Exploring the relationship between urban flood risk and resilience at a high-resolution grid cell scale. Sci. Total Environ. 2023, 893, 164852. [Google Scholar] [CrossRef]
  20. Cao, F.; Xu, X.; Zhang, C.; Kong, W. Evaluation of urban flood resilience and its Space-Time Evolution: A case study of Zhejiang Province, China. Ecol. Indic. 2023, 154, 110643. [Google Scholar] [CrossRef]
  21. Zhang, Z.; Zhang, J.; Zhang, Y.; Chen, Y.; Yan, J. Urban Flood Resilience Evaluation Based on GIS and Multi-Source Data: A Case Study of Changchun City. Remote Sens. 2023, 15, 1872. [Google Scholar] [CrossRef]
  22. Mehryar, S.; Surminski, S. Investigating flood resilience perceptions and supporting collective decision-making through fuzzy cognitive mapping. Sci. Total Environ. 2022, 837, 155854. [Google Scholar] [CrossRef] [PubMed]
  23. Zhu, S.; Li, D.; Feng, H.; Zhang, N. The influencing factors and mechanisms for urban flood resilience in China: From the perspective of social-economic-natural complex ecosystem. Ecol. Indic. 2023, 147, 109959. [Google Scholar] [CrossRef]
  24. Zhang, Y.; Shang, K. Cloud model assessment of urban flood resilience based on PSR model and game theory. Int. J. Disaster Risk Reduct. 2023, 97, 104050. [Google Scholar] [CrossRef]
  25. Xiao, S.; Zou, L.; Xia, J.; Dong, Y.; Yang, Z.; Yao, T. Assessment of the urban waterlogging resilience and identification of its driving factors: A case study of Wuhan City, China. Sci. Total Environ. 2023, 866, 161321. [Google Scholar] [CrossRef]
  26. Liang, Y.; Wang, C.; Chen, G.; Xie, Z. Evaluation framework ACR-UFDR for urban form disaster resilience under rainstorm and flood scenarios: A case study in Nanjing, China. Sustain. Cities Soc. 2024, 107, 105424. [Google Scholar] [CrossRef]
  27. Zhu, S.; Li, D.; Huang, G.; Chhipi-Shrestha, G.; Nahiduzzaman, K.M.; Hewage, K.; Sadiq, R. Enhancing urban flood resilience: A holistic framework incorporating historic worst flood to Yangtze River Delta, China. Int. J. Disaster Risk Reduct. 2021, 61, 102355. [Google Scholar] [CrossRef]
  28. Xu, T.; Xie, Z.; Jiang, F.; Yang, S.; Deng, Z.; Zhao, L.; Wen, G.; Du, Q. Urban flooding resilience evaluation with coupled rainfall and flooding models: A small area in Kunming City, China as an example. Water Sci. Technol. 2023, 87, 2820–2839. [Google Scholar] [CrossRef]
  29. Razafindrabe, B.H.N.; Cuesta, M.A.; He, B.; Rañola Jr, R.F.; Yaota, K.; Inoue, S.; Saito, S.; Masuda, T.; Concepcion, R.N.; Santos-Borja, A.; et al. Flood risk and resilience assessment for Santa Rosa-Silang subwatershed in the Laguna Lake region, Philippines. Environ. Hazards 2015, 14, 16–35. [Google Scholar] [CrossRef]
  30. Li, X.; Hui, E.C.M.; Chen, T.; Lang, W.; Guo, Y. From Habitat III to the new urbanization agenda in China: Seeing through the practices of the “three old renewals” in Guangzhou. Land Use Policy 2019, 81, 513–522. [Google Scholar] [CrossRef]
  31. Li, Z.; Zhang, X.; Ma, Y.; Feng, C.; Hajiyev, A. A multi-criteria decision making method for urban flood resilience evaluation with hybrid uncertainties. Int. J. Disaster Risk Reduct. 2019, 36, 101140. [Google Scholar] [CrossRef]
  32. Javadpoor, M.; Sharifi, A.; Roosta, M. An adaptation of the Baseline Resilience Indicators for Communities (BRIC) for assessing resilience of Iranian provinces. Int. J. Disaster Risk Reduct. 2021, 66, 102609. [Google Scholar] [CrossRef]
  33. Zhou, R.; Zhou, Y.; Zhu, W.; Feng, L.; Liu, L. Projecting Water Yield Amidst Rapid Urbanization: A Case Study of the Taihu Lake Basin. Land 2025, 14, 149. [Google Scholar] [CrossRef]
  34. Ji, J.; Fang, L.; Chen, J.; Ding, T. A novel framework for urban flood resilience assessment at the urban agglomeration scale. Int. J. Disaster Risk Reduct. 2024, 108, 104519. [Google Scholar] [CrossRef]
  35. Abdrabo, K.I.; Kantoush, S.A.; Esmaiel, A.; Saber, M.; Sumi, T.; Almamari, M.; Elboshy, B.; Ghoniem, S. An integrated indicator-based approach for constructing an urban flood vulnerability index as an urban decision-making tool using the PCA and AHP techniques: A case study of Alexandria, Egypt. Urban Clim. 2023, 48, 101426. [Google Scholar] [CrossRef]
  36. Chen, Z.; Zhu, S.; Feng, H.; Zhang, H.; Li, D. Coupling dynamics of urban flood resilience in china from 2012 to 2022: A network-based approach. Sustain. Cities Soc. 2025, 118, 105996. [Google Scholar] [CrossRef]
  37. Dong, B.; Xia, J.; Li, Q.; Zhou, M. Risk assessment for people and vehicles in an extreme urban flood: Case study of the “7.20” flood event in Zhengzhou, China. Int. J. Disaster Risk Reduct. 2022, 80, 103205. [Google Scholar] [CrossRef]
  38. DB51/T 2829-2021; Assessment Technical Specification for Rainstorm and Flood Disaster Risk. Administration for Market Regulation of Sichuan Province: Chengdu, China, 2021.
  39. Jia, H.; Chen, F.; Pan, D.; Du, E.; Wang, L.; Wang, N.; Yang, A. Flood risk management in the Yangtze River basin —Comparison of 1998 and 2020 events. Int. J. Disaster Risk Reduct. 2022, 68, 102724. [Google Scholar] [CrossRef]
  40. Merz, B.; Blöschl, G.; Vorogushyn, S.; Dottori, F.; Aerts, J.C.J.H.; Bates, P.; Bertola, M.; Kemter, M.; Kreibich, H.; Lall, U.; et al. Causes, impacts and patterns of disastrous river floods. Nat. Rev. Earth Environ. 2021, 2, 592–609. [Google Scholar] [CrossRef]
  41. Rus, K.; Kilar, V.; Koren, D. Resilience assessment of complex urban systems to natural disasters: A new literature review. Int. J. Disaster Risk Reduct. 2018, 31, 311–330. [Google Scholar] [CrossRef]
  42. Liu, Y.; Yan, J.; Cen, M.; Fang, Q.; Liu, Z.; Li, Y. A graded index for evaluating precipitation heterogeneity in China. J. Geogr. Sci. 2016, 26, 673–693. [Google Scholar] [CrossRef]
  43. Zhou, S.; Zhang, D.; Wang, M.; Liu, Z.; Gan, W.; Zhao, Z.; Xue, S.; Müller, B.; Zhou, M.; Ni, X.; et al. Risk-driven composition decoupling analysis for urban flooding prediction in high-density urban areas using Bayesian-Optimized LightGBM. J. Clean. Prod. 2024, 457, 142286. [Google Scholar] [CrossRef]
  44. Chakraborty, L.; Rus, H.; Henstra, D.; Thistlethwaite, J.; Minano, A.; Scott, D. Exploring spatial heterogeneity and environmental injustices in exposure to flood hazards using geographically weighted regression. Environ. Res. 2022, 210, 112982. [Google Scholar] [CrossRef]
  45. Hopkins, K.D.; Taylor, C.L.; Zubrick, S.R. Psychosocial resilience and vulnerability in Western Australian Aboriginal youth. Child Abus. Negl. 2018, 78, 85–95. [Google Scholar] [CrossRef] [PubMed]
  46. Forrest, S.A.; Trell, E.-M.; Woltjer, J. Socio-spatial inequalities in flood resilience: Rainfall flooding in the city of Arnhem. Cities 2020, 105, 102843. [Google Scholar] [CrossRef]
  47. Tellman, B.; Sullivan, J.A.; Kuhn, C.; Kettner, A.J.; Doyle, C.S.; Brakenridge, G.R.; Erickson, T.A.; Slayback, D.A. Satellite imaging reveals increased proportion of population exposed to floods. Nature 2021, 596, 80–86. [Google Scholar] [CrossRef] [PubMed]
  48. Chen, J.; Li, Q.; Wang, H.; Deng, M. A Machine Learning Ensemble Approach Based on Random Forest and Radial Basis Function Neural Network for Risk Evaluation of Regional Flood Disaster: A Case Study of the Yangtze River Delta, China. Int. J. Environ. Res. Public Health 2020, 17, 49. [Google Scholar] [CrossRef]
  49. Liu, D.; Feng, J.; Li, H.; Fu, Q.; Li, M.; Faiz, M.A.; Ali, S.; Li, T.; Khan, M.I. Spatiotemporal variation analysis of regional flood disaster resilience capability using an improved projection pursuit model based on the wind-driven optimization algorithm. J. Clean. Prod. 2019, 241, 118406. [Google Scholar] [CrossRef]
  50. Liu, J.; Wang, X.; Gao, G. Spatiotemporal Evolution and Determinants of Urban Flood Resilience: A Case Study of Yellow River Basin. Sustainability 2025, 17, 1433. [Google Scholar] [CrossRef]
  51. Geng, Y.; Huang, X.; Zhong, Y.; Wang, Z. The impact of complex terrain on urban flood resilience under extreme rainfall events. J. Hydrol. 2025, 651, 132597. [Google Scholar] [CrossRef]
  52. Zhu, D.; Chen, H.; Mei, Y.D.; Xu, X.F.; Guo, S. Exploration of Relationships between Flood Control Capacity and Peak Flow Reduction in a Multireservoir System Using an Optimization-Clustering-Fitting Framework. J. Water Resour. Plan. Manag. 2022, 148, 05022002. [Google Scholar] [CrossRef]
  53. Lu, H.; Lu, X.; Jiao, L.; Zhang, Y. Evaluating urban agglomeration resilience to disaster in the Yangtze Delta city group in China. Sustain. Cities Soc. 2022, 76, 103464. [Google Scholar] [CrossRef]
  54. Dąbrowska, J.; Menéndez Orellana, A.E.; Kilian, W.; Moryl, A.; Cielecka, N.; Michałowska, K.; Policht-Latawiec, A.; Michalski, A.; Bednarek, A.; Włóka, A. Between flood and drought: How cities are facing water surplus and scarcity. J. Environ. Manag. 2023, 345, 118557. [Google Scholar] [CrossRef]
  55. Bukvic, A.; Smith, A.; Zhang, A. Evaluating drivers of coastal relocation in Hurricane Sandy affected communities. Int. J. Disaster Risk Reduct. 2015, 13, 215–228. [Google Scholar] [CrossRef]
  56. Lu, X.; Liao, W.; Fang, D.; Lin, K.; Tian, Y.; Zhang, C.; Zheng, Z.; Zhao, P. Quantification of disaster resilience in civil engineering: A review. J. Saf. Sci. Resil. 2020, 1, 19–30. [Google Scholar] [CrossRef]
  57. Huang, G.; Li, D.; Zhu, X.; Zhu, J. Influencing factors and their influencing mechanisms on urban resilience in China. Sustain. Cities Soc. 2021, 74, 103210. [Google Scholar] [CrossRef]
  58. Zhang, Q.; Junyan, H.; Xuping, S.; Zhihong, L.; Kehu, Y.; and Sha, Y. How does social learning facilitate urban disaster resilience? A systematic review. Environ. Hazards 2020, 19, 107–129. [Google Scholar] [CrossRef]
  59. Leandro, J.; Chen, K.-F.; Wood, R.R.; Ludwig, R. A scalable flood-resilience-index for measuring climate change adaptation: Munich city. Water Res. 2020, 173, 115502. [Google Scholar] [CrossRef]
  60. Gall, M.; Borden, K.A.; Emrich, C.T.; Cutter, S.L. The Unsustainable Trend of Natural Hazard Losses in the United States. Sustainability 2011, 3, 2157–2181. [Google Scholar] [CrossRef]
  61. Rana, I.A.; Bhatti, S.S.; Jamshed, A.; Ahmad, S. An approach to understanding the intrinsic complexity of resilience against floods: Evidences from three urban communities of Pakistan. Int. J. Disaster Risk Reduct. 2021, 63, 102442. [Google Scholar] [CrossRef]
  62. Machado, C.G.; Pinheiro de Lima, E.; Gouvea da Costa, S.E.; Angelis, J.J.; Mattioda, R.A. Framing maturity based on sustainable operations management principles. Int. J. Prod. Econ. 2017, 190, 3–21. [Google Scholar] [CrossRef]
  63. Tutak, M.; Brodny, J. Renewable energy consumption in economic sectors in the EU-27. The impact on economics, environment and conventional energy sources. A 20-year perspective. J. Clean. Prod. 2022, 345, 131076. [Google Scholar] [CrossRef]
  64. Usman, M.; Hammar, N. Dynamic relationship between technological innovations, financial development, renewable energy, and ecological footprint: Fresh insights based on the STIRPAT model for Asia Pacific Economic Cooperation countries. Environ. Sci. Pollut. Res. 2021, 28, 15519–15536. [Google Scholar] [CrossRef] [PubMed]
  65. Rahman, M.M. Do population density, economic growth, energy use and exports adversely affect environmental quality in Asian populous countries? Renew. Sustain. Energy Rev. 2017, 77, 506–514. [Google Scholar] [CrossRef]
  66. Bertilsson, L.; Wiklund, K.; de Moura Tebaldi, I.; Rezende, O.M.; Veról, A.P.; Miguez, M.G. Urban flood resilience—A multi-criteria index to integrate flood resilience into urban planning. J. Hydrol. 2019, 573, 970–982. [Google Scholar] [CrossRef]
  67. Khare, N.; Devan, P.; Chowdhary, C.L.; Bhattacharya, S.; Singh, G.; Singh, S.; Yoon, B. SMO-DNN: Spider Monkey Optimization and Deep Neural Network Hybrid Classifier Model for Intrusion Detection. Electronics 2020, 9, 692. [Google Scholar] [CrossRef]
  68. Zhu, Y.; Tian, D.; Yan, F. Effectiveness of Entropy Weight Method in Decision-Making. Math. Probl. Eng. 2020, 2020, 3564835. [Google Scholar] [CrossRef]
  69. Wang, M.; Wang, Y.; Shen, F.; Jin, J. A novel classification approach based on integrated connection cloud model and game theory. Commun. Nonlinear Sci. Numer. Simul. 2021, 93, 105540. [Google Scholar] [CrossRef]
  70. Ma, M.; Zhang, Y.; Zhang, J.; Li, M.; Zhu, J.; Wang, Y. Assessment of urban seismic social vulnerability based on game theory combination and TOPSIS model: A case study of Changchun City. Sci. Rep. 2025, 15, 8189. [Google Scholar] [CrossRef]
  71. Rafiei-Sardooi, E.; Azareh, A.; Choubin, B.; Mosavi, A.H.; Clague, J.J. Evaluating urban flood risk using hybrid method of TOPSIS and machine learning. Int. J. Disaster Risk Reduct. 2021, 66, 102614. [Google Scholar] [CrossRef]
  72. Zheng, J.; Huang, G. A novel grid cell–based urban flood resilience metric considering water velocity and duration of system performance being impacted. J. Hydrol. 2023, 617, 128911. [Google Scholar] [CrossRef]
  73. Park, S.; Kim, J.; Yun, H.; Kang, J. Exploring the network structure of coupled green-grey infrastructure to enhance urban pluvial flood resilience: A scenario-based approach focusing on ‘centralized’ and ‘decentralized’ structures. J. Environ. Manag. 2024, 370, 122344. [Google Scholar] [CrossRef] [PubMed]
  74. Wang, W.; Xu, C.; He, J.; Chi, Z.; Bai, W.; Liu, R. Resilience-Vulnerability Balance and Obstacle Factor Analysis in Urban Flooding: A Case Study in the Qinghai–Tibetan Plateau. Buildings 2024, 14, 1274. [Google Scholar] [CrossRef]
  75. Zhou, J.; Liu, W. Monitoring and Evaluation of Eco-Environment Quality Based on Remote Sensing-Based Ecological Index (RSEI) in Taihu Lake Basin, China. Sustainability 2022, 14, 5642. [Google Scholar] [CrossRef]
  76. Cheng, X.T.; Evans, E.P.; Wu, H.Y.; Thorne, C.R.; Han, S.; Simm, J.D.; Hall, J.W. A framework for long-term scenario analysis in the Taihu Basin, China. J. Flood Risk Manag. 2013, 6, 3–13. [Google Scholar] [CrossRef]
Figure 1. Evaluation framework.
Land 14 01328 g001
Figure 2. Study area.
Land 14 01328 g002
Figure 3. Indicator correlation heatmap.
Land 14 01328 g003
Figure 4. The interannual variation of (a) hazard, (b) VAE, (c) DAR, and (d) UFR in the TLB from 1999 to 2020.
Land 14 01328 g004
Figure 5. Spatial pattern and evolution of UFR and categories in the TLB.
Land 14 01328 g005
Table 2. Grade classification.
LevelUFRHazardVAEDAR
very high 0.55 R j 1 0.73 R j 1 0.54 R j 1 0.59 R j 1
high 0.50 R j < 0.55 0.55 R j < 0.73 0.46 R j < 0.54 0.42 R j < 0.59
medium 0.45 R j < 0.50 0.42 R j < 0.55 0.40 R j < 0.46 0.32 R j < 0.42
low 0.39 R j < 0.45 0.30 R j < 0.42 0.32 R j < 0.40 0.17 R j < 0.32
very low 0 R j < 0.39 0 R j < 0.30 0 R j < 0.32 0 R j < 0.17
Table 3. Indicator weight.
CategoryIndicators w A H P w E W M w G Category Weight
HazardC1 Flood-season precipitation0.0880.0540.0870.224
C2 Precipitation concentration degree0.0620.0540.062
C3 Frequency of heavy rainfall0.0440.0540.045
C4 Coverage of heavy rainfall0.0310.0150.030
VulnerabilityC5 Population age structure0.0710.0530.0700.170
C6 Education level0.0560.0490.056
C7 Proportion of economic losses caused by disasters0.0440.0540.045
ExposureC8 Land development intensity0.0740.0520.0730.179
C9 Economic density0.0470.0550.047
C10 Crop planting area0.0590.0500.059
Defense capacityC11 Actual drainage capacity0.0200.0380.0200.224
C12 Drainage pipeline density0.0940.0330.091
C13 Water resource regulation and storage capacity0.0500.0460.050
C14 Early warning issuance capacity0.0210.0470.022
C15 Lifeline engineering mitigation capability0.0160.0490.018
C16 Emergency command and control capabilities0.0130.0270.014
C17 Smart water conservancy development capacity0.0080.0390.009
Recovery capacityC18 Emergency management capability0.0300.0420.0310.202
C19 Medical capacity0.0860.0480.085
C20 Residents’ economic status0.0400.0460.040
C21 Road network density0.0260.0430.027
C22 Coverage rate of disaster insurance0.0180.0530.020
Disclaimer/Publisher’s Note: The statements, opinions and data contained in all publications are solely those of the individual author(s) and contributor(s) and not of MDPI and/or the editor(s). MDPI and/or the editor(s) disclaim responsibility for any injury to people or property resulting from any ideas, methods, instructions or products referred to in the content.

