


Identifying Spatiotemporal Circles of Residents’ Daily Walking in Historic and Modern Districts: An Empirical Study in Nanjing, China


Abstract
1. Introduction
2. Literature Review
2.1. Purpose of Walking
2.2. Walking Speed
2.3. Walking Distance
3. Materials and Methods
3.1. Practice of the “15-Minute City” in China
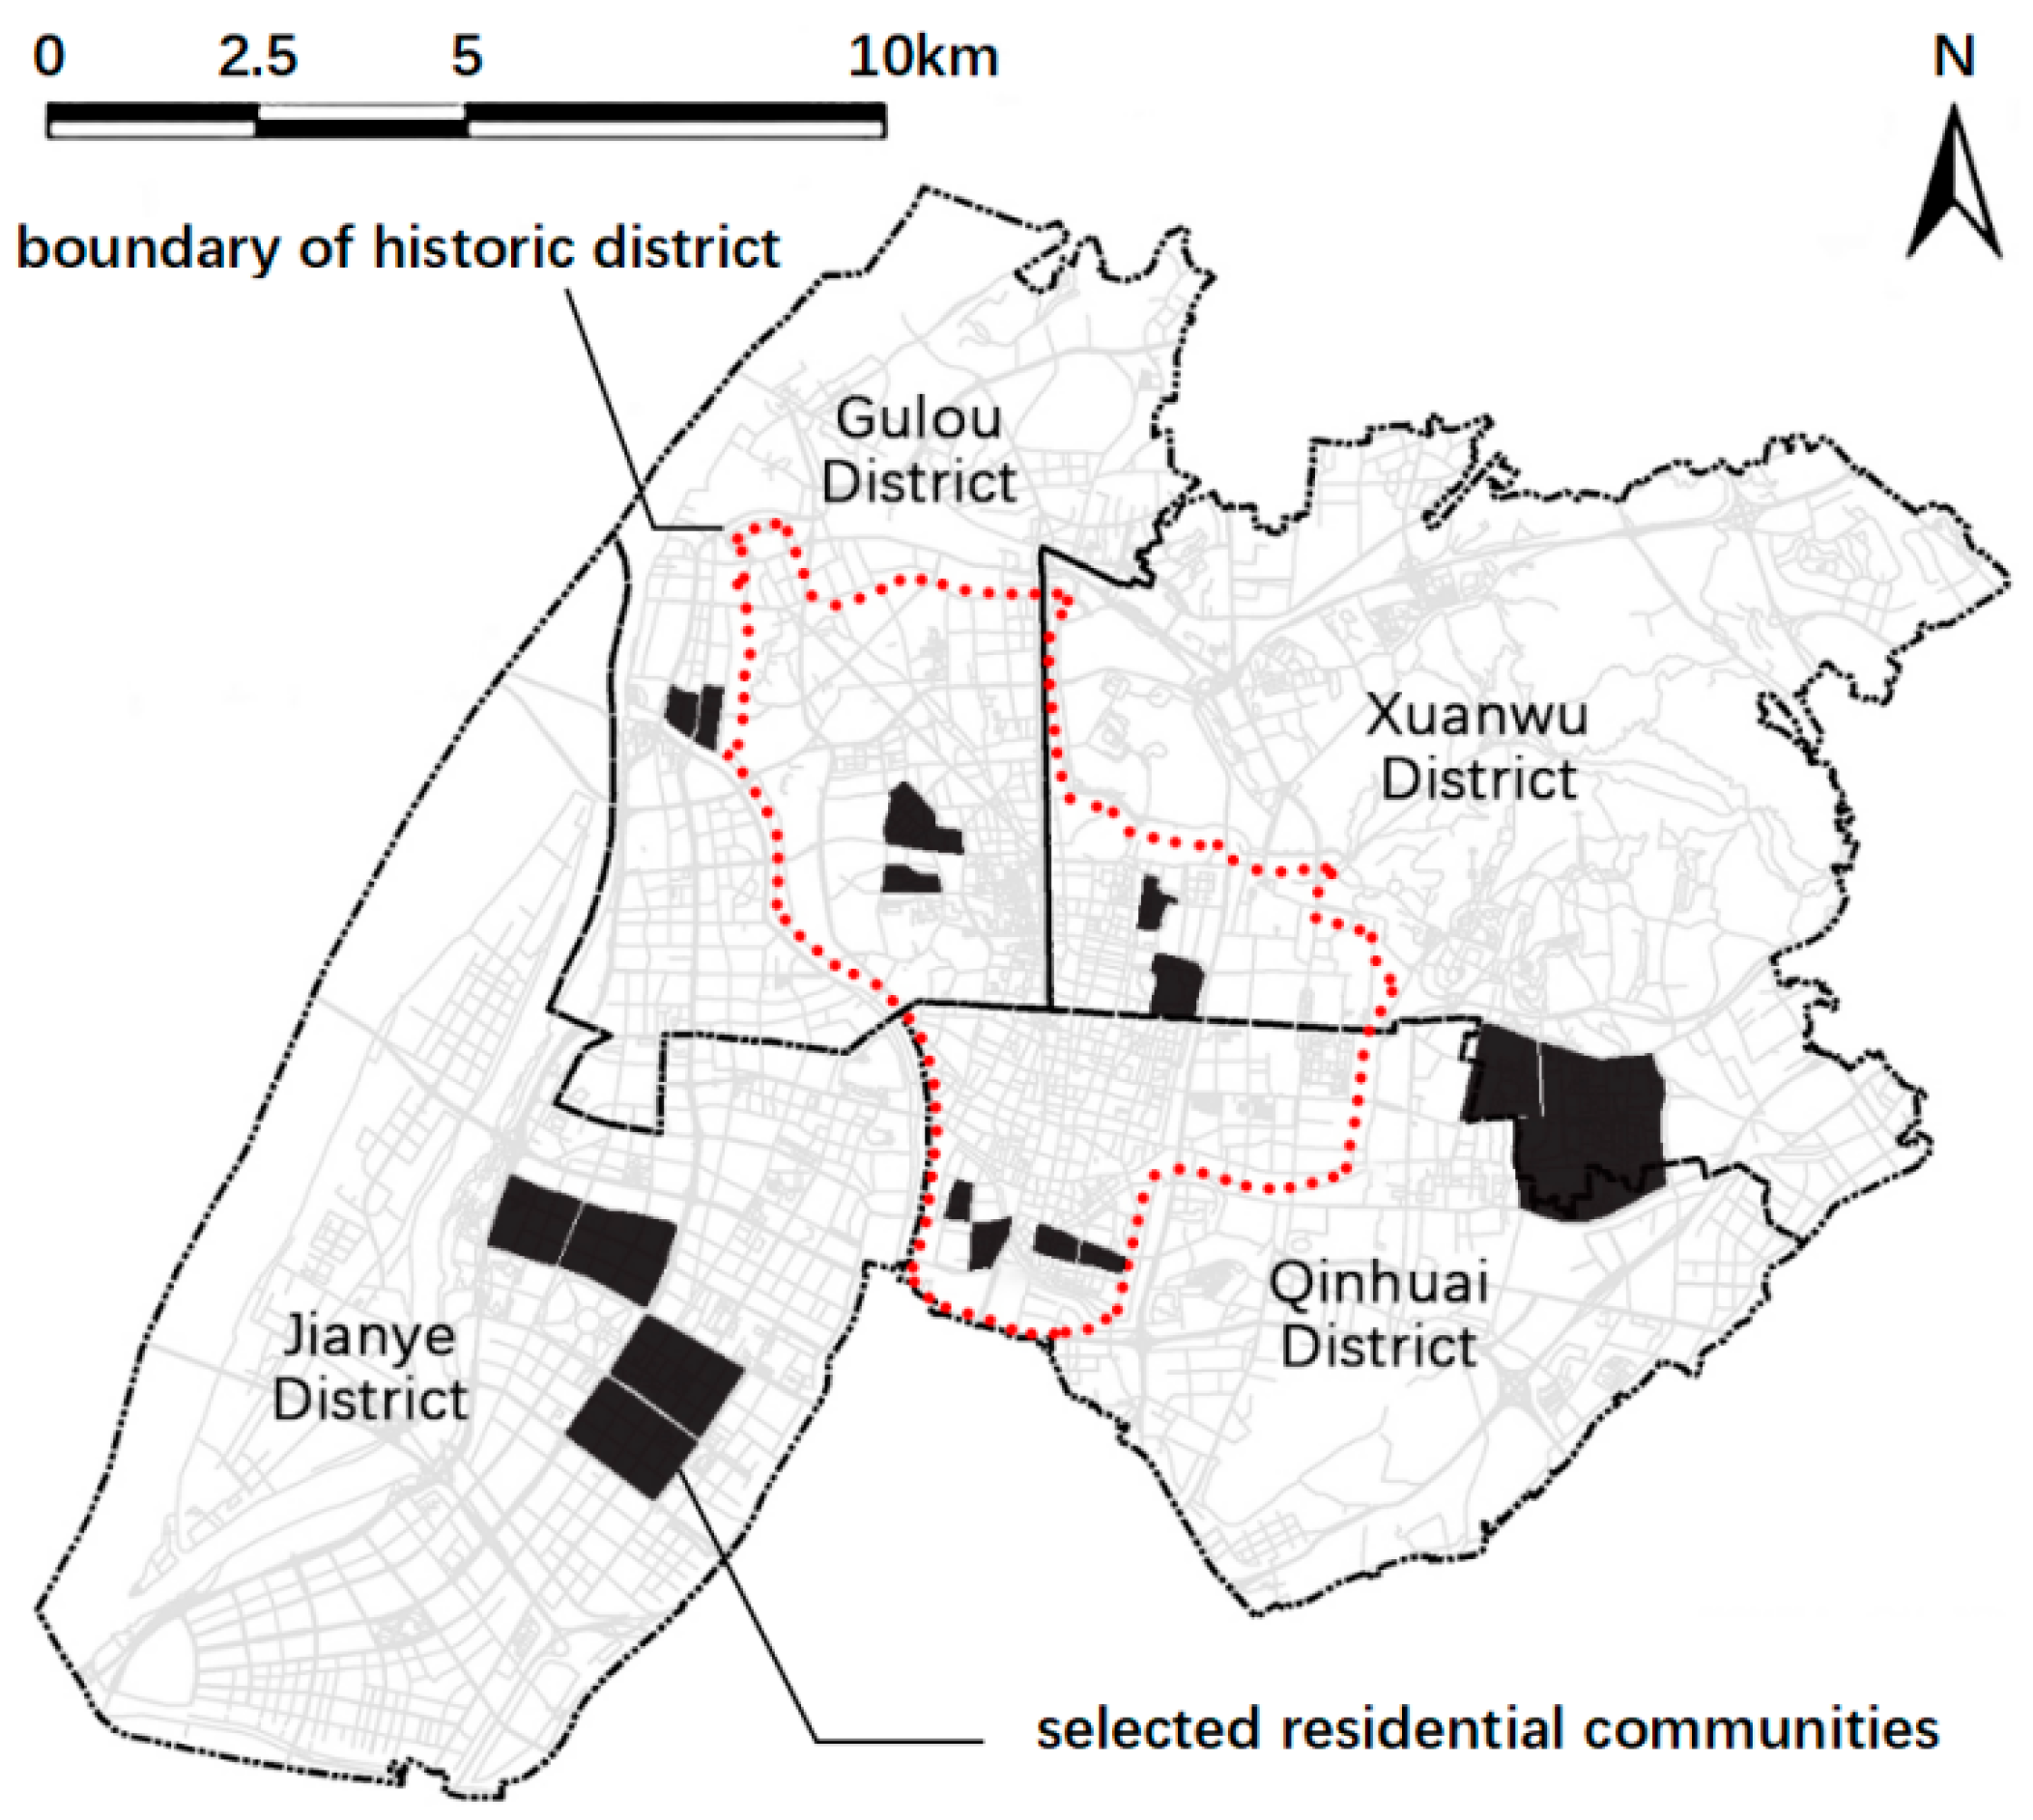
3.2. Data Collection Through Walking Activity Logs
4. Results
4.1. Spatial Features of Residents’ Walking Activities
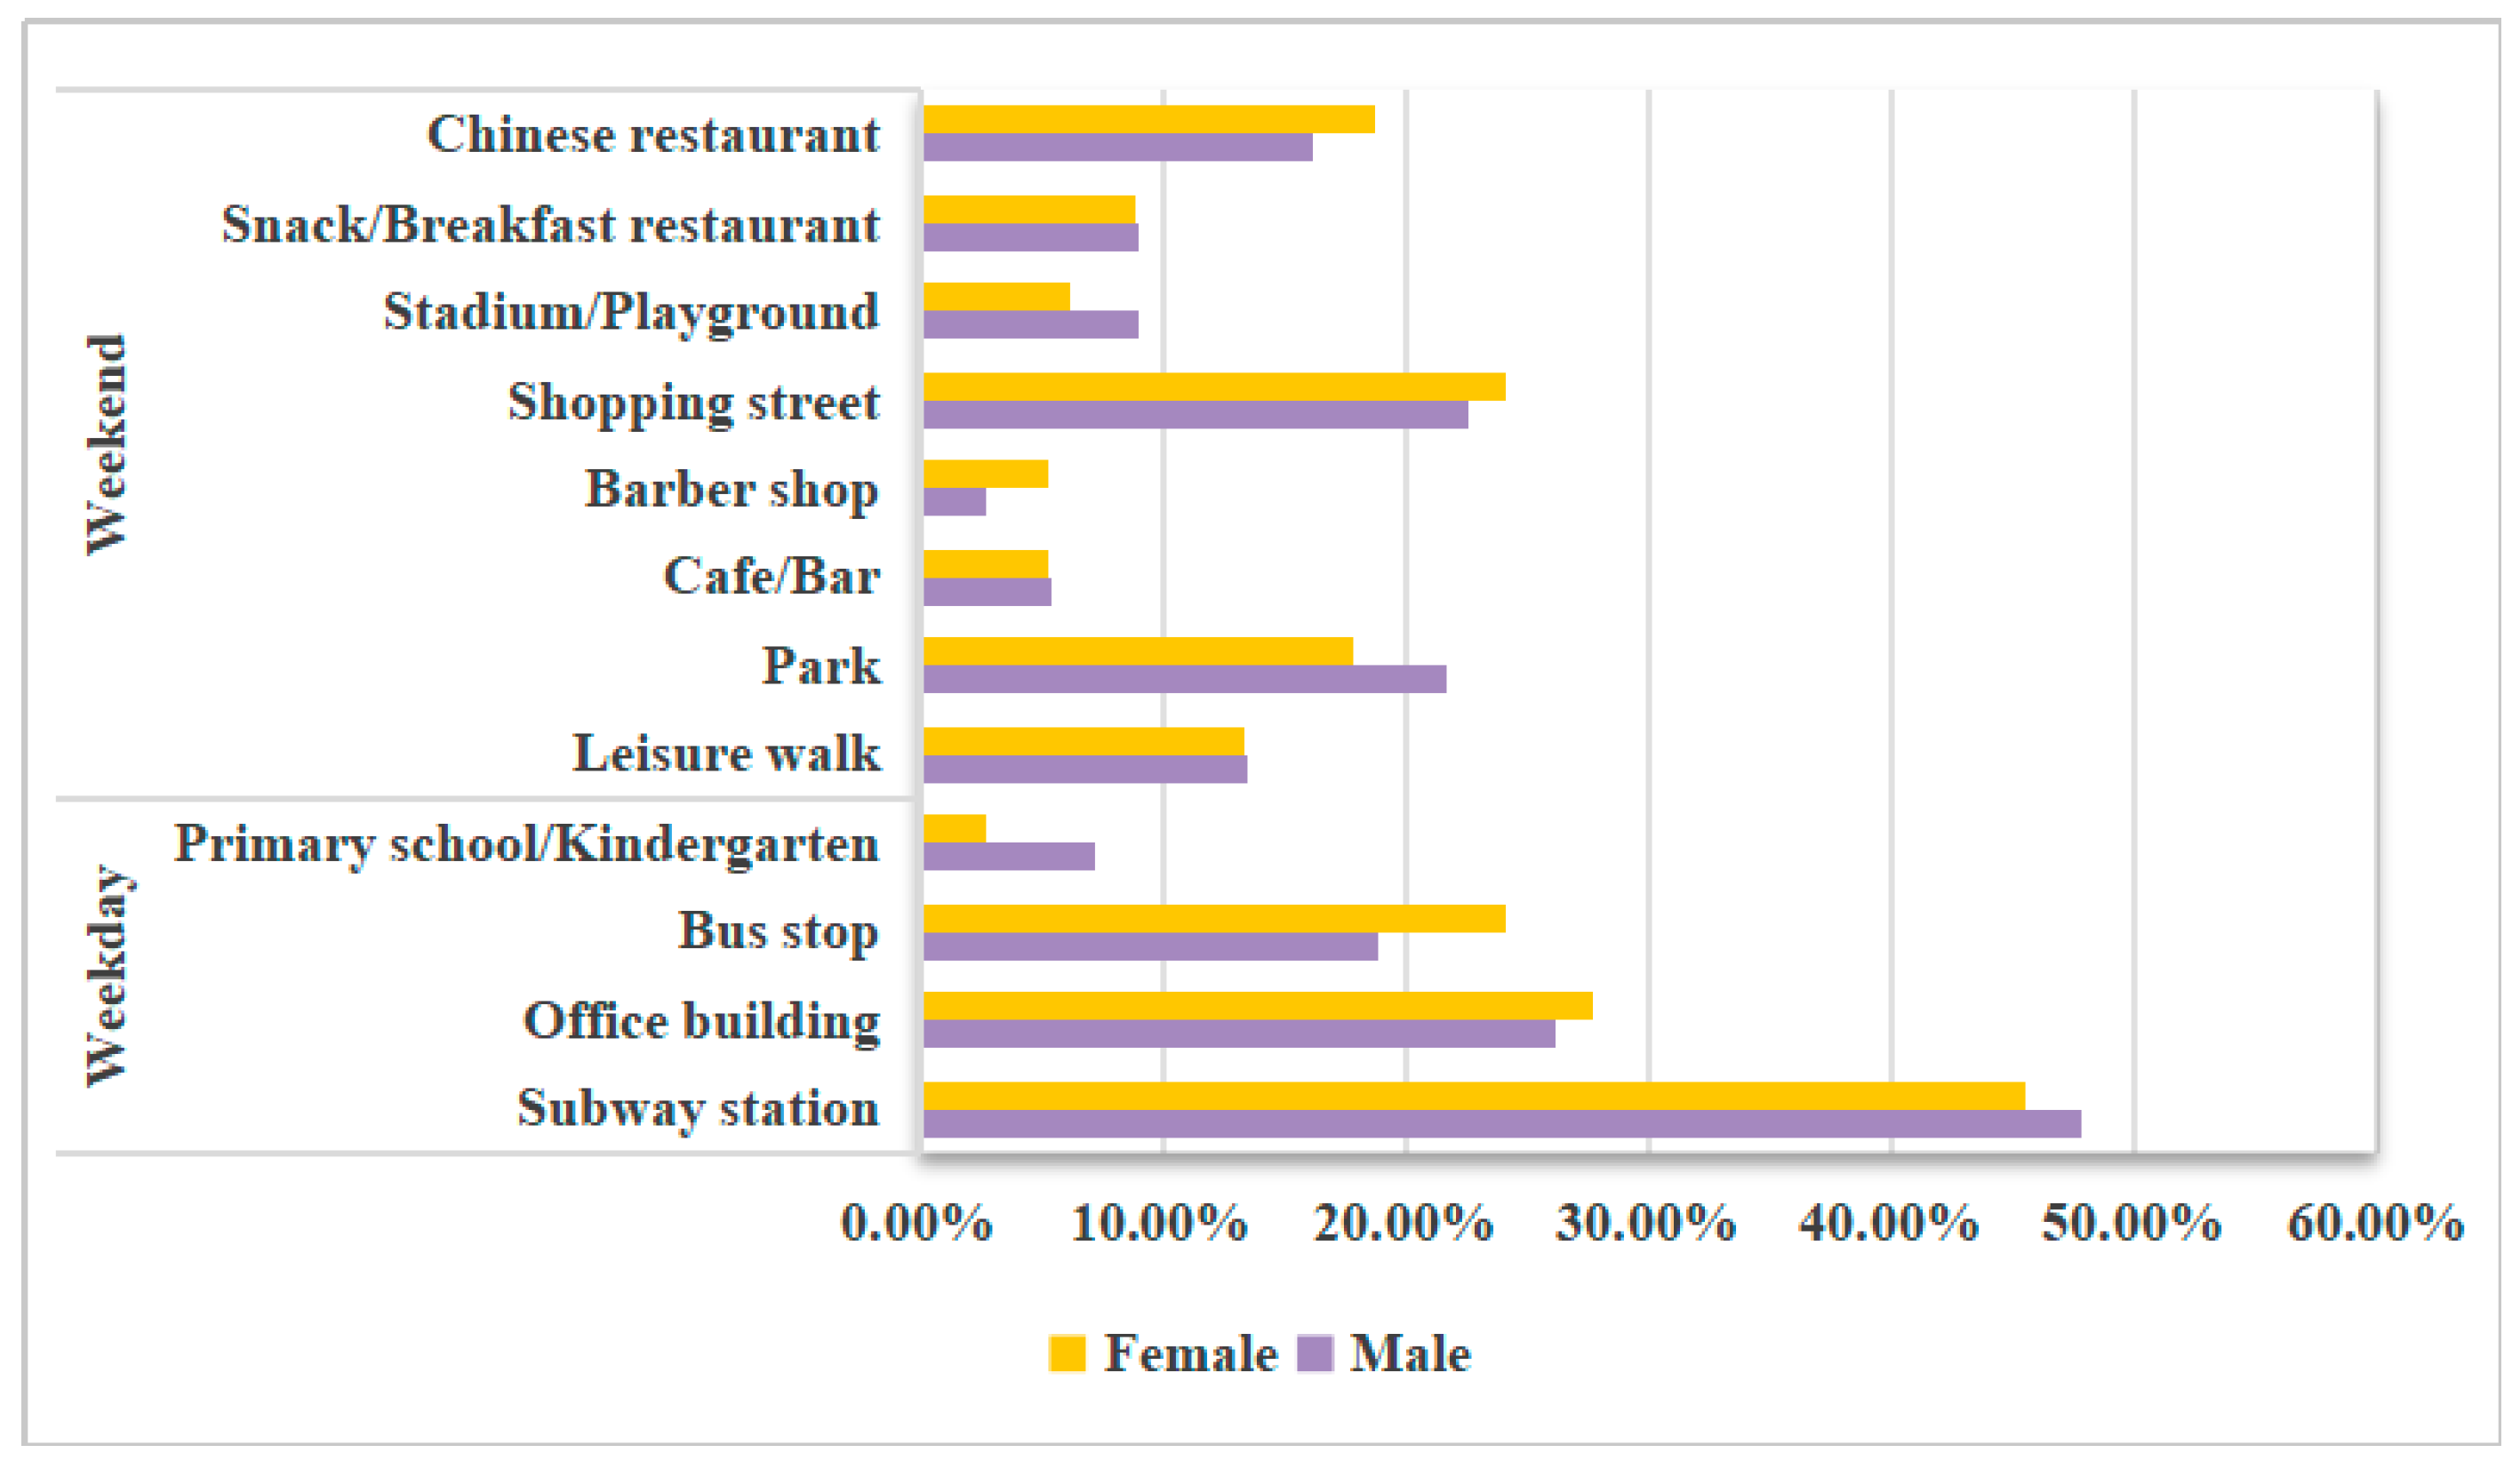
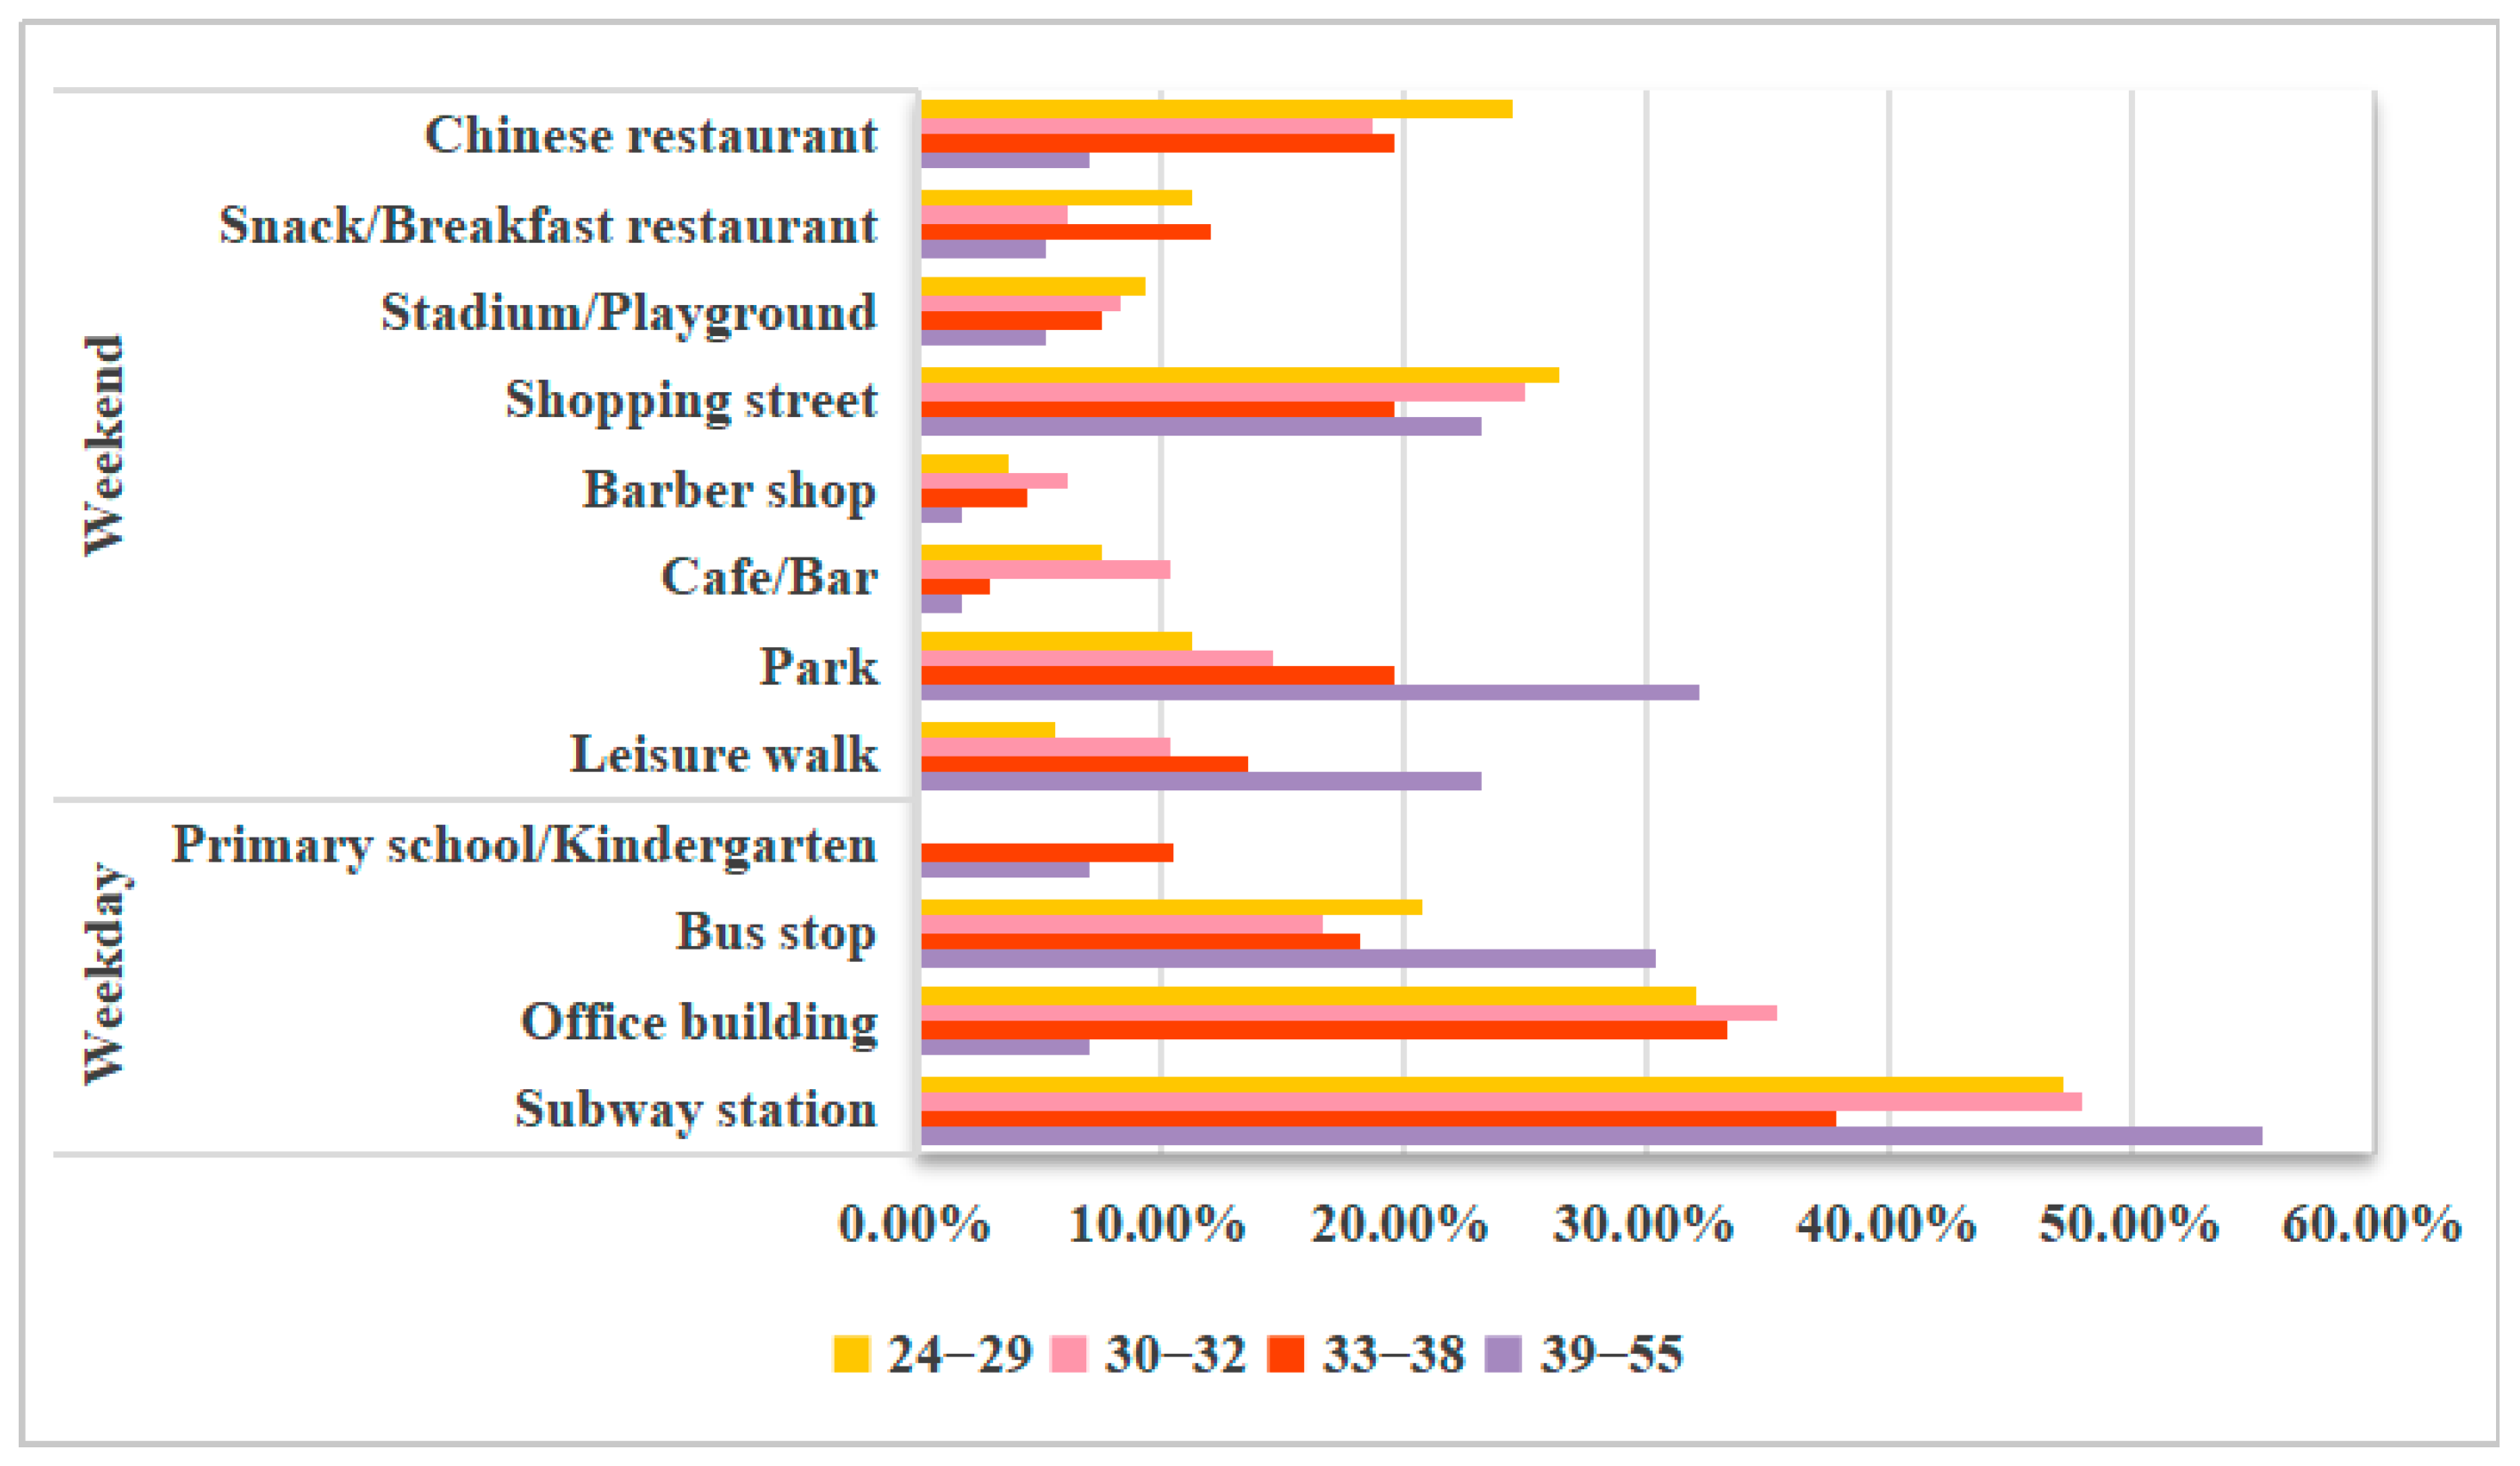
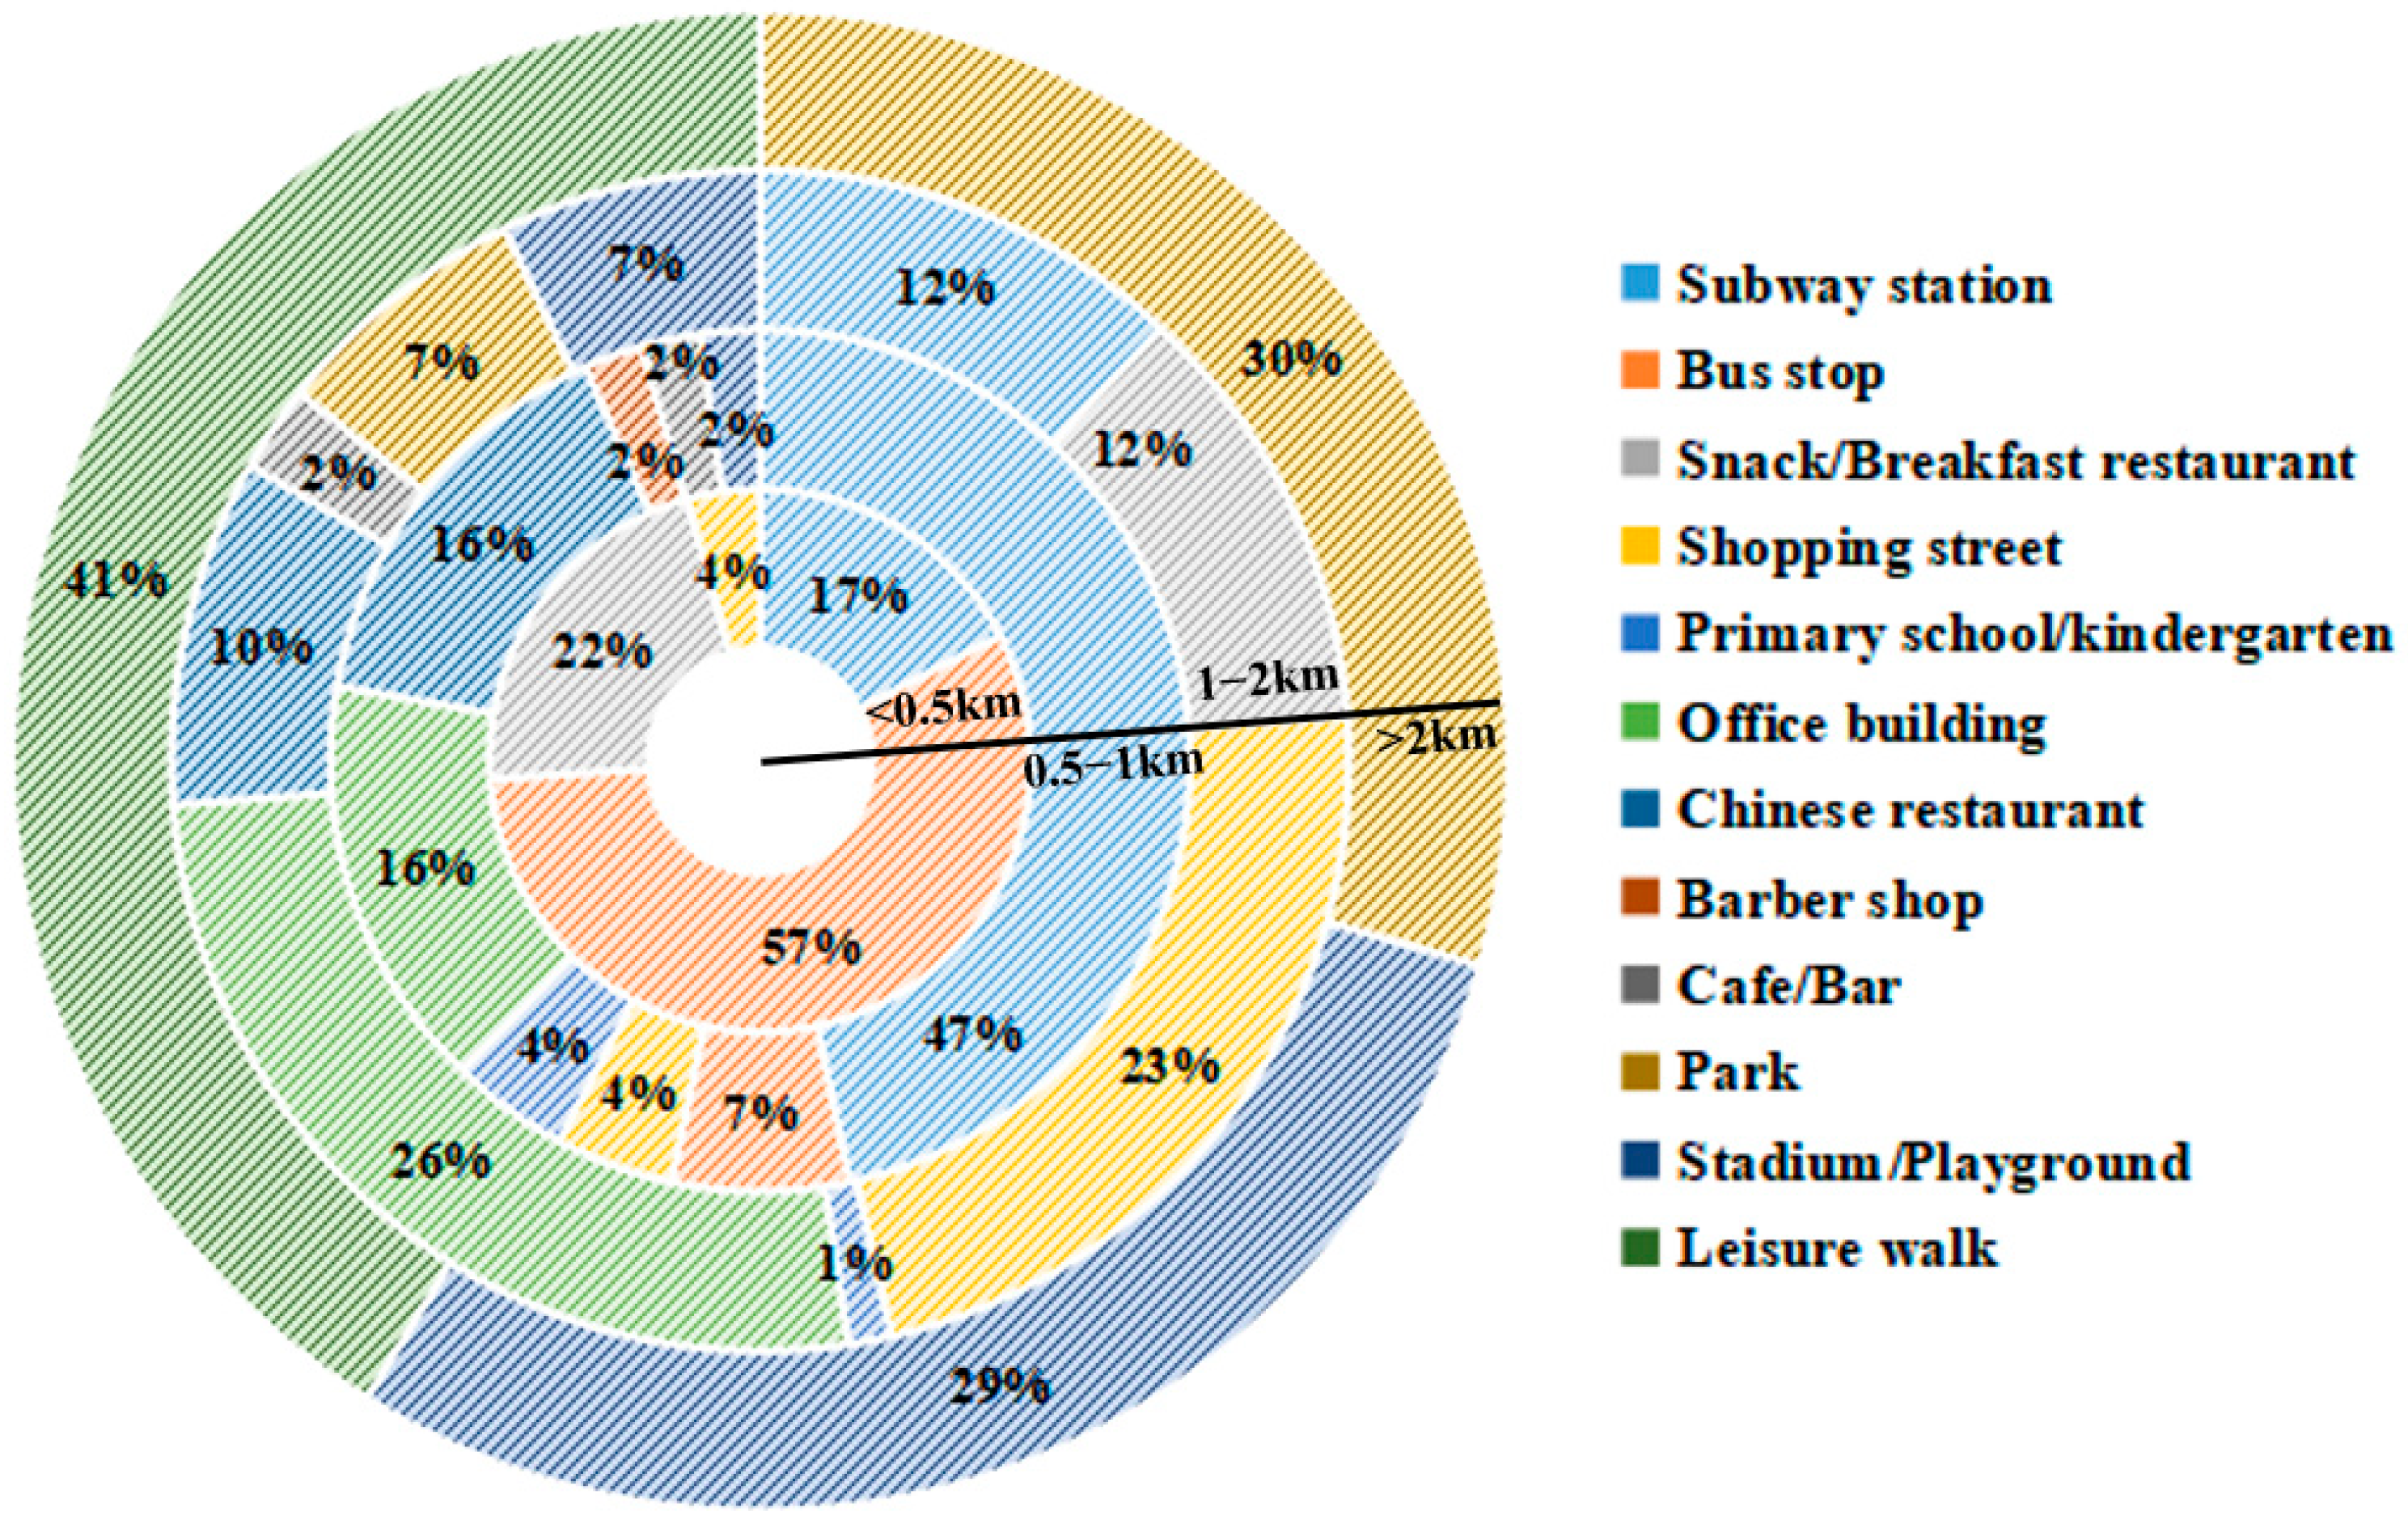
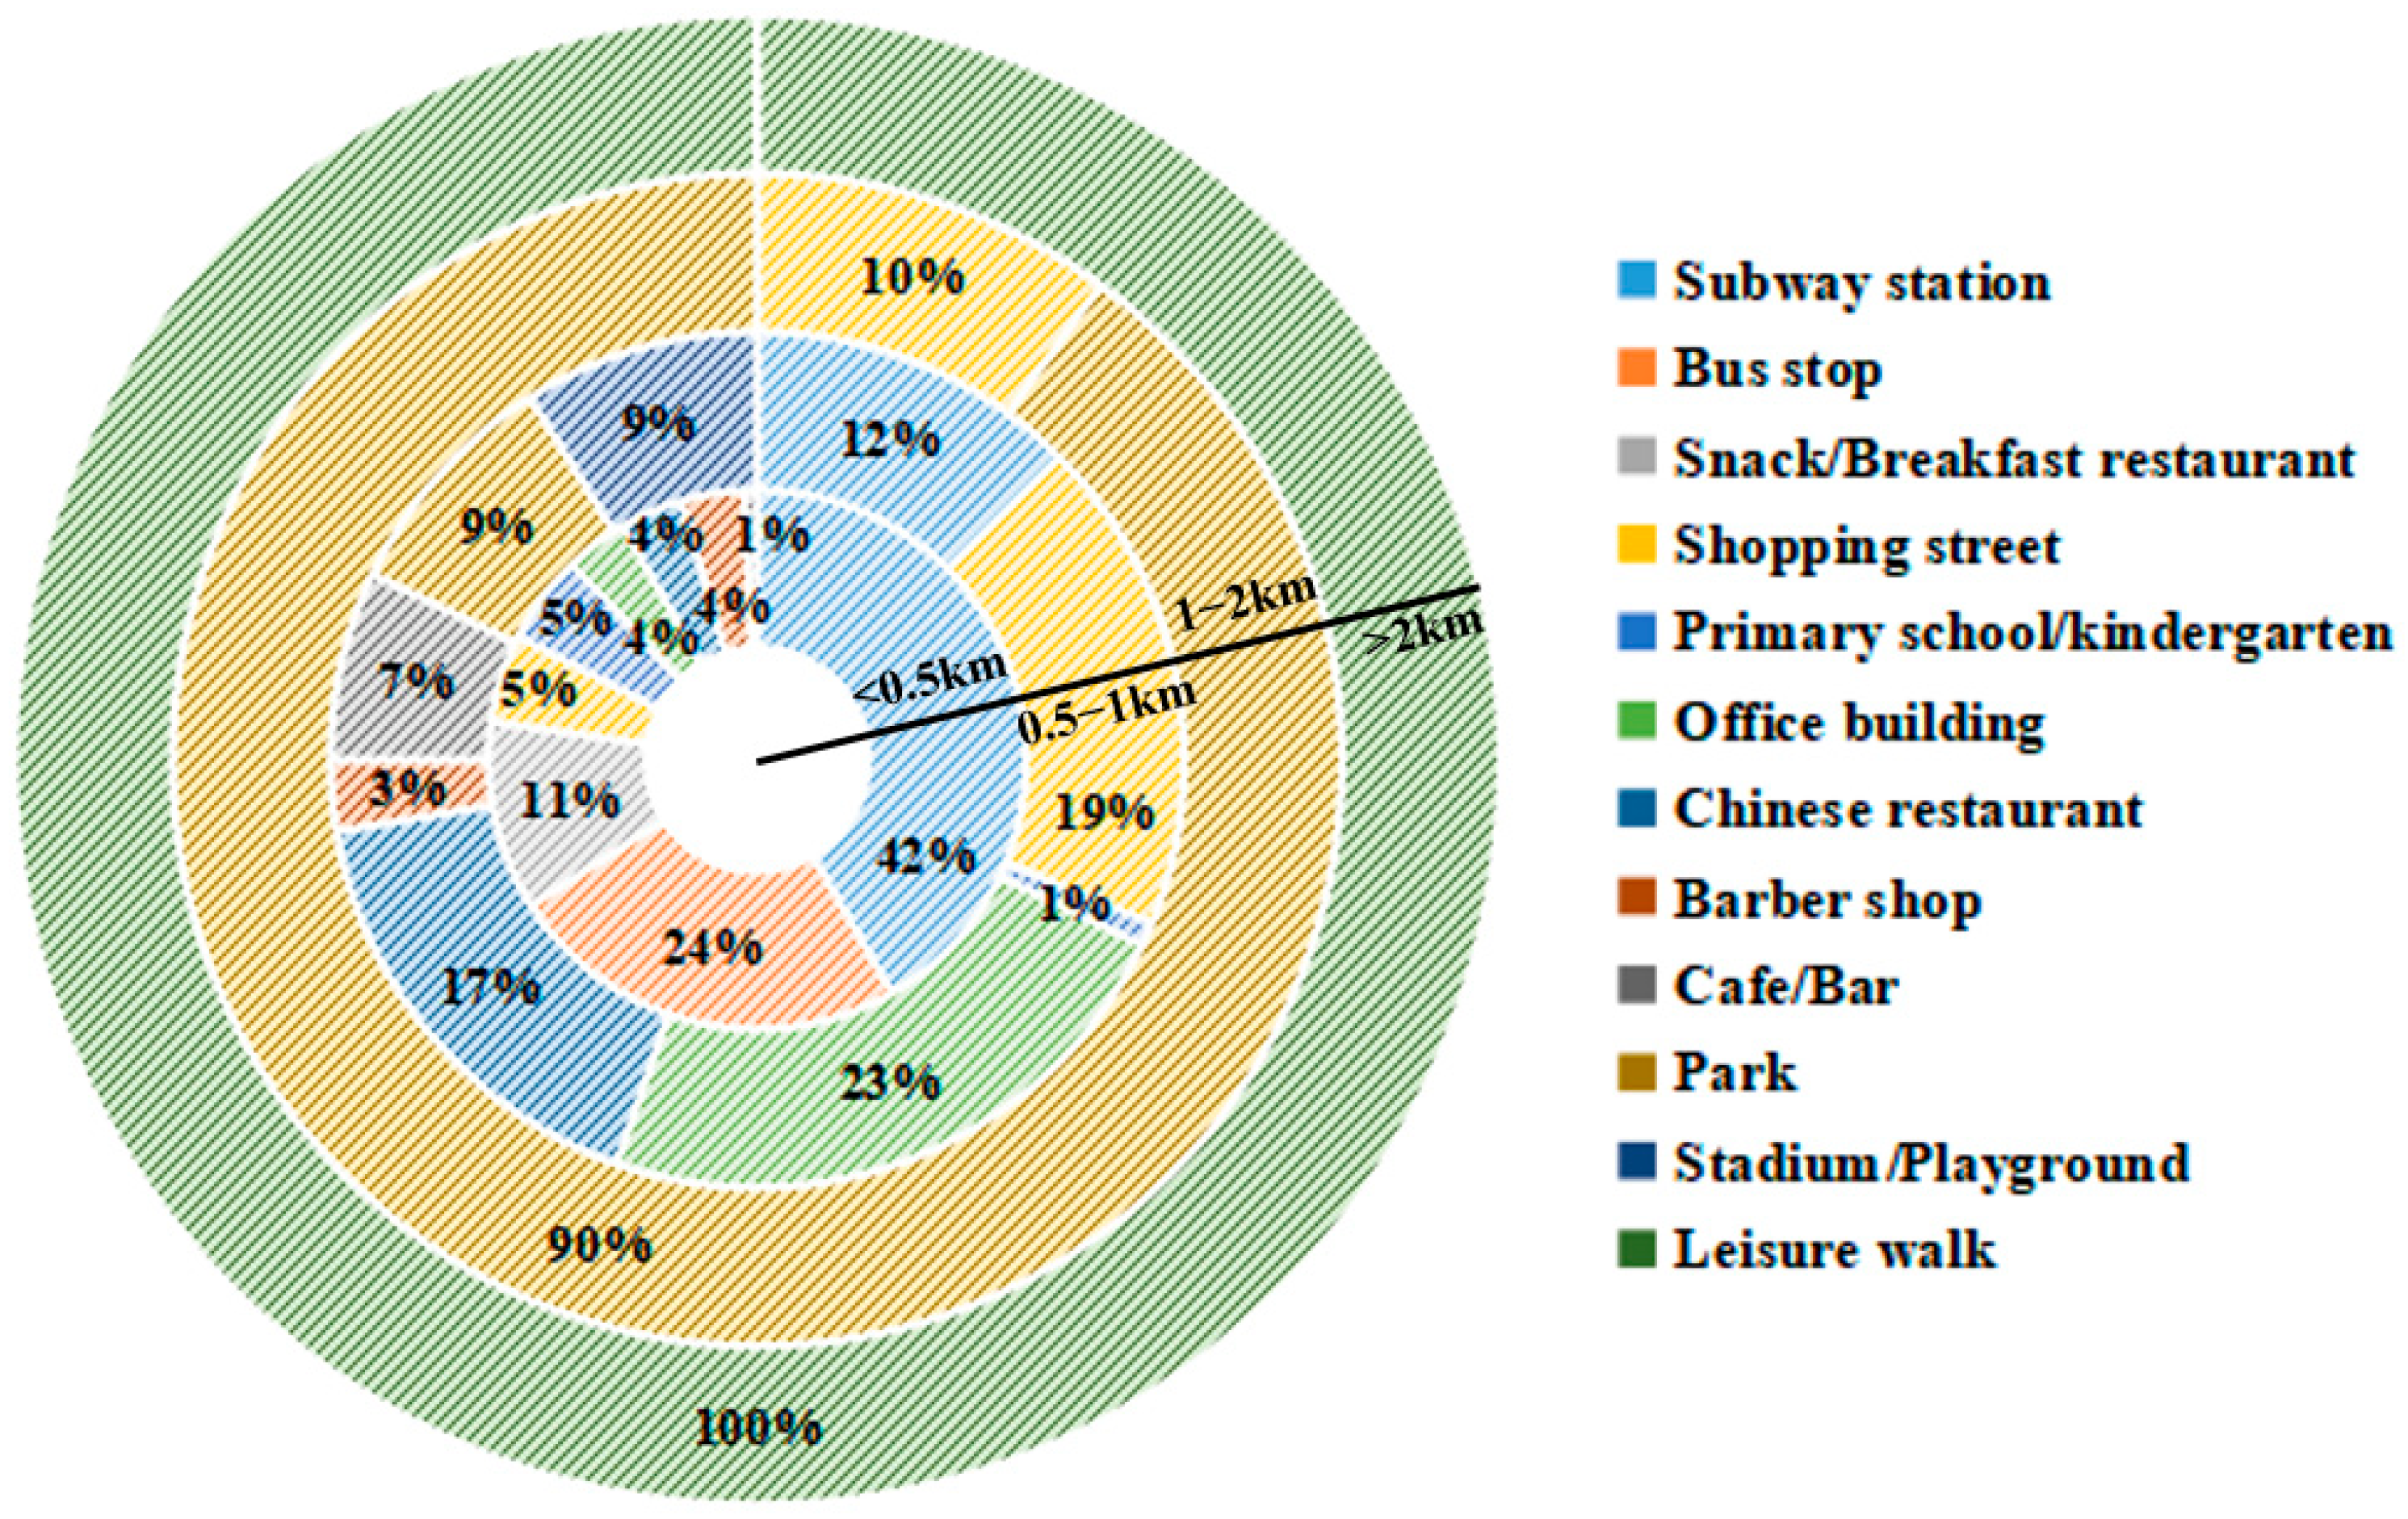
4.1.1. Destination
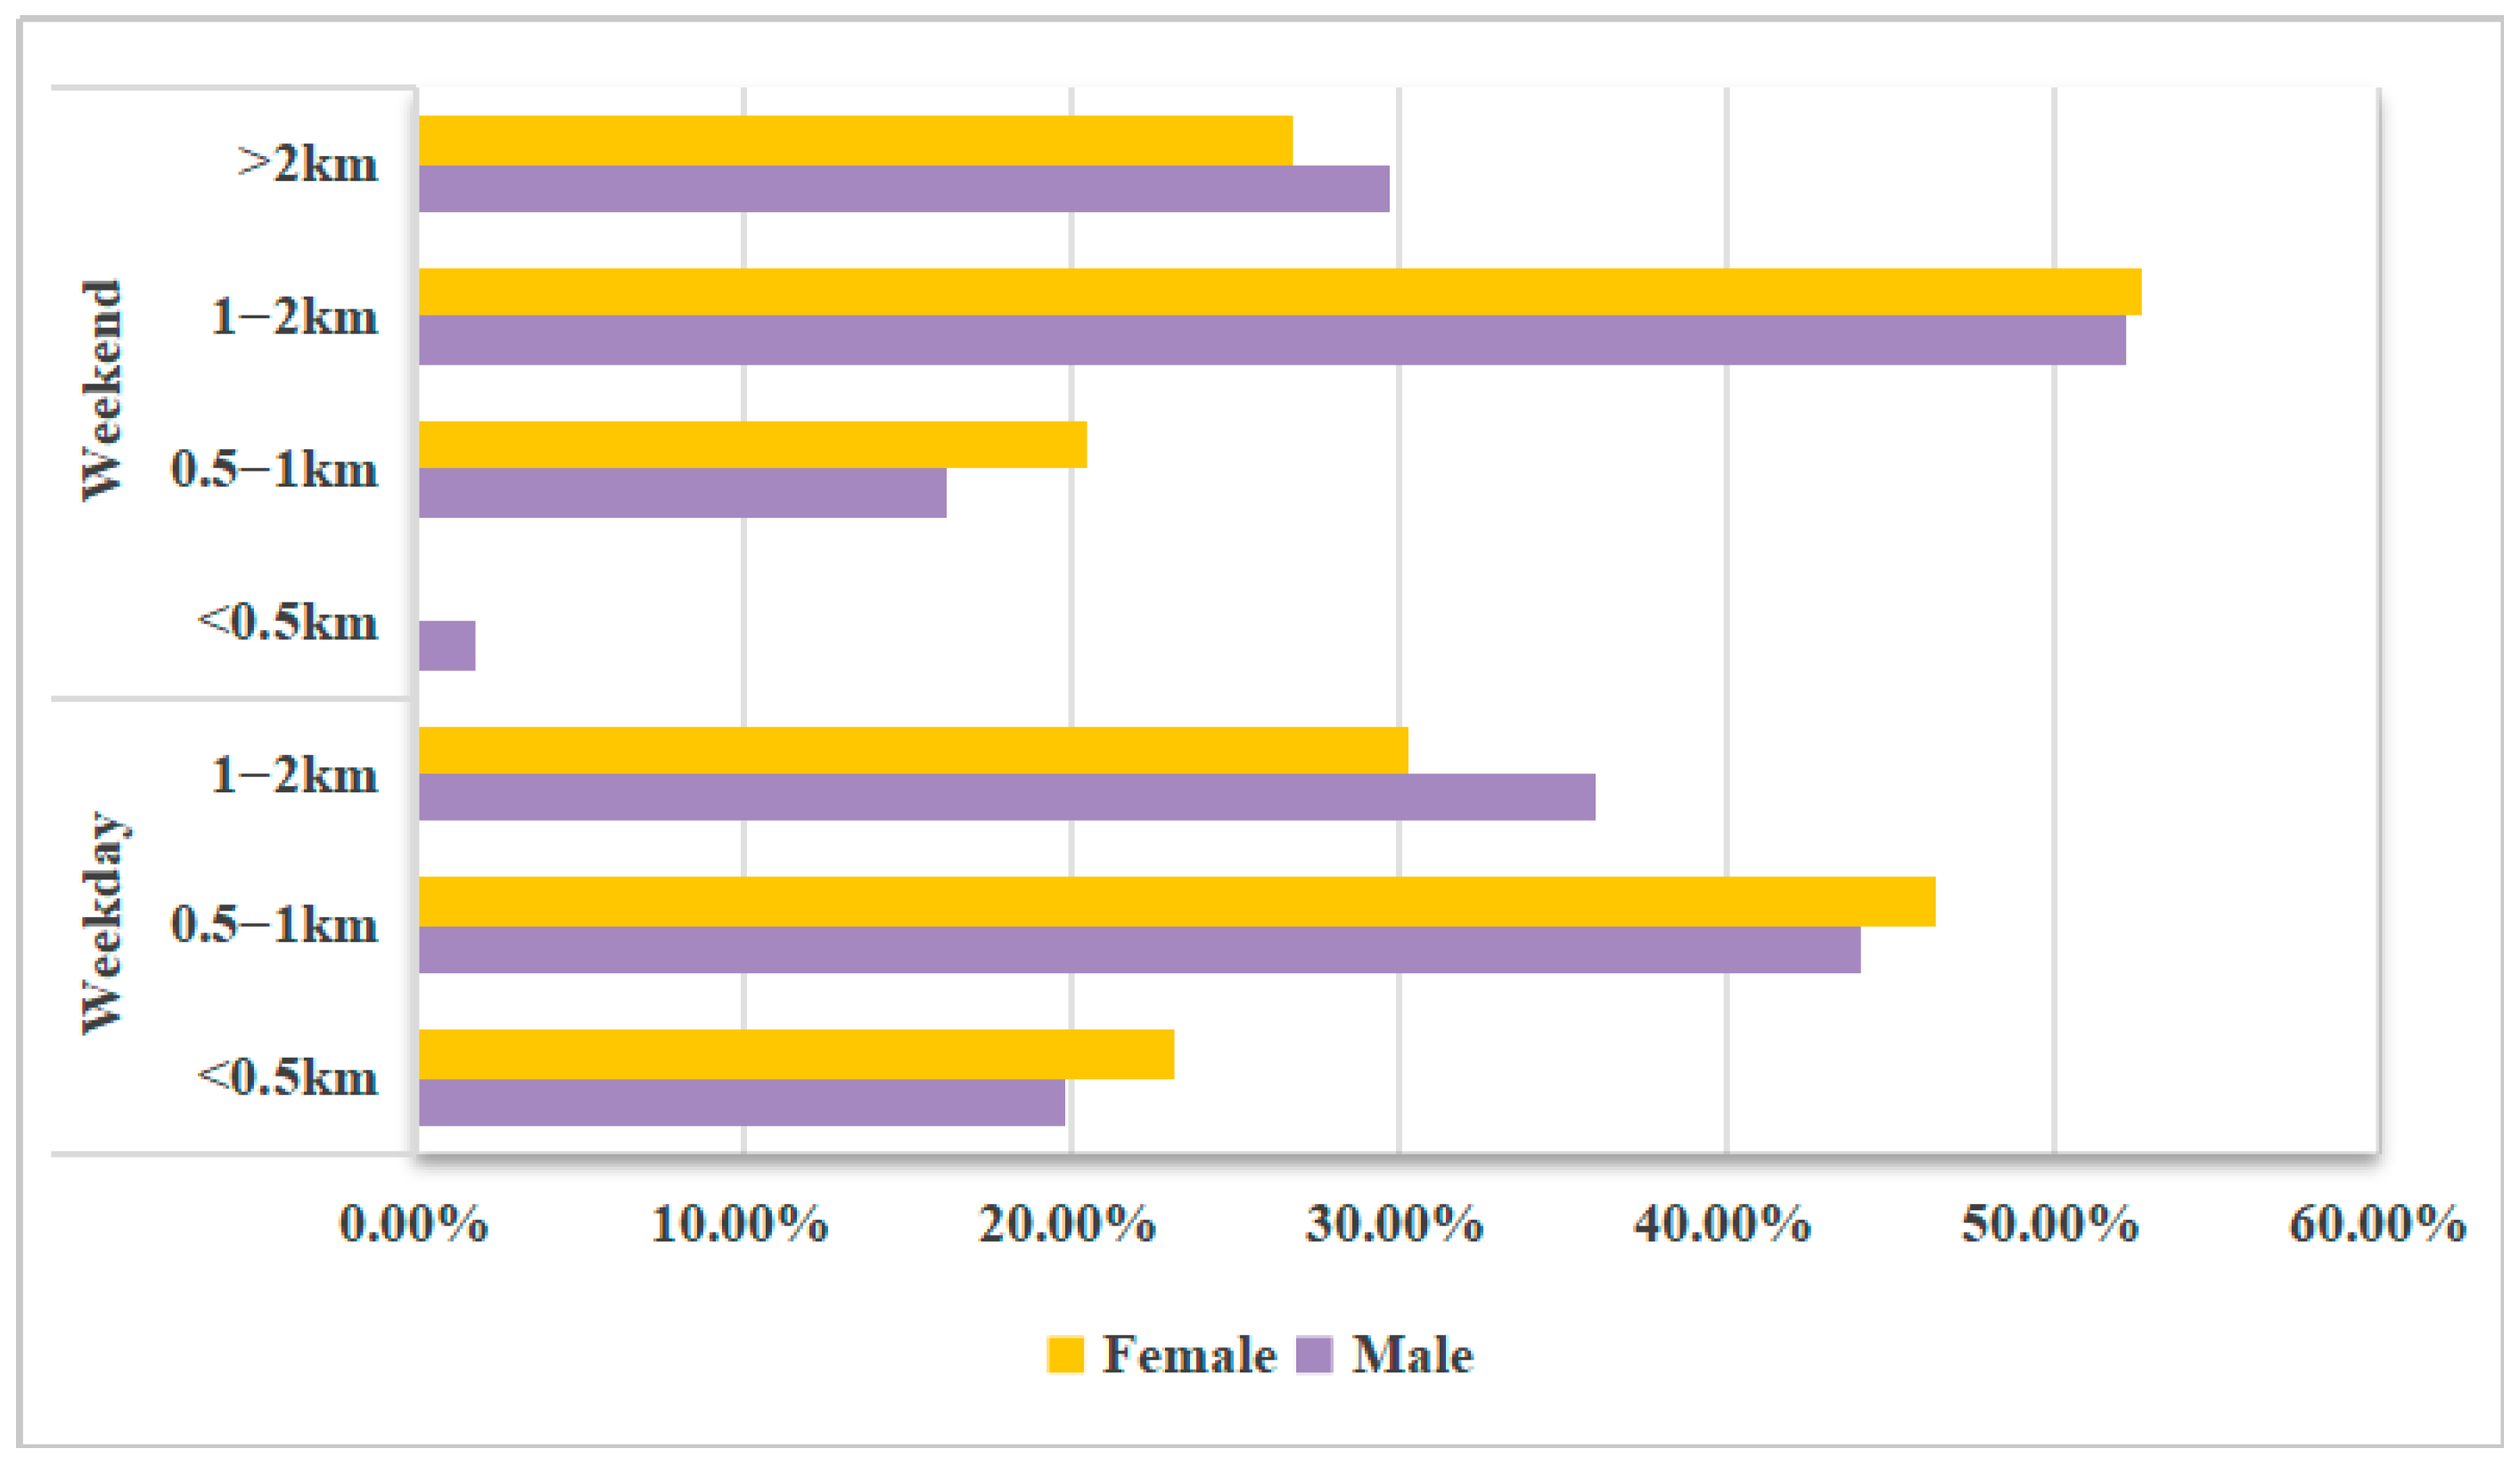
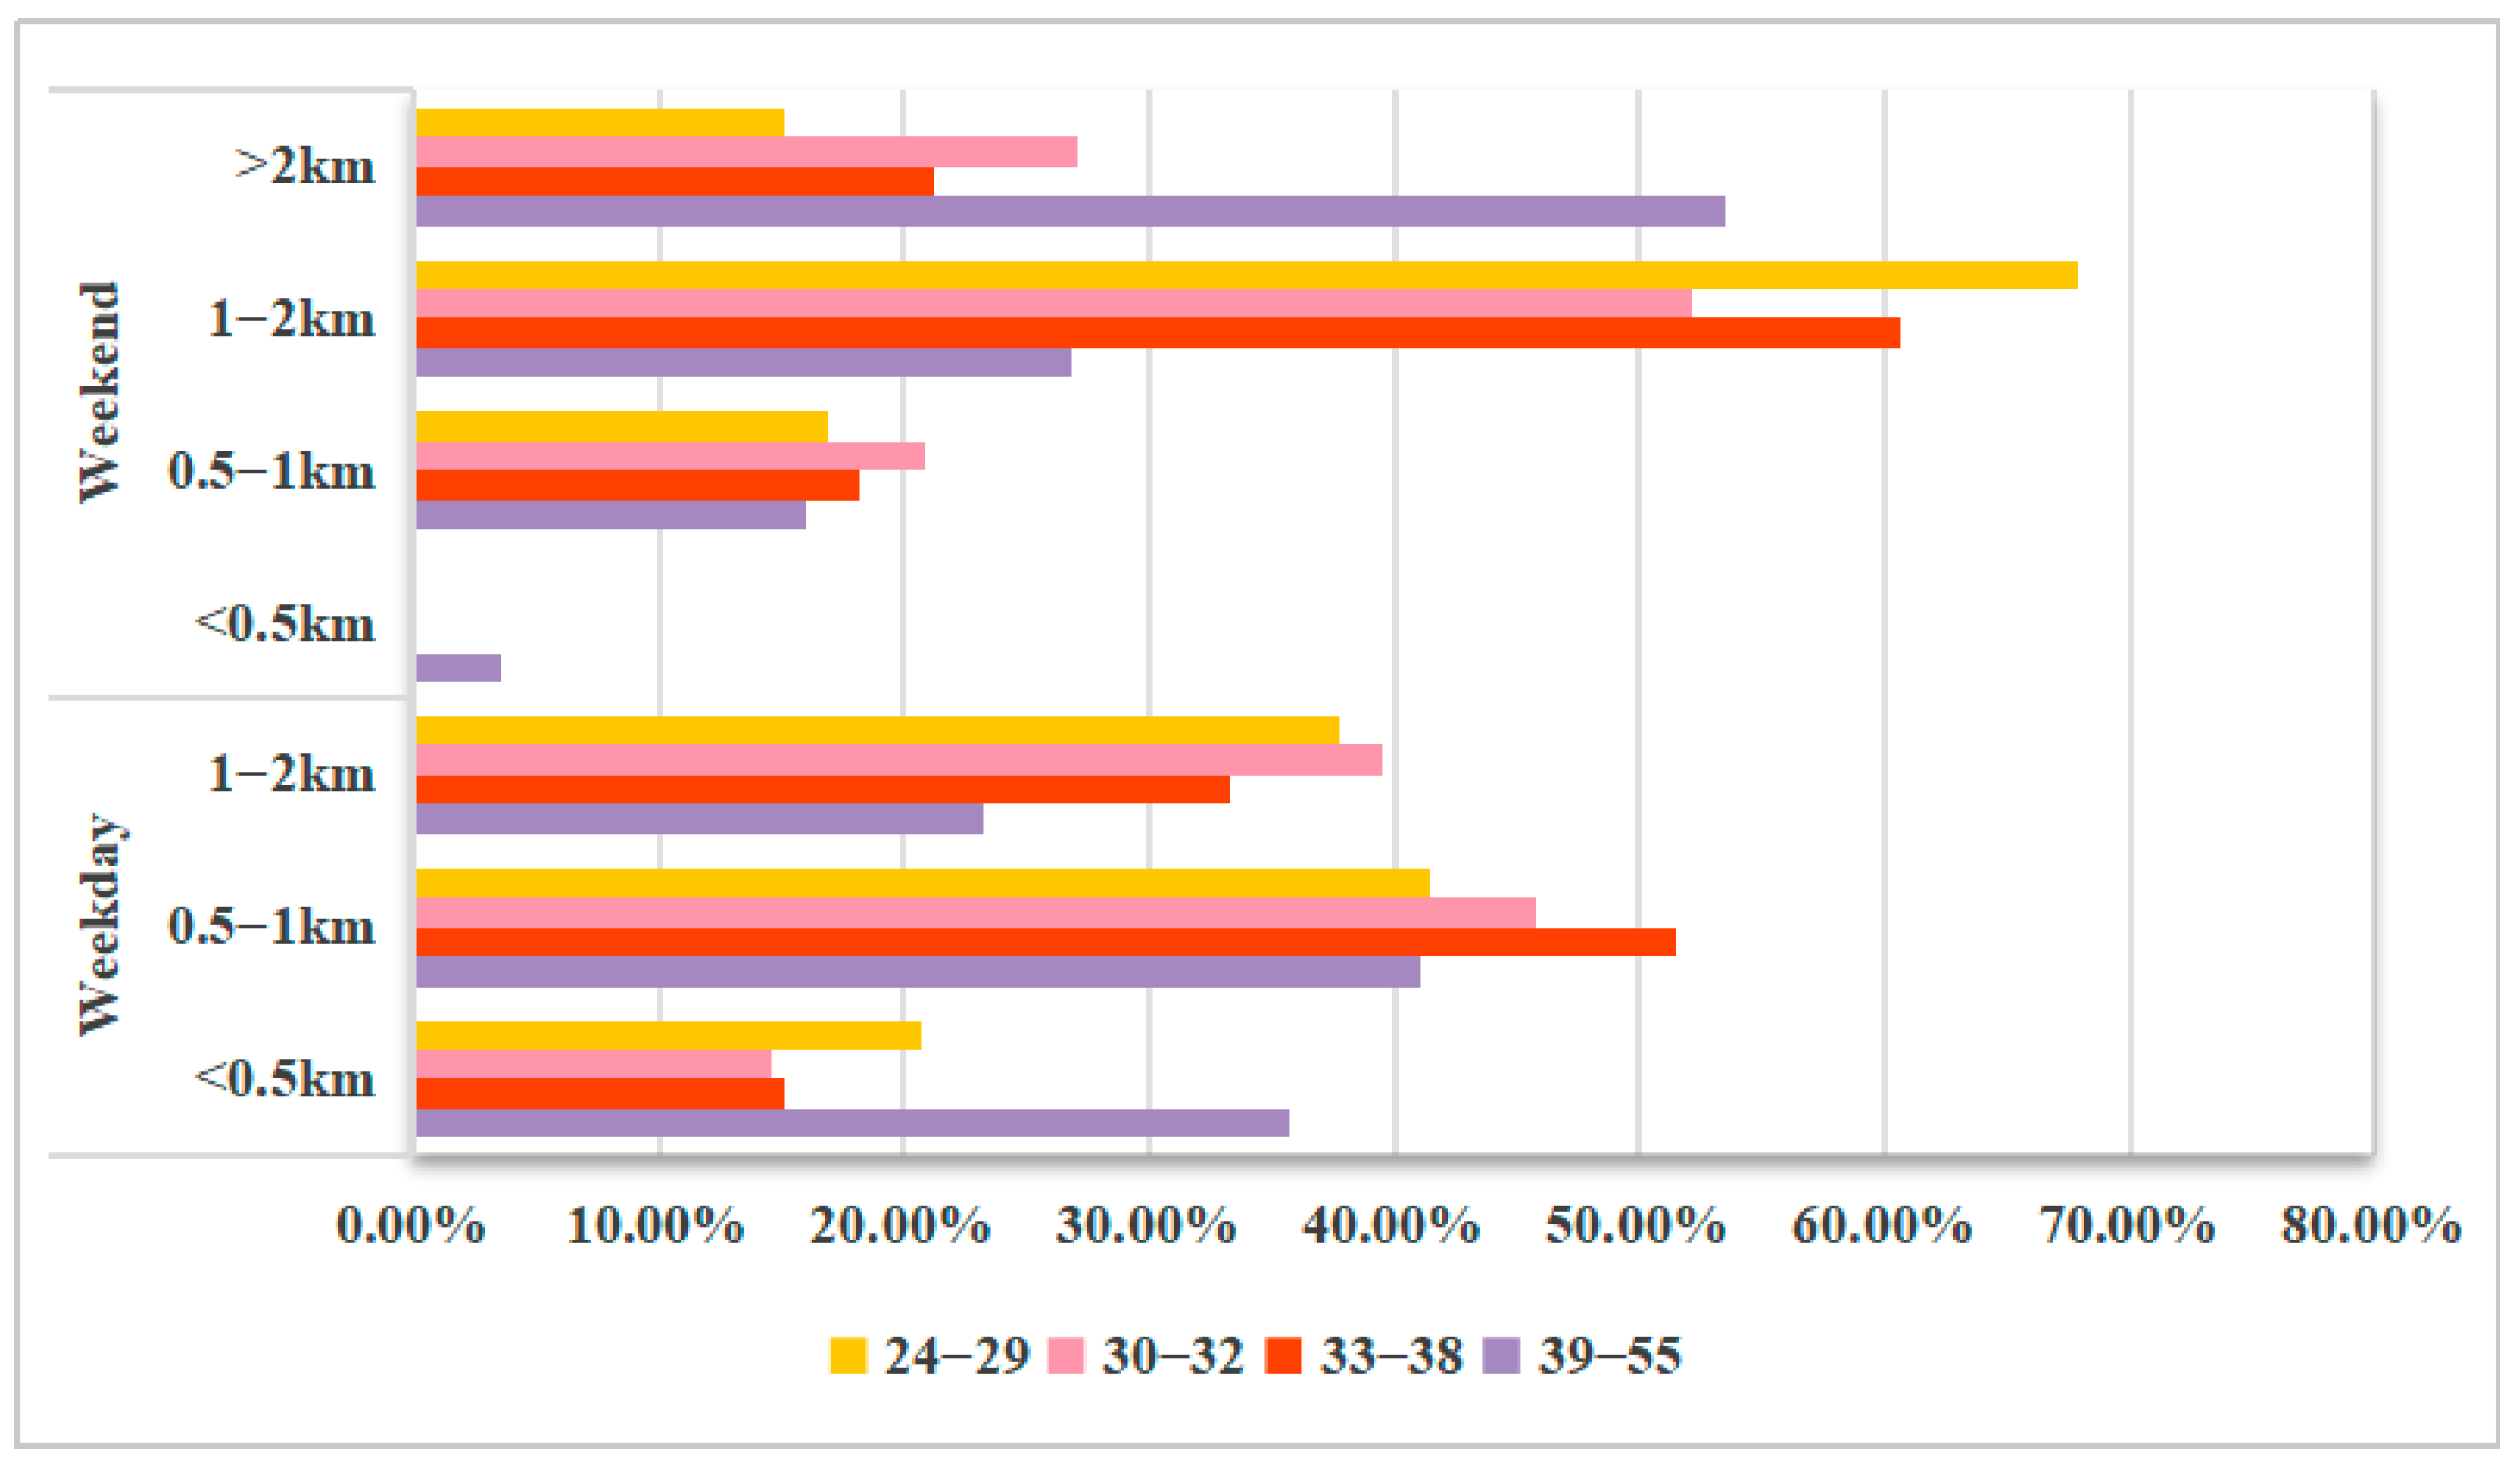
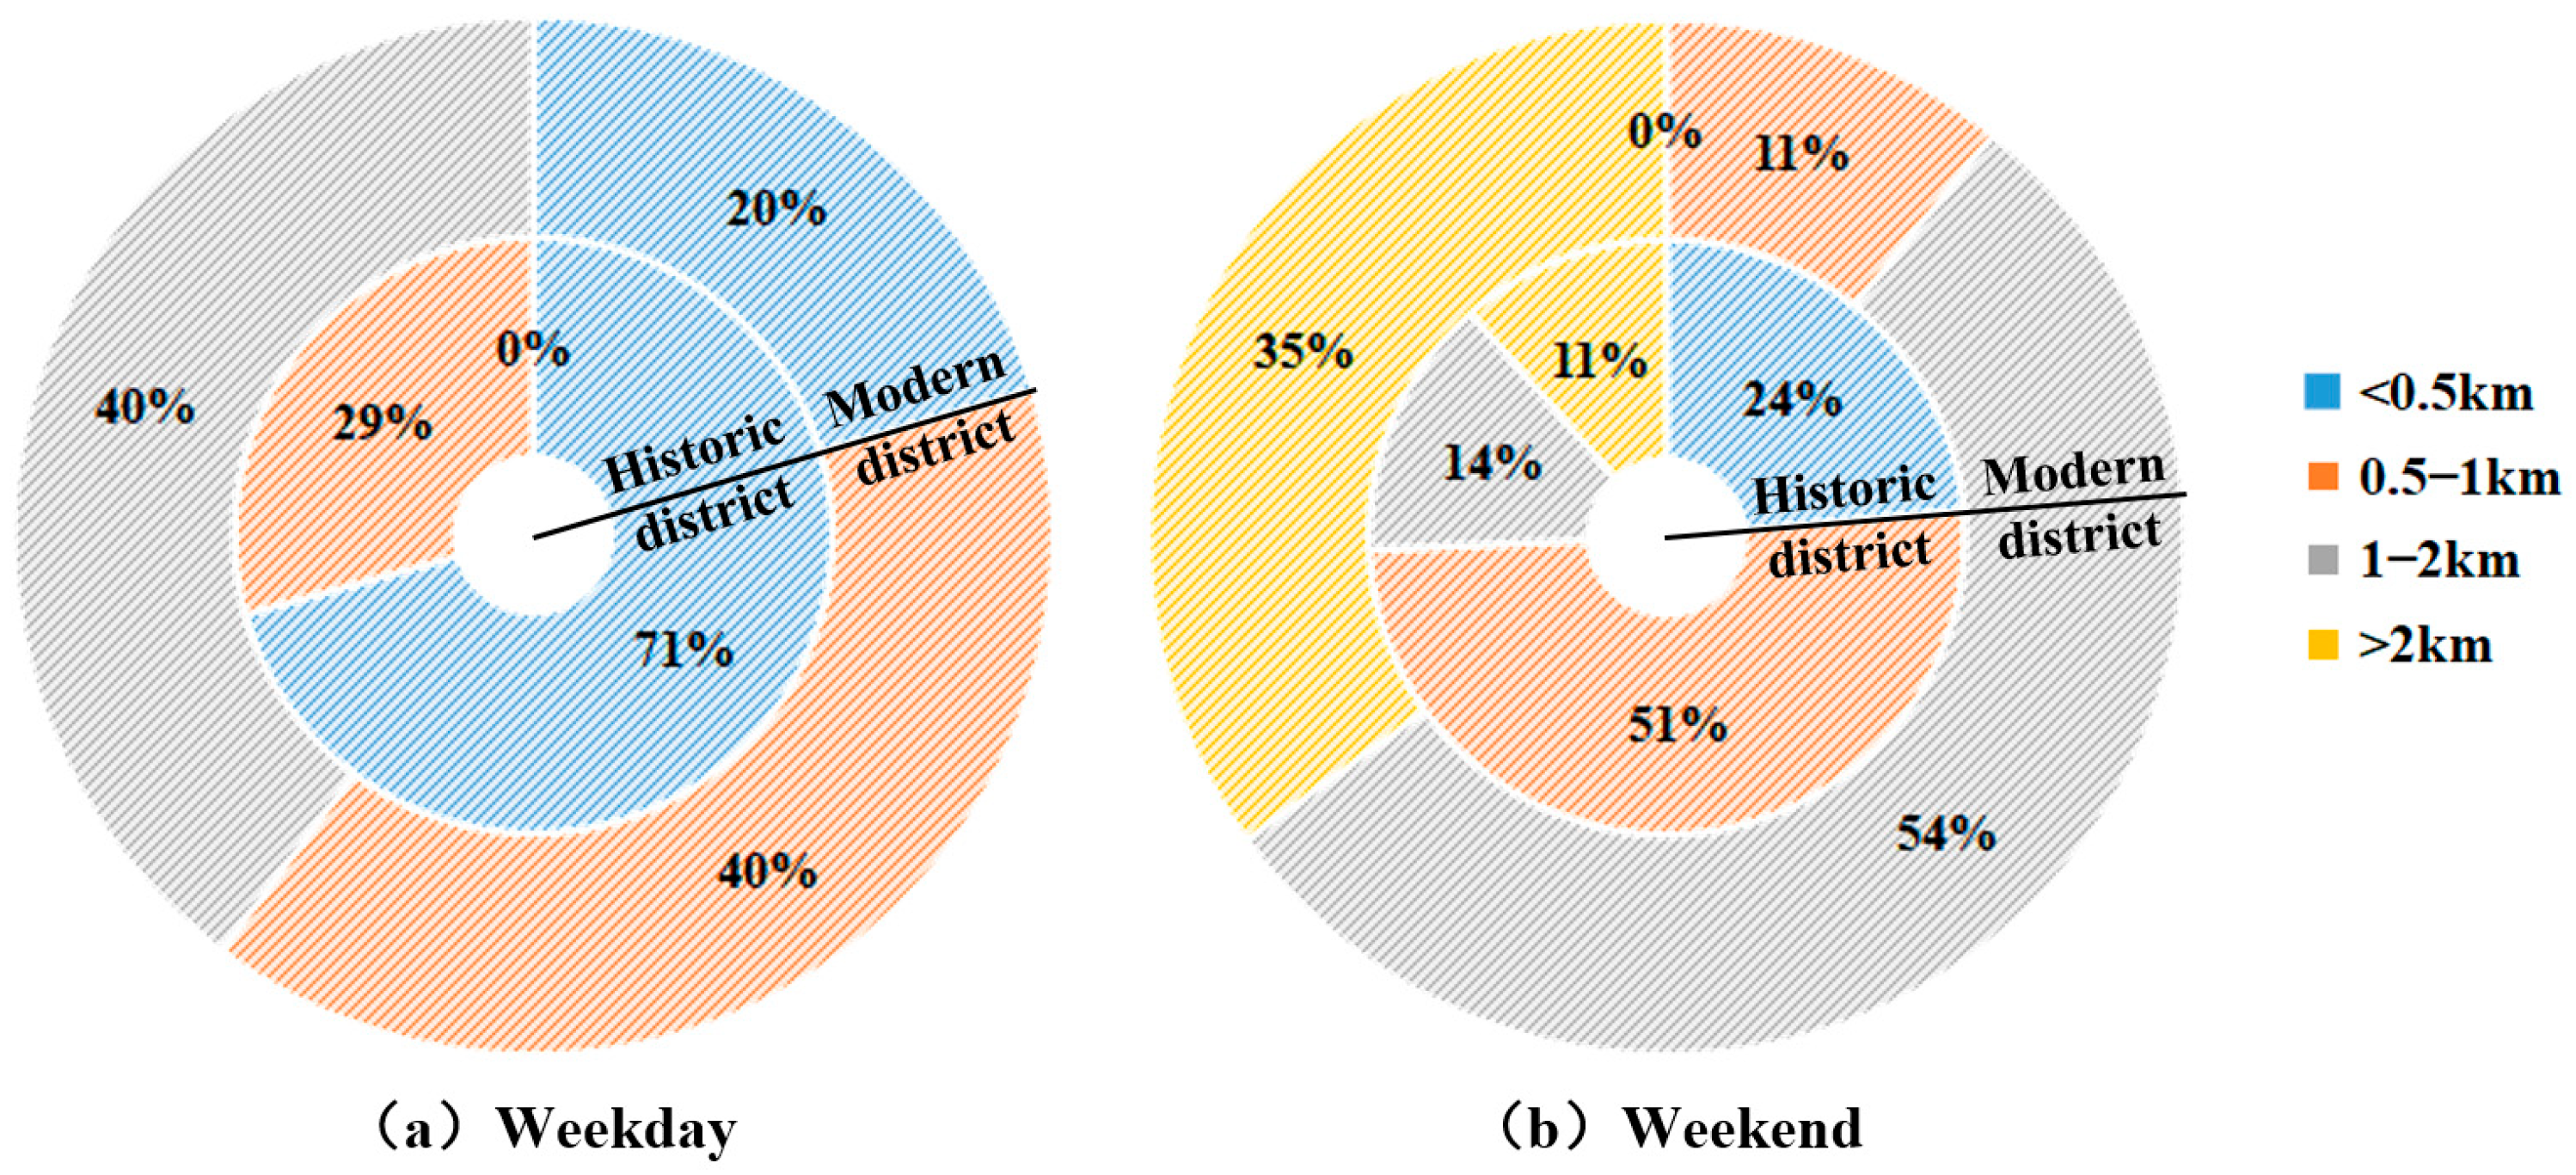
4.1.2. Distance
4.2. Temporal Features of Residents’ Walking Activities
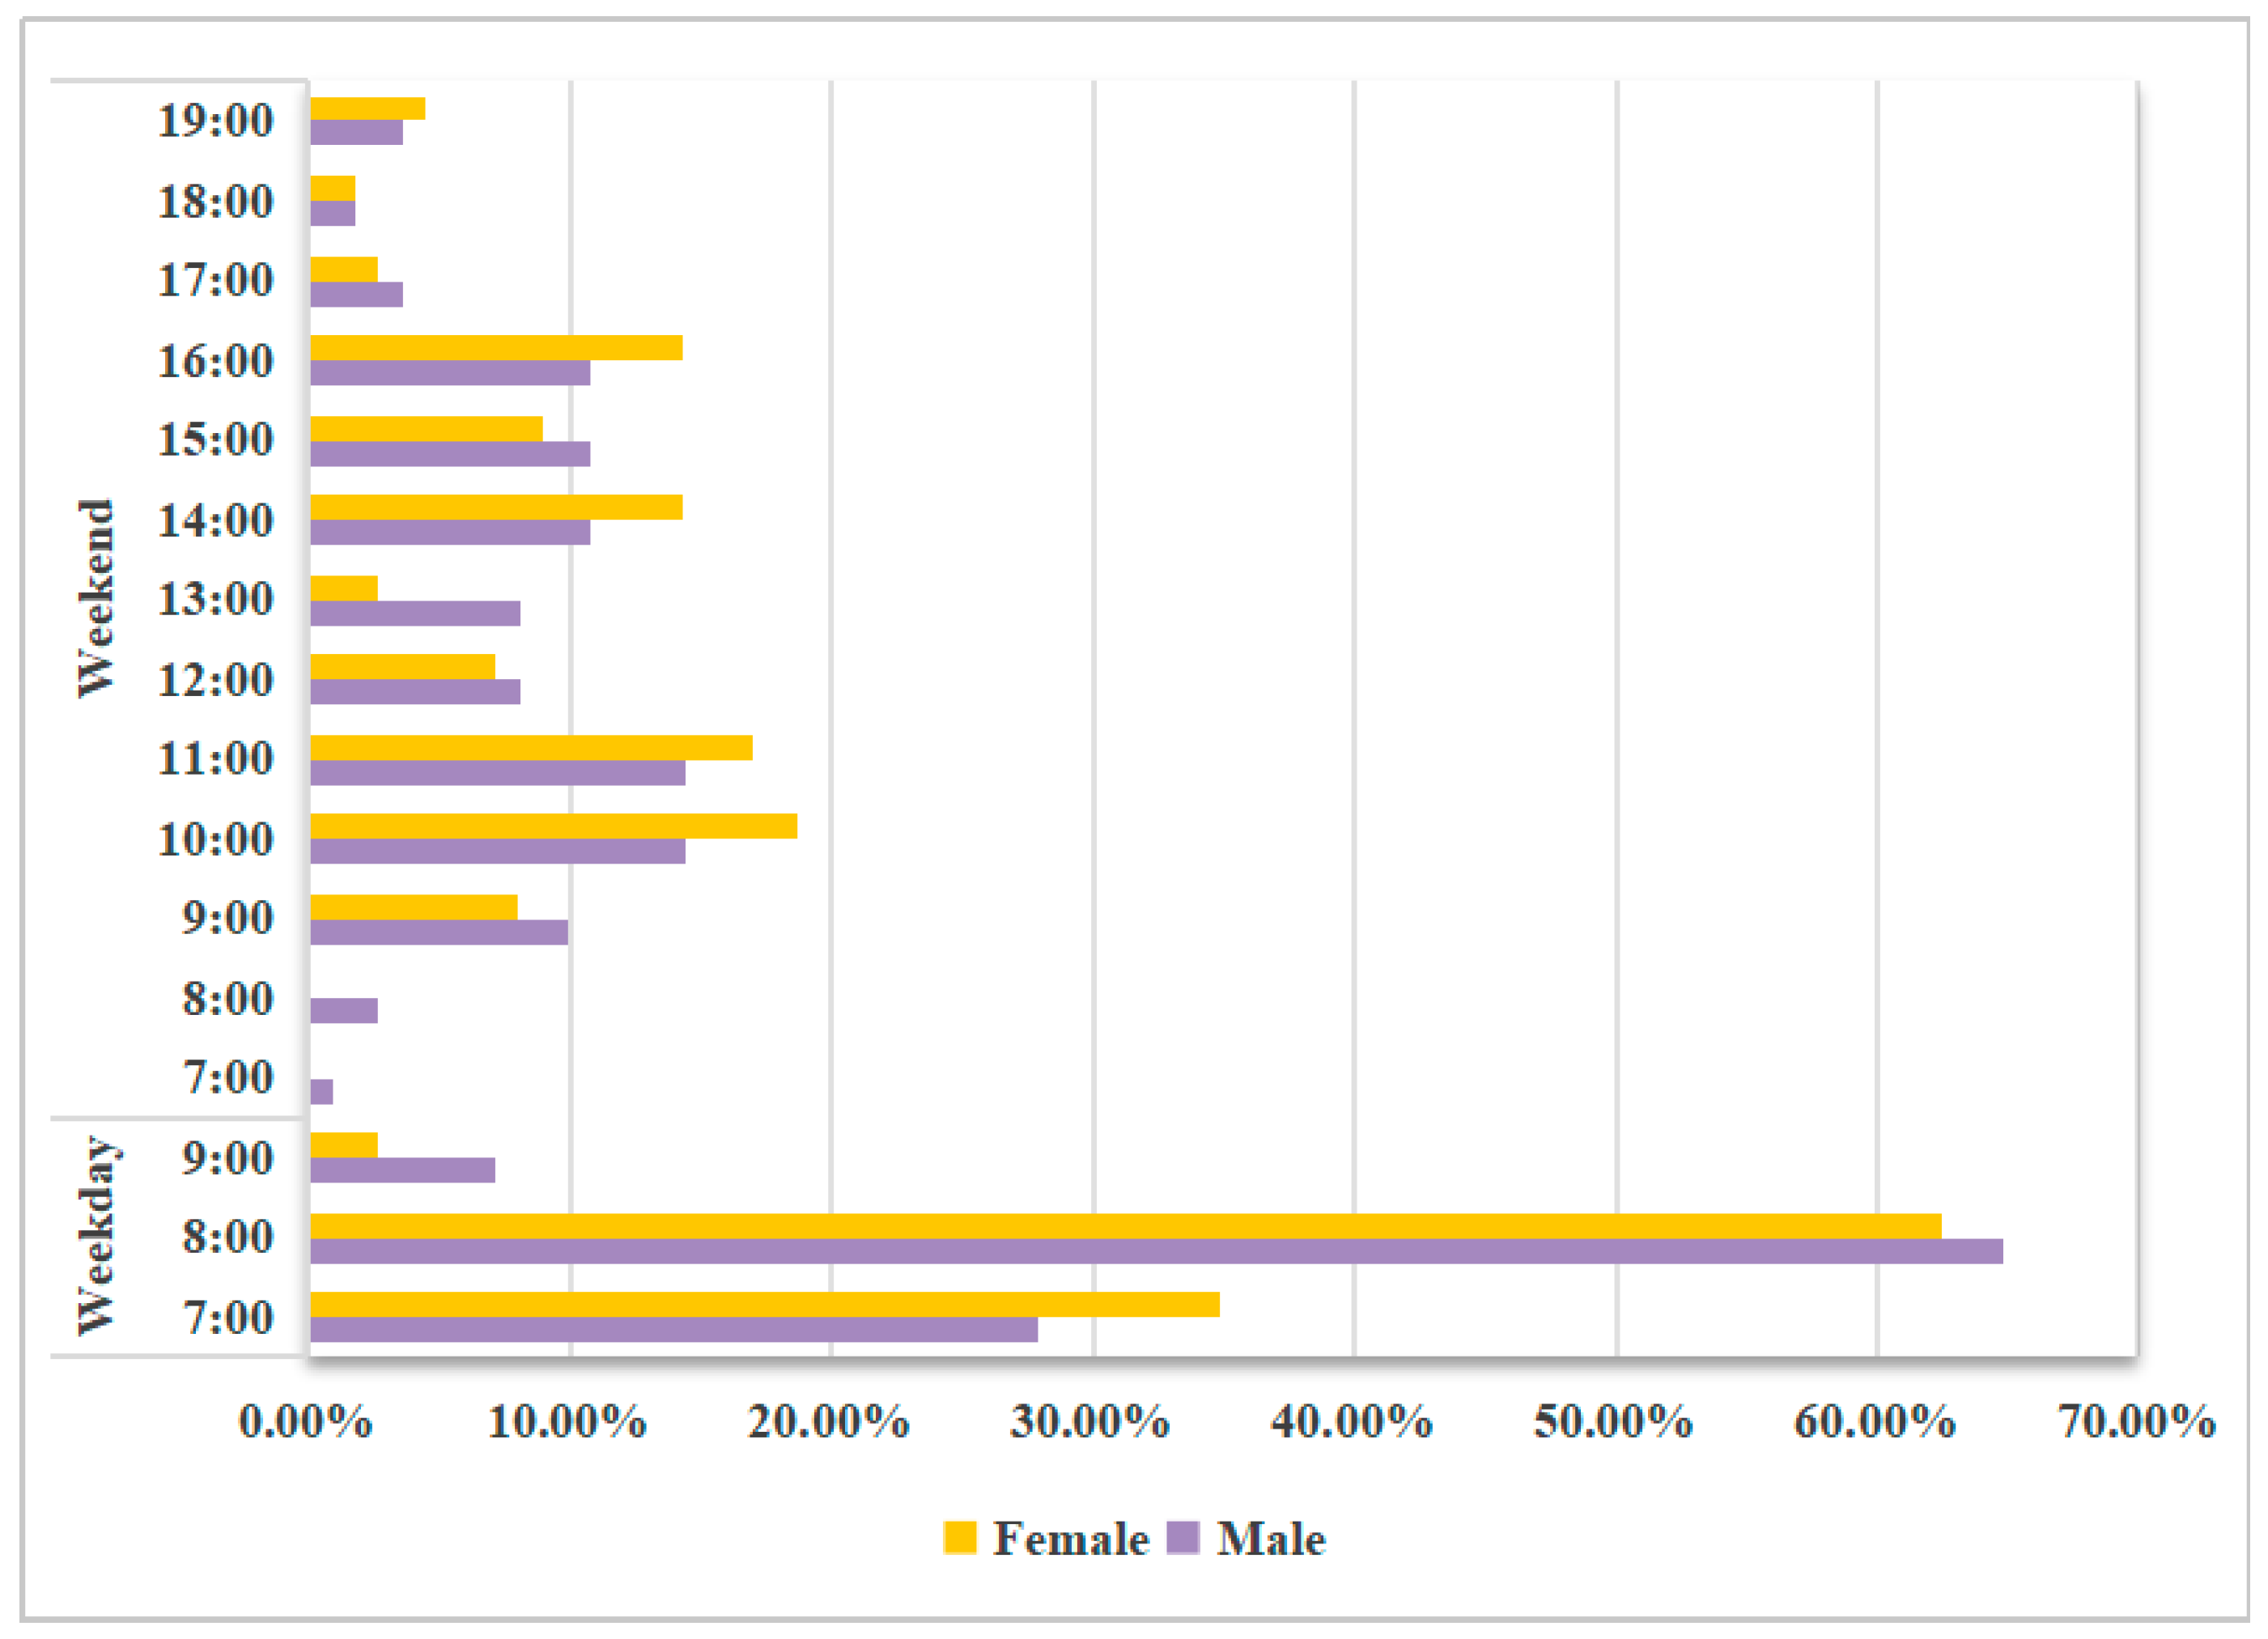
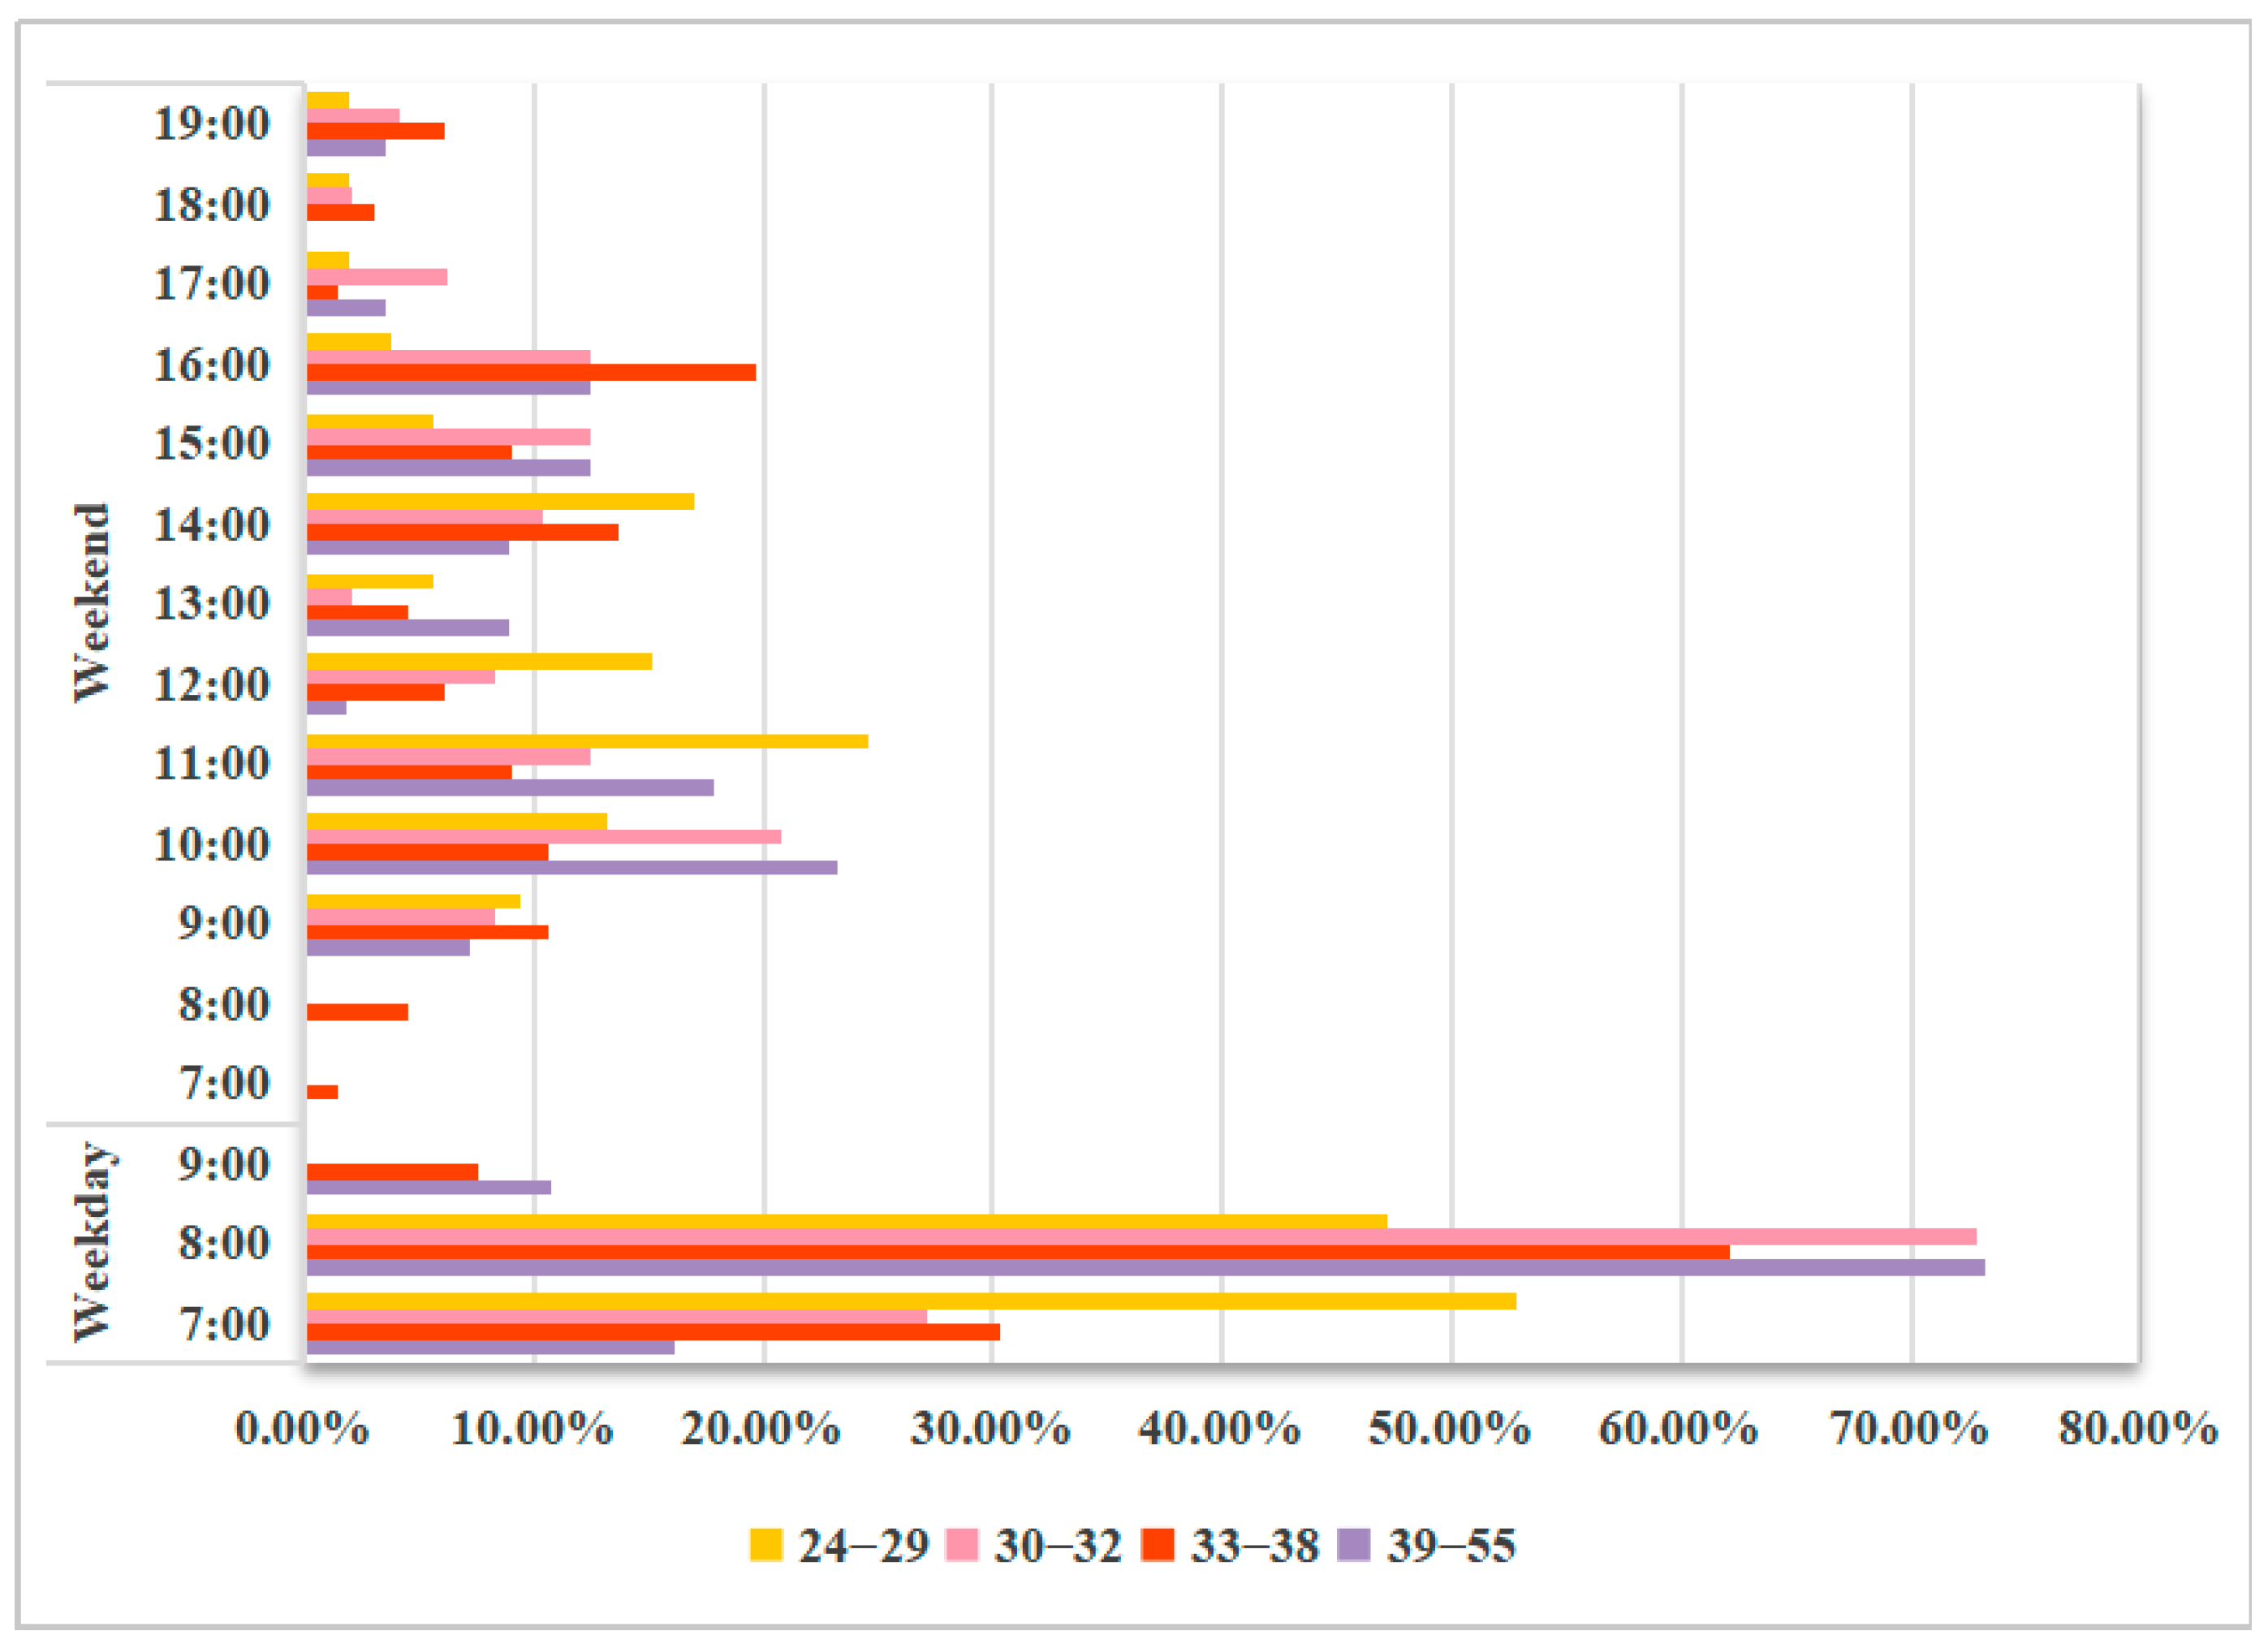
4.2.1. Departure Time
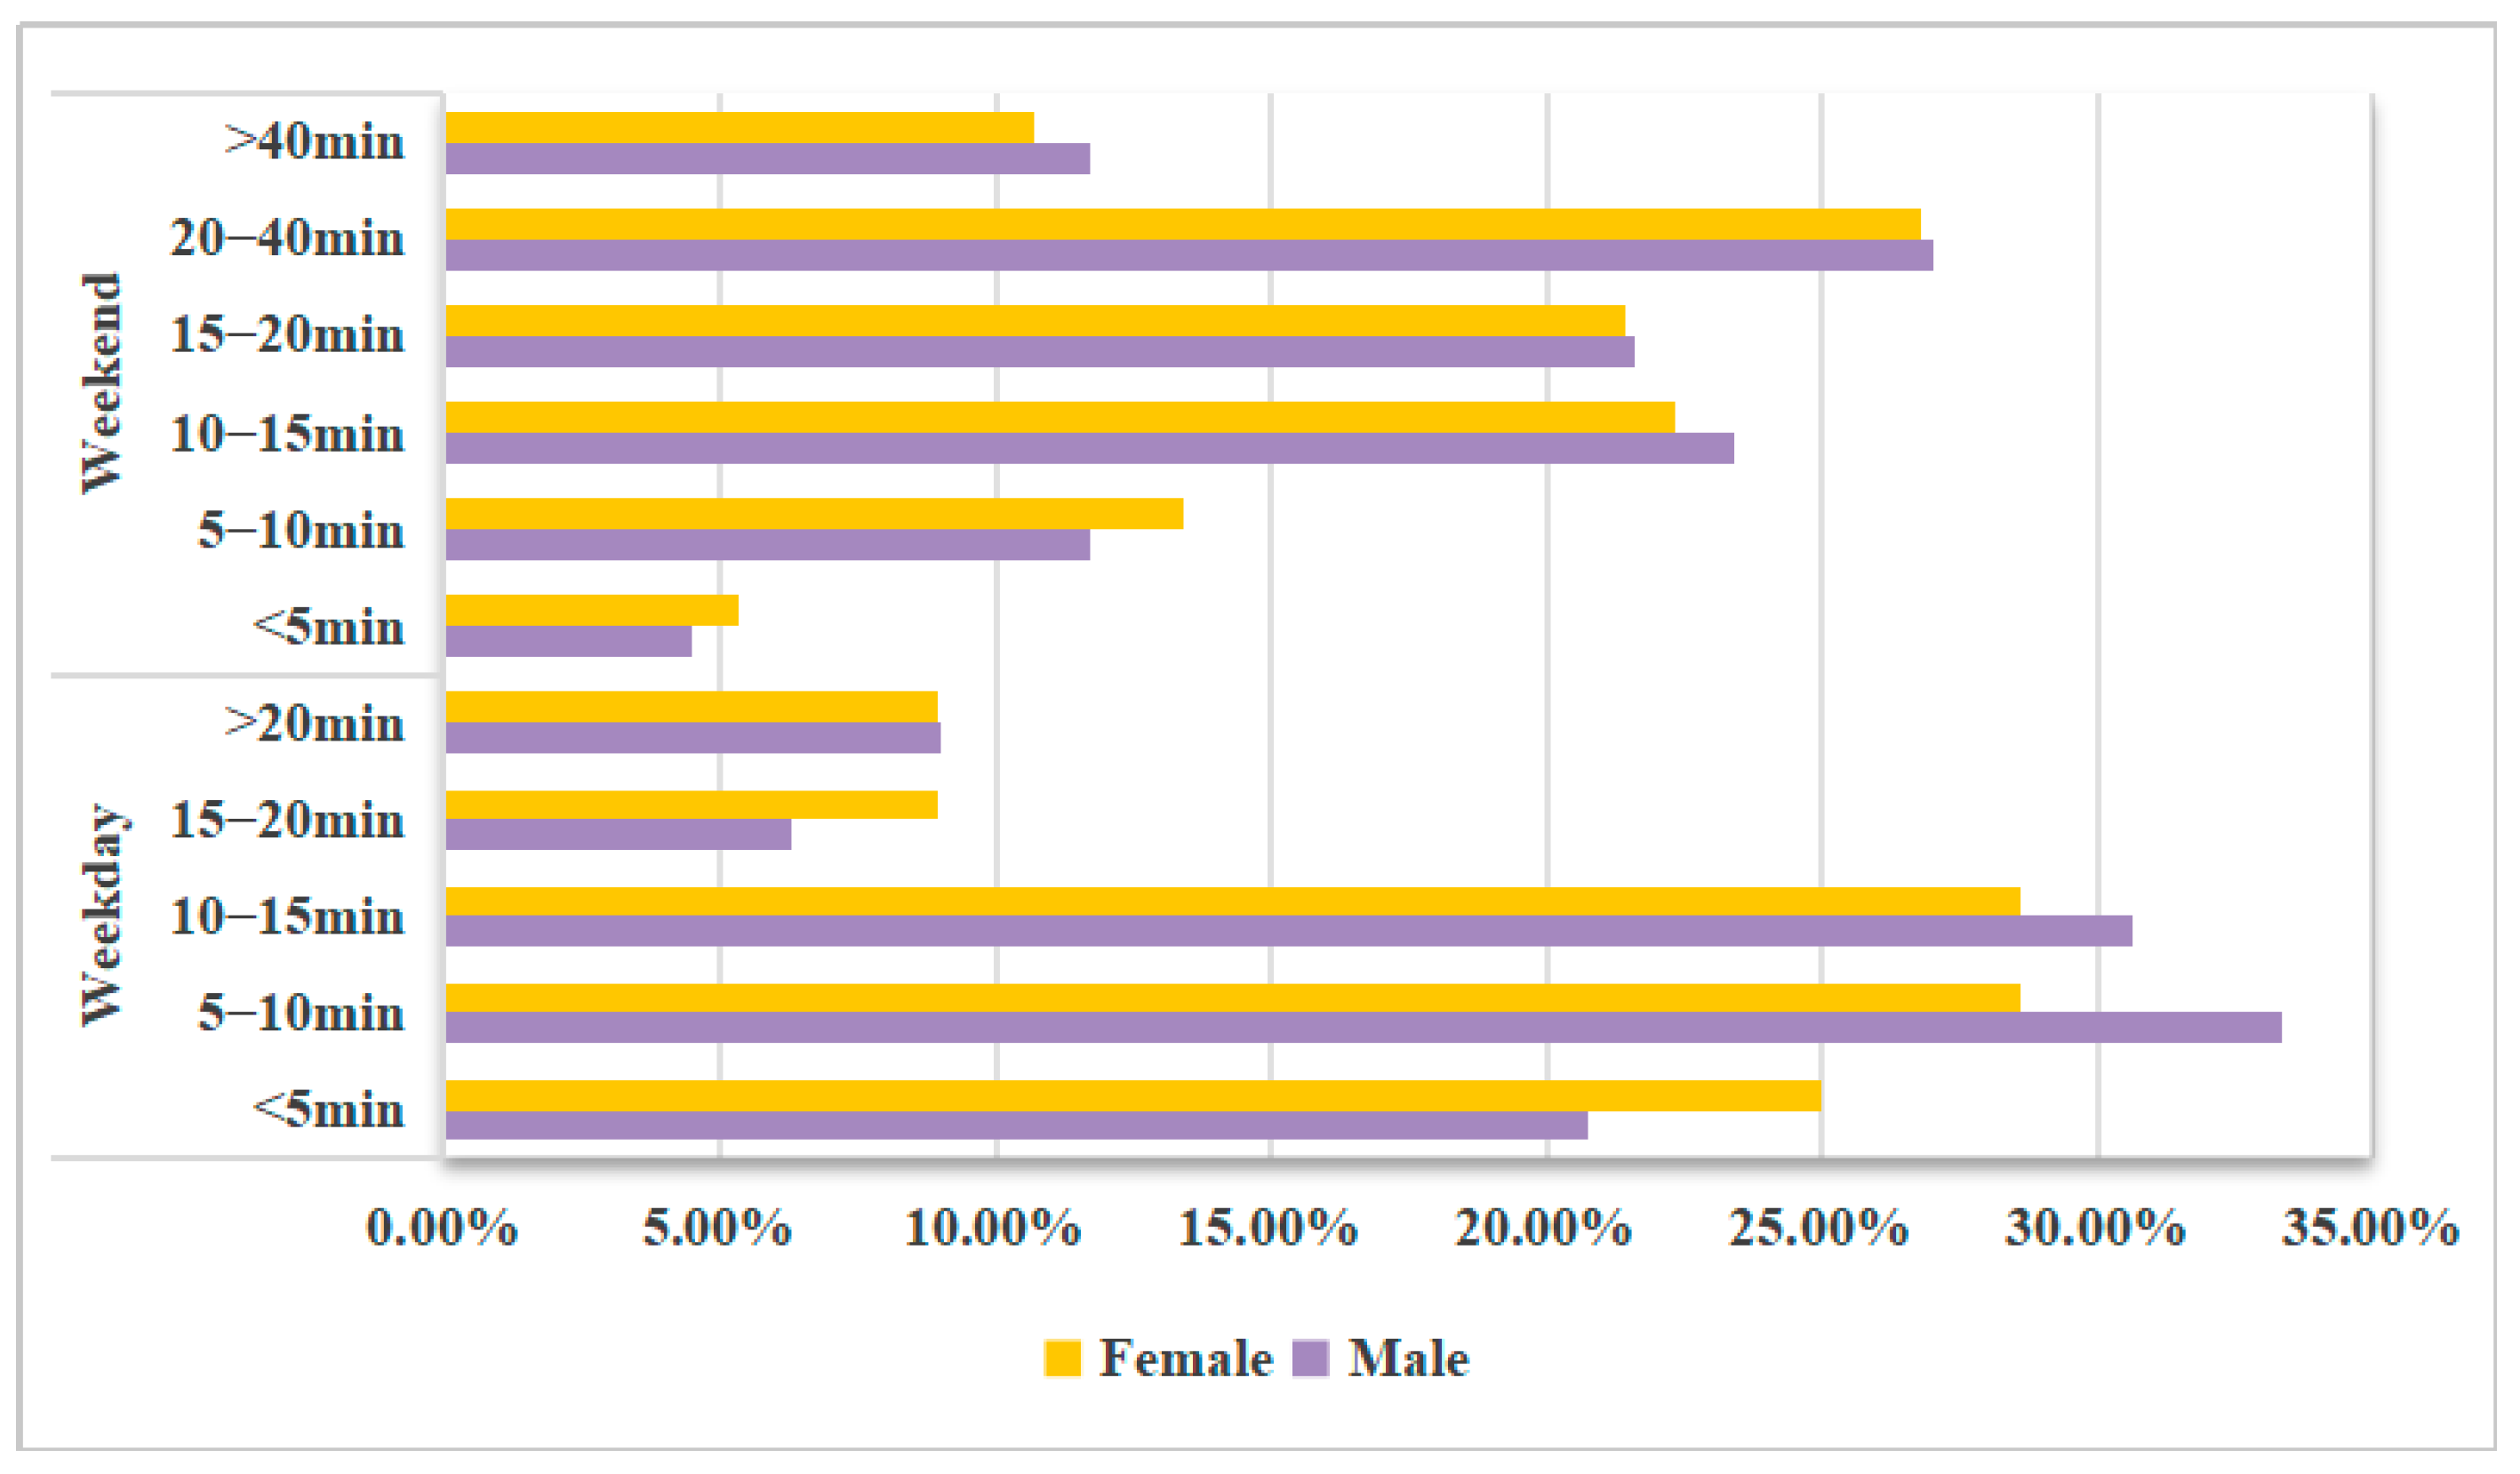
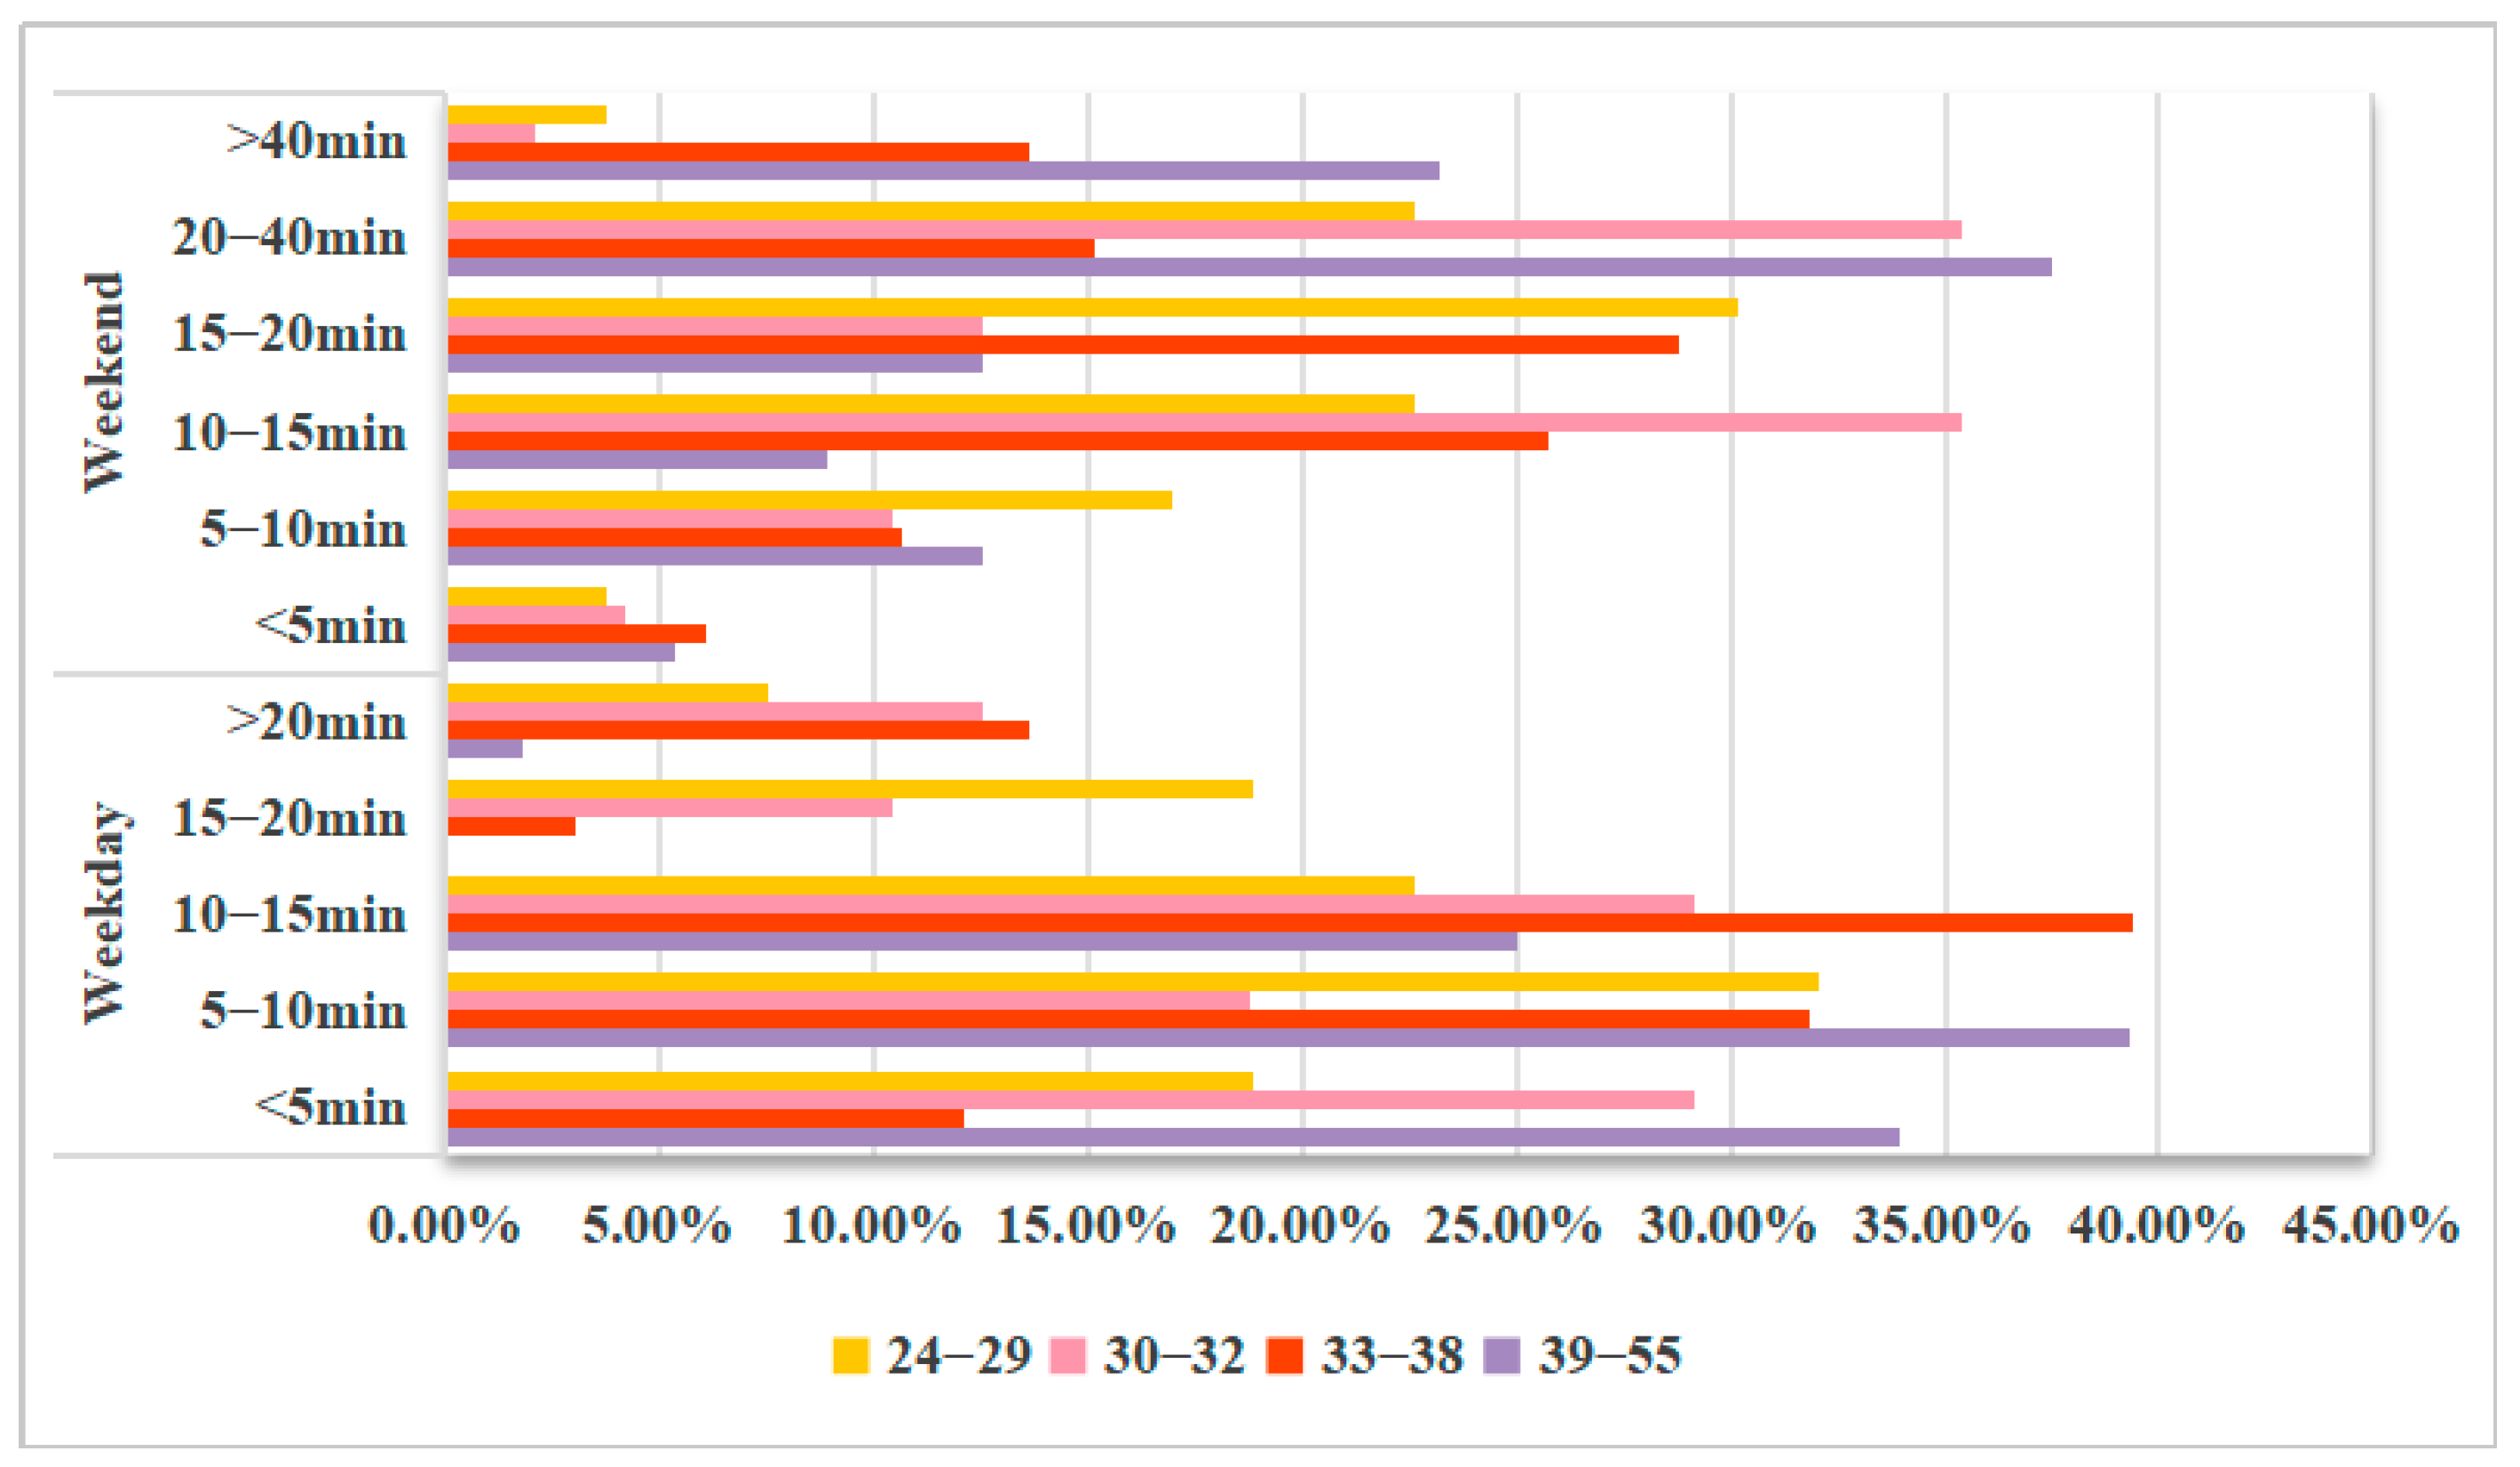
4.2.2. Duration
4.3. Spatiotemporal Circles of Residents’ Daily Walking in Historic and Modern Districts
4.3.1. Walking Distance in Historic and Modern Districts
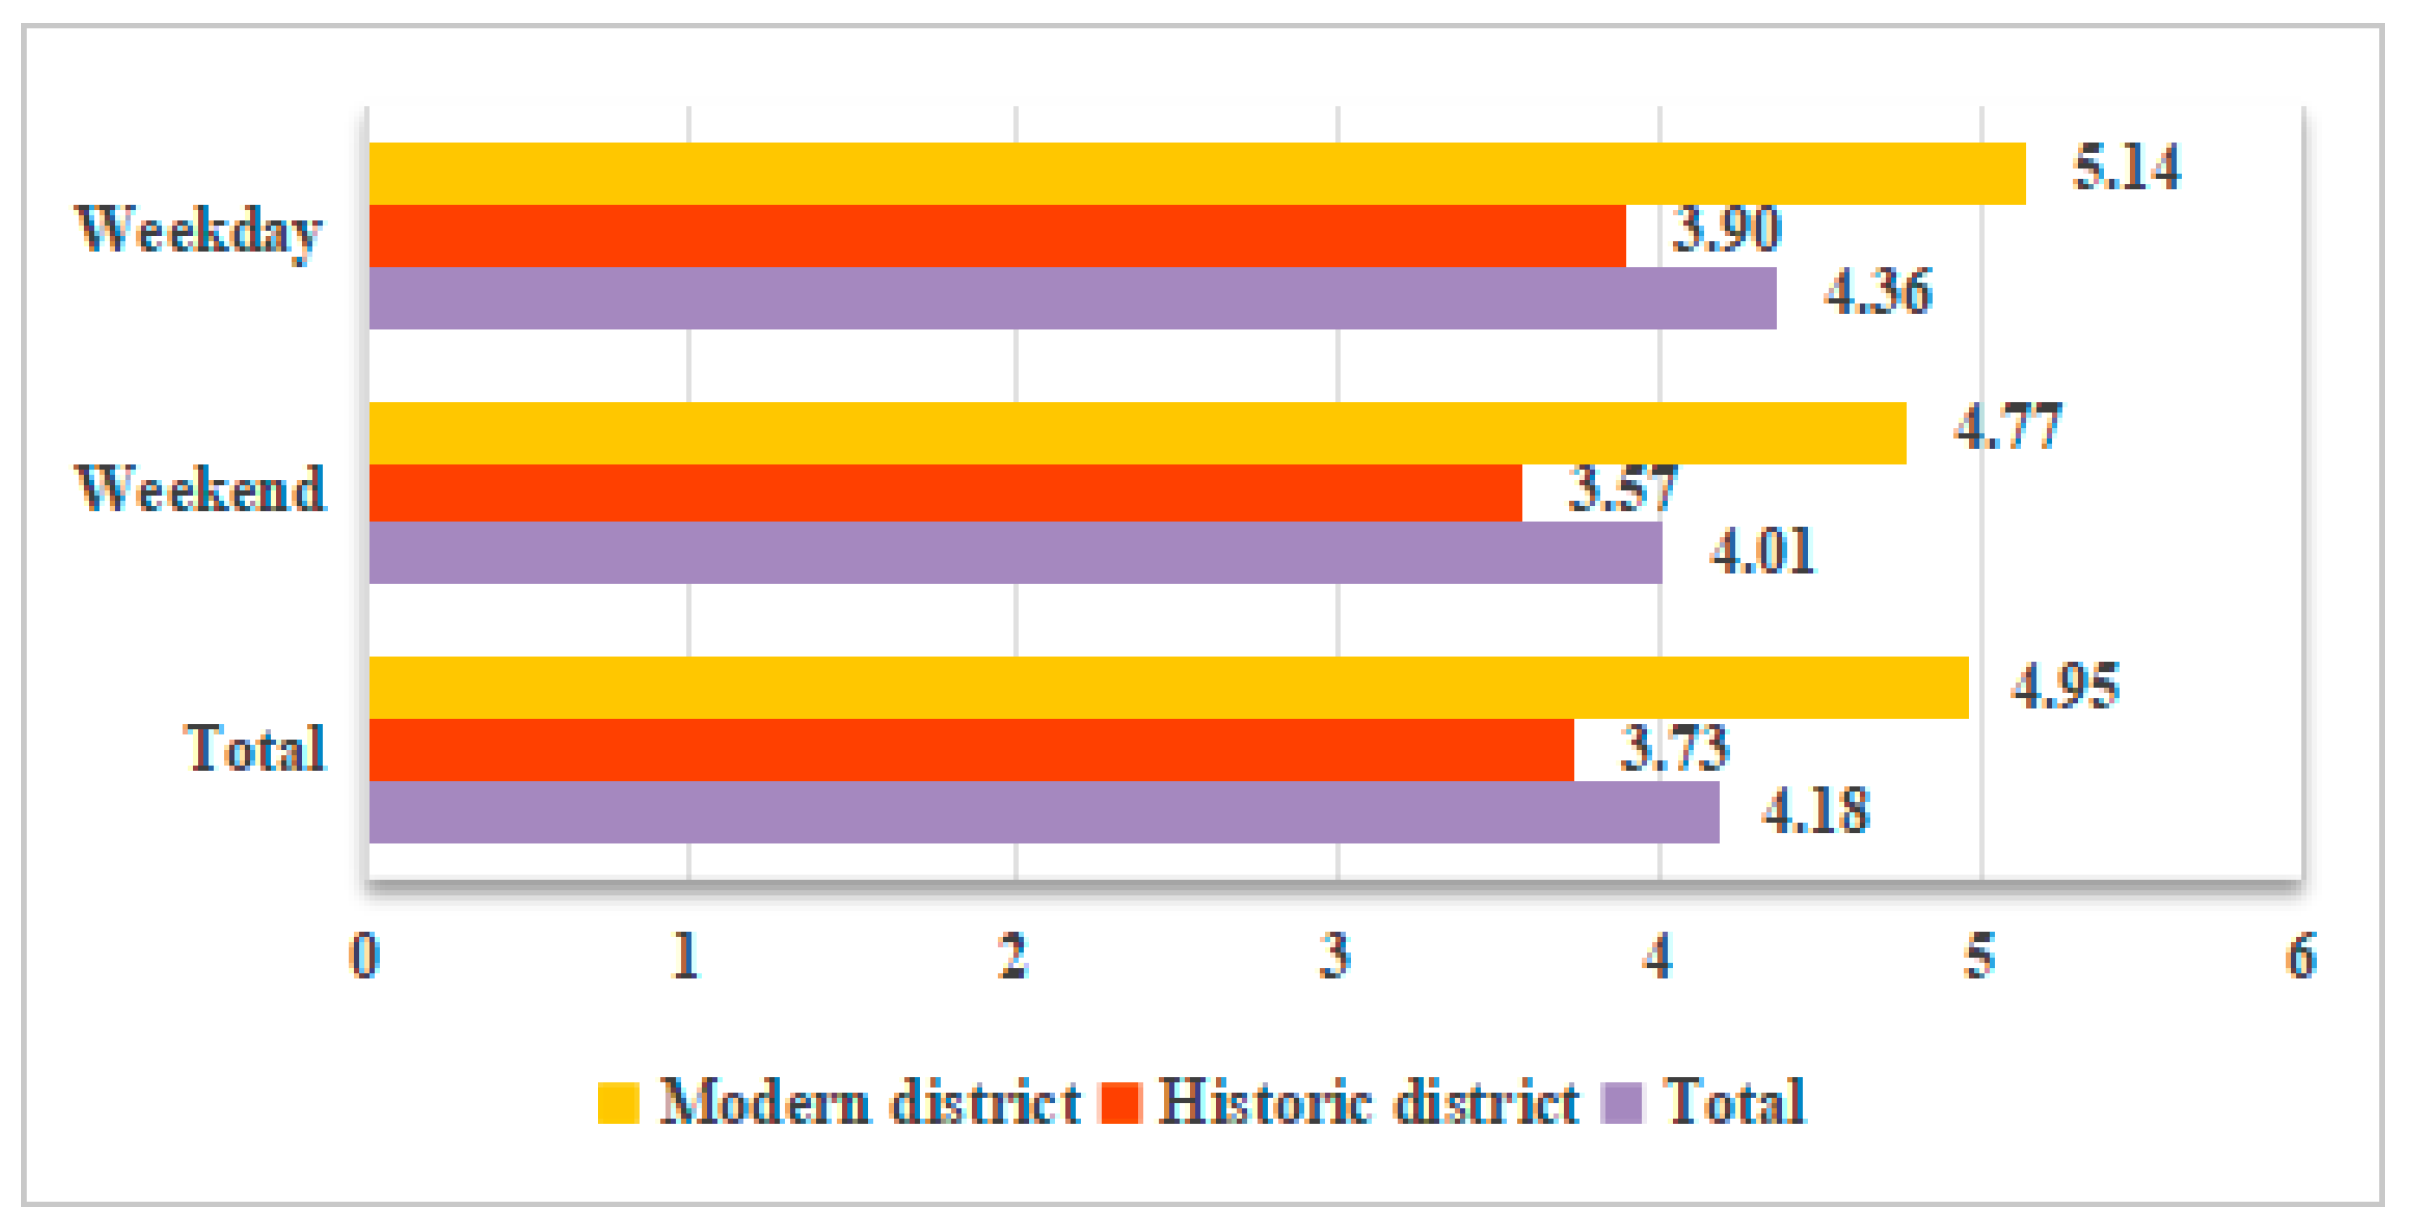
4.3.2. Walking Speed in Historic and Modern Districts
4.3.3. Spatiotemporal Circles of Residents’ Daily Walking
5. Discussion
5.1. Optimization of District-Level Walking Environments Based on Residential Equity
5.2. Planning of Walkable Community Life Units Based on Spatiotemporal Circles
5.3. Potential Applications
5.3.1. Urban Renewal and Community-Building Tools
5.3.2. Walking-Based Health Intervention Strategies
5.3.3. Data Integration and Evidence-Driven Planning
5.4. Limitations and Future Work
6. Conclusions
Author Contributions
Funding
Data Availability Statement
Acknowledgments
Conflicts of Interest
References
- Moreno, C.; Allam, Z.; Chabaud, D.; Gall, C.; Pratlong, F. Introducing the “15-Minute City”: Sustainability, Resilience and Place Identity in Future Post-Pandemic Cities. Smart Cities 2021, 4, 93–111. [Google Scholar] [CrossRef]
- Sepehri, B.; Sharifi, A. X-Minute Cities as a Growing Notion of Sustainable Urbanism: A Literature Review. Cities 2025, 161, 105902. [Google Scholar] [CrossRef]
- Hajna, S.; Ross, N.A.; Brazeau, A.-S.; Bélisle, P.; Joseph, L.; Dasgupta, K. Associations between Neighbourhood Walkability and Daily Steps in Adults: A Systematic Review and Meta-Analysis. BMC Public Health 2015, 15, 768. [Google Scholar] [CrossRef] [PubMed]
- Middleton, J. The Walkable City: Dimensions of Walking and Overlapping Walks of Life; Taylor & Francis: London, UK, 2021; ISBN 978-1-315-51920-3. [Google Scholar]
- Mehaffy, M.W. UN-Sustainable Urbanism: The Challenge of “Lock-In”. Sustainability 2024, 16, 7301. [Google Scholar] [CrossRef]
- Logan, T.M.; Hobbs, M.H.; Conrow, L.C.; Reid, N.L.; Young, R.A.; Anderson, M.J. The X-Minute City: Measuring the 10, 15, 20-Minute City and an Evaluation of Its Use for Sustainable Urban Design. Cities 2022, 131, 103924. [Google Scholar] [CrossRef]
- Grant, J.L. Complete Community Planning Theory From Practice. J. Am. Plan. Assoc. 2024, 90, 213–229. [Google Scholar] [CrossRef]
- Nakamura, K. The relationship between walkability and QOL outcomes in residential evaluation. Cities 2022, 131, 104008. [Google Scholar] [CrossRef]
- Almeida, D.P.; Alberto, K.C.; Mendes, L.L. Neighborhood environment walkability scale: A scoping review. J. Transp. Health 2021, 23, 101261. [Google Scholar] [CrossRef]
- Camerin, F. Urban Governance in Post-Pandemic Barcelona: A Superblock-Based New Normal? In The ‘New Normal’ in Planning, Governance and Participation: Transforming Urban Governance in a Post-Pandemic World; Lissandrello, E., Sørensen, J., Olesen, K., Steffansen, R.N., Eds.; Springer International Publishing: Cham, Switzerland, 2023; pp. 287–299. ISBN 978-3-031-32664-6. [Google Scholar]
- Van der Lee, J.C.T.; Veeneman, W.W. A Framework of Success Factors and Barriers for Urban Car Reduction in European Cities. Transp. Policy 2025, 165, 1–16. [Google Scholar] [CrossRef]
- Torre, A. New Proximities during and after the Covid 19 Pandemic. Reg. Sci. Policy Pract. 2025, 17, 100199. [Google Scholar] [CrossRef]
- Weng, M.; Ding, N.; Li, J.; Jin, X.; Xiao, H.; He, Z.; Su, S. The 15-minute walkable neighborhoods: Measurement, social inequalities and implications for building healthy communities in urban China. J. Transp. Health 2019, 13, 259–273. [Google Scholar] [CrossRef]
- Jiang, M.; Hu, J.; Gao, X. Community Life Circle, Neighbourly Interaction, and Social Cohesion: Does Community Space Use Foster Stronger Communities? Land 2024, 13, 1094. [Google Scholar] [CrossRef]
- Song, L.; Kong, X.; Cheng, P. Supply-Demand Matching Assessment of the Public Service Facilities in 15-Minute Community Life Circle Based on Residents’ Behaviors. Cities 2024, 144, 104637. [Google Scholar] [CrossRef]
- Xu, Z.; Shang, Z.; Zhong, Y.; Han, L.; Li, M.; Yang, Y. Evaluating 15-Minute Walkable Life Circles for the Senior: A Case Study of Jiande, China. J. Asian Archit. Build. Eng. 2024, 1–17. [Google Scholar] [CrossRef]
- Jiang, Z.; Wu, C.; Chung, H. The 15-Minute Community Life Circle for Older People: Walkability Measurement Based on Service Accessibility and Street-Level Built Environment—A Case Study of Suzhou, China. Cities 2025, 157, 105587. [Google Scholar] [CrossRef]
- Mondal, A.; Bhat, C.R.; Costey, M.C.; Bhat, A.C.; Webb, T.; Magassy, T.B.; Pendyala, R.M.; Lam, W.H.K. How do people feel while walking? A multivariate analysis of emotional well-being for utilitarian and recreational walking episodes. Int. J. Sustain. Transp. 2021, 15, 419–434. [Google Scholar] [CrossRef]
- Habibian, M.; Hosseinzadeh, A. Walkability index across trip purposes. Sustain. Cities Soc. 2018, 42, 216–225. [Google Scholar] [CrossRef]
- Christian, H.E.; Bull, F.C.; Middleton, N.J.; Knuiman, M.W.; Divitini, M.L.; Hooper, P.; Amarasinghe, A.; Giles-Corti, B. How important is the land use mix measure in understanding walking behaviour? Results from the RESIDE study. Int. J. Behav. Nutr. Phys. Act. 2011, 8, 55. [Google Scholar] [CrossRef] [PubMed]
- Koohsari, M.J.; Kaczynski, A.T.; Giles-Corti, B.; Karakiewicz, J.A. Effects of access to public open spaces on walking: Is proximity enough? Landsc. Urban Plan. 2013, 117, 92–99. [Google Scholar] [CrossRef]
- Torun, A.O.; Gocer, K.; Yesiltepe, D.; Argin, G. Understanding the role of urban form in explaining transportation and recreational walking among children in a logistic GWR model: A spatial analysis in Istanbul, Turkey. J. Transp. Geogr. 2020, 82, 102617. [Google Scholar] [CrossRef]
- Foster, S.; Hooper, P.; Knuiman, M.; Christian, H.; Bull, F.; Giles-Corti, B. Safe RESIDential Environments? A longitudinal analysis of the influence of crime-related safety on walking. Int. J. Behav. Nutr. Phys. Act. 2016, 13, 22. [Google Scholar] [CrossRef] [PubMed]
- Akpinar, A.; Cankurt, M. How are characteristics of urban green space related to levels of physical activity: Examining the links. Indoor Built Environ. 2017, 26, 1091–1101. [Google Scholar] [CrossRef]
- Chaix, B.; Simon, C.; Charreire, H.; Thomas, F.; Kestens, Y.; Karusisi, N.; Vallée, J.; Oppert, J.-M.; Weber, C.; Pannier, B. The environmental correlates of overall and neighborhood based recreational walking (a cross-sectional analysis of the RECORD Study). Int. J. Behav. Nutr. Phys. Act. 2014, 11, 20. [Google Scholar] [CrossRef] [PubMed]
- Adkins, A.; Makarewicz, C.; Scanze, M.; Ingram, M.; Luhr, G. Contextualizing Walkability: Do Relationships Between Built Environments and Walking Vary by Socioeconomic Context? J. Am. Plan. Assoc. 2017, 83, 296–314. [Google Scholar] [CrossRef]
- Fonseca, F.; Ribeiro, P.J.G.; Conticelli, E.; Jabbari, M.; Papageorgiou, G.; Tondelli, S.; Ramos, R.A.R. Built environment attributes and their influence on walkability. Int. J. Sustain. Transp. 2021, 16, 660–679. [Google Scholar] [CrossRef]
- Dias, A.F.; Gaya, A.R.; Santos, M.P.; Brand, C.; Pizarro, A.N.; Fochesatto, C.F.; Mendes, T.M.; Mota, J.; Gaya, A.C.A. Neighborhood environmental factors associated with leisure walking in adolescents. Rev. Saúde Pública 2020, 54, 61. [Google Scholar] [CrossRef]
- Liu, Z.; Kemperman, A.; Timmermans, H. Correlates of older adults’ walking trip duration. J. Transp. Health 2020, 18, 100889. [Google Scholar] [CrossRef]
- Zhao, Y.; Chung, P.-K. Neighborhood environment walkability and health-related quality of life among older adults in Hong Kong. Arch. Gerontol. Geriatr. 2017, 73, 182–186. [Google Scholar] [CrossRef]
- Bunds, K.S.; Casper, J.M.; Hipp, J.A.; Koenigstorfer, J. Recreational walking decisions in urban away-from-home environments: The relevance of air quality, noise, traffic, and the natural environment. Transp. Res. Part F-Traffic Psychol. Behav. 2019, 65, 363–375. [Google Scholar] [CrossRef]
- McGinn, A.P.; Kaplan, R.C.; Verghese, J.; Rosenbaum, D.M.; Psaty, B.M.; Baird, A.E.; Lynch, J.K.; Wolf, P.A.; Kooperberg, C.; Larson, J.C.; et al. Walking Speed and Risk of Incident Ischemic Stroke Among Postmenopausal Women. Stroke 2008, 39, 1233–1239. [Google Scholar] [CrossRef]
- Bohannon, R.W.; Williams Andrews, A. Normal Walking Speed: A Descriptive Meta-Analysis. Physiotherapy 2011, 97, 182–189. [Google Scholar] [CrossRef] [PubMed]
- Wu, T.; Zhao, Y. Associations between Functional Fitness and Walking Speed in Older Adults. Geriatr. Nurs. 2021, 42, 540–543. [Google Scholar] [CrossRef]
- Giannoulaki, M.; Christoforou, Z. Pedestrian Walking Speed Analysis: A Systematic Review. Sustainability 2024, 16, 4813. [Google Scholar] [CrossRef]
- Tudor-Locke, C. Watch Your Step: Pedometers and Physical Activity; WellSpring: Edmonton, AB, Canada, 2003; p. 8. [Google Scholar]
- Schimpl, M.; Moore, C.; Lederer, C.; Neuhaus, A.; Sambrook, J.; Danesh, J.; Ouwehand, W.; Daumer, M. Association between Walking Speed and Age in Healthy, Free-Living Individuals Using Mobile Accelerometry—A Cross-Sectional Study. PLoS ONE 2011, 6, e23299. [Google Scholar] [CrossRef]
- Salbach, N.M.; O’Brien, K.; Brooks, D.; Irvin, E.; Martino, R.; Takhar, P.; Chan, S.; Howe, J.-A. Speed and Distance Requirements for Community Ambulation: A Systematic Review. Arch. Phys. Med. Rehabil. 2014, 95, 117–128.e11. [Google Scholar] [CrossRef] [PubMed]
- Levine, R.V.; Norenzayan, A. The Pace of Life in 31 Countries. J. Cross-Cult. Psychol. 1999, 30, 178–205. [Google Scholar] [CrossRef]
- Pueboobpaphan, R.; Pueboobpaphan, S.; Sukhotra, S. Acceptable walking distance to transit stations in Bangkok, Thailand: Application of a stated preference technique. J. Transp. Geogr. 2022, 99, 103296. [Google Scholar] [CrossRef]
- McCormack, G.R.; Giles-Corti, B.; Bulsara, M. The Relationship between Destination Proximity, Destination Mix and Physical Activity Behaviors. Prev. Med. 2008, 46, 33–40. [Google Scholar] [CrossRef]
- Brown, S.C.; Lombard, J.; Toro, M.; Huang, S.; Perrino, T.; Perez-Gomez, G.; Plater-Zyberk, E.; Pantin, H.; Affuso, O.; Kumar, N.; et al. Walking and Proximity to the Urban Growth Boundary and Central Business District. Am. J. Prev. Med. 2014, 47, 481–486. [Google Scholar] [CrossRef]
- Kaczynski, A.T.; Potwarka, L.R.; Saelens, B.E. Association of Park Size, Distance, and Features With Physical Activity in Neighborhood Parks. Am. J. Public Health 2008, 98, 1451–1456. [Google Scholar] [CrossRef]
- Tsunoda, K.; Soma, Y.; Kitano, N.; Jindo, T.; Fujii, K.; Okura, T. Acceptable Walking and Cycling Distances and their Correlates among Older Japanese Adults. Popul. Ageing 2021, 14, 183–200. [Google Scholar] [CrossRef]
- Pongprasert, P.; Kubota, H. TOD residents’ attitudes toward walking to transit station: A case study of transit-oriented developments (TODs) in Bangkok, Thailand. J. Mod. Transport. 2019, 27, 39–51. [Google Scholar] [CrossRef]
- Lyu, Y.; Forsyth, A. Attitudes, perceptions, and walking behavior in a Chinese city. J. Transp. Health 2021, 21, 101047. [Google Scholar] [CrossRef]
- Townsend, C.; Zacharias, J. Built environment and pedestrian behavior at rail rapid transit stations in Bangkok. Transportation 2010, 37, 317–330. [Google Scholar] [CrossRef]
- Bivina, G.R.; Gupta, A.; Parida, M. Walk Accessibility to Metro Stations: An analysis based on Meso- or Micro-scale Built Environment Factors. Sustain. Cities Soc. 2020, 55, 102047. [Google Scholar] [CrossRef]
- Sarker, R.I.; Mailer, M.; Sikder, S.K. Walking to a public transport station: Empirical evidence on willingness and acceptance in Munich, Germany. Smart Sustain. Built Environ. 2019, 9, 38–53. [Google Scholar] [CrossRef]
- Liu, W.; Zheng, S.; Hu, X.; Wu, Z.; Chen, S.; Huang, Z.; Zhang, W. Effects of Spatial Scale on the Built Environments of Community Life Circles Providing Health Functions and Services. Build. Environ. 2022, 223, 109492. [Google Scholar] [CrossRef]
- Wang, R.; Wang, Y.; Zhang, Y. International Methods and Local Factors of Walkability: A Bibliometric Analysis and Review. J. Urban Plan. Dev. 2022, 148, 03122003. [Google Scholar] [CrossRef]
- Koohsari, M.J.; McCormack, G.R.; Shibata, A.; Ishii, K.; Yasunaga, A.; Nakaya, T.; Oka, K. The relationship between walk score® and perceived walkability in ultrahigh density areas. Prev. Med. Rep. 2021, 23, 101393. [Google Scholar] [CrossRef]
- Koo, B.W.; Guhathakurta, S.; Botchwey, N. How are Neighborhood and Street-Level Walkability Factors Associated with Walking Behaviors? A Big Data Approach Using Street View Images. Environ. Behav. 2021, 54, 211–241. [Google Scholar] [CrossRef]
- Wei, Z.; Cao, K.; Kwan, M.-P.; Jiang, Y.; Feng, Q. Measuring the age-friendliness of streets’ walking environment using multi-source big data: A case study in Shanghai, China. Cities 2024, 148, 104829. [Google Scholar] [CrossRef]
- Zeng, Q.; Wu, H.; Wei, Y.; Wang, J.; Zhang, C.; Fei, N.; Dewancker, B.J. Association between Built Environment Factors and Collective Walking Behavior in Peri-Urban Area: Evidence from Chengdu. Appl. Geogr. 2024, 167, 103274. [Google Scholar] [CrossRef]
- Zan, C.; Bhatia, R.; Samant, S. Reimagining the High-Density, Vertical 15-Minute City. Buildings 2025, 15, 1629. [Google Scholar] [CrossRef]
- Elzeni, M.M.; ELMokadem, A.A.; Badawy, N.M. Impact of Urban Morphology on Pedestrians: A Review of Urban Approaches. Cities 2022, 129, 103840. [Google Scholar] [CrossRef]
- Ma, W.; Wang, N.; Li, Y.; Sun, D. 15-Min Pedestrian Distance Life Circle and Sustainable Community Governance in Chinese Metropolitan Cities: A Diagnosis. Humanit. Soc. Sci. Commun. 2023, 10, 364. [Google Scholar] [CrossRef]
- Loo, B.P.Y.; Lian, T.; Frank, L.D. Walking (In)Convenience. J. Am. Plan. Assoc. 2024, 90, 742–757. [Google Scholar] [CrossRef]
- Pun-Cheng, L.S.C.; So, C.W.Y. A Comparative Analysis of Perceived and Actual Walking Behaviour in Varying Land Use and Time. J. Locat. Based Serv. 2019, 13, 53–72. [Google Scholar] [CrossRef]
- To, Q.G.; Stanton, R.; Schoeppe, S.; Doering, T.; Vandelanotte, C. Differences in Physical Activity between Weekdays and Weekend Days among U.S. Children and Adults: Cross-Sectional Analysis of NHANES 2011–2014 Data. Prev. Med. Rep. 2022, 28, 101892. [Google Scholar] [CrossRef]
- Liu, J.; Ettema, D.; Helbich, M. Street View Environments Are Associated with the Walking Duration of Pedestrians: The Case of Amsterdam, the Netherlands. Landsc. Urban Plan. 2023, 235, 104752. [Google Scholar] [CrossRef]
- Sepe, M. Contemporary Approaches to Healthy and Livable Public Spaces: Proximity, Flexibility, and Diversification. Urban Des. Int. 2025. [Google Scholar] [CrossRef]
- Ge, T.; Hou, W.; Xiao, Y. Study on the Regeneration of City Centre Spatial Structure Pedestrianisation Based on Space Syntax: Case Study on 21 City Centres in the UK. Land 2023, 12, 1183. [Google Scholar] [CrossRef]
- Rahman, M.T.; Nahiduzzaman, K.M. Examining the Walking Accessibility, Willingness, and Travel Conditions of Residents in Saudi Cities. Int. J. Environ. Res. Public Health 2019, 16, 545. [Google Scholar] [CrossRef] [PubMed]
- Iamtrakul, P.; Chayphong, S.; Gao, W. Assessing Spatial Disparities and Urban Facility Accessibility in Promoting Health and Well-Being. Transp. Res. Interdiscip. Perspect. 2024, 25, 101126. [Google Scholar] [CrossRef]
- Martínez-Hernández, J.A.; Gámez-García, D.C.; Saldaña-Márquez, H. Operational LCA of a Street with Active Mobility Strategies in Northern México. Transp. Res. Part D Transp. Environ. 2024, 135, 104374. [Google Scholar] [CrossRef]

| Services | Walking Time | Walking Distance | Population | |
|---|---|---|---|---|
| Small life unit (Republic of Korea) | Junior and senior high school, a small amount of employment and shopping | <15 min | 1–2 km | 30–60,000 people |
| Fixed life unit (Japan) | ||||
| 15-minute life unit (Shanghai) | Meeting physical and cultural needs of residents | <15 min | 0.8–1 km | 50–100,000 people |
| Residential community life unit (Nanjing) | A functional system for residents’ daily lives | 10–15 min | 0.5–1 km | 30–100,000 people |
| Basic community life unit (Nanjing) | Services for the elderly and children | 5 min | 200–300 m | 0.5–10,000 people |
| Purpose | Departure Time | Duration | Distance | ||
|---|---|---|---|---|---|
| Weekdays/Weekends | 1 | □ To or from a destination __________ (choose from the following options) | ____:____ | ______ minutes | □ <500 m □ 500 m–1 km □ 1 km–2 km □ >2 km |
| 2 | □ Leisure walking | ____:____ | ______ minutes | □ <500 m □ 500 m–1 km □ 1 km–2 km □ >2 km | |
| 1-store, 2-supermarket, 3-commercial street, 4-Chinese restaurant, 5-fast food restaurant, 6-snack bar/breakfast restaurant, 7-cafe/bar, 8-library, 9-hospital/clinic, 10-pharmacy, 11-barber shop, 12-bank/post office, 13-stadium/playground, 14-park, 15-high school/junior high school, 16-primary school/kindergarten, 17-bus stop, 18-subway station, 19-office building, 20-others __________ | |||||
Disclaimer/Publisher’s Note: The statements, opinions and data contained in all publications are solely those of the individual author(s) and contributor(s) and not of MDPI and/or the editor(s). MDPI and/or the editor(s) disclaim responsibility for any injury to people or property resulting from any ideas, methods, instructions or products referred to in the content. |
© 2025 by the authors. Licensee MDPI, Basel, Switzerland. This article is an open access article distributed under the terms and conditions of the Creative Commons Attribution (CC BY) license (https://creativecommons.org/licenses/by/4.0/).
Share and Cite
Wang, R.; Tang, H.; Chen, Y. Identifying Spatiotemporal Circles of Residents’ Daily Walking in Historic and Modern Districts: An Empirical Study in Nanjing, China. Land 2025, 14, 1321. https://doi.org/10.3390/land14071321
Wang R, Tang H, Chen Y. Identifying Spatiotemporal Circles of Residents’ Daily Walking in Historic and Modern Districts: An Empirical Study in Nanjing, China. Land. 2025; 14(7):1321. https://doi.org/10.3390/land14071321
Chicago/Turabian StyleWang, Rui, Hengliang Tang, and Yue Chen. 2025. "Identifying Spatiotemporal Circles of Residents’ Daily Walking in Historic and Modern Districts: An Empirical Study in Nanjing, China" Land 14, no. 7: 1321. https://doi.org/10.3390/land14071321
APA StyleWang, R., Tang, H., & Chen, Y. (2025). Identifying Spatiotemporal Circles of Residents’ Daily Walking in Historic and Modern Districts: An Empirical Study in Nanjing, China. Land, 14(7), 1321. https://doi.org/10.3390/land14071321