Article

Spatiotemporal Patterns and Driving Factors of Cropland Abandonment in Metropolitan Suburbs: A Case Study of Chengdu Directly Administered Zone, Tianfu New Area, Sichuan Province, China

1
Faculty of Geosciences and Engineering, Southwest Jiaotong University, Chengdu 610097, China
2
Survey and Planning Research Center of Sichuan Institute of Geological Survey, Chengdu 621109, China
3
The State Key Laboratory of Geohazard Prevention and Geoenvironment Protection, Chengdu University of Technology, Chengdu 610059, China
*
Author to whom correspondence should be addressed.
Land 2025, 14(6), 1311; https://doi.org/10.3390/land14061311
Submission received: 26 May 2025 / Revised: 13 June 2025 / Accepted: 17 June 2025 / Published: 19 June 2025
(This article belongs to the Section Land Use, Impact Assessment and Sustainability)

Abstract

Cropland abandonment (CA) has become a significant threat to agricultural sustainability, particularly in metropolitan suburbs where urban expansion and cropland preservation often conflict. This study examines the Chengdu Directly Administered Zone of the Tianfu New Area in Sichuan Province, China, as a case study, utilizing high-precision vector data from China’s 2019–2023 National Land Survey to identify abandoned croplands through land use change trajectory analysis. By integrating kernel density estimation, spatial autocorrelation analysis, and geographically weighted regression modeling, we quantitatively analyzed the spatiotemporal patterns of CA and the spatial heterogeneity of driving factors in the study area. The results demonstrate an average annual abandonment rate of approximately 8%, exhibiting minor fluctuations but significant spatial clustering characteristics, with abandonment hotspots concentrated in peri-urban areas that gradually expanded toward urban cores over time, while exurban regions showed lower abandonment rates. Cropland quality and the aggregation index were identified as key restraining factors, whereas increasing slope and land development intensity were found to elevate abandonment risks. Notably, distance to roads displayed a negative effect, contrary to conventional understanding, revealing that policy feedback mechanisms induced by anticipated land expropriation along transportation corridors serve as important drivers of suburban abandonment. This study provides a scientific basis for optimizing resilient urban–rural land allocation, curbing speculative abandonment, and exploring integrated “agriculture + ecology + cultural tourism” utilization models for abandoned lands. The findings offer valuable insights for balancing food security and sustainable development in rapidly urbanizing regions worldwide, particularly providing empirical references for developing countries addressing the dilemma between urban expansion and cropland preservation.

1. Introduction

With continuous global population growth, the demand for food is continuing to rise. To feed the world by 2050, global food production must increase by 70–100% [1,2,3]. However, global food security faces multiple challenges, including climate change, land degradation, political conflicts, water scarcity, and stagnating agricultural productivity [4,5,6,7], all of which exacerbate the difficulty of achieving sustainable agricultural development worldwide. The sustainability of food production is closely linked to land use practices. While arable land suitable for agricultural expansion is becoming increasingly scarce, cropland abandonment (CA) is rapidly increasing across diverse regions globally [8,9,10,11], emerging as a critical factor affecting agricultural sustainability and food security [12,13]. Moreover, CA may trigger a cascade of environmental and ecological issues, such as land degradation, biodiversity loss, and increased wildfire risks [14,15,16], though these negative impacts may vary depending on abandonment duration and local geographical conditions [17,18]. Given that global CA is projected to persist in the coming decades [19], addressing this challenge while achieving sustainable agricultural development has become an urgent global priority [20,21,22].
Accurately identifying the locations of abandoned cropland and elucidating their driving factors are prerequisites for formulating effective reutilization strategies [23,24,25]. Currently, CA assessments primarily employ two approaches: household surveys and remote sensing techniques. Household surveys, conducted through questionnaires and face-to-face interviews, provide firsthand data with high authenticity and accuracy. However, they suffer from low efficiency, high costs, and limited spatial coverage/sample sizes. Crucially, they often fail to geolocate farmer-reported abandonment to specific plots; thus, they are unable to capture spatiotemporal patterns of CA in detail [26,27,28]. In contrast, remote sensing offers cost-effective spatiotemporal monitoring. Due to their open access, long-term archives, and global coverage, the Landsat and MODIS datasets are widely used, primarily relying on land use change detection algorithms and spectral anomaly analysis to identify abandoned cropland [29,30,31]. Nevertheless, their mapping accuracy in specific regions is constrained by image availability, coarse resolution, complex spectral signatures, and error propagation in multi-temporal land cover classifications [32,33,34]. Recent advances in image processing technologies have demonstrated the remarkable potential of deep learning methods for detecting abandonment features, achieving impressive accuracy rates [35,36,37]. However, challenges persist in model architecture design, training data requirements, hyperparameter tuning, iterative optimization, and regional scalability.
A critical aspect of CA research involves identifying the deterministic drivers behind this process. It is widely recognized that CA results from complex interactions among biophysical, socioeconomic, institutional, and technological factors [38,39,40]. Existing studies reveal that abandoned cropland typically exhibits steep slopes [41], poor soil quality and low productivity [42], small and fragmented plot sizes [43], remote locations distant from settlements and roads [44], and high vulnerability to wildlife disturbances [45]. Beyond biophysical constraints, household-level characteristics such as labor diversification and income structure [46], education levels [47], and age demographics [48] significantly influence abandonment decisions. Critically, farmers’ land use decisions are shaped by macro-scale socioeconomic forces, with urbanization being the predominant driver [49,50,51]. Urbanization triggers rural-to-urban migration, leading to rural depopulation, agricultural labor shortages, increased opportunity costs for farming, and reduced profitability of traditional agriculture, collectively establishing urbanization as a primary catalyst for CA [52,53,54]. However, driver heterogeneity exists across regions, with complex interdependencies observed [55,56,57]. Thus, context-specific analyses of abandonment causes are essential to develop tailored mitigation strategies that facilitate sustainable reutilization of abandoned land.
China, as one of the world’s largest developing countries, possesses 8% of global cropland (https://www.fao.org/statistics/en/, accessed on 1 March 2025). Given its large population and severe per capita cropland shortage, the Chinese government has long prioritized cropland preservation and food security as core national governance issues [58,59]. However, rapid urbanization in China has triggered widespread CA, driven by low agricultural profitability, poor cultivation conditions, and rural labor migration [60,61,62]. This trend poses significant challenges to national food security and the stable supply of key agricultural products. A nationwide labor tracking survey revealed an average household-level abandonment rate of 8% [63]. Meanwhile, Landsat-derived annual land cover data estimated 31.2 million hectares of abandoned cropland in 2022 (16.49% of China’s total cropland area). Recultivating these lands could theoretically support the annual food demand of 179 million people [64]. While CA in China’s hilly and mountainous regions has received considerable attention [65,66,67]—where rural decline, labor exodus, and adverse agroecological conditions are pronounced—recent studies also document severe abandonment in economically developed areas [68,69,70]. These cases, though identified in national-scale analyses, remain understudied, lacking detailed investigation.
We are particularly interested in the issue of CA in metropolitan suburbs for three key reasons: (i) These areas serve as exemplary representatives of rapid economic development and profound social transformation due to accelerated urbanization, high population density, and well-established industrial foundations. (ii) Compared to traditional farming regions and remote rural areas, these urban–rural interface zones face more intense urban expansion pressures, where cropland conversion to artificial impervious surfaces dominates land use changes [71,72,73] and has become a primary research focus, while the actual extent, patterns, and driving factors of CA remain poorly understood. (iii) These areas experience intense land use competition and trade-offs among agricultural production, urban development, and ecosystem services, while abandoned cropland holds significant potential for diversified, intensive reuse and multifunctional value creation [74,75,76], requiring additional careful examination for proper governance and development.
Building upon this foundation, our study examines the phenomenon of CA in metropolitan suburbs using China’s Chengdu Directly Administered Zone of the Tianfu New Area, Sichuan Province, as a case study. Based on national land survey data, we generated CA maps to systematically investigate three key research questions:
  • What is the extent of CA in metropolitan suburbs?
  • What are the spatiotemporal patterns of CA in these areas?
  • What driving factors contribute to CA in metropolitan suburbs?
This study contributes to a deeper understanding of CA processes and provides scientific evidence and policy recommendations for enhancing cropland protection in rapidly urbanizing areas, preventing land idling and waste, optimizing land resource allocation efficiency, mitigating human–land conflicts, and promoting sustainable urban development.

2. Materials and Methods

2.1. Study Area

As of 2022, China has established 19 national-level new areas, which collectively account for approximately 0.2% of the nation’s population and land area but contribute 5% of its total economic output, serving as crucial growth poles for regional economic development. Among these, the Sichuan Tianfu New Area (STNA) was approved in 2014 by China’s State Council as the 11th national-level new area, with a total planned area of 1578 km2. The Chengdu Directly Administered Zone (CDAZ), the core area of STNA, is located south of Chengdu’s central urban area (Figure 1). This zone covers 564 km2 and administratively includes 9 subdistricts, 56 urban communities, and 60 administrative villages, representing a typical urban–rural transitional area. Climatically, the region experiences a humid subtropical monsoon climate with an annual precipitation of 856 mm and an average temperature of 16.3 °C. Topographically, the eastern part of the study area lies within the Longquan Mountain range, featuring higher elevations in the east that gradually decrease westward. The landscape is characterized by gentle hills with deep soil layers and high fertility, providing favorable conditions for agricultural production. In 2020, the permanent population reached 866,200 with an urbanization rate of 72.14%. Projections indicate the population will exceed 1.6 million by 2035, with urbanization reaching 90%.
Since its establishment in 2014, the CDAZ has pursued industrialization-oriented development and vigorously promoted industry–city integration, having attracted 450 major industrial projects in sectors, including artificial intelligence, aerospace, biomedicine, and big data, with total investment exceeding RMB 650 billion and achieving a cumulative GDP of RMB 309.3 billion at an average annual growth rate of 11%. However, it should be noted that the CDAZ is currently undergoing rapid economic development characterized by high GDP growth rates, significant population influx, and intensifying competition for land resources among industrial development, infrastructure construction, public services, and agricultural production. This situation not only leads to continued cropland loss but may also increase CA due to growing non-agricultural employment opportunities and diversified household livelihoods, although the current status of CA in the CDAZ remains unclear. Therefore, conducting research on CA in this metropolitan suburban area is particularly significant, as it will provide valuable reference information for land resource management in rapidly urbanizing and industrializing regions as well as policy formulation for emerging development zones, with the case of the CDAZ offering important insights into balancing economic growth with agricultural land preservation in new development zones.

2.2. Data Sources

This study utilized multiple data sources, including land use, cropland quality, road networks, DEM (digital elevation model), GDP (Gross Domestic Product), demographic data, and subdistrict administrative centers (Table 1). The land use data served as the key dataset for identifying CA. This comprehensive dataset was obtained through China’s nationwide land surveys conducted by the government. Implemented every decade since 1984, three such surveys have been completed to date. The Third National Land Survey (2018–2021) employed high-resolution satellite imagery (better than 1 m resolution) as base maps, incorporated advanced technologies, including mobile internet, cloud computing, and UAVs, and implemented strict quality control throughout the process. With participation from 219,000 surveyors over three years, the survey compiled 295 million land parcels, providing a complete inventory of national land use conditions. To maintain data timeliness and accuracy, China’s Ministry of Natural Resources conducts annual updates through change detection surveys. The dataset also includes cropland quality assessments and specifically categorizes road networks. Widely applied in land use change studies across China [58,68,77], the most recent data can be accessed through the National Land Survey Data Sharing Platform (https://gtdc.mnr.gov.cn/Share?UiNMsBTfPrya=1669860791924#/, accessed on 20 March 2025).
In addition to the land use data, other datasets were employed to identify the driving factors of CA. Specifically, cropland quality data were used to reflect agricultural productivity conditions, while DEM, GDP, and population data were utilized to characterize the natural and socioeconomic contexts of the cropland. Road networks and subdistrict administrative center locations served to calculate distance-related variables (see Section 2.3.5 for details).

2.3. Methods

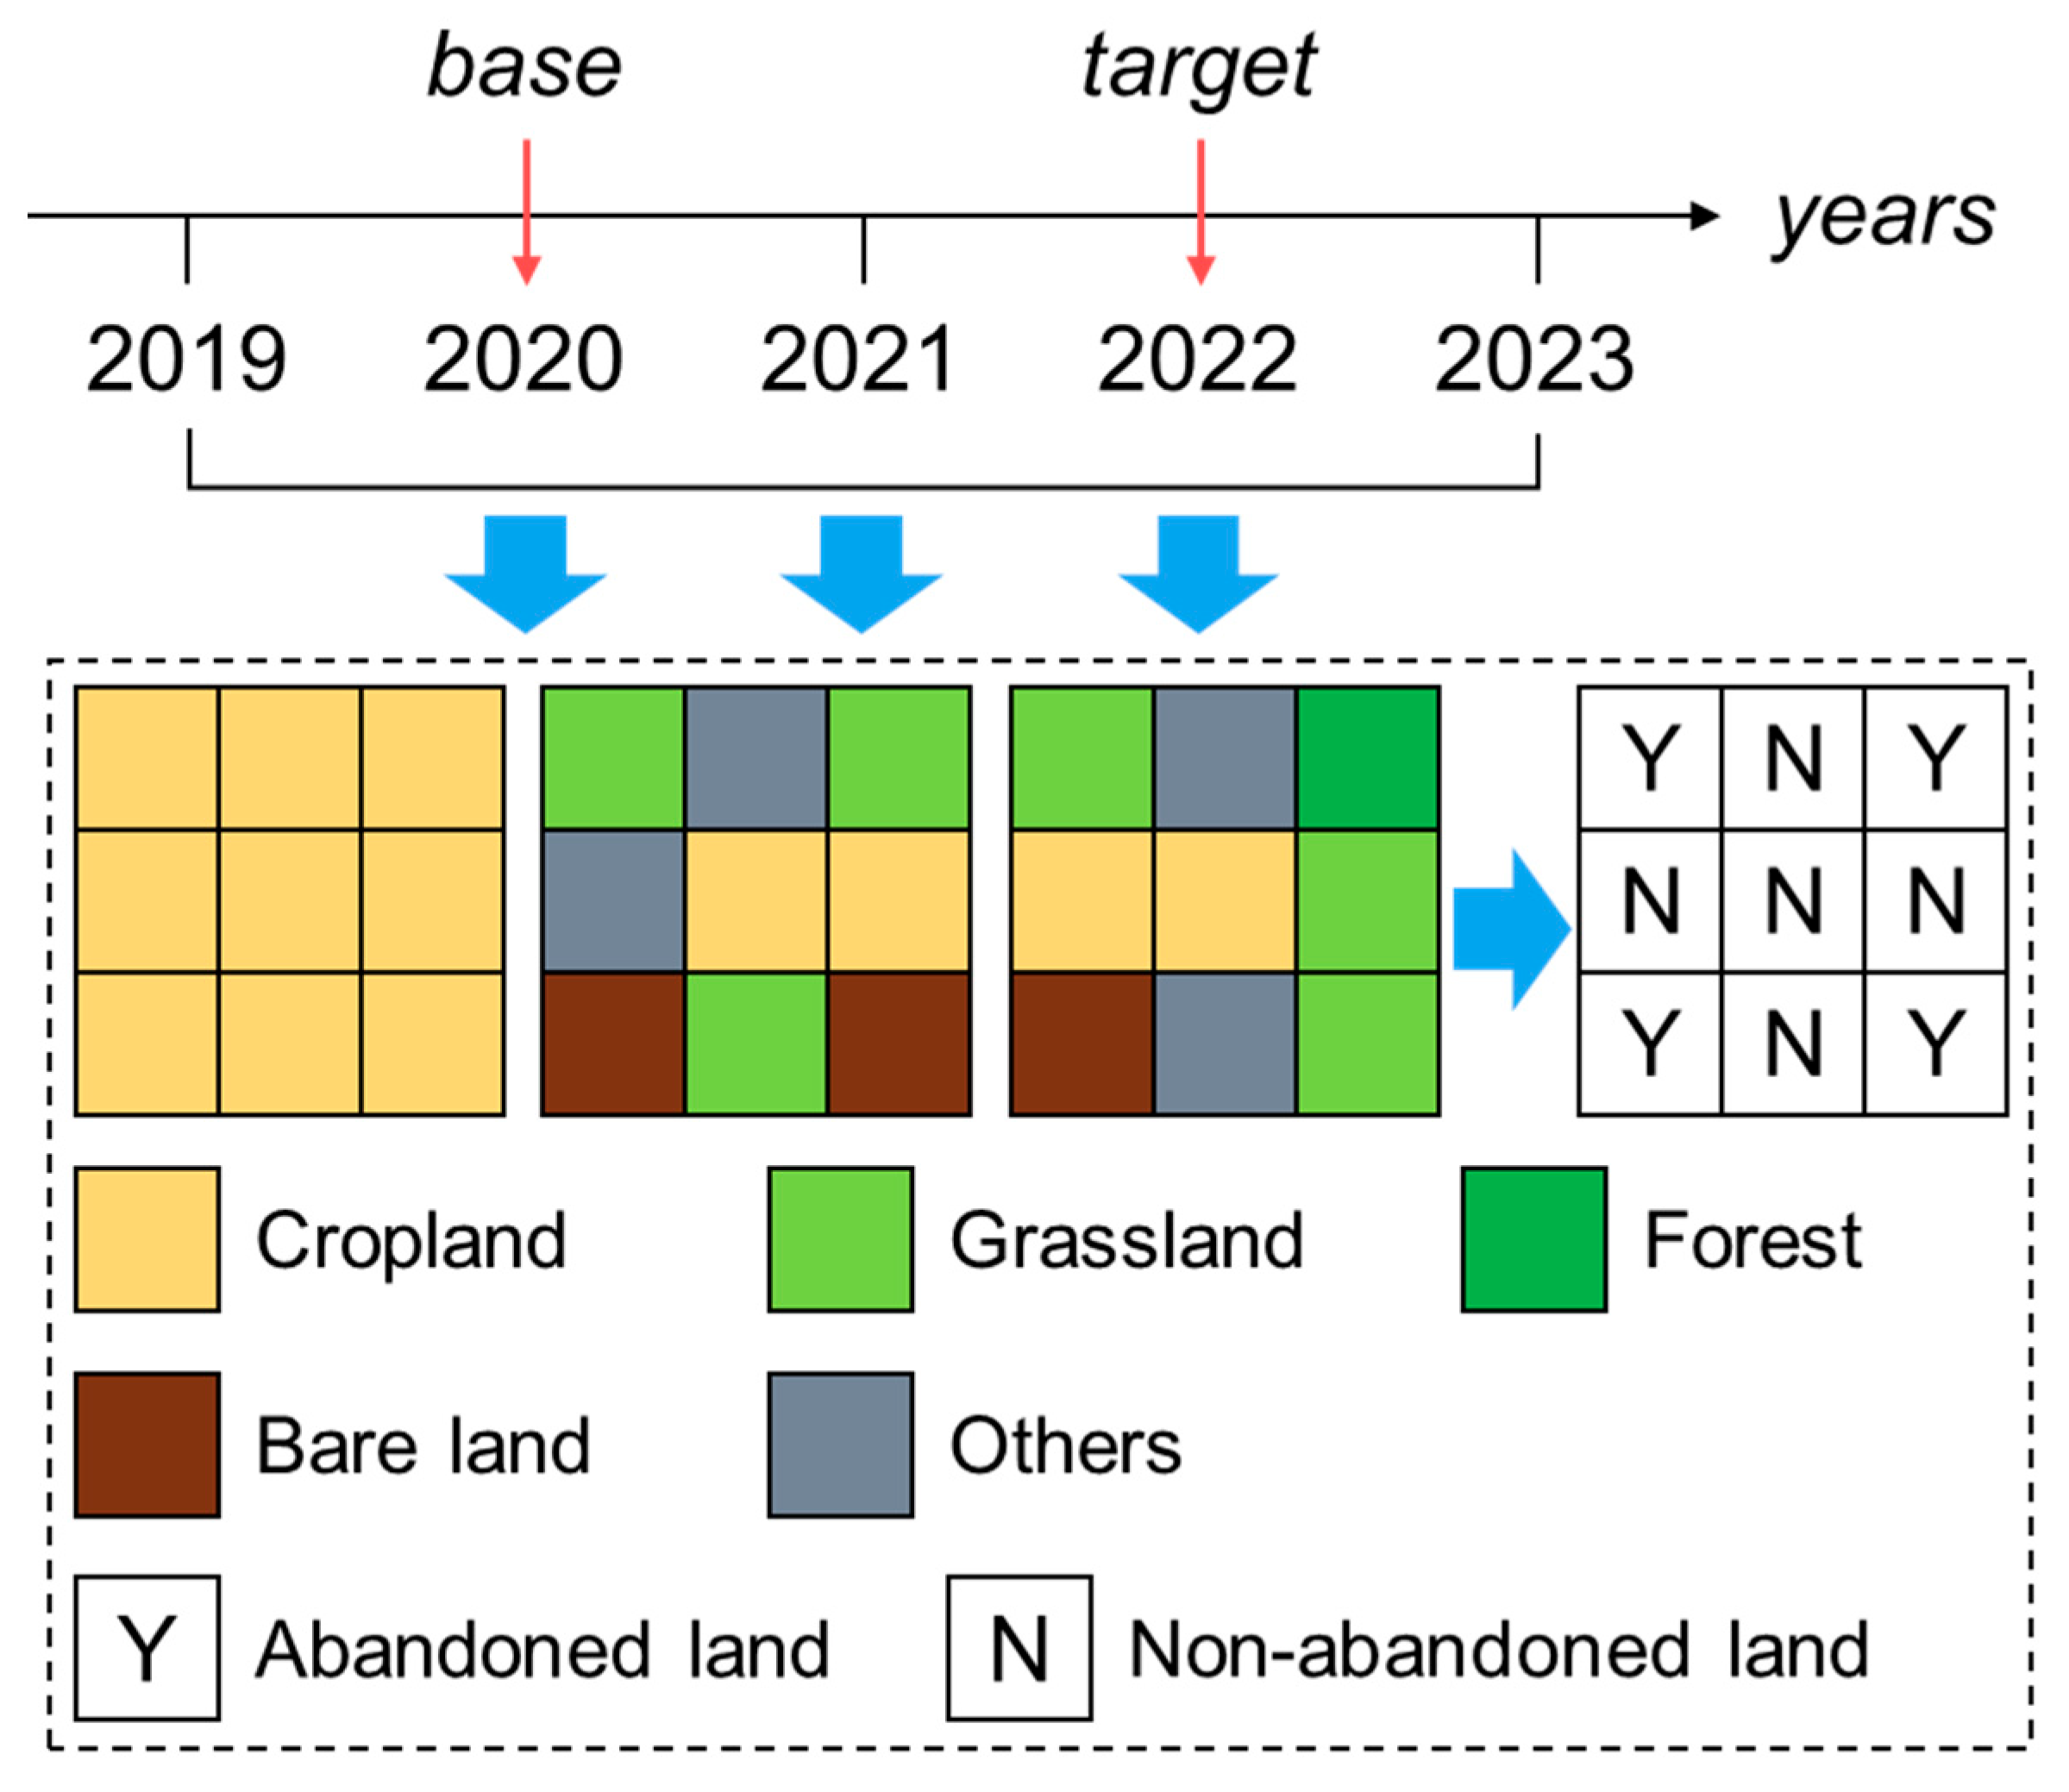
2.3.1. Cropland Abandonment Identification

CA is generally defined as the cessation of agricultural activities with no visible cultivation signs and an absence of direct human influence [18,78,79]. However, the literature lacks a unified precise definition, with primary variations occurring in the threshold duration of discontinued cultivation [30,39,63]. In this study, we adhered to the Land Administration Law of the People’s Republic of China, which mandates that no entity or individual shall leave cropland idle or barren. Croplands unused for two consecutive years may be reclaimed by local governments without compensation. To clarify, in this study, “unused” refers to land that has not been cultivated with crops, including both food crops and vegetables. This excludes seasonal fallow and crop rotation, which are not considered abandonment. To enhance operational clarity, we define CA as the conversion of active croplands to grassland, forest, or bare land for ≥2 consecutive years based on land use change trajectories, consistent with established methodologies [24,61,62]. Importantly, conversion does not require the same non-cultivated land type for two consecutive years. For example, if cropland is converted to grassland in the first year and then changes to forest in the second year, it qualifies as abandonment. However, a cycle such as cropland → grassland → cropland would not be considered abandonment, as the land returns to cultivation. In our study, we specifically focused on three non-cultivated land types—grassland, forest, and bare land—to define CA. This is based on the land use change dynamics that occur after cultivation ceases: vegetation gradually withers, turning into bare land, or vegetation succession occurs, leading to the development of grassland or forest through human interventions such as planting trees or sowing grass. If any land within the two-year trajectory shifts to land use categories such as “others” (e.g., commercial, industrial, residential, public service, or transportation land), it is excluded from the abandonment classification due to the irreversible nature of these land use changes. Using spatial overlay analysis of 2019–2023 land use data, we identified annual distributions of abandoned croplands (Figure 2). The abandonment rate—calculated as the abandoned area in the target year divided by the baseline cropland area [13,67]—quantified abandonment intensity. This yielded three annual CA maps (2021–2023).

2.3.2. Exploratory Spatial Data Analysis

The exploratory spatial data analysis (ESDA) method was applied to examine the spatial clustering effects of abandoned croplands, incorporating both global and local spatial autocorrelation analyses, as measured by Moran’s I index [80,81]. Global spatial autocorrelation describes the overall spatial characteristics of attribute values across the entire study area, quantifying the degree of spatial dependence at the regional scale, while local spatial autocorrelation reveals the similarities or differences between a reference spatial unit and its neighboring units in terms of their attribute values. The formulas are as follows:
I = n i = 1 n j = 1 n W i j x i x ¯ x j x ¯ i = 1 n j = 1 n W i j i = 1 n x i x ¯ 2
I i = n x i x ¯ j = 1 n W i j x j x ¯ i = 1 n x i x ¯ 2
where I and Ii represent the global and local Moran’s I indices, respectively, where n denotes the total number of spatial units, xi and xj indicate the abandonment rates of spatial units i and j, x ¯ is the mean abandonment rate, and Wij stands for the spatial weight matrix. The Moran’s I statistic ranges between [−1, 1], with values greater than 0 indicating positive spatial autocorrelation (clustered pattern), values less than 0 showing negative autocorrelation (dispersed pattern), and 0 suggesting no autocorrelation (random distribution) [82]. For the local indicator Ii, positive values signify that spatial units with similar values tend to cluster together (either high–high or low–low aggregation), while negative values imply they tend to disperse (high–low or low–high dissimilarity). For instance, if a spatial unit exhibits high cropland abandonment, its adjacent units would typically show low abandonment rates, and vice versa.

2.3.3. Kernel Density Estimation

Kernel density estimation (KDE) is a nonparametric method for estimating the probability density function of continuous random variables over a given interval. Owing to its high sensitivity to the distribution characteristics of attribute values, KDE is widely employed to reveal data distribution patterns, clustering features, and dynamic evolution trends. In this study, KDE was applied to analyze the spatial density characteristics and distribution trends of abandoned croplands, where higher kernel density values indicate a greater spatial concentration of CA. The formula is as follows:
f x = 1 n h i = 1 n K x x i h
where f(x) represents the kernel density estimate at point x, where n denotes the number of sample points, h is the bandwidth parameter, K stands for the kernel function, and xxi indicates the distance between the estimation point and sample point i.

2.3.4. Geographically Weighted Regression

We employed geographically weighted regression (GWR) to examine the varying impacts of different driving factors on CA. While traditional linear regression models provide only averaged or global parameter estimates, they often fail to adequately fit spatial data, particularly datasets exhibiting spatial non-stationarity. As an extension of conventional linear regression, GWR incorporates spatial characteristics of the data into the model, enabling local regression analysis of spatial data from a localized perspective to better capture the spatial variability in relationships between explanatory variables and the dependent variable across geographical space [83]. In this study, constrained by data availability limitations, we conducted GWR analysis exclusively for the 2021 abandonment rates, with all computational procedures implemented through the GWR 4.09 software platform (https://gwr.maynoothuniversity.ie/gwr4-software/, accessed on 5 March 2025). The model is expressed as follows:
y i = β 0 μ i , v i + k = 1 p β k μ i , v i x i k + ε i
where yi represents the CA rate of the ith spatial unit, β0(μi, vi) denotes the intercept term where (μi, vi) are the geographic coordinates of the centroid for the ith spatial unit, βk(μi, vi) indicates the regression coefficient for the kth explanatory variable at the ith spatial unit, xik stands for the explanatory variables, p signifies the total number of explanatory variables, and εi represents the random error term.
We used the Gaussian function to determine spatial weights and identified the optimal bandwidth through the Akaike Information Criterion corrected (AICc), where smaller AICc values indicate a better model fit. The Gaussian function can be expressed by the following formula:
W i j = exp d i j / b 2
where Wij represents the spatial weight, dij denotes the distance between spatial unit i and spatial unit j, and b stands for the bandwidth parameter.

2.3.5. Explanatory Variable Descriptions and Statistical Analyses

CA results from the combined effects of multiple contributing factors. Based on the study area’s actual conditions, previous research, and data availability, we categorized the driving factors into 12 explanatory variables across three groups: biophysical conditions, socioeconomic conditions, and location conditions. The biophysical conditions include elevation, slope, cropland quality, the aggregation index, and the division index. Elevation, slope, and cropland quality reflect fundamental conditions for crop growth, directly influencing farmers’ willingness to utilize croplands. The aggregation and division indices represent key landscape pattern characteristics. Generally, contiguous croplands facilitate mechanized farming, ease management, and reduce costs, whereas fragmented plots are more prone to abandonment [61,67]. For socioeconomic conditions, we selected three variables: land development intensity, population density, and per capita GDP. High development intensity often accompanies built-up area expansion, which not only leads to cropland occupation or marginalization but may also cause cropland fragmentation and quality degradation due to mosaic-style urban sprawl, thereby triggering abandonment [49,84]. Population density and per capita GDP reflect regional economic development levels. In densely populated and economically advanced areas, the “siphon effect” may shift labor from agricultural to non-agricultural sectors, increasing abandonment risks due to agricultural labor shortages [65,85]. Additionally, we included four locational variables: distance to the nearest settlement, road, water source, and subdistrict administrative center [32,33,86]. These metrics capture farming convenience and market accessibility for agricultural products. Descriptive statistics for all variables are presented in Table 2.

3. Results

3.1. Spatial–Temporal Patterns of Cropland Abandonment

Based on the extracted CA data (Figure 3), our analysis reveals that the abandoned cropland area in the study region measured 1113.30 ha in 2021, 1120.01 ha in 2022, and 1086.30 ha in 2023, corresponding to abandonment rates of 8.12%, 8.27%, and 8.09%, respectively. These figures demonstrate a slight initial increase followed by a marginal decrease overall (Figure 4).
An analysis of the spatiotemporal patterns of abandonment rates (Figure 5) reveals relatively stable CA levels across the study area during 2021–2023, consistently exhibiting a spatial distribution characterized by higher rates in central regions compared to northern and southern areas. Notably, as visible in Figure 1, abandonment rates were significantly higher in northern areas adjacent to urban built-up zones than along the Longquan Mountain range, highlighting the substantial pressure of urban expansion on cropland marginalization.
Table 3 presents descriptive statistics of abandonment rates at different administrative scales. At the subdistrict level, mean abandonment rates remained stable at approximately 12% across all three years, slightly lower (by <2%) than corresponding averages at the community/village level. However, the standard deviation at the community/village level exceeded twice that of the subdistrict level, indicating substantially greater spatial variability in abandonment rates at finer administrative scales.
The spatial autocorrelation analysis results (Table 4) demonstrate that the global Moran’s I indices for abandonment rates across the three years were 0.6856, 0.6710, and 0.6680 (p < 0.001), all significantly greater than zero. This indicates statistically significant spatial clustering characteristics of CA at the community/village level. Analysis of local spatial autocorrelation (Figure 6) reveals a polarized spatial distribution pattern of abandonment rates. High-value clusters were predominantly concentrated in the central–western portion of the study area, while low-value clusters were mainly located in the southern region, with other cluster types being relatively scarce. Furthermore, the gradual decline in global Moran’s I values over time suggests a slight weakening in the spatial clustering intensity of abandonment rates.
We employed the Kernel Density tool in the ArcGIS 10.7 platform to compute the KDE. The bandwidth for the KDE was determined using Silverman’s rule of thumb, which provides an optimal bandwidth value based on the data distribution. This rule is widely used to balance the trade-off between data smoothing and retaining spatial variability. The KDE results further elucidate the precise locations and distribution trends of CA hotspots (Figure 7). The analysis reveals persistent high-density clustering of abandoned croplands in the central–western study area, forming several distinct banded clusters. Concurrently, severe abandonment was observed in the northeastern sector adjacent to urban built-up areas, with a temporal progression showing an expansion toward urban centers, indicating escalating abandonment scales in these locations. Additionally, in the southern study area, previously dispersed and less intensive abandonment patches are progressively coalescing, intensifying into emerging hotspots. Collectively, the kernel density analysis provides an enhanced spatial resolution of abandonment patterns, with these identified hotspots and trends warranting significant attention for land management interventions.

3.2. Revealing the Determinants of Cropland Abandonment

We further employed GWR to investigate the determinant factors of CA in the study area. The parameter estimates from GWR (Table 5) demonstrate strong model performance, with high R2 (0.832) and adjusted R2 (0.743) values, along with a highly significant F-test (p < 0.001), indicating excellent model fit. Spatial analysis of standardized residuals and local R2 values (Figure 8) reveals that standardized residuals ranged from −3.15 to 2.99, with approximately 97% falling within [−2.5, 2.5], while all local R2 values exceeded 0.75, collectively confirming the model’s overall robustness and suitability for regression analysis of CA patterns.
The GWR analysis generated location-specific regression coefficients for each explanatory variable across spatial units, with descriptive statistics of these coefficients presented in Table 6. The results demonstrate that six variables—cropland quality (CQ), slope (SLO), the aggregation index (AI), land development intensity (LDI), distance to roads (DisR), and population density (PD)—significantly influenced CA, as evidenced by over 50% of spatial units showing statistically significant coefficients. CQ emerged as the dominant factor with the highest regression coefficient (9.3366), exhibiting statistical significance (p < 0.05) in over 62% of spatial units. SLO ranked second (coefficient = 3.7475), showing significance in 64% of units. Other factors demonstrated relatively weaker effects, with coefficients below 0.8, with PD notably displaying the lowest influence (coefficient = 0.0006). Weak-effect factors, including elevation (ELE), distance to settlements (DisS), distance to water sources (DisW), and distance to administrative centers (DisA), all showed coefficients below 0.1 and significance in fewer than 16% of spatial units, indicating their limited direct impact on abandonment. Interestingly, despite substantial coefficients for the division index (DIV) (12.2447) and per capita GDP (PCG) (2.0186), neither variable achieved statistical significance (0% significant spatial units), suggesting substantial spatial variability in their effects and inconsistent driving forces for CA.
Regarding the direction of effects of explanatory variables, they can be classified into two categories based on the proportion of positive and negative regression coefficients:
  • Positive driving factors. The regression coefficients for SLO, LDI, and DisS were exclusively positive (100% of spatial units). Among these, SLO exhibited the strongest positive effect, indicating that each 1° increase in slope elevates abandonment risk by 3.75%, confirming the direct impact of topographic constraints on agricultural activities. This was followed by LDI (regression coefficient = 0.4453, significant in over 86% of spatial units), showing that each 1% increase in land development intensity raises abandonment risk by 0.45%. DisS demonstrated the weakest positive effect, with a coefficient of merely 0.0227 and statistical significance in fewer than 10% of spatial units.
  • Negative driving factors. The regression coefficients for CQ, AI, PD, and DisR were uniformly negative (nearly 100% of spatial units). Among these, CQ emerged as the core restraining factor against abandonment, demonstrating that higher-quality croplands exhibit lower abandonment rates. This was followed by AI (regression coefficient = −0.7850, significant in over 87% of spatial units), indicating that more contiguous cropland parcels offer greater agricultural operational advantages and are consequently less prone to abandonment. PD and DisR also showed significant negative effects, with significant spatial units accounting for 98% and 54%, respectively. This suggests lower abandonment probabilities in densely populated areas and locations farther from roads, though PD’s restraining influence proved exceptionally weak. Notably, DisR’s effect direction contradicted conventional understanding. While conventional wisdom suggests that croplands more distant from roads face higher abandonment risks, our study area revealed the opposite pattern. Detailed examination revealed that typical conclusions primarily derive from accessibility considerations. However, in metropolitan suburbs with highly developed transportation networks—exemplified by our study area, where the average distance to the nearest road measured merely 86 m (SD = 17 m; Table 2)—road proximity poses minimal accessibility constraints. Consequently, accessibility factors can be essentially discounted. We attribute this phenomenon primarily to policy-related factors: road-adjacent croplands may face higher abandonment risks due to their greater potential development value, making them more susceptible to land expropriation or planning adjustments.

4. Discussion

4.1. Comparisons with Previous Studies

4.1.1. Identification Methods and Spatiotemporal Patterns of Cropland Abandonment

This study utilized China’s Third National Land Survey and annual land use change datasets (2019–2023) to identify abandoned croplands by tracking land use conversion trajectories, specifically defining those croplands left uncultivated for two consecutive years and converted to grassland, forest, or bare land as abandoned. This methodology aligns with both China’s legal definition of abandonment (where non-use for two years permits land reclamation) and recent academic criteria [61,62,87], ensuring contextual appropriateness for Chinese conditions.
Compared to internationally prevalent remote sensing approaches (e.g., spectral variation detection using Landsat/MODIS imagery), our administrative datasets offer superior spatial precision and authoritative accuracy. Specifically, our parcel-level administrative data enables precise delineation of cropland boundaries, which is particularly advantageous for complex peri-urban areas characterized by fragmented land tenure. This is a significant improvement over remote sensing data, which often faces challenges such as mixed-pixel effects and misclassification rates in fragmented agricultural landscapes. For example, Prishchepov et al. reported up to 20% misclassification rates in European CA mapping due to these mixed-pixel effects when using Landsat imagery [88]. Similarly, Yin et al. acknowledged reduced mapping accuracy in small-plot, non-intensive farming regions due to the limitations of remote sensing [30]. In contrast, our approach, using detailed parcel-level administrative records, avoids these issues and provides a much higher degree of spatial accuracy, particularly in areas with small and fragmented land plots. However, limitations persist: annual surveys may miss temporary abandonment (e.g., seasonal fallows), whereas remote sensing’s temporal resolution can partially compensate [89,90]. Additionally, while deep learning models (e.g., U-Net, random forest classifiers) demonstrate high precision in abandonment detection [25,37], their requirement for extensive training data precluded application here. Future studies could integrate multi-source data to enhance abandonment identification and monitoring capabilities.
The study area exhibited an average annual CA rate of approximately 8%, which was significantly lower than the 15% rate observed in the southern mountainous regions of Sichuan Province [67] but higher than the national average range of 1.21–5% [61,62]. A separate household survey conducted in 2015 in Wuhan’s urban–rural fringe reported an average household abandonment rate of 9% [91], though meaningful quantitative comparisons across studies remain challenging due to differences in definitions, data sources, methodologies, and study periods, highlighting the inherent complexities in CA assessment. Kernel density analysis revealed distinct spatial patterns characterized by gradient zonation and significant clustering of abandonment hotspots, with higher rates concentrated in urban-adjacent areas and lower rates concentrated in the Longquan Mountain region, forming pronounced high-value clusters in northern peri-urban zones and low-value clusters in southern exurban areas. This spatial configuration markedly contrasts with traditional mountainous abandonment patterns (typically exhibiting global dispersion but local concentration) driven by adverse natural conditions [13,32,34], demonstrating the unique urban-influenced abandonment dynamics characteristic of metropolitan peripheries.

4.1.2. Heterogeneity of Driving Factors for Cropland Abandonment

This study employed the GWR model to reveal the spatial non-stationarity of driving factors behind CA. The results identified CQ, SLO, AI, LDI, and DisR as key explanatory variables. These findings show both consistencies and divergences from previous research, with the differences primarily attributable to the unique context of metropolitan suburbs.
  • Spatial imbalance in cropland quality’s restraining effects. Our results demonstrate that CQ exerts a significant negative effect on CA, aligning with existing studies showing that less productive croplands are more prone to abandonment [42,67,92]. However, this restraining effect exhibits spatial heterogeneity, with stronger impacts concentrated in specific areas. As Table 6 indicates, CQ reached statistical significance in approximately 62% of spatial units. This spatial imbalance likely stems from the unique dynamics of metropolitan suburbs, where high-quality croplands often occupy urban expansion frontiers—particularly in peri-urban zones—facing intense “conservation versus development” conflicts. Typically, the economic returns from land development vastly exceed agricultural outputs, prioritizing development over conservation and resulting in “high-quality yet highly abandoned” croplands. For instance, the study area’s central high-quality croplands adjacent to industrial parks experienced extensive abandonment (Figure 7) despite their high productivity, reflecting the acute tension between economic gains and agricultural sustainability in urban peripheries.
  • The push–pull dynamics of land development intensity. Our analysis reveals uniformly positive regression coefficients for LDI across all spatial units, with statistical significance in 86% of cases (Table 6), demonstrating its spatially pervasive positive driving effect. This contrasts sharply with mountainous region studies where “labor migration dominates abandonment” [39,93]. The divergence highlights fundamentally distinct mechanisms: while mountainous abandonment results from urban pull factors (labor attraction), suburban abandonment stems from urban push factors (active land encroachment). As a national-level new development zone, the study area’s rapid industrial and real estate expansion has accelerated built-up area growth, intensifying cropland fragmentation and marginalization. These fragmented parcels resist mechanized large-scale farming, prompting proactive abandonment by farmers.
  • Spatial heterogeneity in road accessibility’s negative effects. Conventional wisdom holds that CA risk increases with distance from roads [32,44,94]. However, our study reveals an inverse pattern, wherein proximity to roads correlates with higher abandonment rates, though this relationship lacks global consistency, showing significance in only 54% of spatial units (Table 6). After controlling for potential road accessibility variations, we attribute this anomaly to land speculation behaviors in metropolitan suburbs. Road-adjacent parcels in peri-urban areas, given their high development potential, are frequently designated as reserve land by local governments for planning adjustments. Anticipating future expropriation, farmers proactively abandon cultivation to avoid investment losses. As Figure 7 demonstrates, abandonment clusters in the study area’s central zone exhibit linear patterns along transportation corridors, while exurban areas show minimal abandonment rates, confirming that DisR’s negative effects operate only locally. These findings underscore policy feedback mechanisms: land expropriation policies may inadvertently incentivize abandonment in specific locales—a phenomenon previously unquantified in the literature.

4.2. Methodological Considerations

In this study, the global Moran’s I analysis revealed that the spatial distribution of CA rates in the study area exhibited statistically significant clustering patterns rather than random dispersion, confirming the appropriateness of employing GWR for driver analysis. To further validate GWR’s superiority, we established an ordinary least squares (OLS) model and compared key parameters between both approaches (Table 7). While both models demonstrated significant goodness-of-fit at the 99% confidence level, GWR showed a substantially smaller residual sum of squares, indicating superior predictive accuracy. Furthermore, GWR achieved lower AICc values along with significantly improved R2 and adjusted R2 compared to OLS, demonstrating its enhanced capacity to explain the variability in the dependent variable while maintaining an optimal balance between model complexity and goodness-of-fit. Collectively, these results establish GWR as the statistically preferred modeling framework.

4.3. Policy Implications

The findings of this study provide critical policy implications for managing CA in metropolitan suburbs. First, given the significant roles of CQ, SLO, and AI in driving abandonment, policymakers should prioritize special protection measures for high-quality, low-slope, and contiguous croplands. This includes strengthening land use regulations to strictly prohibit the conversion of premium croplands to construction uses while ensuring their long-term agricultural utilization. Concurrently, incentives such as targeted subsidies and modern agricultural infrastructure investments should be introduced to enhance the economic viability of farming these lands.
Second, the pronounced positive effect of LDI underscores the need to mitigate urban encroachment on agricultural land. Urban planning must adopt more balanced approaches to allocate agricultural and construction spaces, avoiding inefficient development patterns like fragmented urbanization that marginalize croplands. Public–private partnerships could develop multifunctional land use models—for instance, establishing agro-ecological corridors in urban-rural transition zones to repurpose abandoned areas for high-value crops (e.g., organic vegetables, flowers), agritourism, or recreational farms. Such “agriculture + ecology + tourism” integration would leverage urban proximity to maximize land value.
Third, the negative effects of PD and DisR call for enhanced urban agricultural support systems, including tailored subsidies and market-oriented industrialization. Initiatives like urban farming cooperatives and Community-Supported Agriculture (CSA) programs [95] could boost land use efficiency. Simultaneously, speculative activities along roads must be curbed through “agricultural priority zones” with strict development restrictions and monitoring. Proactive measures like transparent land expropriation timelines would reduce precautionary abandonment. Temporarily idle lands could host low-input projects (e.g., nurseries, agrivoltaics) to prevent resource waste.
Finally, governments should deploy smart monitoring systems (e.g., remote sensing and big data analytics) for real-time abandonment tracking, complemented by ground inspections to enable rapid response.

4.4. Limitations and Future Research Directions

We acknowledge several limitations in this study that warrant further investigation. First, the temporal scope and data constraints present challenges. Our analysis covered only 2019–2023, and due to the two-year abandonment definition, we generated just three consecutive years of abandonment maps (2021–2023), limiting insights into long-term trends. The third national land survey and annual land change survey datasets used in this study were created using the latest technology and land use classification standards, with a starting year of 2019, making it the most up-to-date and authoritative data currently available. While expanding the time range to include data from the first and second national land surveys could offer additional insights, differences in survey methods and classification standards across these surveys would introduce systematic biases and make comparisons across time periods difficult.
It is also important to note that in this study, the detected cropland-to-forest conversions within the four-year observation window (2019–2023) primarily reflect policy-driven artificial afforestation or administrative land classification adjustments, particularly in peri-urban areas where ecological restoration and greening projects are actively implemented. In China, such government-led afforestation can occur rapidly, sometimes within a single year. However, spontaneous natural succession from cropland to forest is generally a longer-term process that may not be fully captured within this relatively short timeframe, especially when using land survey data alone. This distinction should be carefully considered when interpreting the results.
Understanding long-term trends in CA remains crucial, but effective management and timely intervention rely heavily on current abandonment conditions. The short-term focus of our study provides relevant and actionable insights that are essential for addressing ongoing land management challenges. Future research could extend the time series, incorporate high-resolution remote sensing and UAV monitoring, and conduct field verification to improve the accuracy of abandonment detection and better distinguish between spontaneous ecological processes and policy-driven land use changes. Such efforts would also help mitigate the limitations associated with infrequent land survey updates and further enhance the robustness of long-term trend analyses.
Second, while we focused on biophysical, socioeconomic, and locational factors, institutional drivers (e.g., land transfer policies, agricultural subsidies, and farming services) and household characteristics (e.g., age, employment diversification, and income levels) remain underexplored. Combining household surveys with policy analysis could provide a more comprehensive understanding of abandonment mechanisms in suburban areas.
Third, the GWR model cannot capture interactions between explanatory variables, and data limitations prevented tracking dynamic changes in drivers. Machine learning approaches (e.g., random forests, deep learning) could help unravel complex factor relationships, while incorporating temporal dimensions would improve model explanatory power.
Finally, future research should prioritize reuse strategies for abandoned croplands, identifying optimal pathways (agricultural revival, ecosystem services, or development) based on regional contexts and dominant drivers. Such work would contribute to food security, mitigate land use trade-offs, and promote sustainable regional development.

5. Conclusions

Understanding the scale, patterns, and driving factors of CA in metropolitan suburbs is critically important, as these areas face substantially greater risks of sustained cropland loss from urban expansion and industrial restructuring compared to mountainous regions and traditional farming areas—particularly in China where rapid urbanization coincides with acute cropland scarcity. However, few studies have specifically examined abandonment phenomena in these peri-urban contexts. This study systematically analyzed CA in China’s national-level new development zone CDMA using 2019–2023 land survey and annual change detection data. Through land use transition trajectory analysis, we generated precise abandonment maps and employed ESDA and KDE to reveal distinct spatiotemporal patterns. Furthermore, GWR modeling elucidated the determinant factors and their spatial heterogeneity.
The results demonstrate that the study area maintains a CA rate of approximately 8%, with pronounced spatial clustering characteristics. High-value clusters predominantly concentrate in peri-urban zones, while exurban areas exhibit lower abandonment intensity. KDE further reveals dynamic hotspot evolution trends: abandonment scales are expanding in the northeastern study area, while formerly dispersed abandonment patches in southern exurban regions are progressively coalescing and intensifying.
GWR identified CQ (cropland quality), SLO (slope), AI (aggregation index), LDI (land development intensity), and DisR (distance to roads) as key determinants of suburban abandonment. Notably, CQ and AI exert significant restraining effects on abandonment, whereas increasing SLO and LDI elevate abandonment risks. Contrary to conventional understanding, DisR shows an inverse relationship—road-proximate croplands demonstrate higher abandonment likelihood, potentially attributable to land speculation and planning anticipation behaviors.
To curb unintended CA in metropolitan suburbs, we recommend implementing more detailed measures in target areas, including adopting differentiated cropland protection strategies, innovating land use models, improving the publicity system for land expropriation plans, and strengthening dynamic monitoring and supervision.

Author Contributions

Conceptualization, M.Z., G.L. and C.J.; methodology, M.Z., R.Z. and X.W. (Xiaowen Wang); formal analysis, M.Z., C.J., W.M. and L.S.; data curation, K.D. and X.W. (Xiaodan Wu); writing—original draft preparation, M.Z., C.J. and R.Z.; writing—review and editing, M.Z., G.L., C.J., R.Z., X.W. (Xiaowen Wang), W.M. and L.S.; visualization, M.Z., R.Z. and X.W. (Xiaowen Wang); supervision, G.L.; project administration, G.L.; funding acquisition, G.L., C.J., R.Z., X.W. (Xiaowen Wang) and K.D. All authors have read and agreed to the published version of the manuscript.

Funding

This research was jointly funded by the National Natural Science Foundation of China (U22A20565, 42171355, 42371460, and 42401535); the National Key Research and Development Program of China (2023YFB2604001); the Sichuan Science and Technology Program (2023ZDZX0030) and the Tibet Autonomous Region Key Research and Development Program (XZ202401ZY0057).

Data Availability Statement

The original contributions presented in the study are included in the article, further inquiries can be directed to the corresponding author.

Conflicts of Interest

The authors declare no conflicts of interest.

References

  1. McKenzie, F.C.; Williams, J. Sustainable Food Production: Constraints, Challenges and Choices by 2050. Food Secur. 2015, 7, 221–233. [Google Scholar] [CrossRef]
  2. Godfray, H.C.J.; Beddington, J.R.; Crute, I.R.; Haddad, L.; Lawrence, D.; Muir, J.F.; Pretty, J.; Robinson, S.; Thomas, S.M.; Toulmin, C. Food Security: The Challenge of Feeding 9 Billion People. Science 2010, 327, 812–818. [Google Scholar] [CrossRef] [PubMed]
  3. Prosekov, A.Y.; Ivanova, S.A. Food Security: The Challenge of the Present. Geoforum 2018, 91, 73–77. [Google Scholar] [CrossRef]
  4. Koren, O.; Bagozzi, B.E. From Global to Local, Food Insecurity Is Associated with Contemporary Armed Conflicts. Food Secur. 2016, 8, 999–1010. [Google Scholar] [CrossRef]
  5. Hendriks, S.L.; Montgomery, H.; Benton, T.; Badiane, O.; de la Mata, G.C.; Fanzo, J.; Guinto, R.R.; Soussana, J.-F. Global Environmental Climate Change, COVID-19, and Conflict Threaten Food Security and Nutrition. BMJ 2022, 378, e071534. [Google Scholar] [CrossRef] [PubMed]
  6. Fróna, D.; Szenderák, J.; Harangi-Rákos, M. The Challenge of Feeding the World. Sustainability 2019, 11, 5816. [Google Scholar] [CrossRef]
  7. Chartres, C.J.; Noble, A. Sustainable Intensification: Overcoming Land and Water Constraints on Food Production. Food Secur. 2015, 7, 235–245. [Google Scholar] [CrossRef]
  8. Goussios, D.; Gaki, D.; Mardakis, P.; Faraslis, I. New Possibilities for Planning the Recovery of Abandoned Agricultural Land in Mediterranean Mountain Communities: The Case of Troodos in Cyprus. Land 2025, 14, 6. [Google Scholar] [CrossRef]
  9. Ronchetti, G.; Aiello, M. Potential of Abandoned Agricultural Lands for New Photovoltaic Installations. Sustainability 2025, 17, 694. [Google Scholar] [CrossRef]
  10. Estel, S.; Kuemmerle, T.; Alcántara, C.; Levers, C.; Prishchepov, A.; Hostert, P. Mapping Farmland Abandonment and Recultivation across Europe Using MODIS NDVI Time Series. Remote Sens. Environ. 2015, 163, 312–325. [Google Scholar] [CrossRef]
  11. Næss, J.S.; Cavalett, O.; Cherubini, F. The Land–Energy–Water Nexus of Global Bioenergy Potentials from Abandoned Cropland. Nat. Sustain. 2021, 4, 525–536. [Google Scholar] [CrossRef]
  12. Zheng, Q.; Ha, T.; Prishchepov, A.V.; Zeng, Y.; Yin, H.; Koh, L.P. The Neglected Role of Abandoned Cropland in Supporting Both Food Security and Climate Change Mitigation. Nat. Commun. 2023, 14, 6083. [Google Scholar] [CrossRef]
  13. Wang, J.; Wang, J.; Xiong, J.; Sun, M.; Ma, Y. Spatial-Temporal Characterization of Cropland Abandonment and Its Driving Mechanisms in the Karst Plateau in Eastern Yunnan, China, 2001–2020. PLoS ONE 2024, 19, e0307148. [Google Scholar] [CrossRef] [PubMed]
  14. Cammeraat, E.; Anders, N.; Scholten, R.; Boix-Fayos, C. Erosion and Sedimentation on an Abandoned Terraced and Gullied Hillslope. Catena 2024, 246, 108393. [Google Scholar] [CrossRef]
  15. Fischer, J.; Hartel, T.; Kuemmerle, T. Conservation Policy in Traditional Farming Landscapes. Conserv. Lett. 2012, 5, 167–175. [Google Scholar] [CrossRef]
  16. Dara, A.; Baumann, M.; Hölzel, N.; Hostert, P.; Kamp, J.; Müller, D.; Ullrich, B.; Kuemmerle, T. Post-Soviet Land-Use Change Affected Fire Regimes on the Eurasian Steppes. Ecosystems 2020, 23, 943–956. [Google Scholar] [CrossRef]
  17. Daskalova, G.N.; Kamp, J. Abandoning Land Transforms Biodiversity. Science 2023, 380, 581–583. [Google Scholar] [CrossRef] [PubMed]
  18. Crawford, C.L.; Yin, H.; Radeloff, V.C.; Wilcove, D.S. Rural Land Abandonment Is Too Ephemeral to Provide Major Benefits for Biodiversity and Climate. Sci. Adv. 2022, 8, eabm8999. [Google Scholar] [CrossRef] [PubMed]
  19. Gvein, M.H.; Hu, X.; Næss, J.S.; Watanabe, M.D.B.; Cavalett, O.; Malbranque, M.; Kindermann, G.; Cherubini, F. Potential of Land-Based Climate Change Mitigation Strategies on Abandoned Cropland. Commun. Earth Environ. 2023, 4, 39. [Google Scholar] [CrossRef]
  20. Osawa, T.; Kohyama, K.; Mitsuhashi, H. Multiple Factors Drive Regional Agricultural Abandonment. Sci. Total Environ. 2016, 542, 478–483. [Google Scholar] [CrossRef]
  21. Gafurov, A.; Ivanov, M. Deep Learning and Remote Sensing for Restoring Abandoned Agricultural Lands in the Middle Volga (Russia). Land 2024, 13, 2054. [Google Scholar] [CrossRef]
  22. Xie, H.; Ouyang, Z.; Liu, W.; He, Y. Impact of Farmer Differentiation on Farmland Abandonment: Evidence from Fujian’s Hilly Mountains, China. J. Rural Stud. 2025, 113, 103494. [Google Scholar] [CrossRef]
  23. Zhang, T.; Yang, J.; Zhou, H.; Dai, A.; Tan, D. Abandoned Cropland Mapping and Its Influencing Factors Analysis: A Case Study in the Beijing-Tianjin-Hebei Region. Catena 2024, 239, 107876. [Google Scholar] [CrossRef]
  24. Ren, W.; Yang, A.; Wang, Y. Spatial Patterns, Drivers, and Sustainable Utilization of Terrace Abandonment in Mountainous Areas of Southwest China. Land 2024, 13, 283. [Google Scholar] [CrossRef]
  25. Wang, J.; Guan, Y.; Wang, H.; Zhou, W. Identifying and Monitoring of Abandoned Farmland in Key Agricultural Production Areas on the Qinghai–Tibet Plateau: A Case Study of the Huangshui Basin. J. Environ. Manag. 2024, 354, 120380. [Google Scholar] [CrossRef]
  26. Wang, Y.; Yang, A.; Shen, W.; Yang, J.; Wang, Y.; Li, X. Spatial Patterns, Determinants, Future Trends, and Implications for the Sustainable Use of Terraces Abandonment in China. J. Clean. Prod. 2024, 467, 142860. [Google Scholar] [CrossRef]
  27. Song, H.; Li, X.; Xin, L.; Wang, X. Do Farmland Transfers Mitigate Farmland Abandonment?—A Case Study of China’s Mountainous Areas. Habitat Int. 2024, 146, 103023. [Google Scholar] [CrossRef]
  28. Zhou, R.; Ji, M.; Zhao, S. Does E-Commerce Participation among Farming Households Affect Farmland Abandonment? Evidence from a Large-Scale Survey in China. Land 2024, 13, 376. [Google Scholar] [CrossRef]
  29. Dara, A.; Baumann, M.; Kuemmerle, T.; Pflugmacher, D.; Rabe, A.; Griffiths, P.; Hölzel, N.; Kamp, J.; Freitag, M.; Hostert, P. Mapping the Timing of Cropland Abandonment and Recultivation in Northern Kazakhstan Using Annual Landsat Time Series. Remote Sens. Environ. 2018, 213, 49–60. [Google Scholar] [CrossRef]
  30. Yin, H.; Brandão, A.; Buchner, J.; Helmers, D.; Iuliano, B.G.; Kimambo, N.E.; Lewińska, K.E.; Razenkova, E.; Rizayeva, A.; Rogova, N.; et al. Monitoring Cropland Abandonment with Landsat Time Series. Remote Sens. Environ. 2020, 246, 111873. [Google Scholar] [CrossRef]
  31. Xie, Y.; Spawn-Lee, S.A.; Radeloff, V.C.; Yin, H.; Robertson, G.P.; Lark, T.J. Cropland Abandonment between 1986 and 2018 across the United States: Spatiotemporal Patterns and Current Land Uses. Environ. Res. Lett. 2024, 19, 044009. [Google Scholar] [CrossRef]
  32. Wei, Y.; Wen, J.; Zhou, Q.; Zhang, Y.; Dong, G. Mapping Cropland Abandonment in the Cloudy Hilly Regions Surrounding the Southwest Basin of China. Land 2024, 13, 586. [Google Scholar] [CrossRef]
  33. Han, Z.; Song, W. Spatiotemporal Variations in Cropland Abandonment in the Guizhou–Guangxi Karst Mountain Area, China. J. Clean. Prod. 2019, 238, 117888. [Google Scholar] [CrossRef]
  34. He, S.; Shao, H.; Xian, W.; Zhang, S.; Zhong, J.; Qi, J. Extraction of Abandoned Land in Hilly Areas Based on the Spatio-Temporal Fusion of Multi-Source Remote Sensing Images. Remote Sens. 2021, 13, 3956. [Google Scholar] [CrossRef]
  35. Leite, D.; Teixeira, I.; Morais, R.; Sousa, J.J.; Cunha, A. Comparative Analysis of CNNs and Vision Transformers for Automatic Classification of Abandonment in Douro’s Vineyard Parcels. Remote Sens. 2024, 16, 4581. [Google Scholar] [CrossRef]
  36. Zimmer-Dauphinee, J.; Wernke, S.A. Semantic Segmentation and Classification of Active and Abandoned Agricultural Fields through Deep Learning in the Southern Peruvian Andes. Remote Sens. 2024, 16, 3546. [Google Scholar] [CrossRef]
  37. Li, H.; Lin, H.; Luo, J.; Wang, T.; Chen, H.; Xu, Q.; Zhang, X. Fine-Grained Abandoned Cropland Mapping in Southern China Using Pixel Attention Contrastive Learning. IEEE J. Sel. Top. Appl. Earth Obs. Remote Sens. 2024, 17, 2283–2295. [Google Scholar] [CrossRef]
  38. Zheng, L. Big Hands Holding Small Hands: The Role of New Agricultural Operating Entities in Farmland Abandonment. Food Policy 2024, 123, 102605. [Google Scholar] [CrossRef]
  39. Eklund, L.; Mohr, B.; Dinc, P. Cropland Abandonment in the Context of Drought, Economic Restructuring, and Migration in Northeast Syria. Environ. Res. Lett. 2024, 19, 014077. [Google Scholar] [CrossRef]
  40. Subedi, Y.R.; Kristiansen, P.; Cacho, O. Drivers and Consequences of Agricultural Land Abandonment and Its Reutilisation Pathways: A Systematic Review. Environ. Dev. 2022, 42, 100681. [Google Scholar] [CrossRef]
  41. Yi, X.; Zhang, Y.; He, J.; Wang, Y.; Dai, Q.; Hu, Z.; Zhou, H.; Lu, Y. Characteristics and Influencing Factors of Farmland Abandonment in the Karst Rocky Desertification Area of Southwest China. Ecol. Indic. 2024, 160, 111802. [Google Scholar] [CrossRef]
  42. Ye, J.; Hu, Y.; Feng, Z.; Zhen, L.; Shi, Y.; Tian, Q.; Zhang, Y. Monitoring of Cropland Abandonment and Land Reclamation in the Farming–Pastoral Zone of Northern China. Remote Sens. 2024, 16, 1089. [Google Scholar] [CrossRef]
  43. Sang, Y.; Xin, L. Factors Determining Concurrent Reclamation and Abandonment of Cultivated Land on the Qinghai-Tibet Plateau. Land 2023, 12, 1081. [Google Scholar] [CrossRef]
  44. Zhang, Q.; Hu, J.; Graybill, S.A.; Moody, A.; Bista, R.; Bilsborrow, R.E.; Song, C. Crop-Raiding by Wildlife and Cropland Abandonment as Feedback from Nature-Based Solutions: Lessons from Case Studies in China and Nepal. Environ. Res. Lett. 2024, 19, 124029. [Google Scholar] [CrossRef]
  45. Dahal, N.K.; Harada, K.; Adhikari, S.; Sapkota, R.P.; Kandel, S. Impact of Wildlife on Food Crops and Approaches to Reducing Human Wildlife Conflict in the Protected Landscapes of Eastern Nepal. Hum. Dimens. Wildl. 2022, 27, 273–289. [Google Scholar] [CrossRef]
  46. Sun, J.; Li, J.; Cui, Y. Does Non-Farm Employment Promote Farmland Abandonment of Resettled Households? Evidence from Shaanxi, China. Land 2024, 13, 129. [Google Scholar] [CrossRef]
  47. Luo, Y.; Ding, S.; Xiang, F.; Wang, L. Reducing Farmland Abandonment by Raising Women’s Education Levels: Evidence from China. J. Asian Econ. 2024, 95, 101825. [Google Scholar] [CrossRef]
  48. Li, Y.; Li, R.; Guo, S.; Xu, D. Why Do Aging Households in Agriculture Prefer Land Abandonment to Transfer? Evidence from Hill Plots in Sichuan, China. Land Degrad. Dev. 2024, 35, 4985–4996. [Google Scholar] [CrossRef]
  49. Zheng, N.; Li, L.; Han, L.; Zhu, X.; Zhao, K.; Zhu, Z.; Ye, X. The Relationship between Farmland Abandonment and Urbanization Processes: A Case Study in Four Chinese Urban Agglomerations. Land 2024, 13, 664. [Google Scholar] [CrossRef]
  50. Zhang, Y.; Li, X.; Shi, T.; Li, H.; Zhai, L. Understanding Cropland Abandonment from Economics within a Representative Village and Its Empirical Analysis in Chinese Mountainous Areas. Land Use Policy 2023, 133, 106876. [Google Scholar] [CrossRef]
  51. Wu, J.; Jin, S.; Zhu, G.; Guo, J. Monitoring of Cropland Abandonment Based on Long Time Series Remote Sensing Data: A Case Study of Fujian Province, China. Agronomy 2023, 13, 1585. [Google Scholar] [CrossRef]
  52. McGunnigle, N.; Bardsley, D.; Nuberg, I.; Pandit, B.H. Is Rewilding Too Wild? Assessing the Benefits and Challenges of Forest Succession on Abandoned Land in the Mid-Hills of Nepal. People Nat. 2025, 7, 415–433. [Google Scholar] [CrossRef]
  53. Yan, J.; Yang, Z.; Li, Z.; Li, X.; Xing, L.; Sun, L. Drivers of Cropland Abandonment in Mountainous Areas: A Household Decision Model on Farming Scale in Southwest China. Land Use Policy 2016, 57, 459–469. [Google Scholar] [CrossRef]
  54. Qiu, T.; Zhang, D.; Zhu, M. Do Land Transfers Reduce the Effects of Labour Costs on Agricultural Land Abandonment? Appl. Econ. 2024, 56, 9219–9222. [Google Scholar] [CrossRef]
  55. Long, M.; Zhao, Y.; Zhou, C.; Li, X.; Su, L.; Zou, Y. Analysis of Factors Influencing Terrace Abandonment Based on Unmanned Aerial Photography and Farmer Surveys: A Case Study in Jianhe, Guizhou. Land Degrad. Dev. 2024, 35, 757–771. [Google Scholar] [CrossRef]
  56. Wang, X.; Zhao, D. Study on the Causes of Differences in Cropland Abandonment Levels among Farming Households Based on Hierarchical Linear Model—13,120 Farming Households in 26 Provinces of China as an Example. Land 2023, 12, 1791. [Google Scholar] [CrossRef]
  57. Calafat-Marzal, C.; Sánchez-García, M.; Gallego-Salguero, A.; Piñeiro, V. Drivers of Winegrowers’ Decision on Land Use Abandonment Based on Exploratory Spatial Data Analysis and Multilevel Models. Land Use Policy 2023, 132, 106807. [Google Scholar] [CrossRef]
  58. Zhou, Y.; Zhong, Z.; Cheng, G. Cultivated Land Loss and Construction Land Expansion in China: Evidence from National Land Surveys in 1996, 2009 and 2019. Land Use Policy 2023, 125, 106496. [Google Scholar] [CrossRef]
  59. Wang, Y.; Yang, A.; Yang, Q. The Extent, Drivers and Production Loss of Farmland Abandonment in China: Evidence from a Spatiotemporal Analysis of Farm Households Survey. J. Clean. Prod. 2023, 414, 137772. [Google Scholar] [CrossRef]
  60. Song, H.; Li, X.; Zhang, F.; Gu, P.; Chen, Y.; Wu, H.; Xin, L.; Lu, Y.; Liu, Y.; Wang, X. Understanding the Spatial Distribution Patterns and Dominant Determinants of Farmland Abandonment in China. Habitat Int. 2025, 156, 103298. [Google Scholar] [CrossRef]
  61. Guo, A.; Yue, W.; Yang, J.; Xue, B.; Xiao, W.; Li, M.; He, T.; Zhang, M.; Jin, X.; Zhou, Q. Cropland Abandonment in China: Patterns, Drivers, and Implications for Food Security. J. Clean. Prod. 2023, 418, 138154. [Google Scholar] [CrossRef]
  62. Zhu, X.; Xiao, G.; Zhang, D.; Guo, L. Mapping Abandoned Farmland in China Using Time Series MODIS NDVI. Sci. Total Environ. 2021, 755, 142651. [Google Scholar] [CrossRef]
  63. Chen, M.; Han, Q.; Zhang, C.; Chen, J. Valuing the Effect of Capital Goes to Countryside on Cropland Abandonment: Evidence from Rural China. Habitat Int. 2025, 156, 103299. [Google Scholar] [CrossRef]
  64. Wu, X.; Zhao, N.; Wang, Y.; Ye, Y.; Wang, W.; Yue, T.; Zhang, L.; Liu, Y. The Potential Role of Abandoned Cropland for Food Security in China. Resour. Conserv. Recycl. 2025, 212, 108004. [Google Scholar] [CrossRef]
  65. He, Y.; Xie, H.; Peng, C. Analyzing the Behavioural Mechanism of Farmland Abandonment in the Hilly Mountainous Areas in China from the Perspective of Farming Household Diversity. Land Use Policy 2020, 99, 104826. [Google Scholar] [CrossRef]
  66. Yang, D.; Song, W. Tracking Land Use Trajectory to Map Abandoned Farmland in Mountainous Area. Ecol. Inform. 2023, 75, 102103. [Google Scholar] [CrossRef]
  67. Hong, C.; Prishchepov, A.V.; Bavorova, M. Cropland Abandonment in Mountainous China: Patterns and Determinants at Multiple Scales and Policy Implications. Land Use Policy 2024, 145, 107292. [Google Scholar] [CrossRef]
  68. Jiang, G.; Ma, W.; Li, Y.; Zhou, D.; Zhou, T. Mapping Abandoned Cultivated Land in China: Implications for Grain Yield Improvement. Appl. Sci. 2025, 15, 165. [Google Scholar] [CrossRef]
  69. Li, G.; Jiang, C.; Gao, Y.; Du, J. Spatial Heterogeneity Characteristics and Driving Mechanisms of Abandoned Farmland in Different Scales and Regions in China. Land Degrad. Dev. 2024, 36, 1452–1466. [Google Scholar] [CrossRef]
  70. Wang, J.; Pei, F.; Kang, T.; Cheng, P.; Yang, K. Assessing the Bioenergy Potential of Abandoned Cropland in China: Toward an Optimal Distribution of Bioenergy Crops. Energy Sustain. Dev. 2024, 83, 101590. [Google Scholar] [CrossRef]
  71. Bren d’Amour, C.; Reitsma, F.; Baiocchi, G.; Barthel, S.; Güneralp, B.; Erb, K.-H.; Haberl, H.; Creutzig, F.; Seto, K.C. Future Urban Land Expansion and Implications for Global Croplands. Proc. Natl. Acad. Sci. USA 2017, 114, 8939–8944. [Google Scholar] [CrossRef] [PubMed]
  72. Güneralp, B.; Reba, M.; Hales, B.U.; Wentz, E.A.; Seto, K.C. Trends in Urban Land Expansion, Density, and Land Transitions from 1970 to 2010: A Global Synthesis. Environ. Res. Lett. 2020, 15, 044015. [Google Scholar] [CrossRef]
  73. Wang, Y. Effects of Urbanization on Spatial-Temporal Changes of Cultivated Land in Bohai Rim Region. Environ. Dev. Sustain. 2023, 25, 8469–8486. [Google Scholar] [CrossRef]
  74. Wiśniewska-Paluszak, J.; Paluszak, G.; Fiore, M.; Coticchio, A.; Galati, A.; Lira, J. Urban Agriculture Business Models and Value Propositions: Mixed Methods Approach Based on Evidence from Polish and Italian Case Studies. Land Use Policy 2023, 127, 106562. [Google Scholar] [CrossRef]
  75. Sroka, W.; Poelling, B.; Mergenthaler, M. City Adjustments as the Main Factor of Success of Urban and Peri-Urban Farms-Empirical Evidence from the Ruhr Metropolis. NJAS-Wagening. J. Life Sci. 2019, 89, 100299. [Google Scholar] [CrossRef]
  76. Mazzocchi, C.; Orsi, L.; Ferrazzi, G.; Corsi, S. The Dimensions of Agricultural Diversification: A Spatial Analysis of Italian Municipalities. Rural Sociol. 2020, 85, 316–345. [Google Scholar] [CrossRef]
  77. Liu, L.; Liu, Z.; Gong, J.; Wang, L.; Hu, Y. Quantifying the Amount, Heterogeneity, and Pattern of Farmland: Implications for China’s Requisition-Compensation Balance of Farmland Policy. Land Use Policy 2019, 81, 256–266. [Google Scholar] [CrossRef]
  78. Haddaway, N.R.; Styles, D.; Pullin, A.S. Evidence on the Environmental Impacts of Farm Land Abandonment in High Altitude/Mountain Regions: A Systematic Map. Environ. Evid. 2014, 3, 17. [Google Scholar] [CrossRef]
  79. Ojha, R.B.; Atreya, K.; Kristiansen, P.; Devkota, D.; Wilson, B. A Systematic Review and Gap Analysis of Drivers, Impacts, and Restoration Options for Abandoned Croplands in Nepal. Land Use Policy 2022, 120, 106237. [Google Scholar] [CrossRef]
  80. Anselin, L.; Syabri, I.; Kho, Y. Geoda: An Introduction to Spatial Data Analysis. Geogr. Anal. 2006, 38, 5–22. [Google Scholar] [CrossRef]
  81. Anselin, L. Local Indicators of Spatial Association—LISA. Geogr. Anal. 1995, 27, 93–115. [Google Scholar] [CrossRef]
  82. Zhang, J.; Zhang, K.; Zhao, F. Research on the Regional Spatial Effects of Green Development and Environmental Governance in China Based on a Spatial Autocorrelation Model. Struct. Chang. Econ. Dyn. 2020, 55, 1–11. [Google Scholar] [CrossRef]
  83. Brunsdon, C.; Fotheringham, A.S.; Charlton, M.E. Geographically Weighted Regression: A Method for Exploring Spatial Nonstationarity. Geogr. Anal. 1996, 28, 281–298. [Google Scholar] [CrossRef]
  84. Grădinaru, S.R.; Iojă, C.I.; Onose, D.A.; Gavrilidis, A.A.; Pătru-Stupariu, I.; Kienast, F.; Hersperger, A.M. Land Abandonment as a Precursor of Built-up Development at the Sprawling Periphery of Former Socialist Cities. Ecol. Indic. 2015, 57, 305–313. [Google Scholar] [CrossRef]
  85. Song, W.; Yang, D.; Wang, Y. Integrating an Abandoned Farmland Simulation Model (AFSM) Using System Dynamics and CLUE-S for Sustainable Agriculture. Agric. Syst. 2024, 219, 104063. [Google Scholar] [CrossRef]
  86. Li, X.; Ma, L.; Liu, X. Identification, Mechanism and Countermeasures of Cropland Abandonment in Northeast Guangdong Province. Land 2025, 14, 246. [Google Scholar] [CrossRef]
  87. Hou, D.; Meng, F.; Prishchepov, A.V. How Is Urbanization Shaping Agricultural Land-Use? Unraveling the Nexus between Farmland Abandonment and Urbanization in China. Landsc. Urban Plan. 2021, 214, 104170. [Google Scholar] [CrossRef]
  88. Prishchepov, A.V.; Müller, D.; Dubinin, M.; Baumann, M.; Radeloff, V.C. Determinants of Agricultural Land Abandonment in Post-Soviet European Russia. Land Use Policy 2013, 30, 873–884. [Google Scholar] [CrossRef]
  89. Liu, G.; Li, Y.; Chen, Y.; Lu, Y.; Jiang, D.; Xu, A.; Zhong, Y.; Yin, H. Mapping Abandoned Cropland in Tropical/Subtropical Monsoon Areas with Multiple Crop Maturity Patterns. Int. J. Appl. Earth Obs. Geoinf. 2024, 127, 103674. [Google Scholar] [CrossRef]
  90. Li, L.; Pan, Y.; Zheng, R.; Liu, X. Understanding the Spatiotemporal Patterns of Seasonal, Annual, and Consecutive Farmland Abandonment in China with Time-Series MODIS Images during the Period 2005–2019. Land Degrad. Dev. 2022, 33, 1608–1625. [Google Scholar] [CrossRef]
  91. Zhou, T.; Koomen, E.; Ke, X. Determinants of Farmland Abandonment on the Urban–Rural Fringe. Environ. Manag. 2020, 65, 369–384. [Google Scholar] [CrossRef] [PubMed]
  92. Subedi, Y.R.; Kristiansen, P.; Cacho, O.; Ojha, R.B. Agricultural Land Abandonment in the Hill Agro-Ecological Region of Nepal: Analysis of Extent, Drivers and Impact of Change. Environ. Manag. 2021, 67, 1100–1118. [Google Scholar] [CrossRef] [PubMed]
  93. Xu, D.; Deng, X.; Guo, S.; Liu, S. Labor Migration and Farmland Abandonment in Rural China: Empirical Results and Policy Implications. J. Environ. Manag. 2019, 232, 738–750. [Google Scholar] [CrossRef] [PubMed]
  94. Nguyen, H.; Hölzel, N.; Völker, A.; Kamp, J. Patterns and Determinants of Post-Soviet Cropland Abandonment in the Western Siberian Grain Belt. Remote Sens. 2018, 10, 1973. [Google Scholar] [CrossRef]
  95. Spanier, J. What Does It Mean to Nurture ‘Good Intentions between City and Country’? Performances of Rural–Urban Relations in Community-Supported Agriculture. Geoforum 2025, 159, 104211. [Google Scholar] [CrossRef]
Figure 1. Location of study area. (a) Position of Chengdu in China; (b) location of the study area within Chengdu; (c) enlarged map of the study area and its digital elevation model (DEM).
Land 14 01311 g001
Figure 2. Example of abandoned cropland identification through land use change trajectory analysis.
Land 14 01311 g002
Figure 3. Spatial extent of abandoned croplands. (AC) Surface characteristics of typical abandoned plots in the study area.
Land 14 01311 g003
Figure 4. Annual cropland area, cropland abandonment area, and abandonment rate.
Land 14 01311 g004
Figure 5. Spatial distribution of abandonment rates at different scales.
Land 14 01311 g005
Figure 6. Local spatial autocorrelation of abandonment rates.
Land 14 01311 g006
Figure 7. Kernel density estimation of abandoned croplands.
Land 14 01311 g007
Figure 8. Spatial distribution of GWR standardized residuals and local R square values.
Land 14 01311 g008
Table 1. Data description and source.
DataDateFormatTitle 3
Land use2019–2023Vector: polygonChengdu Municipal Bureau of Planning and Natural Resources, The Third National Land Survey and Annual Land Change Survey Dataset
Cropland quality2021Vector: polygon
Road networks2021Vector: polygon
DEM2009Raster: 30 mGeospatial Data Cloud, ASTER GDEM (http://www.gscloud.cn/, accessed on 20 March 2025)
GDP2020Raster: 1 kmResource and Environmental Science Data Platform, China GDP Spatial Distribution Kilometer Grid Dataset (https://www.resdc.cn/Default.aspx, accessed on 20 March 2025)
Demographic data2020Raster: 100 mNational Earth System Science Data Center, 100 M Gridded Population Dataset of China’s Seventh Census (http://geodata.nnu.edu.cn/, accessed on 20 March 2025)
Subdistrict administrative centers2019Vector: pointNational Catalogue Service for Geographic Information, 1:1 Million Public Version Fundamental Geographic Information Data (https://www.webmap.cn/main.do?method=index, accessed on 20 March 2025)
Table 2. Descriptive statistics of the variables.
CategoriesVariablesAbbreviationDescription 1MeanStandard Deviation
Biophysical
conditions
Elevation (m)ELEMean elevation of croplands per administrative unit.483.7044.09
Slope (°)SLOMean slope of croplands per administrative unit.7.731.39
Cropland quality (-)CQMean quality of croplands per administrative unit. In the Third National Land Survey, cropland quality was comprehensively determined by topographic conditions, soil conditions, and ecological environment conditions, classified into 15 grades (1–15), where lower values indicate better quality. The mean cropland quality was calculated as the weighted average of cropland area and quality grade.8.070.62
Aggregation index (-)AIAggregation index of croplands per administrative unit, calculated using the Fragstats 4.2 software.60.5111.59
Division index (-)DIVDivision index of croplands per administrative unit, calculated using the Fragstats 4.2 software.0.820.16
Socioeconomic
conditions
Land development intensity (%)LDI(Built-up area/Total area) × 100% per administrative unit.27.6920.71
Population density (person/km2)PD(Total population/Total area) per administrative unit.10,06614,183
Per capita GDP (104 RMB)PCG(Total GDP/Total population) per administrative unit.5.440.83
Location
conditions
Distance to the nearest settlementDisSDisS, DisR, DisW, and DisA were calculated using Euclidean distance, with the mean value computed for all croplands within each administrative unit.144.66171.26
Distance to the nearest roadDisR85.6316.72
Distance to the nearest water sourceDisW112.6763.81
Distance to the nearest subdistrict administrative centerDisA3563.092151.50
1 The administrative units in this study refer to communities and villages. Among these, 21 communities were excluded from subsequent analysis due to having no cropland or cropland areas smaller than 1 hectare. Consequently, the final sample size comprised 95 units. It should be noted that within China’s administrative hierarchy system, communities and villages hold equivalent administrative status.
Table 3. Descriptive statistics of cropland abandonment rates at different scales.
YearSubdistrict LevelCommunity/Village Level
Mean (%)Standard Deviation (%)Mean (%)Standard Deviation (%)
202112.168.0913.7917.76
202212.137.2713.7816.24
202312.207.7214.1216.93
Table 4. Global Moran’s I indices of cropland abandonment rates.
YearMoran’s I 1z-Valuep-Value
20210.685611.36670.0000
20220.671011.09720.0000
20230.668011.05880.0000
1 It is generally recognized that spatial autocorrelation calculations become unreliable when the sample size falls below 30. Therefore, we computed Moran’s I exclusively at the community and village level, where our sample size comprised 95 units, ensuring statistically robust results.
Table 5. Parameter estimation results of GWR.
ParameterStatistic
Best bandwidth size79.000
Residual sum of squares5050.508
Effective number of parameters26.664
ML based sigma7.291
Unbiased sigma8.972
AICc726.305
R square0.832
Adjusted R square0.743
F-value3.57 ***
*** indicates p < 0.001.
Table 6. Descriptive statistics and VIF of regression coefficients for explanatory variables in the GWR model.
VariablesMean of the
Absolute Values 1
Standard
Deviation
Proportion of
Positive Values (%)
Proportion of
Negative Values (%)
Proportion of
Significant Values
VIF
ELE0.07390.058415.7984.2115.792.86
SLO3.74751.3521100.000.0064.211.73
CQ9.33665.95760.00100.0062.111.97
AI0.78500.32600.00100.0087.372.68
DIV12.244712.580457.8942.110.001.72
LDI0.44530.1341100.000.0086.325.41
PD0.00060.00010.00100.0097.902.90
PCG2.01861.14131.0598.950.002.62
DisS0.02270.0129100.000.008.424.73
DisR0.21240.15522.1197.8953.682.28
DisW0.04530.0381100.000.000.003.84
DisA0.00120.001435.7964.2110.531.51
1 Mean of absolute values of regression coefficients for a given explanatory variable across all spatial units.
Table 7. Comparison of key parameters between OLS and GWR.
ModelResidual Sum of SquaresAICcR SquareAdjusted R SquareF-Valuep-Value
OLS10,588.786750.6470.6470.59011.55<0.001
GWR5050.508726.3050.8320.7433.57<0.001
Disclaimer/Publisher’s Note: The statements, opinions and data contained in all publications are solely those of the individual author(s) and contributor(s) and not of MDPI and/or the editor(s). MDPI and/or the editor(s) disclaim responsibility for any injury to people or property resulting from any ideas, methods, instructions or products referred to in the content.

