Article

Quantifying Urban Vitality in Guangzhou Through Multi-Source Data: A Comprehensive Analysis of Land Use Change, Streetscape Elements, POI Distribution, and Smartphone-GPS Data

1
School of Architecture and Allied Art, Guangzhou Academy of Fine Arts, 257 Changgang East Road, Haizhu District, Guangzhou 510006, China
2
Cushman & Wakefield, 5 Floor, Tower 2, Kerry Plaza, No.1 Zhongxinsi Road, Futian District, Shenzhen 518048, China
3
Department of Art and Communication, Nanhang Jincheng College, Nanjing 211156, China
*
Author to whom correspondence should be addressed.
Land 2025, 14(6), 1309; https://doi.org/10.3390/land14061309
Submission received: 8 April 2025 / Revised: 10 June 2025 / Accepted: 13 June 2025 / Published: 19 June 2025

Abstract

Urban vitality is a critical indicator of urban development quality and livability. However, existing studies often rely on single-source data or subjective evaluation methods, making it challenging to comprehensively and objectively capture the spatial-temporal characteristics of urban vitality. This study takes Baiyun District in Guangzhou as a case study, integrating multiple data sources—including Points of Interest (POI) data, streetscape elements, transportation networks, land use data, and Baidu heat maps—to construct an urban vitality index and explore its key influencing factors. The results reveal the spatial distribution patterns of urban vitality and the varying significance of different determinants, providing data-driven insights and policy implications for urban planning and development.

1. Introduction

Urban vitality has become a key indicator for evaluating the quality and livability of contemporary urban development [1]. Urbanization progress has experienced a noticeable increment on a global scale in past decades [2], benefitting from both urban sprawl and migration from rural to urban areas [3,4,5]. Researchers claim that over half of the global population will settle in urban areas in the next decades [6,7]. Therefore, understanding the mechanisms that promote urban vitality has become increasingly important.
Growth, diversity, and mobility make up the city’s “vital triangle” [1,8]. The concept of urban vitality encompasses more than just population density or economic activity, it reflects the dynamic interplay between built environment characteristics, functional diversity, and human behavior that collectively create lively urban spaces [8,9,10]. Jane Jacobs first articulated the fundamental principles of vibrant urban environments, emphasizing the importance of mixed land use, small blocks, and accessible public spaces [9]. Subsequent research has expanded this foundation, demonstrating how factors such as street design, transportation networks, and green infrastructure contribute to urban vitality [11,12].
Also, researchers began incorporating behavioral and economic indicators into vitality assessment, moving beyond purely physical measures. Montgomery’s influential model [13] integrated activity, image, and form as three dimensions of urban vitality, while concepts of creative cities expanded vitality understanding beyond physical attributes to include cultural and economic dynamism [14].
The most recent stage has been characterized by the revolutionary integration of big data technologies into urban vitality research. The emergence of ubiquitous mobile technologies enabled researchers to leverage mobile phone data, POI data [15], and GPS tracking to measure human activities at unprecedented scales and temporal resolutions [16,17,18]. This transformation marked a fundamental shift from small-scale observational studies to city-wide quantitative analysis using multi-source big data, enabling researchers to validate theoretical concepts with large-scale empirical evidence [19].
However urban vitality research in Chinese contexts faces unique theoretical and methodological challenges [20]. The rapid urbanization process, characterized by large-scale new town development and urban village transformation, creates urban environments that differ significantly from the organic urban evolution assumed in Western theories [21].

2. Research Gap

Firstly, recent advances in geospatial technologies and big data analytics have revolutionized our ability to measure and understand urban vitality [1,22,23]. However, an urban vitality index is not well-defined.
Earlier studies are mainly subjective qualitative research and difficult to apply to large-scale case studies, often conducted based on single data source [24,25]. However, with the expansion of urban dimensions, urban vitality is difficult to precisely assess from a signal aspect [24,26] and should integrate multiple data sources [27]. In recent years, with the occurrence of various types of big data heat maps [28,29], POI data (Points of Interests, a term used in cartography to represent a particular feature using an icon on maps or geodatasets) [30,31], and mobile phone signal data with geotags [32,33], researchers are turning to using big data to access large-scale dynamic and detailed information [34]. Despite these technological advances, current research approaches remain fragmented in their application of big data sources. While researchers increasingly recognize that urban vitality cannot be precisely assessed from single data sources [24,26] and requires integration of multiple data streams [27], most contemporary studies continue to employ individual data sources without systematic integration frameworks. This limitation is particularly problematic given the multidimensional nature of urban vitality, which encompasses social, economic, environmental, and spatial characteristics that cannot be captured through any single measurement approach.
Secondly, a particularly understudied aspect of urban vitality concerns its relationship with sense of place and community cohesion in high-density environments. While compact urban forms can enhance accessibility and support diverse activities [35], excessive density may undermine social connections and place attachment [36]. For example, in Hong Kong’s ultra-dense housing estates, researchers have observed how overcrowding and a lack of communal spaces can reduce neighborly interactions and weaken community bonds [37]. This tension between density and social cohesion represents a critical consideration for urban vitality research.
Mixed land use is becoming a key part in urban planning practice and policy development phases, because it provides good connections on both geographical and functional aspects [38,39], as well as in new urbanism and the growth of urban sustainability [40,41,42]. Land use is defined as the distribution of residential, commercial, and business spaces [9]. This mixed use pattern facilitates greater accessibility and increases the density of land use in the area [43,44,45].
Researchers are now able to access data that reflect the connections of users and spaces from big data sources that occurred with developed information and communication technologies [46,47,48]. The POI contains the geographic information of the location, like name, latitude and longitude, and function of the location, and can be displayed on digital maps [49]. The POI allows scholars to obtain a more accurate and comprehensive understanding of mixed land use because of the large data base it provides [7,50,51,52,53,54].
Thirdly, research into various aspects that influence urban vitality has been conducted. Table 1 illustrates some common methods and measurements to study elements connected to urban vitality. Some scarped numbers of POI data from open access sources like Baidu Maps, and categorized based on GB/T 21010–2017, are a foundation for identifying urban function structures [1,55,56]. Other scholars also studied the numbers of POIs within the perimeter of the community center point [57] to understand the built environment characteristics. However, this research did not include comprehensive categories of POIs (e.g., agricultural land) and multidimensional data are not fully integrated. Other research, such as linear traffic data that include methods of travel, type of vehicle, and other detailed indicators that reflect travel distance, time, traffic volume, delay time, and time spent in congestion [58,59], was collected to understand the movements and activities of urban populations. But this research is considered not comprehensive enough to develop a personalized quantitative index of traffic information based on population characteristics and also lacks a comparison with different time periods.
Elliott et al. [60] examined how urban green infrastructure stimulates activities and living within cities by reducing the urban heat index and promoting residents’ livability and comfort level. Similar studies into urban green spaces was also conducted by Ma et al. [61], Chen et al. [62], and Zhao et al. [63], which studied the alignment between population flow and urban greenery by considering the population flow as dynamically changing. Relevant studies into land use are also conducted from various aspects. Wang et al. [64] investigated the spatial heterogeneity of land use, and Meng and Xing [65] studied the percentage of different functions. The density of land use is also examined [1].
Table 1. Factors and tools to measure urban vitality (points, polyline, polygon).
Points, Polyline, PolygonSubjectsMeasurementPublications
PointsPOIsClassification based on GB/T 21010–2017.[1]
[55]
[56]
Numbers of POIs within the perimeter of the community center point.[58]
PolylineStreet elementsMeasuring urban vitality through built environment factors (like road greenery and maintenance status of pavements) affecting residents’ mental health. Qualitative interviews.[66]
TrafficThree indexes with progressive granularity. Pedestrian, non-motorized, motor vehicle as the first layer, and categorization of auto motors as second layer. Traffic volume, delay time, time spent in congestion as a third layer.[58]
Public transport data: Ridership diversity.[59]
Linear greeneryThe effect of urban greenery on thermal comfort.[60]
The alignment between pedestrian flows and street greenery.[61]
PolygonLand useEvaluating the spatial heterogeneity of land functions, considering both the social and ecological functions.[64]
Percentage of service and public land (PSL), residential land (PRL), industrial land (PIL), and commercial land (PCL).[65]
Land use intensity based on block density and typology.[1]
Green spacePark green space coverage ratio.[58]
[34]
Density of urban park POIs to represent the environmental vitality of a city.[26]
TerrainExtracting slope and elevation data and analyzing the spatial distribution of urban vitality.[67]
[68]
PopulationHuman mobility intensity analysis[64]
Pedestrian traffic measured by cellular phone activity. [69]
Social cohesion index based on qualitative analysis of participants’ individual characteristics.[57]
Nighttime lightNighttime light radiance (intensity).[70]
[71]
[59]
Built environmentStreet system, block pattern, and building arrangement.[70]
Mobile phone dataShared check-in social media data to represent urban individuals’ location information, and intensity to access spatio-temporal behavior.[71]
Using the accumulated number of mobile phone users in a working day as a proxy for neighborhood vibrancy.[17]

3. Research Objectives and Contributions

To address these gaps, this study makes three primary contributions to urban vitality research. First, we develop an innovative methodological framework that integrates multiple data sources (POIs, street view elements, land use patterns, and heat maps) to construct a comprehensive urban vitality index. Second, we examine the complex relationships between built environment characteristics, functional diversity, and urban vitality patterns in a rapidly urbanizing Chinese context. Third, we provide empirical evidence on how spatial heterogeneity in urban form and infrastructure distribution creates distinct vitality patterns across different areas of the Baiyun District.
This research aims to explore these research questions:
(1)
How can an urban vitality index be constructed based on the current literature and multi-source data?
(2)
What are the key factors influencing the urban vitality index in Guangzhou?

4. Methods

4.1. Study Area

We selected the Baiyun District as our study area—Guangzhou’s largest central urban zone—to systematically investigate urban vitality through multi-source data integration. This choice was strategically made because Baiyun’s unique spatial composition spans the complete urban-rural continuum, ensuring representative coverage of diverse development contexts. The land area is 795.79 square kilometers, it governs four towns including Jianggao, Renhe, Taihe, and Zhongluotan, as well as 20 sub-districts, and includes 286 community residents’ committees and 118 villagers’ committees. By the end of 2023, the registered population is 1,228,900, and the permanent population is 3,666,800, which is the central urban area with the largest permanent population in Guangzhou. Figure 1 shows the overall research flow of this study.

4.2. Data Sources

This study conducts data analysis based on three dimensions: points, polyline, and polygon. As shown in Table 2, five types of data are used, including geographic information data, POI data, Baidu Street View, traffic data, land use data, and Baidu heat map. The basic geographic information data are sourced from the National Geographic Conditions Census [72], including the administrative boundaries of the Baiyun District and road network data. The POI data were crawled from A-map [73] at the end of 2022. Street-built environment elements were extracted through Baidu Online Map, reflecting the streetscape vitality in the actual photos showcased. Land use data including the areas of open space occupied, construction land, agricultural land [74,75], and hydrology, etc. were from the National Catalogue Service for Geographic Information at the end of 2022. This article collected Baidu heat map data during 2024 to characterize the degree of crowd aggregation. By aggregating the location information of users who use Baidu-related mobile applications (such as Baidu Maps, Baidu Search, Baidu Weather, etc.) and projecting it onto spaces, calculating the Baidu heat index, and reflecting the spatial distribution of users within a certain area through different colors, it has been widely used to measure crowd aggregation characteristics [76].
In the spatial dimension, the study area is divided into 2892 units according to a 500 m × 500 m grid. Most studies on urban vitality within the municipal area typically choose a block scale of 0.5–2.0 km [77]. Considering that this paper focuses on the central urban area, where the road network is denser, in order to better match the spatial scale of the blocks in the central urban area and to achieve the research objectives of the spatiotemporal visualization of urban vitality at the block scale and its relationship with the built environment, this study selects a 500 m × 500 m grid.

4.3. Dependent and Independent Variables

4.3.1. The Number of Points of Interest (POIs)

The number of Points of Interest (POIs) within a unit can effectively reflect the agglomeration degree of urban functions. The POI data used in this study were obtained from the Amap (Gaode Map) Search Service API, with a collection cutoff date of 2024 (Table 3). A total of 20,014 POI records were collected, covering the spatial distribution of various facility points within the Baiyun District of Guangzhou City. Each POI record includes eight attributes: longitude, latitude, name, address, type, administrative district, administrative code, and contact number.
To analyze the spatial distribution characteristics of POIs, this study adopted a 500 m × 500 m grid as the statistical unit. The spatial join function in ArcGIS 10.7 was utilized to calculate the number of POIs within each grid cell. The specific classification of POIs is as follows:

4.3.2. Road Length

Road length reflects the development level of the urban transportation network. The road data were obtained from OpenStreetMap (OSM), including various levels of road networks such as primary roads, secondary roads, and branch roads. After classifying the road data using ArcGIS 10.7, the total road length within each 500 m × 500 m grid was calculated. Table 4 shows the classification of roads is as follows:

4.3.3. Proportion of Land Use Types

This study is based on land use data from the China Land Cover Dataset (CLCD). Initially, the raw data within the study area were clipped. Subsequently, a regular grid of 500 m × 500 m was generated across the study area using ArcGIS Pro 3.2 software. Through spatial overlay analysis, the area of each land use type within each grid cell was calculated, and its proportion relative to the total area of the grid cell was determined, thereby obtaining the proportion of each land use type within every grid cell. The classification of land use is as Table 5.

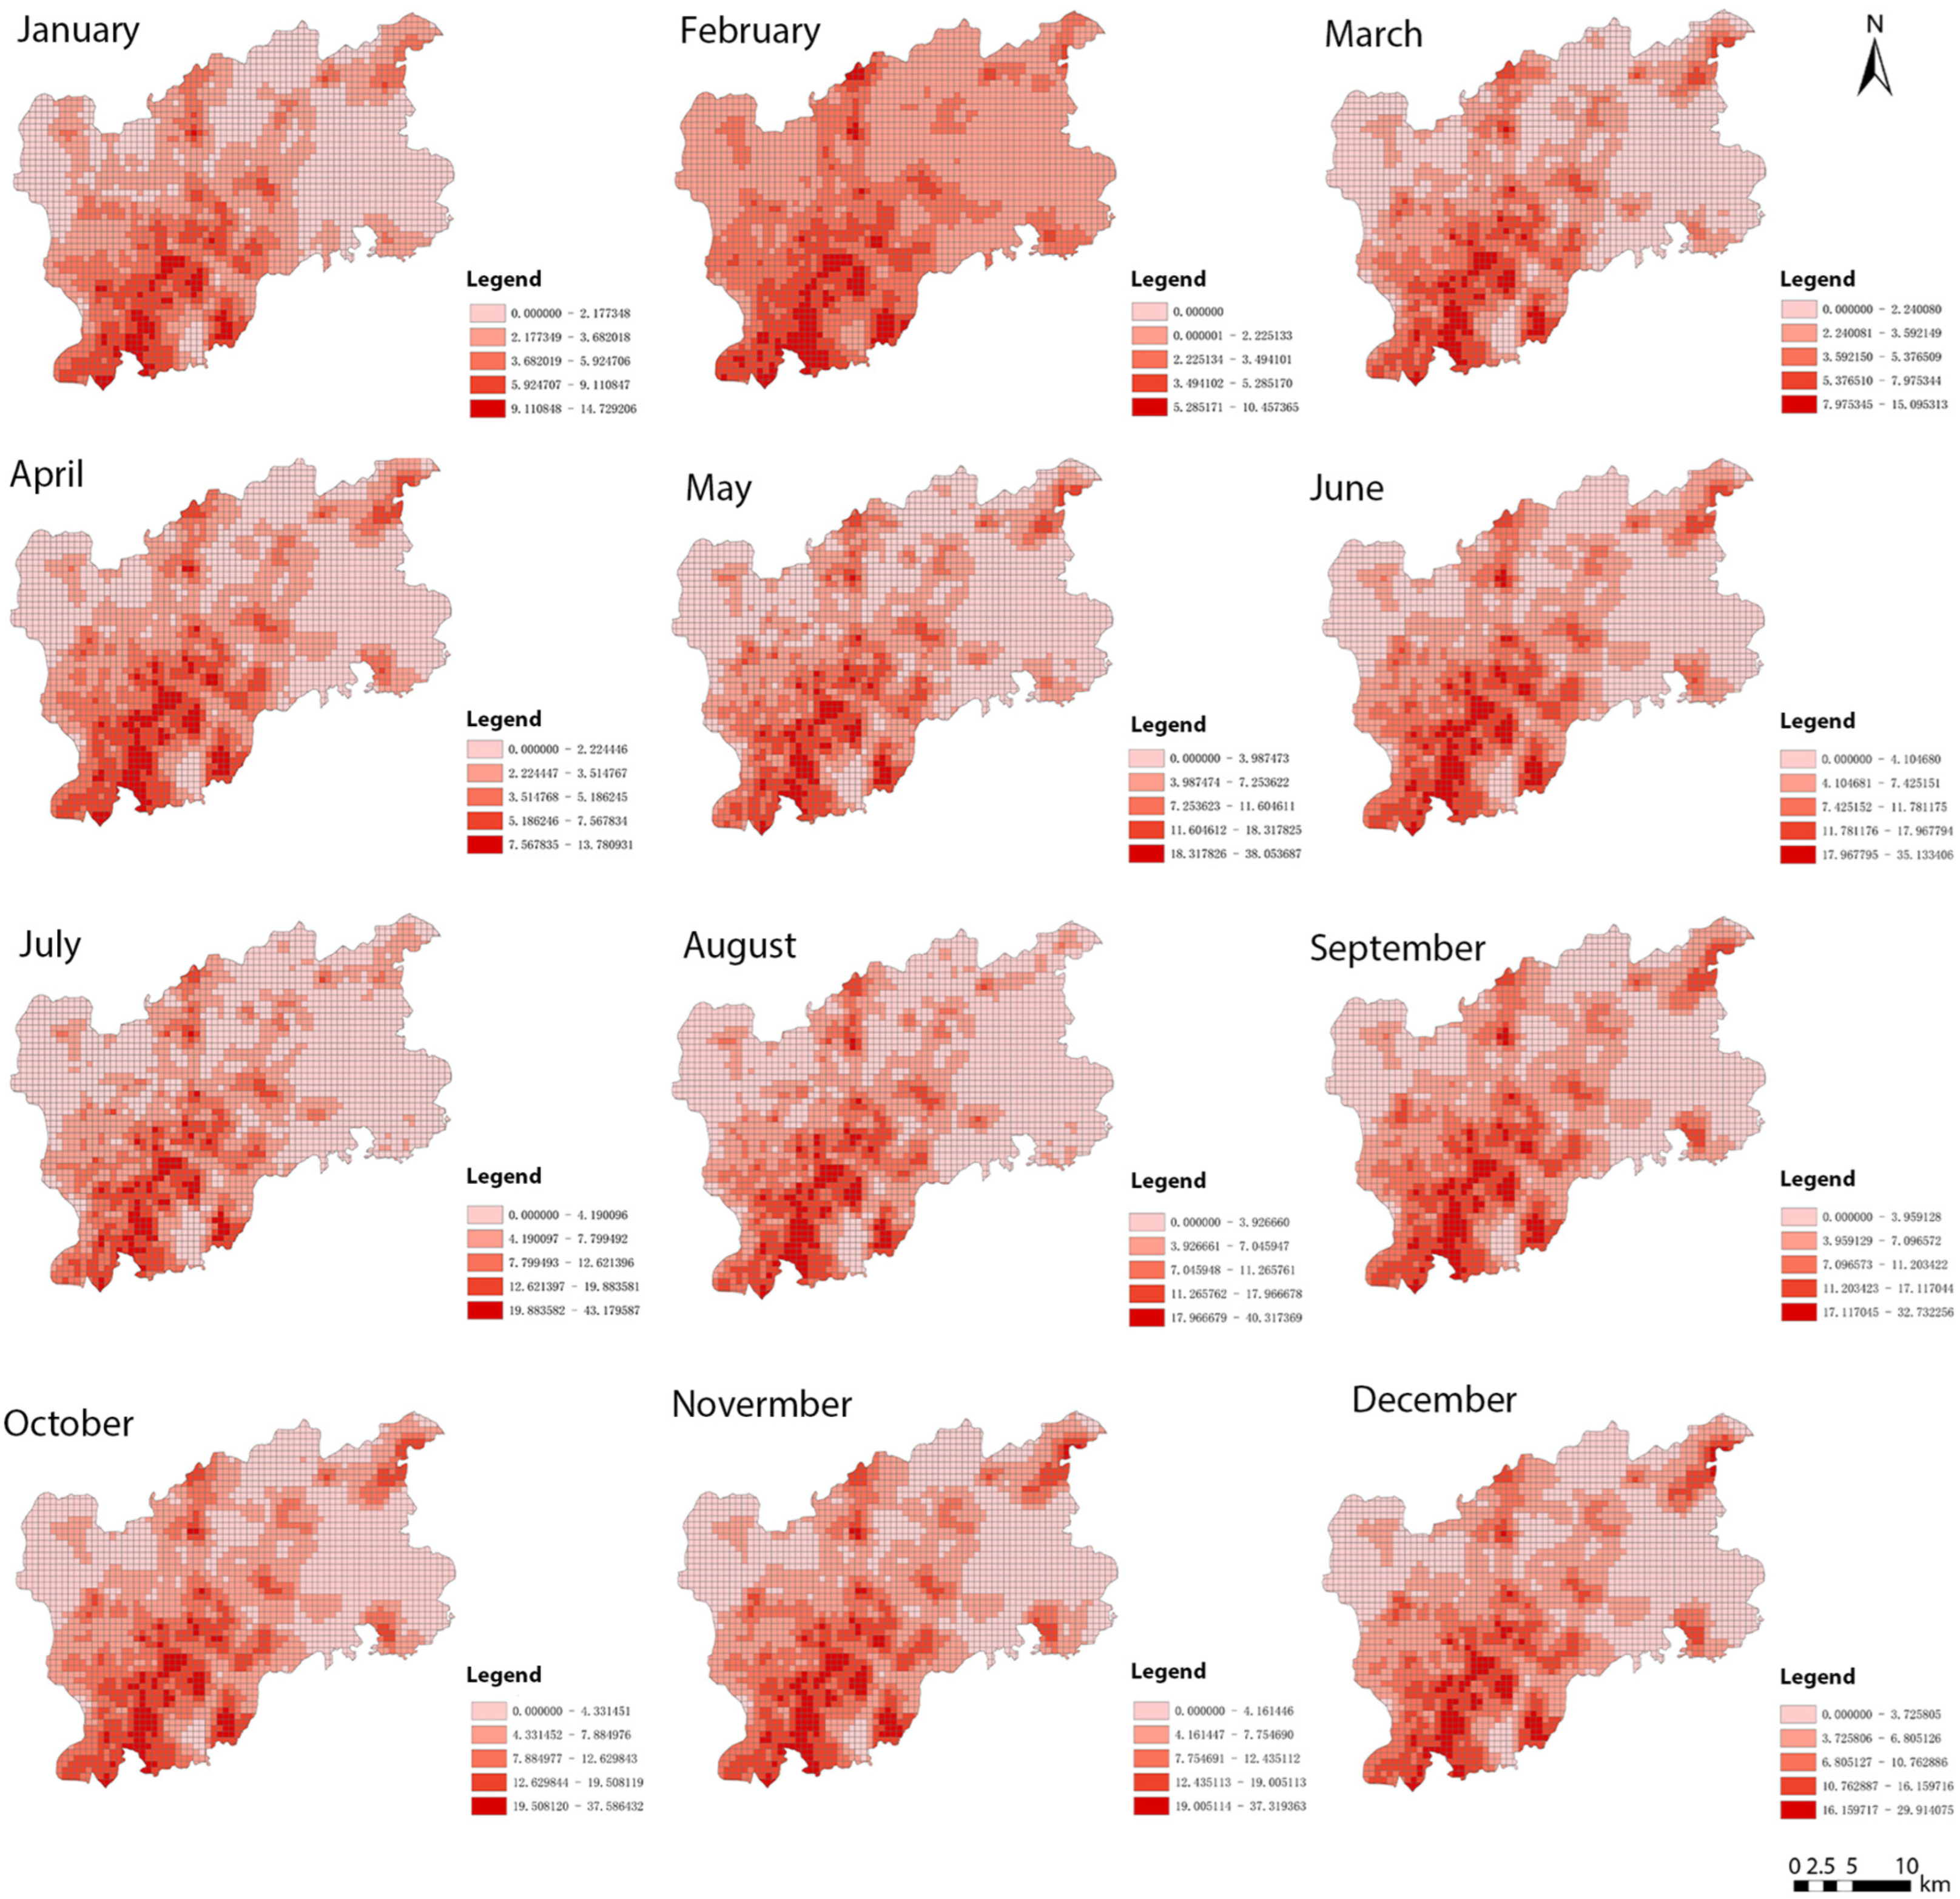
4.3.4. Dependent Variables

For this study, urban vitality is defined as “the intensity and diversity of human activities within urban spaces that reflects the dynamic interaction between people and the built environment, contributing to the social, economic, and cultural vibrancy of urban areas”. This definition builds upon Jane Jacobs’ foundational concepts while incorporating contemporary understanding of urban dynamics as measurable through digital technologies.
Urban vitality encompasses three key dimensions that can be operationalized through data analysis. First, activity intensity, which is the frequency and density of human presence and movement in urban spaces. Then spatial distribution, represented by the geographic patterns of human activities across different urban locations. Finally, temporal consistency, which is the sustained nature of activities over time, distinguishing vital areas from those experiencing only sporadic use.
Baidu heat maps aggregate anonymous location data from millions of users of Baidu mobile applications. The heat values represent the spatial density of mobile phone users at specific locations and times, providing a direct measurement of human activity intensity across urban spaces. This can represent vitality in three dimensions, including heat map values that directly reflect where people are present and active, which aligns with the core concept of urban vitality as human activity intensity [78]. And the data provide comprehensive spatial coverage across the entire study area, enabling systematic comparisons of vitality levels across different locations. Monthly aggregation of heat map data captures sustained activity patterns rather than isolated events, reflecting genuine urban vitality rather than temporary gatherings.
Baidu heat maps visualize aggregated user location data from Baidu mobile apps (e.g., Maps, Search) through color gradients (red = high density, blue = low), representing real-time human activity intensity (Baidu API Documentation, 2024). The dependent variable data in this study were obtained from Baidu heat maps. Baidu heat maps provided latitude and longitude information along with corresponding heat values for over 20,000 locations across Guangzhou. To systematically process these data, we developed a Python (version 3.8) script to align monthly data to the same set of locations, resulting in a final dataset of 25,081 valid points.
Subsequently, we calculated the average activity value for each point on a monthly basis and mapped these values geographically. Since the original point data did not fully cover the entire Baiyun District, we employed Kriging Interpolation (Formula (1)) to spatially interpolate the point data. Through this interpolation process, we were able to fill in gaps in the data and extract the average activity value within each grid as the final dependent variable. This data processing approach ensured the spatial continuity and completeness of the dependent variable, providing a reliable foundation for subsequent analysis.
Z ^ s 0 = i = 1 n λ i Z s i
where Z ^ s 0 represents the estimated value at the unknown location s 0 , Z s i represents the observed value at the known location s i , λ i represents the weight coefficient associated with each known point s i , and n represents the number of known points used for interpolation.
The key to the Kriging interpolation method lies in determining the weight coefficients λ i . The determination of these weights is based on the variogram, which describes the spatial autocorrelation of the data. The formula for the variogram is:
γ h = 1 2 N h i = 1 N h Z s i Z s i + h 2
where γ h represents the variogram value at distance h , which describes the spatial autocorrelation, N ( h ) represents the number of point pairs separated by distance h , and Z s i and Z s i + h   represent the observed values at locations s i and s i + h , respectively.

4.4. Data Statistics Methods

To explore the relationship between urban vitality and POI density, road density, and the proportion of land use types, this study adopts the following Ordinary Least Squares (OLS) statistics.

4.4.1. GIS Hot Spot Analysis

GIS Hot Spot Analysis (Getis-Ord Gi*) is a spatial statistical method used to identify significant clusters of high values (hotspots) or low values (cold spots) within a study area. This study employs the Getis-Ord Gi* index to determine significant spatial patterns of urban vitality (dependent variable) by calculating the spatial autocorrelation between each spatial unit (e.g., grid) and its neighboring units. The calculation is based on the Getis-Ord Gi* statistic, as follows:
G i = j = 1 n ω i j x j X ¯ j = 1 n ω i j S n j 1 n ω i j 2 j = 1 n ω i j 2 n 1
where G i is the Getis-Ord Gi* statistic for location i , ω i j is the spatial weight between feature i and j , X ¯ is the mean of the attribute values (Equation (3)), and S is the standard deviation of the attribute values (Equation (4)):
X ¯ = j = 1 n x j n
S = j = 1 n x j 2 n X ¯ 2
where   x j is the attribute value for feature j , and n is equal to the total number of features. A positive G i value indicates a hotspot (high-value clustering) while a negative G i value indicates a coldspot (low-value clustering). The statistical significance of these clusters is determined by comparing the G i statistic to a critical value from the standard normal distribution.

4.4.2. Cluster and Outlier Analysis

Cluster and Outlier Analysis (Local Moran’s I) uses the Local Moran’s I index to identify spatial units with similar or dissimilar characteristics within the study area. Unlike hotspot analysis, this method not only detects clusters of high or low values but also identifies spatial outliers (units significantly different from their neighbors). This method provides a more detailed understanding of the spatial heterogeneity of urban vitality and its complex relationships with independent variables.
Both Hot Spot Analysis (Getis-Ord Gi*) and Cluster and Outlier Analysis (Local Moran’s I) are based on spatial statistical methods. The difference lies in that hotspot analysis focuses on identifying significant clusters of high or low values, making it suitable for macro-level spatial pattern analysis, while Cluster and Outlier Analysis can simultaneously detect clusters and outliers, making it suitable for micro-level spatial heterogeneity analysis. Combining these two methods provides a comprehensive understanding of the spatial characteristics of urban vitality and its driving factors at both global and local scales.
The Local Moran’s I ( I i ) is calculated as follows:
I i = x i X ¯ S i 2 j = 1 , j i n ω i , j x j X ¯
where x i and x j are the attribute values for locations i and j , respectively, X ¯ is the mean of the attribute values, ω i , j is the spatial weight between features i   and j , and S i 2   is the variance of the attribute values, calculated as:
S i 2 = j = 1 , j i n x j X ¯ 2 n 1
where n is equal to the total number of features. The analysis results classify spatial units into high-high clusters (HH), low-low clusters (LL), high-low outliers (HL), low-high outliers (LH), and non-significant regions.

4.4.3. Ordinary Least Squares (OLS)

Ordinary Least Squares (OLS) is used to preliminarily analyze the linear impact of POI density, road density, and the proportion of land use types on urban vitality. Through the OLS model, the global influence of each independent variable on urban vitality can be assessed.

5. Results

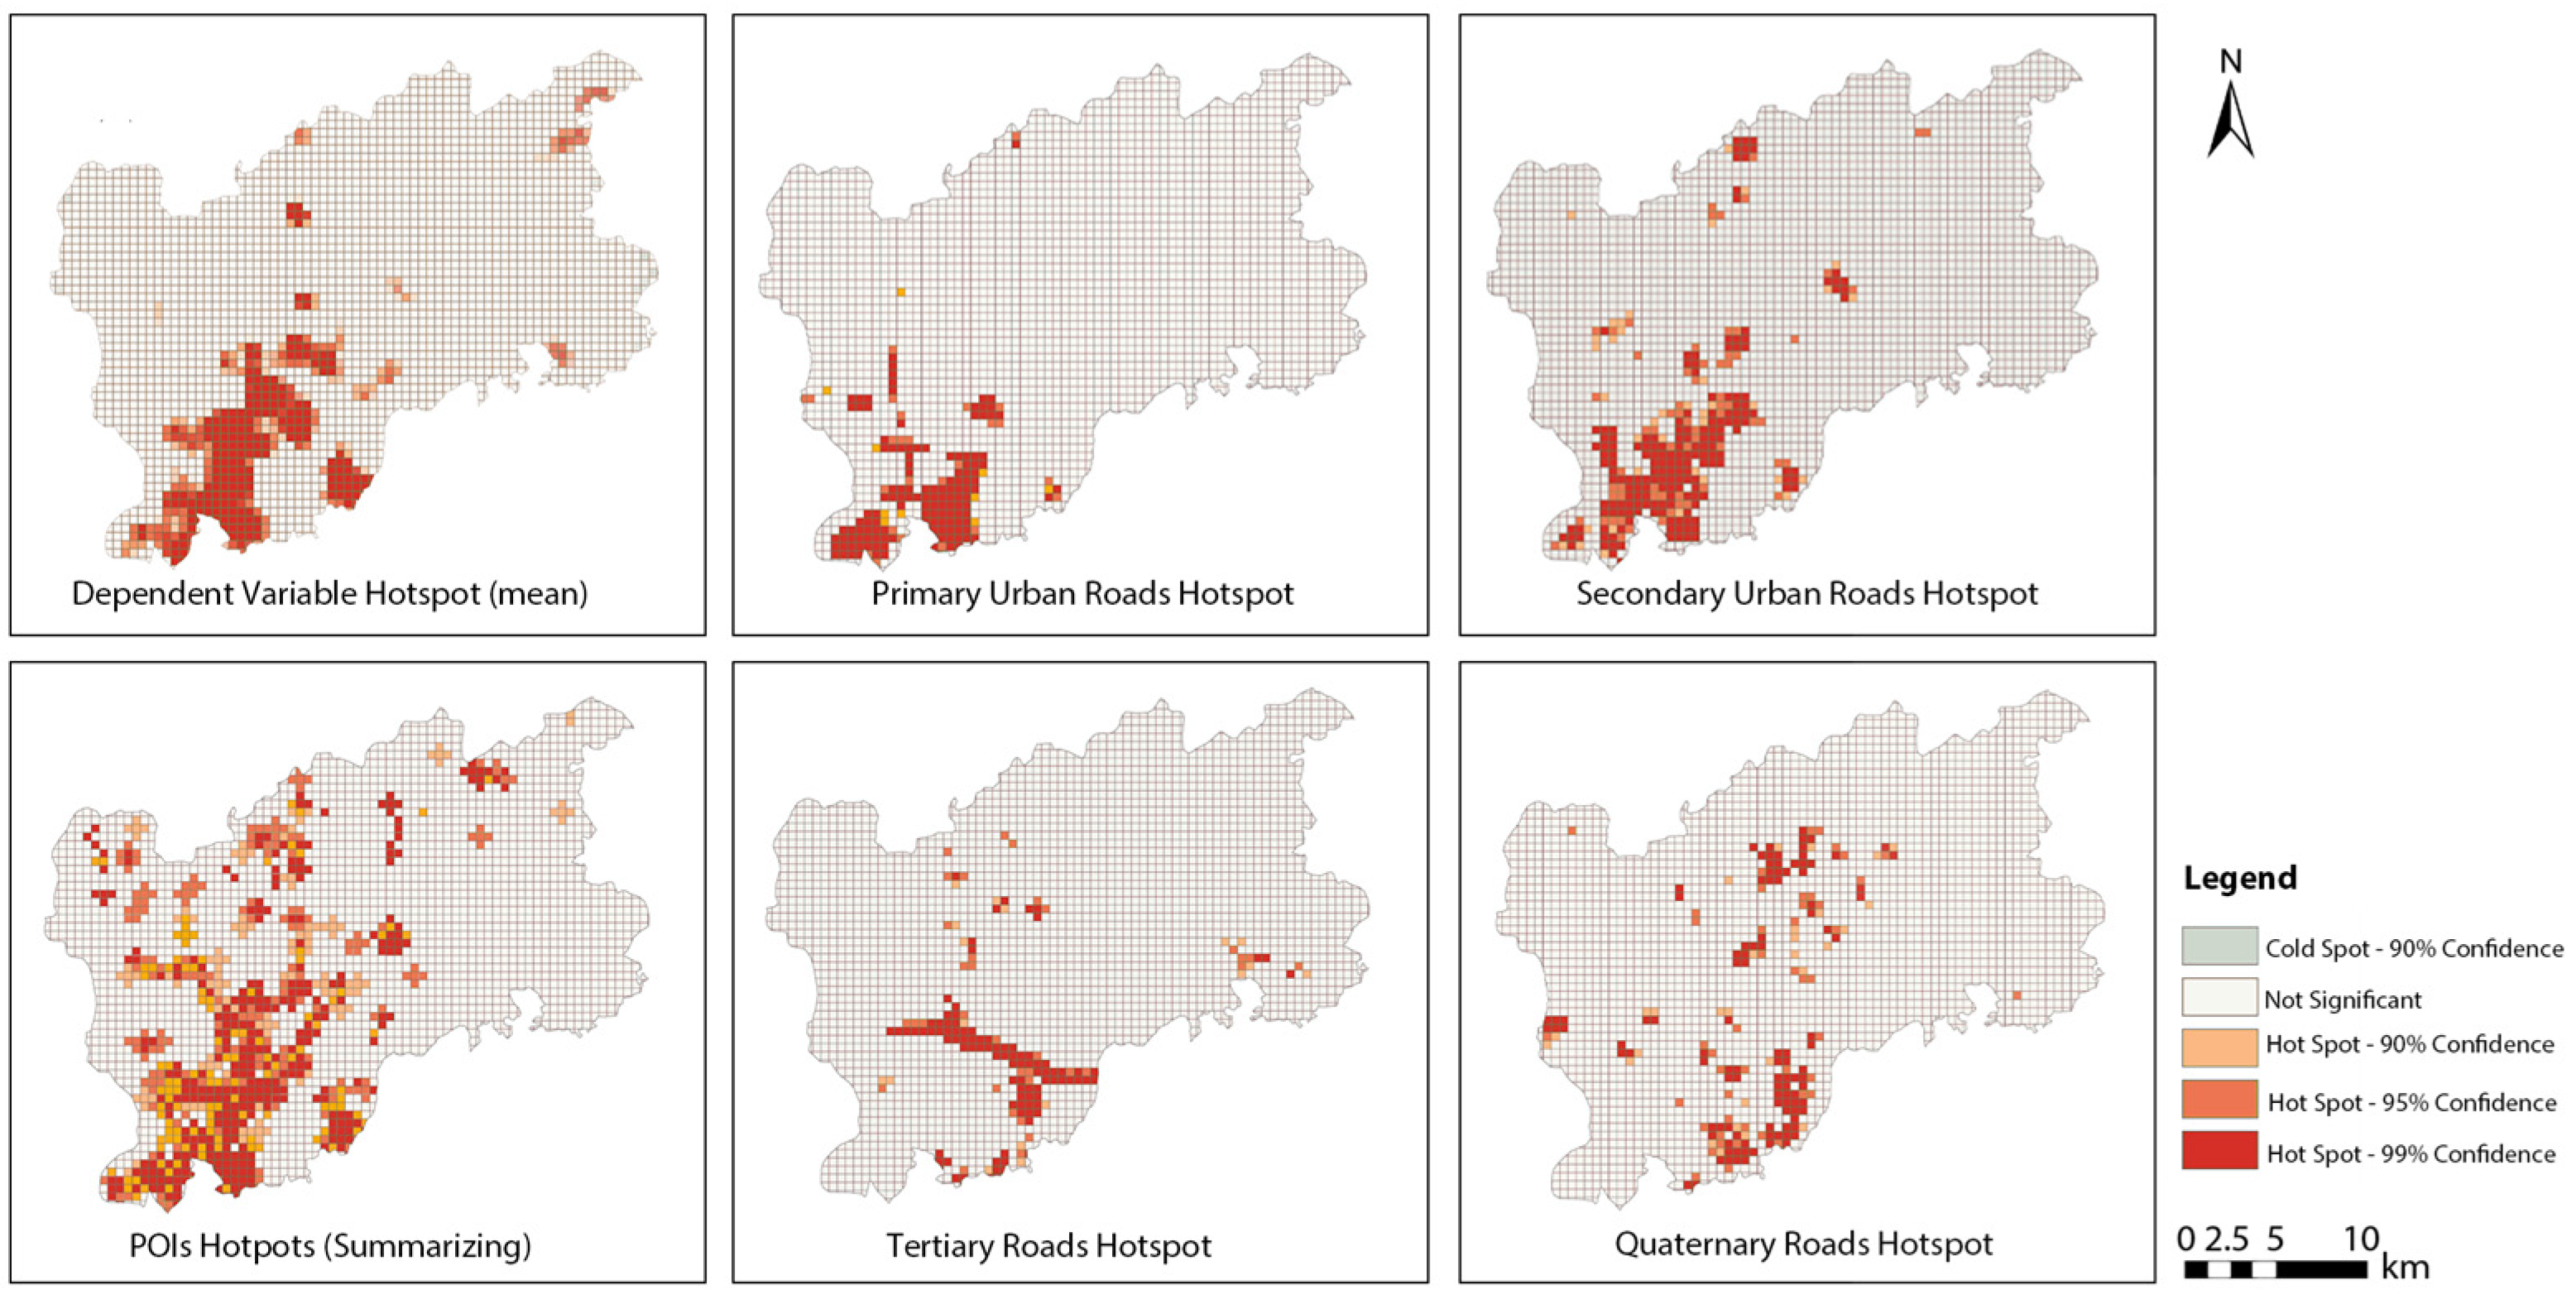
5.1. Hotspot Analysis Results

The hotspot analysis of the dependent variable reveals a distinct spatial clustering pattern of urban vitality. Specifically, the hotspots of urban vitality over the 12 months are predominantly concentrated in the southern part of the Baiyun District, with several secondary hotspots scattered in the northeastern and southeastern regions. Figure 2 shows Baidu heat map of the Guangzhou Baiyun District for 12 months in 2024. This indicates that the southern Baiyun District serves as the core area of urban vitality, while the northeastern and southeastern areas exhibit some spillover effects of vitality.
Among the independent variables, the hotspot distributions of primary and secondary urban roads align closely with the vitality hotspots of the dependent variable, suggesting that these road networks play a significant role in shaping the spatial distribution of urban vitality. However, other road types (e.g., tertiary and quaternary roads) show limited consistency with the dependent variable due to the scarcity of their hotspots. Figure 3 shows Hotspot analysis results.
For Point of Interest (POI) variables, the hotspot distributions of hotels, restaurants, bus stops, corporate service areas, schools, pharmacies, medical facilities, government institutions, banks, parking lots, and high-rise buildings exhibit strong consistency with the vitality hotspots of the dependent variable. This indicates that these facilities and services significantly contribute to the spatial distribution of urban vitality. In contrast, the hotspot distributions of land use types do not align with the vitality hotspots, suggesting a weaker influence of land use types on the spatial distribution of urban vitality.
In conclusion, the spatial distribution of urban vitality is closely related to the spatial layout of road networks and POI facilities, while the influence of land use types is relatively limited. These findings provide valuable insights for optimizing urban spatial planning and resource allocation.

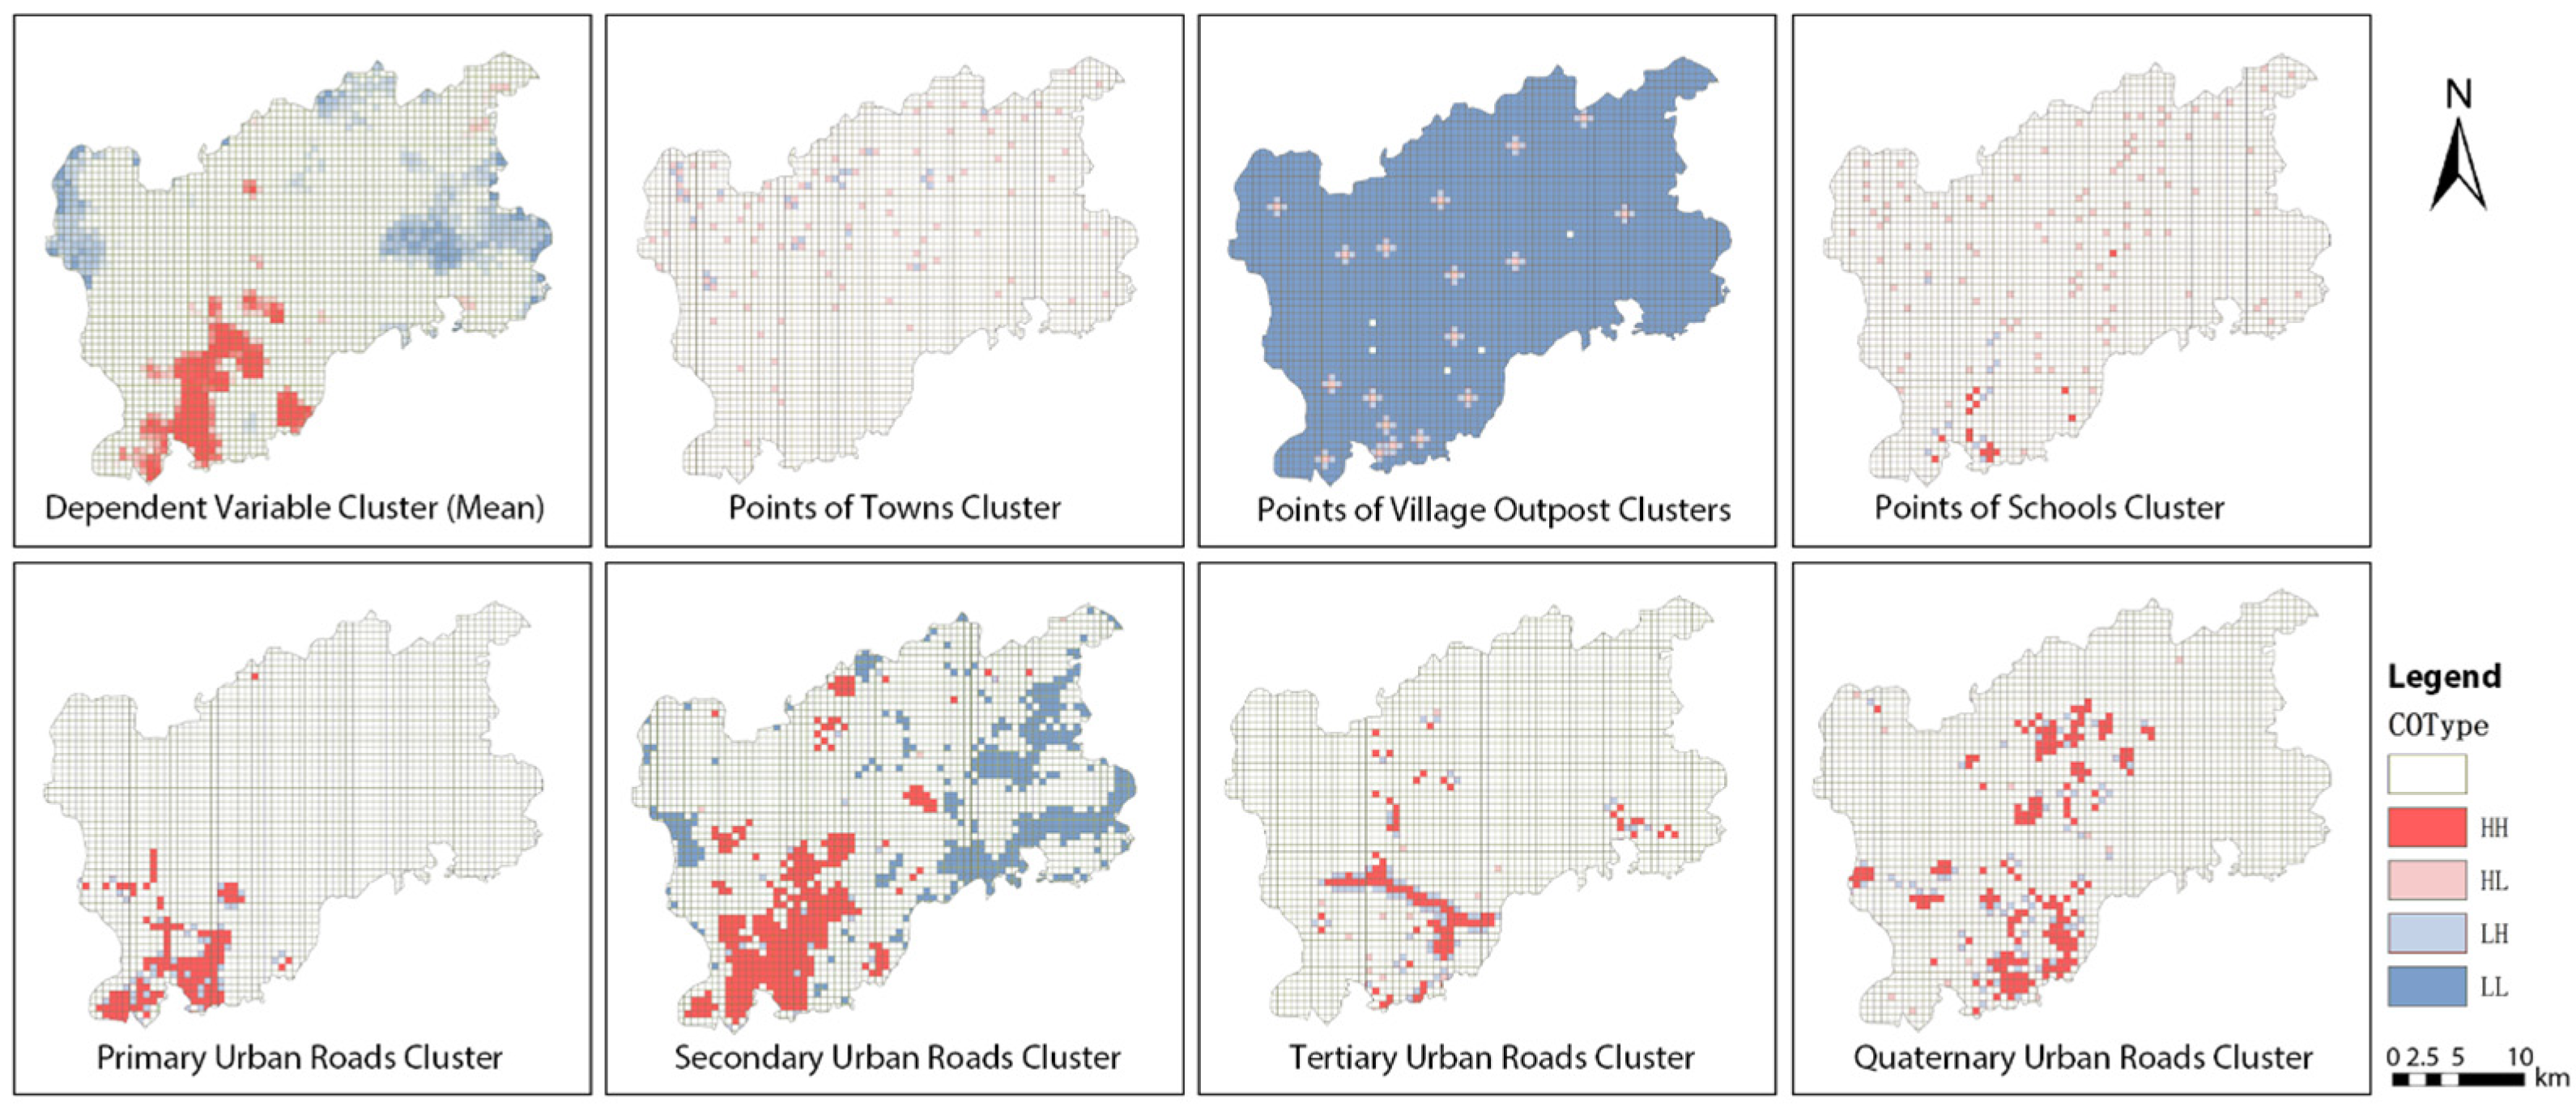
5.2. Cluster Analysis Results

The clustering analysis reveals significant spatial autocorrelation characteristics in the distribution of urban vitality. Specifically, high-high (H-H) clusters are predominantly concentrated in the southern part of the Baiyun District, indicating a high level of urban vitality in this area and a strong positive spatial association with its surrounding regions. In contrast, low-low (L-L) clusters are mainly distributed in the eastern and western parts of the Baiyun District, suggesting lower levels of urban vitality and negative spatial associations with neighboring areas. Figure 4 shows parts of Cluster analysis results.
Among the Point of Interest (POI) variables, the clustering analysis of schools, towns, and village stations shows scattered high-low (H-L) and low-high (L-H) clusters, indicating a certain degree of heterogeneous spatial association between these facilities and urban vitality. However, other POI variables do not exhibit significant spatial clustering patterns.
For road variables, the clustering distribution of primary and secondary urban roads aligns well with the spatial distribution of urban vitality, highlighting the important role of these road networks in shaping the spatial pattern of urban vitality. In contrast, other road types (e.g., tertiary and quaternary roads) show clustering distributions that primarily reflect their own morphological characteristics due to their limited numbers, without significant spatial associations with urban vitality.
In summary, the spatial distribution of urban vitality is closely related to the H-H clusters in the southern Baiyun District, while only some POI and road variables exhibit spatial associations with urban vitality. These findings provide valuable insights for understanding the spatial patterns of urban vitality and their influencing factors.

5.3. OLS Results

The results of the regression analysis based on Ordinary Least Squares (OLS) in Table 6 indicate that the model is statistically significant (joint F-statistic = 105.35, p < 0.01), and the model exhibits a relatively high goodness of fit (R2 = 0.526). Among the explanatory variables, hotels (coefficient = 0.495, p < 0.01), corporate service areas (coefficient = 0.098, p < 0.01), pharmacies (coefficient = 0.677, p < 0.01), and highway length (coefficient = 0.000, p < 0.01) have a significant positive impact on the dependent variable, suggesting a strong positive association between these factors and the dependent variable. Conversely, village stations (coefficient = −1.120, p < 0.01) and parking lots (coefficient = −0.419, p < 0.05) exhibit a significant negative impact on the dependent variable. Additionally, provincial road length (coefficient = −0.000, p < 0.01) and rural road length (coefficient = −0.001, p < 0.01) also show significant negative effects. The Variance Inflation Factor (VIF) analysis reveals that all explanatory variables have VIF values below 7.5, indicating no severe multicollinearity issues in the model. Overall, the model provides a good explanation for the variation in the dependent variable, although potential model assumption biases should be noted.

6. Discussion

6.1. Key Findings and Contributions of Multi-Source Data in Urban Vitality Assessments

This study demonstrates the value of systematic integration of diverse urban data sources for comprehensive urban vitality assessment. By simultaneously analyzing POI distributions, transportation networks, land use patterns, and population activity data within a unified framework, we address critical limitations in previous research that typically examined these elements in isolation. Our integrated approach reveals vitality patterns that would be missed by single-source analyses, showing how different urban elements work together to create spatial vitality distributions, which is more comprehensive and objective than the traditional single data or subjective indicators.
Our findings align with the “diversity breeds vitality” principle proposed by Jacobs, as evidenced by the strong positive correlation between POI density (particularly hotels and corporate services) and vitality in southern Baiyun. This supports Xia et al.’s argument that functional mix is a key driver of urban vibrancy in Chinese megacities. However, unlike their study, which highlighted retail dominance, our data show corporate services contribute more than restaurants, suggesting Baiyun’s unique role as a Guangzhou’s sub-center with specialized business functions. The micro-scale streetscape analysis further reveals that POI effects are amplified in areas with pedestrian-friendly designs (e.g., wide sidewalks), echoing Gehl’s emphasis on “life between buildings”.
By integrating POIs, street views, land use, and dynamic heat maps, this study constructed the best “function-spatial-time” trinity of urban vitality assessment framework, breaking through the limitations of traditional single data or subjective indicators. In terms of method, the combination of points, polyline, and polygon not only improves the scientific of index construction, but also reveals the multi-scale mechanism of vitality formation through spatial metrology model “global spillover + local heterogeneity”. At the practical level, 500 m grid analysis puts forward a precise planning strategy of “improving the quality in the south and making up for the deficiency in the east” for the Baiyun District, verifying the feasibility of multi-source data-driven urban renewal. This paradigm can provide a technical blueprint for the sustainable governance of other high-density cities.

6.2. The Role of Built Environment and Functional Diversity in Shaping Urban Vitality

The built environment and functional diversity are mutually reinforcing factors that together shape urban vitality [62]. By optimizing transport networks, improving the quality of public spaces and promoting mixed-use development, cities can create vibrant, resilient and inclusive urban environments. The interaction between the built environment and functional diversity creates synergies that further amplify urban vitality. A well-designed transport network enhances the accessibility of POIs, making it easier for people to reach commercial, recreational, and cultural facilities. This in turn increases the attractiveness of these areas, creating a positive cycle that maintains vitality.
High quality public spaces (e.g., pedestrian-friendly streets, green spaces) combined with diverse functions (e.g., mixed-use buildings) create a sense of place and promote social interaction and community engagement. This is particularly evident in the southern Baiyun District, where vibrant street life and active public spaces coexist. Diverse and well-connected urban areas are more resilient to economic and social shocks. For example, during seasonal fluctuations, functionally balanced areas (such as a mix of commercial and residential) maintained higher activity levels than single-function areas.
There are significant differences between the central area (the southern core area) and the fringe area (the eastern and western areas) in terms of transportation network, POI facilities, land use, etc., resulting in spatial heterogeneity of its vitality level. The central area has a developed transportation network, dense main roads and public transportation, high density and diverse functions of POI facilities, mainly mixed-use development of land, supporting high-density economic activities, spatial heterogeneity, as POIs and traffic have strong marginal effects and significant synergies, forming a high-vitality core area, showing a significant “high-high” cluster. In the marginal area, traffic coverage is sparse, accessibility is poor, POI density is low and function is single, land use is mainly agricultural land and green land, with a lack of mixed-use development, spatial heterogeneity is manifested by weak marginal effects of POIs and traffic, isolated functional agglomeration, and low vitality levels, showing a significant “low-low” clustering. Targeted planning strategies, such as a central area to further enhance the connectivity of the transportation network, can optimize the layout of a POI, consolidate its status as a dynamic core area, develop business centers, cultural landmarks and innovation parks, and enhance the radiation effect. The edge district gives priority to improving transportation infrastructure, increasing the density of commercial and service facilities, promoting mixed-use development, using natural resources to develop eco-tourism and leisure industries, and creating characteristic vitality nodes, which can effectively narrow regional disparities, promoting the balanced distribution of urban vitality. The negative impacts of village stations (β = −1.120, p < 0.01) and parking lots (β = −0.419, p < 0.05) on urban vitality reveal systemic planning challenges in transitional urban areas. Village stations suffer from institutional fragmentation that restricts mixed-use development, resulting in significantly lower functional diversity (H = 0.38 vs. 1.25 in urban cores) and poor transit connectivity (only 18% within 500 m of metro stations). Similarly, parking lots clustered near expressway interchanges create pedestrian-hostile environments, reducing walkability by 22.3 points while wasting valuable land resources. These findings suggest the need for targeted interventions, including mandatory commercial space requirements (≥30% FAR) for village stations and mobility-based parking maximums (0.3 spaces/100 m2) in transit zones, as successfully implemented in Shenzhen’s recent urban renewal projects. Such measures would align with Guangzhou’s strategic planning goals while addressing current vitality deficits in peri-urban areas.

6.3. Spatial Heterogeneity and the Impact on Urban Vitality

This study reveals significant spatial heterogeneity in the distribution of urban vitality in the Baiyun District, Guangzhou, through hotspot analysis and cluster analysis. The hotspot analysis results indicate that the southern part of the Baiyun District is the core area of urban vitality, forming a significant high-value cluster, while the northeastern and southeastern regions exhibit secondary hotspots, demonstrating a certain spillover effect of vitality. Cluster analysis further validates this pattern, with the southern region showing a prominent “high-high” clustering characteristic, indicating not only high vitality within the area but also a positive radiation effect on surrounding regions. In contrast, the eastern and western regions exhibit “low-low” clustering, reflecting lower urban vitality due to inadequate transportation networks and insufficient infrastructure.
From the perspective of influencing factors, the southern region benefits from a dense transportation network (e.g., Airport Expressway, Guangyuan Expressway) and abundant POI facilities (e.g., hotels, corporate service areas, pharmacies), which significantly promote the agglomeration of urban vitality. In comparison, the eastern and western regions are constrained by insufficient transportation coverage, limiting the development of urban vitality. Notably, the distribution of land use types does not significantly affect the spatial pattern of urban vitality, suggesting that urban vitality in the Baiyun District relies more on the layout of transportation and POI facilities rather than land use itself. Based on these findings, future urban planning should focus on optimizing the transportation network (e.g., enhancing the construction of arterial roads in the eastern and western regions) and rationalizing the layout of POI facilities (e.g., increasing commercial and service facilities in low-vitality areas) to mitigate the hindering effects of spatial heterogeneity on the distribution of urban vitality.

6.4. Policy Implications, Limitations, and Future Research Directions

This study provides important policy insights for enhancing urban vitality and optimizing spatial planning in the Baiyun District, Guangzhou. First, the results indicate that transportation networks (especially primary and secondary roads) and POI facilities (e.g., hotels, corporate service areas, pharmacies) are key factors influencing the distribution of urban vitality. Therefore, it is recommended to prioritize the improvement of transportation infrastructure in the Baiyun District’s urban planning, particularly by strengthening the construction of arterial roads and expressways in the eastern and western regions to enhance their accessibility. Simultaneously, increasing the density of commercial and service facilities in low-vitality areas, along with policy incentives to attract investment and population inflow, can promote a more balanced distribution of urban vitality. Second, as the core area of urban vitality in the Baiyun District, the southern region should further strengthen its functional positioning, for example, by developing commercial centers, cultural landmarks, and innovation parks to enhance its radiating influence on surrounding areas.
However, this study also has certain limitations. The relatively low spatial resolution of land use data may affect the precise localization of urban vitality distribution. Future research could incorporate higher-precision dynamic data (e.g., time-series data) and more sophisticated spatial econometric models (e.g., spatial lag models or machine learning) to provide a more comprehensive analysis of the spatiotemporal evolution of urban vitality. Additionally, cross-city comparative studies (e.g., comparing with other districts in Guangzhou or cities in the Pearl River Delta) could help validate the generalizability of this study’s findings, offering more universal planning strategies for enhancing urban vitality in different cities. For instance, drawing on the experiences of Shenzhen’s Nanshan District or Dongguan’s Songshan Lake, future research could explore how to integrate technological innovation with urban vitality in the Baiyun District, driving high-quality regional economic development. Third, while OLS regression identified significant global relationships, it cannot capture spatially varying effects. Future studies should adopt GWR to examine how the influence of commercial facilities or transport infrastructure changes across urban-rural gradients.

7. Conclusions

This study constructs a comprehensive urban vitality index for the Baiyun District, Guangzhou by integrating multi-source data including POIs, road networks, land use, streetscape features, and heat maps. The results reveal significant spatial heterogeneity, with the southern area emerging as a core vitality cluster due to dense transportation and functional diversity. By combining PCA, spatial econometric models, and machine learning, the study offers an objective and replicable framework for vitality assessment. While the methodology is applied to Guangzhou, the framework’s reliance on widely available geospatial data (POIs, street views, heat maps) ensures its adaptability to other cities, particularly those with similar high-density, mixed-use urban forms, such as Shanghai, Shenzhen, or other rapidly urbanizing contexts in Southeast Asia. It provides valuable insights for targeted urban renewal strategies, supporting data-driven planning and sustainable development in high-density urban environments.

Author Contributions

Conceptualization, H.C. and J.G.; methodology, H.C.; software, H.C.; validation, H.C., J.G. and W.H.; formal analysis, H.C.; investigation, H.C.; resources, H.C.; data curation, H.C.; writing—original draft preparation, H.C.; writing—review and editing, H.C.; visualization, H.C.; supervision, W.H.; project administration, W.H.; funding acquisition, J.G. All authors have read and agreed to the published version of the manuscript.

Funding

Study on Landscape Renewal Patterns of Industrial Brownfield Sites in Guangdong, Hong Kong and Macao Greater Bay Area (25XSC27).

Data Availability Statement

Data available in a publicly accessible repository. The data presented in this study are openly available in Web of Science.

Conflicts of Interest

Author Hongjin Chen was employed by Cushman & Wakefield. The remaining authors declare that the research was conducted in the absence of any commercial or financial relationships that could be construed as a potential conflict of interest.

References

  1. Xia, C.; Zhang, A.; Yeh, A.G.O. Analyzing spatial relationships between urban land use intensity and urban vitality at street block level. Landsc. Urban Plan. 2020, 193, 103669. [Google Scholar] [CrossRef]
  2. Johnson, M.T.J.; Munshi-South, J. Evolution of life in urban environments. Science 2017, 358, eaam8327. [Google Scholar] [CrossRef]
  3. Alcock, I.; White, M.P.; Taylor, T.; Coldwell, D.F.; Gribble, M.O.; Evans, K.L.; Corner, A.; Vardoulakis, S.; Fleming, L.E. ‘Green’ on the ground but not in the air: Pro-environmental attitudes are related to household behaviours but not discretionary air travel. Glob. Environ. Change 2017, 42, 136–147. [Google Scholar] [CrossRef] [PubMed]
  4. Seto, K.C.; Güneralp, B.; Hutyra, L.R. Global forecasts of urban expansion to 2030 and direct impacts on biodiversity and carbon pools. Proc. Natl. Acad. Sci. USA 2012, 109, 16083–16088. [Google Scholar] [CrossRef] [PubMed]
  5. Shahbaz, M.; Shahzad, S.J.H.; Ahmad, N.; Alam, S. Financial development and environmental quality: The way forward. Energy Policy 2016, 98, 353–364. [Google Scholar] [CrossRef]
  6. Liu, Y.; Delahunty, T.; Zhao, N.; Cao, G. These lit areas are undeveloped: Delimiting China’s urban extents from thresholded nighttime light imagery. Int. J. Appl. Earth Obs. Geoinf. 2016, 50, 39–50. [Google Scholar] [CrossRef]
  7. Zhang, W.; Li, W.; Zhang, C.; Ouimet, W.B. Detecting horizontal and vertical urban growth from medium resolution imagery and its relationships with major socioeconomic factors. Int. J. Remote Sens. 2017, 38, 3704–3734. [Google Scholar] [CrossRef]
  8. Wu, W.; Xu, L.C.; Zhao, K. Vital triangle: A new concept to evaluate urban vitality. Comput. Environ. Urban Syst. 2022, 98, 101886. [Google Scholar]
  9. Jacobs, J. The Death and Life of Great American Cities; Vintage Books: New York, NY, USA, 1961. [Google Scholar]
  10. Cao, Y. Urban spatio-temporal weighted population vitality detection based on multi-source data. Geogr. Sci. Res. 2024, 13, 469–488. [Google Scholar]
  11. Buchanan, P. Facing up to facades: A report from the front. Archit. J. 1988, 188, 24–27. [Google Scholar]
  12. Gehl, J. Life Between Buildings: Using Public Space, 1st ed.; Island Press: Washington, DC, USA, 2011. [Google Scholar]
  13. Montgomery, J. Making a City: Urbanity, Vitality and Urban Design. J. Urban Des. 1998, 3, 93–116. [Google Scholar] [CrossRef]
  14. Florida, R. The Rise of the Creative Class: And How it’s Transforming Work, Leisure, Community and Everyday Life; Basic Books: New York, NY, USA, 2006; ISBN 978-0-465-02476-6. [Google Scholar]
  15. Zhang, B.; Song, Y.; Liu, D.; Zeng, Z.; Guo, S.; Yang, Q.; Wen, Y.; Wang, W.; Shen, X. Descriptive and Network Post-Occupancy Evaluation of the Urban Public Space through Social Media: A Case Study of Bryant Park, NY. Land 2023, 12, 1403. [Google Scholar] [CrossRef]
  16. Wu, W.; Niu, X. Influence of Built Environment on Urban Vitality: Case Study of Shanghai Using Mobile Phone Location Data. J. Urban Plan. Dev. 2019, 145, 04019007. [Google Scholar] [CrossRef]
  17. Yue, Y.; Zhuang, Y.; Yeh, A.G.; Xie, J.Y.; Ma, C.L.; Li, Q.Q. Measurements of POI-Based Mixed Use and Their Relationships with Neighbourhood Vibrancy. Int. J. Geogr. Inf. Sci. 2017, 31, 658–675. [Google Scholar] [CrossRef]
  18. Sung, H.; Lee, S.; Cheon, S. Operationalizing Jane Jacobs’s Urban Design Theory: Empirical Verification from the Great City of Seoul, Korea. J. Plan. Educ. Res. 2015, 35, 117–130. [Google Scholar] [CrossRef]
  19. Liu, S.; Zhang, L.; Long, Y.; Long, Y.; Xu, M. A New Urban Vitality Analysis and Evaluation Framework Based on Human Activity Modeling Using Multi-Source Big Data. ISPRS Int. J. Geo-Inf. 2020, 9, 617. [Google Scholar] [CrossRef]
  20. Teng, Y.; Wu, Y.; Liu, M. How Do Urban Amenities Shape Knowledge-Intensive Industry Locations within Cities? A Multi-Scalar Study of Wuhan, China. Appl. Geogr. 2025, 180, 103659. [Google Scholar] [CrossRef]
  21. Liu, Y.; Li, J.; Yang, Y. Strategic Adjustment of Land Use Policy under the Economic Transformation. Land Use Policy 2018, 74, 5–14. [Google Scholar] [CrossRef]
  22. Gui, Z.; Wang, Y.; Li, F.; Tian, S.; Peng, D.; Cui, Z. High Performance Spatiotemporal Visual Analytics Technologies; Springer: Cham, Switzerland, 2020. [Google Scholar]
  23. Yu, M.; Chen, X.; Zheng, X.; Cui, W.; Ji, Q.; Xing, H. Evaluation of spatial visual perception of streets based on deep learning. Sci. Rep. 2025, 15, 18439. [Google Scholar] [CrossRef] [PubMed]
  24. Jiang, Y.; Huang, Z.; Zhou, X.; Chen, X. Evaluating the impact of urban morphology on urban vitality: An exploratory study using big geo-data. Int. J. Digit. Earth 2024, 17, 2327571. [Google Scholar] [CrossRef]
  25. Wentz, E.A.; York, A.M.; Alberti, M.; Conrow, L.; Fischer, H.; Inostroza, L.; Jantz, C.; Pickett, S.T.A.; Seto, K.C.; Taubenböck, H. Six fundamental aspects for conceptualizing multidimensional urban form: A spatial mapping perspective. Landsc. Urban Plan. 2018, 179, 55–62. [Google Scholar] [CrossRef]
  26. Deng, C.; Zhou, D.; Wang, Y.; Wu, J.; Yin, Z. Association between land use and urban vitality in the guangdong–hong kong–macao greater bay area: A multiscale study. Land 2024, 13, 1574. [Google Scholar] [CrossRef]
  27. Huang, H.; Roland-Holst, D.; Wang, C.; Cai, W. China’s income gap and inequality under clean energy transformation: A CGE model assessment. J. Clean. Prod. 2020, 251, 119626. [Google Scholar] [CrossRef]
  28. Li, Z.; Wei, H.; Wu, Y.; Su, S.; Wang, W.; Qu, C. Impact of community deprivation on urban park access over time: Understanding the relative role of contributors for urban planning. Habitat Int. 2019, 92, 102031. [Google Scholar] [CrossRef]
  29. Shi, L.; Halik, Ü.; Mamat, Z.; Aishan, T.; Abliz, A.; Welp, M. Spatiotemporal investigation of the interactive coercing relationship between urbanization and ecosystem services in arid northwestern China. Land Degrad. Dev. 2021, 32, 4105–4120. [Google Scholar] [CrossRef]
  30. Lyu, R.; Pang, J.; Tian, X.; Zhao, W.; Zhang, J. How to optimize the 2D/3D urban thermal environment: Insights derived from UAV LiDAR/multispectral data and multi-source remote sensing data. Sustain. Cities Soc. 2023, 88, 104287. [Google Scholar] [CrossRef]
  31. Yang, S.; Zhang, X.; Xu, J.; Feng, C.; Guan, S.; Yao, Y.; Jia, K. Quantification of the urbanization impacts on solar dimming and brightening over China. Environ. Res. Lett. 2022, 17, 084001. [Google Scholar] [CrossRef]
  32. Wang, J.; Xu, H.; Ye, J.; Yan, M.; Shen, W.; Zhang, J.; Huang, F.; Sang, J. Mobile-agent: Autonomous multi-modal mobile device agent with visual perception. arXiv 2024. [Google Scholar] [CrossRef]
  33. Rizwan, M.; Wan, W.; Cervantes, O.; Gwiazdzinski, L. Using location-based social media data to observe check-in behavior and gender difference: Bringing weibo data into play. ISPRS Int. J. Geo-Inf. 2018, 7, 196. [Google Scholar] [CrossRef]
  34. Sheng, J.; He, Y.; Lu, T.; Wang, F.; Huang, Y.; Leng, B.; Zhang, X.; Chen, Y. Exploring Urban Vitality Characteristics and Interactive Mechanisms at the Community Scale through the Lens of Human Behaviour: A Case Study of Chongqing, China. ISPRS Ann. Photogramm. Remote Sens. Spat. Inf. Sci. 2024, X-4–2024, 303–310. [Google Scholar] [CrossRef]
  35. Kim, S. Urban vitality, urban form, and land use: Their relations within a geographical boundary for walkers. Sustainability 2020, 12, 10633. [Google Scholar] [CrossRef]
  36. Mouratidis, K. Built environment and social well-being: How does urban form affect social life and personal relationships? Cities 2018, 74, 7–20. [Google Scholar] [CrossRef]
  37. Bardhan, R.; Kurisu, K.; Hanaki, K. Does compact urban forms relate to good quality of life in high density cities of India? Case of Kolkata. Cities 2015, 48, 55–65. [Google Scholar] [CrossRef]
  38. Katz, P.; Scully, V.; Bressi, T.W. The New Urbanism: Toward an Architecture of Community; McGraw-Hill: New York, NY, USA, 1994. [Google Scholar]
  39. Berghauser Pont, M.; Haupt, P. Spacematrix: Space, Density and Urban Form—Revised Edition; TU Delft Open: Delft, The Netherlands, 2023. [Google Scholar]
  40. Tian, L.; Ge, B.; Li, Y. Impacts of state-led and bottom-up urbanization on land use change in the peri-urban areas of Shanghai: Planned growth or uncontrolled sprawl? Cities 2017, 60, 476–486. [Google Scholar] [CrossRef]
  41. Song, Y.; Knaap, G.-J. Measuring urban form: Is portland winning the war on sprawl? J. Am. Plan. Assoc. 2004, 70, 210–225. [Google Scholar] [CrossRef]
  42. Ritsema Van Eck, J.; Koomen, E. Characterising urban concentration and land-use diversity in simulations of future land use. Ann. Reg. Sci. 2008, 42, 123–140. [Google Scholar] [CrossRef]
  43. Ewing, R.; Cervero, R. Travel and the built environment: A meta-analysis. J. Am. Plan. Assoc. 2010, 76, 265–294. [Google Scholar] [CrossRef]
  44. Gehrke, S.R.; Clifton, K.J. Toward a spatial-temporal measure of land-use mix. J. Transp. Land Use 2015, 9, 171–186. [Google Scholar] [CrossRef]
  45. Mavoa, S.; Eagleson, S.; Badland, H.M.; Gunn, L.; Boulange, C.; Stewart, J.; Giles-Corti, B. Identifying appropriate land-use mix measures for use in a national walkability index. J. Transp. Land Use 2018, 11, 681–700. [Google Scholar] [CrossRef]
  46. Shen, X.; Kong, J.; Song, Y.; Wang, X.; Mosey, G. Optimizing the environmental design and management of public green spaces: Analyzing urban infrastructure and long-term user experience with a focus on streetlight density in the city of Las Vegas, NV. Inf. Fusion 2025, 118, 102914. [Google Scholar] [CrossRef]
  47. Ratti, C.; Frenchman, D.; Pulselli, R.M.; Williams, S. Mobile landscapes: Using location data from cell phones for urban analysis. Environ. Plan. B Plan. Des. 2006, 33, 727–748. [Google Scholar] [CrossRef]
  48. Kang, C.; Fan, D.; Jiao, H. Validating activity, time, and space diversity as essential components of urban vitality. Environ. Plan. B Urban Anal. City Sci. 2021, 48, 1180–1197. [Google Scholar] [CrossRef]
  49. Ma, G.; Pellegrini, P.; Wu, H.; Han, H.; Wang, D.; Chen, J. Impact of Land-Use Mixing on the Vitality of Urban Parks: Evidence from Big Data Analysis in Suzhou, Yangtze River Delta Region, China. J. Urban Plan. Dev. 2023, 149, 04023045. [Google Scholar] [CrossRef]
  50. Shen, X.; Chen, M.; Ge, M.; Padua, M.G. Examining the conceptual model of potential urban development patch (Pudp), vocs, and food culture in urban ecology: A case in chengdu, china. Atmosphere 2022, 13, 1369. [Google Scholar] [CrossRef]
  51. Jiang, S.; Alves, A.; Rodrigues, F.; Ferreira, J.; Pereira, F.C. Mining point-of-interest data from social networks for urban land use classification and disaggregation. Comput. Environ. Urban Syst. 2015, 53, 36–46. [Google Scholar] [CrossRef]
  52. Andrade, R.; Alves, A.; Bento, C. Poi mining for land use classification: A case study. ISPRS Int. J. Geo-Inf. 2020, 9, 493. [Google Scholar] [CrossRef]
  53. Wu, R.; Wang, J.; Zhang, D.; Wang, S. Identifying different types of urban land use dynamics using Point-of-interest (Poi) and Random Forest algorithm: The case of Huizhou, China. Cities 2021, 114, 103202. [Google Scholar] [CrossRef]
  54. Louw, E.; Bruinsma, F. From mixed to multiple land use. J. Hous. Built Environ. 2006, 21, 1–13. [Google Scholar] [CrossRef]
  55. Zhang, X.; Li, X.; Liu, H.; Song, Y.; Gao, M. Research on urban thermal environment differentiation based on functional zones—Take four districts of Dalian as an example. Urban Clim. 2024, 58, 102152. [Google Scholar] [CrossRef]
  56. Hu, Q.; Shen, W.; Yan, J.; Kong, W.; Li, W.; Zhang, Z. Does existing mixed land development promote the urban spatial composite function? Evidence from Beijing, China. Land Use Policy 2024, 143, 107212. [Google Scholar] [CrossRef]
  57. Mouratidis, K.; Poortinga, W. Built environment, urban vitality and social cohesion: Do vibrant neighborhoods foster strong communities? Landsc. Urban Plan. 2020, 204, 103951. [Google Scholar] [CrossRef]
  58. Wu, L.; Yang, J.; Tian, Z.; Wang, Y.; Zhang, R.; Cao, D. Research on urban vitality changes in the short period of time before and after the outbreak of the epidemic—Taking zhengzhou as an example. IEEE Access 2023, 11, 118427–118442. [Google Scholar] [CrossRef]
  59. Zhang, J.; Liu, X.; Tan, X.; Jia, T.; Senousi, A.M.; Huang, J.; Yin, L.; Zhang, F. Nighttime Vitality and Its Relationship to Urban Diversity: An Exploratory Analysis in Shenzhen, China. IEEE J. Sel. Top. Appl. Earth Obs. Remote Sens. 2022, 15, 309–322. [Google Scholar] [CrossRef]
  60. Elliott, H.; Eon, C.; Breadsell, J. Improving City Vitality through Urban Heat Reduction with Green Infrastructure and Design Solutions: A Systematic Literature Review. Buildings 2020, 10, 219. [Google Scholar] [CrossRef]
  61. Ma, Q.; Zhang, J.; Li, Y. Advanced Integration of Urban Street Greenery and Pedestrian Flow: A Multidimensional Analysis in Chengdu’s Central Urban District. ISPRS Int. J. Geo-Inf. 2024, 13, 254. [Google Scholar] [CrossRef]
  62. Chen, M.; Cai, Y.; Guo, S.; Sun, R.; Song, Y.; Shen, X. Evaluating implied urban nature vitality in San Francisco: An interdisciplinary approach combining census data, street view images, and social media analysis. Urban For. Urban Green. 2024, 95, 128289. [Google Scholar] [CrossRef]
  63. Zhao, R.; Song, Y.; Guo, S.; Guo, Z.; Shen, X. Unraveling the relationships between urban park characteristics and visit durations: A longitudinal smartphone behavior survey in Austin. Urban For. Urban Green. 2025, 105, 128706. [Google Scholar] [CrossRef]
  64. Wang, X.; Bai, T.; Yang, Y.; Wang, G.; Tian, G.; Kollányi, L. A Multi-Scenario Analysis of Urban Vitality Driven by Socio-Ecological Land Functions in Luohe, China. Land 2024, 13, 1330. [Google Scholar] [CrossRef]
  65. Meng, Y.; Xing, H. Exploring the relationship between landscape characteristics and urban vibrancy: A case study using morphology and review data. Cities 2019, 95, 102389. [Google Scholar] [CrossRef]
  66. Zumelzu, A.; Heskia, C.; Herrmann-Lunecke, M.G.; Vergara, G.; Estrada, M.; Jara, C. Street design elements that influence mental well-being: Evidence from southern chile. Land 2024, 13, 1398. [Google Scholar] [CrossRef]
  67. Zhou, L.; Zhao, Z.; He, Q.; Du, J.; Mu, F.; Ma, W.; Guan, D.; Zhang, X. RMCVI: A Refined Urban Vitality Perception Index Considering Mountain Characteristics. Trans. GIS 2025, 29, e13292. [Google Scholar] [CrossRef]
  68. Kim, Y.-L. Data-driven approach to characterize urban vitality: How spatiotemporal context dynamically defines Seoul’s nighttime. Int. J. Geogr. Inf. Sci. 2020, 34, 1235–1256. [Google Scholar] [CrossRef]
  69. Xia, C.; Zhang, A.; Yeh, A.G.O. The varying relationships between multidimensional urban form and urban vitality in chinese megacities: Insights from a comparative analysis. Ann. Am. Assoc. Geogr. 2022, 112, 141–166. [Google Scholar] [CrossRef]
  70. Zhang, A.; Li, W.; Wu, J.; Lin, J.; Chu, J.; Xia, C. How can the urban landscape affect urban vitality at the street block level? A case study of 15 metropolises in China. Environ. Plan. B Urban Anal. City Sci. 2021, 48, 1245–1262. [Google Scholar] [CrossRef]
  71. Zeng, Z.; Li, Y.; Tang, H. Multidimensional spatial driving factors of urban vitality evolution at the subdistrict scale of changsha city, china, based on the time series of human activities. Buildings 2023, 13, 2448. [Google Scholar] [CrossRef]
  72. National Geomatics Center of China. National Geomatics Center of China. Available online: http://www.ngcc.cn (accessed on 8 March 2025).
  73. Baidu Maps. Baidu Maps. Available online: https://map.baidu.com (accessed on 1 January 2025).
  74. WebMap.cn. WebMap.cn. Available online: https://www.webmap.cn/main.do?method=index (accessed on 1 December 2024).
  75. Amap. Amap. Available online: http://ditu.amap.com (accessed on 1 December 2024).
  76. Ling, Z.; Zheng, X.; Chen, Y.; Qian, Q.; Zheng, Z.; Meng, X.; Kuang, J.; Chen, J.; Yang, N.; Shi, X. The Nonlinear Relationship and Synergistic Effects between Built Environment and Urban Vitality at the Neighborhood Scale: A Case Study of Guangzhou’s Central Urban Area. Remote Sens. 2024, 16, 2826. [Google Scholar] [CrossRef]
  77. Wang, B.; Loo, B.P.; Zhen, F.; Xi, G. Urban resilience from the lens of social media data: Responses to urban flooding in Nanjing, China. Cities 2020, 106, 102884. [Google Scholar] [CrossRef]
  78. Shi, P.; Xiao, Y.; Zhan, Q. A Study on Spatial and Temporal Aggregation Patterns of Urban Population in Wuhan City Based on Baidu Heat Map and POI Data. IRSPSD Int. 2020, 8, 101–121. [Google Scholar] [CrossRef]
Figure 1. Research workflow.
Land 14 01309 g001
Figure 2. Baidu heat map of the Guangzhou Baiyun District for 12 months in 2024.
Land 14 01309 g002
Figure 3. Hotspot analysis results.
Land 14 01309 g003
Figure 4. Cluster analysis results.
Land 14 01309 g004
Table 2. Data sources.
Points, Polyline, PolygonSubjectsSourcesDefinition
PointsPOIs[75]Represents various types of functional facilities that contain information, categories, and other attributes of the location.
PolylineStreet elements[73]High-definition panoramic images of selected city streets can be viewed.
Traffic[72]Including all types of road information such as national, provincial, rural roads, railway tracks, etc.
PolygonLand use[74]The current area dimension and proportion of specific land use types.
Heat map[73]Through the degree of color change, an intuitive response to the distribution of hot spots, regional aggregation, and other data information can reflect the degree of concentration of pedestrian flow, etc.
Table 3. Classification and definitions of POIs.
CategorySubcategoryDefinition/Description
CPOIHotelsEstablishments that provide lodging, typically offering additional services such as meals and room service, often located in city centers or tourist areas.
RestaurantsBusinesses that prepare and serve food and drinks to customers, ranging from casual eateries to fine dining establishments.
ParksPublic green spaces designed for recreation, leisure, and aesthetic enjoyment, often featuring gardens, walking paths, and playgrounds.
HPOIVillage OutpostsService points or offices located in rural areas, providing essential services and support to local communities.
High-rise BuildingsTall structures with multiple floors, used for residential, commercial, or mixed purposes, often defining a city’s skyline.
TownsSmall urban areas larger than villages but smaller than cities, characterized by a concentrated population and local governance.
OPOICorporate Service AreasZones designated for business operations, including office buildings and related facilities that support corporate activities.
SchoolsInstitutions dedicated to education, providing instruction to students at various levels, from elementary to higher education.
PharmaciesRetail stores where medicinal drugs are dispensed and sold, often offering health-related products and advice.
Medical FacilitiesInstitutions such as hospitals and clinics provide healthcare services, including diagnosis, treatment, and preventive care.
BanksFinancial institutions that offer services such as deposits, loans, and currency exchange play a crucial role in the economy.
Government InstitutionsOrganizations that administer public services and enforce regulations, operating at various levels of government.
TPOIEntrancesPoints of access and egress for buildings or areas, designed to manage the flow of people and vehicles.
Bus Stops Designated locations where buses halt to pick up and drop off passengers, facilitating public transportation.
Toll StationsFacilities where fees are collected for the use of certain roads, bridges, or tunnels, often to fund maintenance and construction.
Parking LotsDesignated areas for vehicle parking, which can be open-air or multi-level structures, providing space for cars in urban and commercial areas.
Table 4. Classification and definitions of roads.
CategorySubcategoryDefinition/Description
ExpresswayHighwaysHigh-speed roads designed for fast travel between major cities, typically with multiple lanes and limited access points.
RailwaysRailroadsTracks and associated infrastructure used for train travel, including passenger and freight services.
Arterial RoadsNational HighwaysMajor roads that connect different regions or provinces within a country, maintained by the national government.
Provincial HighwaysRoads that connect cities and towns within a province, maintained by provincial authorities.
County and Rural RoadsCounty RoadsRoads that serve counties, connecting smaller towns and rural areas within a county.
Township RoadsLocal roads that serve townships and rural communities, often maintained by local governments.
Urban RoadsPrimary Urban RoadsMajor roads within a city that handle high traffic volumes and connect key areas.
Secondary Urban RoadsRoads that serve as important connectors within urban areas but carry less traffic than primary roads.
Tertiary Urban RoadsLocal roads within neighborhoods, providing access to residential and commercial areas.
Quaternary Urban RoadsMinor roads and streets that serve very localized areas, often with low traffic volumes.
Table 5. Classification and definitions of land use.
CategorySubcategoryDefinition/Description
Cropland1Land used for growing crops, including paddy fields, dry farmland, orchards, and cash crop areas, serving as the primary land type for human food and agricultural production.
Forest2Land covered by natural or artificial forests, including tree forests, shrub forests, and bamboo forests, with significant ecological functions, carbon sequestration, and economic value.
Shrub3Land dominated by shrub vegetation, typically found in arid or semi-arid regions, and an important component of ecosystems.
Grassland4Land dominated by herbaceous plants, including natural and artificial grasslands, primarily used for grazing, ecological conservation, or biodiversity maintenance.
Water5Includes rivers, lakes, reservoirs, ponds, and surrounding wetlands, serving as a critical component of water resources and ecosystems.
Snow/Ice6Land covered by snow or ice year-round or seasonally, mainly distributed in high-latitude or high-altitude regions, playing a significant role in climate regulation and water storage.
Barren7Land that is unused or difficult to utilize, including deserts, Gobi, bare rocks, and saline-alkali land, typically with low ecological and economic value.
Impervious8Impermeable surfaces, including urban roads, buildings, plazas, and other artificial hardened surfaces, often closely related to urban development.
Wetland9Land permanently or seasonally covered by water, including swamps, peatlands, and tidal flats, with important ecological functions and water resource regulation roles.
Table 6. Results of OLS.
VariablesCoefficientSEp-Value (* p Values < 0.05)
Intercept4.0110.4890.000 *
Hotels0.4950.1460.001 *
Restaurants−0.0860.0540.112
Parks0.6050.4850.212
Village Outposts−1.1200.2180.000 *
High-rise Buildings0.3050.2710.261
Towns0.1160.9100.898
Corporate Service Areas0.0980.0190.000 *
Schools0.2040.1220.094
Pharmacies0.6770.1000.000 *
Medical Facilities0.0510.1430.722
Banks0.0010.0980.990
Government Institutions−0.3330.1970.091
Entrances−0.2320.2580.369
Bus Stops−0.0050.0460.907
Toll Stations0.0850.1830.643
Parking Lots−0.4190.2170.053
Highways0.0000.0000.000 *
Railroads0.0020.0010.003 *
National Highways0.0000.0000.090
Provincial Highways−0.0000.0000.123
County Roads0.0000.0000.978
Township Roads−0.0010.0000.009 *
Primary Urban Roads0.0010.0000.000 *
Secondary Urban Roads0.0010.0000.000 *
Tertiary Urban Roads0.0020.0000.000 *
Quaternary Urban Roads0.0010.0000.000 *
Cropland−0.4040.5000.419
Forest−0.5890.4960.235
Grassland−5.1525.1890.321
Water−0.5460.5970.361
Barren−7.36716.6460.658
Impervious−0.4970.4980.319
Disclaimer/Publisher’s Note: The statements, opinions and data contained in all publications are solely those of the individual author(s) and contributor(s) and not of MDPI and/or the editor(s). MDPI and/or the editor(s) disclaim responsibility for any injury to people or property resulting from any ideas, methods, instructions or products referred to in the content.

