Article

From a Coal Mining Area to a Wetland Park: How Is the Social Landscape Performance in Pan’an Lake National Wetland Park?

1
School of Mechanics and Civil Engineering, China University of Mining and Technology, Xuzhou 221116, China
2
Jiangsu Collaborative Innovation Center for Building Energy Saving and Construct Technology, Jiangsu Vocational Institute of Architectural Technology, Xuzhou 221116, China
3
Technology Innovation Center for Ecological Restoration of Mining Region, Department of Natural Resources of Jiangsu Province, Xuzhou 221116, China
4
School of Architecture and Design, China University of Mining and Technology, Xuzhou 221116, China
*
Author to whom correspondence should be addressed.
Land 2025, 14(6), 1305; https://doi.org/10.3390/land14061305
Submission received: 19 May 2025 / Revised: 11 June 2025 / Accepted: 17 June 2025 / Published: 19 June 2025
(This article belongs to the Section Landscape Ecology)

Abstract

The increasing development of coal mining subsidence wetland parks has led to a growing focus on assessing their ecological, economic, and social benefits following ecological restoration. This study establishes an assessment framework for the social landscape performance of coal mining subsidence wetland parks based on the landscape performance series (LPS), cultural ecosystem services (CES), and the unique characteristics of coal mining subsidence wetland parks. The framework integrates expert opinions and field research to select indicators, resulting in a comprehensive evaluation system comprising 28 indicators across five dimensions. Taking the Pan’an Lake National Wetland Park (PLNWP) in Xuzhou, China, as an example, we conducted empirical research by collecting data through questionnaires and on-site interviews. Using the fuzzy comprehensive evaluation method, the social landscape performance score of PLNWP was 3.511, which is rated as “good.” The importance–performance analysis (IPA) was applied to identify differences in the perceptions of visitors and local residents regarding the social landscape performance of the PLNWP. Local residents highlighted the need to enhance the amenity of waterside spaces, while visitors focused on the accessibility. Finally, based on the performance score and the perceptions from different stakeholders, optimization strategies were proposed in four aspects: enhancing waterside space amenity, optimizing accessibility, improving educational facilities, and addressing diverse user needs. This study could provide a feasible assessment framework and optimization guidance for other coal mining subsidence wetland parks.

1. Introduction

In China’s eastern Huanghuai plain, the groundwater table is relatively high. Underground coal mining activities have led to frequent ground subsidence. This has created numerous coal mining subsidence wetlands. These wetlands have gradually evolved into unique water–land composite ecosystems [1]. Coal mining subsidence wetland parks serve as an ecological restoration method for post-mining landscapes. Researchers have been focused on the issues caused by the subsidence wetlands, such as the evolution of coal mining subsidence wetland distribution [2], water pollution [3], farmland destruction [4], vegetation productivity decline [5], and animal habitat loss [6]. However, coal mining subsidence wetlands are believed to offer significant environmental, economic, and social value after restoration since they are a special part of the urban green space system. Many studies have addressed that coal mining wetlands not only enhance the function of the ecosystem service but also play a crucial role in maintaining the history and culture, promoting ecological civilization, and shaping the image of the city [7,8]. For example, they are reused by local residents and have become a new impetus for urban ecotourism in Xuzhou [9], Huaibei [10], Jining [11] and many other coal resource-based cities [12,13] in China.
Coal mining subsidence wetland parks development relies not only on planning and construction by the government or mining companies, but also on multi-stakeholder public management. Therefore, researchers have focused on the multiple benefits generated by post-mining landscapes after ecological restoration and have conducted theoretical and practical studies, including the planning and design based on their ecological, economic, landscape aesthetic, and historical and cultural values [14,15,16], as well as visitor preferences [17,18] and benefit assessments [19,20]. As research has deepened, methods for measuring the effectiveness of these parks have also improved. Hine Ameli [21] measured the social and economic values of the Lick Creek mine in Australia through semi-structured interviews to obtain users’ subjective perceptions. K Svobodova et al. [22] measured landscape aesthetic value by combining online questionnaires with landscape visual quality assessments in the North Bohemian Brown Coal Basin. Additionally, Wang et al. [9] uses environmental economic theory, geographic information system (GIS) raster calculations, and geostatistics methods to conduct value assessments for artificial wetlands derived from mining subsided lakes. Singh and Kumar [23] proposed reducing the impacts of coal mining subsidence wetlands on surrounding communities through monitoring and control measures and integrating detailed geographical data into urban planning to achieve coordinated development.
The social value of the reconstructed post-mining landscape in terms of evaluation and perception of users has rarely been the subject of in-depth research. The landscape performance series (LPS) has been introduced as an effective evaluation tool to quantitatively assess the sustainable benefits of urban green space projects [24,25]. Tanar [26] analyzed and evaluated the social benefits and their influencing factors of two urban landscape projects through on-site observations, supplemented by secondary data obtained from the literature and relevant personnel. Church [27] assessed the social benefits of green streets with rain gardens using data analysis based on questionnaires. In the research on evaluation tools, the landscape architecture foundation (LAF) launched the Landscape Performance Series Benefit Toolkit, which includes assessment tools for ecological, social, and economic performance. This toolkit aims to transform basic data into quantifiable benefits. The tools for ecological and economic performance are more comprehensive, while the methods for social performance assessment are more complex and lack readily available tools related to specific indicators [28]. Therefore, many scholars continue to explore this area. Veitch et al. [29] found that the usage of parks in Victoria, Australia, significantly increased after improvements. Yang Bo et al. [30] evaluated two residential landscape designs based on visual and bioclimatic analyses, providing a method for measuring social-level landscape performance. Overall, research on the evaluation of coal mining subsidence wetland parks still has some limitations: (1) The research content mostly focuses on quantitative calculations of ecological and economic benefits, lacking a comprehensive and robust set of social benefit evaluation indicators. (2) The scope of study is often defined by the boundaries of the coal mining subsidence wetland parks, with few studies determining the park’s walkable catchment area from the residents’ perspectives. (3) The research methods mostly involve quantitative or qualitative analysis of single values, and further in-depth research is needed on qualitative assessments of social benefits that integrate multiple values.
This study used mixed methods and built a social landscape performance framework to quantify and characterize subsidence wetland park performance. The guiding research question was the following: “How is the social landscape performance of the Pan’an Lake National Wetland Park, and in what ways do local residents and tourists differ in their perceptions of the park”? This question was investigated through local residents’ and tourists’ assessments of social demand for and experiences in response to subsidence wetland park. The findings are expected to provide transferable criteria for assessing and optimizing social landscape performance in similar degraded landscapes across China.

2. Overview and History of the Pan’an Lake National Wetland Park

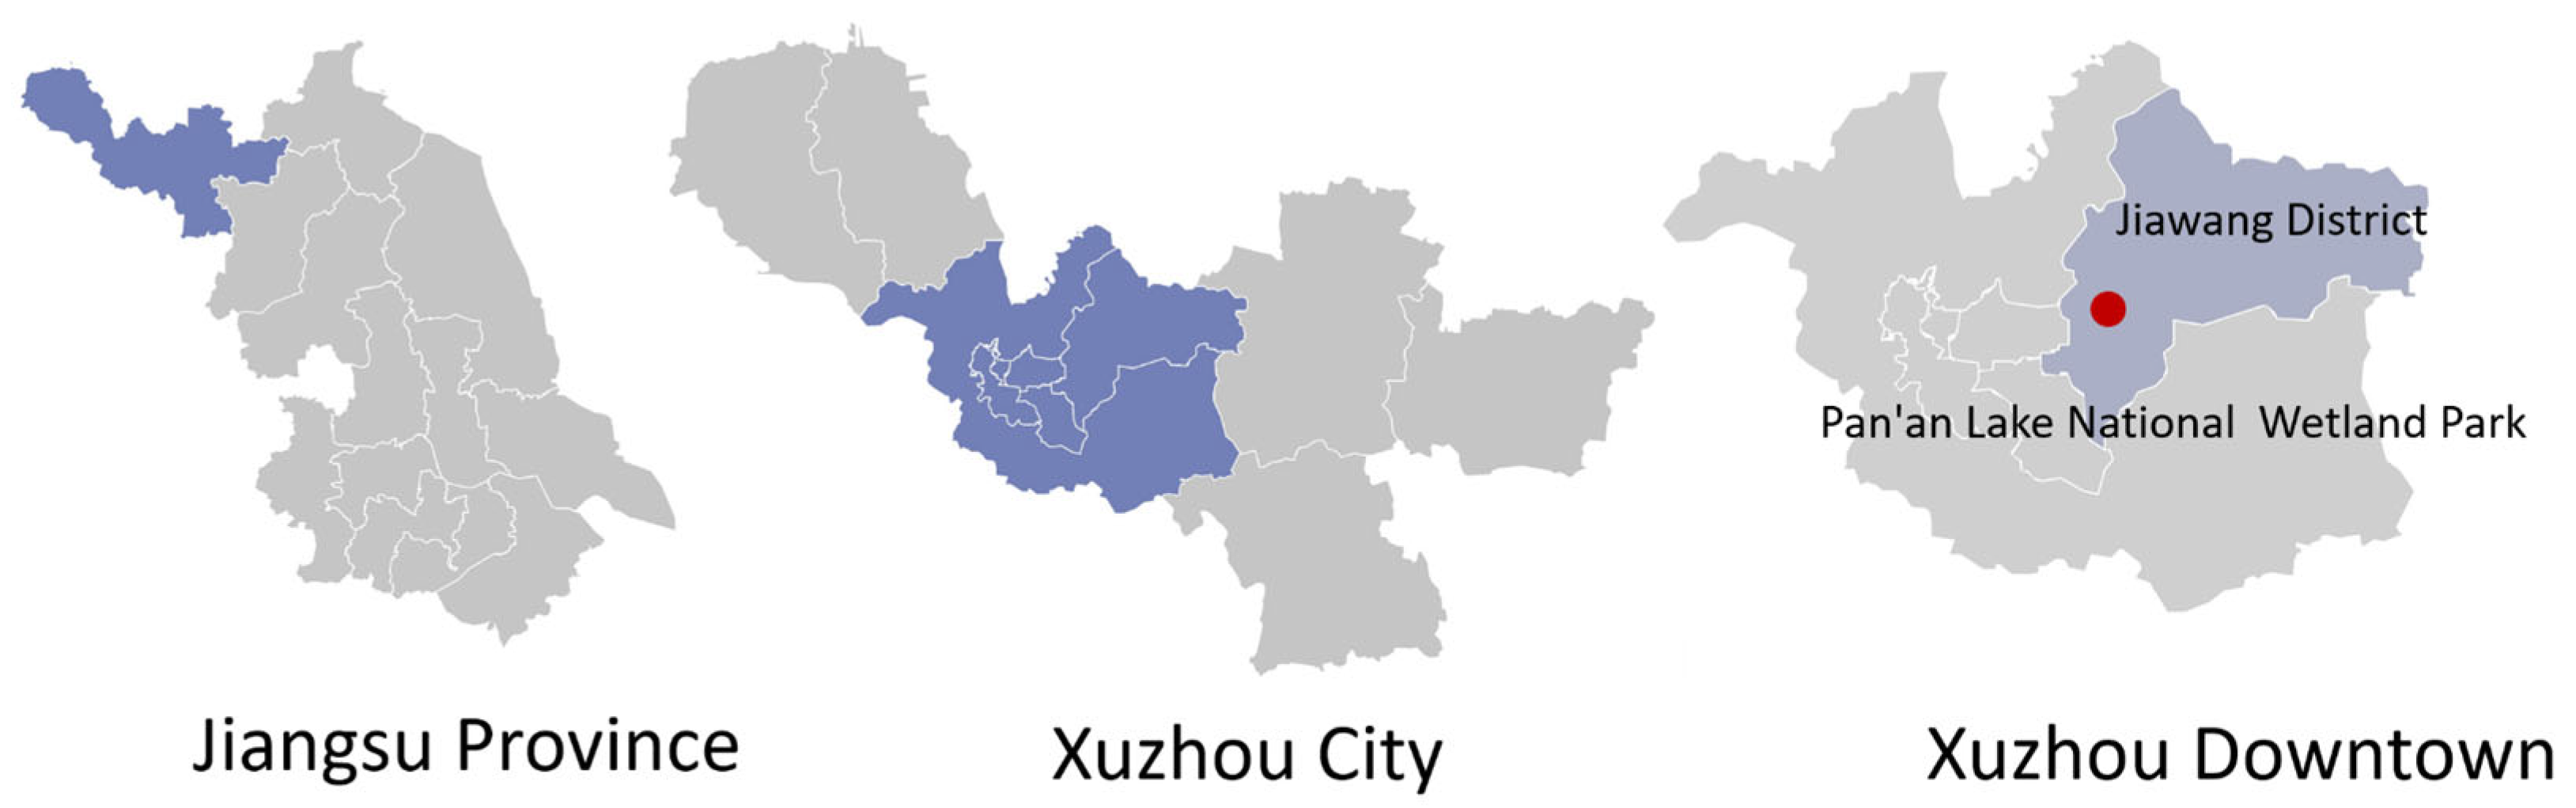
2.1. Overview of Study Area

The Pan’an Lake National Wetland Park (PLNWP) is located in the southwest of Jiawang District, Xuzhou, Jiangsu Province, China (Figure 1). This coal mining subsidence area is the largest and most concentrated subsidence region in Xuzhou, with a total subsidence area of about 1160 hectares and an average depth of over 4 m. To address the severe environment and prominent human–land conflicts in the Pan’an Lake area, the Xuzhou Municipal Committee and the People’s Government initiated a comprehensive restoration project for the coal mining subsidence area in 2001. The project involved deepening and filling to transform the subsidence wetland areas into ponds for fisheries. The construction of the wetland park began in April 2011 and opened to the public in October 2012. In 2017, it became one of the first ten national wetland tourism demonstration bases.
The park covers a total area of 466.7 hectares and includes five functional zones: wetland conservation area, wetland restoration area, publicity science exhibition area, leisure experience area, and management service area (Figure 2). The wetland conservation and restoration areas together account for 311.7 hectares, or 66.8% of the total park area. The park attracts visitors through its innovative and orderly open spaces and waterside areas. It creates a city landmark for ecological tourism by integrating material spatial elements such as water landscapes, waterside shorelines, plant diversity, and rich landscape features. The construction of the wetland park not only improves the mining area’s environment but also provides surrounding residents with green spaces for leisure, entertainment, and social interaction. It also increases employment rates, improves infrastructure, and enhances the living environment.

2.2. Construction and Development of Pan’an Lake National Wetland Park

PLNWP was previously the subsidence area of the Quantai and Qishan Coal Mine. After ecological restoration, it successfully transformed into the national wetland park and subsequently received national honors such as Water Conservancy Scenic Area and Ecological Demonstration Base, becoming a key development area in Jiawang District. However, the reuse and redevelopment of this areas experienced a long time that could be divided into four stages as follows.
(1)
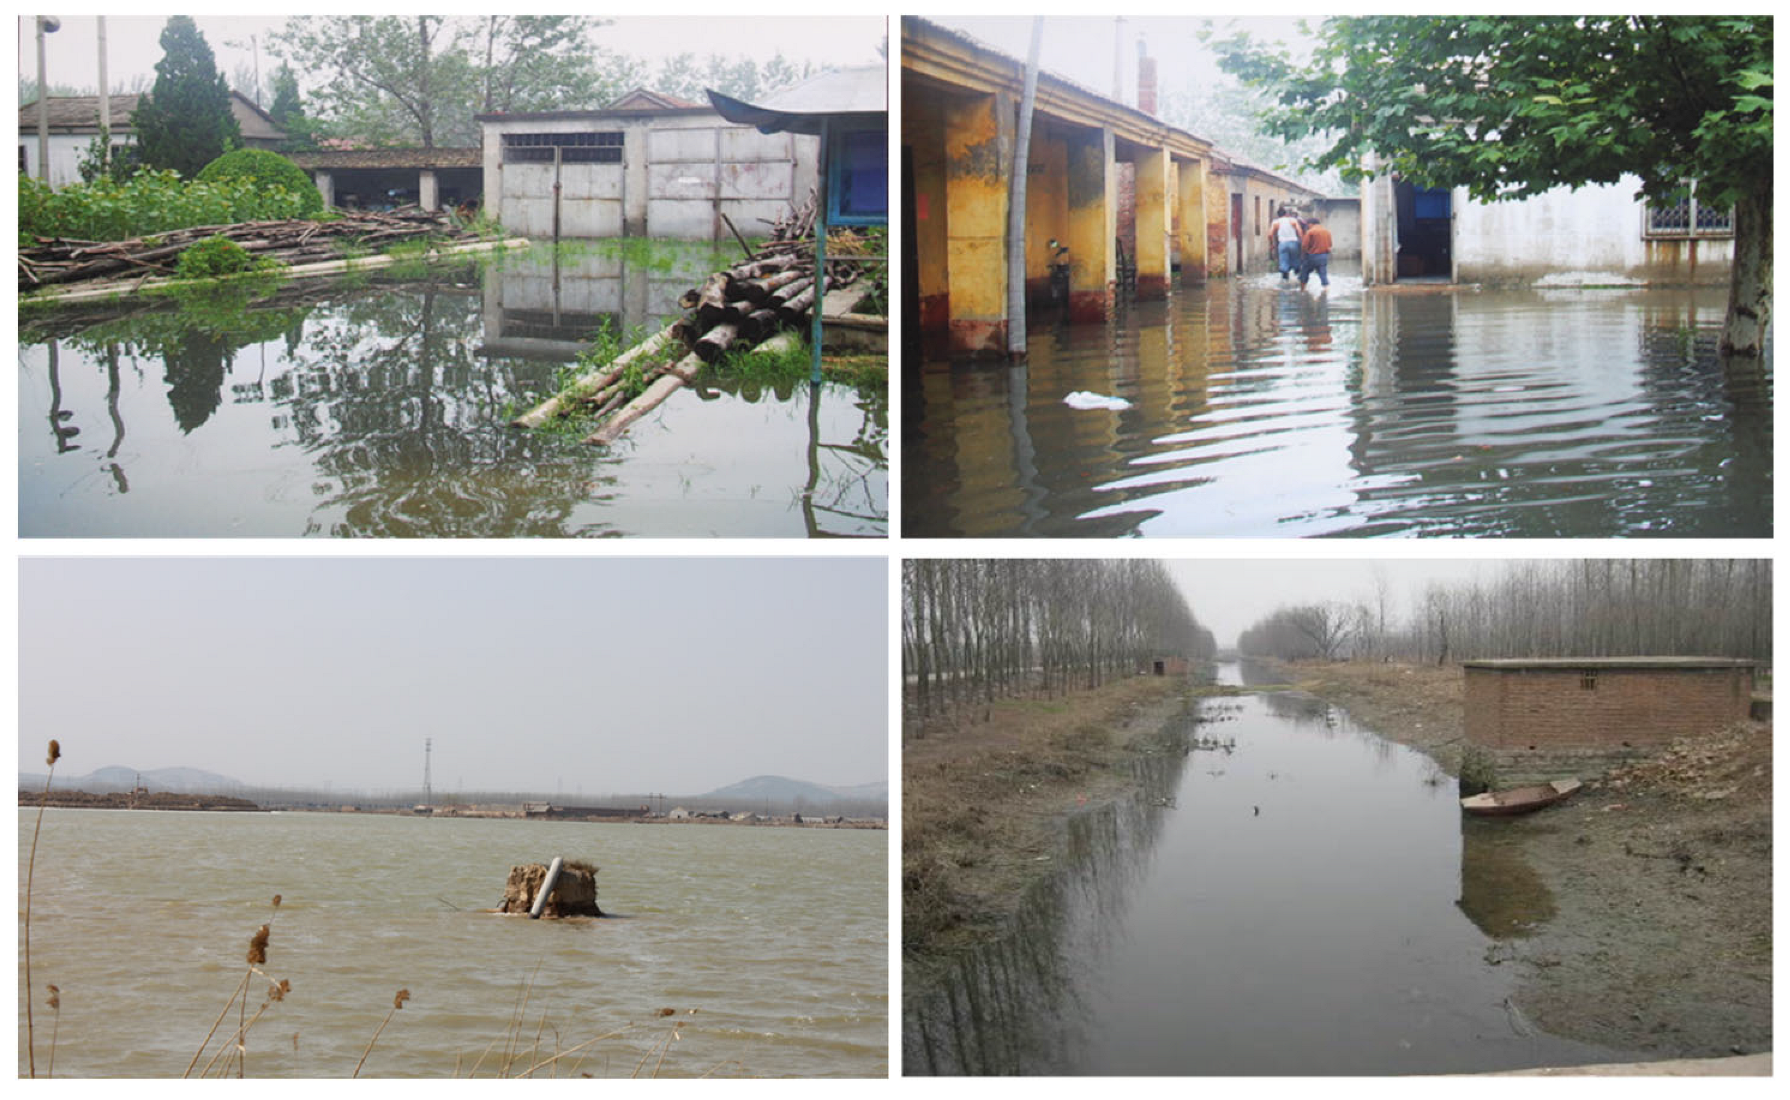
Land Reclamation and Remediation (2000–2008)
From 2001, the Xuzhou Municipal Committee and the People’s Government initiated a comprehensive remediation project for the coal mining subsidence area to address the severe ecological environment and prominent human–land conflicts. The project involved deepening and filling to transform the subsidence wetland areas into ponds for fisheries. During this period, the overall environment of the subsidence wetland was chaotic, with sparse vegetation. Some shallow water-accumulated areas had overgrown weeds in summer and dust in dry seasons due to soil compaction (Figure 3). The locals described the environment as muddy in the rain and dusty in the sun.
(2)
Ecological Restoration Planning and Construction (2009–2012)
In 2009, this area began ecological restoration, which significantly improved the environment. In 2011, the Xuzhou Municipal Committee and the People’s Government designated the Pan’an Lake coal mining subsidence area management project as the top priority for the economic and social development of Jiawang District. They proposed an integrated management approach combining “basic farmland management, coal subsidence land reclamation, environment restoration, and wetland landscape development” to transform the ecological and environmental quality of the coal mining subsidence wetland. The construction of the wetland park began in April 2011 and opened to the public in October 2012. On 14 November 2012, the Jiangsu Provincial Forestry Bureau officially approved it as the Provincial Wetland Park. The wetlands significantly increased, primarily consisting of natural wetlands such as lakes, rivers, and marshes, after the restoration project.
(3)
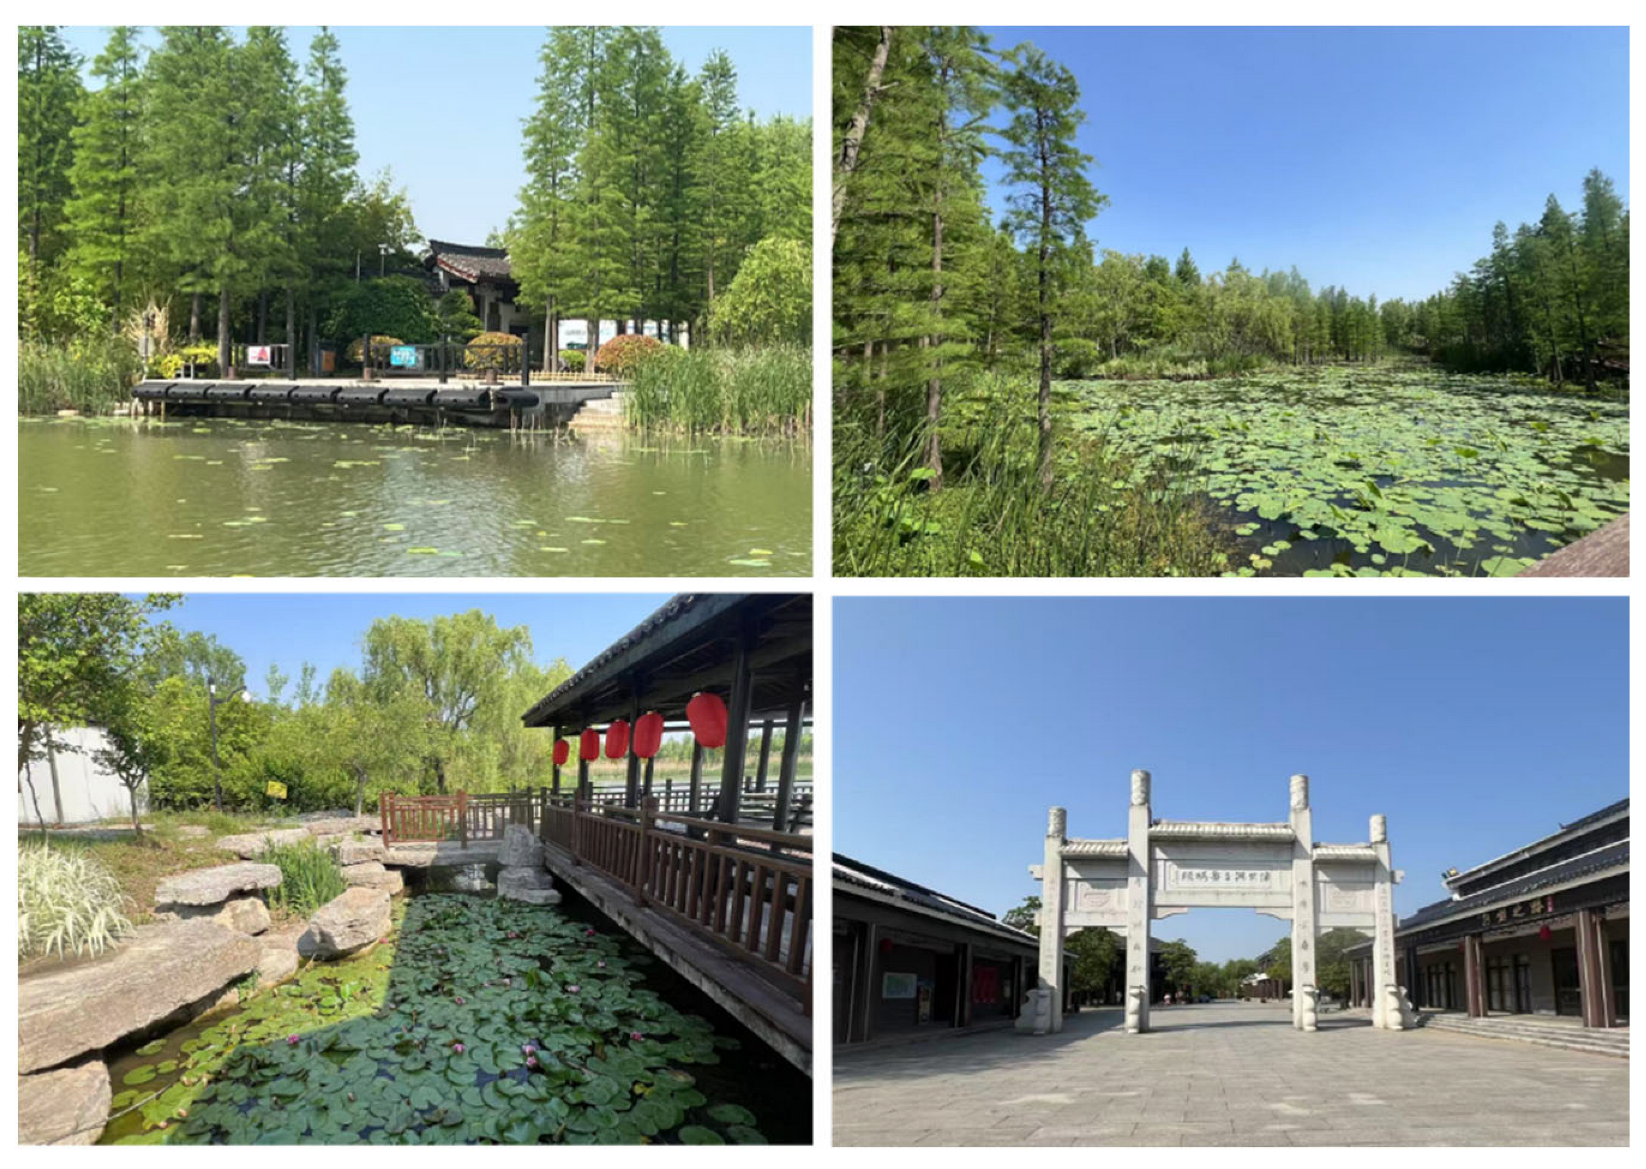
Transformation and Comprehensive Development (2013–2021)
With increasing national emphasis on ecology, the “Master Plan for Jiangsu Xuzhou Pan’an Lake National Wetland Park (2013–2020)” was developed in 2013 under the requirement of the Xuzhou Municipal Committee and People’s Government. In December 2013, the plan passed the National Forestry Administration’s review and was granted the title of National Wetland Park (pilot). By 2014, wetland park was fully constructed, marking the ecological transformation of the largest coal subsidence area in Jiawang District (Figure 4). In 2017, it became one of the first ten national wetland tourism demonstration bases. In the same year, President Xi visited the park, commending Jiawang’s successful transformation and leaving the comment that “Jiawang is truly prosperous.”
(4)
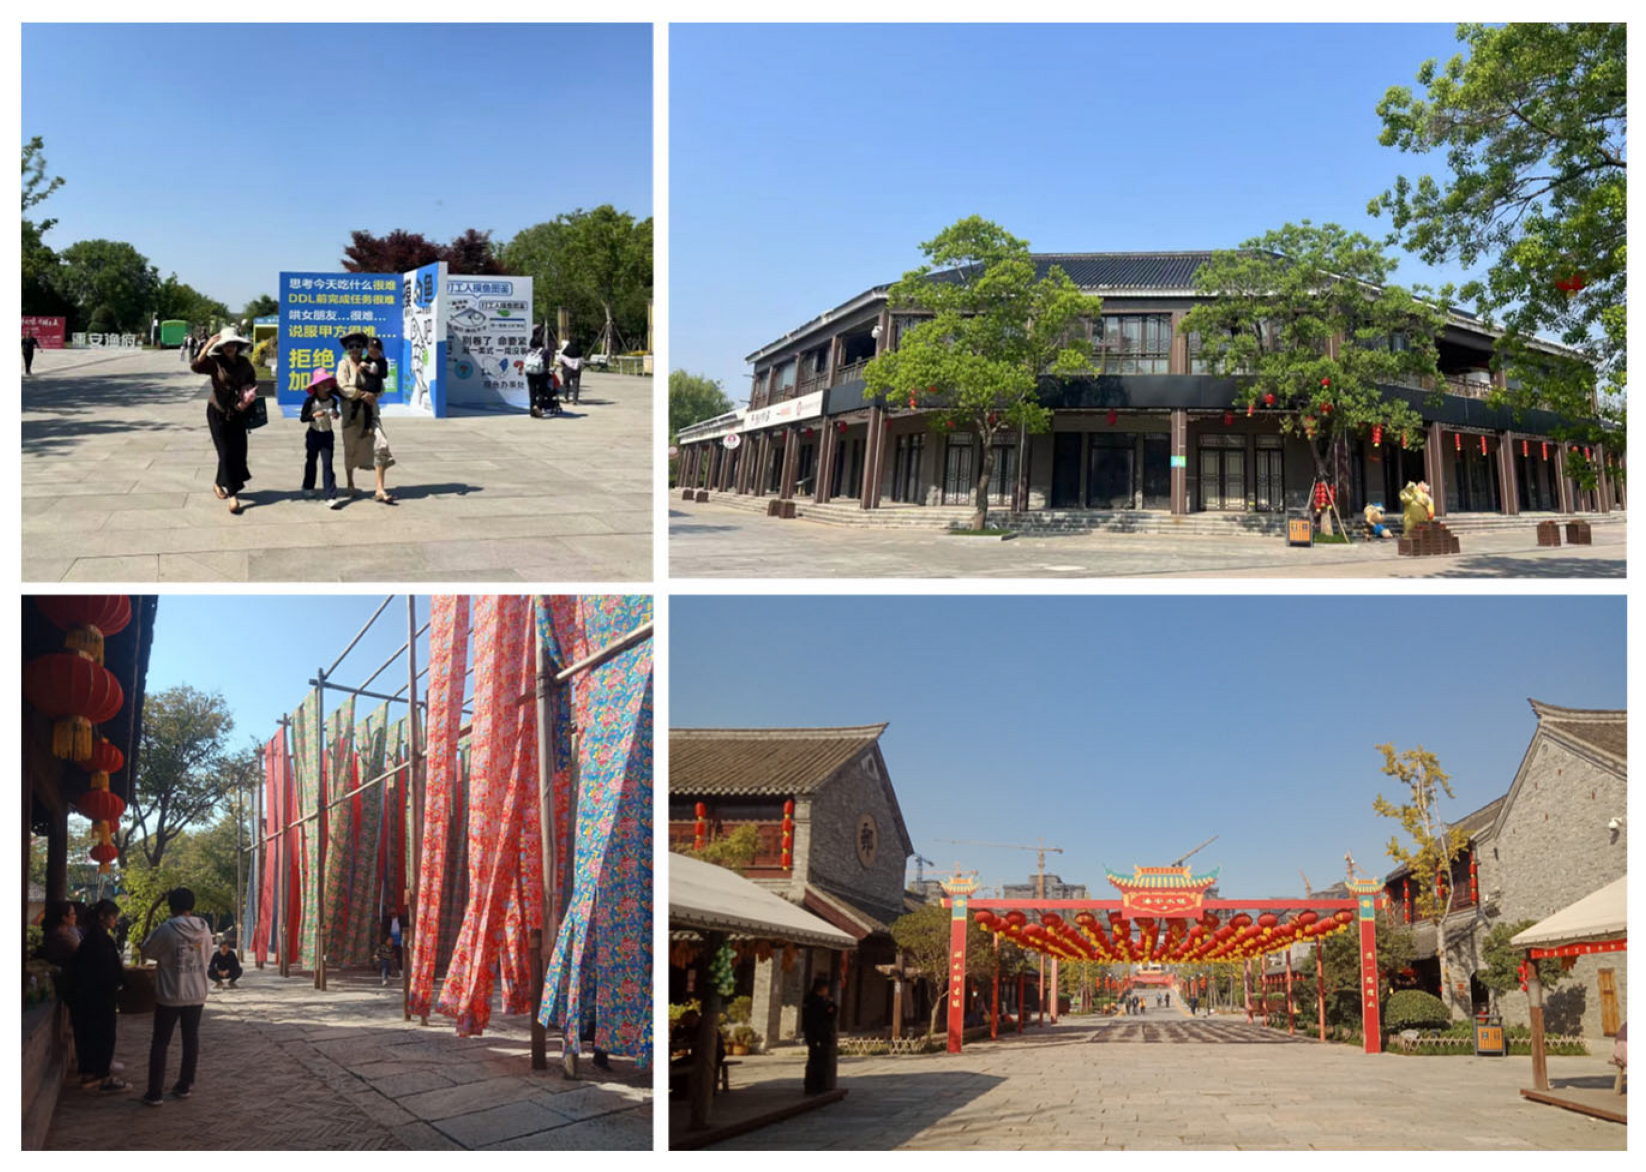
Efforts to Create a National 5A-Level Tourist Attraction (2022–Present)
The 2025 Jiawang District Government Work Report emphasized the persistent effort to create a 5A-level tourist attraction at Pan’an Lake, ensuring it passes the provincial scenic quality evaluation. The district is accelerating the operation of Pan’an Lake islands, planning events such as lakeside camping festivals and spring wave music festivals. It is also integrating resources like Pan’an Water Town, Mazhuang Cultural Fair, and the “Xuzhou Night” night city, incorporating elements such as “music, chess, calligraphy, painting, poetry, wine, tea” to create a multi-functional tourism hub for health and wellness, intangible cultural heritage experiences, and family interactions (Figure 5). The park will comprehensively upgrade in eight aspects: tourism transportation, sightseeing services, integrated services, characteristic culture, informatization, tourism safety, resource and environmental protection, and comprehensive management.

3. Materials and Methodology

3.1. Establishment of the Social Landscape Performance Conceptual Framework

The Landscape Architecture Foundation has developed a basic framework for an open-ended landscape performance series that integrates environmental, social, and economic benefits based on ecosystem service theory [28]. This study constructs an indicator set by synthesizing the social aspects and cultural ecosystem services from the well-established landscape performance series, incorporating the unique characteristics of coal mining subsidence wetland parks, and referencing evaluation standards and regulations for wetland parks. Ultimately, the social landscape performance of coal mining wetland parks was identified as five dimensions and 28 indicators (Table 1).
(1)
Indicators from Landscape Performance Series and Cultural Ecosystem Services
After reviewing the literature [24,31,32,33] and consulting experts from universities and planning and design institutes, we proposed the conceptual framework, which consisted of three aspects: the social dimension from landscape performance series and cultural ecosystem services, the unique characteristics of coal mining subsidence wetland parks, and wetland park evaluation standards and regulations. The Millennium Ecosystem Assessment (MA) categorizes ecosystem services into four types: provisioning, regulating, supporting, and cultural services. The landscape performance research framework corresponds these services to environmental, social, and economic indicators: provisioning, regulating, and supporting services are measured through environmental indicators, cultural services through social indicators, and related monetary benefits through economic indicators [34].
Using a literature review approach, we searched the CNKI database with the themes “landscape performance” and “cultural ecosystem services,” excluding irrelevant articles. We then organized the dimensions, indicators, indicator descriptions, and data acquisition methods from each article.
(2)
Characteristics of Coal Mining Subsidence Wetland Parks
The construction of the evaluation index system for coal mining subsidence wetland parks is based on its unique characteristics, selecting applicable indicators. Field research has identified several distinctive features of coal mining subsidence wetland parks:
  • Environmental quality improvement based on ecological restoration. The park’s ecological restoration not only improves the mining area’s environment but also promotes the physical and mental health of surrounding residents.
    Characteristic industrial cultural landscape. Integrating industrial cultural elements that represent the city’s history into the landscape highlights the city’s historical significance for residents and supports urban transformation.
    Regional synergistic development through ecological transition. Ecological restoration can drive synergistic development in surrounding areas, such as improving infrastructure, promoting industrial transformation, and enhancing the city’s image.
    Special status of surrounding residents. Displaced farmers, as stakeholders in park construction, benefit from improved living environments but must also adapt to the transition from rural to urban lifestyles.
(3)
Referring to wetland park evaluation standards and regulations
Drawing on evaluation standards and regulations such as the “National Wetland Park Management Measures” (2017), “Urban Wetland Park Planning and Design Guidelines (Trial)” (2017), and “National Wetland Park Assessment Scoring Criteria” (2018), further evaluations and analyses of each dimension and indicator were conducted in consultation with relevant experts.

3.2. Questionnaire Design and Distribution

(1)
Questionnaire design
This study investigates the social landscape performance from the perspectives of tourists and local residents. The questionnaire begins with an introduction to the survey’s purpose and a statement on data confidentiality. The survey is divided into two main sections: ① Respondent demographic information. This section collects basic demographic information from respondents. This data helps understand the background of respondents. To provide a comprehensive understanding of the evaluation system, it is essential to consider the characteristics of the respondents. Respondent characteristics such as age, gender, occupation, and frequency of park visits can significantly influence their perceptions and evaluations of the park. ② Importance–performance analysis of landscape performance indicators. Based on the conceptual framework, this section converts qualitative indicators into a quantitative format using a Likert 5-point scale [35,36]. Respondents are asked to rate the importance and satisfaction levels of various indicators related to the social landscape performance of PLNWP. The scale ranges from “1–5”. Specifically, the numbers on the scale are defined as follows:
1:
Very Unimportant/Very Dissatisfied;
2:
Unimportant/Dissatisfied;
3:
Neutral;
4:
Important/Satisfied;
5:
Very Important/Very Satisfied.
(2)
Questionnaire distribution
To account for variations in survey results due to different holidays and time periods, the questionnaire survey was conducted during the National Day holiday, as well as on regular weekends and weekdays afterward. Specifically, the distribution of questionnaires was as follows: National Day Holiday (4–6 October 2024): 50% of the questionnaires were distributed during this period due to higher visitor traffic. Regular weekends (13–14 and 20–21 October 2024): 25% of the questionnaires were distributed. Regular weekdays (22–26 October 2024): The remaining 25% of the questionnaires were distributed. Visitor questionnaires were distributed across various functional zones within PLNWP. Local resident questionnaires were distributed within a 1-km radius (15-min living circle) from the park boundary, covering seven surrounding communities. These included five villages (Zhenwang Village, Mazhuang Village, Xidawu Village, Pan’an Village, and Quanta Village) and two resettlement communities (Hubin Community and Runfeng Garden) (Figure 6).
The survey was conducted by five trained graduate students majoring in urban and rural planning. During the survey process, researchers provided explanations or examples for any unclear questions to ensure the quality of the responses. A total of 200 questionnaires were distributed in 2024, with 192 valid responses, resulting in a response rate of 96.00%.

3.3. Determination of Indicator Weight by Analytic Hierarchy Process (AHP)

The analytic hierarchy process (AHP) is a systematic traditional method for integrating and analyzing the views of multiple experts [37]. This study determined the indicator weights through the steps of “constructing a judgment matrix and calculating the weight, conducting a performing consistency check, and determining weights calculating the weights of each indicator.”
Initially, the indicators were structured into a judgment matrix and formatted into an electronic questionnaire, which were collected from 10 experts in the fields of urban planning, wetland park management, and ecological restoration. Subsequently, the evaluation results of the judgment matrix were subjected to a consistency check, with any inconsistent data being corrected. Finally, the weights of the factors were calculated using the arithmetic mean method in the software YAAHP 10.3. This method involves pairwise comparisons of the effectiveness of influencing factors within the same hierarchy based on a 1–9 scale of perceived importance. Experts were invited to judge the relative importance of any two indicators to determine the significance of different indicators. The Delphi method was employed in August 2024 to invite 10 experts in coal mining subsidence wetlands and wetland park research to complete the survey questionnaire, with a 100% response rate.

3.4. Social Landscape Performance and Classification Using Fuzzy Comprehensive Evaluation (FCE)

Fuzzy comprehensive evaluation is a method based on fuzzy mathematics, designed to analyze complex issues with multiple influencing factors that are difficult to quantify directly. As research progresses, this method has been increasingly applied across various fields. In the field of green space performance studies, it is primarily used for evaluating visitor satisfaction [38], park recreational functions [39], and environmental safety [40]. In these studies, satisfaction evaluations are often based on users’ subjective perceptions, which are inherently fuzzy. Fuzzy comprehensive evaluation transforms qualitative assessments into quantitative data, thereby providing a clearer representation of issues that are otherwise challenging to quantify due to their subjective nature.
  • Set the social landscape performance of the PLNWP evaluation index, U. U = (Ui) (where i = 1, 2, 3, 4, 5 correspond to the five criteria levels: B1, B2, B3, B4, B5), with the secondary indicators composed of Uij.
  • Construct the evaluation grade set, V. Each evaluation indicator is divided into five grades, namely V = {v1, v2, v3, v4, v5}, corresponding to “Very poor” (1 point), “Poor” (2 points), “Fair” (3 points), “Good” (4 points), and “Excellent” (5 points), as Table 2 showed.
  • Determine the fuzzy comprehensive evaluation set, B. The weights of each evaluation indicator are determined using the analytic hierarchy process (AHP), and the formula for fuzzy comprehensive evaluation is defined as follows:
B = A R = ( a 1 , a 2 , , a m ) * r 11 r 12 r 1 n r 21 r 22 r 2 n r m 1 r m 2 r m n = ( b 1 , b 2 , , b n )
where A is the weighted coefficient set, a1, a2, …, am ( i = 1 n a i = 1 ) are the weights of each evaluation indicator, R is the fuzzy transformation matrix, and rm1, rm2, …, rmn are the membership degrees of each indicator. By summarizing the scores of each evaluation factor, the proportion of the number of people to whom the indicator Uij belongs in the evaluation set V to the total number of people is obtained, that is,   R i   (i = 1, 2, 3, 4, 5).
Finally, the social landscape performance evaluation results for the five criteria levels of PLNWP are calculated using the fuzzy comprehensive evaluation. The final social landscape performance calculation formula is as follows:
X = b1 × I + b2 × II + b3 × III + b4 × IV + b5 × V
where b1, b2, b3, b4, and b5 represent the five levels of social landscape performance evaluation, and X represents the overall score of the social landscape performance.

3.5. Importance–Performance Analysis (IPA)

Importance–performance analysis (IPA) was first proposed by Martilla and James in 1977 [41] to analyze the attributes of locomotive products. Due to its simplicity and practicality, it has been rapidly adopted across various fields, including tourism [42], management [43], and geography [44]. This method primarily collects data through questionnaires, asking respondents to rate the importance and satisfaction of specific landscape features. The composite statistical values of importance and satisfaction are then plotted on a two-dimensional coordinate graph divided into four quadrants, with the mean values as the intersection point. This visualization clarifies the respondents’ perceptions of different landscape features. IPA helps managers determine whether resources are optimally utilized and whether visitors have the best possible experience. It can also be applied to landscape design, construction, and evaluation to provide better cultural ecosystem services.

4. Results

4.1. Reliability and Validity Analysis

Reliability testing assesses the consistency and stability of the data obtained from the questionnaire. In this study, Cronbach’s alpha was used to measure the reliability coefficient of the data. A reliability coefficient greater than 0.7 indicates good reliability. The survey data were coded and entered into SPSS 22.0. The analysis revealed that the reliability coefficients for importance and satisfaction were 0.829 and 0.863, respectively (alpha > 0.7), suggesting that the survey questionnaire had good reliability.
The structural validity of the questionnaire was evaluated using the Kaiser-Meyer-Olkin (KMO) measure. The KMO values for importance and satisfaction were 0.719 and 0.759, respectively, both greater than 0.7. This indicates that the structure of the survey questionnaire and the results obtained were valid.

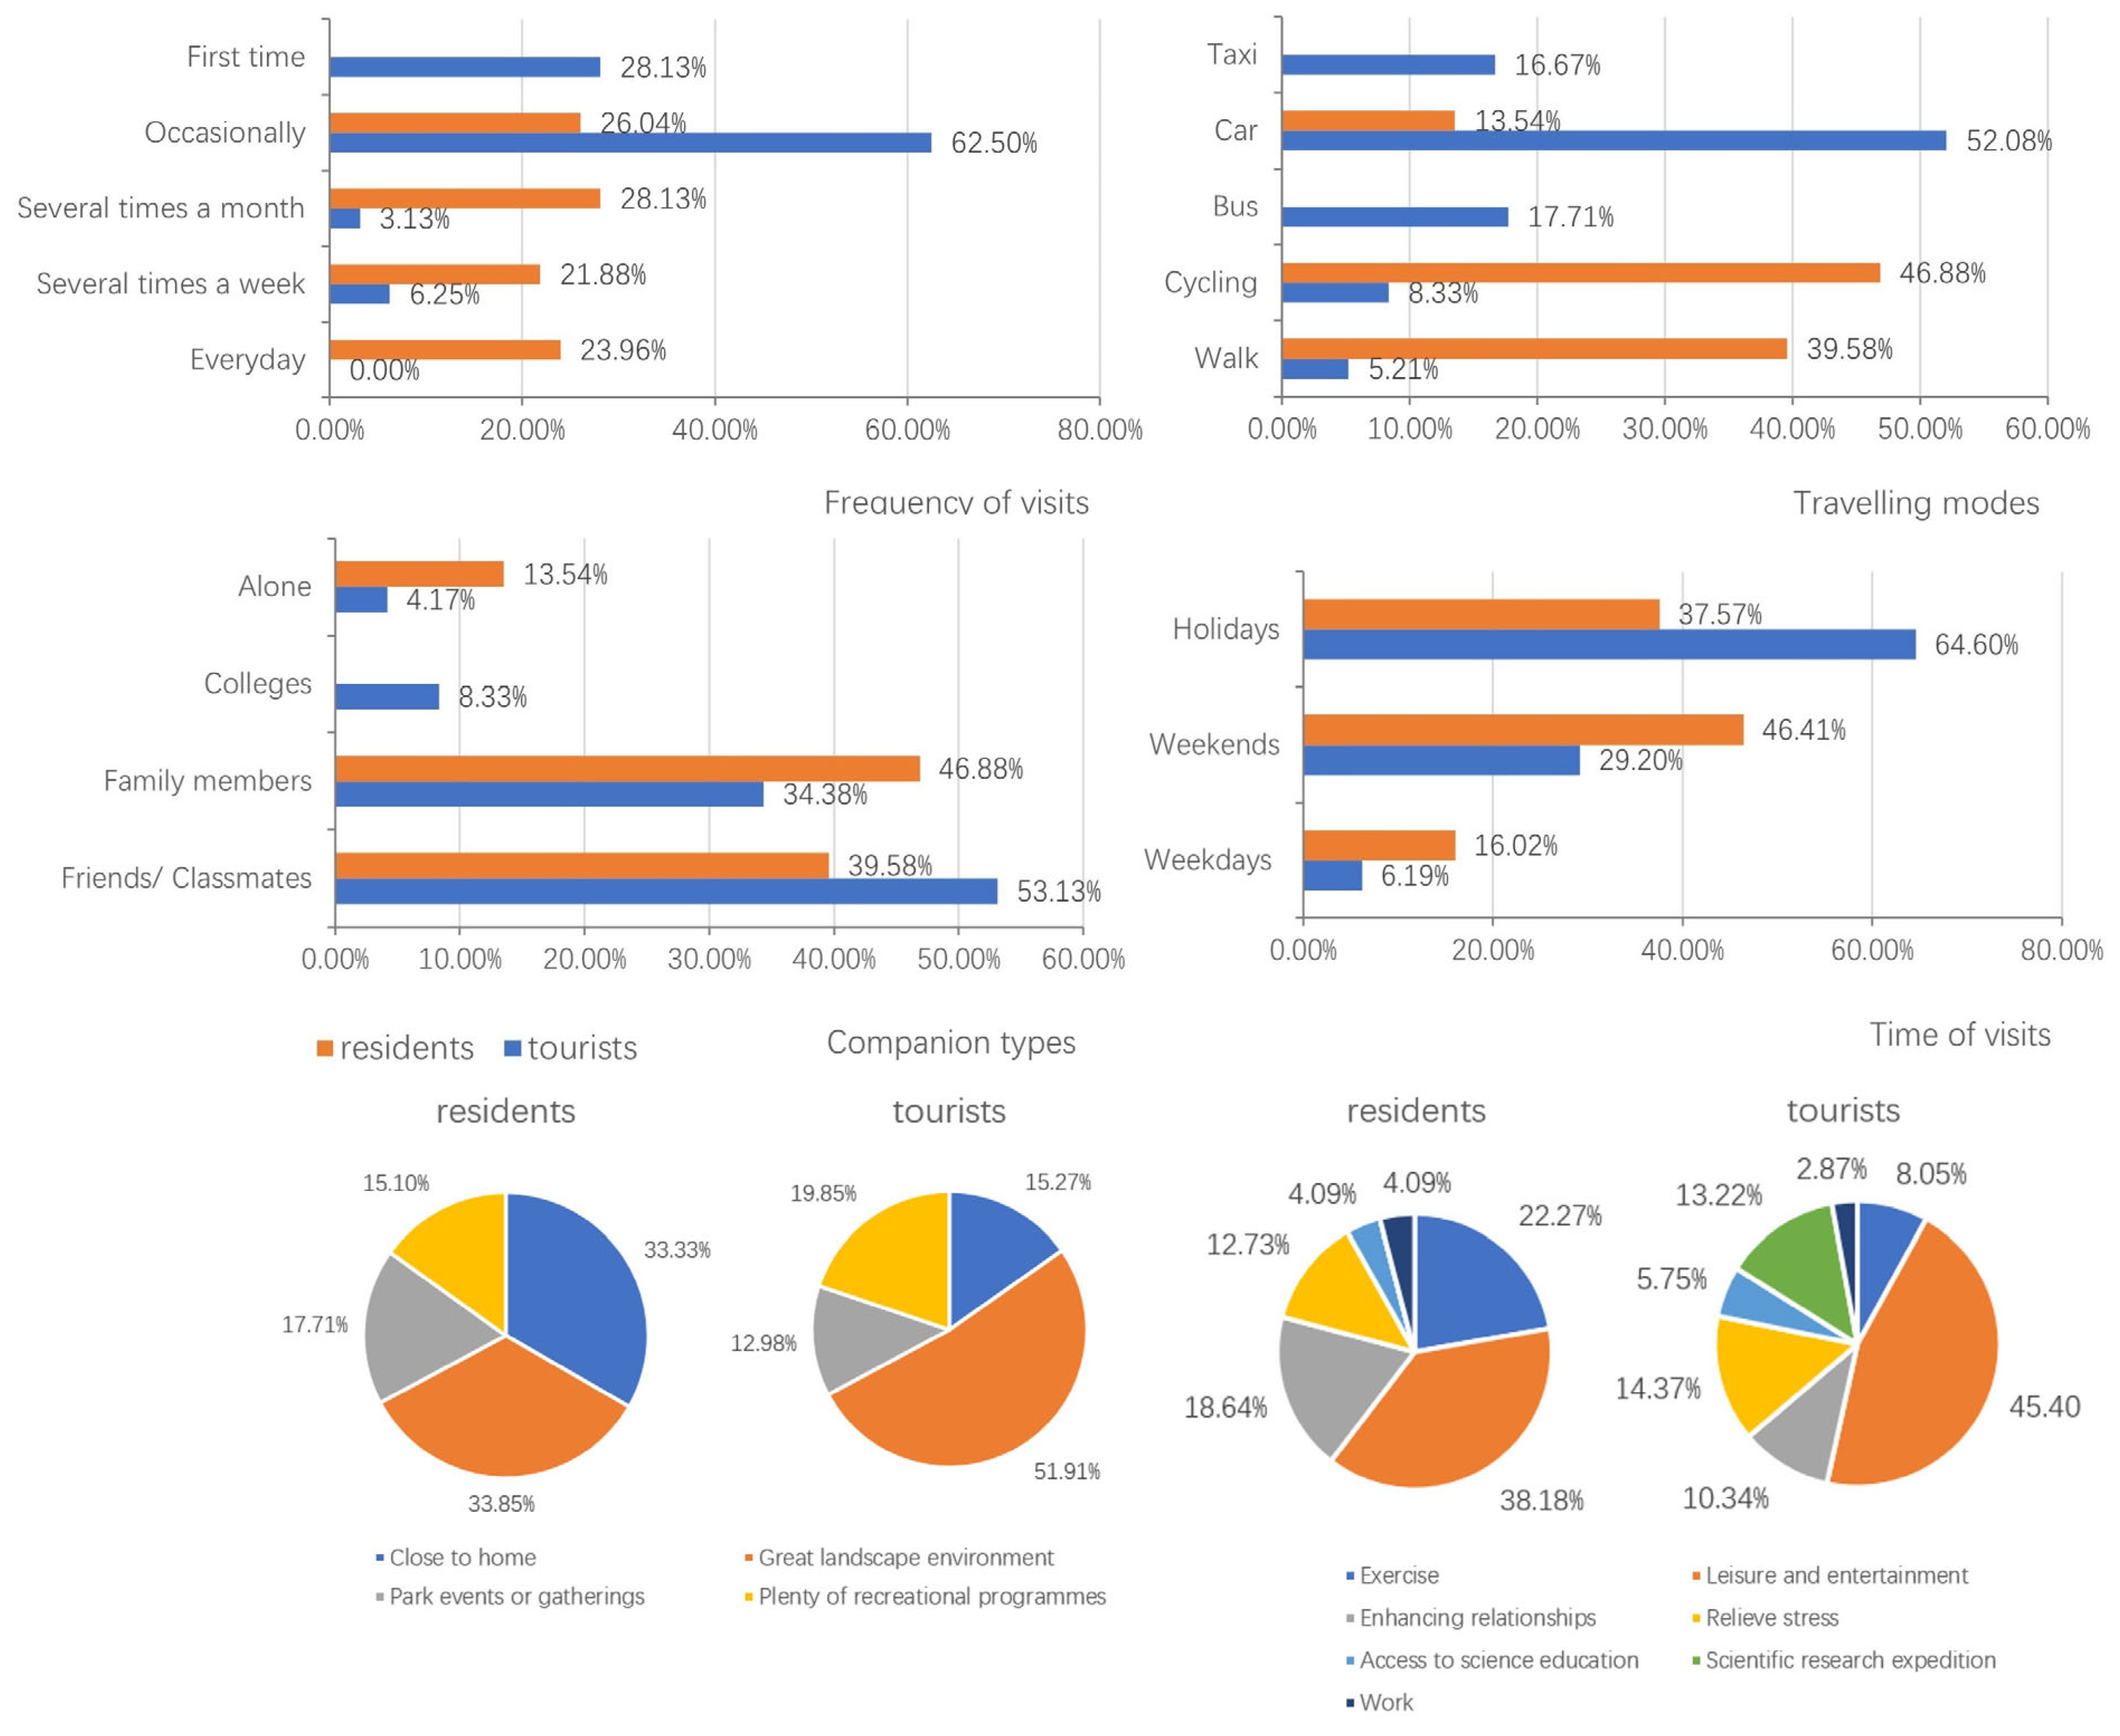
4.2. Characteristics of the Respondents

After the survey was completed, the questionnaires were checked to ensure all questions were answered accurately and were suitable for statistical analysis. The basic information of the respondents is shown in Table 3. Overall, the gender ratio of the respondents is balanced, with the majority being employees of enterprises and institutions, students, and retirees. The respondents cover a wide range of ages, and the educational level is concentrated in those with college degrees and above, accounting for 47.40%. Since the student group has no income, the majority have a monthly income of less than 2000 yuan, accounting for 41.15%. As shown in Figure 7, there are significant differences in the usage characteristics between visitors and local residents.
(1)
Characteristics of tourists
Since the wetland park is located in a suburban area of the city, most visitors travel by private car or taxi, taking 1–2 h to reach the park. They generally choose to visit in the morning during holidays to maximize their stay in the park. The common travel companions are classmates, friends, or family members, but due to the long distance, visits are infrequent. The main purposes of visiting the park are for leisure and entertainment, stress relief, scientific research, and strengthening relationships with friends and family. Therefore, visitors exhibit a pattern of long travel distances, low frequency, and relatively simple activities.
(2)
Characteristics of local residents
Due to the proximity of the park, residents usually choose green transportation modes such as cycling or walking with family members on regular days off. With the increasing demand for urban green spaces, the accessibility and landscape diversity of the park have become the main attractions for surrounding community residents. The park offers a variety of recreational activities and entertainment programs, as well as venues for gatherings, which leads to a higher frequency of visits by residents, mostly several times a month. Residents mainly travel in family units on weekends, forming a pattern of short travel distances, high frequency, and rich content.

4.3. Weights of Indicators

Based on the methods described in Section 3.3 and Section 3.4, we combined the AHP and FCE methods to calculate the weights of each indicator (Table 4). The weights of the five criteria layers—recreational and social value (B1), landscape and scenic quality (B2), educational value (B3), cultural heritage value (B4), and community service value (B5)—were 0.271, 0.349, 0.131, 0.138, and 0.113, respectively. Among them, landscape and scenic quality had the highest weight (0.349), while community service value had the lowest weight (0.113). Among the 28 indicators, the indicators with the highest weights in the landscape and scenic quality layer were the fun of waterside spaces (C10) and the aesthetic degree of water bodies (C8), with weights of 0.089 and 0.082, respectively. In the indicator layer, the key indicators of social performance were the aesthetic degree of the shoreline (C9), plant richness (C11), urban image shaping (C20), and the promotion of ecological culture (C22), with weights of 0.063, 0.064, 0.051, and 0.055, respectively. The weights of the other 22 indicators were all less than 0.050.

4.4. Fuzzy Comprehensive Evaluation of Social Landscape Performance of PLNWP

The social landscape performance evaluation matrix for the various criteria layers of PLNWP, including recreational and social value, landscape and scenic quality, educational value, cultural heritage value, and community service value, is calculated as follows:
R 1 = 0.177 0.000 0.000 0.000 0.000 0.004 0.024 0.037 0.036 0.077 0.014 0.000 0.001 0.001 0.000 0.016 0.000 0.012 0.014 0.011 0.018 0.050 0.015 0.122 0.000 0.000 0.018 0.020 0.038 0.059 0.030 0.099 0.022 0.039 0.038
R 2 = 0.001 0.007 0.065 0.097 0.065 0.002 0.002 0.058 0.079 0.041 0.003 0.001 0.000 0.000 0.016 0.007 0.005 0.005 0.093 0.089 0.054 0.057 0.032 0.016 0.028 0.026 0.034 0.022 0.016 0.011
R 3 = 0.000 0.000 0.145 0.000 0.000 0.000 0.000 0.138 0.083 0.055 0.001 0.000 0.001 0.000 0.009 0.011 0.010 0.000 0.078 0.072 0.023 0.007 0.019 0.006 0.049 0.050 0.058 0.067 0.027 0.005
R 4 = 0.000 0.017 0.094 0.000 0.000 0.000 0.012 0.073 0.083 0.055 0.002 0.012 0.098 0.162 0.125
R 5 = 0.053 0.007 0.043 0.068 0.041 0.004 0.039 0.070 0.040 0.016 0.000 0.000 0.000 0.000 0.000 0.007 0.004 0.009 0.050 0.155 0.140 0.043 0.042 0.023 0.044 0.026 0.044 0.035 0.032 0.018
To calculate the criteria layer fuzzy evaluation set B using the weighted average fuzzy operator:
B 1 = A 1   ×   R 1 = 0.206 0.076 0.252 0.275 0.191
B 2 = A 2   ×   R 2 = 0.007 0.042 0.327 0.353 0.202
B 3 = A 3   ×   R 3 = 0.002 0.030 0.468 0.300 0.162
B 4 = A 4   ×   R 4 = 0.002 0.042 0.265 0.411 0.281
B 5 = A 5   ×   R 5 = 0.004 0.065 0.277 0.384 0.270
From the secondary index of the social landscape performance in the fuzzy calculation, the five dimensions of the fuzzy comprehensive evaluation scores were obtained.
X1 = 0.206 × 1 + 0.076 × 2 + 0.252 × 3 + 0.275 × 4 + 0.191 × 5 = 3.169
X2 = 0.007 × 1 + 0.042 × 2 + 0.327 × 3 + 0.353 × 4 + 0.202 × 5 = 3.495
X3 = 0.002 × 1 + 0.030 × 2 + 0.468 × 3 + 0.300 × 4 + 0.162 × 5 = 3.471
X4 = 0.002 × 1 + 0.042 × 2 + 0.265 × 3 + 0.411 × 4 + 0.281 × 5 = 3.931
X5 = 0.004 × 1 + 0.065 × 2 + 0.277 × 3 + 0.384 × 4 + 0.270 × 5 = 3.849
Given the weight vector A = (0.271, 0.349, 0.131, 0.138, 0.113) for the social landscape performance of PLNWP, we can calculate the social landscape performance matrix:
B = A   ×   R = 0.059 0.052 0.312 0.337 0.213
Based on these results, a composite evaluation score for social landscape performance was calculated:
X = 0.059 × 1 + 0.052 × 2 + 0.312 × 3 + 0.337 × 4 + 0.213 × 5 = 3.511
The social landscape performance score of PLNWP is 3.511. According to the evaluation score, it is rated as “good.” Among the five dimensions, the highest score is 3.931, for cultural heritage value (B4), while the lowest is 3.169, for recreational and social value (B1). Recreational and social value, as the first intuitive or comprehensive perception of the evaluation subjects, determines their willingness to revisit and affects the effectiveness of the park’s development. Therefore, it is crucial to enhance the recreational and social value.

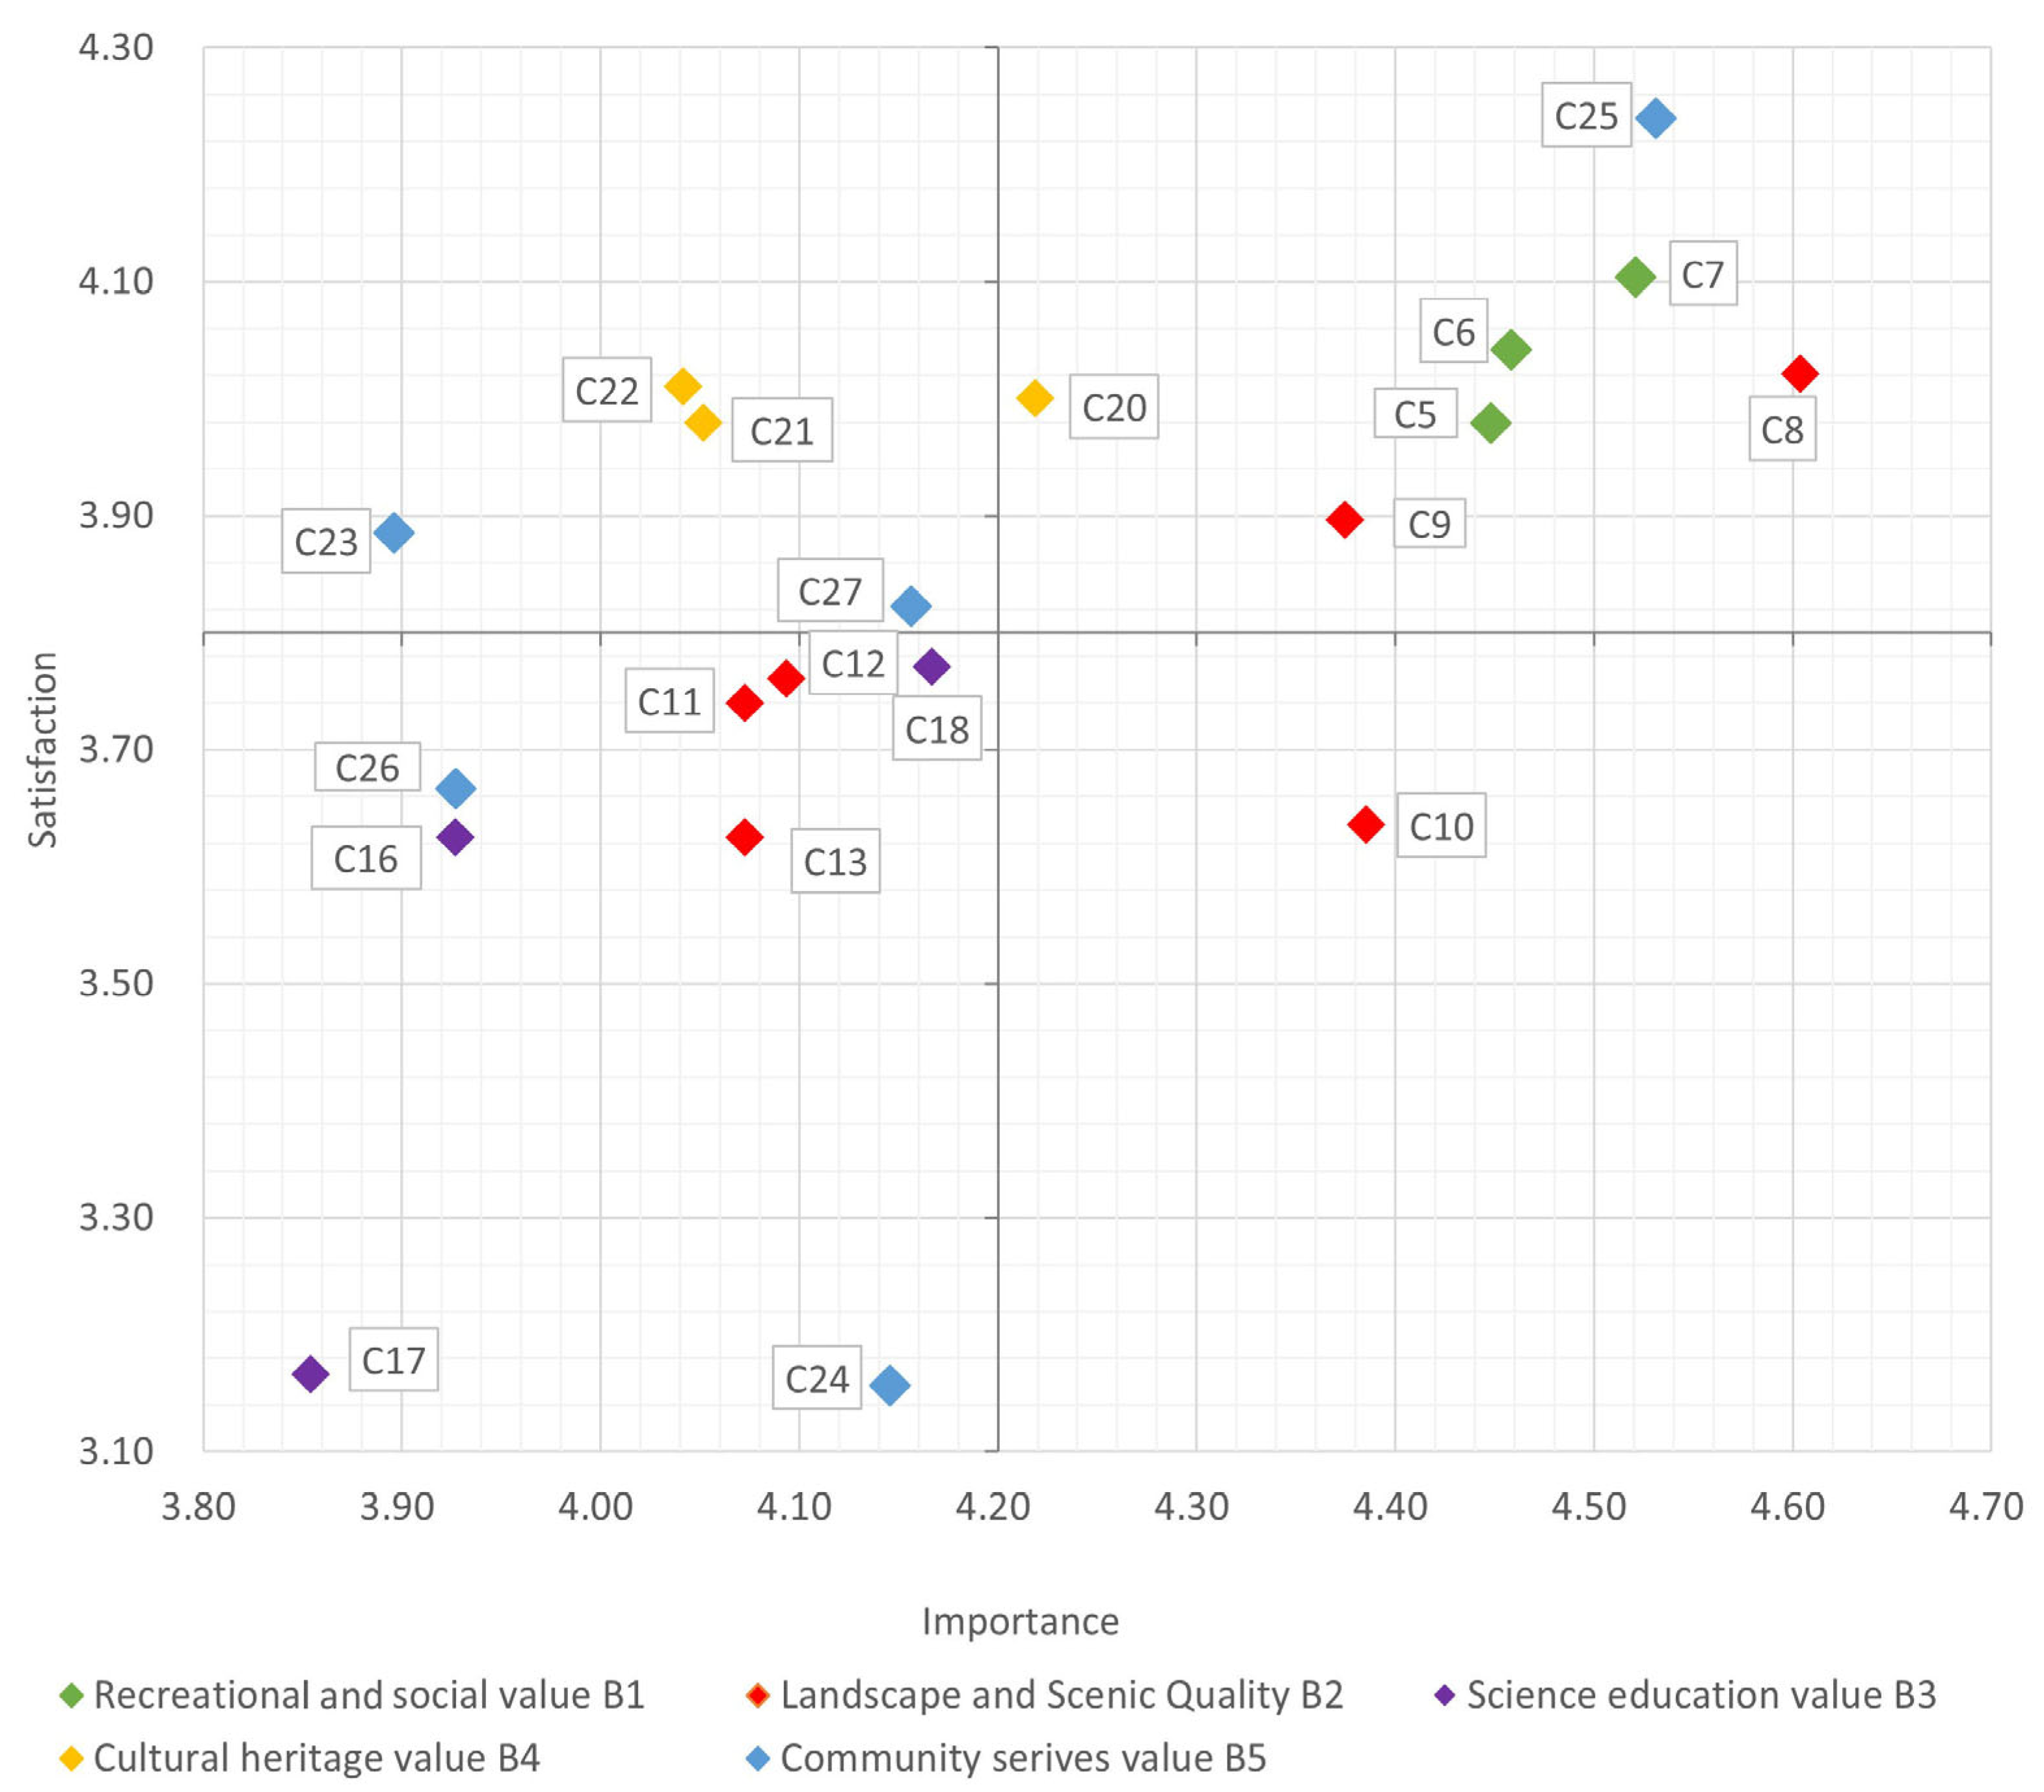
4.5. Mapping the IPA Plots: Local Residents and Tourists

Based on the evaluation results from tourists and community residents, the IPA is employed to create an intuitive and clear quadrant diagram. This analysis identifies the strengths and weaknesses of the social landscape performance evaluation indicators from different perspectives of the respondents. The insights gained from this analysis can be used to propose targeted suggestions for improvement, thereby enhancing the satisfaction of the different groups of visitors.

4.5.1. From Local Residents’ Perspectives

The local residents’ average scores for importance and satisfaction are relatively high, at 4.20 and 3.81, respectively, with most evaluation indicators concentrated in quadrants I, II, and III, indicating that they are satisfied with the social performance of PLNWP (Figure 8).
(1)
Strengths Maintenance Zone
Quadrant I includes seven indicators: Accessibility (C5), Tourist Route Convenience (C6), User Safety Experience (C7), Aesthetic Quality of Water Bodies (C8), Aesthetic Quality of Shorelines (C9), City Image Shaping (C20), and Improvement of Public Health (C25). These indicators have high importance and corresponding high satisfaction, representing the strengths of PLNWP. The investment in these seven aspects has been effective in meeting the needs of the surrounding residents and should be continued.
(2)
Steady Maintenance Zone
Quadrant II includes four indicators: Historical Continuity (C21), Promotion of Ecological Culture (C22), Sense of Place (C23), and Improvement of Community Public Facilities (C27). These indicators have high satisfaction but low importance. According to several retired miners, it is unimaginable turning the dilapidated coal mining subsidence area into such a beautiful park; they are very proud of it. For the surrounding residents, the historical heritage value and community service value do not directly boost their economic benefits. However, living near the scenic park, which features the unique landscape and history of the coal mining subsidence wetland, generally brings satisfaction.
(3)
Gradual Refinement Zone
Quadrant III includes eight indicators: Plant Diversity (C11), Public Art Significance (C12), Night Scene Quality (C13), Completeness of Educational Facilities (C15), Completeness of Interpretive Systems (C16), Perceived Participation in Experiential Learning (C17), Perceived Effectiveness of Science Communication (C18), Increase in Community Residents’ Income (C24), and Enrichment of Community Cultural Life (C26). These indicators have low importance and low satisfaction. Investment should be increased in landscape quality, science popularization education, and community service value to improve the satisfaction of these indicators and thereby enhance overall evaluation satisfaction, providing a healthier lifestyle for urban residents.
(4)
Key Improvement Zone
Quadrant IV contains only one indicator: Water Feature Diversity (C10). Its satisfaction should be improved. The waterside spaces mainly feature natural landscapes presented by landscape platforms but lack engaging and innovative design features that encourage prolonged visitation, especially those that can attract children. Increasing different types of shorelines and expanding the users’ waterside spaces can meet the surrounding residents’ needs for waterside spaces and achieve positive social benefits.

4.5.2. From Tourists’ Perspectives

The average scores for the importance and satisfaction evaluations of tourists are relatively high, at 4.09 and 3.73, respectively (Figure 9). Compared with the local residents, the scores for satisfaction and importance are slightly lower. This may be because many visitors are visiting here for the first time, and their expectations for the park are not as high as those of local residents. Moreover, most indicators are concentrated in quadrants I and III, indicating that from the perspective of visitors, they are relatively satisfied with the social performance indicators of PLNWP, and the gap between the actual performance and their expectations is relatively small.
(1)
Strengths Maintenance Zone
Quadrant I includes seven indicators: City Image Shaping (C20), Tourist Route Convenience (C6), Promotion of Ecological Culture (C22), Aesthetic Quality of Water Bodies (C8), Aesthetic Quality of Shorelines (C9), Water Feature Diversity (C10), and User Safety Experience (C7). These indicators have high importance and corresponding high satisfaction, which represents the strengths of PLNWP. It shows that the investment in recreational and social value, landscape and scenic quality, and historical heritage value has been effective. Tourists can appreciate the unique charm of the wetland landscape and its historical and cultural particularity.
(2)
Steady Maintenance Zone
Quadrant II includes only one indicator: Plant Diversity (C11), which should maintain its high satisfaction rating. Tourists mainly come to the park during the spring, summer, and autumn seasons. They mentioned feeling relaxed and relieved of stress when seeing plants that offer scenic views in all four seasons and blossoms in three seasons. In interviews, some visitors specifically highlighted the cypress forest in PLNWP during autumn as a popular spot for taking photos. They also appreciated the park’s natural state preserved after ecological restoration, which provides a rare “natural feel” in the city.
(3)
Gradual Refinement Zone
Quadrant III includes five indicators: Public Art Significance (C12), Completeness of Educational Facilities (C15), Completeness of Interpretive Systems (C16), Perceived Participation in Experiential Learning (C17), and Historical Continuity (C21). These indicators have low importance and low satisfaction. The reason is that tourists focus on the wetland landscape and factors that have direct sensory contact. Science popularization and historical culture do not directly affect visitors’ experience. So, dissatisfaction with these factors is usually fleeting. Therefore, PLNWP should enhance science popularization and educational publicity and make gradual improvements.
(4)
Key Improvement Zone
Quadrant IV contains only one indicator: Accessibility (C5). This indicates that for tourists, the transportation is crucial, directly affecting their travel arrangements and visit duration. Location is the primary concern for them when planning their trips. However, due to its position in the urban outskirts, inconvenient public transit and high demand for parking during holidays cause visitors to spend excessive time in transit, which in turn affects their satisfaction. Therefore, the development of PLNWP requires coordinated efforts among planning, transportation, and park management departments.

5. Discussion

5.1. Social Landscape Performance Assessment and Indicators

This study constructs a social landscape performance evaluation system. It integrates quantitative evaluation with social benefit assessment. Compared with cultural ecosystem services, this system provides clear quantitative tools and methods for evaluating specific indicator performance while also addressing the issue of landscape performance series focusing on scientific quantification results. Additionally, this study establishes a hierarchical dimension in the landscape performance series and sets evaluation indicators based on the characteristics of coal mining subsidence wetland parks, avoiding the singularity of universal indicators. The spatial planning objectives and sustainability benefits of different landscape types often vary significantly. Therefore, the social landscape performance assessment framework in this study provides a set of evaluation criteria with comparative value across similar landscapes, which are subsidence wetlands. This framework offers a feasible evaluation framework for coal mining subsidence wetland parks in China’s coal resource-based cities. Due to its regional features, the social landscape performance evaluation system for coal mining subsidence wetland parks can easily obtain reasonable value ranges for relevant indicators in the area, allowing for scoring and assessment of social benefits.
This study’s social landscape performance assessment reveals that the PLNWP not only offers significant ecological benefits but also generates diverse social benefits based on its favorable ecological environment. It meets tourists’ demands for scenic enjoyment while benefiting local residents. Xu Jiaxing et al. [45] indicated that the ecosystem service value of the area increased after the establishment of PLNWP, with a significant positive spillover effect on surrounding land prices. The restoration of the wetland ecosystem is ongoing. Educational outreach and scientific monitoring are essential for supporting the development of this artificial wetland ecosystem. The government has invested substantial funds and labor into the restoration project. Today, the picturesque PLNWP serves as a recreational site for local residents, with its rich biodiversity of flora and fauna attracting tourists, especially young people eager to explore. However, research has shown that the ecological tourism carrying capacity of PLNWP is 23,226–35,240 visitors per day, with birdwatching and dining facilities on Bird Island being the limiting factors [46]. There are 40 species of nationally third-grade protected or provincially key-protected wild birds, over 100 species of resident birds on Bird Island, and more than 200 bird species in total. To ensure a safe distance for birds, adequate separation should be maintained between birdwatching areas, tourist roads, and bird activity zones. Similar to our findings, enhancing the service capacity of various infrastructures within the park can promote ecological tourism development in Xuzhou and engage more people in the protection and restoration of wetland ecosystems. The area has also become a typical case of urban ecological reconstruction projects in China, with many visitors believing that it plays a positive role in regional ecological improvement and environmental protection.

5.2. IPA: Different Perception from Local Residents and Tourists

The landscape of wetland parks can provide diverse social values, but tourists and residents are influenced to varying degrees by different types of social perceptions [47]. This study identifies recreation and social value (B1), landscape and scenic quality (B2), and cultural heritage value (B4) as the most highly valued and easily perceived dimensions by both tourists and residents. This finding is consistent with Ridding et al. [48]. The importance of landscape characteristics for the delivery of cultural ecosystem services: those who assessed the CES functions of nature reserves in southern Wiltshire concluded that aesthetic and recreational/ecotourism values have significant impacts on people. These results offer valuable insights for regional land use planning and ecosystem management.
Local residents and tourists both have high satisfaction with the PLNWP, and the evaluation indicators that need improvement are relative. The two evaluation groups share common characteristics: the evaluation indicators for educational value are in the steady maintenance zone, indicating that both groups have the same perception of the park’s educational value, which requires long-term enhancement. Meanwhile, there are differences in the evaluation indicators between the two groups: residents believe that the waterside spaces need to be prioritized for improvement, while participatory experience perception, resident income increase, and the perfection of exhibition and interpretation systems include eight other indicators that require long-term efforts for improvement.
Tourists, on the other hand, consider that accessibility needs to be prioritized for improvement, while participatory experience perception, the perfection of exhibition and interpretation systems, educational publicity perception, and the other five indicators need long-term gradual rectification. This research has highlighted that the subsidence wetland park has potentially attractive assets, recognized by tourists, but they do not fully manage to meet visitors’ expectations in terms of orientation, public transport, accommodation, or other infrastructures. This finding is consistent with the literature [49].
The types of social benefits gained by tourists and local residents vary. On one hand, as green infrastructure, the wetland park offers internal benefits such as recreation, education, and cultural heritage, which are the same for both visitors and residents. This point is highlighted in the literature [50]. On the other hand, the externalities of the coal mining subsidence wetland park generate benefits for local residents, such as improved community infrastructure, increased income, and economic development. This is consistent with study [51,52], which suggests that the most important economic impacts of transition can be described as support for employment opportunities, increase in living standards, increase in investments in new types of business, and the creation of economic prerequisites for the protection and preservation of natural and cultural heritage. These are policy-driven measures for regional harmony. Thus, residents, as beneficiaries of the park, gain more social benefits than visitors. Overall, the social landscape performance of coal mining subsidence wetland parks is related to the different users. Residents could gain more social benefits than tourists and are more affected by landscape quality, education, and community services.

5.3. Strategies for Enhancing Social Landscape Performance of Pan’an Lake National Wetland Park

The social landscape performance evaluation results and the importance–performance analysis (IPA) quadrant diagrams for different evaluation subjects show that enhancing recreational and social value (B1) and landscape and scenic quality (B2) are crucial for the healthy and sustainable development of PLNWP. Improving the fun of waterside spaces and optimizing transportation accessibility are key areas for enhancing the park’s social landscape performance.

5.3.1. Rational Planning of Zoning and Enrichment of Wetland Landscapes

Given the large size of the park, its education and display area can be enhanced by adding artificial facilities to create diverse entertainment spaces. The park’s landscape tour areas—Bird Island, Cypress Forest Wetland, and Pan’an Water Town—are connected by a main dock for water-based tours to enjoy the waterside scenery. However, residents generally report that it lacks open waterside spaces for playing or lingering (C5). Therefore, in line with the planning concept of prioritizing protection, it is necessary to rationally plan various functional zones, conduct targeted design and planning for the water’s edge of different functional areas, enrich the park’s wetland landscape forms, and add distinctiveness of landscape features to bring vitality to the park.

5.3.2. Enhancing Accessibility and Improving Services and Infrastructure

The internal roads of the wetland park can be divided into three levels: electric vehicle lanes, bicycle lanes, and walking paths, connecting major functional areas. However, the main road from the south gate to the main dock is a mixed-use lane for both vehicles and pedestrians, requiring drivers to alert walkers, which compromises safety. Therefore, it is suggested that PLNWP increase bus routes from the urban area of Xuzhou to the park and add more sightseeing vehicles and frequencies during peak seasons. Parking spaces should be reasonably arranged. Speed limits and safety signs should be installed on mixed-use roads.

5.3.3. Improving Science Popularization and Environmental Awareness

The PLNWP is used as extracurricular practice venues for primary and secondary school students. Visitors need to make reservations in advance; however, they are unclear about the opening hours and reservation methods. Visitors who come for leisure and entertainment reported limited engagement with participatory experiences, which also indicates that the current science education services provided by the park do not match the activities that visitors can experience. Therefore, it is recommended to place signs at the park’s main entrance and visitor center to better utilize resources and enhance the public’s understanding and awareness of wetland resources (C18). At the same time, coal mining subsidence wetland parks should design more interesting and scientific activities (C17) to encourage participation from people of all age groups and increase visitors’ enthusiasm and initiative. Wetland parks should actively conduct wetland ecological scientific monitoring and research and regularly hold science popularization lectures to cultivate teenagers’ environmental awareness and promote the development of science popularization education in wetland parks (C16).

5.3.4. Creating a Diverse Landscape and Enhancing the Visibility of Public Art

Both local residents and tourists mentioned in the survey that the public art currently lacks a strong sense of distinctiveness. Public art that is both rational and aesthetically pleasing can create a sense of regional culture in the wetland park while fully utilizing the functions of wetland resources. To enhance the visibility of public art in the wetland park, it is necessary to consider not only the surrounding landscape environment but also the needs of different types of visitors. For example, considering the differences in age, it is necessary to meet the young people’s demand for the aesthetic beauty of the coal mining subsidence wetland park landscape, increase the variety of entertainment facilities, and strengthen the development of projects and games, such as building popular photo spots. At the same time, it is necessary to consider the elderly people’s longing for the natural form of the coal mining subsidence wetland park, such as wetland landscape water flow, classical pavilions, and places for middle-aged and elderly people to exercise in the morning and evening. In summary, landscape features and public art construction should be carried out based on the differences of users to reflect the unique beauty of the coal mining subsidence wetland park.

5.4. Limitations and Future Directions

This study has some limitations. The current research on social landscape performance is still immature, and the methods for quantifying qualitative indicators need further discussion. In this study, qualitative indicators were quantified using questionnaires. However, differences in quantification methods can lead to deviations in results. Additionally, the threshold values of the evaluation indicators are subjective and require further research to develop a more scientific and comprehensive evaluation index system. The extent to which strategies employed in the design process can deliver social benefits after construction has long been a significant research question in this field. Theoretically, extensive sample collection and empirical studies can gradually clarify the upper limits of efficiency for a category of strategies. However, this work requires long-term accumulation to achieve. Therefore, the normalized evaluation standards established by the single-factor quantification model still need further in-depth research.
Currently, this study focuses on only one coal mining subsidence wetland park. In the future, multiple coal mining subsidence wetland parks could be selected for social landscape performance measurement. By exploring the factors that influence social landscape performance and conducting comparative studies, this research can provide references for evaluating the social landscape performance of other coal mining subsidence wetland parks.

6. Conclusions

As a special type of wetland park, coal mining subsidence wetland parks are material spatial testimonies of the transformation and development of resource-based cities and social spaces that enhance urban residents’ sense of happiness and achievement. Xuzhou, a successful case of an old industrial base transformation, has demonstrated effective approaches in promoting the transformation and landscape reconstruction of coal mining subsidence wetlands. Taking the Pan’an Lake National Wetland Park in Xuzhou, China, as an example, this study constructs an evaluation system for the social landscape performance of coal mining subsidence wetland parks using the analytic hierarchy process (AHP), fuzzy comprehensive evaluation, and importance–performance analysis (IPA). The results show that the established evaluation index system is feasible.
Research on the renewal and reuse of coal mining subsidence wetlands in China has been conducted relatively early but has mostly focused on land reclamation, ecological restoration, and landscape planning, with a predominance of individual project studies. However, studies on the social landscape performance of coal mining subsidence wetland parks are currently limited, with a lack of quantitative research on their social benefits after transformation. By establishing a social landscape performance evaluation framework to assess their social benefit performance, this study could advance the research depth of urban planning in the direction of transformation from post-mining landscape into green infrastructure and provide effective scientific guidance for urban construction decision-makers and relevant government departments.

Author Contributions

Conceptualization, C.L. and J.C.; methodology, C.L.; software, C.L.; investigation, C.L., S.Z. and S.F.; formal analysis, S.Z.; data curation, C.L.; writing—original draft preparation, C.L.; writing—review and editing, C.L. and J.C.; visualization, C.L.; supervision, J.C.; project administration, J.C. and S.F.; funding acquisition, J.C., C.L. and S.Z. All authors have read and agreed to the published version of the manuscript.

Funding

This research was funded by the Jiangsu Collaborative Innovation Center for Building Energy Saving and Construct Technology, grant number SJXTBZ2103, and the National Natural Science Foundation of China, grant number 52208091.

Data Availability Statement

The original contributions presented in this study are included in the article. Further inquiries can be directed to the corresponding author.

Acknowledgments

The authors would like to express their gratitude to the reviewers and editor for their insightful comments and suggestions.

Conflicts of Interest

The authors declare no conflicts of interest.

References

  1. Zhou, K. Wetland Landscape Pattern Evolution and Prediction in the Yellow River Delta. Appl. Water Sci. 2022, 12, 190. [Google Scholar] [CrossRef]
  2. Yang, Y.; Zhang, Y.; Su, X.; Hou, H.; Zhang, S. The Spatial Distribution and Expansion of Subsided Wetlands Induced by Underground Coal Mining in Eastern China. Environ. Earth Sci. 2021, 80, 112. [Google Scholar] [CrossRef]
  3. Deng, X.; Chen, G. Characteristics of Water Pollution and Evaluation of Water Quality in Subsidence Water Bodies in Huainan Coal Mining Areas, China. J. Chem. 2022, 2022, 2857700. [Google Scholar] [CrossRef]
  4. Chen, Y.; Hu, Z.; Li, P.; Li, G.; Yuan, D.; Guo, J. Assessment and Effect of Mining Subsidence on Farmland in Coal–Crop Overlapped Areas: A Case of Shandong Province, China. Agriculture 2022, 12, 1235. [Google Scholar] [CrossRef]
  5. Chen, L.; Zhang, H.; Zhang, X.; Liu, P.; Zhang, W.; Ma, X. Vegetation Changes in Coal Mining Areas: Naturally or Anthropogenically Driven? Catena 2022, 208, 105712. [Google Scholar] [CrossRef]
  6. Nakade, D.; Dhadse, S. Biodiversity loss due to mining activities. Sustain. Biodivers. Conserv. 2024, 3, 49–65. [Google Scholar] [CrossRef]
  7. Krzysztofik, R.; Dulias, R.; Kantor-Pietraga, I.; Spórna, T.; Dragan, W. Paths of Urban Planning in a Post-Mining Area. A Case Study of a Former Sandpit in Southern Poland. Land. Use Policy 2020, 99, 104801. [Google Scholar] [CrossRef]
  8. Feng, S.; Hou, W.; Chang, J. Changing Coal Mining Brownfields into Green Infrastructure Based on Ecological Potential Assessment in Xuzhou, Eastern China. Sustainability 2019, 11, 2252. [Google Scholar] [CrossRef]
  9. Wang, L.; Wang, L.; Yin, P.; Cui, H.; Liang, L.; Wang, Z. Value Assessment of Artificial Wetland Derived from Mining Subsided Lake: A Case Study of Jiuli Lake Wetland in Xuzhou. Sustainability 2017, 9, 1860. [Google Scholar] [CrossRef]
  10. Li, Z.; Chang, J.; Li, C.; Gu, S. Ecological Restoration and Protection of National Land Space in Coal Resource-Based Cities from the Perspective of Ecological Security Pattern: A Case Study in Huaibei City, China. Land 2023, 12, 442. [Google Scholar] [CrossRef]
  11. Zheng, X.; Wang, F. Construction of an Adaptive River-Based Recreational Network for Urban River Restoration: A Case Study of Rencheng District, Jining City, China. J. Clean. Prod. 2022, 374, 133985. [Google Scholar] [CrossRef]
  12. Abandoned Pit Area Transformed into Scenic Park in N China’s Hebei. Available online: https://english.www.gov.cn/news/202307/23/content_WS64bcbe9dc6d0868f4e8de0c5.html (accessed on 9 June 2025).
  13. Xie, P. Striving Towards Ecocity: Experience from Huainan, China. Available online: https://www.smartcitiesdive.com/ex/sustainablecitiescollective/striving-towards-ecocity-experience-huainan-china/190911/ (accessed on 9 June 2025).
  14. Muntoni, F.; Balvis, T.; Rizzo, R.; Loru, P. Territorial Planning of Geological Mining Historical and Environmental Park of Sardinia. Geoheritage 2020, 12, 22. [Google Scholar] [CrossRef]
  15. Streever, W.J. Kooragang Wetland Rehabilitation Project: Opportunities and Constraints in an Urban Wetland Rehabilitation Project. Urban. Ecosyst. 1998, 2, 205–218. [Google Scholar] [CrossRef]
  16. Hartter, J.; Southworth, J. Dwindling Resources and Fragmentation of Landscapes around Parks: Wetlands and Forest Patches around Kibale National Park, Uganda. Landsc. Ecol. 2009, 24, 643–656. [Google Scholar] [CrossRef]
  17. Zhao, J.; Huang, Y.; Tang, T.; Yang, S. Reclamation of Coal Mining Subsidence Based on People’s Esthetic Preference. Int. J. Environ. Sci. Technol. 2022, 19, 6243–6250. [Google Scholar] [CrossRef]
  18. Lupp, G.; Konold, W.; Bastian, O. Landscape Management and Landscape Changes towards More Naturalness and Wilderness: Effects on Scenic Qualities—The Case of the Müritz National Park in Germany. J. Nat. Conserv. 2013, 21, 10–21. [Google Scholar] [CrossRef]
  19. von Döhren, P.; Haase, D. Ecosystem Services for Planning Post-Mining Landscapes Using the DPSIR Framework. Land 2023, 12, 1077. [Google Scholar] [CrossRef]
  20. Kodir, A.; Hartono, D.M.; Haeruman, H.; Mansur, I. Integrated Post Mining Landscape for Sustainable Land Use: A Case Study in South Sumatera, Indonesia. Sustain. Environ. Res. 2017, 27, 203–213. [Google Scholar] [CrossRef]
  21. Hine, A. Disrupting Landscape: Enacting Zones of Socio-Material Entanglement for Alternative Futures. Extr. Ind. Soc. 2021, 8, 100889. [Google Scholar] [CrossRef]
  22. Svobodova, K.; Sklenicka, P.; Vojar, J. Dominance Level of Significant Features in Post-Mining Landscapes as a Predictor of Perceived Scenic Beauty. In Mine Planning and Equipment Selection; Drebenstedt, C., Singhal, R., Eds.; Springer International Publishing: Cham, Swizerland, 2014; pp. 843–853. [Google Scholar]
  23. Singh, S.K.; Kumar, D. Optimizing Coal Mine Planning and Design for Sustainable Development in the Context of Mass Exploitation of Coal Deposits. Heliyon 2024, 10, e28524. [Google Scholar] [CrossRef]
  24. Yang, B. Landscape Performance Evaluation in Socio-Ecological Practice: Current Status and Prospects. Socio-Ecol. Pract. Res. 2020, 2, 91–104. [Google Scholar] [CrossRef]
  25. Brown, R.D.; Corry, R.C. Evidence-Based Landscape Architecture: The Maturing of a Profession. Landsc. Urban. Plan. 2011, 100, 327–329. [Google Scholar] [CrossRef]
  26. Taner, R.O. Social value of urban landscapes: Performance study lessons from two iconic Texas Projects. Landsc. Archit. Front. 2016, 4, 12–29. [Google Scholar]
  27. Church, S.P. Exploring Green Streets and Rain Gardens as Instances of Small Scale Nature and Environmental Learning Tools. Landsc. Urban. Plan. 2015, 134, 229–240. [Google Scholar] [CrossRef]
  28. Yang, B. Landscape Performance: Ian McHarg’s Ecological Planning in the Woodlands, Texas; Routledge: London, UK, 2018; ISBN 978-1-315-63682-5. [Google Scholar]
  29. Veitch, J.; Ball, K.; Crawford, D.; Abbott, G.R.; Salmon, J. Park Improvements and Park Activity: A Natural Experiment. Am. J. Prev. Med. 2012, 42, 616–619. [Google Scholar] [CrossRef]
  30. Yang, B.; Pamela, B.; Chris, B. Residential landscape performance evaluation:A visual and bioclimatic analysis based on field data. Landsc. Archit. 2015, 1, 87–98. [Google Scholar]
  31. Yang, B.; Li, S. Blending Project Goals and Performance Goals in Ecological Planning: Ian McHarg’s Contributions to Landscape Performance Evaluation. Socio-Ecol. Pract. Res. 2019, 1, 209–225. [Google Scholar] [CrossRef]
  32. Krsnik, G.; Illán-Fernández, E.J. Assessing Indicators and Preferences of Cultural Ecosystem Services in Urban Areas: A Case Study of Murcia, Spain. Landsc. Ecol. 2024, 39, 190. [Google Scholar] [CrossRef]
  33. Dickinson, D.C.; Hobbs, R.J. Cultural Ecosystem Services: Characteristics, Challenges and Lessons for Urban Green Space Research. Ecosyst. Serv. 2017, 25, 179–194. [Google Scholar] [CrossRef]
  34. Wang, Z.; Yang, B.; Li, S.; Binder, C. Economic Benefits: Metrics and Methods for Landscape Performance Assessment. Sustainability 2016, 8, 424. [Google Scholar] [CrossRef]
  35. Wu, S.-J.; Ng, E.; Lin, K.-B.; Cheng, Y.-H.; LePage, B.A.; Fang, W.-T. Influence of Landscape Preference and Place Attachment on Responsible Environmental Behavior—A Study of Taipei’s Guandu Nature Park Wetlands, Taiwan. Land 2023, 12, 2036. [Google Scholar] [CrossRef]
  36. Chakraborty, S.; Avtar, R.; Raj, R.; Thu Minh, H.V. Village Level Provisioning Ecosystem Services and Their Values to Local Communities in the Peri-Urban Areas of Manila, The Philippines. Land 2019, 8, 177. [Google Scholar] [CrossRef]
  37. Saaty, T.L.; Peniwati, K.; Shang, J.S. The Analytic Hierarchy Process and Human Resource Allocation: Half the Story. Math. Comput. Model. 2007, 46, 1041–1053. [Google Scholar] [CrossRef]
  38. Faerber, L.S.; Hofmann, J.; Ahrholdt, D.; Schnittka, O. When Are Visitors Actually Satisfied at Visitor Attractions? What We Know from More than 30 Years of Research. Tour. Manag. 2021, 84, 104284. [Google Scholar] [CrossRef]
  39. Jin, C.; Li, L.; Wang, Q.; Shao, J. Application of Fuzzy Comprehensive Evaluation (FCE) Method in the Evaluation of Outdoor Sports Environment in Cold Region Universities: A Case Study of Harbin, China. In Proceedings of the 5th International Conference on Resources and Environmental Research—Icrer 2023; Yuan, C., Ed.; Springer Nature: Cham, Switzerland, 2024; pp. 117–131. [Google Scholar]
  40. Wang, W.; Dong, C.; Dong, W.; Yang, C.; Ju, T.; Huang, L.; Ren, Z. The Design and Implementation of Risk Assessment Model for Hazard Installations Based on AHP–FCE Method: A Case Study of Nansi Lake Basin. Ecol. Inform. 2016, 36, 162–171. [Google Scholar] [CrossRef]
  41. Martilla, J.A.; James, J.C. Importance-Performance Analysis. J. Mark. 1977, 41, 77–79. [Google Scholar] [CrossRef]
  42. Boley, B.B.; McGehee, N.G.; Tom Hammett, A.L. Importance-Performance Analysis (IPA) of Sustainable Tourism Initiatives: The Resident Perspective. Tour. Manag. 2017, 58, 66–77. [Google Scholar] [CrossRef]
  43. Suryawan, I.W.K.; Sianipar, I.M.J.; Lee, C.-H. Community Importance-Performance Preferences and Policy Adaptiveness in Marine Debris Management: A Case Study from the Komodo Subdistrict, Indonesia. Mar. Policy 2025, 174, 106592. [Google Scholar] [CrossRef]
  44. Xiao, X.; Ye, Q.; Dong, X. Using Importance–Performance Analysis to Reveal Priorities for Multifunctional Landscape Optimization in Urban Parks. Land 2024, 13, 564. [Google Scholar] [CrossRef]
  45. Xu, J.; Yin, P.; Hu, W.; Fu, L.; Zhao, H. Assessing the Ecological Regime and Spatial Spillover Effects of a Reclaimed Mining Subsided Lake: A Case Study of the Pan’an Lake Wetland in Xuzhou. PLoS ONE 2020, 15, e0238243. [Google Scholar] [CrossRef]
  46. Tan, X.; Peng, Y.; Liu, S.; Liu, P. Landscape Pattern and Ecotourism Carrying Capacity of Pan’an Lake Wetland Park in Xuzhou City, China. Desalination Water Treat. 2020, 188, 288–296. [Google Scholar] [CrossRef]
  47. Zhang, J.; Zhu, X.; Gao, M. The Relationship between Habitat Diversity and Tourists’ Visual Preference in Urban Wetland Park. Land 2022, 11, 2284. [Google Scholar] [CrossRef]
  48. Ridding, L.E.; Redhead, J.W.; Oliver, T.H.; Schmucki, R.; McGinlay, J.; Graves, A.R.; Morris, J.; Bradbury, R.B.; King, H.; Bullock, J.M. The Importance of Landscape Characteristics for the Delivery of Cultural Ecosystem Services. J. Environ. Manag. 2018, 206, 1145–1154. [Google Scholar] [CrossRef] [PubMed]
  49. Nicola, S.; Schmitz, S. From Mining to Tourism: Assessing the Destination’s Image, as Revealed by Travel-Oriented Social Networks. Tour. Hosp. 2024, 5, 395–415. [Google Scholar] [CrossRef]
  50. Conesa, H.M.; Schulin, R.; Nowack, B. Mining Landscape: A Cultural Tourist Opportunity or an Environmental Problem?: The Study Case of the Cartagena–La Unión Mining District (SE Spain). Ecol. Econ. 2008, 64, 690–700. [Google Scholar] [CrossRef]
  51. Tabak, B.; Trišić, I.; Štetić, S.; Nechita, F.; Ilić, M.; Obadović, M.; Dobrescu, A.I. Economic and Socio-Cultural Development Dimension—Two Lake-Protected Areas’ Sustainability: A Case of Hungary and Serbia. Land 2025, 14, 479. [Google Scholar] [CrossRef]
  52. Sánchez-Arredondo, L.H.; López-Gómez, A.; Garavito-Higuera, S.A. Exploration of Mining Heritage and Evaluation of Mining Tourism Potential in the La Ferrería Village, Mining Territory of the Municipality of Amagá, in the Northwestern Colombian Andes. Int. J. Geoheritage Parks 2025, 13, 274–289. [Google Scholar] [CrossRef]
Figure 1. Location of the study area, Pan’an Lake National Wetland Park, Xuzhou, China.
Land 14 01305 g001
Figure 2. Functional zoning of Pan’an Lake National Wetland Park.
Land 14 01305 g002
Figure 3. Landscape of subsidence wetland before restoration in study area Xuzhou, China.
Land 14 01305 g003
Figure 4. Landscape of Pan’an Lake after restoration in Xuzhou, China.
Land 14 01305 g004
Figure 5. Infrastructure of Pan’an Lake National Wetland Park in Xuzhou, China.
Land 14 01305 g005
Figure 6. Distribution range of the questionnaire for Pan’an Lake National Wetland Park.
Land 14 01305 g006
Figure 7. Pan’an Lake National Wetland Park usage characteristics of tourists and local residents.
Land 14 01305 g007
Figure 8. IPA plots for social landscape performance from local residents’ perspectives.
Land 14 01305 g008
Figure 9. IPA plots for social landscape performance from tourists’ perspectives.
Land 14 01305 g009
Table 1. Indicators for assessing social landscape performance of coal mining subsidence wetland parks.
Criterion LayerIndicator LayerIndicator ExplanationData Source/Tool
Recreational and Social Value (B1)Visitor Numbers (C1)Total number of visitors received over a period after park constructionVisitor flow monitoring and statistics
Dwell Time (C2)Hours visitors spend in the parkQuestionnaire survey
Visit Frequency (C3)Frequency of visits to the park over a periodQuestionnaire survey
Planned/Organized Activities (C4)Frequency of events such as festivals, concerts, and cultural activitiesInterviews and departmental data statistics
Accessibility (C5)Layout of entrances and exits, convenience of public transport transfersQuestionnaire survey
Tourist Route Convenience (C6)Rationality of vehicle and pedestrian systems, parking facilities, and accessibility facilitiesQuestionnaire survey
User Safety Experience (C7)Expanded visibility, presence of security personnel, openness of the parkQuestionnaire survey
Landscape and Scenic Quality (B2)Aesthetic Quality of Water Bodies (C8)Area, color, and sediment of water bodiesQuestionnaire survey
Aesthetic Quality of Shorelines (C9)Types of shorelines (artificial, semi-artificial, natural)Questionnaire survey
Water Feature Diversity (C10)Presence of ponds, open lake surfacesQuestionnaire survey
Plant Diversity (C11)Variety of aquatic and terrestrial plants (trees, shrubs, herbaceous plants)Questionnaire survey
Public Art Significance (C12)Presence of landscape sculptures and unique featuresQuestionnaire survey
Night Scene Quality (C13)Number and distribution of streetlights, lighting effectsQuestionnaire survey
Educational Value (B3)Frequency of Educational Activities (C14)Frequency of activities such as nature education, gardening classes, and children’s science educationInterviews and departmental data statistics
Completeness of Educational Facilities (C15)Richness and rational distribution of educational facilities such as science museums, signage systems, and observation stationsInterviews and departmental data statistics
Completeness of Interpretive Systems (C16)Prominence of interpretive signs for flora and fauna and ecological restoration techniques, detailed guided toursQuestionnaire survey
Perceived Participation in Experiential Learning (C17)Experiential learning through wetland museums, park celebrations, and understanding of subsidence and restoration processesQuestionnaire survey
Perceived Effectiveness of Science Communication (C18)Enhancing public awareness of ecological and environmental protectionQuestionnaire survey
Scientific Research and Achievements (C19)Surveys and monitoring of hydrology, water quality, wetlands, and biodiversityInterviews and departmental data statistics
Cultural Heritage Value (B4)City Image Shaping (C20)Improvement of city image and promotion of local characteristicsQuestionnaire survey
Historical Continuity (C21)Recording the history of urban coal industry development and urban rise and fallQuestionnaire survey
Promotion of Ecological Culture (C22)Recording the ecological transformation of the city and reflecting the concept of “ Green Water and Green Mountains are Valuable Assets”Questionnaire survey
Community Service Value (B5)Sense of Place (C23)Users’ sense of identity and belonging to the parkQuestionnaire survey
Increase in Community Residents’ Income (C24)Perceived increase in income by surrounding residentsQuestionnaire survey
Improvement of Public Health (C25)Alleviation of emotional stress, noise reduction, and enhancement of quality of life and visual experienceQuestionnaire survey
Enrichment of Community Cultural Life (C26)Hosting community cultural and entertainment activities to promote neighborhood interactionQuestionnaire survey
Improvement of Community Public Facilities (C27)Renovation and design improvements to the community public environment after park constructionQuestionnaire survey
Disaster Prevention and Mitigation (C28)Effective disaster avoidance area, population capacity, and sufficiency of disaster prevention facilities for emergency rescueQuestionnaire survey
Table 2. Social landscape performance classification.
LevelSLP ValueCharacteristics
Very poor0 < Xi ≤ 1The social landscape performance of the park is very poor. None of the social values are reflected. The park fails to deliver recreational and social value, as well as landscape and scenic quality. It is unable to meet the social service needs of the surrounding residents.
Poor1 < Xi ≤ 2The social landscape performance of the park is poor. All the social value is not well presented. The park needs to pay extra attention to recreational and social value and improve the landscape and scenic quality. The community services barely meet residents’ needs very well.
Fair2 < Xi ≤ 3The social landscape performance of the park is average. The recreational and social values, as well as the landscape and scenic quality, are ordinary. The cultural characteristics are not prominent, and both the educational value and social service value require attention and have space for improvement. The community services basically meet residents’ needs.
Good3 < Xi≤ 4The social landscape performance of the park is in a relatively good state. The park offers recreational and social values and has distinct cultural characteristics. It also has good landscape quality and educational facilities. Residents around the park can gain certain social benefits from it.
Excellent4 < Xi ≤ 5The social landscape performance is in an excellent state. Visitors can enjoy recreational and social values as well as cultural characteristics. The park boasts high-quality landscapes and a comprehensive science popularization and education system. Additionally, residents surrounding the park can gain social benefits from it.
Table 3. Descriptive statistics of respondents’ characteristics.
VariablesDemographic CharacteristicsFrequencyRatiosVariablesDemographic CharacteristicsFrequencyRatios
GenderMale9348.44%EmploymentStudents3920.31%
Female9951.56%Employees of enterprises and institutions4121.35%
Staff of institutional units105.21%
AgeUnder 18105.21%Commercial, service industry employees115.73%
18–306835.42%Private business owners, individual Entrepreneurs126.25%
31–454121.35%Workers2010.42%
46–604422.92%Freelancers2513.02%
60 and above2915.10% Retirees3417.71%
EducationMiddle school or below6131.77%Income<CNY 20007941.15%
High school and technical4020.83%CNY 2000–50005830.21%
CNY 5000–80003618.75%
College5830.21%CNY 8000–10,000115.73%
Graduate and above3317.19%>CNY 10,00084.17%
Table 4. Ecosystem health assessment indicator weights.
Criterion LayerWeightIndicator LayerWeight
Recreational and Social Value (B1)0.271Visitor Numbers (C1)0.048
Dwell Time (C2)0.048
Visit Frequency (C3)0.031
Planned/Organized Activities (C4)0.033
Accessibility (C5)0.030
Tourist Route Convenience (C6)0.031
User Safety Experience (C7)0.050
Landscape and Scenic Quality (B2)0.39Aesthetic Quality of Water Bodies (C8)0.082
Aesthetic Quality of Shorelines (C9)0.063
Water Feature Diversity (C10)0.089
Plant Diversity (C11)0.064
Public Art Significance (C12)0.029
Night Scene Quality (C13)0.022
Educational Value (B3)0.131Frequency of Educational Activities (C14)0.019
Completeness of Educational Facilities (C15)0.036
Completeness of Interpretive Systems (C16)0.024
Perceived Participation in Experiential Learning (C17)0.011
Perceived Effectiveness of Science Communication (C18)0.019
Scientific Research and Achievements (C19)0.022
Cultural Heritage Value (B4)0.138City Image Shaping (C20)0.051
Historical Continuity (C21)0.032
Promotion of Ecological Culture (C22)0.055
Community Service Value (B5)0.113Sense of Place (C23)0.018
Increase in Community Residents’ Income (C24)0.019
Improvement of Public Health (C25)0.039
Enrichment of Community Cultural Life (C26)0.013
Improvement of Community Public Facilities (C27)0.014
Disaster Prevention and Mitigation (C28)0.010
Disclaimer/Publisher’s Note: The statements, opinions and data contained in all publications are solely those of the individual author(s) and contributor(s) and not of MDPI and/or the editor(s). MDPI and/or the editor(s) disclaim responsibility for any injury to people or property resulting from any ideas, methods, instructions or products referred to in the content.

