Article

Visual Storytelling of Landscape Change on Rathlin Island, UK

1
School of Natural and Built Environment, Queen’s University Belfast, Belfast BT7 1NN, UK
2
School of Geography and Information Engineering, China University of Geosciences, Wuhan 430074, China
*
Author to whom correspondence should be addressed.
Land 2025, 14(6), 1304; https://doi.org/10.3390/land14061304
Submission received: 22 May 2025 / Revised: 6 June 2025 / Accepted: 16 June 2025 / Published: 19 June 2025
(This article belongs to the Special Issue Urban Resilience and Heritage Management (Second Edition))

Abstract

Islands represent distinctive geographical landscapes where cultural heritage, history, and ecological systems converge, offering critical insights into human–environment interactions. This study investigates how visual storytelling through digital tools such as the Historical Environment Map Viewer, Environment Digimap, Google Maps and Google Street View, and ArcGIS Field Maps can be employed to capture, interpret, and communicate islands’ landscape changes. By integrating historical environmental mapping, landscape change mapping, street map views, and field observations, this study creates a layered visual narrative that reveals shifts in land use, settlement patterns, and ecological features over time. Rathlin Island represents a distinctive island landscape, and this study uses visual storytelling as a tool to foster a broader public understanding of environmental conservation and engagement with the island’s ecologial challenges. The study demonstrates that multi-perspective, interdisciplinary methods provide valuable insights into the complex dynamics of landscape change, while also offering a comprehensive vision of sustainable future landscape on small islands.

1. Introduction

Small islands are widely regarded as disadvantaged regions facing unique developmental and environmental challenges and are among the most vulnerable areas globally to climate change and sea-level rise [1,2,3]. Despite accounting for less than 2% of the planet’s terrestrial area (1.86% including Greenland; 1.47% otherwise), islands host approximately one-tenth of humanity [4]. This disproportionate population density across fragmented and frequently isolated landmasses intensifies the interconnected nature of their socio-environmental vulnerabilities [5]. The systemic challenges confronting island communities arise from four synergistic pressures: (1) remoteness from continental markets and infrastructure networks; (2) scarcity of arable land and potable water reserves; (3) ecological sensitivity amplified by endemic species dominance; and (4) heightened susceptibility to climate extremes, including oceanic inundation, intensified storm systems, shoreline degradation, and saltwater infiltration into aquifers [6,7]. Compounding these risks, island economies disproportionately rely on climate-vulnerable sectors—notably subsistence agriculture, marine resource extraction, and seasonal tourism—creating dual exposure to both biophysical hazards and fluctuations in international commodity demand [8].
There is a growing consensus in the literature that small islands are disproportionately affected by climate change due to their peripheral or marginal locations, restricted adaptive capacities, and reliance on external aid or imported products, energy, and services [9,10]. Moreover, many small islands harbor endemic species and unique socio-cultural systems that are highly sensitive to environmental change, meaning the loss of such systems would have irreversible global implications [11]. To address these challenges, interdisciplinary and visually driven research methods have emerged as powerful toolkits [12,13]. Visual storytelling has proven effective in communicating the ecological and cultural dimensions of island environments. Based on this point, visual storytelling can serve as an effective tool for bridging the gap between academic research and public engagement in island studies. By leveraging visual media—such as 2D mapping, 3D modeling, photography, video documentaries, and infographics—researchers can present a comprehensive analysis of islands in a more accessible and compelling format. In contrast to conventional spatial planning approaches that treat visualization tools primarily as instruments for or of planning—either to support planning decisions or to represent planning outcomes—this research repositions storytelling as an interactive, polyphonic tool. This study develops a multifaceted technological framework, including tools such as Historical Environment Map Viewer, Environment Digimap, Google Maps and Google Street View, and ArcGIS Field Maps. These tools can be engaged with diverse voices and perspectives embedded within the island context. This allows us to explore not only the physical changes in land use and environment, but also the subjective and cultural dimensions of place as experienced by its inhabitants.
This paper proposes visual storytelling not only as a comprehensive tool for understanding landscape change on small islands, but also as a critical methodology for analyzing spatial relationships and guiding sustainable island futures. Using Rathlin Island, UK, as a case study, it demonstrates how visual storytelling can effectively connect mapping with lived experience. By integrating historical mapping, spatial visualization, and local knowledge, this study develops an interdisciplinary and multi-perspective framework that supports both academic inquiry and stakeholder engagement. Therefore, it contributes to the broader discourse on how visual methods can enhance environmental awareness and inform sustainable landscape development on small islands. This paper addresses a key gap in island research by asking “How can a multi-perspective, interdisciplinary method to visual storytelling help diverse stakeholder groups understand and engage with landscape change on the island?”

2. Literature Review

2.1. The Role of Storytelling in Cultural Heritage and Environmental Education

Storytelling plays a vital role in preserving cultural values and environmental knowledge across generations [14]. Its forms have transitioned from oral histories and paper trails to advanced digital formats in this century, particularly through multimedia visualization. Advanced digital formats not only support storytelling but also enhance the effectiveness of environmental education. Recent technological developments have enhanced storytelling’s impact by embedding visual elements, thereby highlighting its relevance in fields such as cultural heritage conservation and ecological awareness [14,15]. From the cultural heritage perspective, storytelling has enabled cultural heritage institutions, museums, and communities to revitalize endangered narratives and represent intangible heritage through digital archives, immersive storytelling platforms, and augmented or virtual reality experiences [16]. With the progression of technological tools, storytelling has been able to integrate spatial and visual dimensions, enhancing its ability to convey messages effectively in the fields of cultural heritage and environmental education. Complex environmental information can be more effectively communicated through visual storytelling, allowing for improved accessibility, emotional resonance, and public participation in heritage and ecological efforts [16]. For example, virtual reality (VR) technologies have been increasingly adopted in tourist and heritage sites to create immersive experiences that transport users to reconstructed historical environments or threatened ecological landscapes [17]. These technologies stimulate emotional engagement and allow for interactive learning, where users can explore narratives at their own pace and according to their interests [17]. By combining spatial immersion with narrative depth, VR-based storytelling enhances cognitive retention and fosters a deeper connection between audiences and the content presented [18]. Such innovations are particularly valuable in sustainability education and heritage preservation, where abstract or distant concepts—such as climate change or intangible cultural practices—can be made tangible and meaningful through embodied, sensory-rich experiences.
However, the effectiveness of immersive or applied storytelling extends beyond technological sophistication. While such tools enhance narrative delivery, the framing and interpretation of the message remain central to whether the story resonates, informs, or persuades. Throgmorton (2003) conceptualise planning as persuasive storytelling, where narratives shape institutional logic and societal responses to environmental uncertainty [19]. Expanding on this, Eckstein and Throgmorton (2003) positions storytelling as a democratic process that enables individuals to articulate concerns within wider public discourse [20]. In what he terms a discursive democracy, storytelling allows diverse voices to co-create shared meaning and future visions, making it an essential component of inclusive and just environmental planning, especially in small island contexts, where lived experience is tightly coupled with ecological change. Similarly, the Center for Research on Environmental Decisions emphasizes that the way environmental or cultural information is communicated is key to provoking meaningful engagement. Narrative framing—together with the choice of media and dissemination platforms—significantly influences the social, cultural, and political impact of the story [21,22]. Yet, as Joosse et al. (2024) highlight, storytelling around sustainability is often embedded with implicit assumptions about who speaks, who listens, and whose knowledge matters—assumptions further complicated by the contested and fluid definitions of concepts like sustainability and heritage [23]. Therefore, the ethical and contextual selection of storytelling tools is essential to ensure that information is clear, socially inclusive, and culturally diverse.

2.2. Visual Storytelling in Island Studies

Islands serve as unique microcosms of broader cultural and environmental issues, making them particularly suited for visual storytelling. Their distinct geographical features and cultural histories provide rich material for creating visual narratives that can capture the nuances of both cultural heritage and environmental challenges [23]. The development of technological tools has transformed how these island stories are told, with visual storytelling emerging as a critical method for not only preserving the cultural heritage of island communities but also for raising awareness about environmental issues like climate change, biodiversity loss, and resource management [24].
Technological advancements have made it possible to create more dynamic and immersive visual experiences [25]. By leveraging tools such as digital mapping and immersive 3D models, island studies can present intricate environmental data in visually compelling ways, making abstract concepts more tangible and encouraging engagement with sustainability efforts [25]. This stresses the important role technology plays in bridging the gap between complex environmental science and accessible public engagement.

2.3. Technological Tools for Visual Storytelling

The evolution of technological tools has reshaped visual storytelling, particulaly in the contexts of environmental and island studies. Initially, storytelling was a straightforward process involving basic multimedia or geographical tools, but over time, applications have become more complex, allowing for interactive, immersive narratives [26]. With growing digitalization and social media use, storytelling has become more and more relevant within the context of information systems. This is due to digital tools providing innovative ways to communicate information in a narrative format [27,28]. Visual storytelling has emerged as a key research focus for information visualization, a discipline closely related to cartography [29,30]. Much of this scholarship is oriented toward supporting the expanding field of data journalism, which integrates textual narratives with visual elements and data-driven graphics to enhance news reporting [30,31]. Within this progression, visualization research has increasingly emphasized the importance of effectively communicating data through graphical representations tailored to user perception [32]. As Gershon et al. suggest, narrative formats are often more memorable for users than isolated factual data, highlighting the potential of storytelling as a powerful medium for knowledge transmission [27]. Consequently, technological developments have introduced a suite of interactive tools designed to advance the capabilities of visual storytelling. Tools such as the Historical Environment Map Viewer, Environment Digimap, Google Maps and Google Street View, and ArcGIS Field Maps, represent some of the most significant advancements in visual storytelling technologies. These tools provide new capabilities for creating multilayered, dynamic visualizations that integrate diverse data sources, providing a more refined and immersive understanding of the subject matter. Initially, these systems were simple, with limited features and static visuals. However, as technology has evolved, so has their functionality. For instance, the Historic Environment Map Viewer allows users to explore temporal changes in landscapes through layered historical maps, aiding in heritage conservation and spatial analysis [33]. The Environment Digimap offers access to a wide range of environmental datasets—including ones related to land cover, geology, and hydrology—facilitating detailed landscape assessments [34]. Google Maps and Google Street View, originally limited to static panoramic imagery, have evolved to support interactive, real-time exploration, allowing users to navigate environments virtually with high spatial fidelity [35,36]. Moreover, ArcGIS Field Maps has been widely adopted by environmental researchers for their ability to combine geographical data with multimedia elements, making them powerful tools for communicating spatial and ecological stories [37]. These tools were chosen for review because they represent some of the most widely used and impactful technologies in the field of visual storytelling, particularly in environmental and island studies.
As mentioned above, those tools of visual storytelling have evolved significantly from static images and maps to interactive, data-driven experiences [38,39]. These advancements have not only transformed how environmental stories are told but also who can participate in these narratives, broadening the scope of engagement to include the public, scientists, and policymakers alike [40]. The evolution of these tools demonstrates ongoing technological progression, showing that visual storytelling is becoming ever more sophisticated, inclusive, and impactful in addressing environmental and cultural challenges [41]. These technological tools enable the creation of dynamic, multilayered storytelling that can effectively convey the complexity of island environments and inform more sustainable planning and management strategies [38]. In addition, those tools have revolutionized visual storytelling, offering unprecedented advantages in accessibility, interactivity, and immersion [41]. These innovations make it easier to convey complex topics, particularly in environmental and island studies, by integrating geographical, ecological, and cultural information into rich, multi-layered narratives [41]. This capability allows for a more holistic understanding of both the environmental challenges and the unique cultural identities of island communities.

3. Materials and Methods

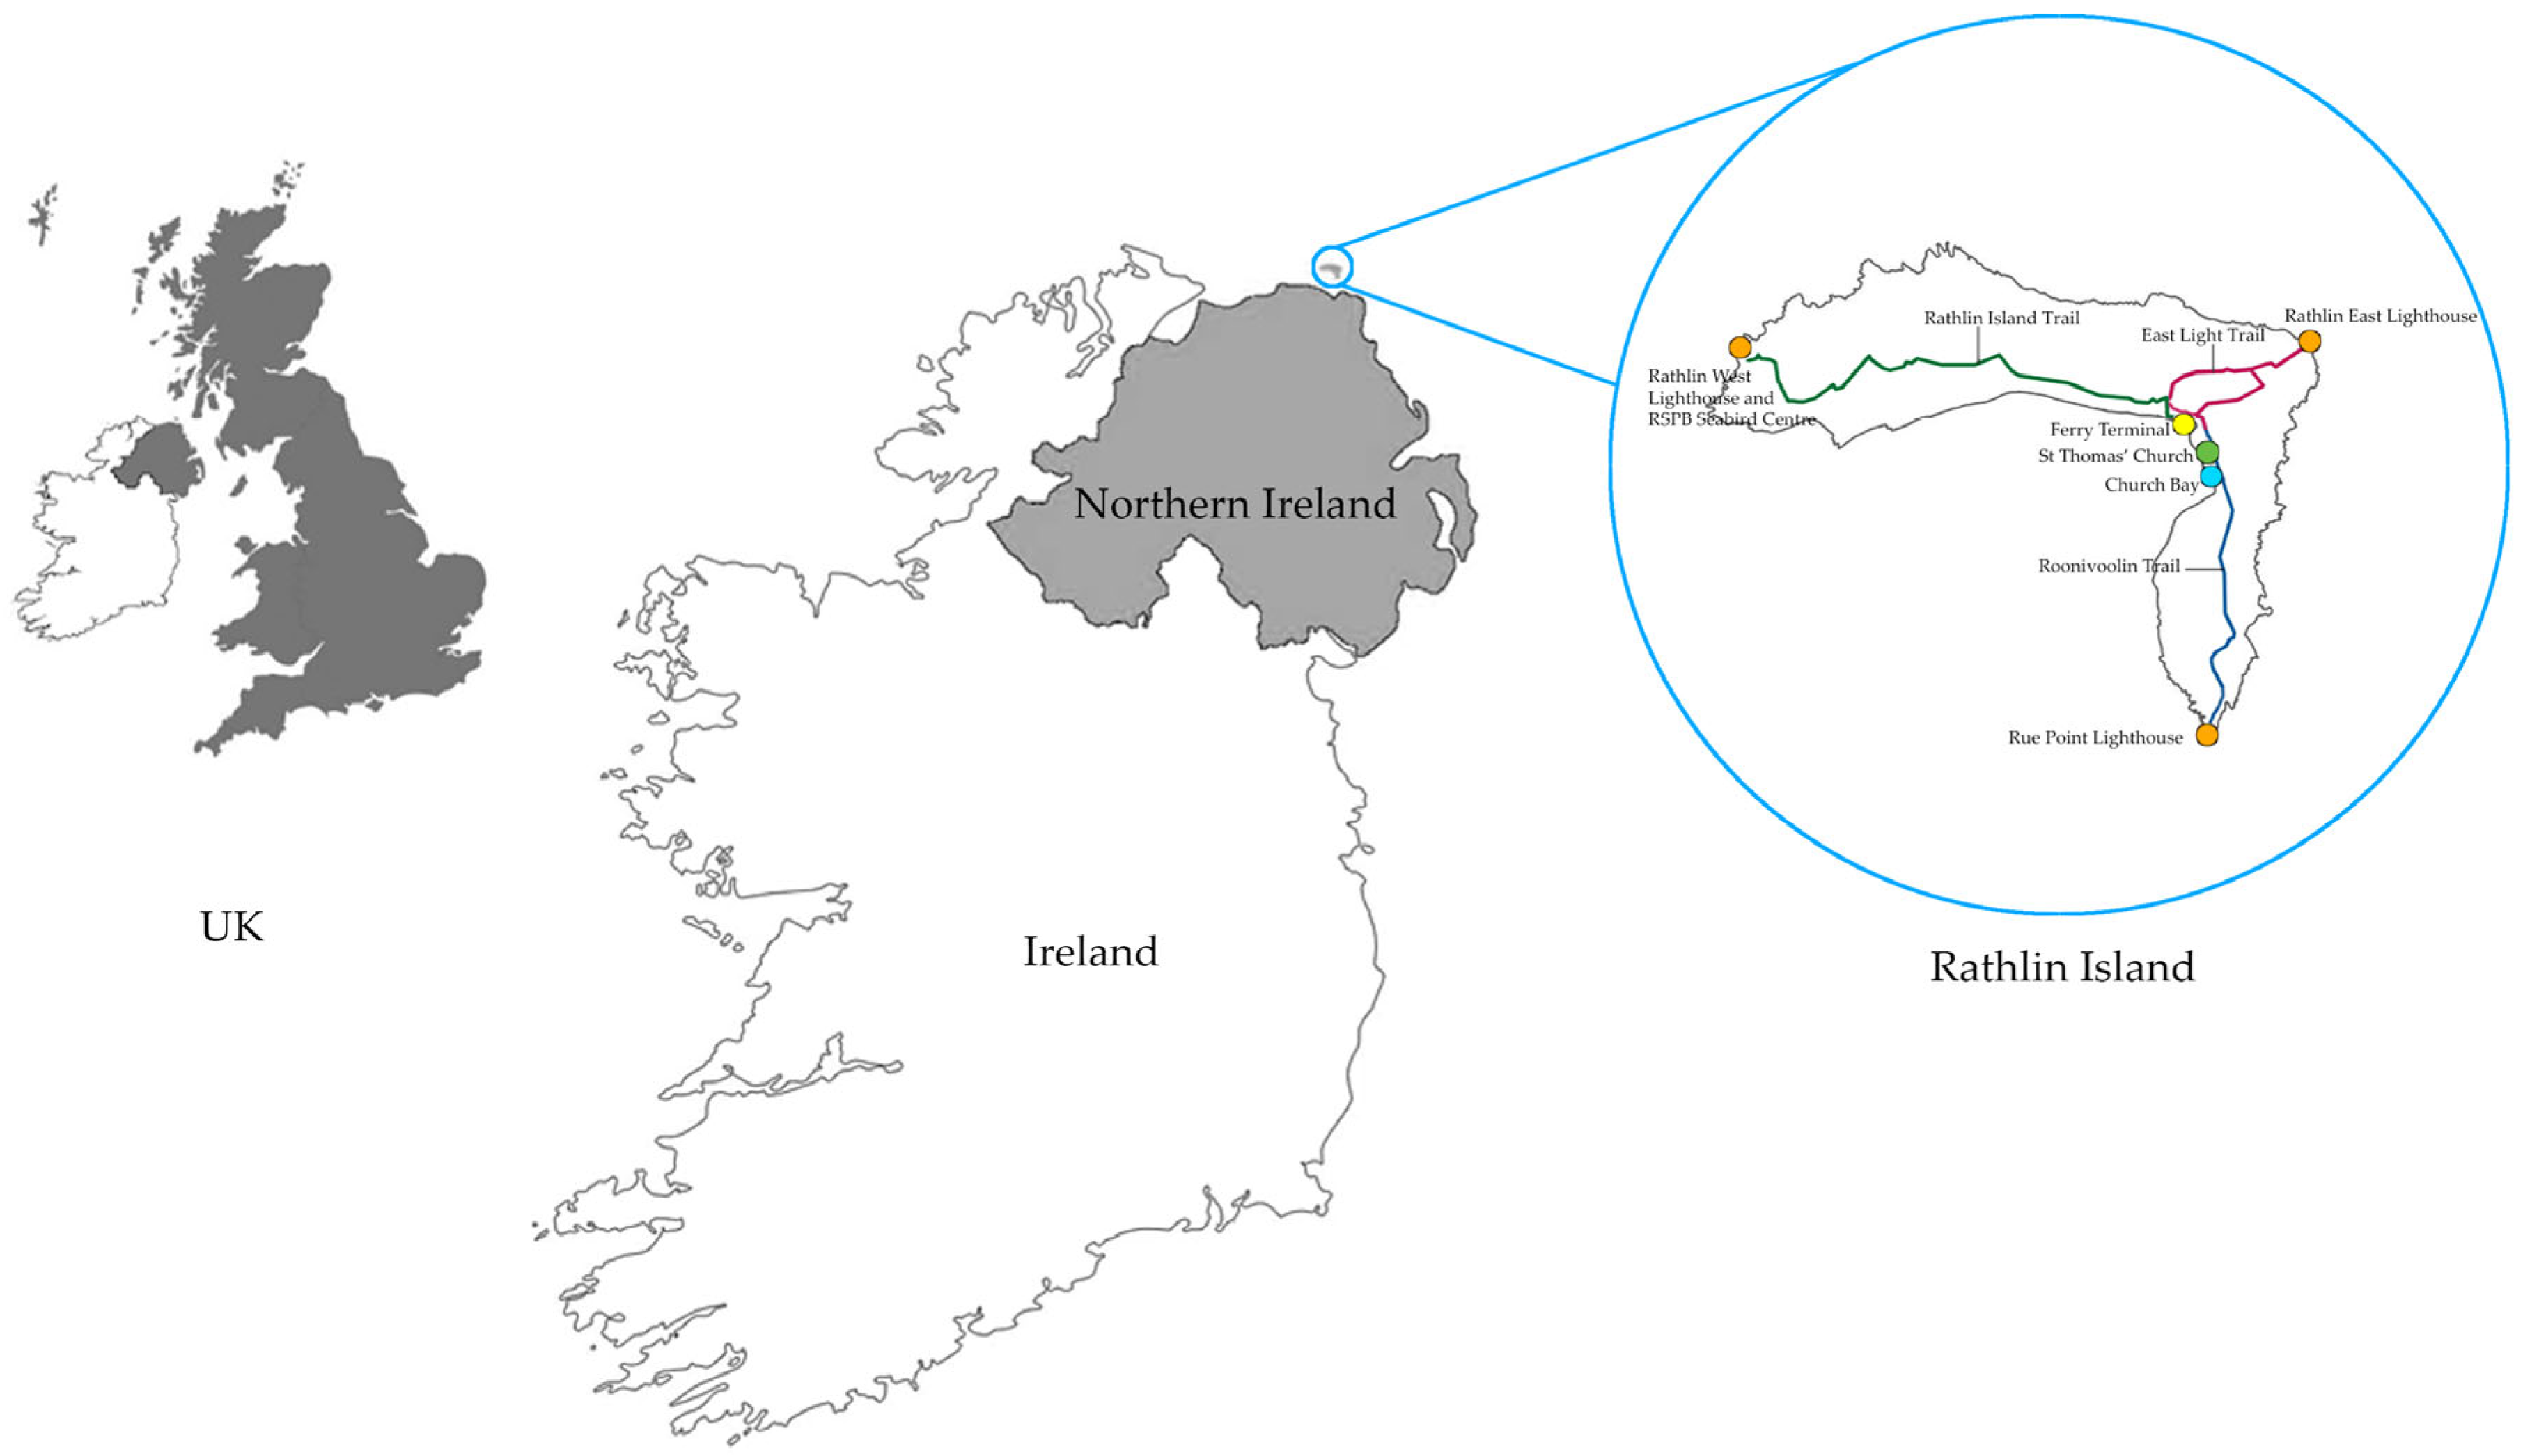
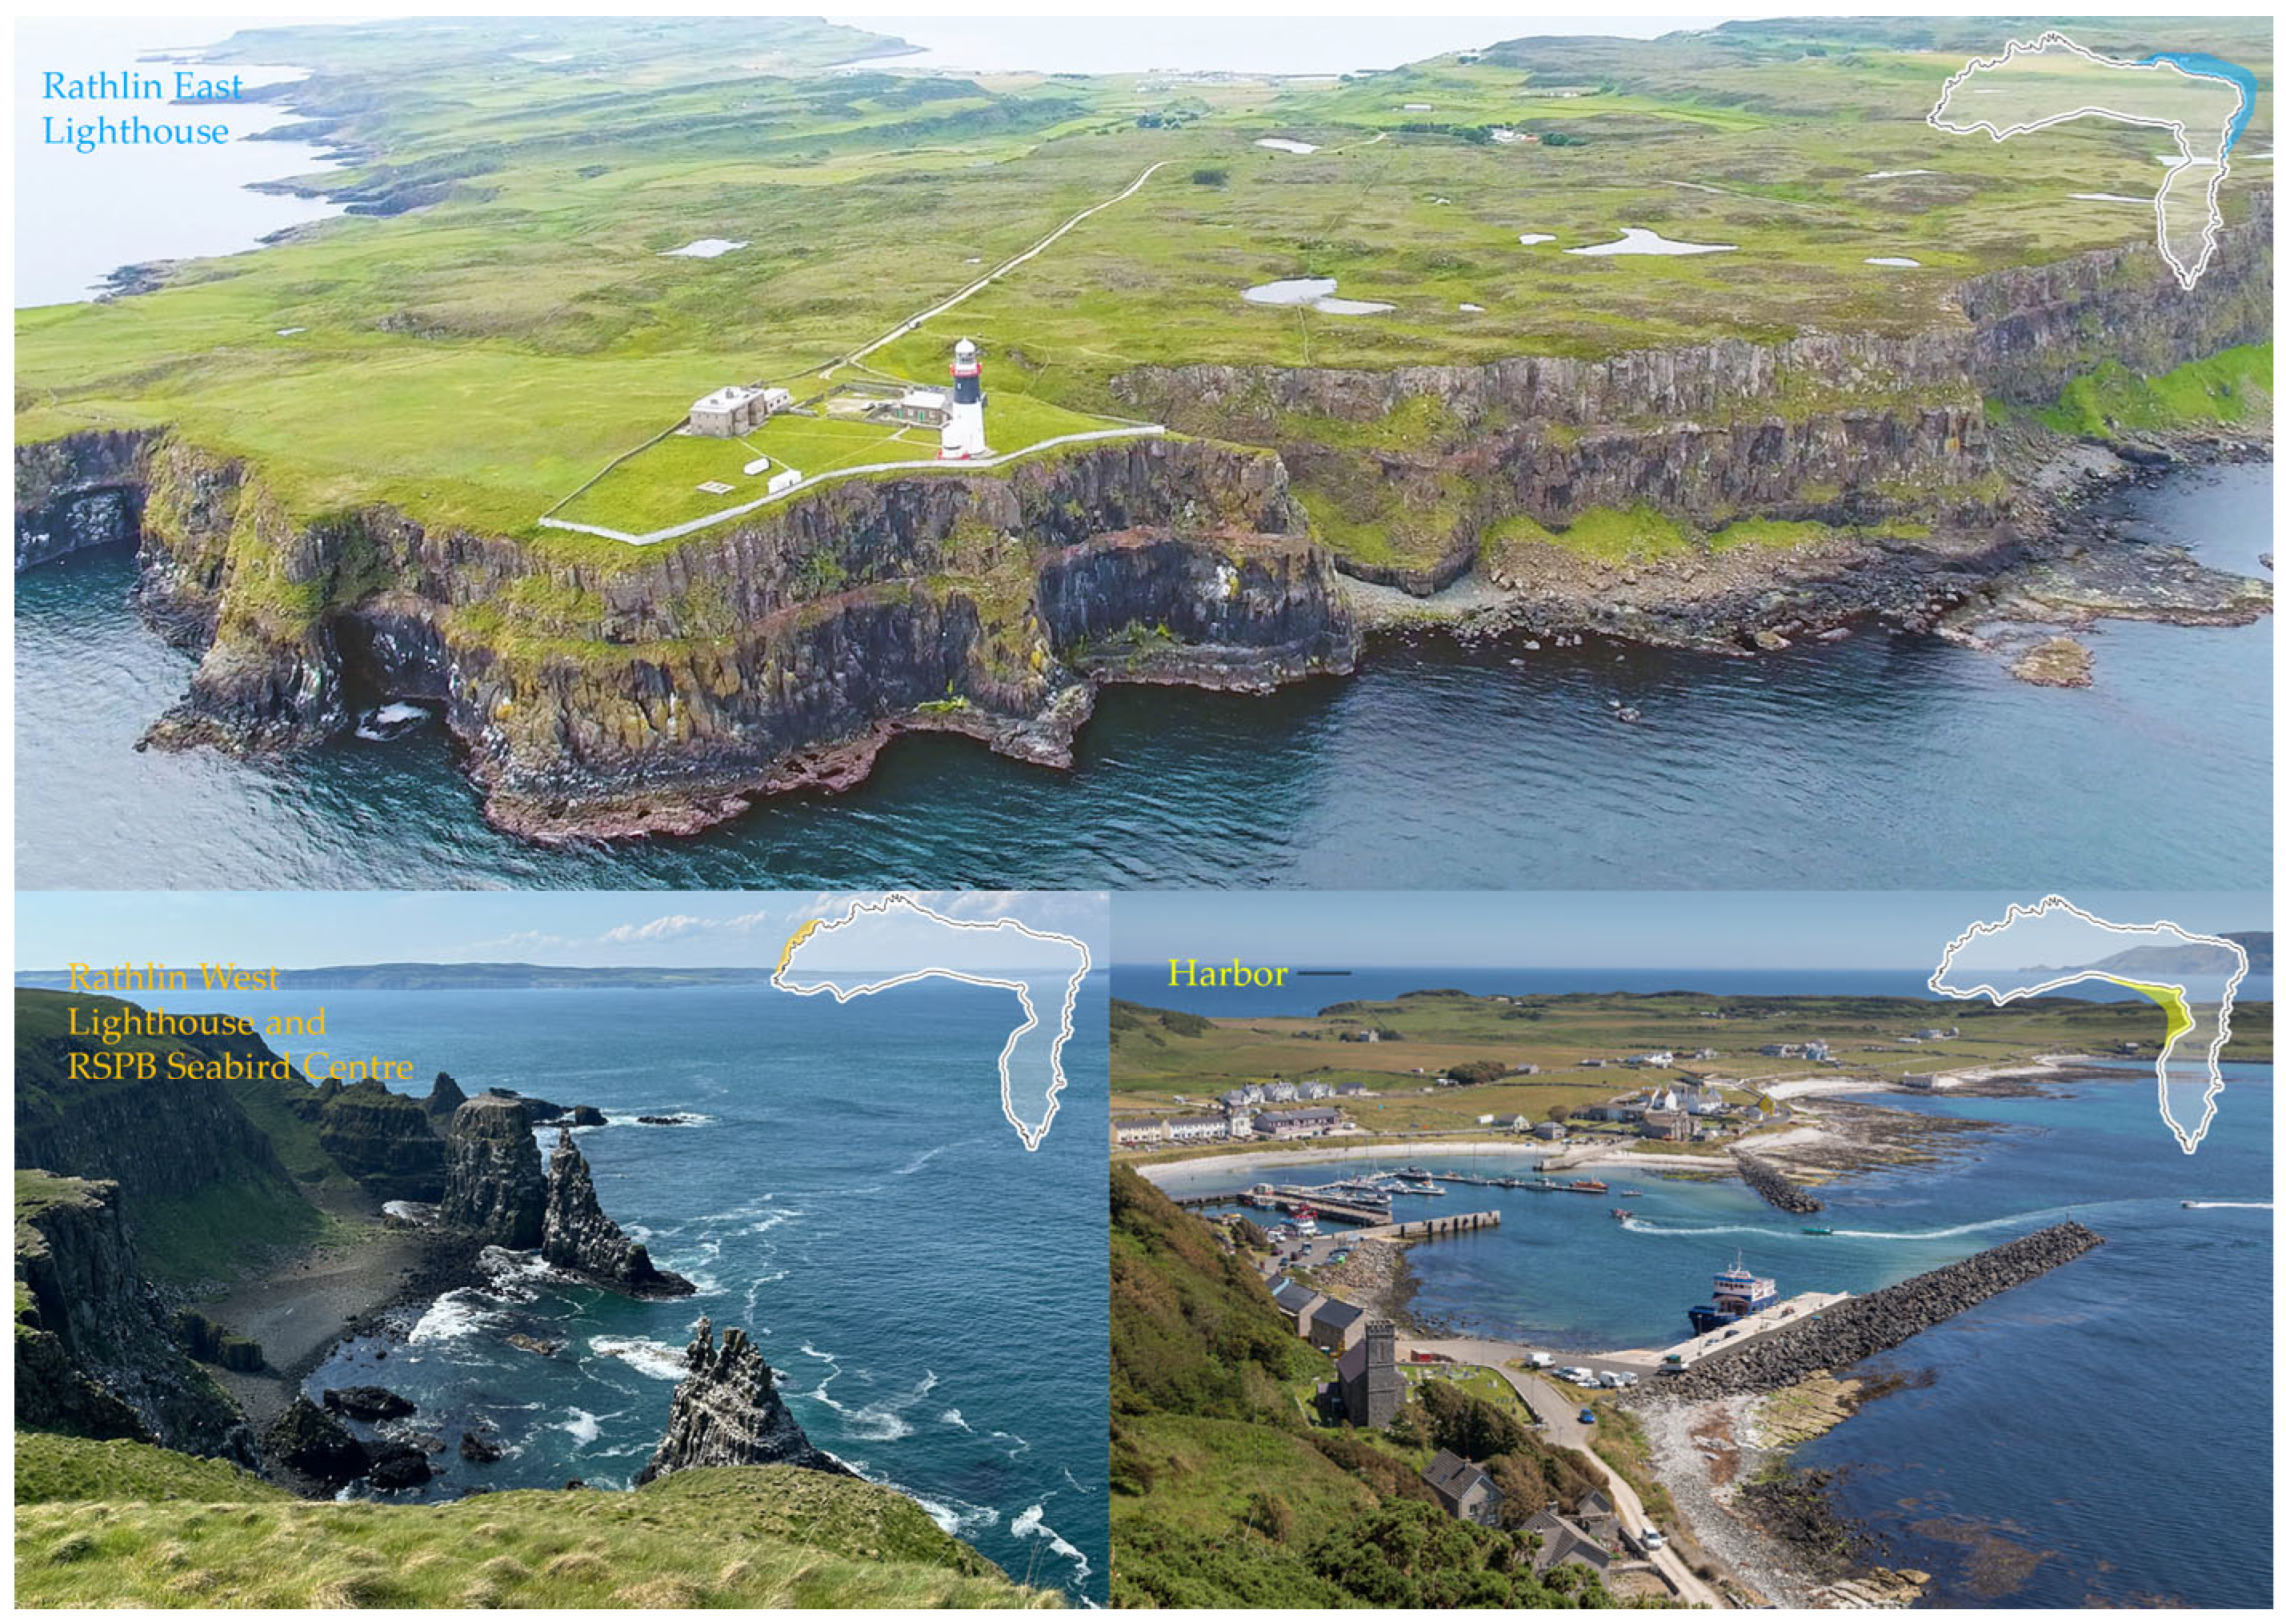
3.1. Case Study Area

Rathlin Island, situated in the North Channel, 4.2 km from Fair Head in County Antrim and 23.3 km from the Mull of Kintyre in Scotland [42,43]. From Bull Point, at the western extremity, to Bruce’s Castle in the east is 7.4 km; and from Altacorry on the north-east shore to Rue Point is 5 km [43]. The harbor and main settlement area of the island are at Church Bay [44]. The island is accessed by ferry from Ballycastle harbor, the journey taking around 40 min. The island has an area of approximately 1420 hectares [44]. Its population has been steadily growing and currently stands at approximately 163 people, making it the most northerly inhabited island off the coast of Northern Ireland. The island, shaped in a reverse-L formation, spans four miles (six kilometers) from east to west and 2 + 1/2 miles (four kilometers) from north to south (Figure 1) [44]. Figure 2 presents a composite aerial view of three key sites on Rathlin Island: the East Lighthouse, the West Lighthouse and RSPB Seabird Centre, and the main harbour. These images provide a spatial and visual narrative of the island’s geography, edge conditions, and maritime infrastructure (Figure 2). The annotated outlines highlight the specific locations of each site along the island’s coastline. Aerial photography, as shown here, enhances the visual storytelling approach by offering a broader perspective of the island’s topographical character and ecological context.
Historically, Rathlin Island’s geographical significance has been recognized in historical cartography [45]. It was notably depicted with exceptional accuracy in early Portolan Charts by Venetian cartographers as early as the 14th century, including works by Francesco Pizigano in 1373 and Jacobus de Giroldis in 1422 [45]. As Michael C. Andrews documents in Rathlin Island in the Portolan Charts in 1925, the island appears with exceptional precision in several 14th- and 15th-century Portolan charts produced by Venetian cartographers [45]. Regarding its cultural heritage, Rathlin Island has maintained close cultural ties with its northern neighbor [45]. From the fifteenth century, it was under the ownership of the Scottish McDonnell family before being sold to John Gage in 1746 [45]. Gage, an Anglican clergyman from nearby County Derry, belonged to the established ruling class in Ireland. The ownership of the island property remained within his family until the early twentieth century [45]. Gage’s acquisition of the island coincided with a period of economic expansion, during which Irish landowners were encouraged to view the improvement of their estates as both a moral and patriotic imperative [45,46].
During World War II, Rathlin Island was home to a coastal observation post located at the island’s western point, overlooking the Atlantic Ocean [47]. This structure (Building ID 18411), recorded in the Northern Ireland Buildings Database, was built as part of the island’s wartime coastal defense system [47]. According to the archival record, the building is a small reinforced concrete structure with a square plan, flat roof, and narrow slits offering visibility toward the sea—typical features of early 20th-century military lookout posts (Figure 3). Although often referred to locally as a “radar station”, no formal evidence has been found to confirm the installation of radar technology at this location [47]. Instead, the structure functioned primarily as a visual watchpoint, used for manual observation of enemy aircraft and naval activity across the North Channel [47]. Its strategic placement and surviving physical form make it a significant site in Rathlin’s wartime landscape narrative [47]. Archival evidence of this radar installation, including associated aerial imagery, is preserved in the collections of The National Archives (UK) (Figure 4). In constructing a time-anchored visual narrative, this study incorporates the Ordnance Survey—Quarter Inch to the Mile Maps of Scotland, 3rd Edition (1940–41), RAF (War) 2nd Edition. Produced by the Royal Air Force during World War II, this cartographic series was intended for strategic military use and provides highly reliable topographic information from the wartime period.
Rathlin Island’s ecosystems are characterized by a high degree of biodiversity, including several endemic species [48]. However, the island’s small size and geographic isolation make it particularly vulnerable to environmental changes, including climate change, habitat loss, and the impacts of human activities [49]. The conservation of Rathlin Island’s unique ecosystems requires a comprehensive understanding of its cultural and ecological landscapes, informed by both scientific data and local knowledge [50]. For example, Rathlin’s seabirds are under threat from non-native species such as brown rats and ferrets [51]. Rathlin Island Special Protection Area (SPA) is designated for breeding guillemots and peregrine falcons [51].
Rathlin Island shares several defining characteristics with many small islands across the British Isles: peripheral geographical location, ecological vulnerability, limited access to natural resources, and the presence of complex, multi-scalar governance frameworks. As noted by Cooney [46] in his comparative analysis of Rathlin, Lambay, and the Shetland Islands, such island communities—despite their local distinctions—are subject to shared structural conditions shaped by environmental constraints, material dependencies, and identity formation processes embedded within broader regional systems [46]. However, what distinguishes Rathlin from other islands is its uniquely nested governance configuration. It exemplifies an “island within an island” model: a small island administered by Northern Ireland, which itself occupies a portion of the island of Ireland and is situated within the wider jurisdiction of the United Kingdom. This “Russian Doll” administrative structure introduces an added layer of complexity in infrastructure development, spatial landscape planning, and environmental regulation. Therefore, Rathlin Island serves as a particularly instructive case.
In recent years, Rathlin Island has become increasingly embedded within Northern Ireland’s long-term spatial and infrastructure planning frameworks. As outlined in the Regional Development Strategy 2035 (RDS 2035), the island is part of a broader vision that promotes balanced regional development, enhanced accessibility, and sustainable environmental management [52]. The strategy identifies the need to support remote and insular communities through targeted investment in connectivity and infrastructure, aligning with wider goals of decarbonisation and spatial equity [52]. In this context, the Department for Infrastructure (DfI) has announced plans to replace the ferries serving Rathlin Island and Strangford Lough, aiming to improve reliability, reduce emissions, and enhance quality of life for residents and visitors [53]. Complementing this regional vision, the Rathlin Island Harbour Environmental Statement, developed under statutory Environmental Impact Assessment (EIA) protocols, provides a detailed appraisal of the island’s core transport infrastructure [53]. The document highlights the strategic importance of the harbour in maintaining the island’s economic viability, social cohesion, and emergency access [53]. It also identifies key ecological and visual sensitivities linked to proposed development, including the need to preserve designated habitats and mitigate construction-related impacts [53]. Through a suite of targeted measures—such as biodiversity safeguards, phasing plans, and stakeholder consultations—the report reflects a context-sensitive planning approach tailored to island geographies. Together, these policy- and project-level frameworks illustrate how Rathlin’s development is governed by a multi-scalar system that integrates regional planning objectives with local ecological constraints and community needs.

3.2. Methods

The research methodology adopts multiple perspectives and different visual tools, supporting the aim of addressing the research question. The research methodology systematically categorizes data from diverse sources, including websites, maps, documents, posters, media, articles, and books. These data provide a lot of information related to the study’s objectives. Following data collection, the information is organized into distinct categories based on thematic relevance, spatiotemporal features, or other factors deemed appropriate for this research methodology. Afterwards, various software packages and technical methods are used to analyze the data under categories from different research perspectives. This analytical process involves the application of professional software tools such as the Historic Environment Map Viewer, Environment Digimap, Google Maps and Google Street View, and ArcGIS Field Maps. Through meticulous mapping and analysis, different types of data were standardized, organized, and stored to create a detailed and comprehensive analysis of the islands. Through analysis, different types of data are reorganized to enable a detailed and comprehensive understanding of the island. The chosen technology is intended to integrate diverse sources of information into a very good format to understand.
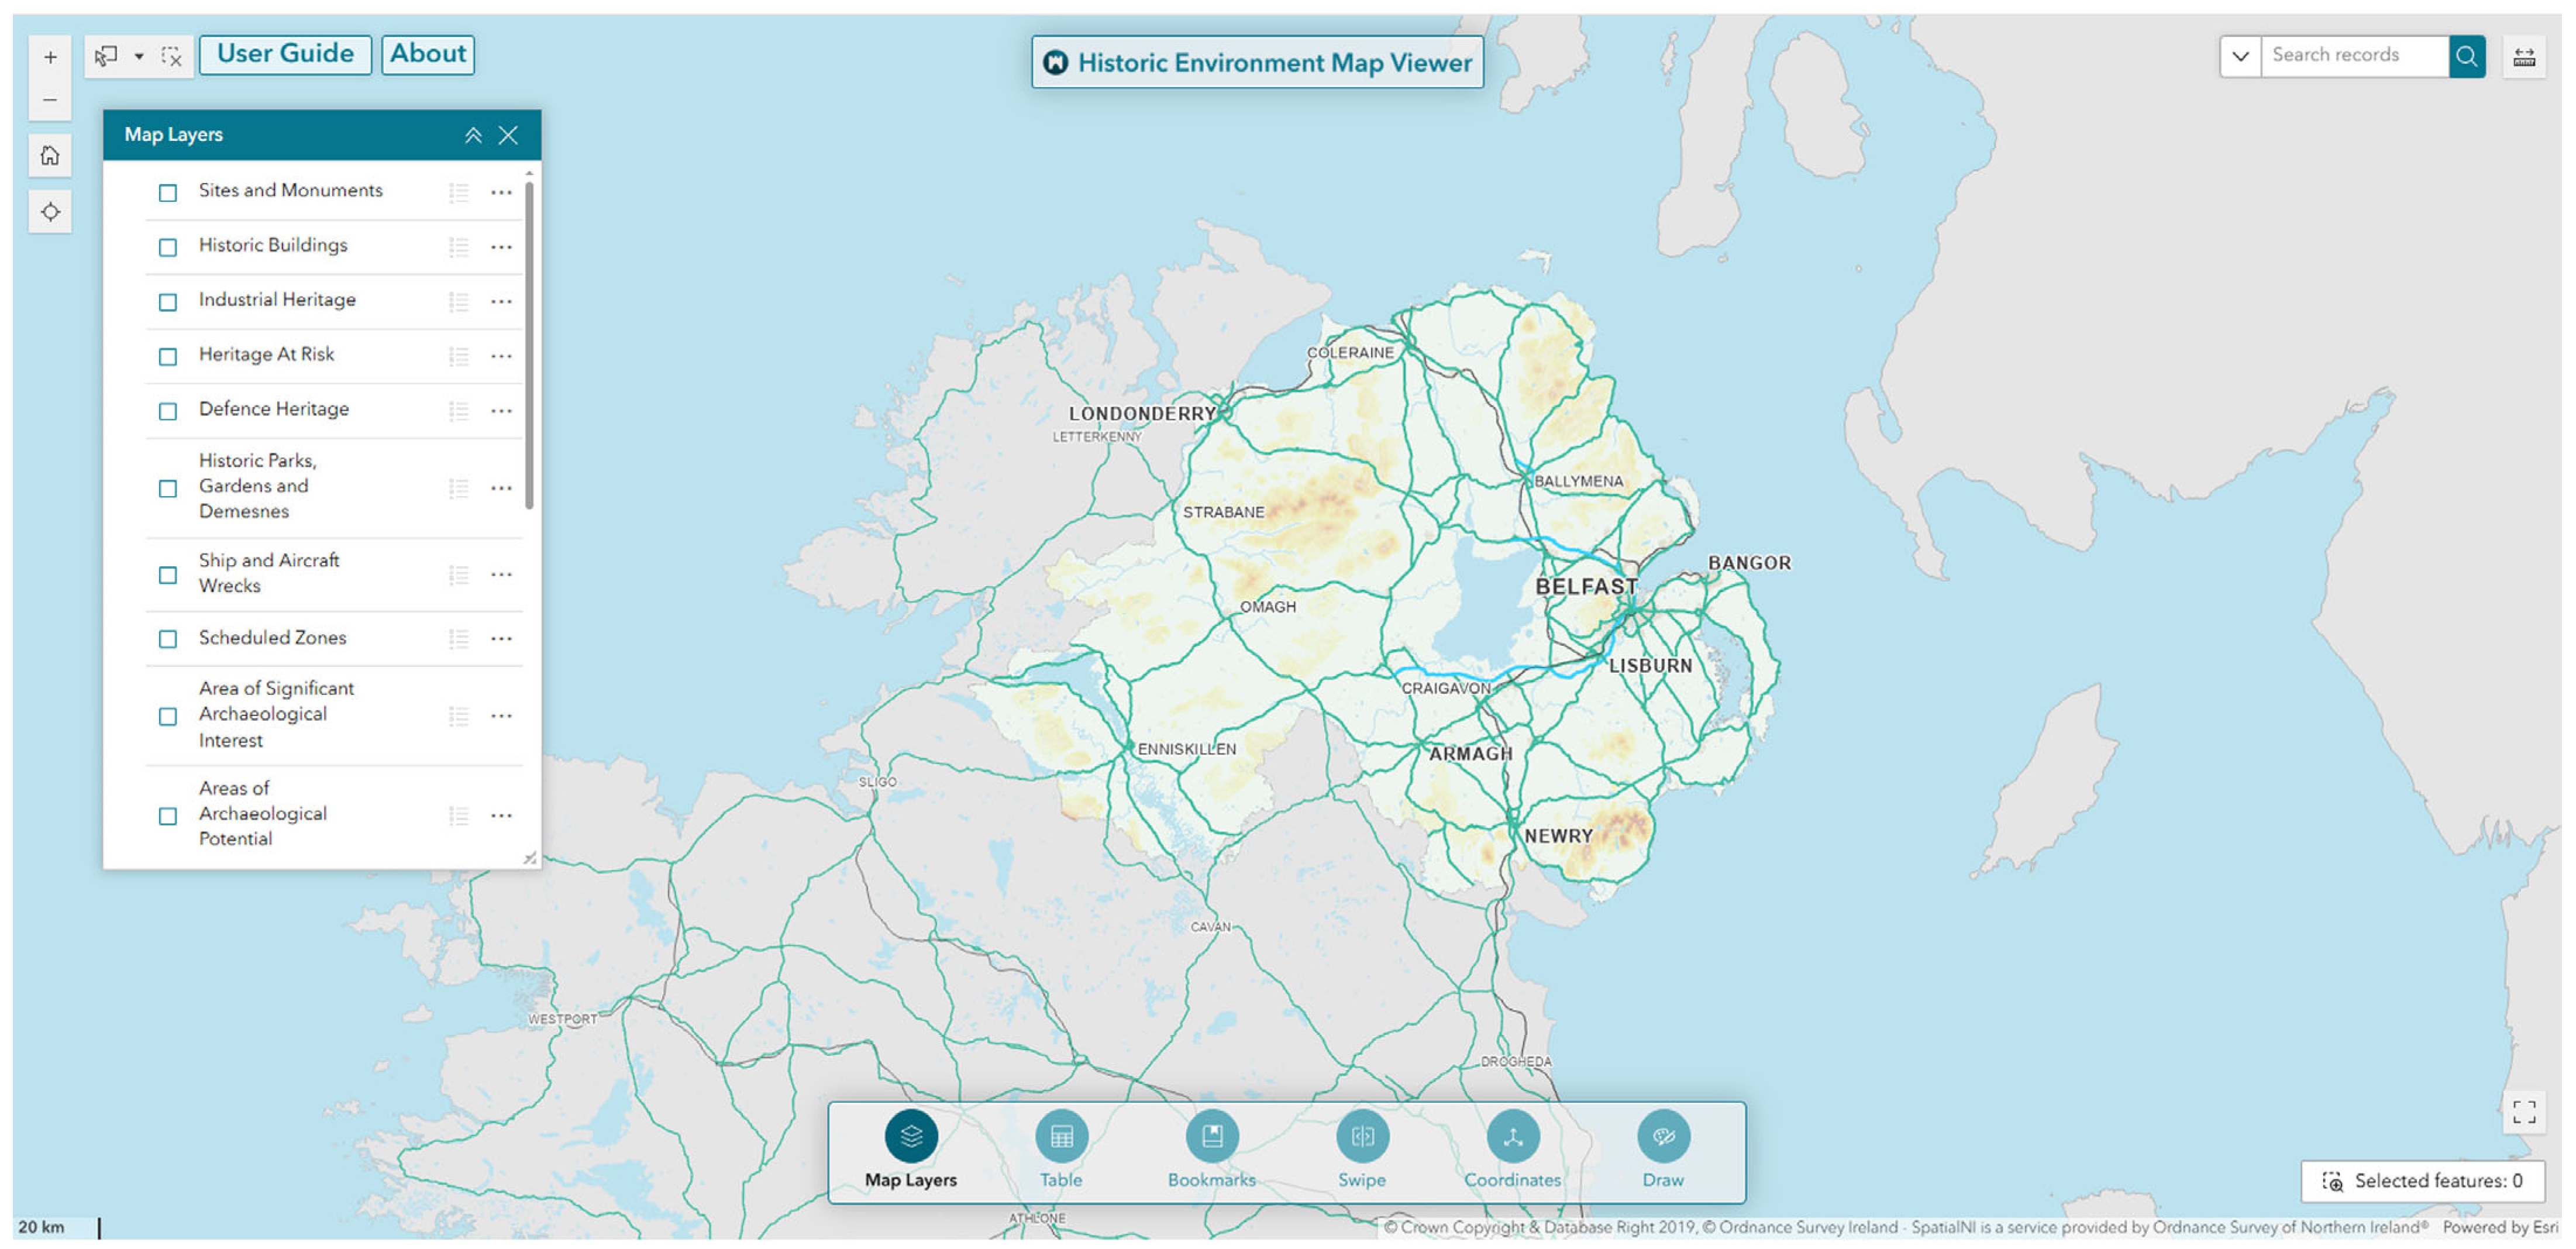
  • Method one: Historic Environment Map Viewer
The Historic Environment Map Viewer, managed by the Department of Housing, Heritage, and Local Government, is an invaluable tool for accessing data related to the cultural and historical landscapes of islands (Figure 5) [54]. It allows users to examine the spatial patterns and cultural value of historic sites, monuments, and architectural heritage [54]. By integrating historical layers with contemporary mapping, this tool enables researchers, planners, and designers to understand the temporal evolution of island landscapes [54]. This understanding is crucial in preserving cultural heritage while also guiding new developments that respect and integrate with historical contexts.
On Rathlin Island, the tool can assist in identifying key heritage locations such as early settlements, religious landmarks, and historic battlegrounds. These findings can be embedded into landscape design and planning frameworks to avoid potential conflicts with heritage zones. Additionally, the map’s visual outputs support heritage storytelling by weaving historical narratives into the physical and cultural fabric of the island.
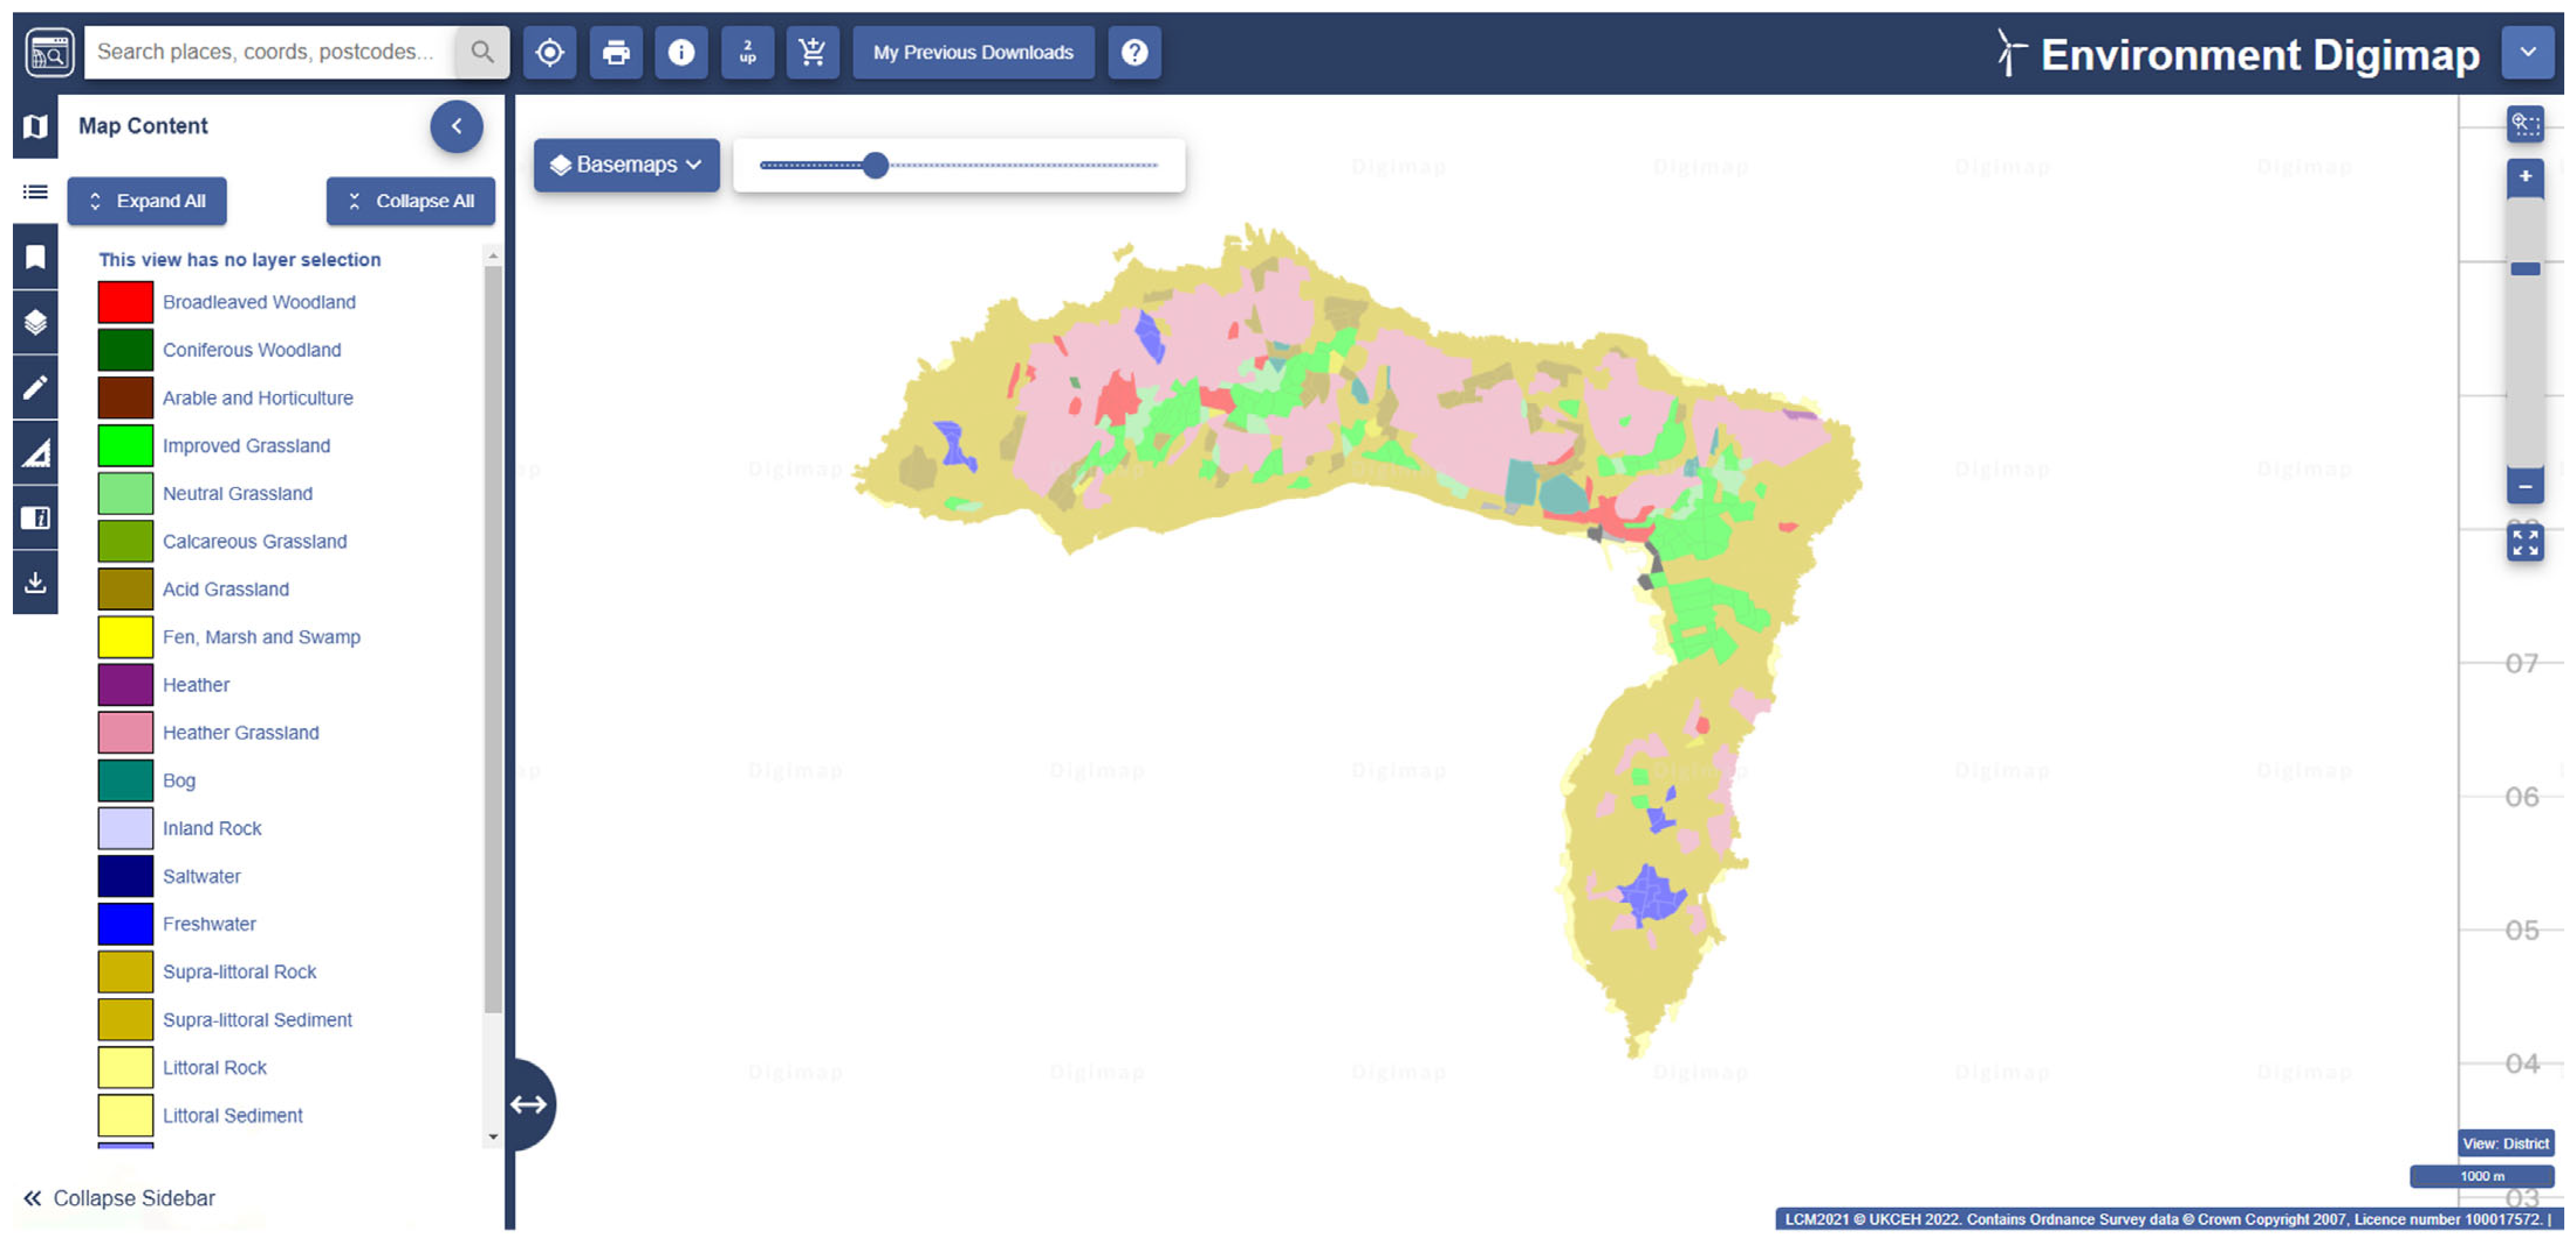
  • Method two: Environment Digimap
Environment Digimap offers access to mapping data provided by the UK Centre for Ecology and Hydrology [55]. It achieves this by classifying the physical materials that make up the UK’s surface, presenting a comprehensive national dataset of land cover categories. These categories encompass various landscapes, including grasslands, woodlands, and freshwater bodies, as well as urban and suburban built-up areas [55]. Download the land cover map data from the website and use GIS Pro mapping to analyze the spatial and temporal changes in land use across different years on Rathlin Island (Figure 6).
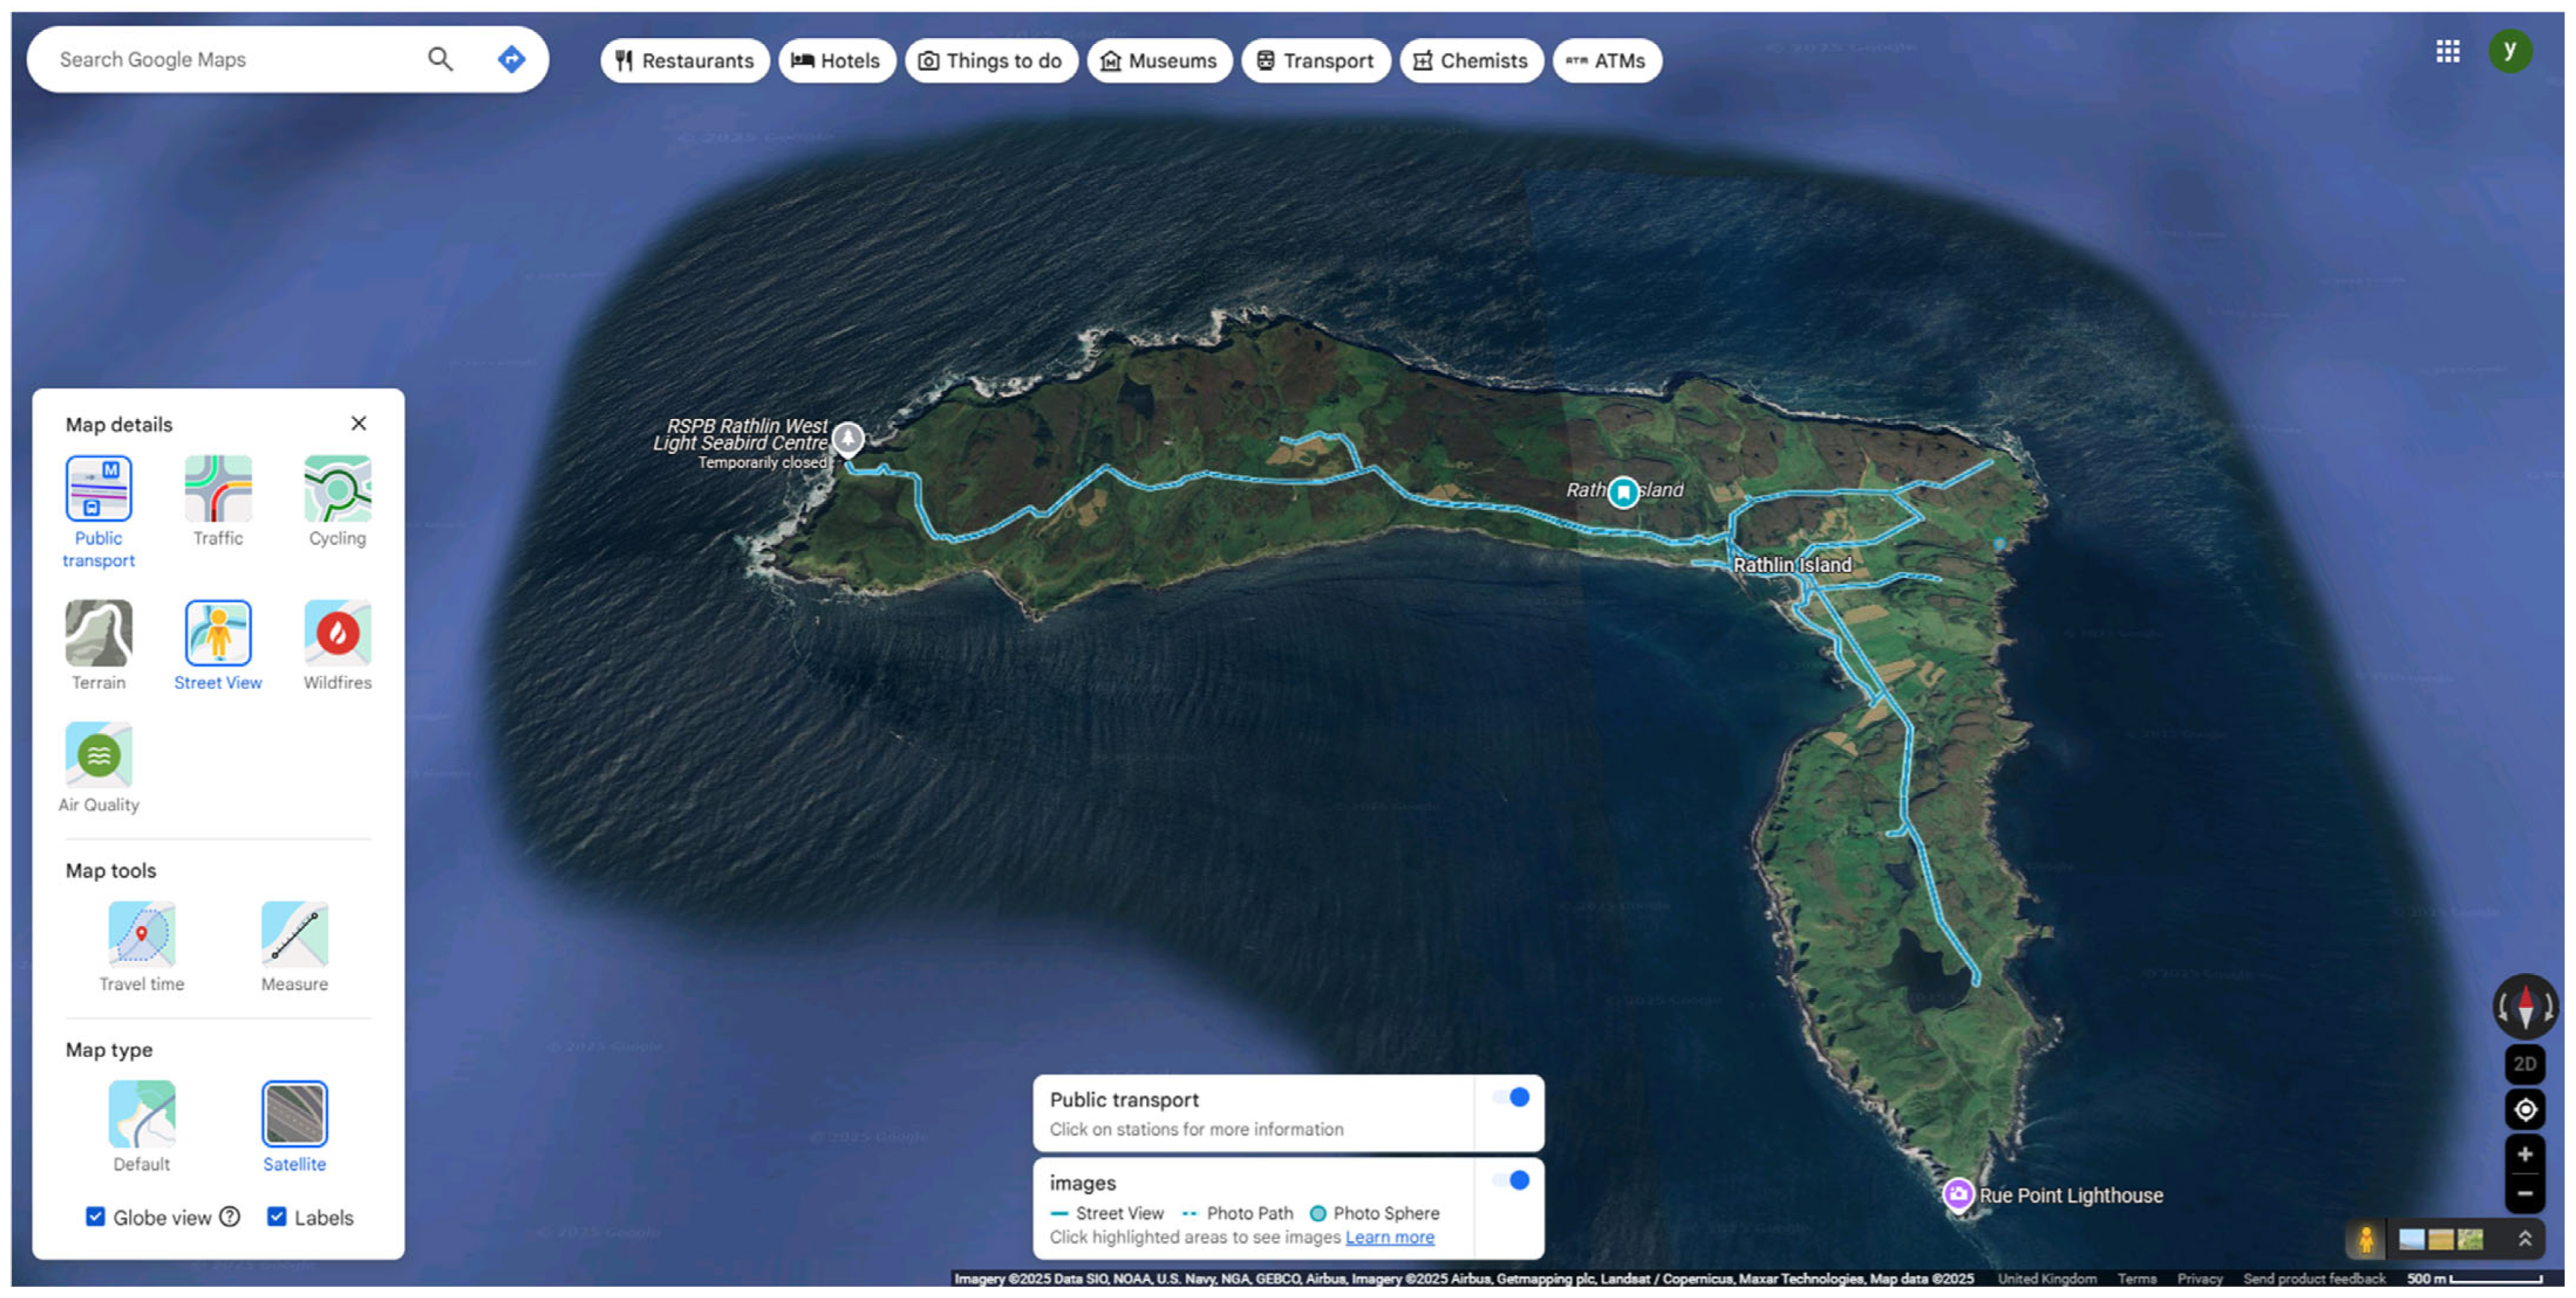
  • Method three: Google Maps and Google Street View
Google Maps is a widely accessible digital mapping tool that provides turn-by-turn navigation and utilizes real-time traffic data to suggest the most efficient routes to a given destination [56]. Google Street View is widely recognized as one of the most prominent and extensively used services providing street view imagery [56]. Google Street View is a technology featured in Google Maps and Google Earth that provides interactive panoramas from positions along many streets in the world (Figure 7) [57]. Using Google Street View, researchers can conduct “virtual” field audits of neighborhoods [58]. In the case study, a primary public transport route extends across the island from east to west, with four additional roads branching towards the northern region. The research methodology utilizing Google Street View will involve a systematic selection of six points along this primary route for visual analysis and comparative study.
  • Method four: ArcGIS Field Maps
ArcGIS Field Maps is a mobile app solution that uses data-driven maps to help fieldworkers perform mobile data collection and editing, find assets and information, and report their real-time locations [59]. ArcGIS Field Maps is the go-to field app, powered by field maps, that streamlines the critical workflows field personnel use every day. Because it is built on ArcGIS, everyone—whether in the field or the office—will benefit from using the same data. ArcGIS Field Maps enables simultaneous access for multiple users, with real-time updates available in areas with internet connectivity [60]. During the field research, the app was used to capture images and record survey data, which were continuously updated via a computer in real time. The study involved two field visits to Rathlin Island, conducted on 7 February 2024, and 17 October 2024. During these trips, research data was systematically recorded using the ArcGIS Field Maps application (Figure 8).

4. Results

The integration of advanced technological tools such as the Historic Environment Map Viewer, Environment Digimap, Google Maps and Google Street View, and ArcGIS Field Maps plays a crucial role in enhancing the understanding and visualization of island environments. These tools facilitate the creation of dynamic, multifaceted narratives that are essential for sustainable future planning and landscape design on islands. Below is a detailed discussion on how each of these technologies can be utilized to achieve these objectives.

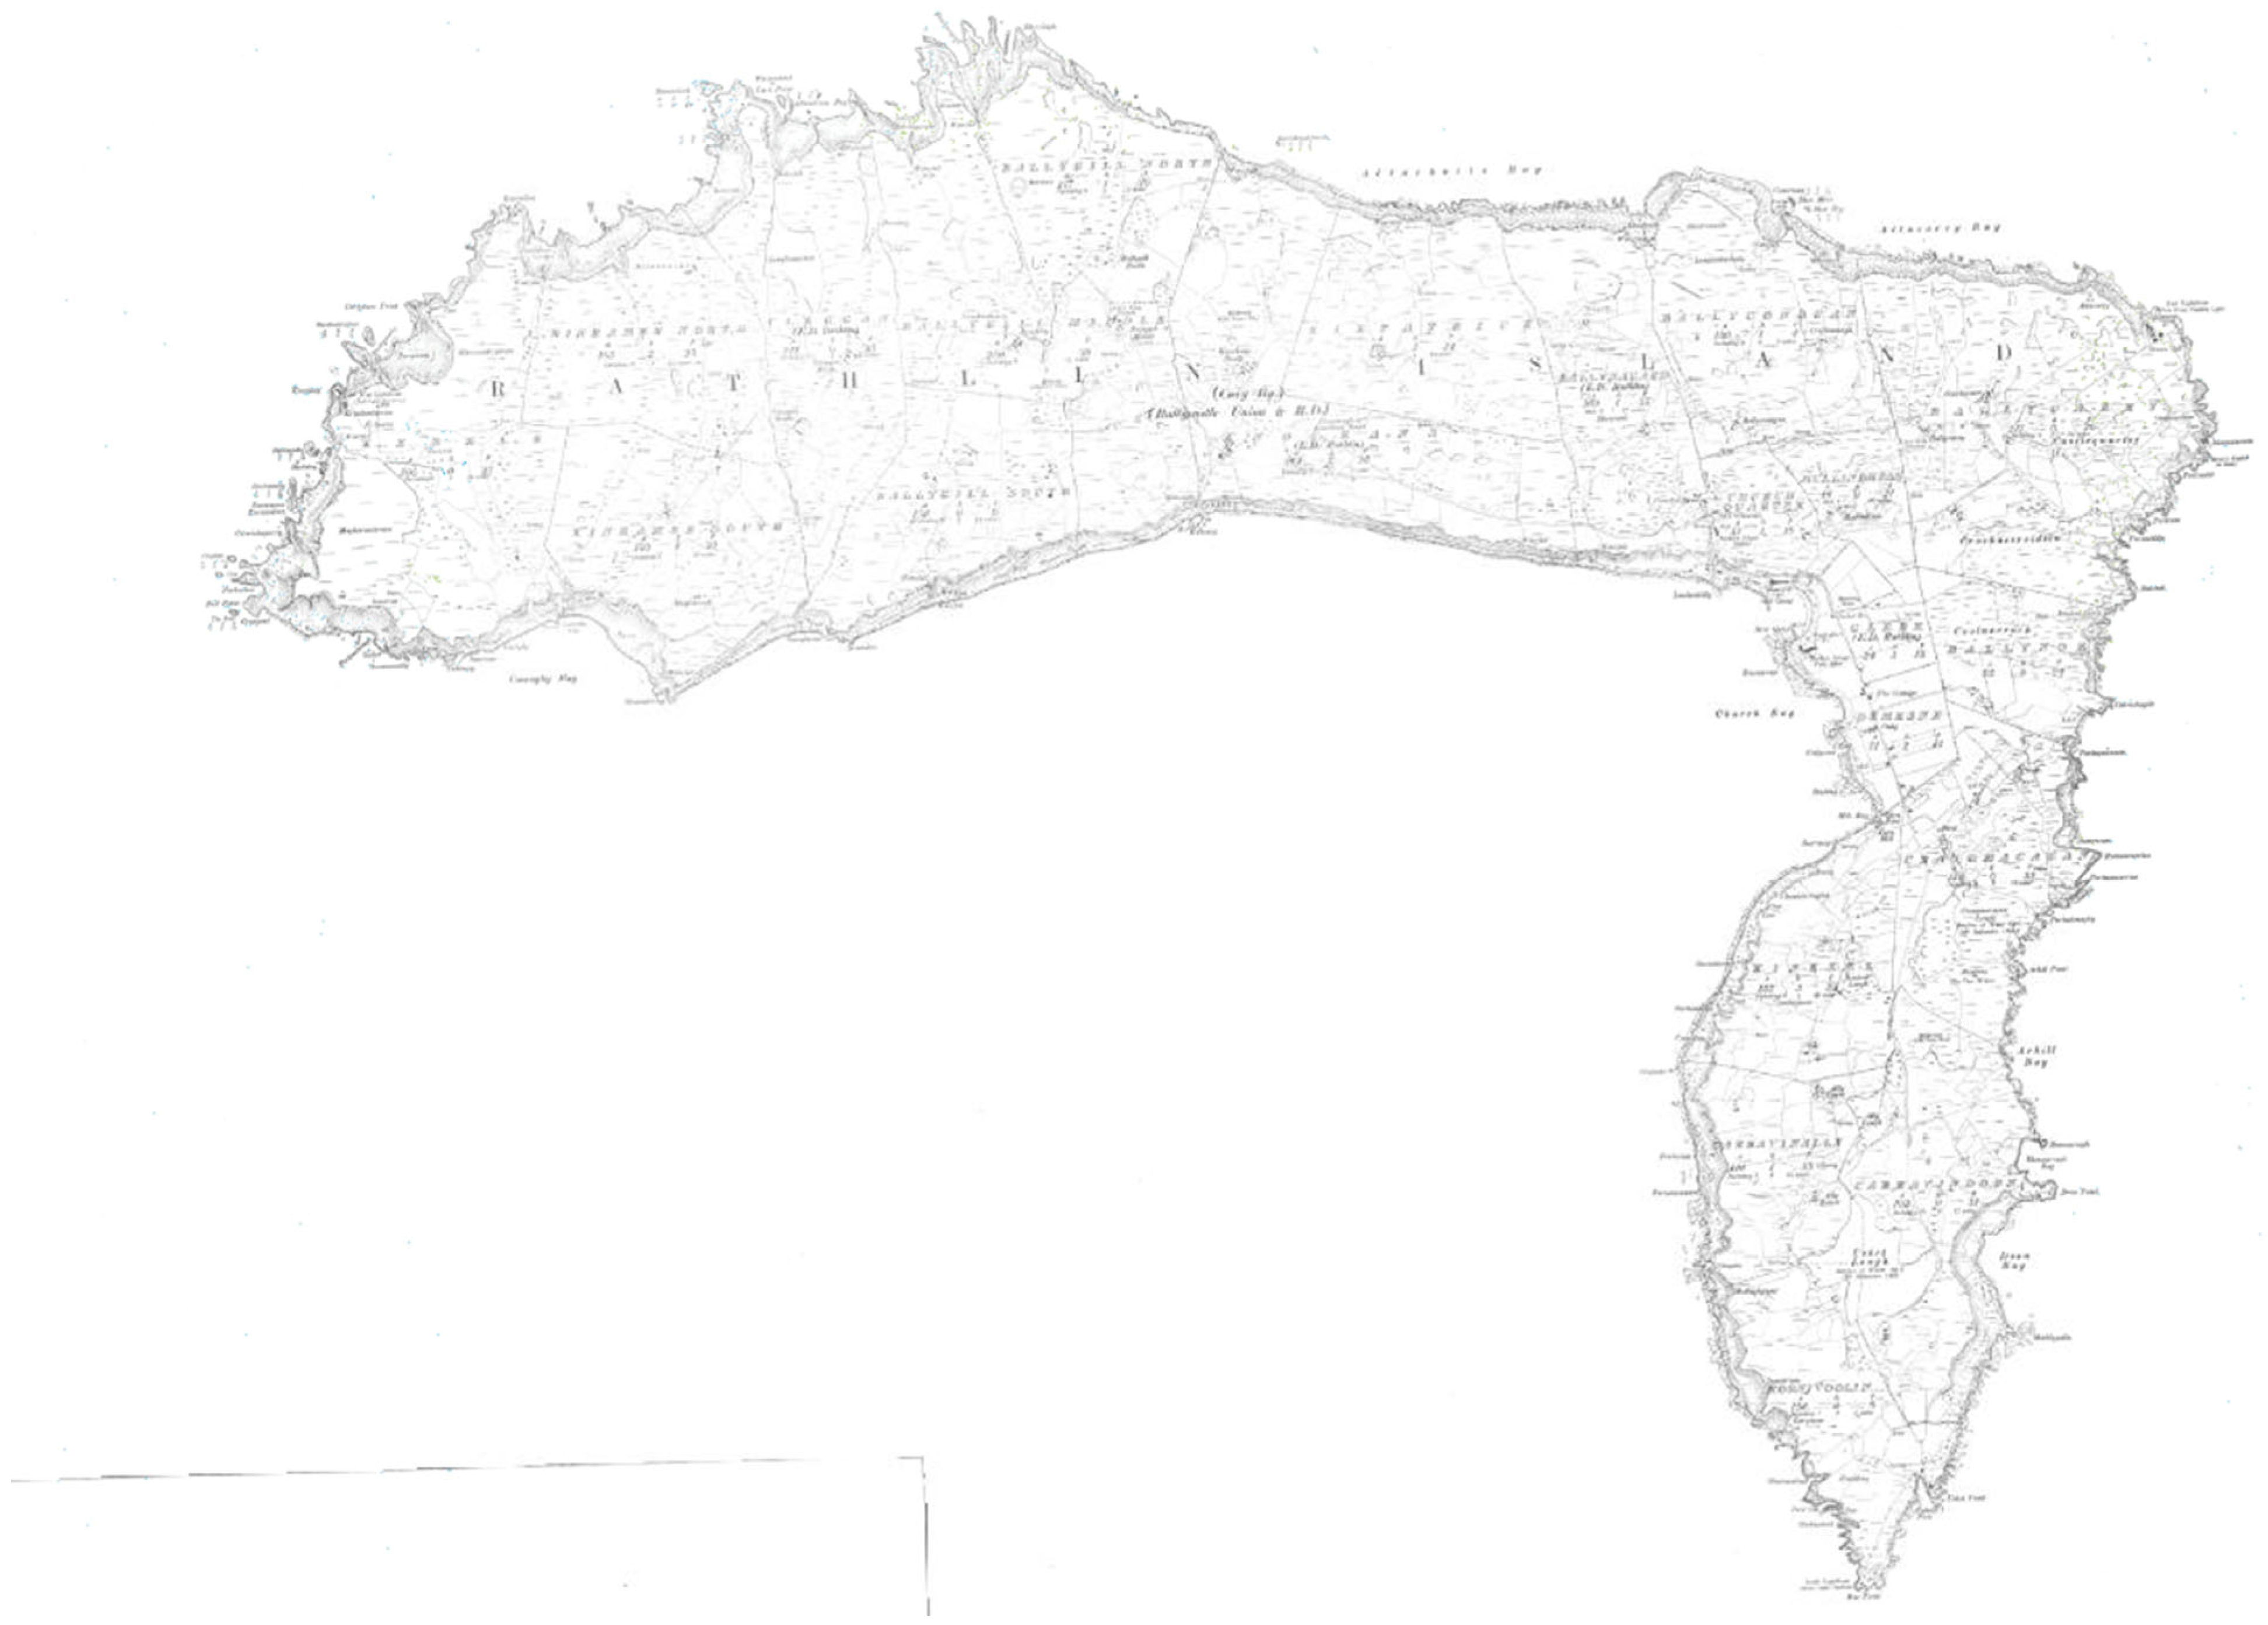
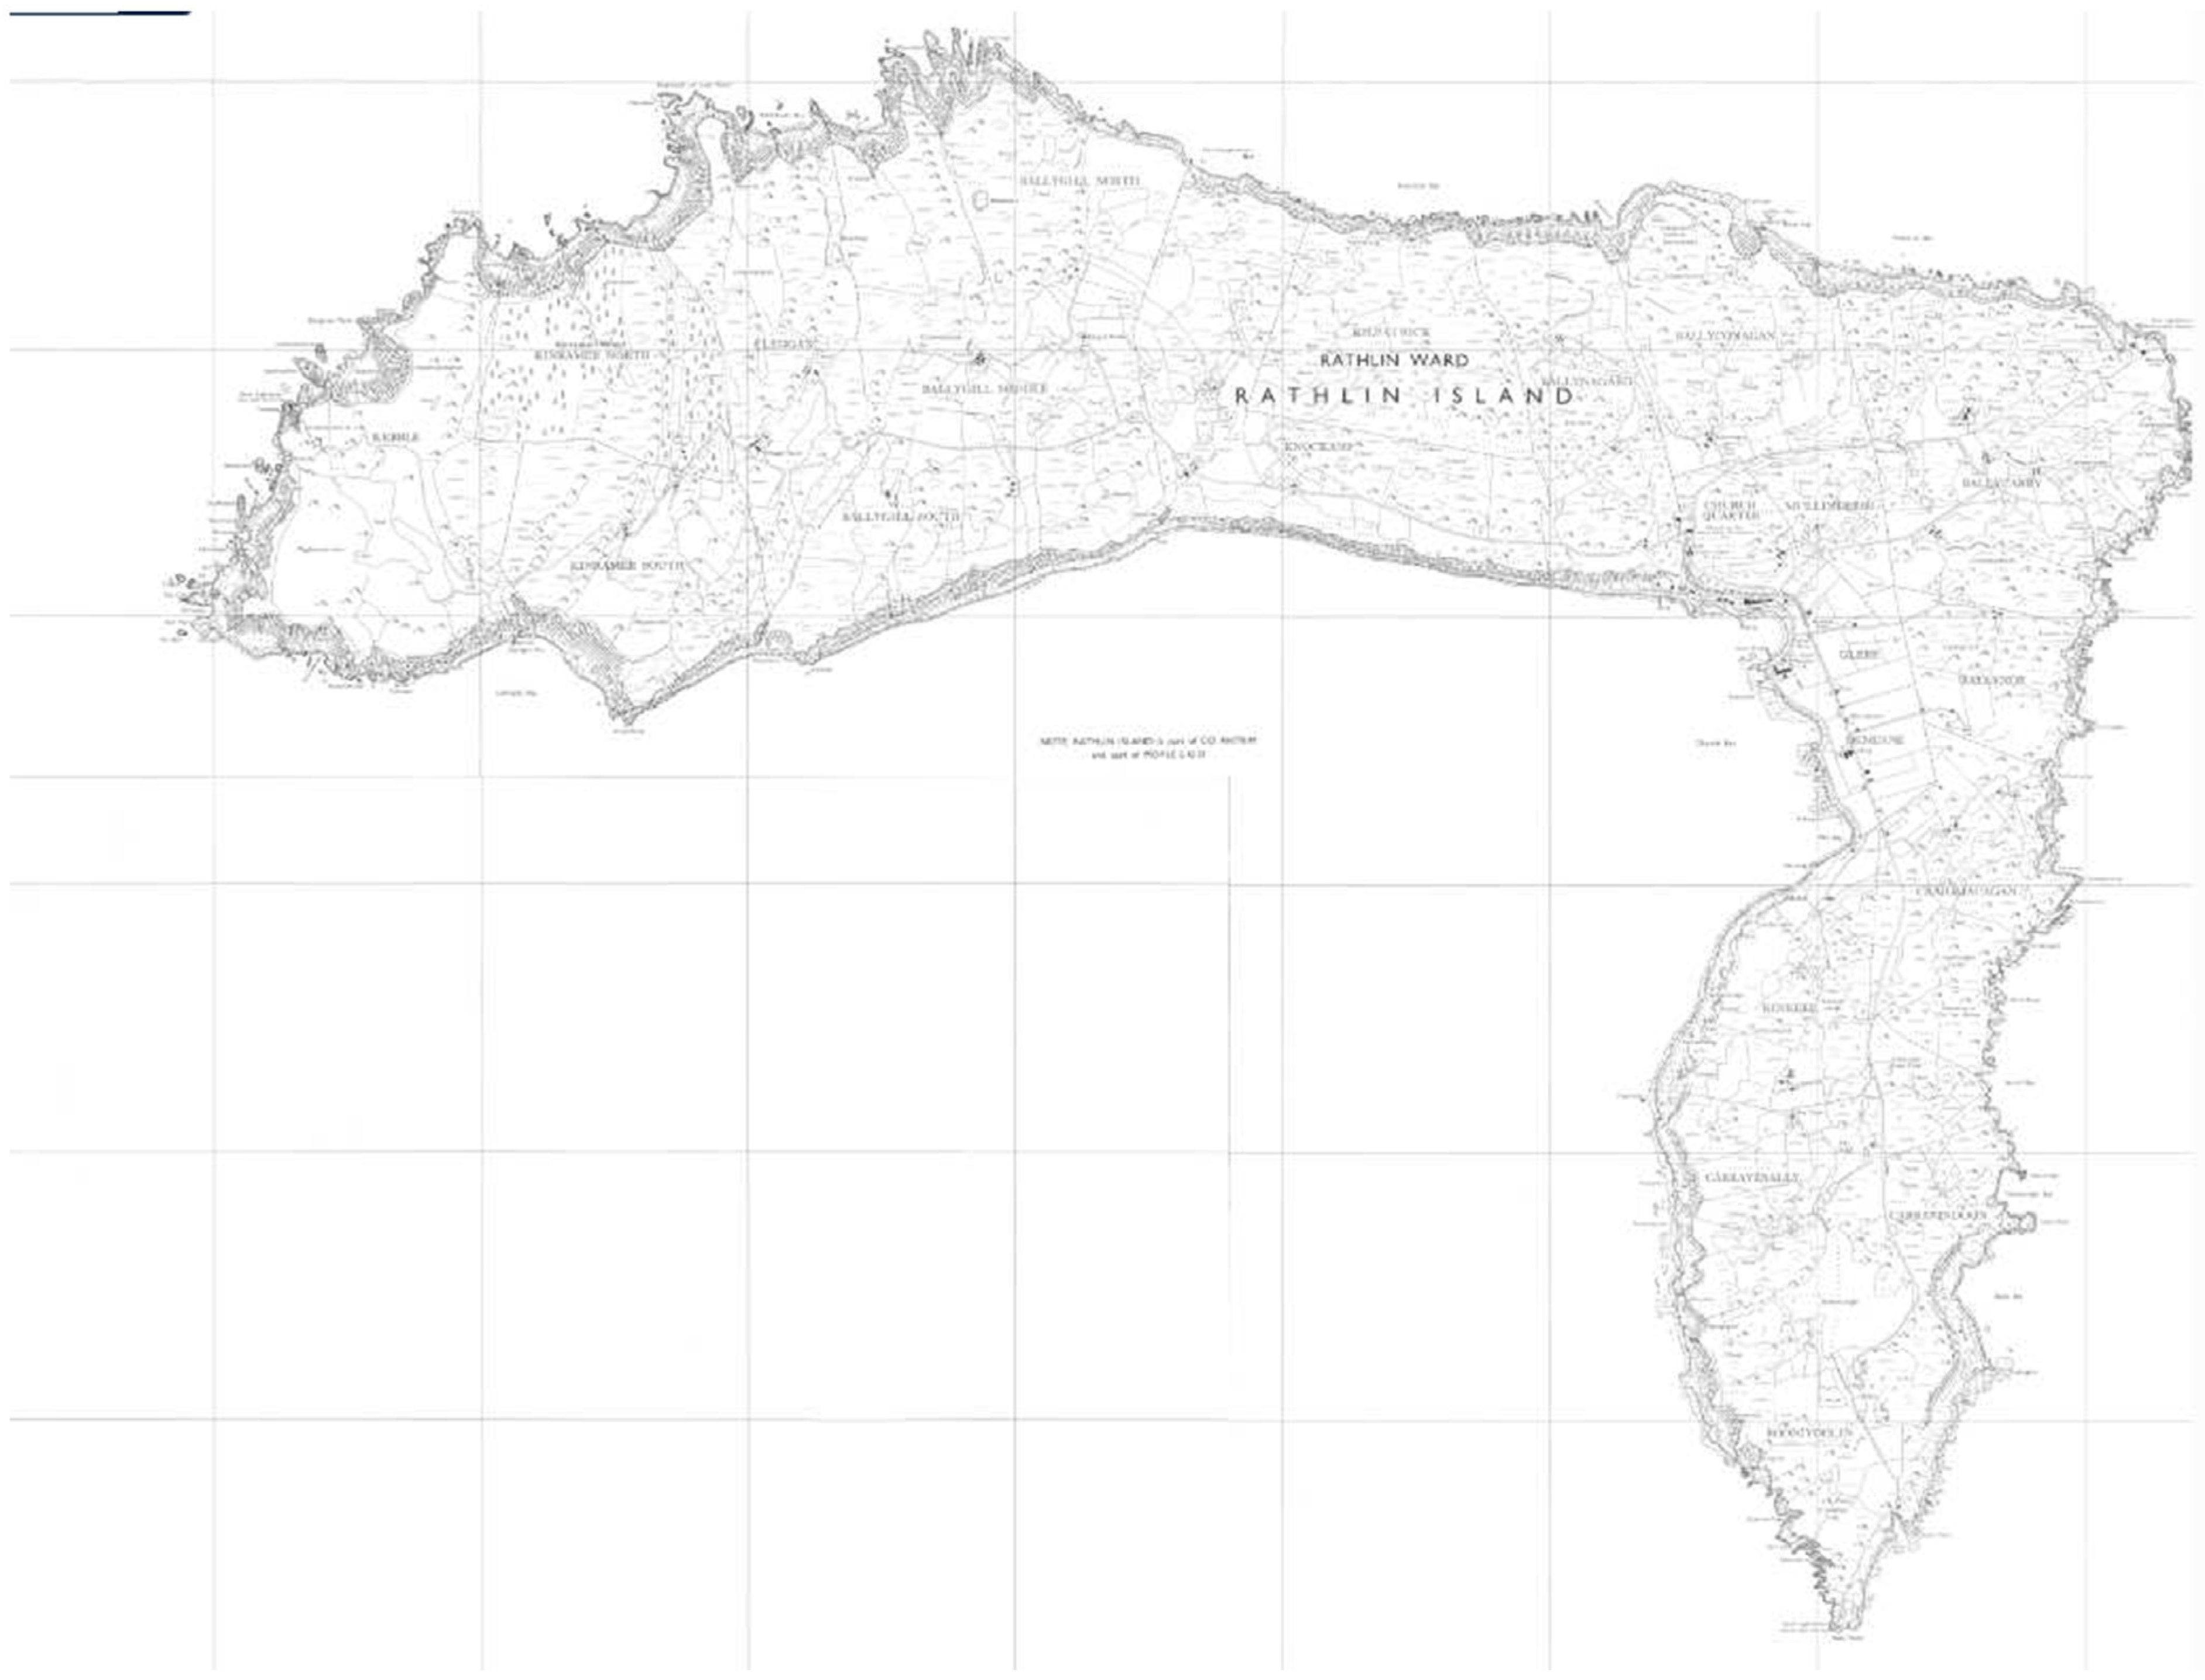
4.1. Results from the Historic Environment Map Viewer

The series of maps presented illustrate the geographical and infrastructural evolution of Rathlin Island over different time periods, specifically 1827, 1829–1835, 1838–1862, 1900–1932, 1916–1957, and 1957–1986 [54]. Comparative analysis of these maps provides insights into the historic environmental transformation of the island, focusing on changes in topography, land use, and infrastructure development.
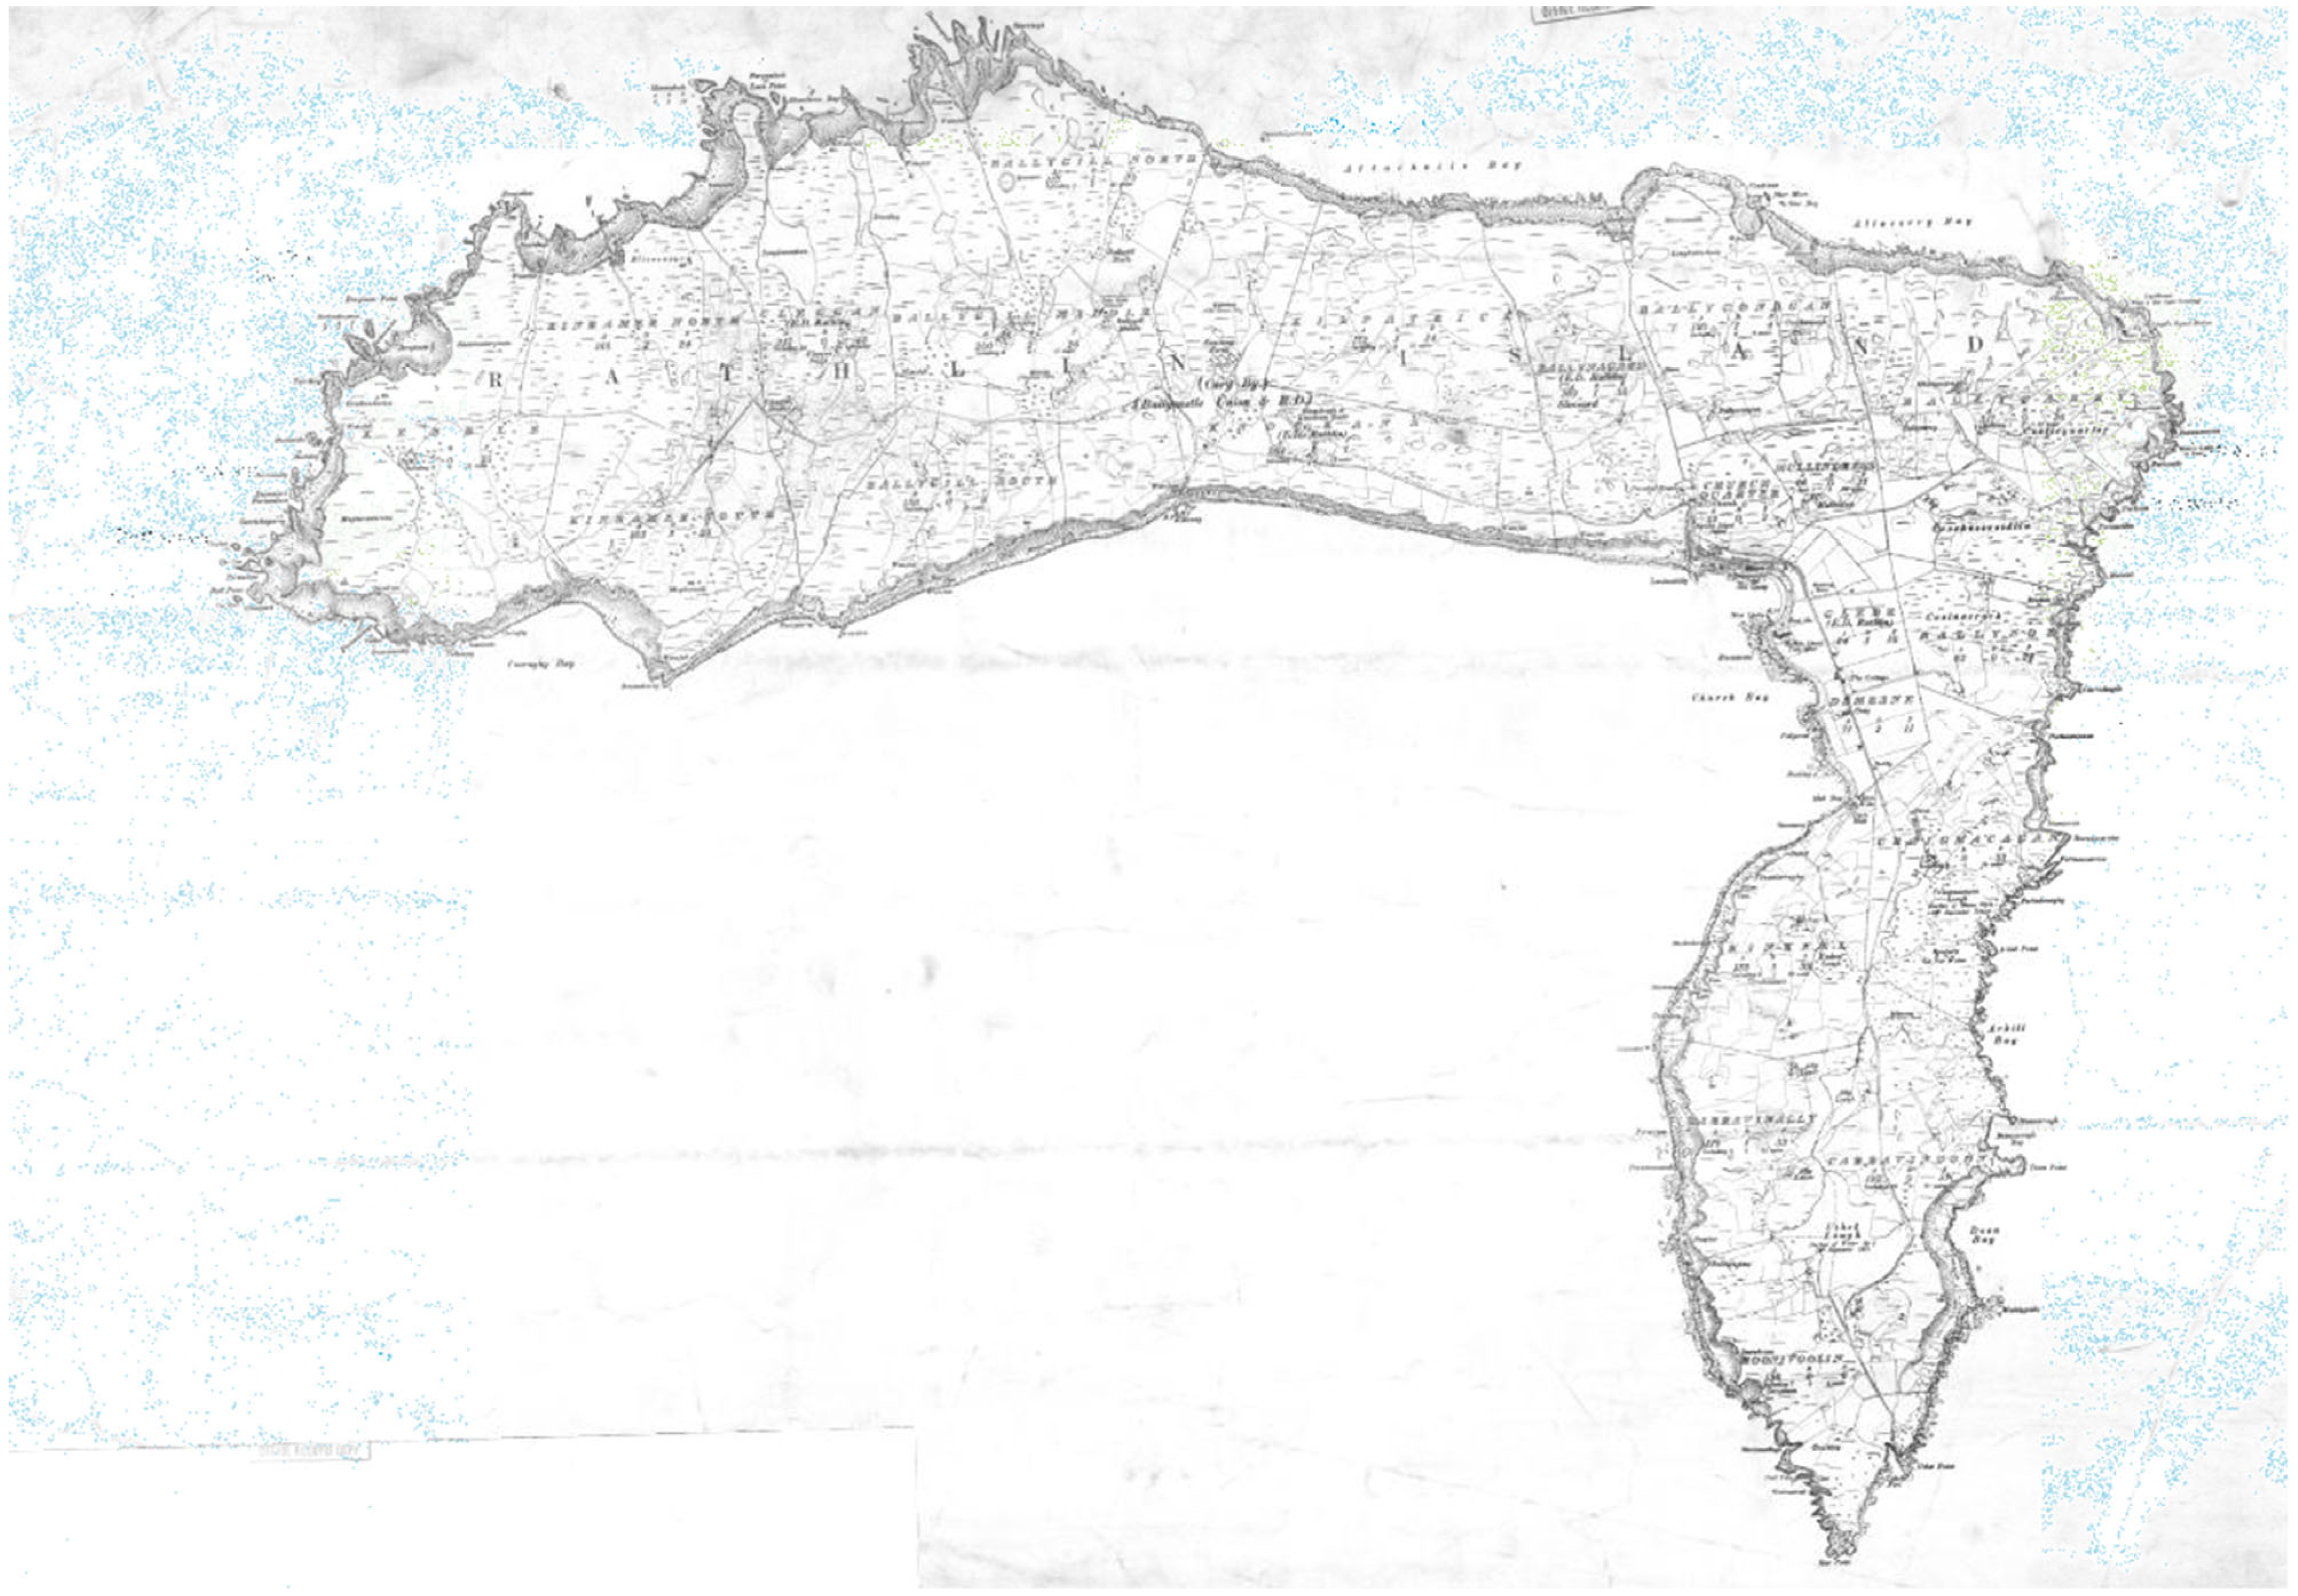
  • Topographical Changes
The 1827 map constitutes the earliest systematic cartographic record of Rathlin Island [61]. Characterized by a relatively basic style, the map delineates the island’s overall form while using shading and contour lines to indicate changes in elevation. Particular emphasis is given to the island’s southern and eastern areas, which are rendered with greater detail and prominence. This mapping effort was undertaken in response to the 1824 Royal Commission’s recommendations, which aimed to address issues related to land valuation across Ireland. The commission proposed a comprehensive survey of the island at a scale of six inches to one mile (approximately 1:10,560) to facilitate accurate land assessment [61]. The surveying process commenced in 1825 and was completed in 1827, marking the first systematic documentation of Rathlin Island’s geography (Figure 9).
1829–1835 Map: This edition builds upon the initial 1827 survey by incorporating more detailed environmental and infrastructural elements. It includes additional records of road networks, lakes, and contour lines, offering a clearer representation of Rathlin Island’s settlements within each townland [60]. For example, the “main road” extending southward from Demesne to Ushet is distinctly mapped, along with minor laneways connecting clusters of settlements to roads and adjacent agricultural fields [60]. However, this version lacks the delineation of field boundaries and property divisions, limiting its utility for land ownership assessments (Figure 10).
1838–1862 Map: The maps from this period exhibit greater detail for road networks and residential settlements, reflecting an increase in human activities across the island [60]. This period is particularly significant for the development of maritime infrastructure, as indicated by the construction of a docking facility to accommodate ships. This enhancement suggests a growing emphasis on maritime connectivity and economic interactions (Figure 11).
  • Infrastructure Development and Land Use [60]
1900–1932 Map: By the early 20th century, Rathlin Island witnessed notable infrastructural advancements. This period marks the initial efforts to modernize the island’s transportation network and land distribution (Figure 12).
1916–1957 Map: The cartographic records from this period further refine the depiction of roads, settlements, and agricultural land use (Figure 13). The increased detail in mapping suggests a heightened focus on land utilization, likely in response to population and economic changes.
1957–1986 Map: The later maps exhibit more comprehensive detailing of residential areas, roads, and other human activities, indicating continued infrastructure expansion (Figure 14). Notably, the development of tourism-related facilities is evident during this period. A significant example is the £54,000 grant provided by the Northern Ireland Tourist Board—acting as an agent for the International Fund for Ireland—to support the establishment of an activity center at the Manor House complex under the tourism amenities scheme [62]. The maps from this era also highlight the emergence of tourism infrastructure, including cafés and visitor reception areas near the dock, reflecting the island’s growing appeal as a tourist destination.

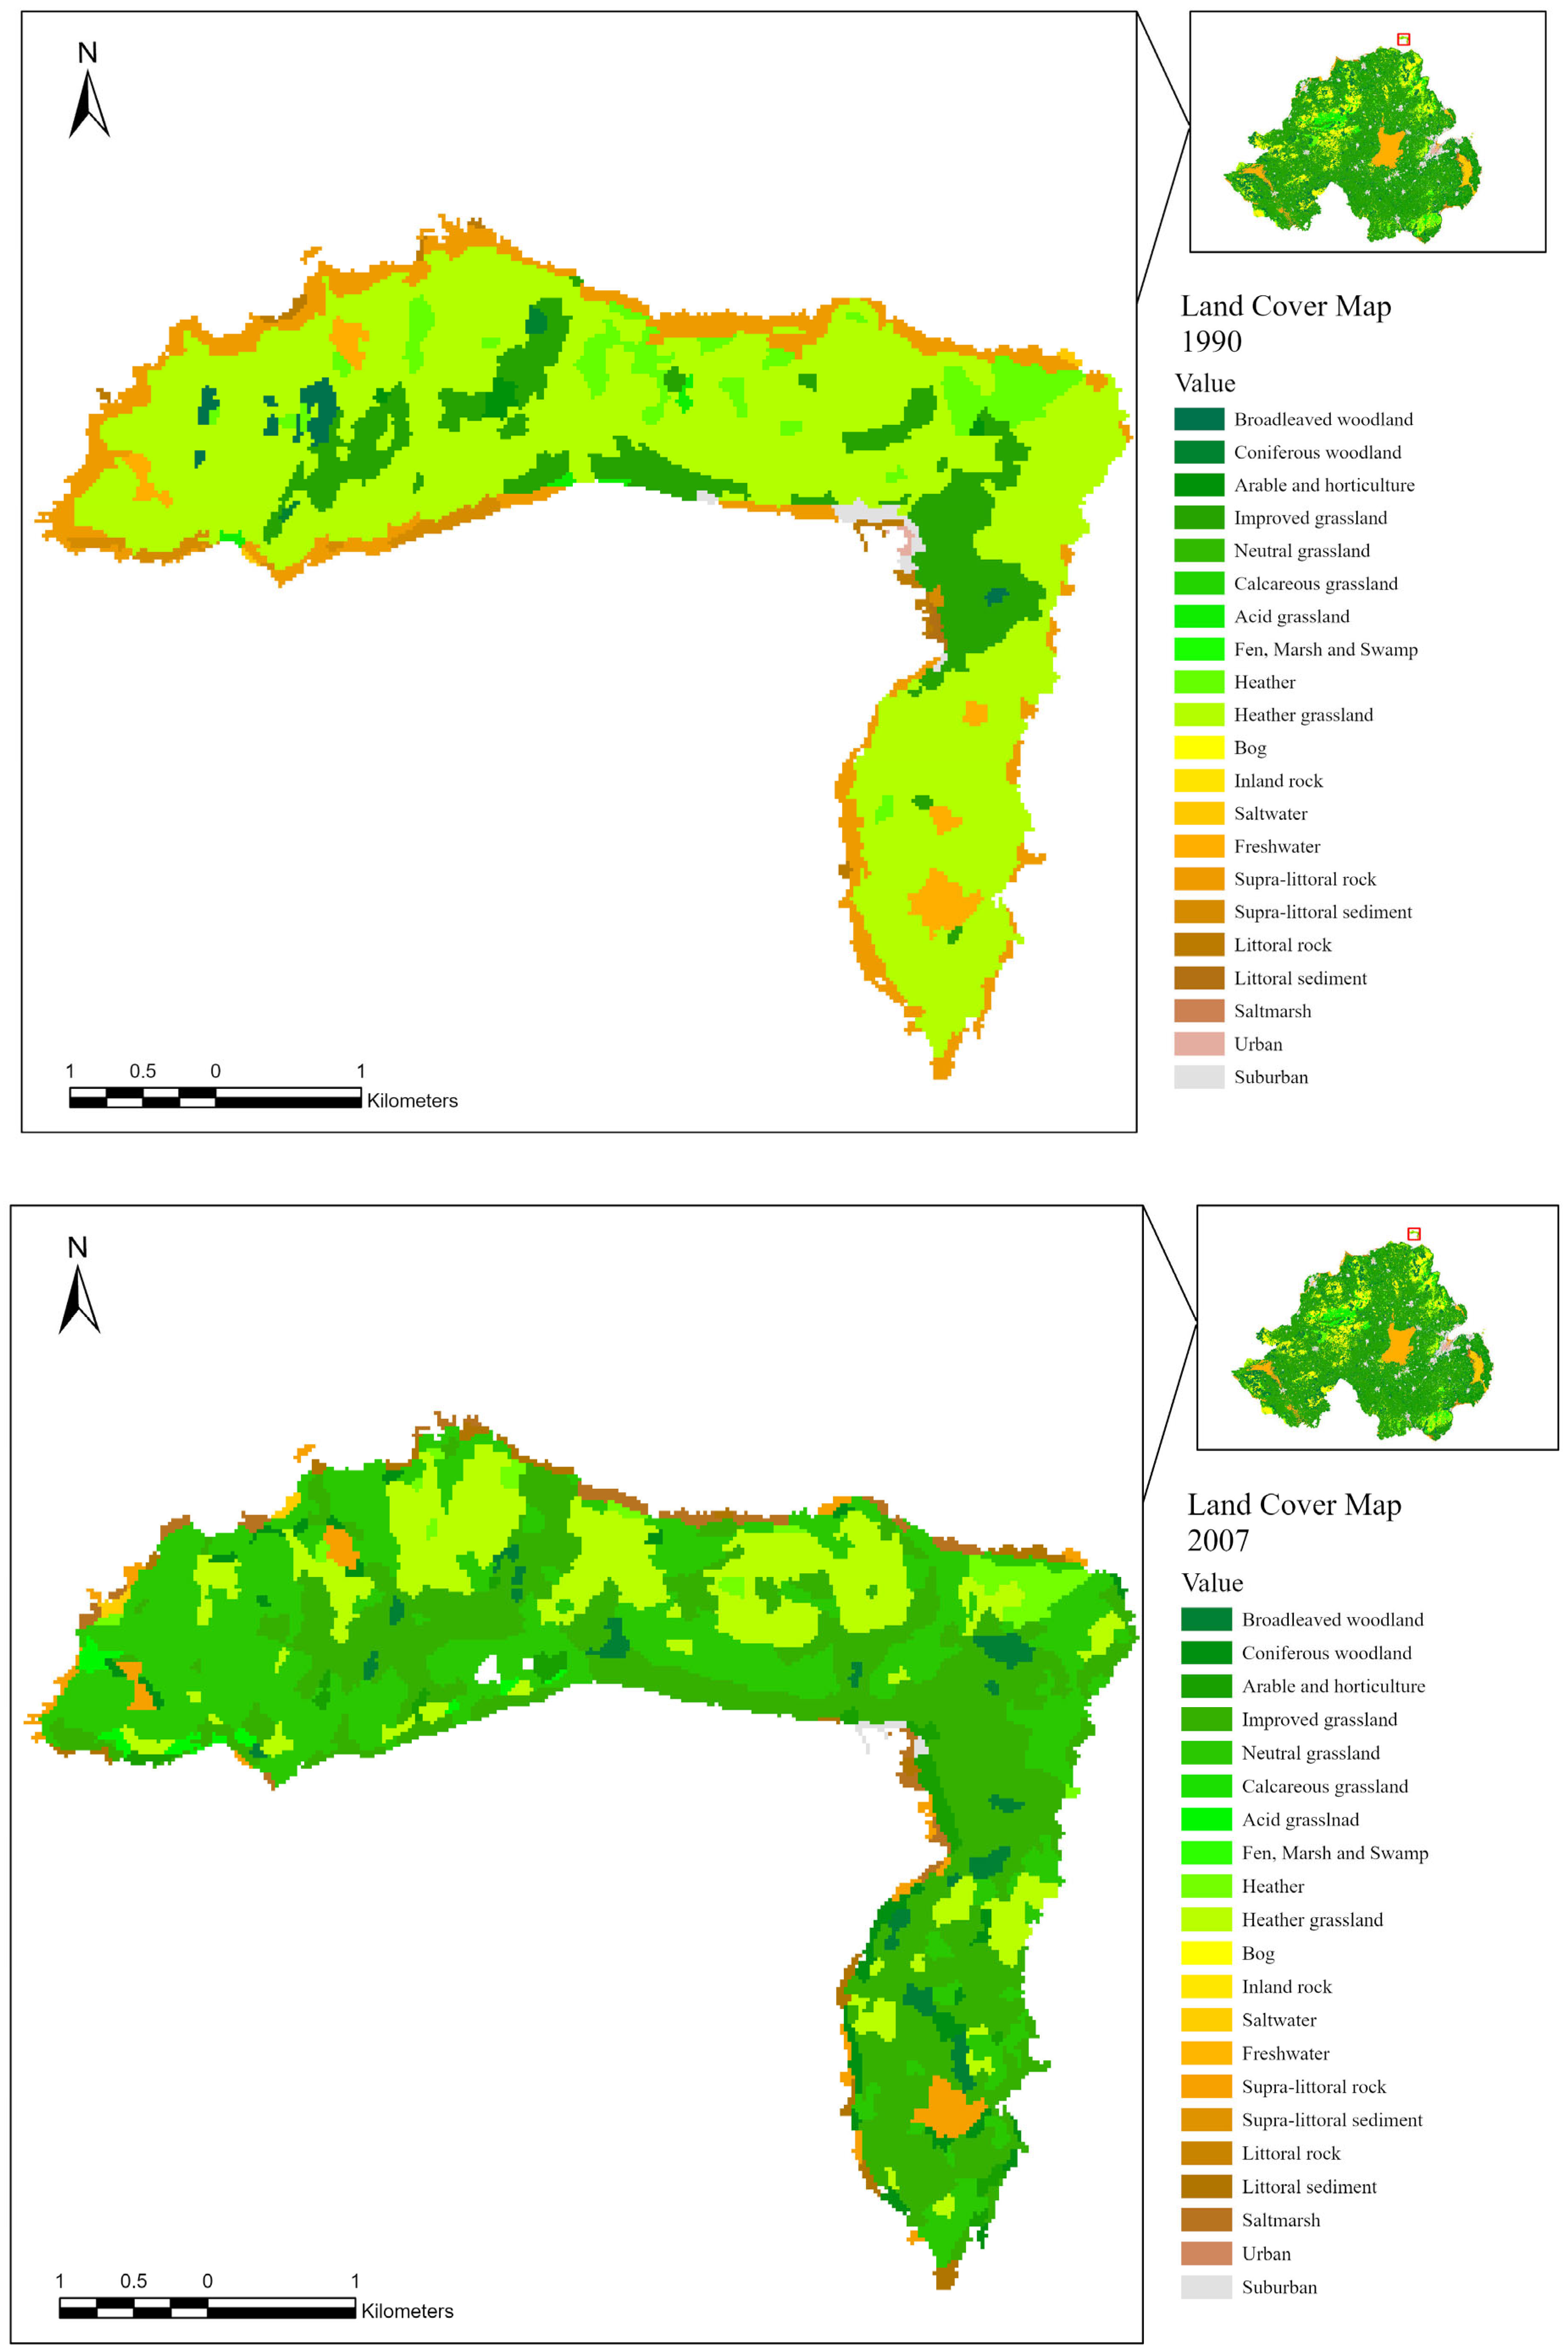
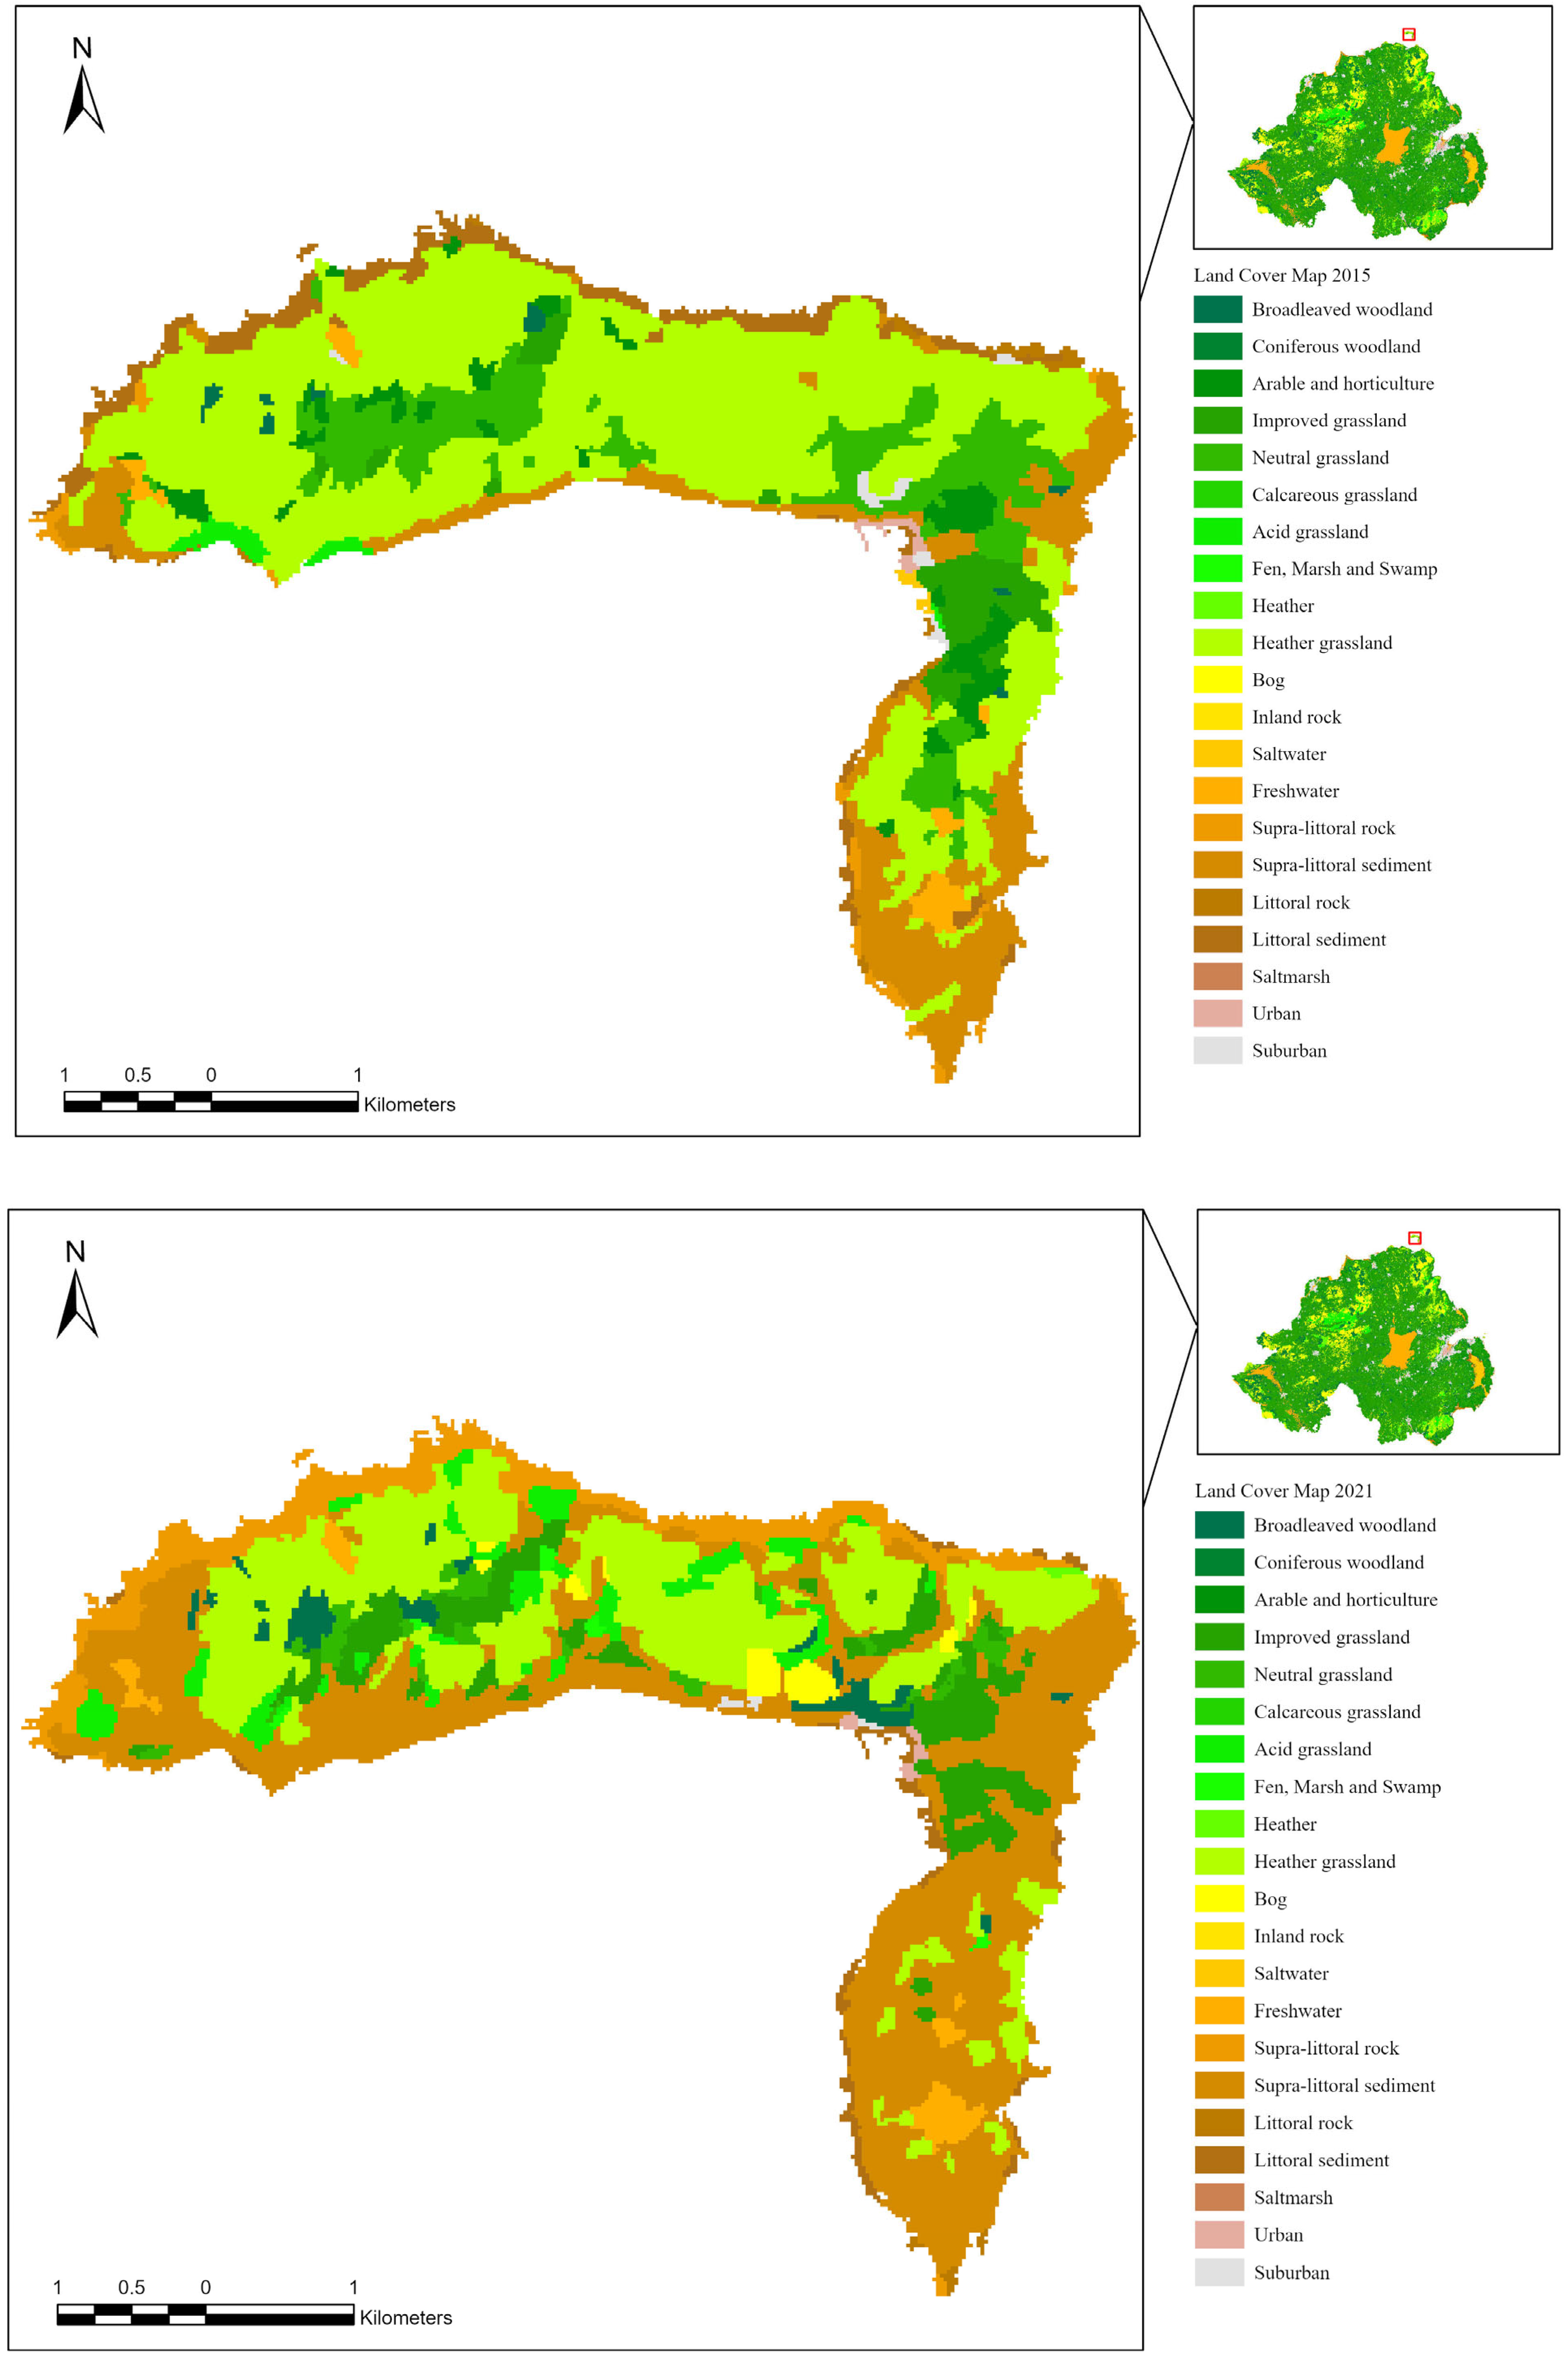
4.2. Results from Environment Digimap

Four versions of the Land Use and Land Cover (LULC) maps for Rathlin Island are presented in Figure 15, utilizing 25 m LU/LC classes derived by reclassifying the recorded descriptors. These maps represent four time periods—1990, 2007, 2015, and 2021—and illustrate changes across various land use categories, including woodlands, grasslands, urban areas, and water bodies [55]. The selection of these four time periods was based on the availability of downloadable data for Rathlin Island. These specific years represent the only time intervals currently accessible.
In general, significant changes can be observed in land cover types, including woodlands, grasslands, and coastal zones. Specifically, there was a significant expansion in woodland cover between 1990 and 2007. The 2015 map reveals further woodland growth, accompanied by a decline in certain grassland types, while coastal areas remained largely unchanged. By 2021, there is a marked increase in coastal and inland area land use, primarily concentrated in the southern and southeastern parts of the region. During this period, grasslands continued to decline and woodland areas appear to have stabilized or experienced slight retraction in some locations, potentially due to the development of island tourism.

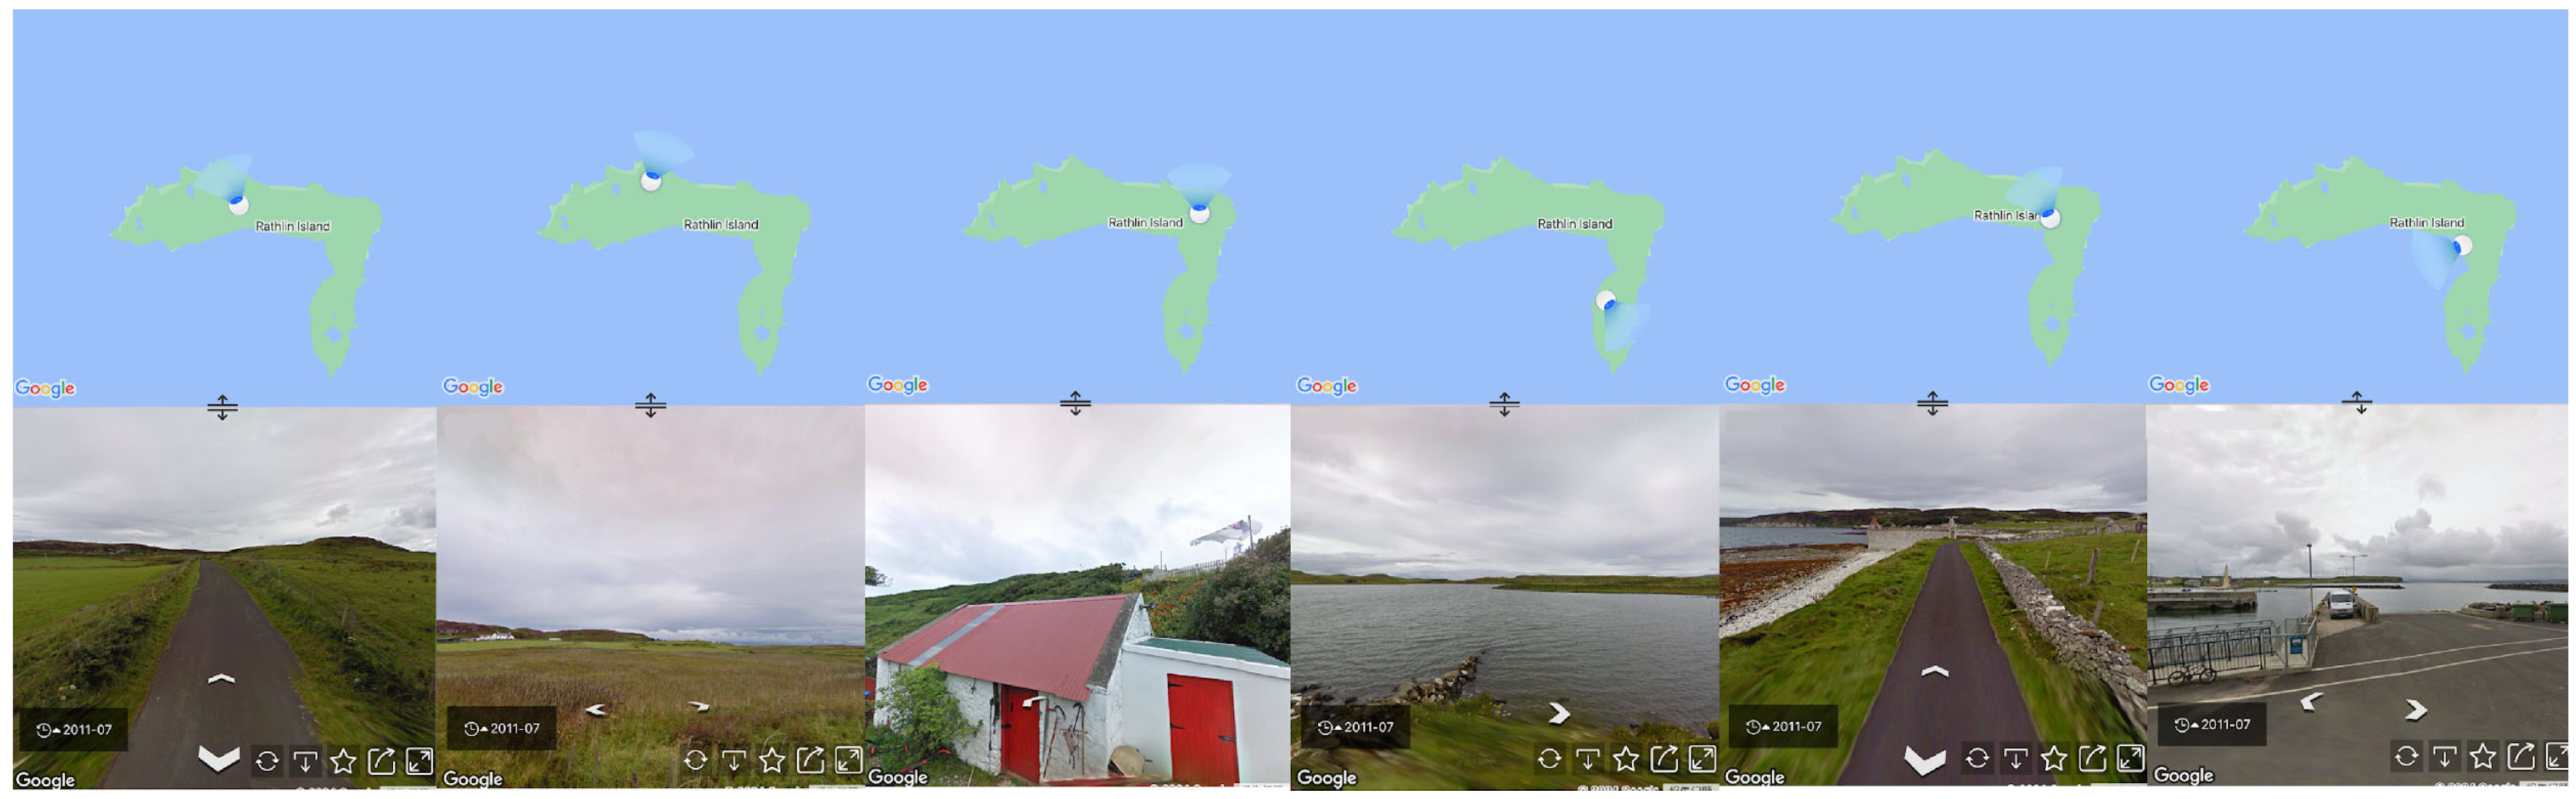
4.3. Results from Google Maps and Google Street View

Google Maps and Street View can be employed to create a virtual tour of Rathlin Island, showcasing key locations such as Church Bay, Bull Point, and Bruce’s Castle. This study selected six representative island scenes as a typology to capture and convey the diverse spatial characteristics of Rathlin Island. Each site was documented using Google Street View to provide a 360° panoramic perspective of key locations (Figure 16). The Street View camera offers a different field of view compared to an observer walking along the sidewalk, enabling a comprehensive yet distinct visual experience. This tool can be particularly effective in engaging stakeholders who may not have the opportunity to visit the island in person, such as distant policymakers, researchers, or international environmental advocates. Additionally, Google Street View imagery can be integrated into educational materials and digital storytelling platforms, providing a visually rich, first-person perspective that complements other narrative elements. However, limitations were identified in this study. The available imagery is restricted to data captured in 2011, which may not reflect the current state of the island. Moreover, the coverage of Rathlin Island is incomplete, as some areas remain undocumented in the dataset. While the tool provides significant value for remote users and researchers who cannot visit Rathlin Island, there are still limitations. The user should be supplemented with other data sources to provide a more comprehensive view of the island’s environment and infrastructure.

4.4. Results from ArcGIS Field Maps

ArcGIS Field Maps is a mobile-based application that supports efficient field data collection and real-time information exchange. It allows users to gather geospatial data, update existing records, and immediately share findings with other team members. This functionality is particularly valuable in island contexts, where accurate on-site data is essential for monitoring ecological and cultural resources.
On Rathlin Island, researchers and other practitioners can use the ArcGIS Field Maps app to record the locations of key features, such as harbors, agricultural sites, industrial facilities, or habitats of endangered species (Figure 17). The capacity for real-time updates ensures that the most up-to-date information is available for analysis and planning. Furthermore, the tool’s collaborative capabilities promote better coordination among stakeholders—ranging from local authorities to environmental agencies—by ensuring shared access to current and reliable spatial data.

5. Discussion

This study responds to the key research question by demonstrating how a multi-perspective, interdisciplinary visual storytelling method can serve as a powerful tool for landscape change on small islands. The paper explores the small island context through four interconnected dimensions: historical environmental context, island landscape changes, street views, and real visualization of islands using the Historic Environment Map Viewer, Environment Digimap, Google Maps and Google Street View, and ArcGIS Field Maps. This integrative narrative approach offers a more comprehensive and multi-angled understanding of landscape change on Rathlin Island. Rather than serving only as a technical analysis, the study is intentionally designed to engage a broader audience—including tourists, local residents, the general public, social science students, researchers, and educators etc. By weaving together diverse visual perspectives, the paper provides an accessible yet conceptually rich framework for interpreting small island landscapes. Thus, the study functions as a visual novel—telling the evolving story of the island through layered imagery and interpretive mapping. This narrative quality not only broadens the reach of island research but also opens up new pedagogical and communicative pathways for environmental understanding.
The application of diverse visual tools in this study provides deep insights into both the spatial and socio-cultural dimensions of Rathlin Island. The use of the Historic Environment Map Viewer enabled the reconstruction of spatial memory and long-term environmental change. However, the analysis was constrained by the limited availability and resolution of early cartographic records, which affected the precision of historical comparisons. Environment Digimap facilitated the assessment of land use change across four time points—1990, 2007, 2015, and 2021. Notable landscape changes were observed in land cover types, particularly in woodlands, grasslands, and coastal areas. These spatial trends also align with the gradual development of tourism infrastructure on the island in recent years. Google Maps and Google Street View offered immersive and user-friendly visual reference points, especially beneficial for first-time visitors or those unfamiliar with the island’s geography. However, their effectiveness was limited by incomplete temporal and spatial coverage on Rathlin Island, particularly in ecologically sensitive or remote areas. In addition, field visits conducted in February and October 2024 provided grounded local perspectives that enriched the visual analysis with community knowledge. Although these engagements revealed valuable insights into stakeholder concerns and aspirations, they were informal and unstructured in nature. Consequently, ethical and methodological limitations prevented the systematic recording of these interactions, thereby constraining the depth and reproducibility of qualitative data within this study.
Visual storytelling, in the context of island studies, has significant implications for sustainable future landscapes. By presenting complex information in an accessible, digestible, and engaging format, it can help to raise awareness about environmental challenges and promote more informed decision-making among stakeholders such as policymakers or even local residents. Integrated local narratives and ecological knowledge within visualizations also ensures that planning strategies are grounded in the lived experiences and core values of island communities, thereby enhancing their relevance and effectiveness from that perspective.

6. Conclusions

In conclusion, this study highlights the significance of visual storytelling as a multidimensional approach to a sustainable future in island environments. By integrating diverse technological sources of information (e.g., the Historic Environment Map Viewer, Environment Digimap, Google Maps, Google Street View, ArcGIS Story Maps, and ArcGIS Field Maps) into dynamic visualizations, visual storytelling, as a practice, provides a nuanced understanding of island landscapes that can inform more resilient and sustainable planning strategies. The findings indicate that (1) comparative analysis with the Historic Environment Map Viewer provides insights into the historical environmental transformation of the island, focusing on changes in topography, land use, and infrastructure development; (2) land use change visualization with Environment Digimap; (3) Google Maps and Google Street View can be particularly effective in engaging stakeholders who may not have the opportunity to visit the island in person; (4) the locations of key features, such as harbors, agricultural sites, industrial facilities, or habitats of endangered species have been recorded by ArcGIS Field Maps. Thus, the contextual case study of Rathlin Island demonstrates the possibilities of this approach for bridging the gap between academic research and civic engagement. It offers valuable insights for other island communities facing similar challenges, such as ecological degradation, and has the potential to perform as a scalable and transferable practice at international scales. However, it is crucial to acknowledge and address some limitations present in this study, recognizing the need for ongoing refinement and exploration in future research endeavors.

Future Directions

Future research could explore the potential of visual storytelling in other island contexts, such as the mainland of Ireland, with a particular focus on its role in promoting community engagement, communication exchange, and the potential for participatory planning processes. Additionally, the development of new digital tools and platforms (e.g., Geocaching and TikTok) for visual storytelling could further enhance the accessibility and impact of this approach, particularly in the context of addressing larger, messier problems, such as global environmental challenges. The research could also explore how social media platforms might be leveraged as participatory tools for real-time storytelling. This could perhaps enable island residents, visitors, and wider audiences to share knowledge, lived experiences, and visual content that enrich and diversify the narrative of the landscape.
Island storytelling could be approached in a holistic manner that considers the cultural, historical, and ecological dimensions of the island environment through these mechanisms. Each tool contributes to a more nuanced understanding of the island, with the aim of supporting sustainable planning efforts that are informed by a comprehensive analysis of past, present, and unrealised future conditions.
These tools can enable the visualization of complex data in accessible formats, facilitating informed decision-making and fostering a deeper connection between the public and the island’s land. Preservation of cultural heritage, the protection of biodiversity, or the promotion of sustainable development are all possibilities. The application of these technologies ensures that Rathlin Island (and other similar island environments) can be aided in a way that balances the needs of ‘here and now’ with the responsibilities to far-future generations.

Author Contributions

Conceptualization, Y.Z., R.J.M., G.K., S.C. and E.C.; methodology, Y.Z. and Z.Z.; software, Y.Z. and Z.Z.; formal analysis, Y.Z. and Z.Z.; writing—original draft preparation, Y.Z. and R.J.M.; writing—review and editing, Y.Z., R.J.M., S.C. and T.J.; visualization, Y.Z. and Z.Z.; supervision, G.K. and T.J.; project administration, G.K. and T.J. All authors have read and agreed to the published version of the manuscript.

Funding

This research was funded by the Future Island-Island project (R1573NBE).

Data Availability Statement

The data presented in this study are openly available online.

Conflicts of Interest

The authors declare no conflicts of interest.

References

  1. Pathirana, A. Small islands: Living Laboratories revealing global climate and sustainable development challenges. Front. Clim. 2025, 6, 1445378. [Google Scholar] [CrossRef]
  2. Giardino, A.; Nederhoff, K.; Vousdoukas, M. Coastal hazard risk assessment for small islands: Assessing the impact of climate change and disaster reduction measures on Ebeye (Marshall Islands). Reg. Environ. Change 2018, 18, 2237–2248. [Google Scholar] [CrossRef]
  3. Nurse, L.A.; McLean, R.F.; Agard, J.; Briguglio, L.P.; Duvat-Magnan, V.; Pelesikoti, N.; Tompkins, E.; Webb, A. Small Islands. In Climate Change 2014: Impacts, Adaptation, and Vulnerability. Part B: Regional Aspects. Contribution of Working Group II to the Fifth Assessment Report of the Intergovernmental Panel on Climate Change; Barros, V.R., Field, C.B., Dokken, D.J., Mastrandrea, M.D., Mach, K.J., Bilir, T.E., Chatterjee, M., Ebi, K.L., Estrada, Y.O., Genova, R.C., et al., Eds.; Cambridge University Press: Cambridge, UK, 2014; pp. 1613–1654. [Google Scholar]
  4. Baldacchino, G. Introducing a world of islands [Editorial]. In A World of Islands: An Island Studies Reader; Baldacchino, G., Ed.; Island Studies Press: Charlottetown, PEI, Canada, 2007; pp. 1–29. [Google Scholar]
  5. Vousdoukas, M.I.; Athanasiou, P.; Giardino, A.; Mentaschi, L.; Stocchino, A.; Kopp, R.E.; Menéndez, P.; Beck, M.W.; Ranasinghe, R.; Feyen, L. Small Island Developing States under threat by rising seas even in a 1.5 °C warming world. Nat. Sustain. 2023, 6, 1089–1099. [Google Scholar] [CrossRef]
  6. Mycoo, M.; Robinson, S.-A.; Wairiu, M.; Duvat, V. Climate change adaptation in small islands: A systematic literature review. Reg. Environ. Change 2022, 22, 55. [Google Scholar] [CrossRef]
  7. Robinson, S.-A. Climate change adaptation in SIDS: A systematic review of the literature pre and post the IPCC Fifth Assessment Report. Wiley Interdiscip. Rev. Clim. Change 2020, 11, e653. [Google Scholar] [CrossRef]
  8. Vousdoukas, M.I.; Ranasinghe, R.; Mentaschi, L.; Plomaritis, T.A.; Athanasiou, P.; Luijendijk, A.; Feyen, L. Sandy coastlines under threat of erosion. Nat. Clim. Change 2020, 10, 260–263. [Google Scholar] [CrossRef]
  9. Niles, K.; Lloyd, B. Small Island Developing States (SIDS) & Energy Aid: Impacts on the Energy Sector in the Caribbean and Pacific. Energy Sustain. Dev. 2013, 17, 521–530. [Google Scholar] [CrossRef]
  10. Briguglio, L. Economic Challenges Faced by Small Island Economies: An Overview. World Dev. 1995, 23, 1615–1629. [Google Scholar] [CrossRef]
  11. Bárcena, C.; Darnaude, A.M.; Planas, A. The Importance of Islands for the Protection of Biological and Linguistic Diversity. Glob. Ecol. Conserv. 2022, 34, e02054. [Google Scholar] [CrossRef]
  12. Cutter, S.L.; Emrich, C.T.; Webb, J.J.; Morath, D.P. Interdisciplinary Theory, Methods, and Approaches for Hazards and Disaster Research: An Introduction to the Special Issue. Risk Anal. 2021, 41, 1059–1067. [Google Scholar] [CrossRef]
  13. Prosser, J. Visual Data in Applied Qualitative Research: Lessons from Experience. In The SAGE Handbook of Qualitative Research; Miles, M., Huberman, A.M., Eds.; Sage Publications: Thousand Oaks, CA, USA, 2005; pp. 143–155. [Google Scholar]
  14. Zort, Ç.; Karabacak, E.; Öznur, Ş.; Dağlı, G. Sharing of Cultural Values and Heritage through Storytelling in the Digital Age. Front. Psychol. 2023, 14, 1104121. [Google Scholar] [CrossRef] [PubMed]
  15. Carvalho, D.B.; Clua, E.G.; Pozzer, C.T.; Passos, E.B.; Paes, A. Simulated Perceptions for Emergent Storytelling. Comput. Intell. 2017, 33, 606–627. [Google Scholar] [CrossRef]
  16. Katifori, A.; Karvounis, M.; Kourtis, V.; Perry, S.; Roussou, M.; Ioannidis, Y. Applying Interactive Storytelling in Cultural Heritage: Opportunities, Challenges and Lessons Learned. Lect. Notes Comput. 2018, 11318, 603–612. [Google Scholar] [CrossRef]
  17. Sacks, R.; Brilakis, I.; Pikas, E.; Xie, H.; Girolami, M. A Research Agenda for Augmented and Virtual Reality in Architecture, Engineering and Construction. Adv. Eng. Inform. 2020, 45, 101122. [Google Scholar] [CrossRef]
  18. Zhang, R.; Peng, F.; Gwilt, I. Exploring the Role of Immersive Technology in Digitally Representing Contemporary Crafts within Hybrid Museum Exhibitions: A Scoping Review. Digit. Creat. 2024, 35, 355–377. [Google Scholar] [CrossRef]
  19. Throgmorton, J.A. Planning as Persuasive Storytelling in a Global-Scale Web of Relationships. Plan. Theory 2003, 2, 125–151. [Google Scholar] [CrossRef]
  20. Eckstein, B.; Throgmorton, J.A. (Eds.) Story and Sustainability: Planning, Practice, and Possibility for American Cities; The MIT Press: Cambridge, MA, USA, 2003. [Google Scholar] [CrossRef]
  21. Fonseca, L.M.; Domingues, J.P. How to succeed in the digital age? Monitor the organizational context, identify risks and opportunities, and manage change effectively. Manag. Mark. 2017, 12, 443–455. [Google Scholar] [CrossRef]
  22. Shanahan, E.A.; McBeth, M.K.; Hathaway, P.L. Narrative Policy Framework: The Influence of Media Policy Narratives on Public Opinion. Politics Policy 2011, 39, 373–400. [Google Scholar] [CrossRef]
  23. Joosse, S.; Westin, M.; Möckel, F.; Keasey, H.; Lorenzen, S. Storytelling to Save the Planet: Who Gets to Say What Is Sustainable, Who Tells the Stories, and Who Should Listen and Change? J. Environ. Plan. Manag. 2023, 67. [Google Scholar] [CrossRef]
  24. Baldacchino, G. The Lure of the Island: A Spatial Analysis of Power Relations. J. Mar. Isl. Cult. 2012, 1, 55–62. [Google Scholar] [CrossRef]
  25. Hamad, A.; Jia, B. How Virtual Reality Technology Has Changed Our Lives: An Overview of the Current and Potential Applications and Limitations. Int. J. Environ. Res. Public Health 2022, 19, 11278. [Google Scholar] [CrossRef]
  26. Bakhtiari, V.; Piadeh, F.; Behzadian, K.; Kapelan, Z. A Critical Review for the Application of Cutting-Edge Digital Visualisation Technologies for Effective Urban Flood Risk Management. Sustain. Cities Soc. 2023, 99, 104958. [Google Scholar] [CrossRef]
  27. Gershon, N.; Page, W. What storytelling can do for information visualization. Commun. ACM 2001, 44, 31–37. [Google Scholar] [CrossRef]
  28. Weissenfeld, K.; Abramova, O.; Krasnova, H. Understanding Storytelling in the Context of Information Systems. In Proceedings of the 23rd Americas Conference on Information Systems (AMCIS 2017), Boston, MA, USA, 10–12 August 2017; Available online: https://aisel.aisnet.org/amcis2017/eBusiness/Presentations/20 (accessed on 21 May 2025).
  29. Kosara, R.; Mackinlay, J. Storytelling: The Next Step for Visualization. Computer 2013, 46, 44–50. [Google Scholar] [CrossRef]
  30. Roth, R.E. Cartographic Design as Visual Storytelling: Synthesis and Review of Map-Based Narratives, Genres, and Tropes. Cartogr. J. 2020, 58, 83–114. [Google Scholar] [CrossRef]
  31. Gray, J.; Chambers, L.; Bounegru, L. The Data Journalism Handbook: How Journalists can Use Data to Improve the News; O’Reilly: Sebastopol, CA, USA, 2012. [Google Scholar]
  32. Thöny, M.; Schnürer, R.; Sieber, R.; Hurni, L.; Pajarola, R. Storytelling in Interactive 3D Geographic Visualization Systems. ISPRS Int. J. Geo-Inf. 2018, 7, 123. [Google Scholar] [CrossRef]
  33. Department for Communities. Historic Environment. Available online: https://www.communities-ni.gov.uk/topics/historic-environment (accessed on 5 March 2025).
  34. Environment Digimap. Available online: https://digimap.edina.ac.uk/environment (accessed on 1 April 2025).
  35. Google Maps. Available online: https://www.google.com/maps (accessed on 21 May 2025).
  36. Google Street View. Available online: https://www.google.com/streetview/ (accessed on 3 April 2025).
  37. Arc GIS Field Maps. Available online: https://www.esri.com/en-us/arcgis/products/arcgis-field-maps/overview (accessed on 4 April 2025).
  38. Cisneros, L.; Campbell, T.; Freidenfelds, N.; Lindemann, A.; Elliot-Famularo, H.; Chadwick, C.; Dickson, D.; Park, B.-Y. Eco-Digital Storytelling: Engaging Historically Excluded Populations in Environmental Action through Mentoring, Geospatial Technology, and Digital Media Storytelling. Front. Educ. 2023, 7, 1083064. [Google Scholar] [CrossRef]
  39. Quinn, R.; Forsythe, W.; Breen, C.; McCarron, S.; Plets, R.; Westley, K. Comparison of the Maritime Sites and Monuments Record with Side-Scan Sonar and Diver Surveys: A Case Study from Rathlin Island, Ireland. Geoarchaeology 2002, 17, 441–451. [Google Scholar] [CrossRef]
  40. Goodchild, M.F. Citizens as Sensors: The World of Volunteered Geography. GeoJournal 2007, 69, 211–221. [Google Scholar] [CrossRef]
  41. Peterson, G.N. GIS Cartography: A Guide to Effective Map Design; CRC Press: Boca Raton, FL, USA, 2015. [Google Scholar]
  42. Stewart, S.A. Report on the Botany of the Island of Rathlin, County of Antrim. Proc. R. Ir. Acad. Sci. 1888, 4, 82–104. Available online: https://www.jstor.org/stable/20635914 (accessed on 6 April 2025).
  43. Martin, P. Rathlin Island: An Archaeological Survey of a Maritime Landscape. Int. J. Naut. Archaeol. 2014, 43, 226–228. [Google Scholar] [CrossRef]
  44. Documenting Ireland. Rathlin Island. Documenting Ireland. Available online: https://documentingireland.com/northern-ireland/rathlin-island/ (accessed on 7 April 2025).
  45. Forsythe, W.; McConkey, R. At the Crossroads: The Historical Archaeology of Rathlin Island. In Scottish Odysseys: The Archaeology of Islands; Noble, G., Poller, T., Raven, J., Verrill, L., Eds.; The History Press: Stroud, UK, 2008; pp. 132–149. [Google Scholar]
  46. Garrow, D.; Sturt, F. The Role of Stone in Island Societies in Neolithic Atlantic Europe: Creating Places and Cultural Landscapes. In Submerged Prehistory; Bailey, G., Harff, J., Sakellariou, D., Eds.; Springer: Cham, Switzerland, 2017; pp. 145–157. [Google Scholar] [CrossRef]
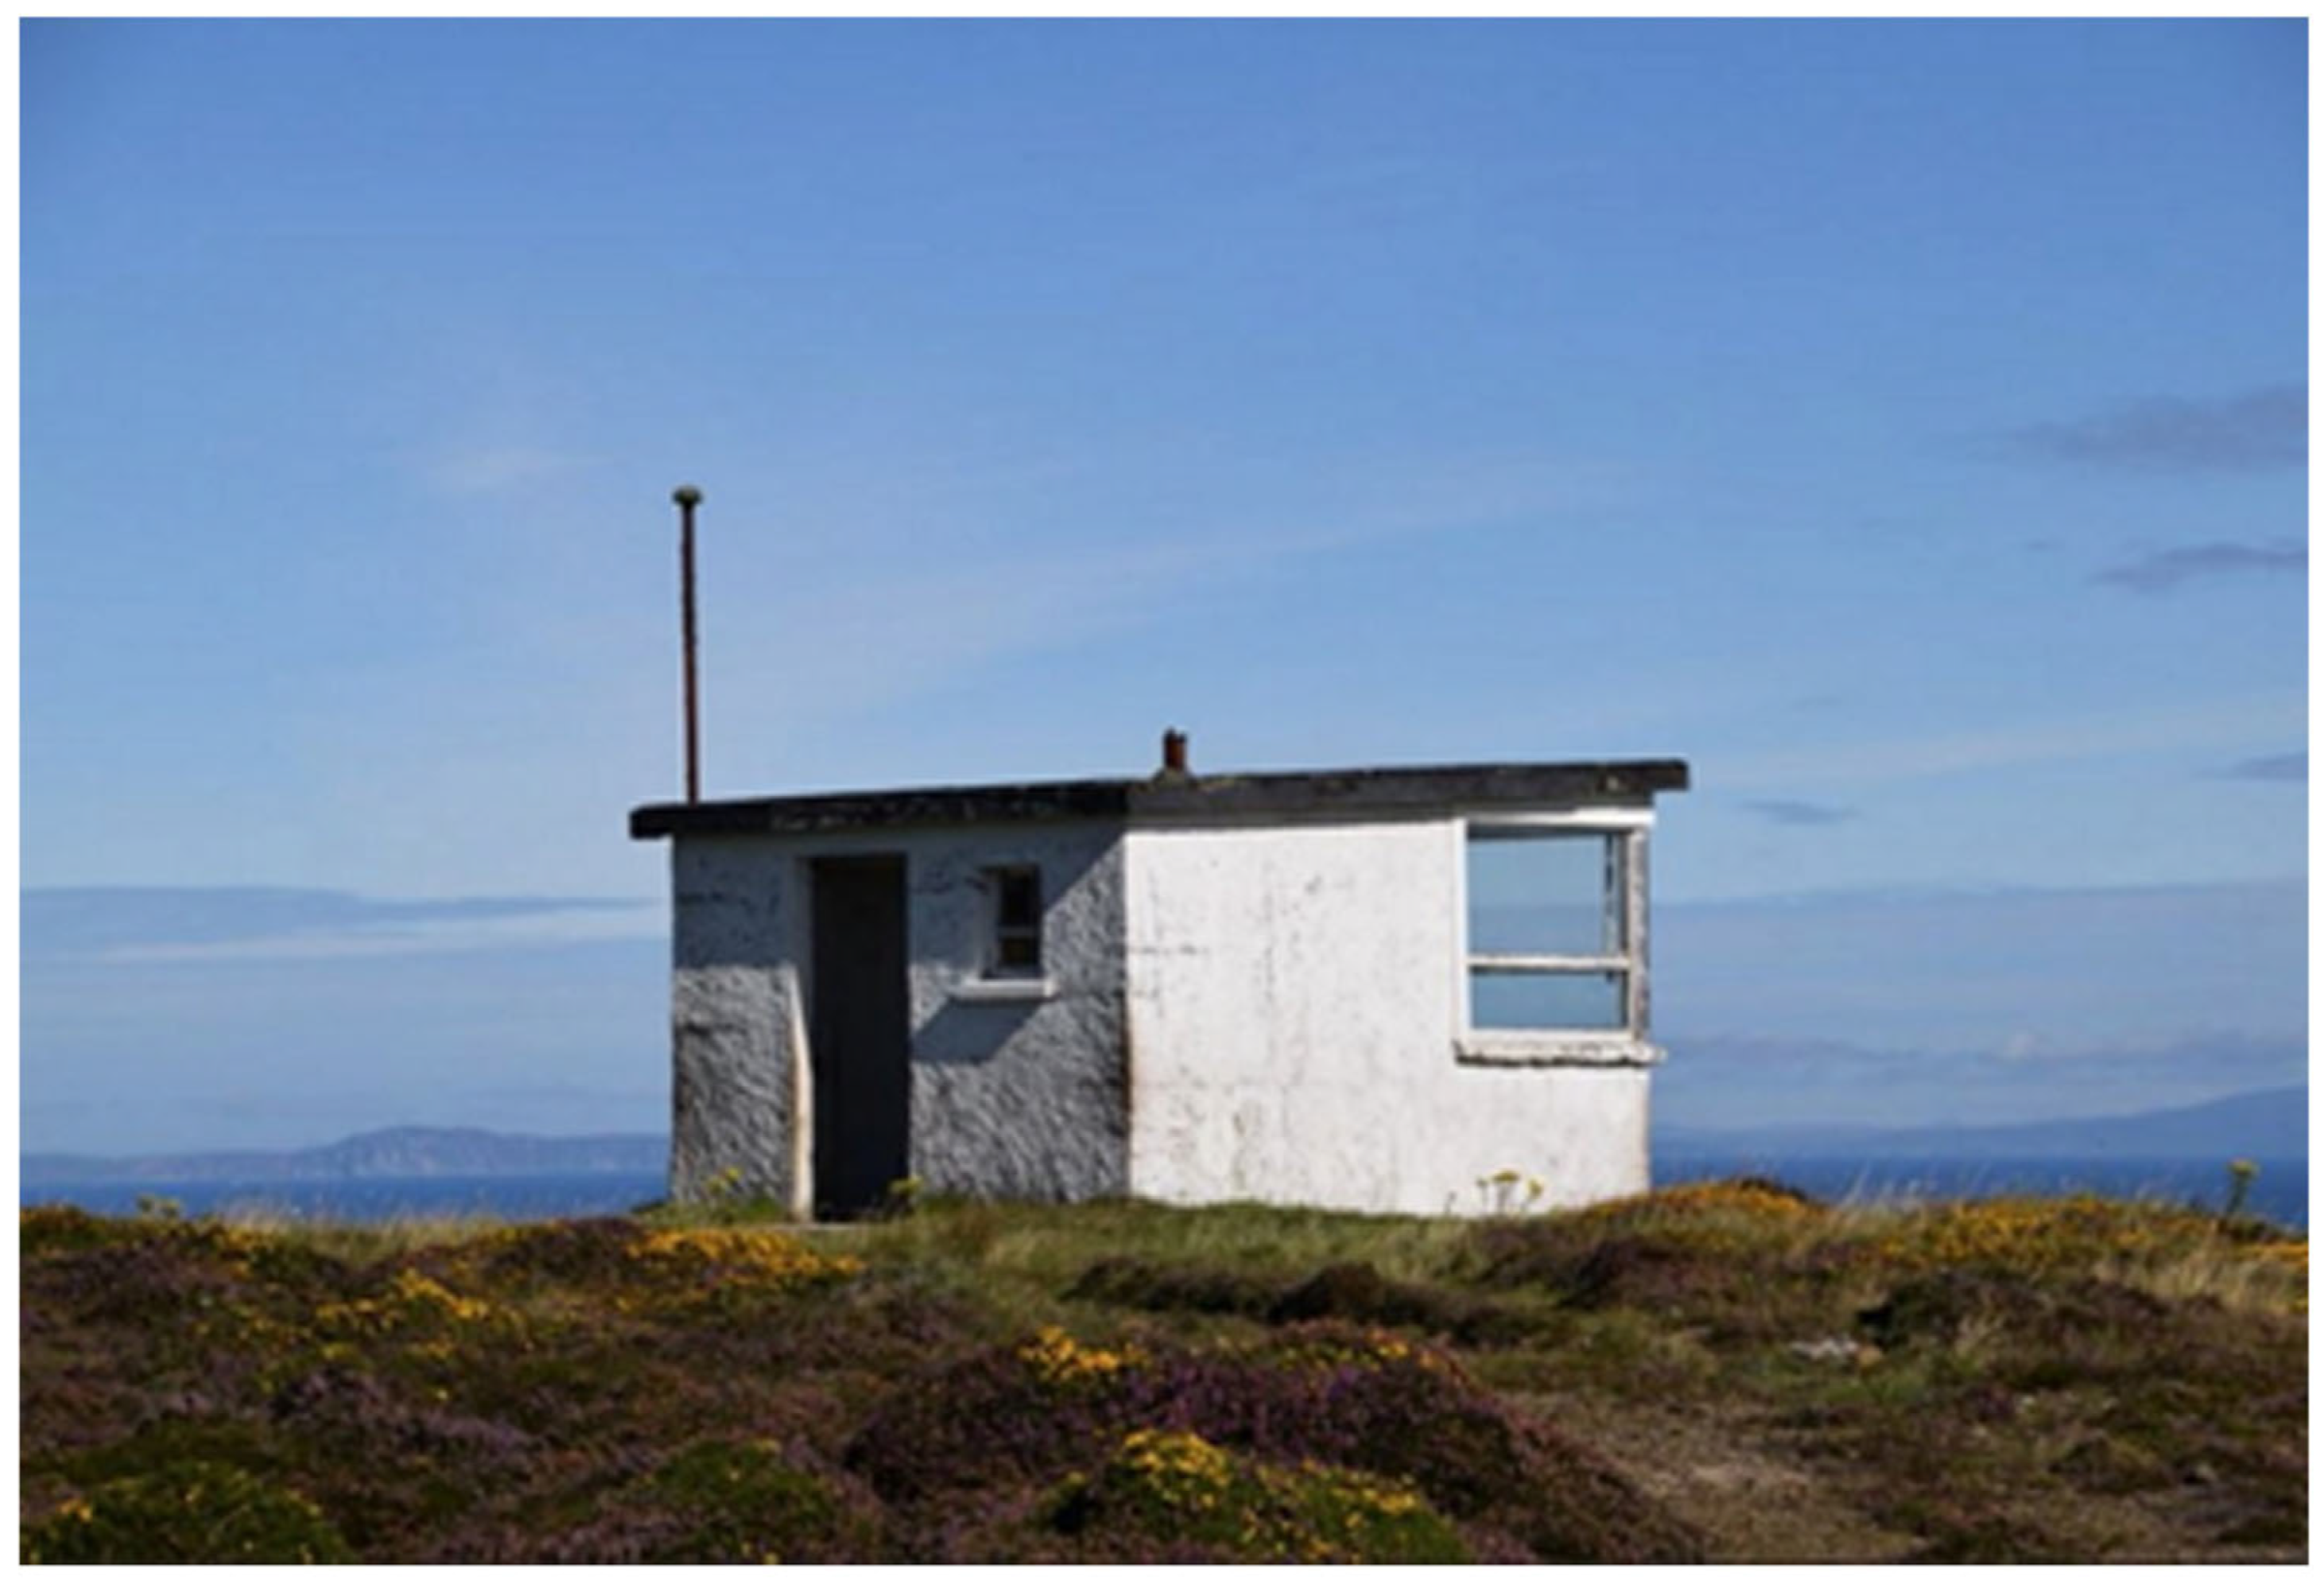
  47. Department for Communities. Former Coastguard Lookout Post, Rathlin Island (HB 06/500017). Northern Ireland Buildings Database. Available online: https://apps.communities-ni.gov.uk/Buildings/buildview.aspx?id=18411&js=false (accessed on 5 June 2025).
  48. Goodwin, C.; Edwards, H.; Breen, J.; Picton, B. Rathlin Island—A Survey Report from the Nationally Important Marine Features Project 2009–2011; Northern Ireland Environment Agency Research and Development Series No. 11/03; Northern Ireland Environment Agency: Belfast, UK, 2011. [Google Scholar] [CrossRef]
  49. Ortiz, A.M.D.; Jamero, M.L.; Crespin, S.J.; Agostini, V.N.; Schwerdtner Máñez, K.; Morrison, T.H.; Sanz, V.; Barnett, J. The Land and Sea Routes to 2030: A Call for Greater Attention on All Small Islands in Global Environmental Policy. NPJ Biodivers. 2023, 2, 18. [Google Scholar] [CrossRef]
  50. Veron, S.; Mouchet, M.; Govaerts, R.; Haevermans, T.; Pellens, R. Vulnerability to Climate Change of Islands Worldwide and Its Impact on the Tree of Life. Sci. Rep. 2019, 9, 14471. [Google Scholar] [CrossRef] [PubMed]
  51. RSPB. LIFE Raft on Rathlin: A Monumental Step for Seabird Conservation. RSPB News, 22 October 2024. Available online: https://www.rspb.org.uk/whats-happening/news/life-raft-on-rathlin (accessed on 6 April 2025).
  52. Department for Regional Development. Regional Development Strategy 2035: Building a Better Future; Department for Regional Development: Belfast, UK, 2012. Available online: https://www.infrastructure-ni.gov.uk/publications/regional-development-strategy-2035 (accessed on 21 May 2025).
  53. Department for Regional Development. Rathlin Island Harbour Development: Environmental Statement; Department for Regional Development: Belfast, UK, 2012. Available online: https://www.infrastructure-ni.gov.uk/sites/default/files/publications/drd/rathlin-island-harbour-environmental-statement.pdf (accessed on 21 May 2025).
  54. Department of Housing, Heritage and Local Government. Historic Environment Viewer. Available online: https://heritagedata.maps.arcgis.com/apps/webappviewer/index.html?id=0c9eb9575b544081b0d296436d8f60f8 (accessed on 8 April 2025).
  55. Sutton, E.; Medyckyj-Scott, D.; Urwin, T. The EDINA Digimap® Service—10 Years On…. Cartogr. J. 2007, 44, 268–275. [Google Scholar] [CrossRef]
  56. Google Maps. Available online: https://www.google.co.uk/maps/ (accessed on 18 May 2025).
  57. Li, Y.; Peng, L.; Wu, C.; Zhang, J. Street View Imagery (SVI) in the Built Environment: A Theoretical and Systematic Review. Buildings 2022, 12, 1189. [Google Scholar] [CrossRef]
  58. Rundle, A.G.; Bader, M.D.M.; Richards, C.A.; Neckerman, K.M.; Teitler, J.O. Using Google Street View to Audit Neighborhood Environments. Am. J. Prev. Med. 2011, 40, 94–100. [Google Scholar] [CrossRef]
  59. Wilson, P.; Byrum, S.; Wilson, P. Geospatial Technologies. In Smart Grids, 2nd ed.; CRC Press: Boca Raton, FL, USA, 2017; p. 26. [Google Scholar] [CrossRef]
  60. Rossiter, K.M. Using ArcGIS Field Maps in the Classroom. Geogr. Teach. 2022, 19, 154–161. [Google Scholar] [CrossRef]
  61. Glens of Antrim Historical Society. The Ordnance Survey Memoir for the Parish of Rathlin; Glens of Antrim Historical Society: Ballycastle, UK, 2015; Available online: https://antrimhistory.net/the-ordnance-survey-memoir-for-the-parish-of-rathlin/ (accessed on 21 May 2025).
  62. Tourism Northern Ireland. New Capital Investment Funding Scheme Announced for Visitor Attractions and Experiences as Part of the Shared Island Tourism Brand Collaboration Project; Tourism Northern Ireland: Belfast, UK, 2024; Available online: https://www.tourismni.com/news/new-capital-investment-funding-scheme-announced-for-visitor-attractions-and-experiences-as-part-of-the-shared-island-tourism-brand-collaboration-project/ (accessed on 21 May 2025).
Figure 1. Map of Rathlin Island and research scope used in the study.
Land 14 01304 g001
Figure 2. Aerial photography of Rathlin Island, highlighting the East Lighthouse (top), West Lighthouse and RSPB Seabird Centre (bottom left), and the main harbor (bottom right).
Land 14 01304 g002
Figure 3. Coast-watching Post on Rathlin Island.
Land 14 01304 g003
Figure 4. Ordnance Survey—Quarter Inch to the Mile Maps of Scotland 3rd Edition, 1940–41. RAF (War) 2nd Edition.
Land 14 01304 g004
Figure 5. Interface of the Historic Environment Map Viewer.
Land 14 01304 g005
Figure 6. Interface of Environment Digimap.
Land 14 01304 g006
Figure 7. Interface of Google Maps and Google Street View.
Land 14 01304 g007
Figure 8. Interface of ArcGIS Field Maps app.
Land 14 01304 g008
Figure 9. 1827 map.
Figure 9. 1827 map.
Land 14 01304 g009
Figure 10. 1829–1835 map.
Land 14 01304 g010
Figure 11. 1838–1862 map.
Land 14 01304 g011
Figure 12. 1900–1932 map.
Land 14 01304 g012
Figure 13. 1916–1957 map.
Land 14 01304 g013
Figure 14. 1957–1986 map.
Land 14 01304 g014
Figure 15. Land use changes from 1990, 2007, 2015, and 2021 in Rathlin Island, NI using Digimap.
Land 14 01304 g015aLand 14 01304 g015b
Figure 16. Screen captures of Google Street View panoramic images.
Land 14 01304 g016
Figure 17. Arc GIS Field Maps Map. 1. Factory on Rathlin Island; 2. Rathlin Boathouse Visitor Centre; 3. Rathlin Island Ferry; 4. Rathlin Development Community.
Land 14 01304 g017
Disclaimer/Publisher’s Note: The statements, opinions and data contained in all publications are solely those of the individual author(s) and contributor(s) and not of MDPI and/or the editor(s). MDPI and/or the editor(s) disclaim responsibility for any injury to people or property resulting from any ideas, methods, instructions or products referred to in the content.

