Spatiotemporal Assessment of Desertification in Wadi Fatimah


Abstract
1. Introduction
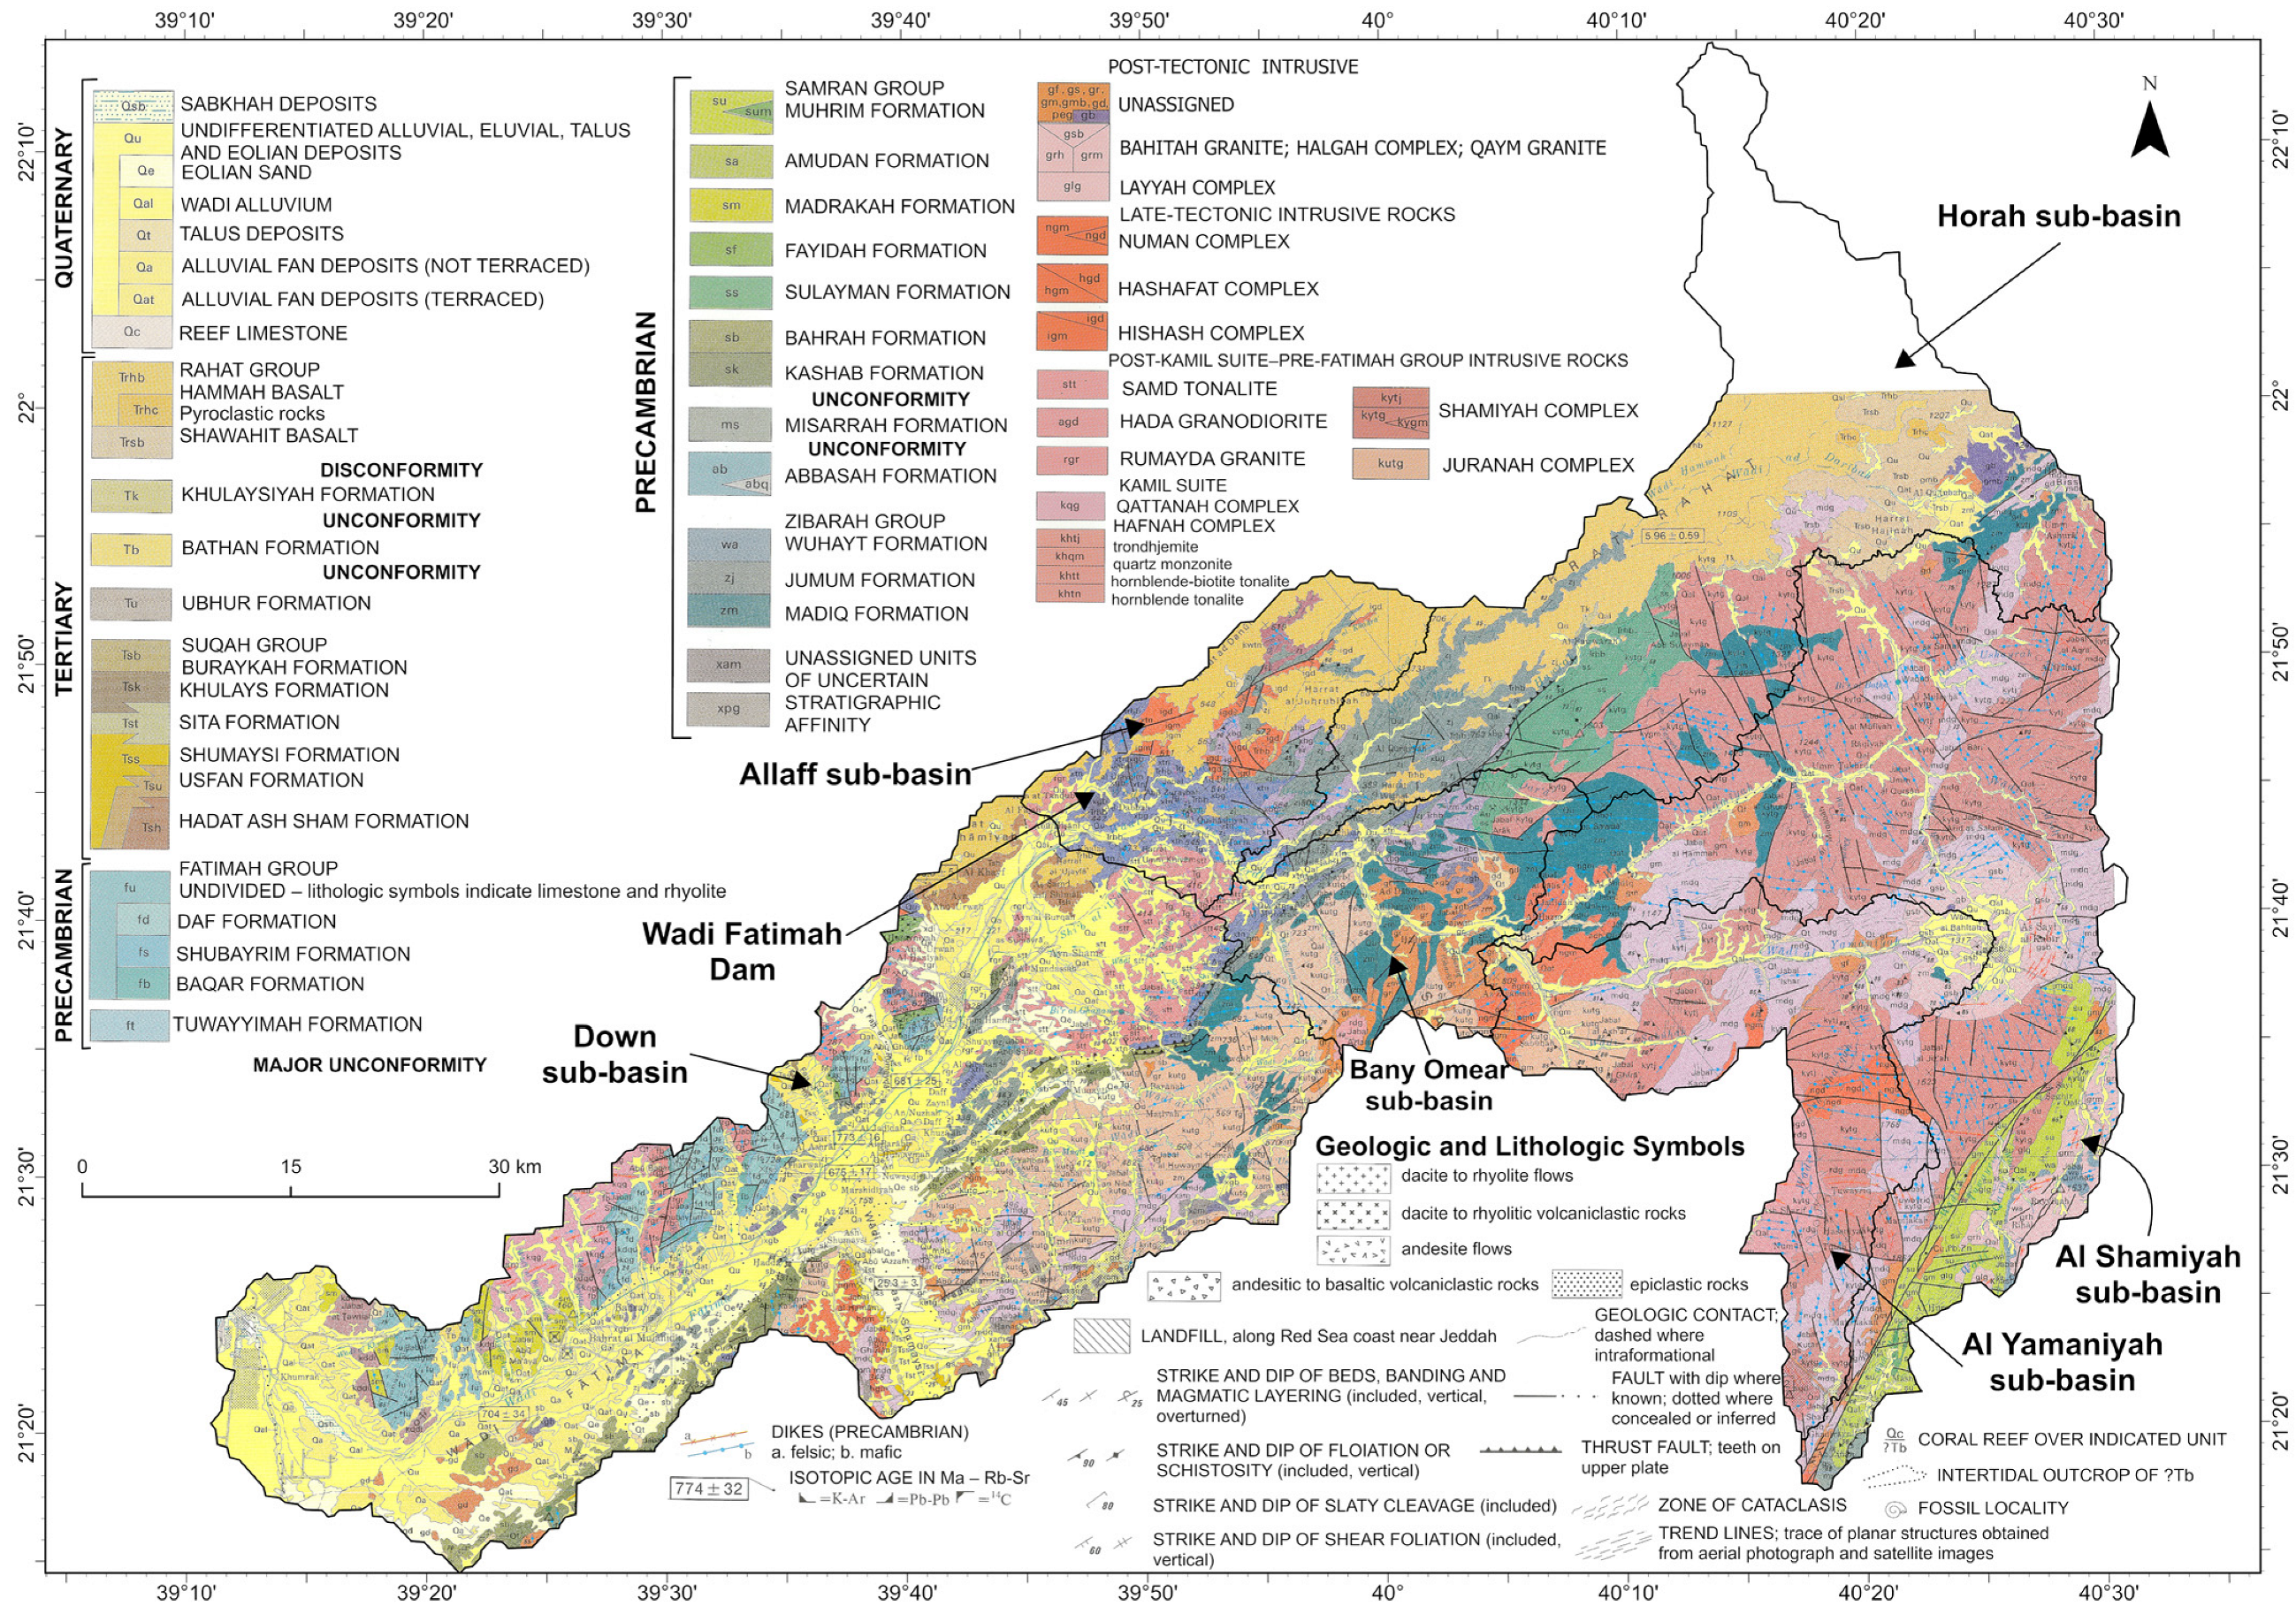
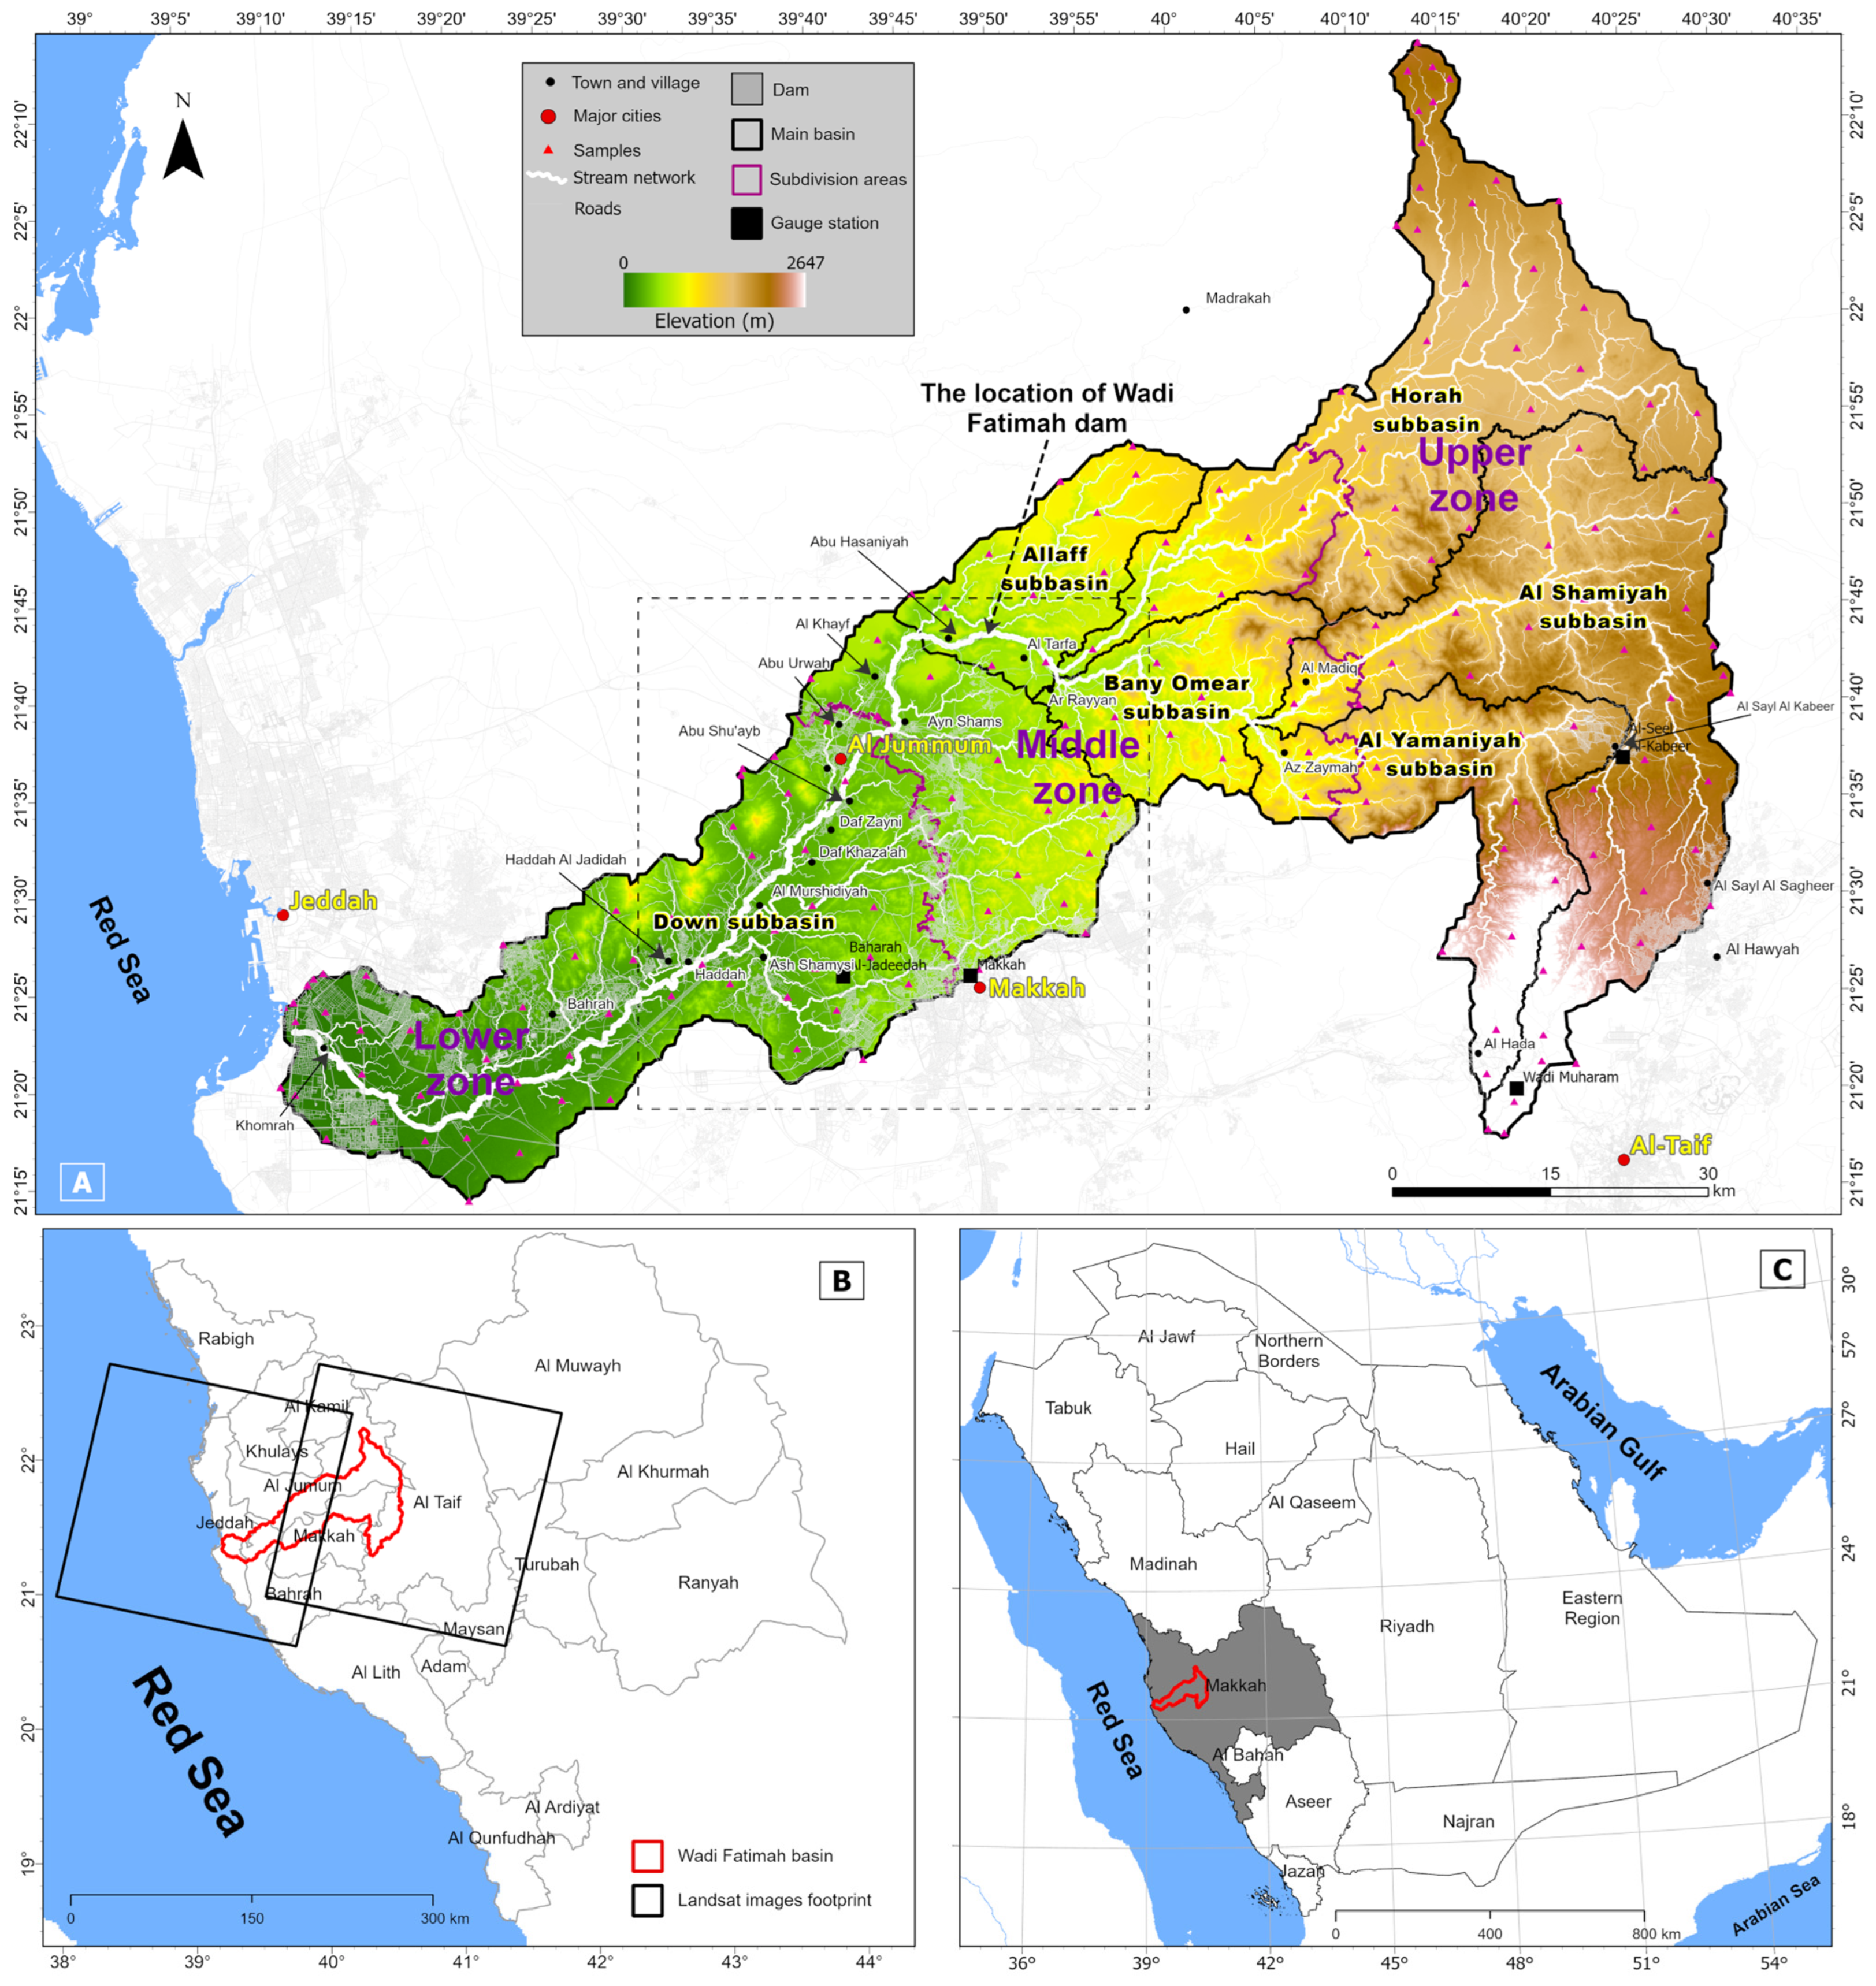
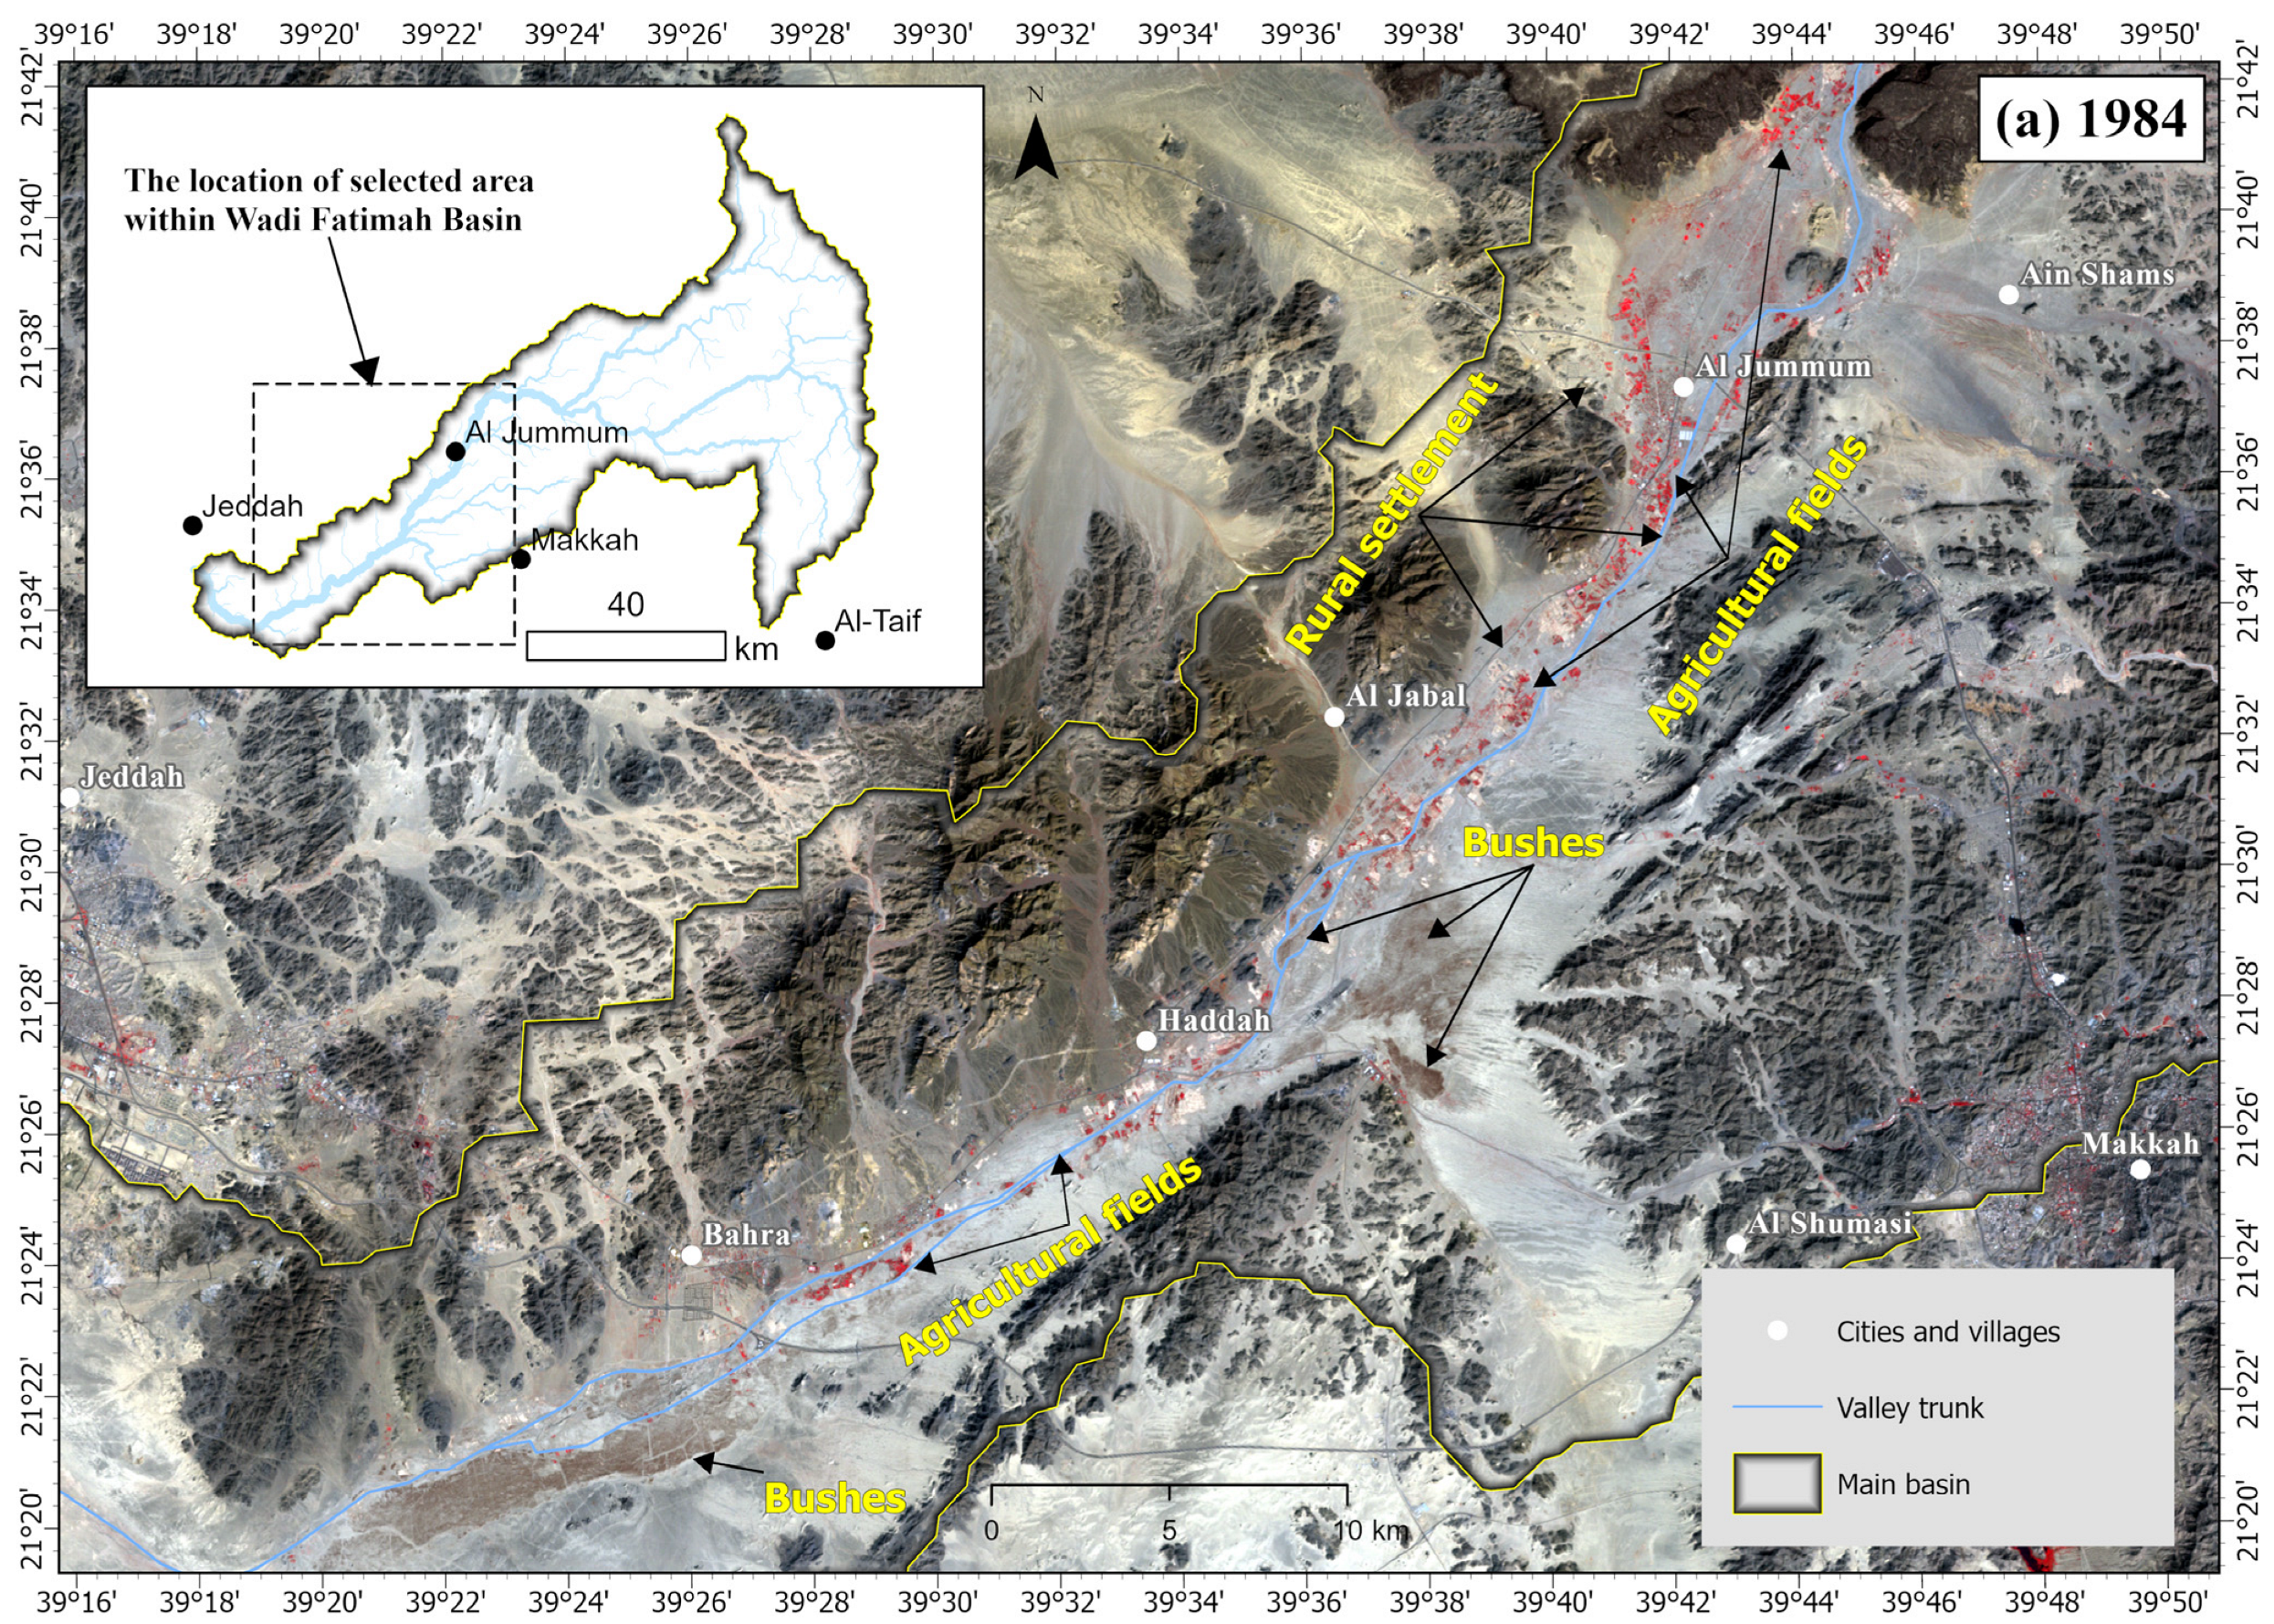
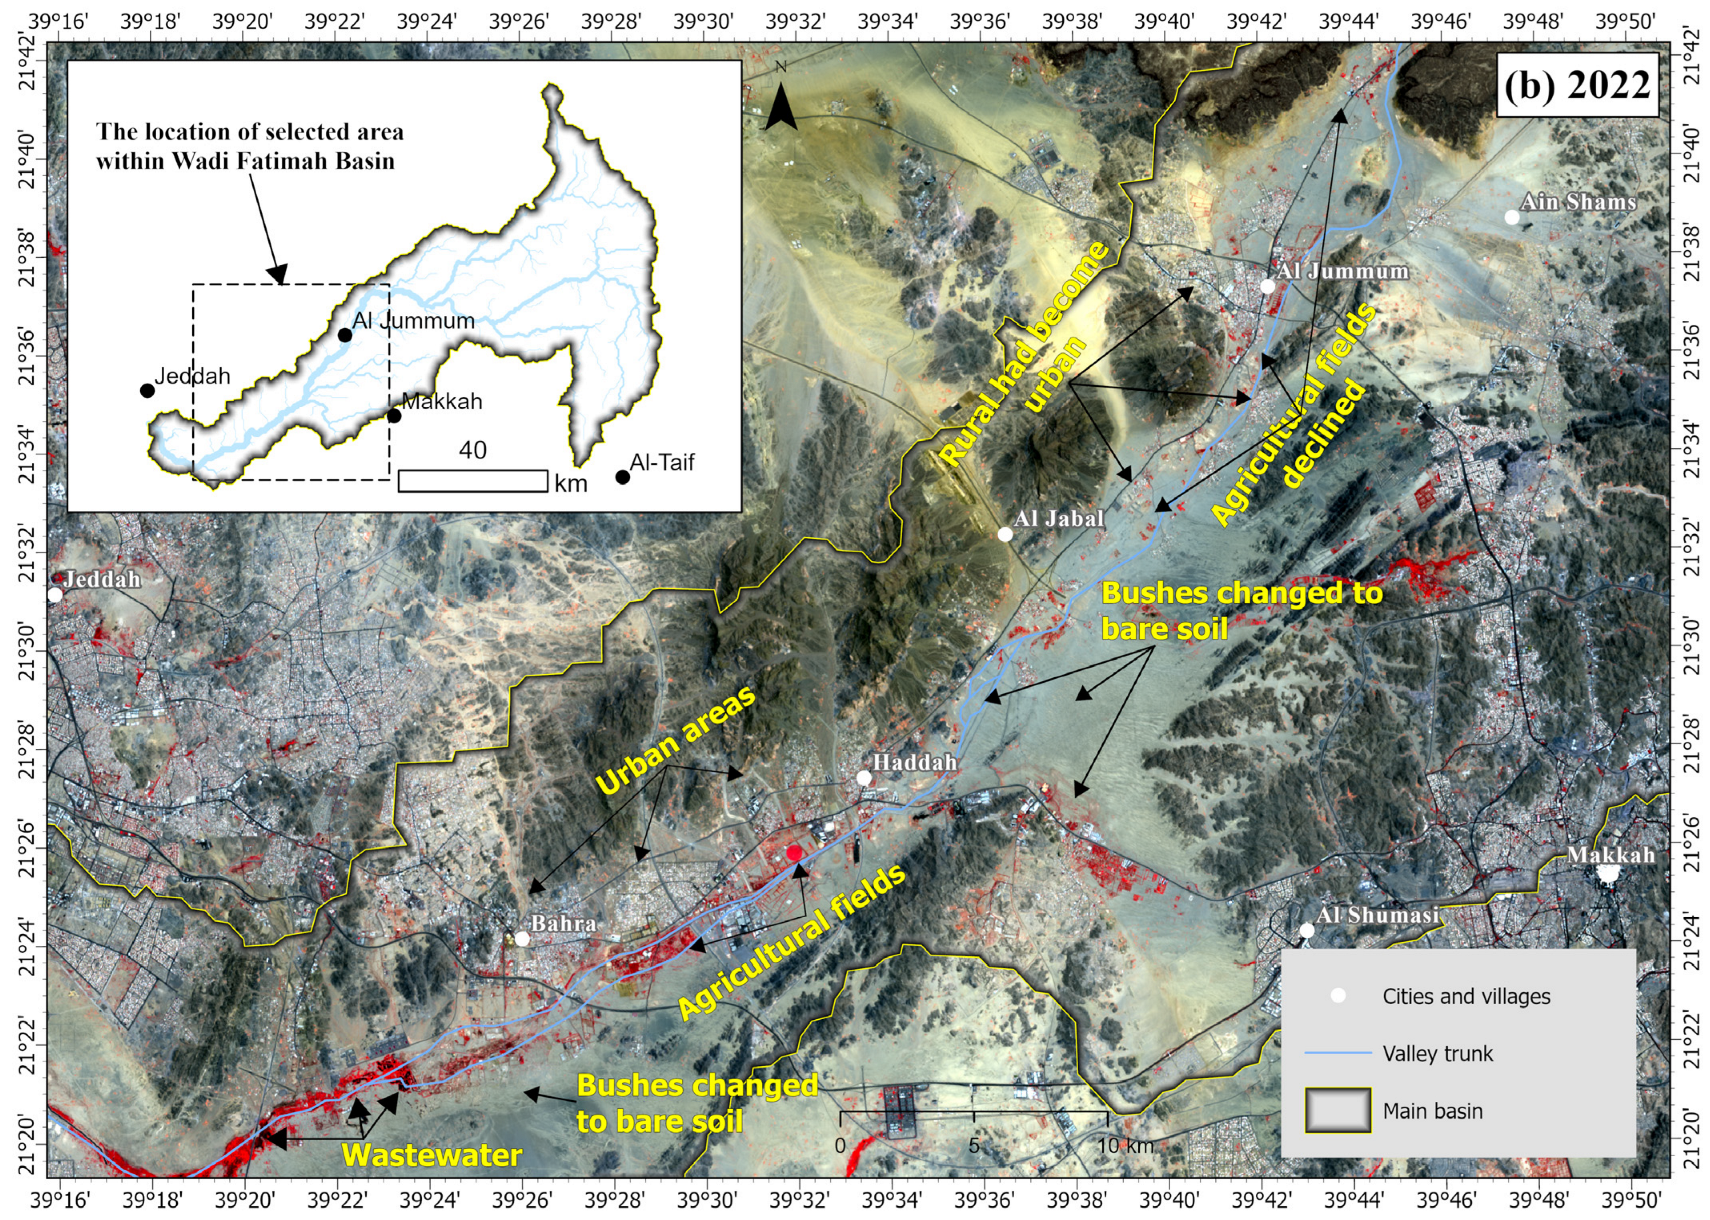
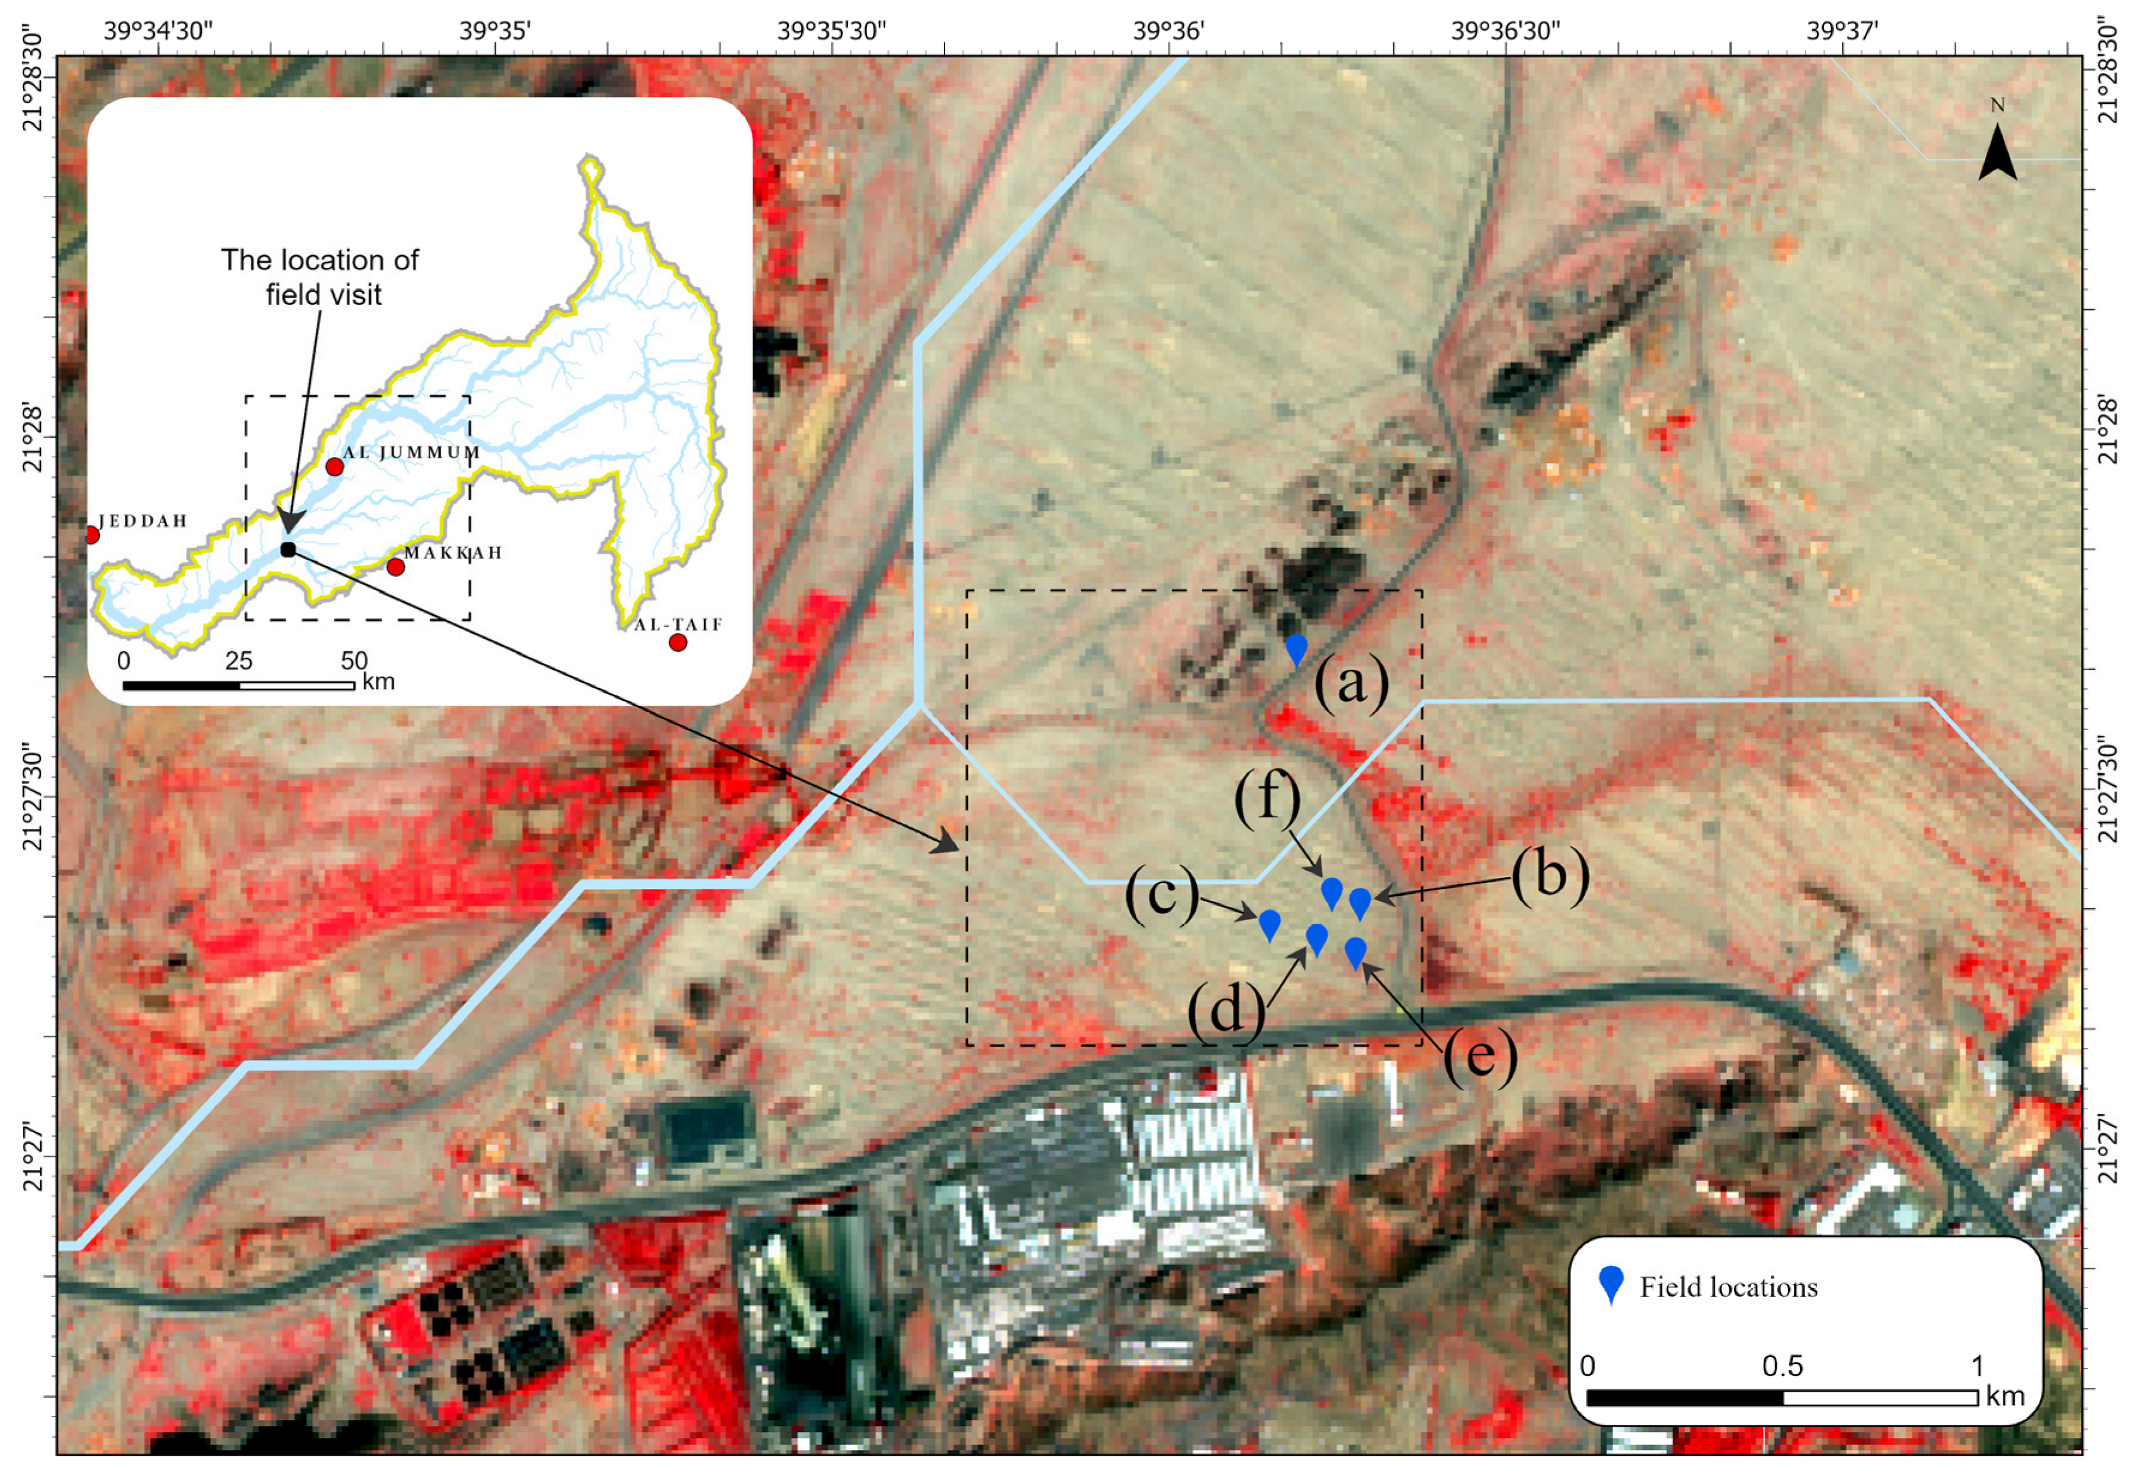
2. Study Area
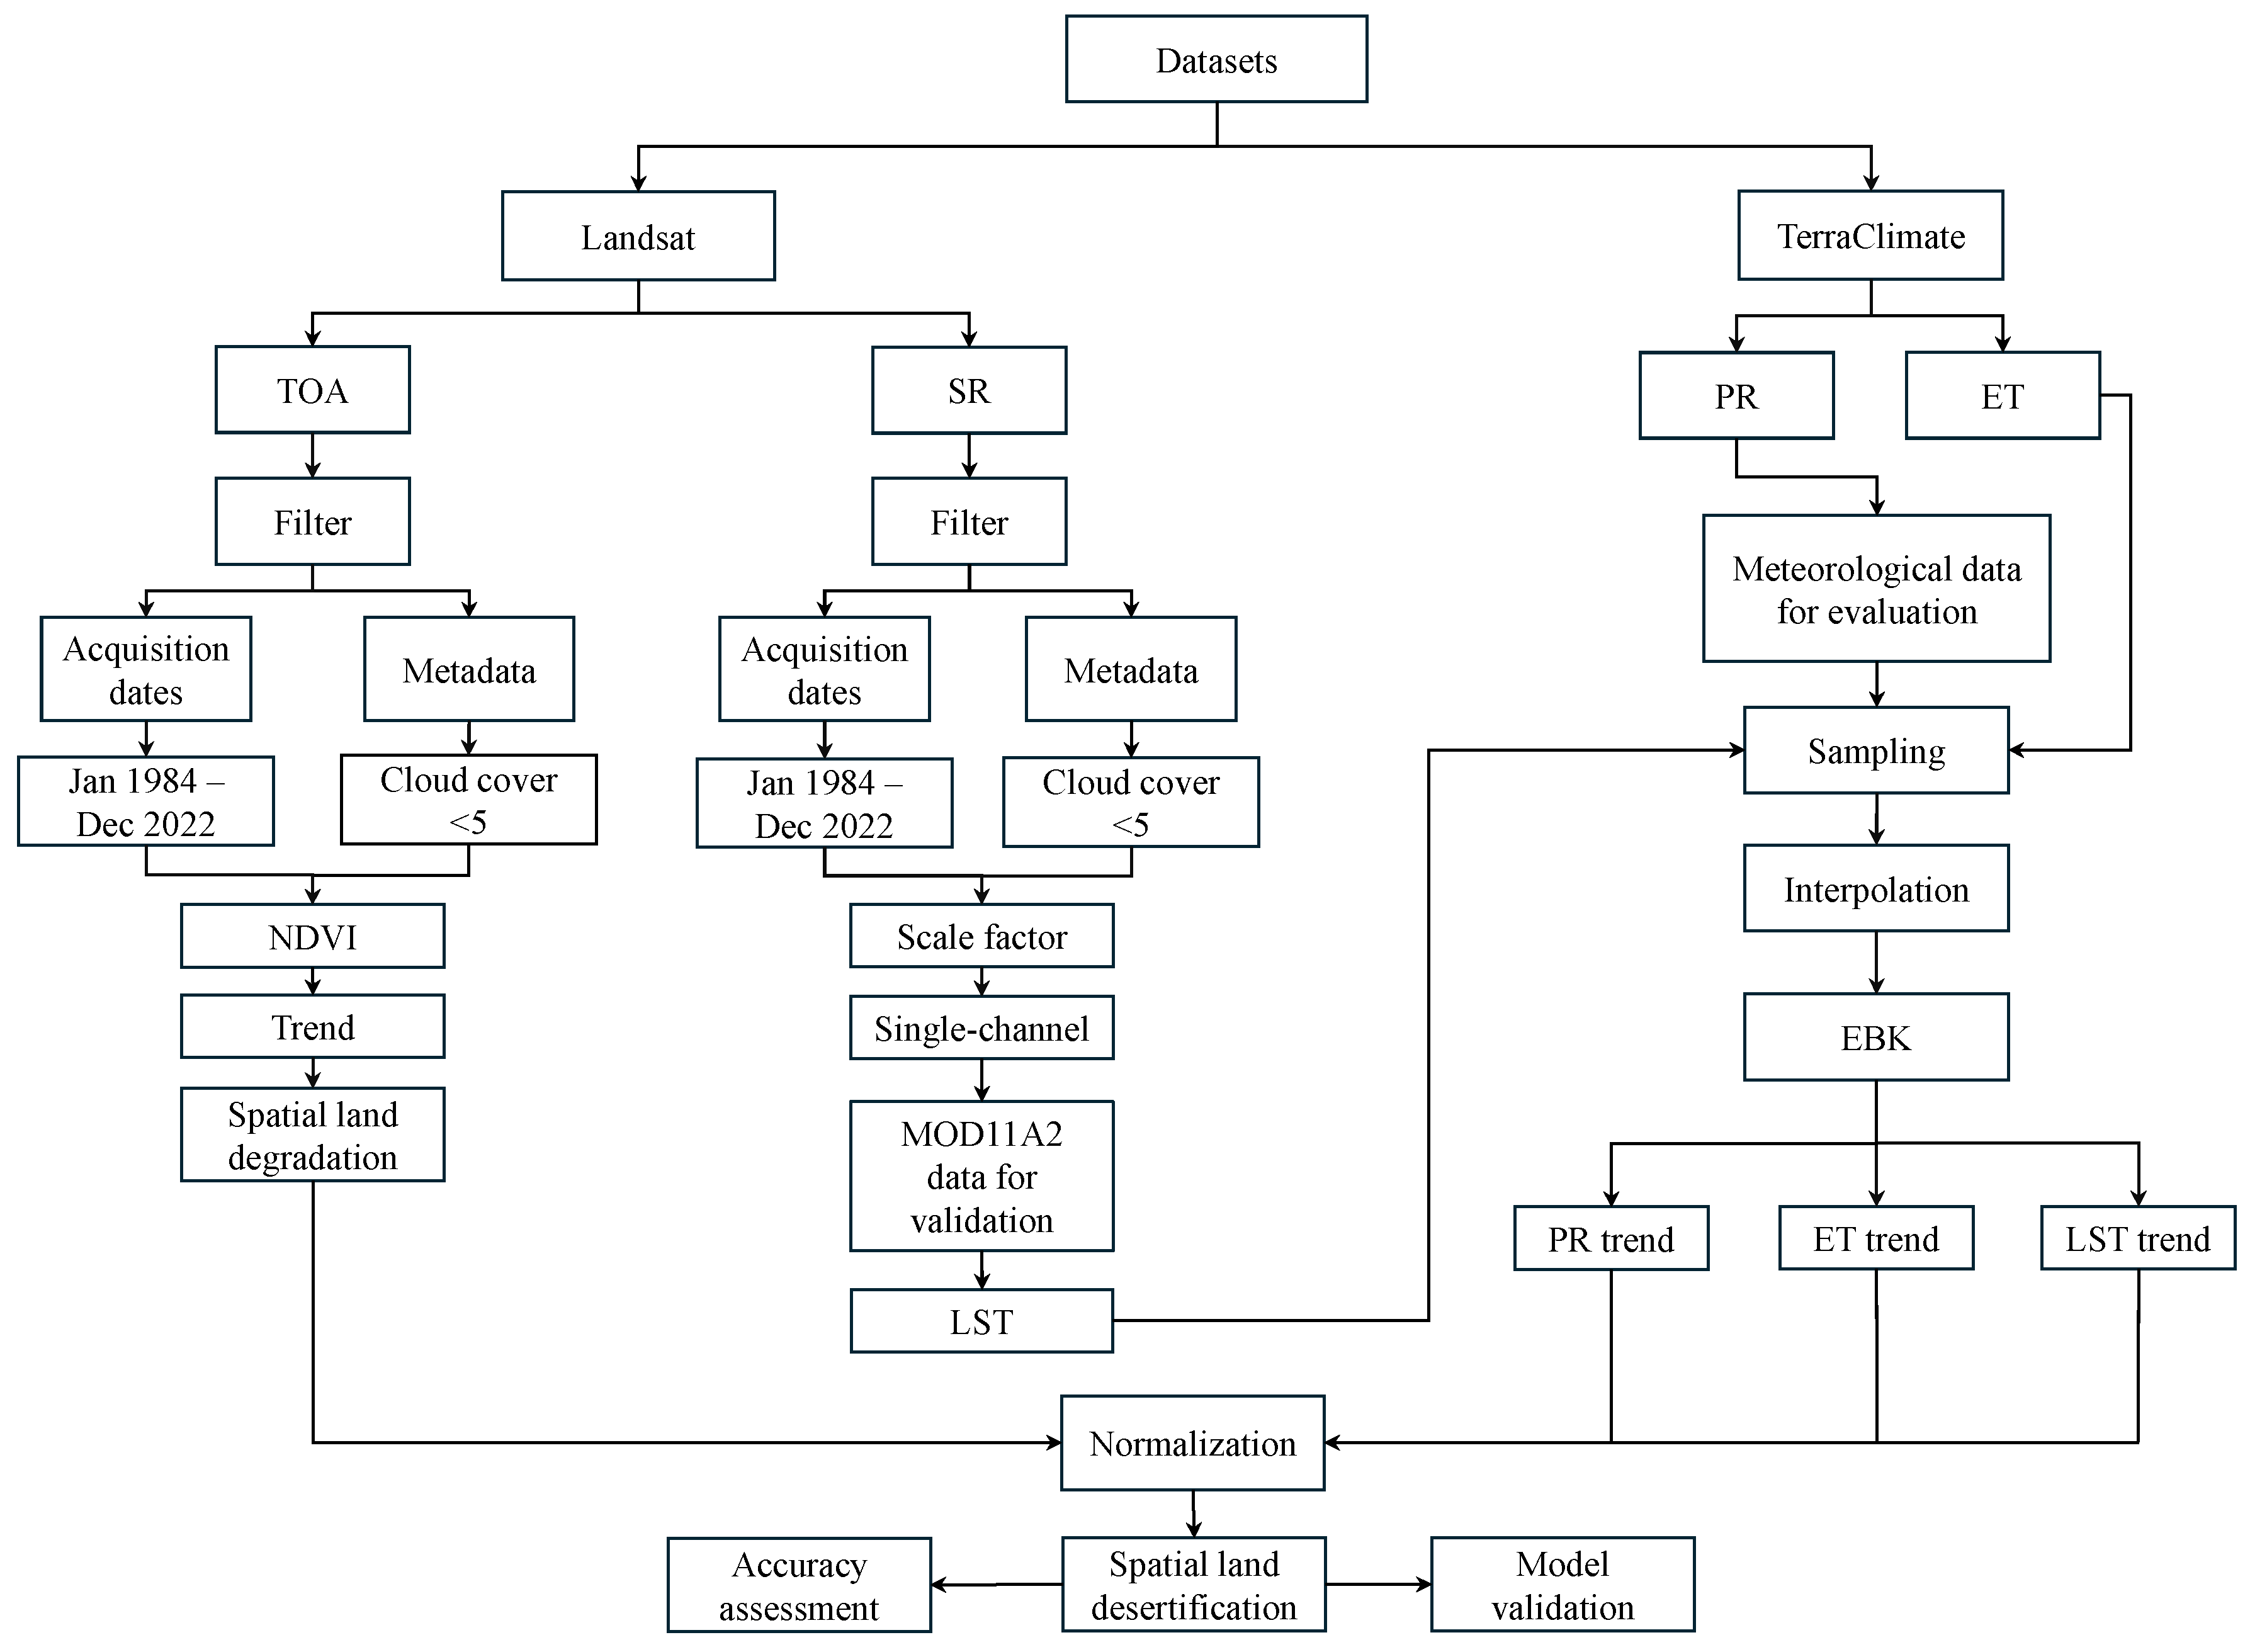
3. Materials and Methods
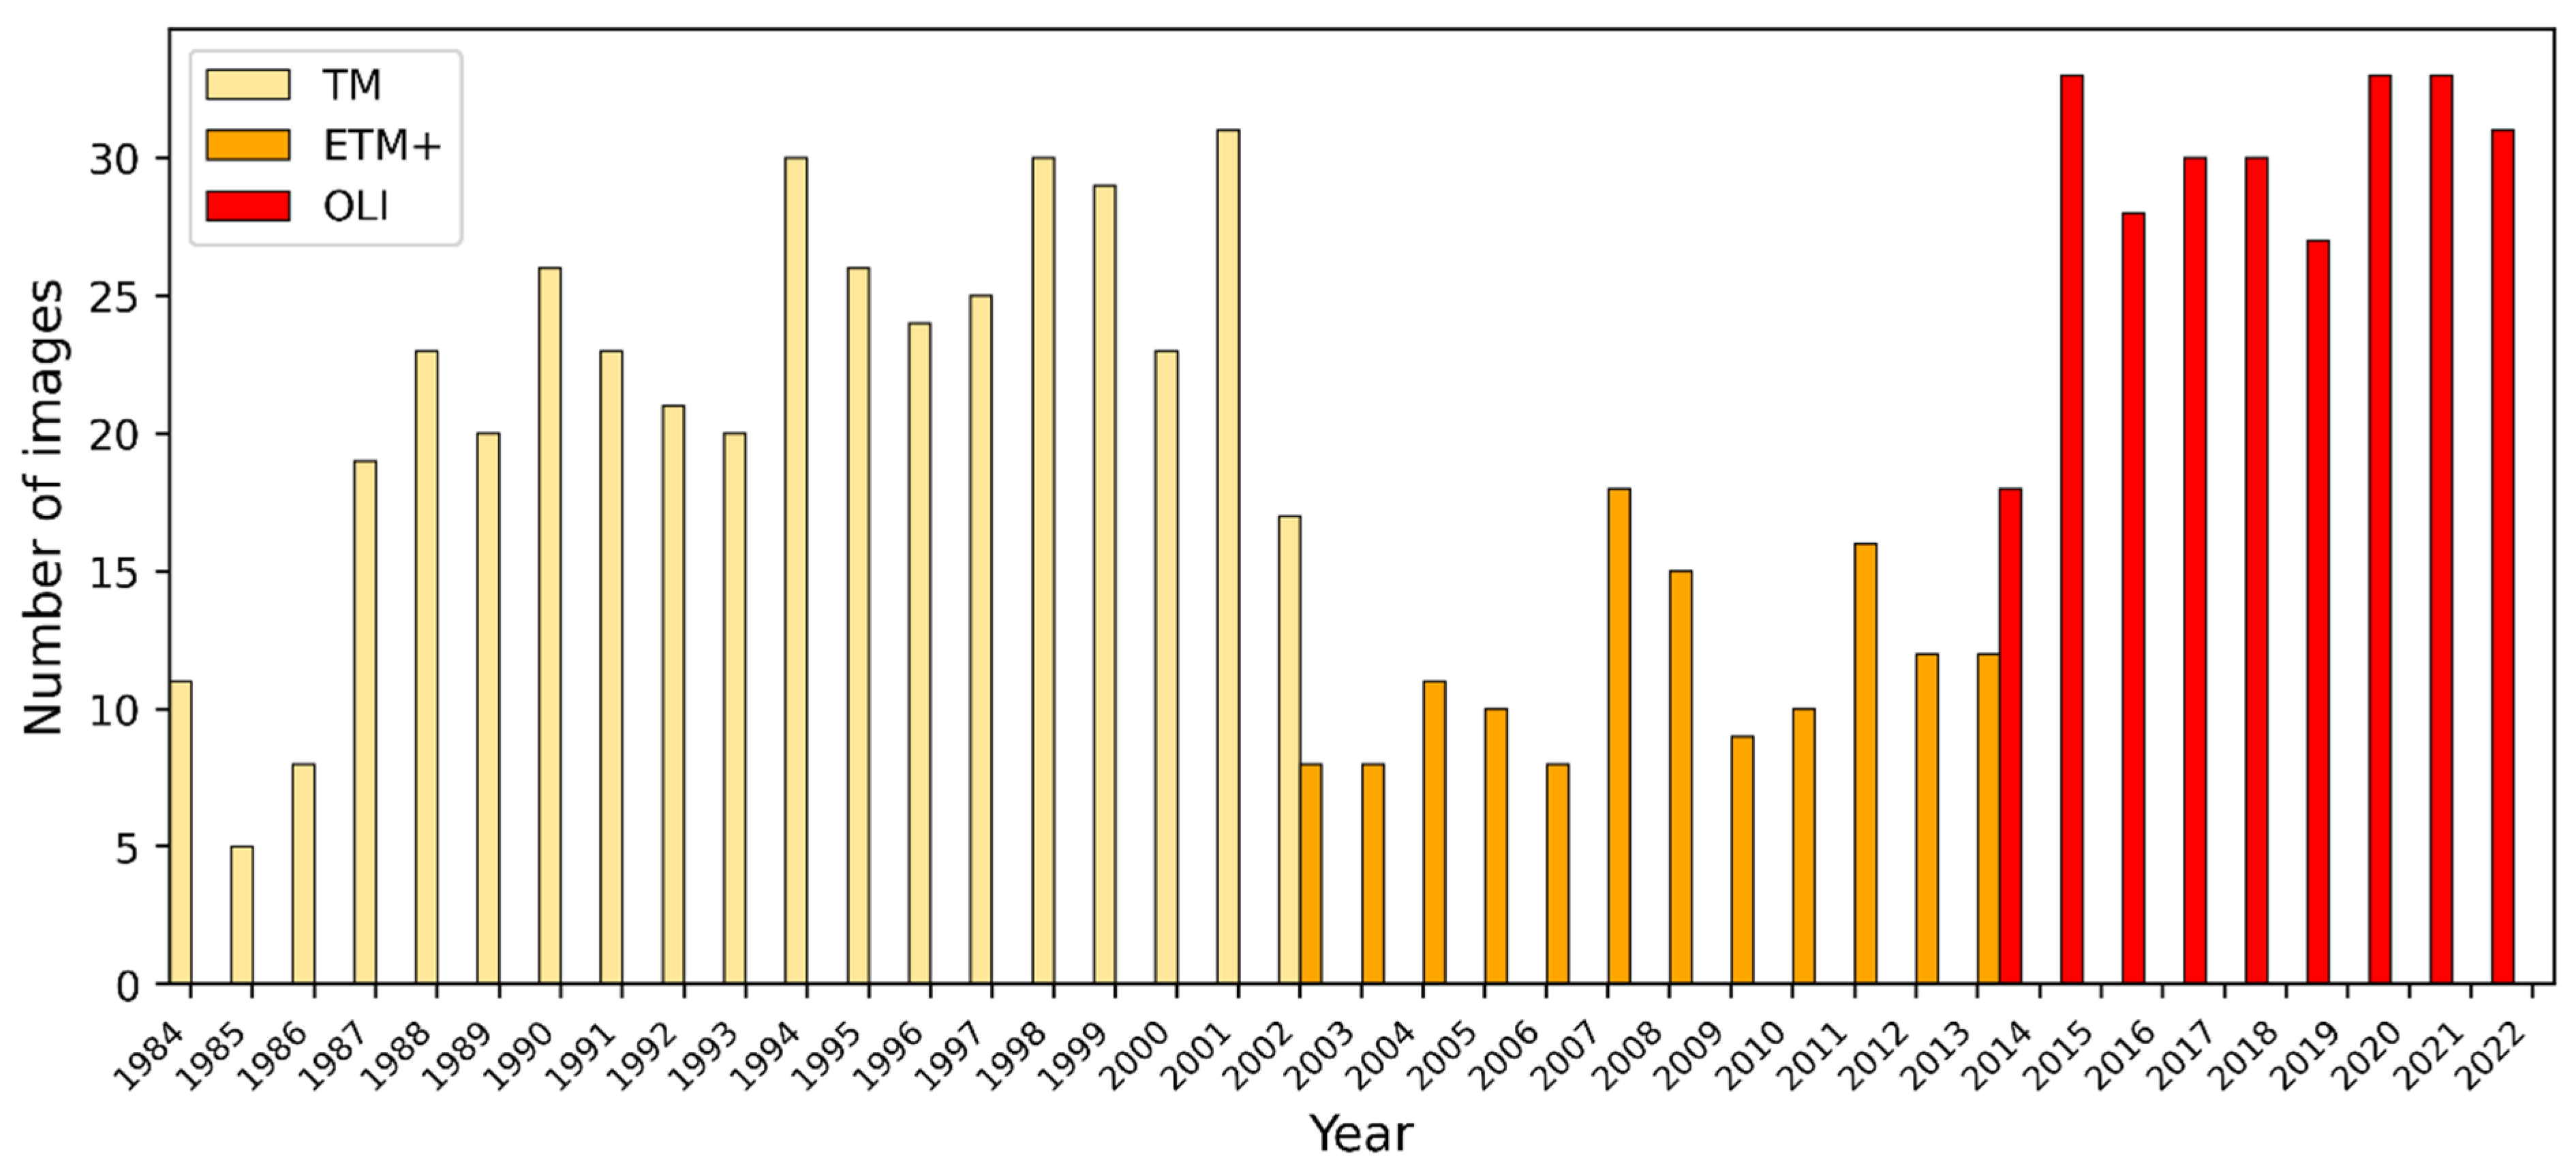
3.1. Datasets
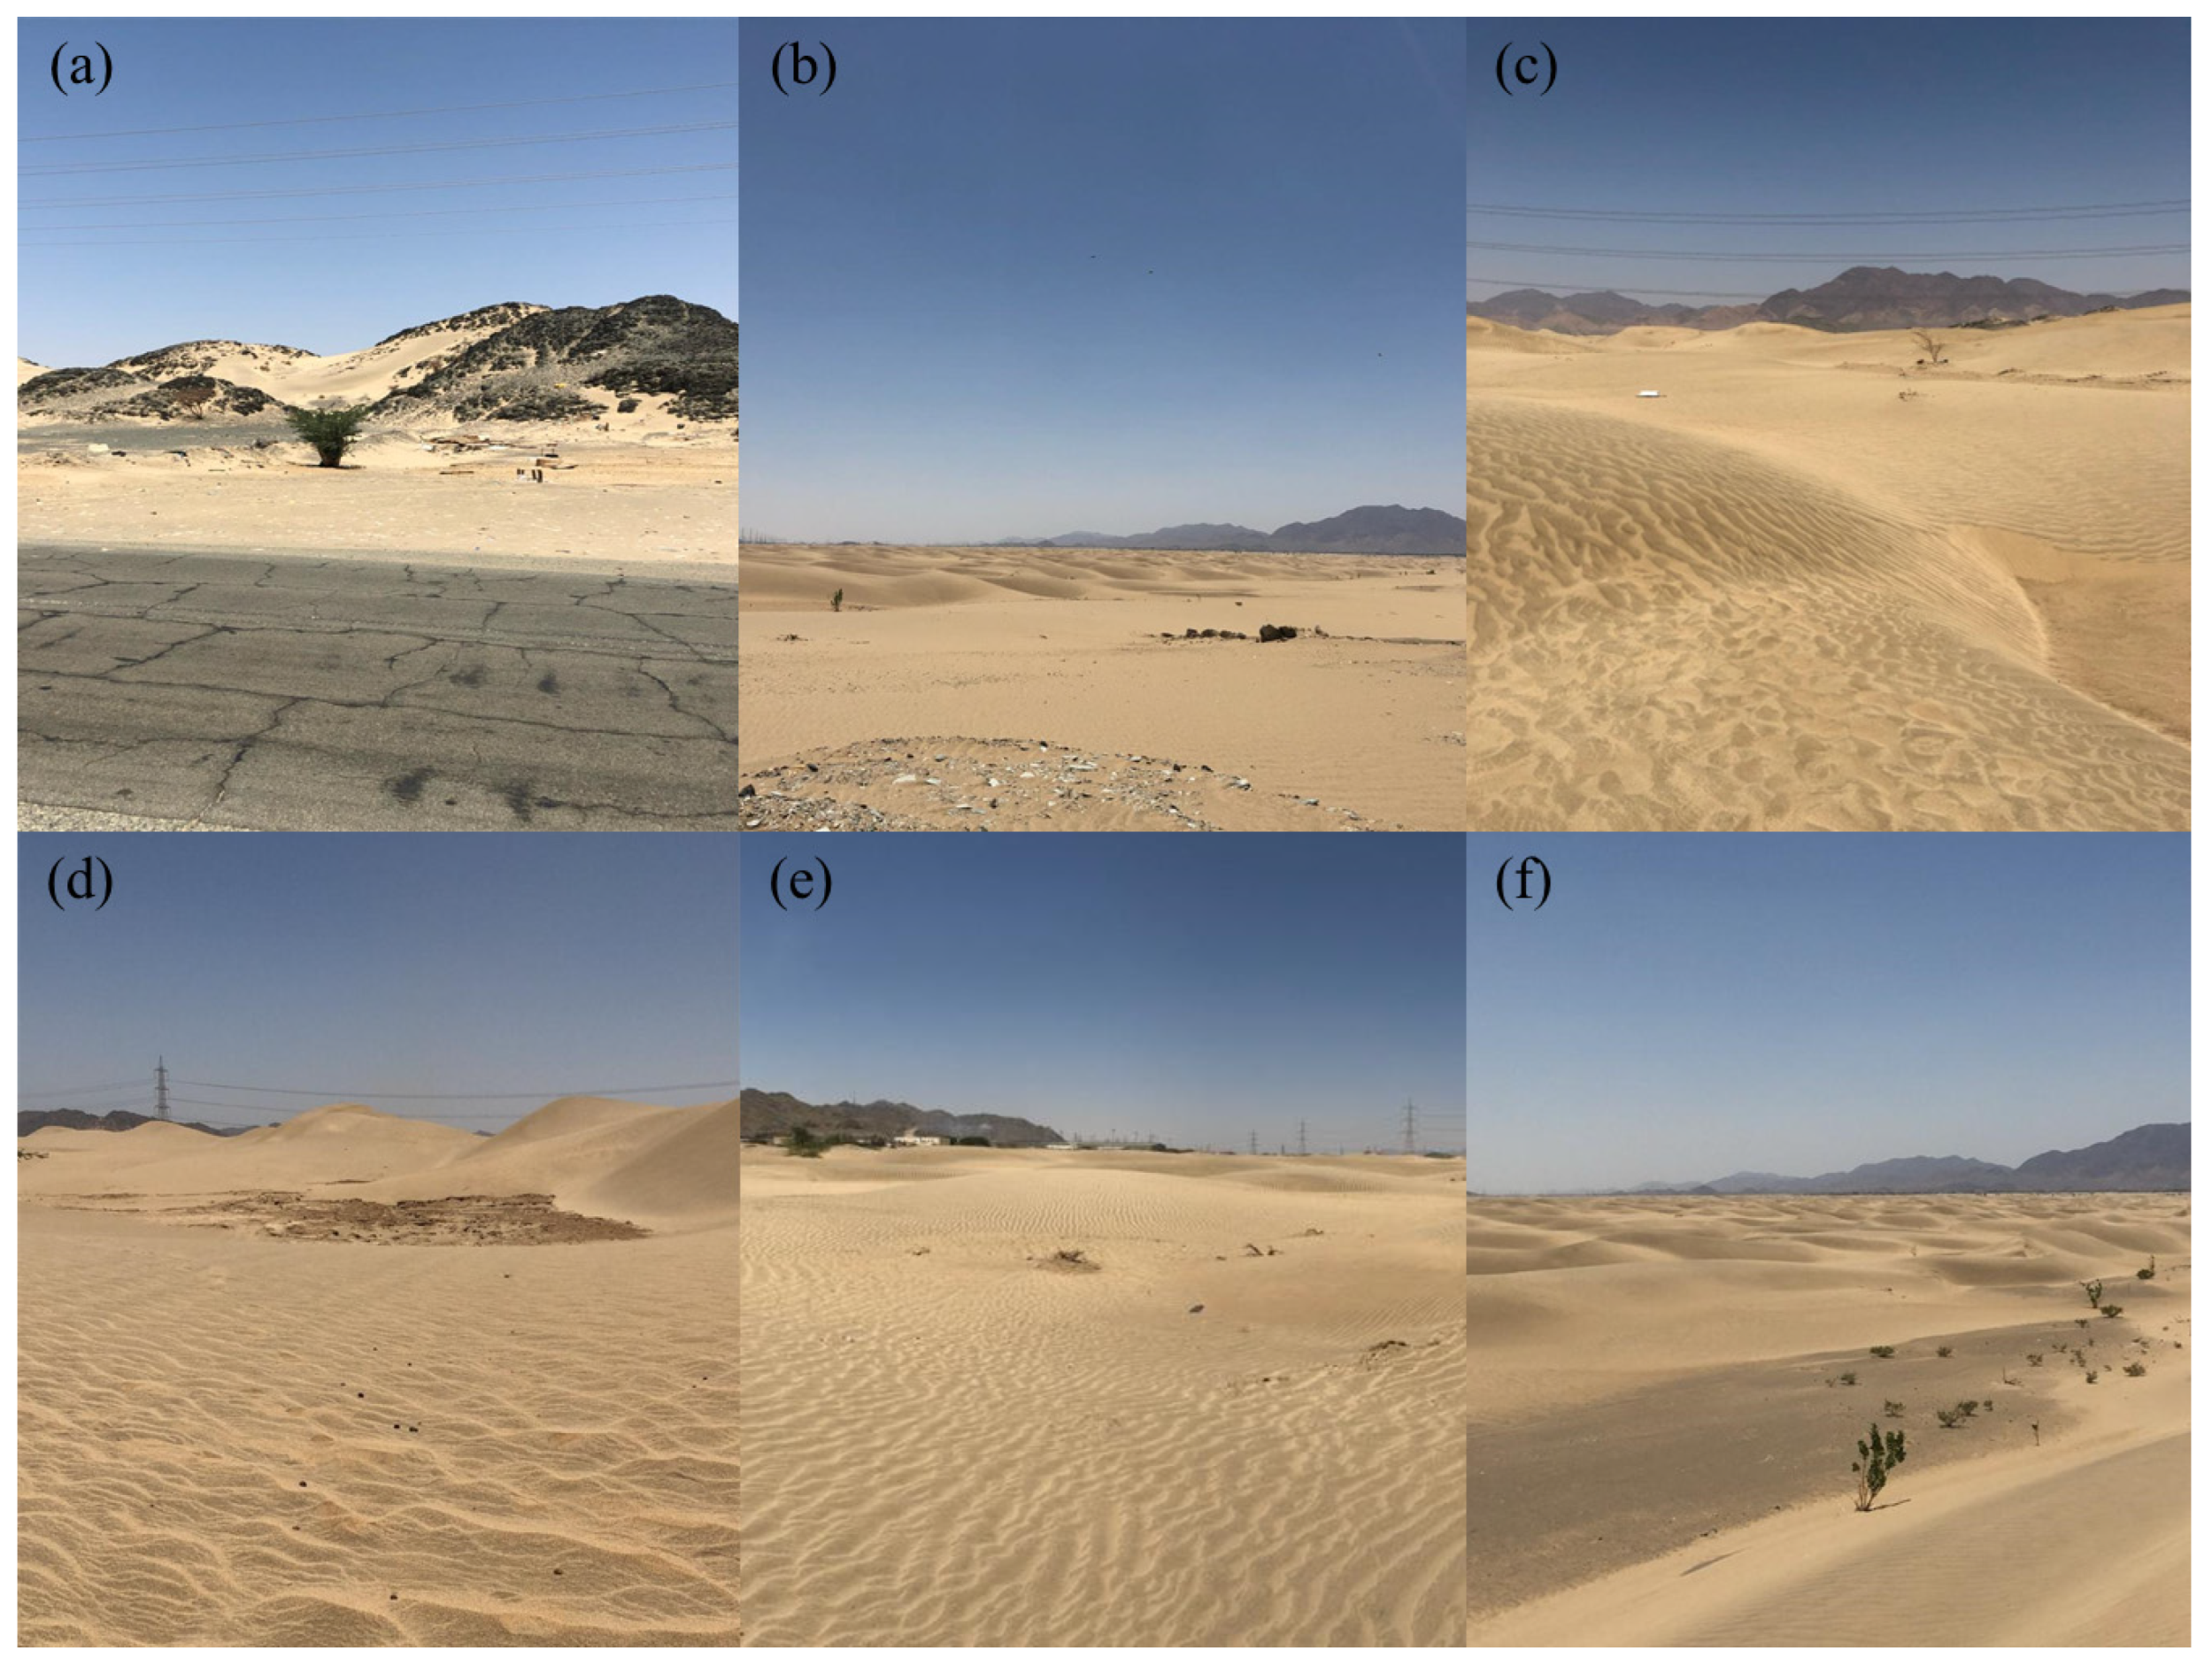
3.2. Sampling and Spatial Interpolation
3.3. Land Surface Temperature (LST) Retrieval and Validation
3.3.1. LST Retrieval
3.3.2. LST Validation
3.4. Precipitation and ET Evaluation
3.5. Trend Analysis
3.6. Desertification Index
3.7. Model Evaluation and Comparison
3.8. Accuracy Assessment
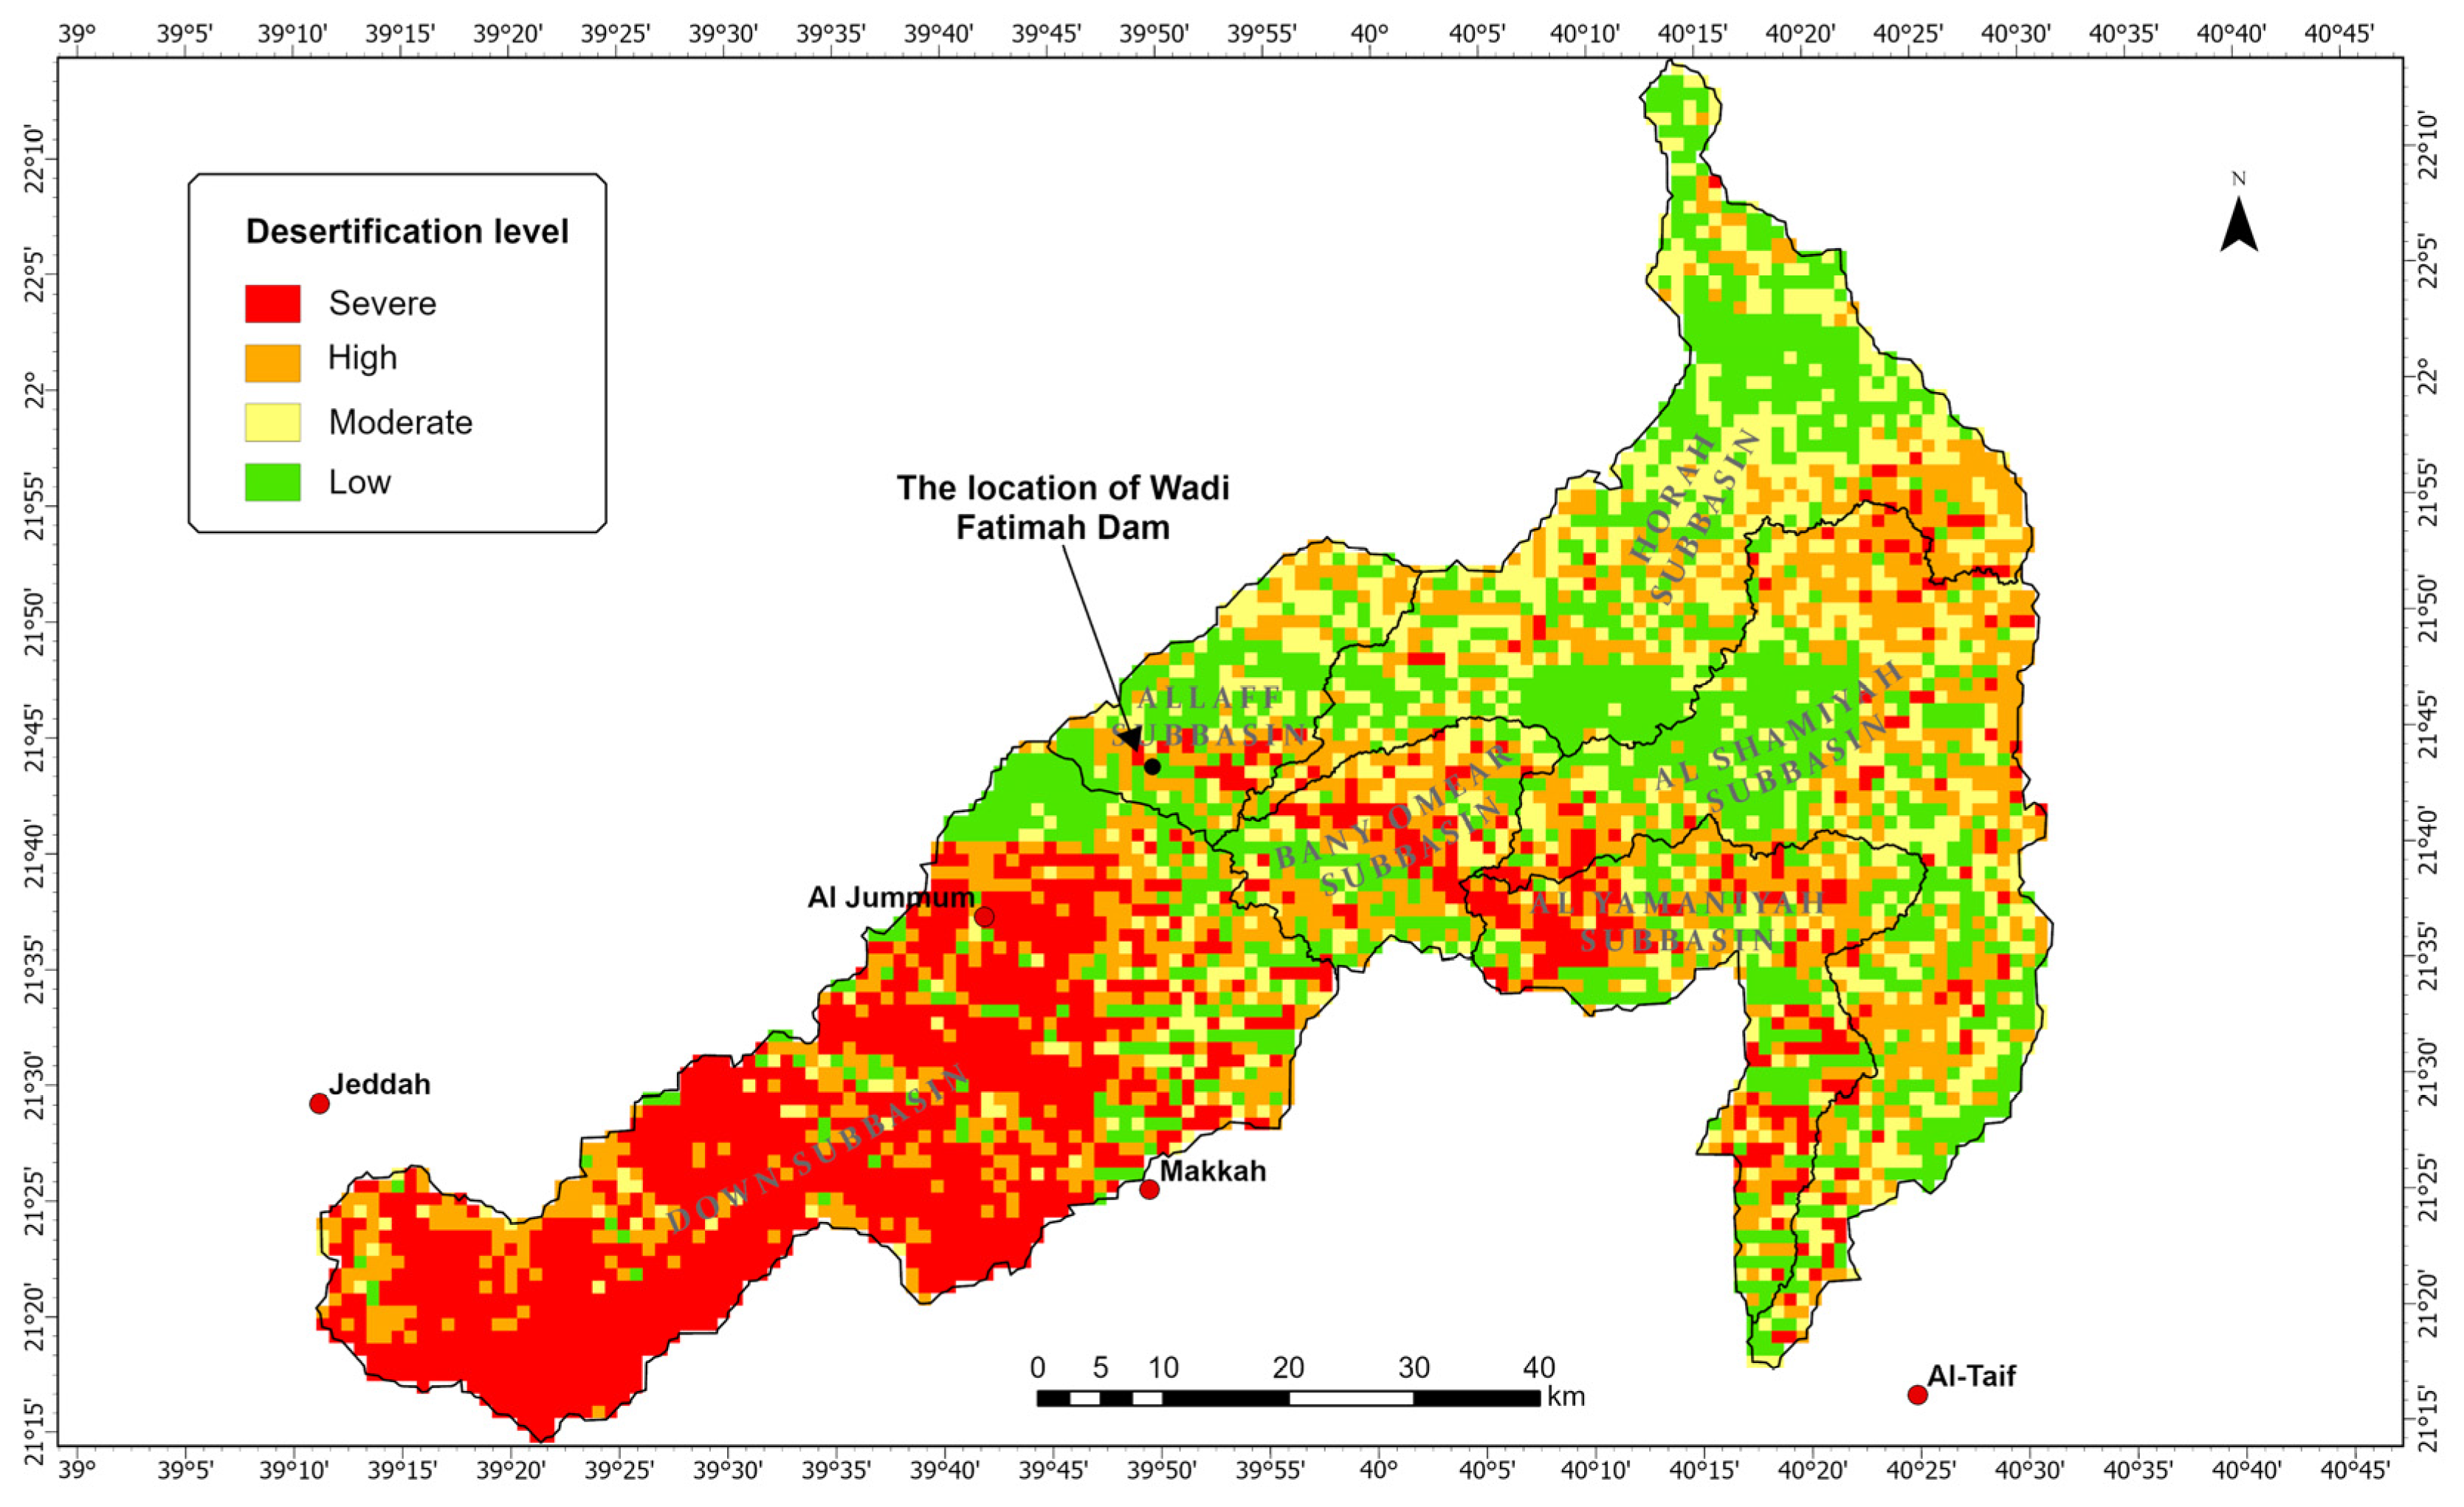
- Severe desertification: Areas with no vegetation cover and extremely high LST, typically consisting of sand dunes and bare soil.
- High desertification: Areas with sparse, seasonally growing vegetation and high LST.
- Moderate desertification: Areas characterized by partial vegetation cover and moderate LST.
- Low desertification: Areas with substantial vegetation cover and relatively low LST.
4. Results
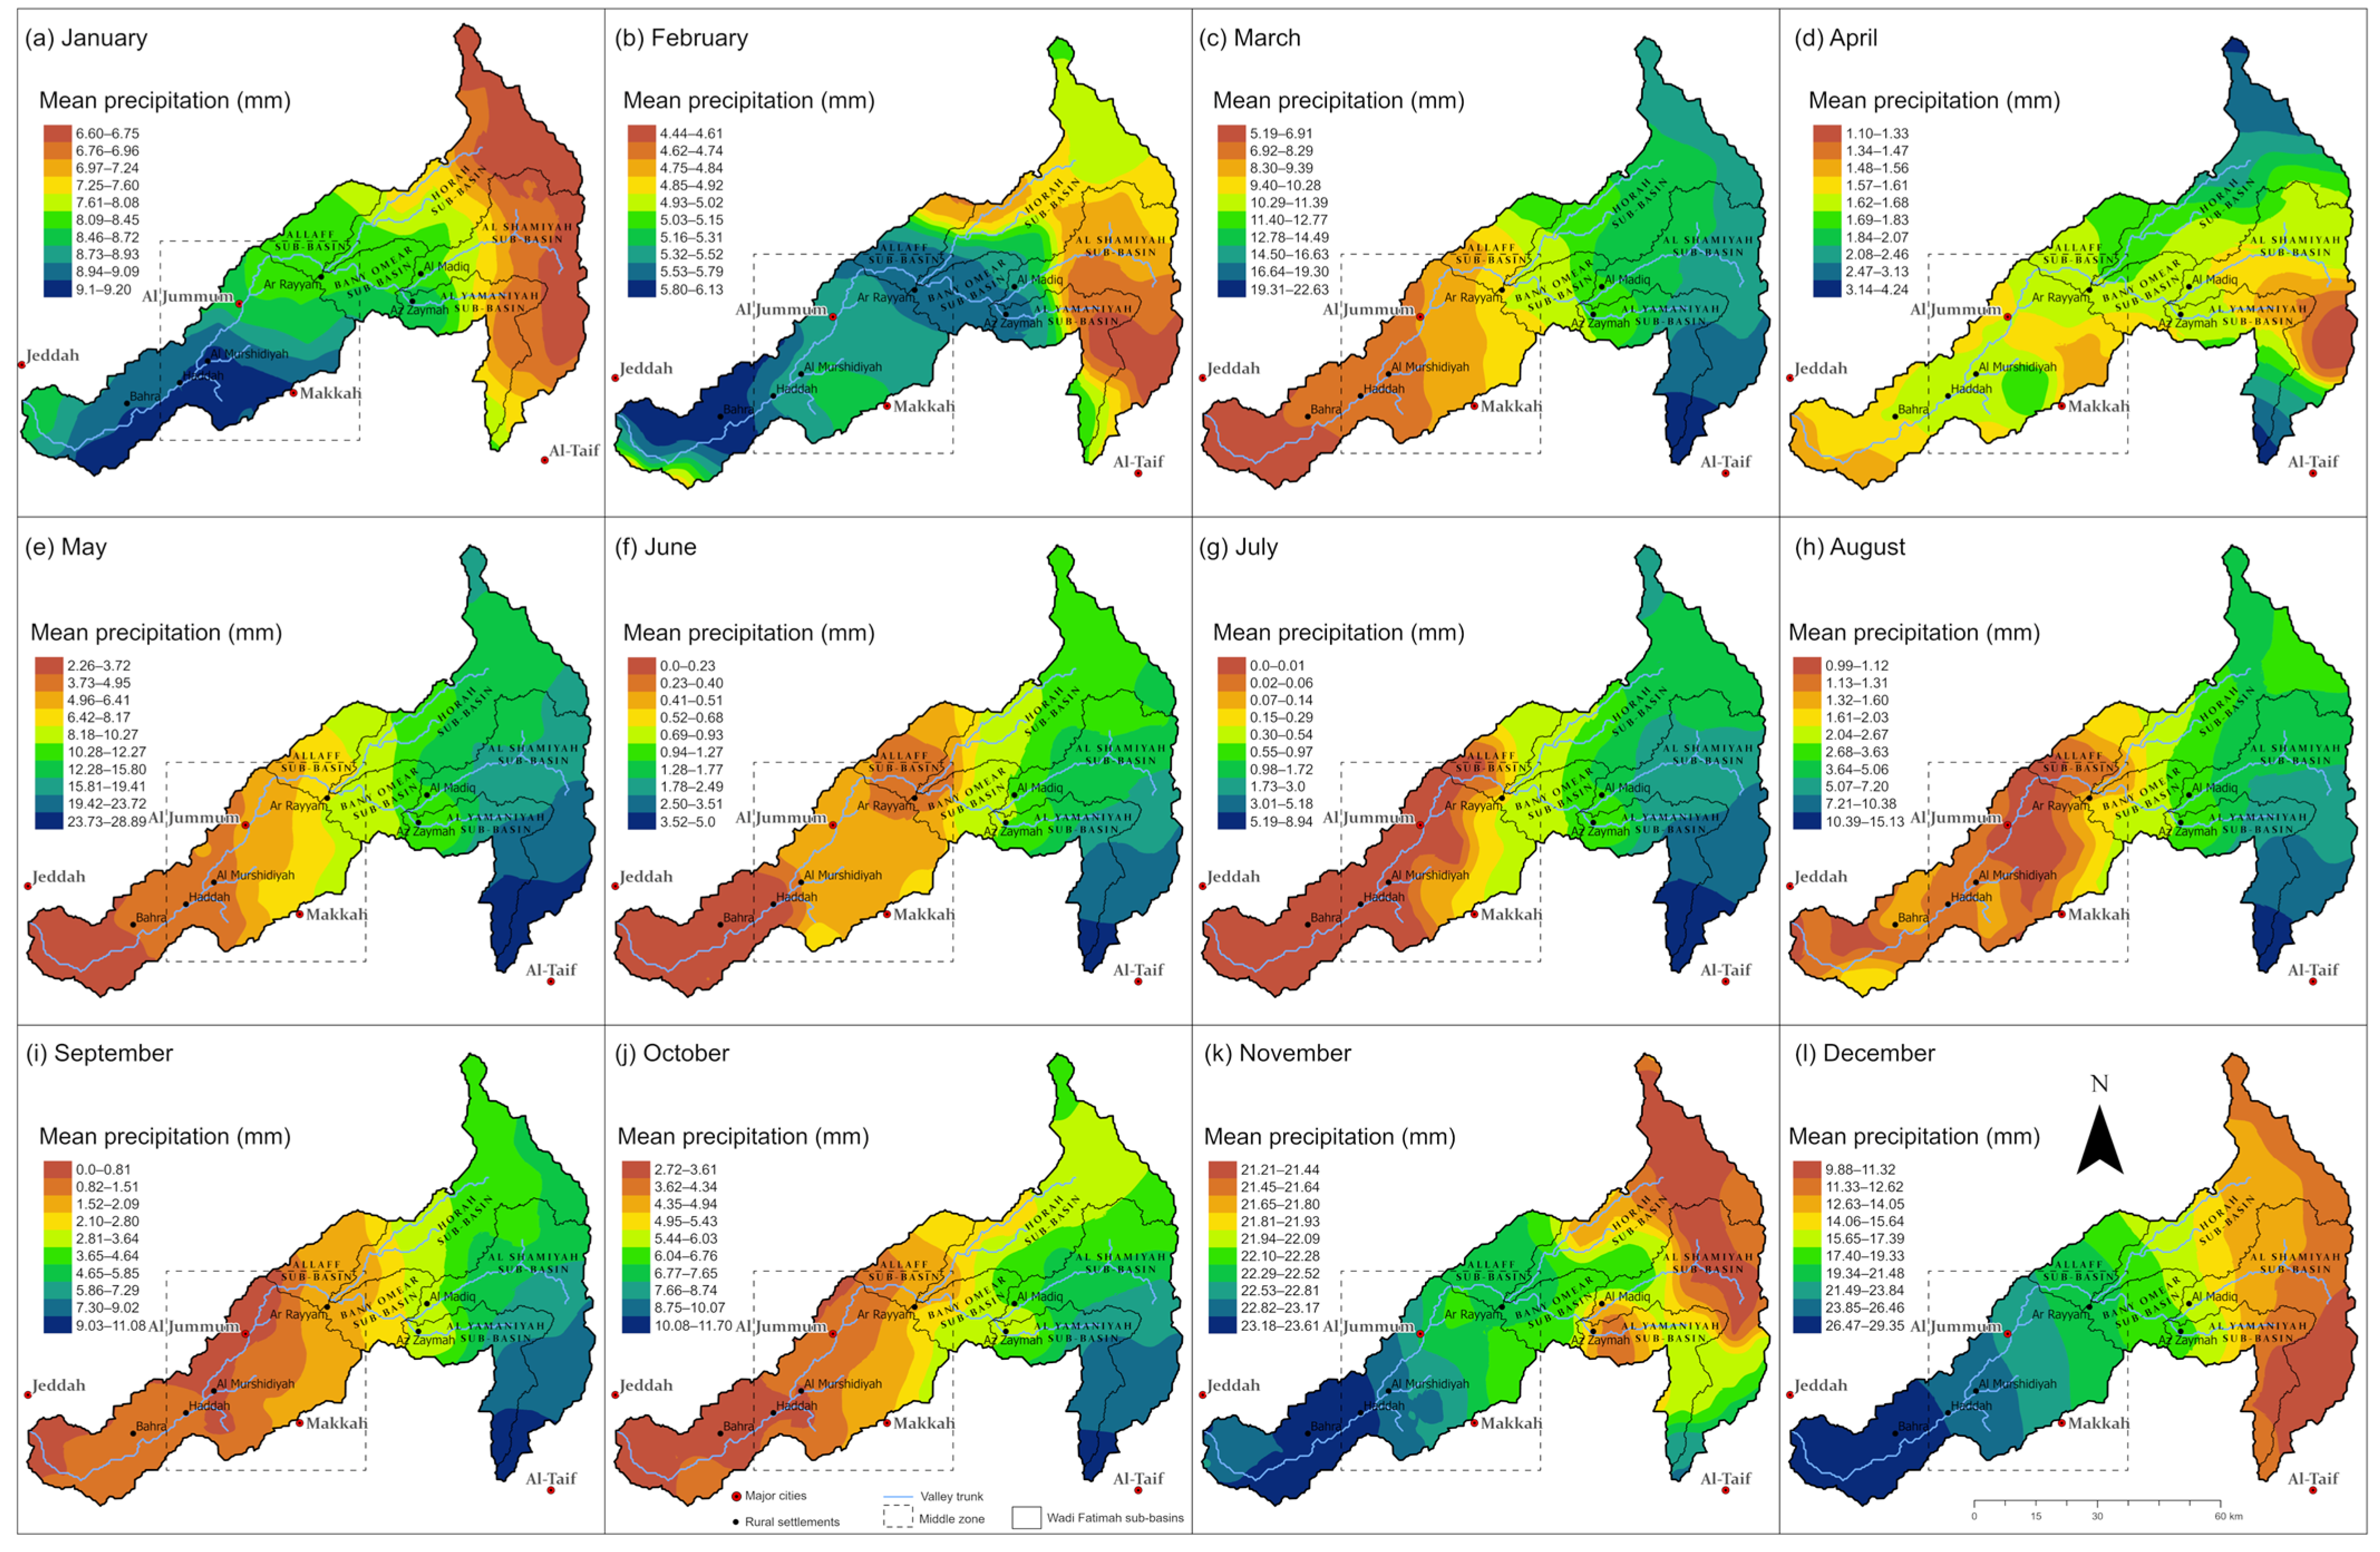
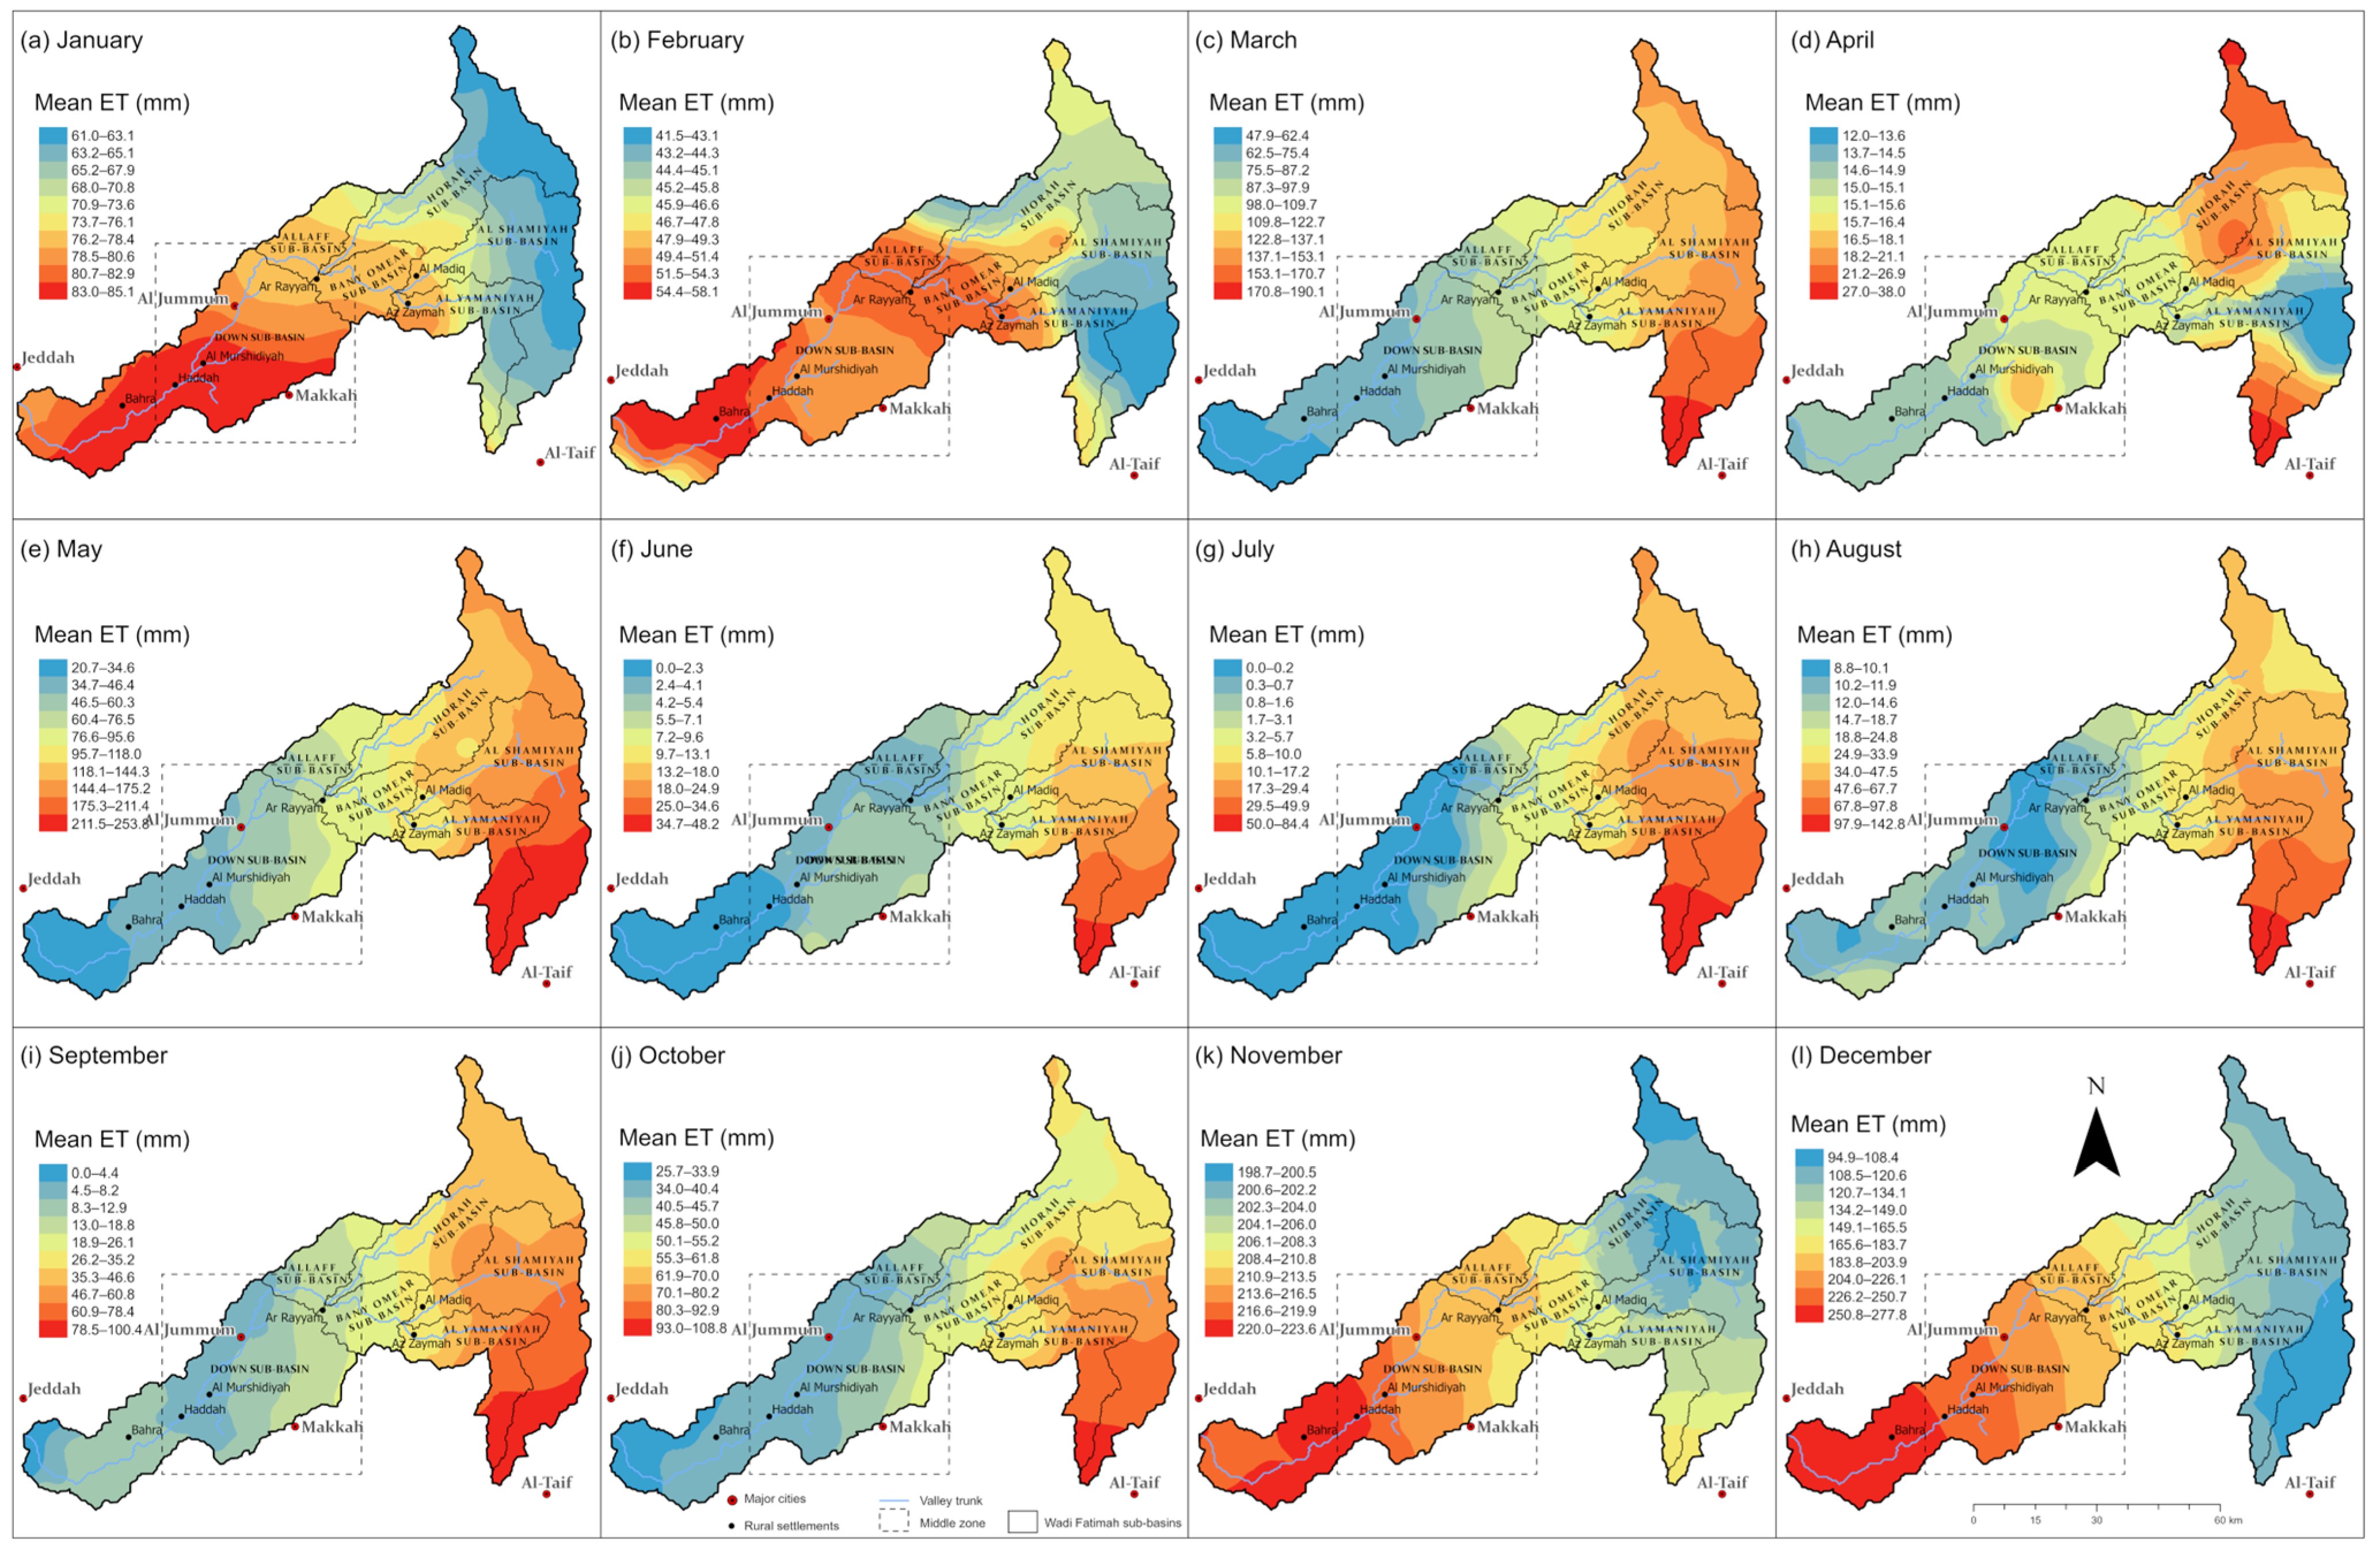
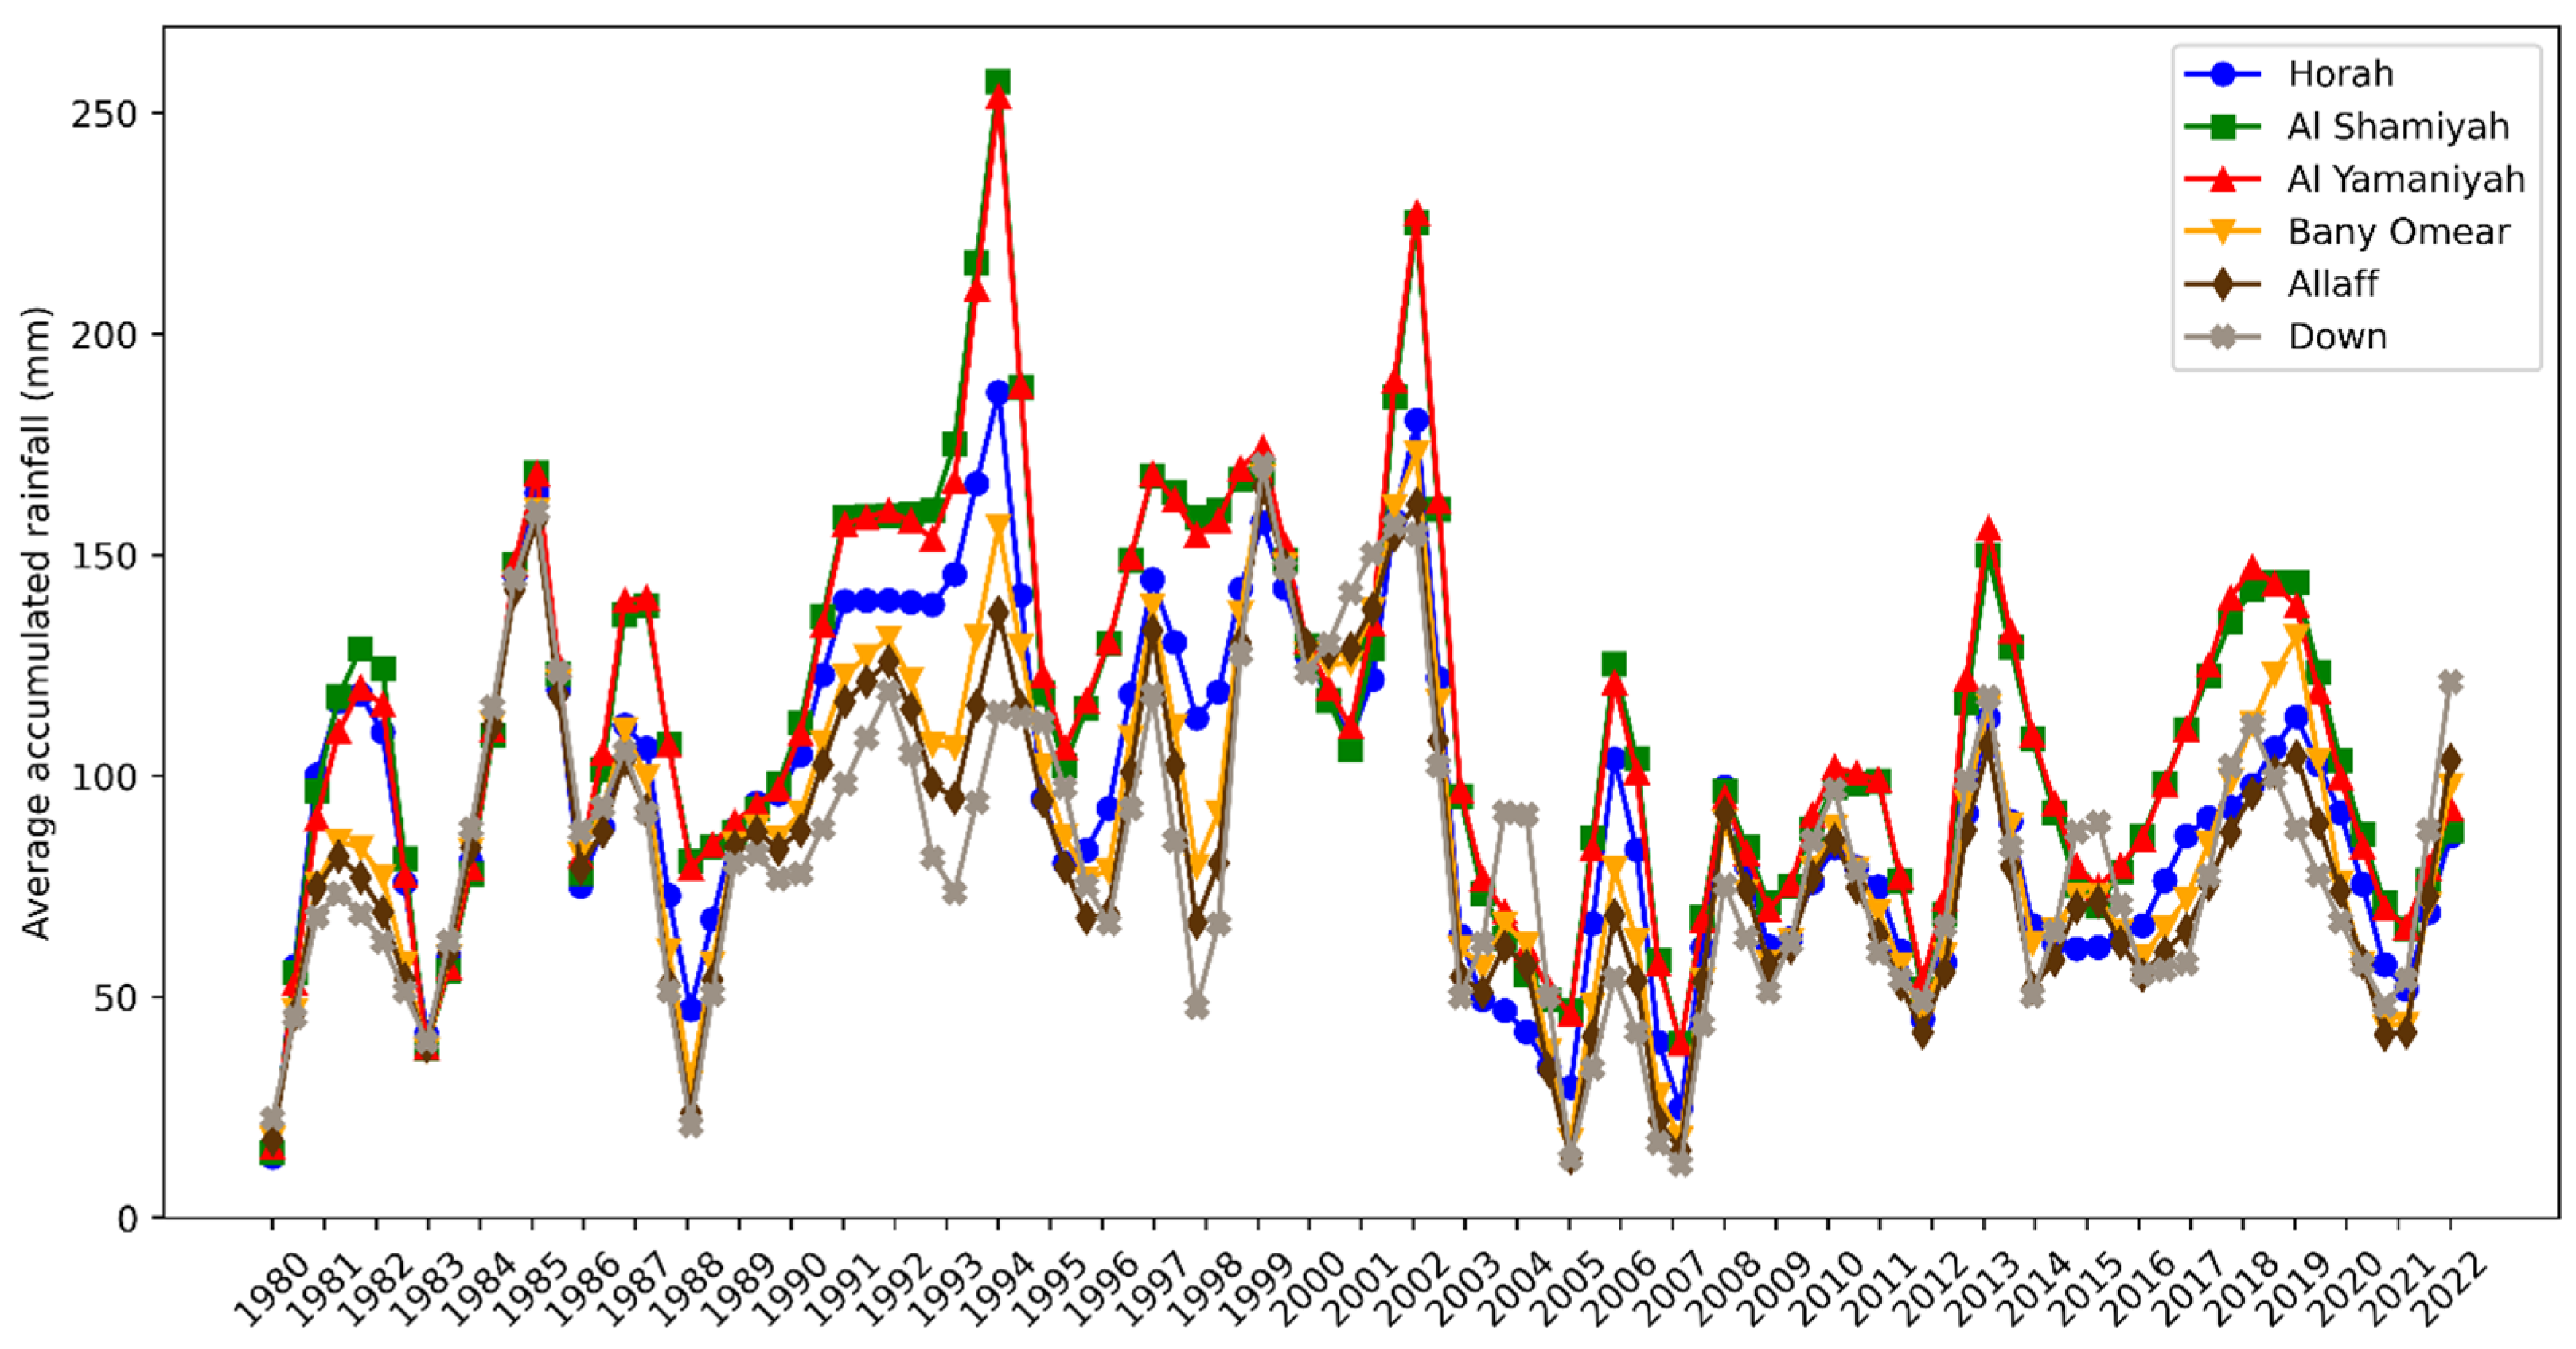
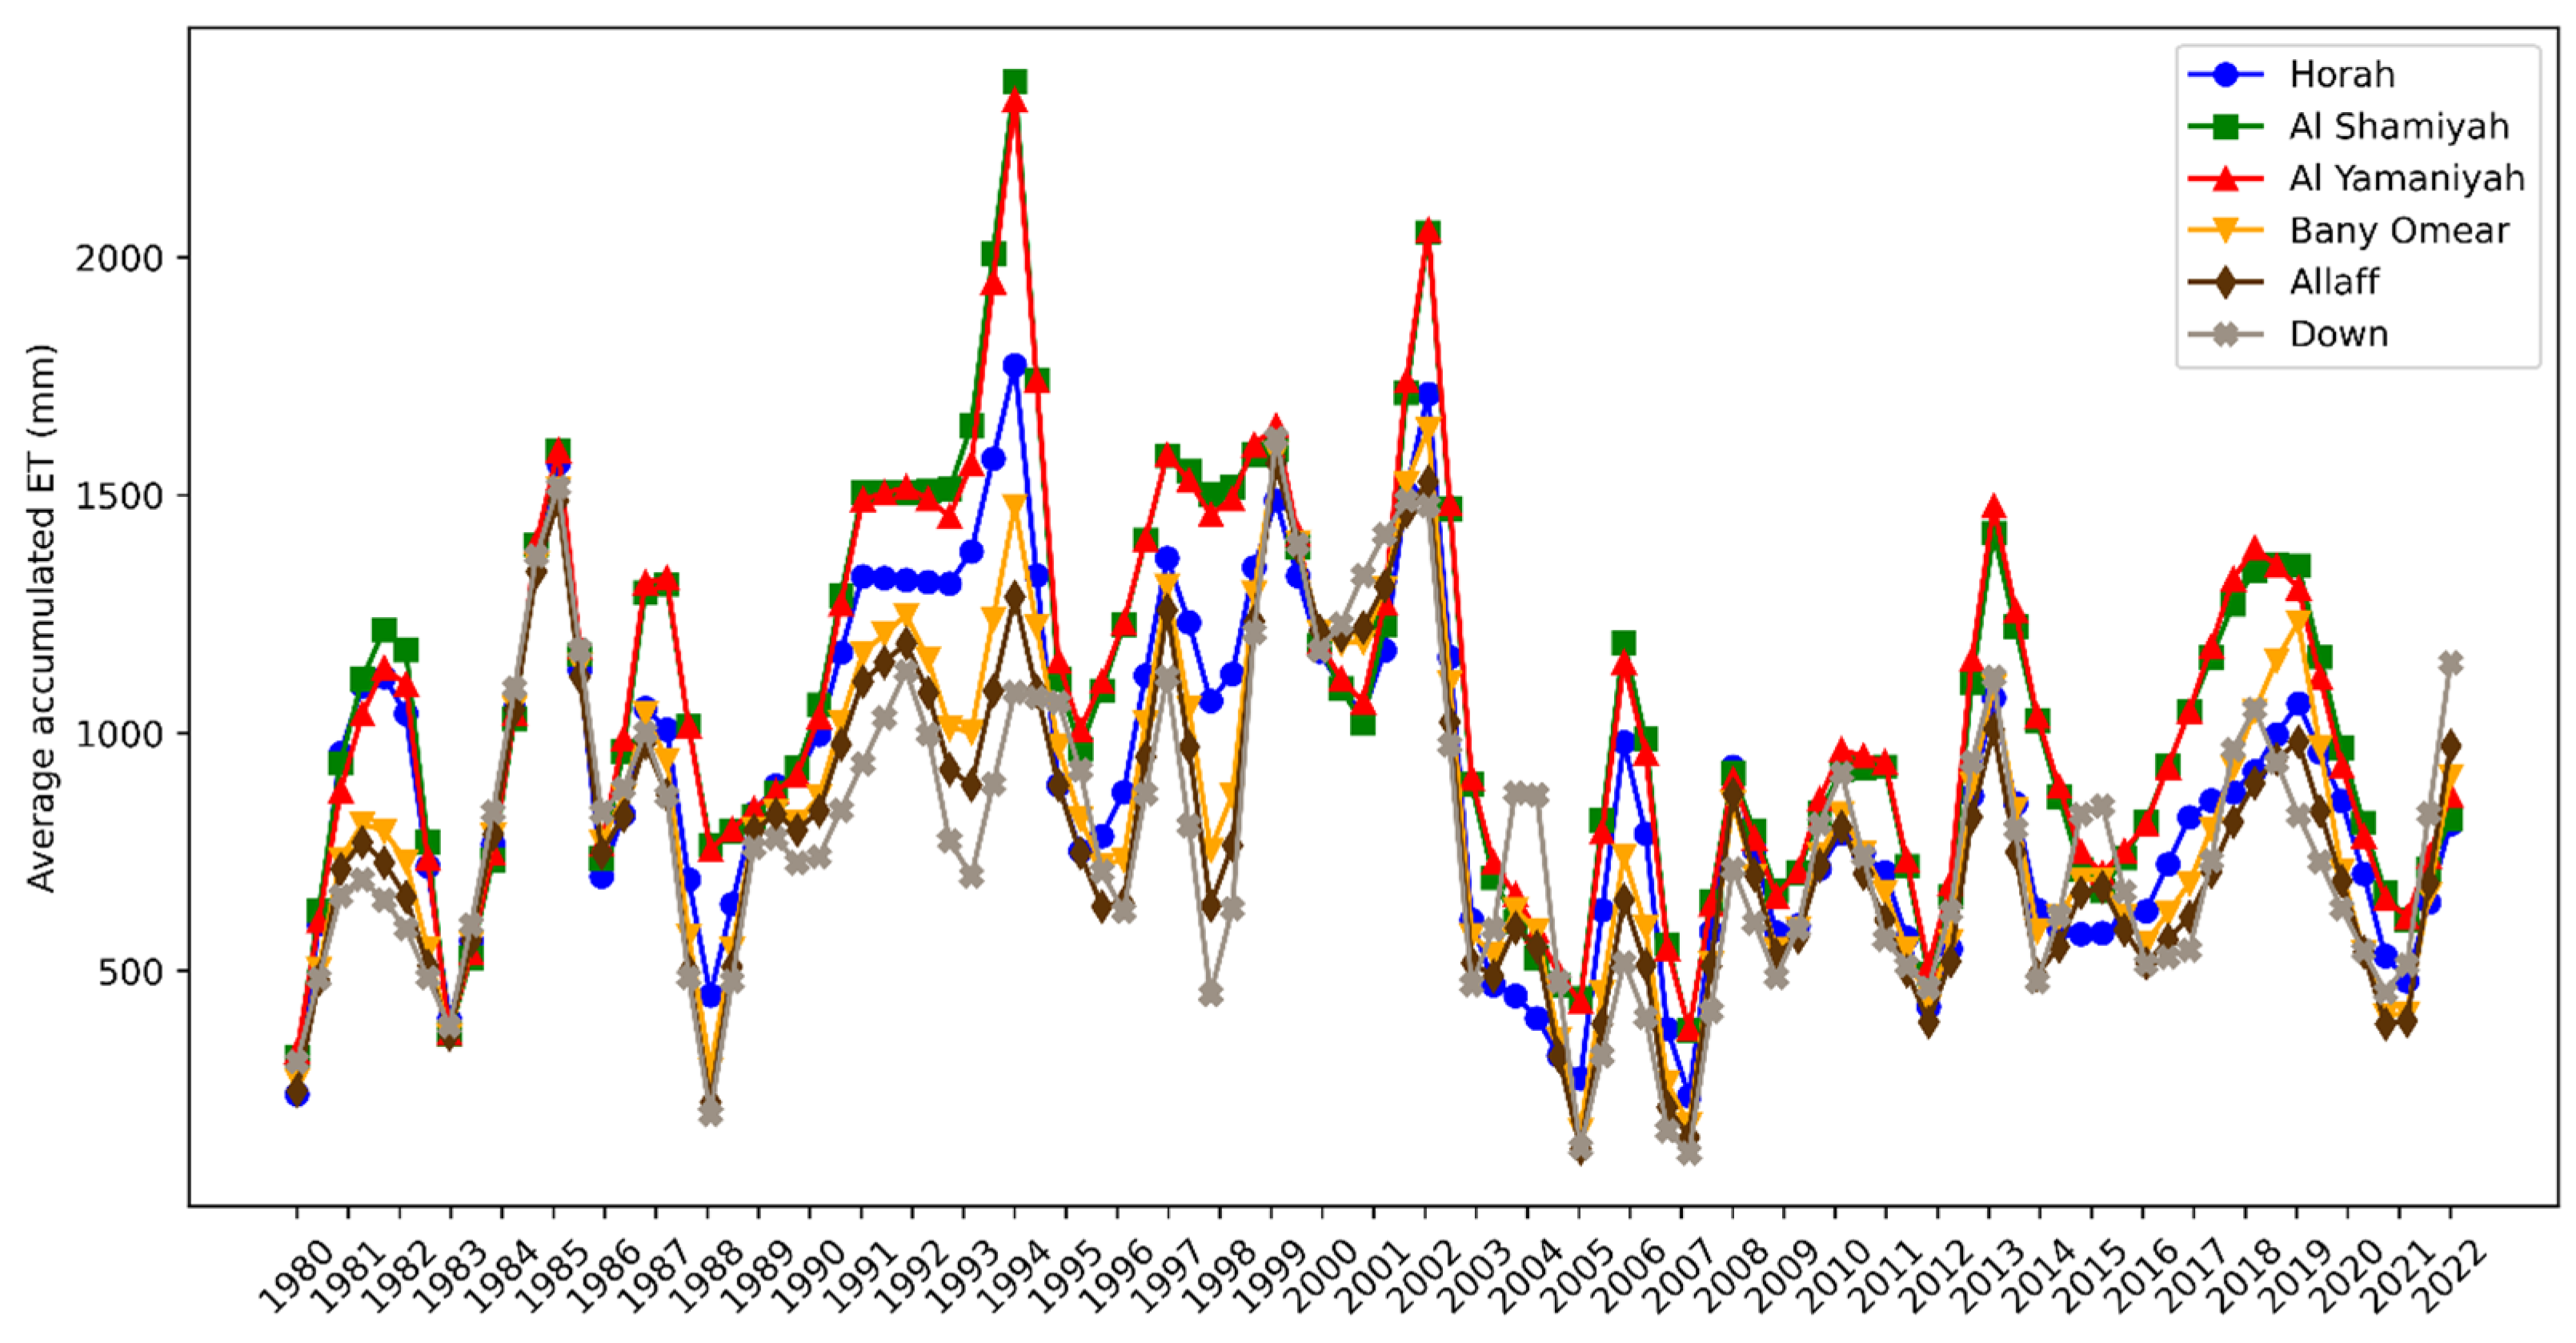
4.1. Precipitation and Evapotranspiration (ET)
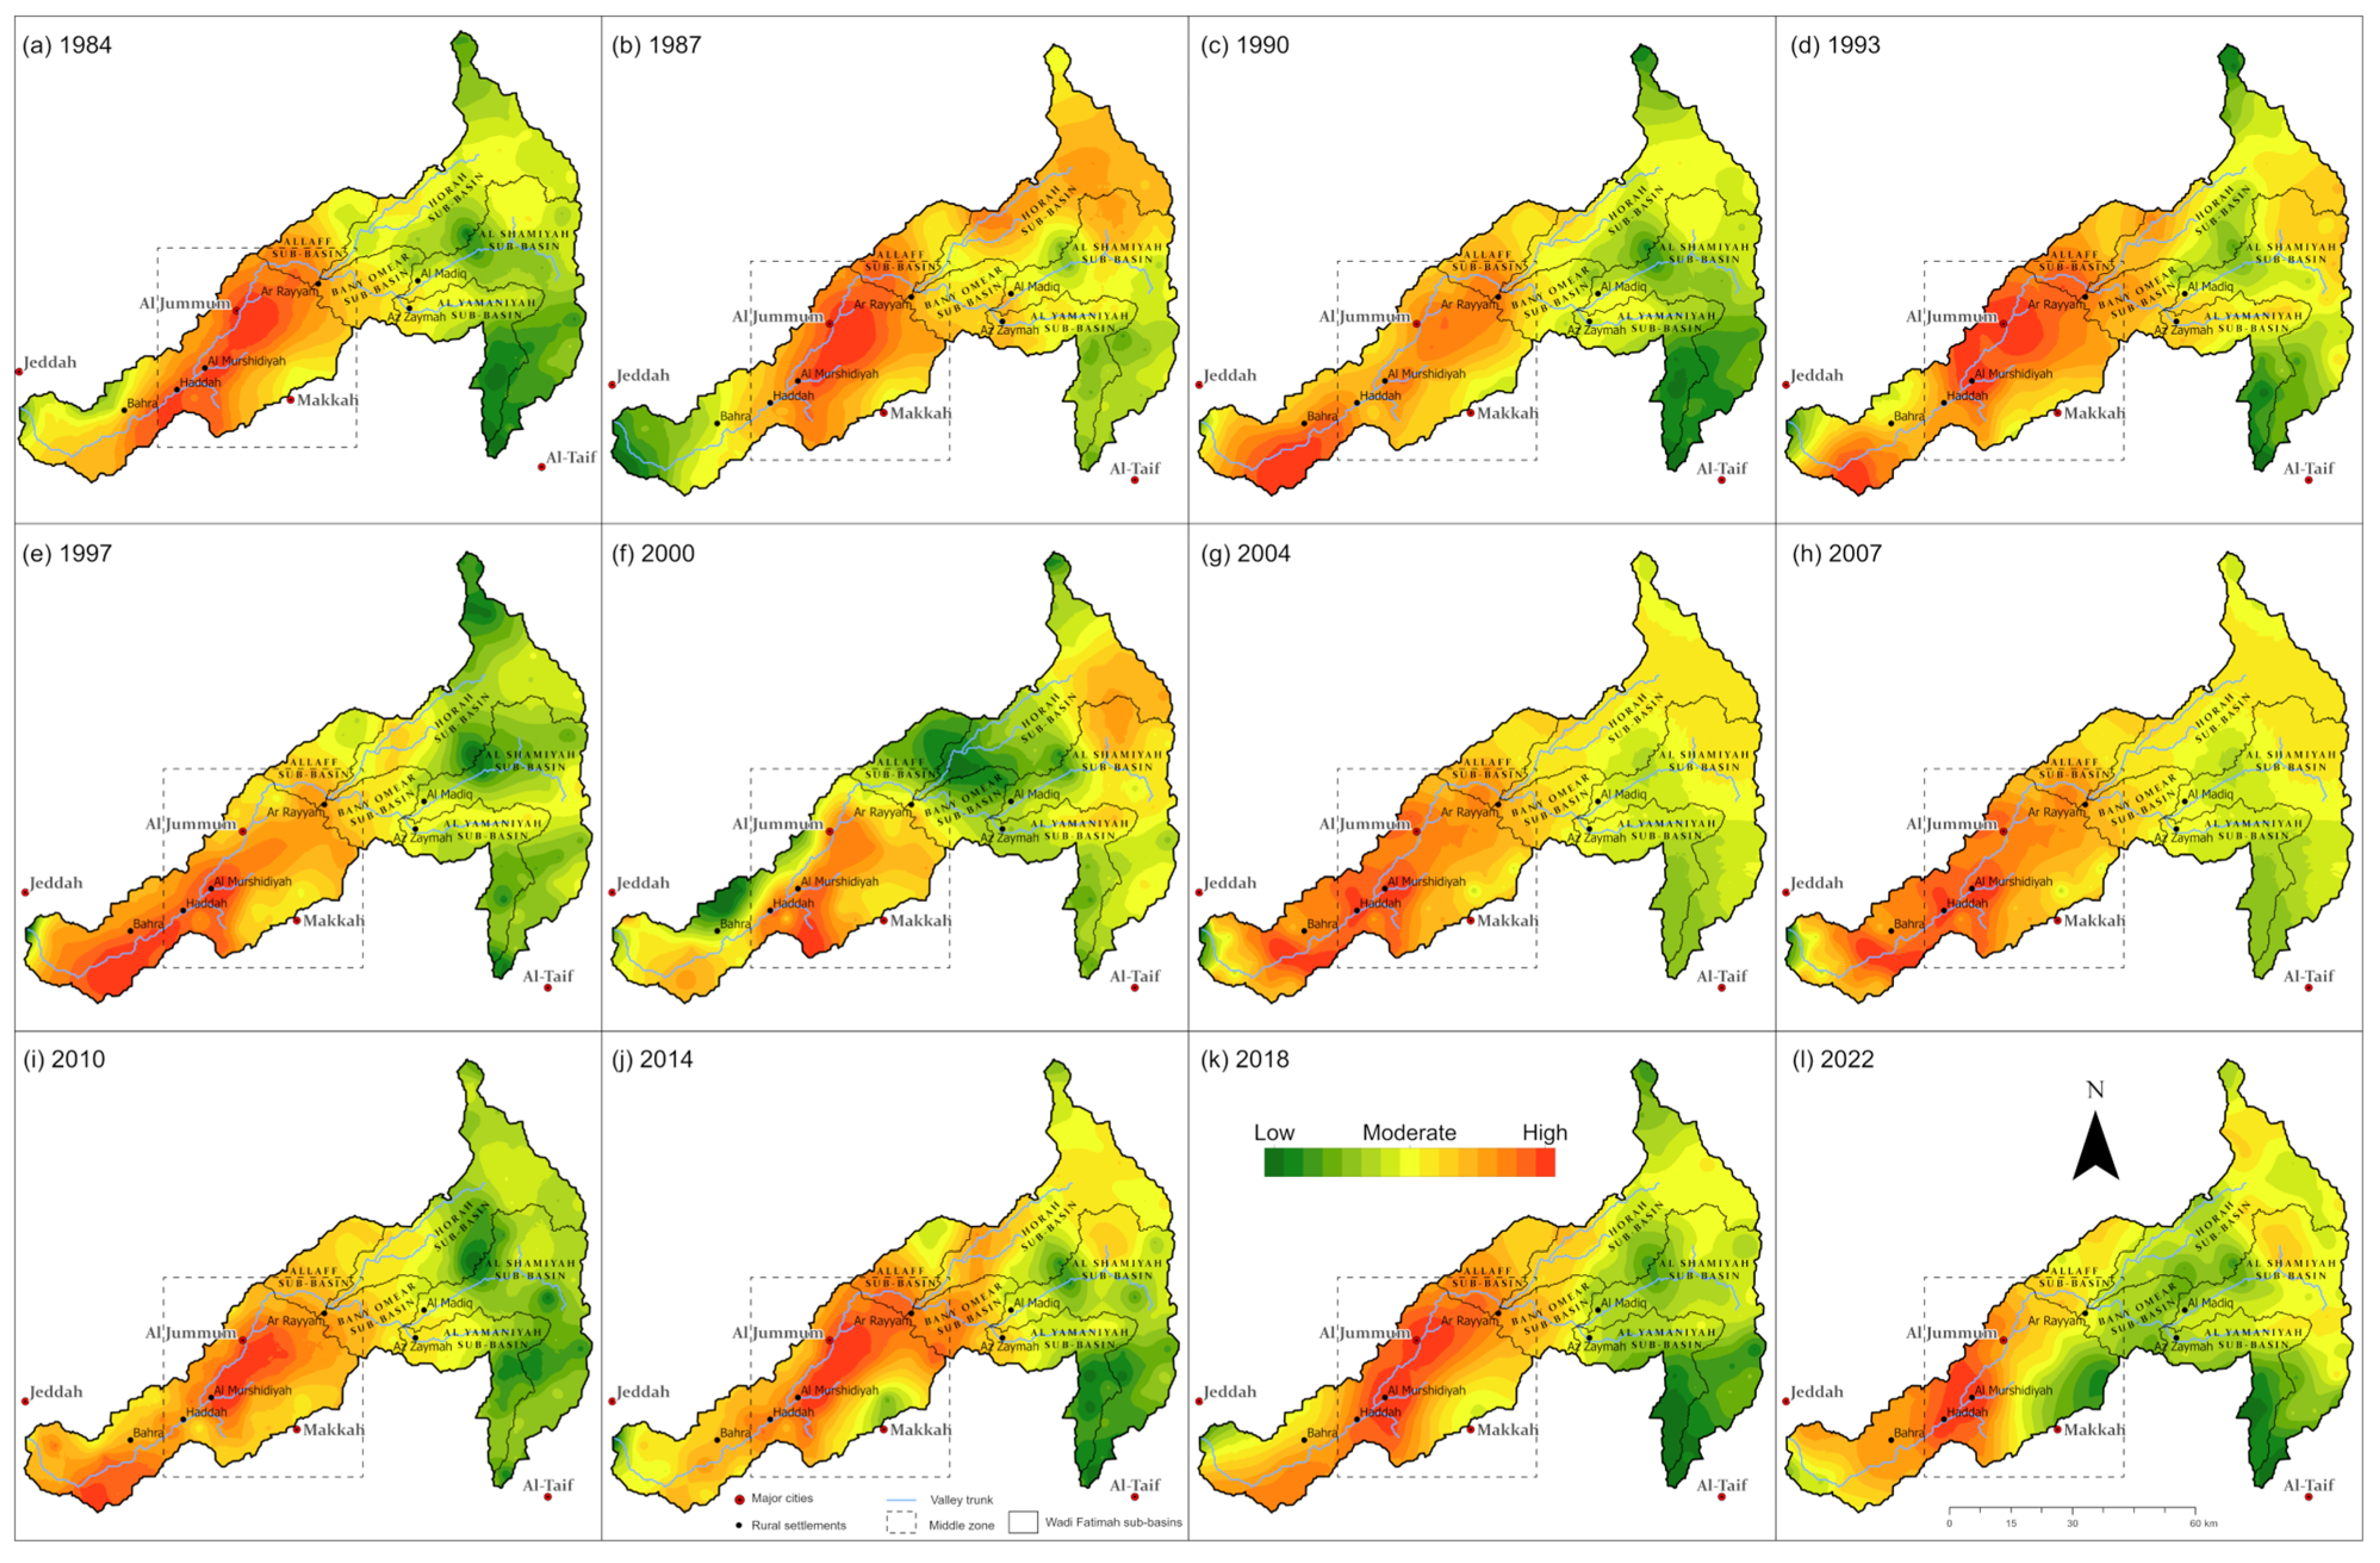
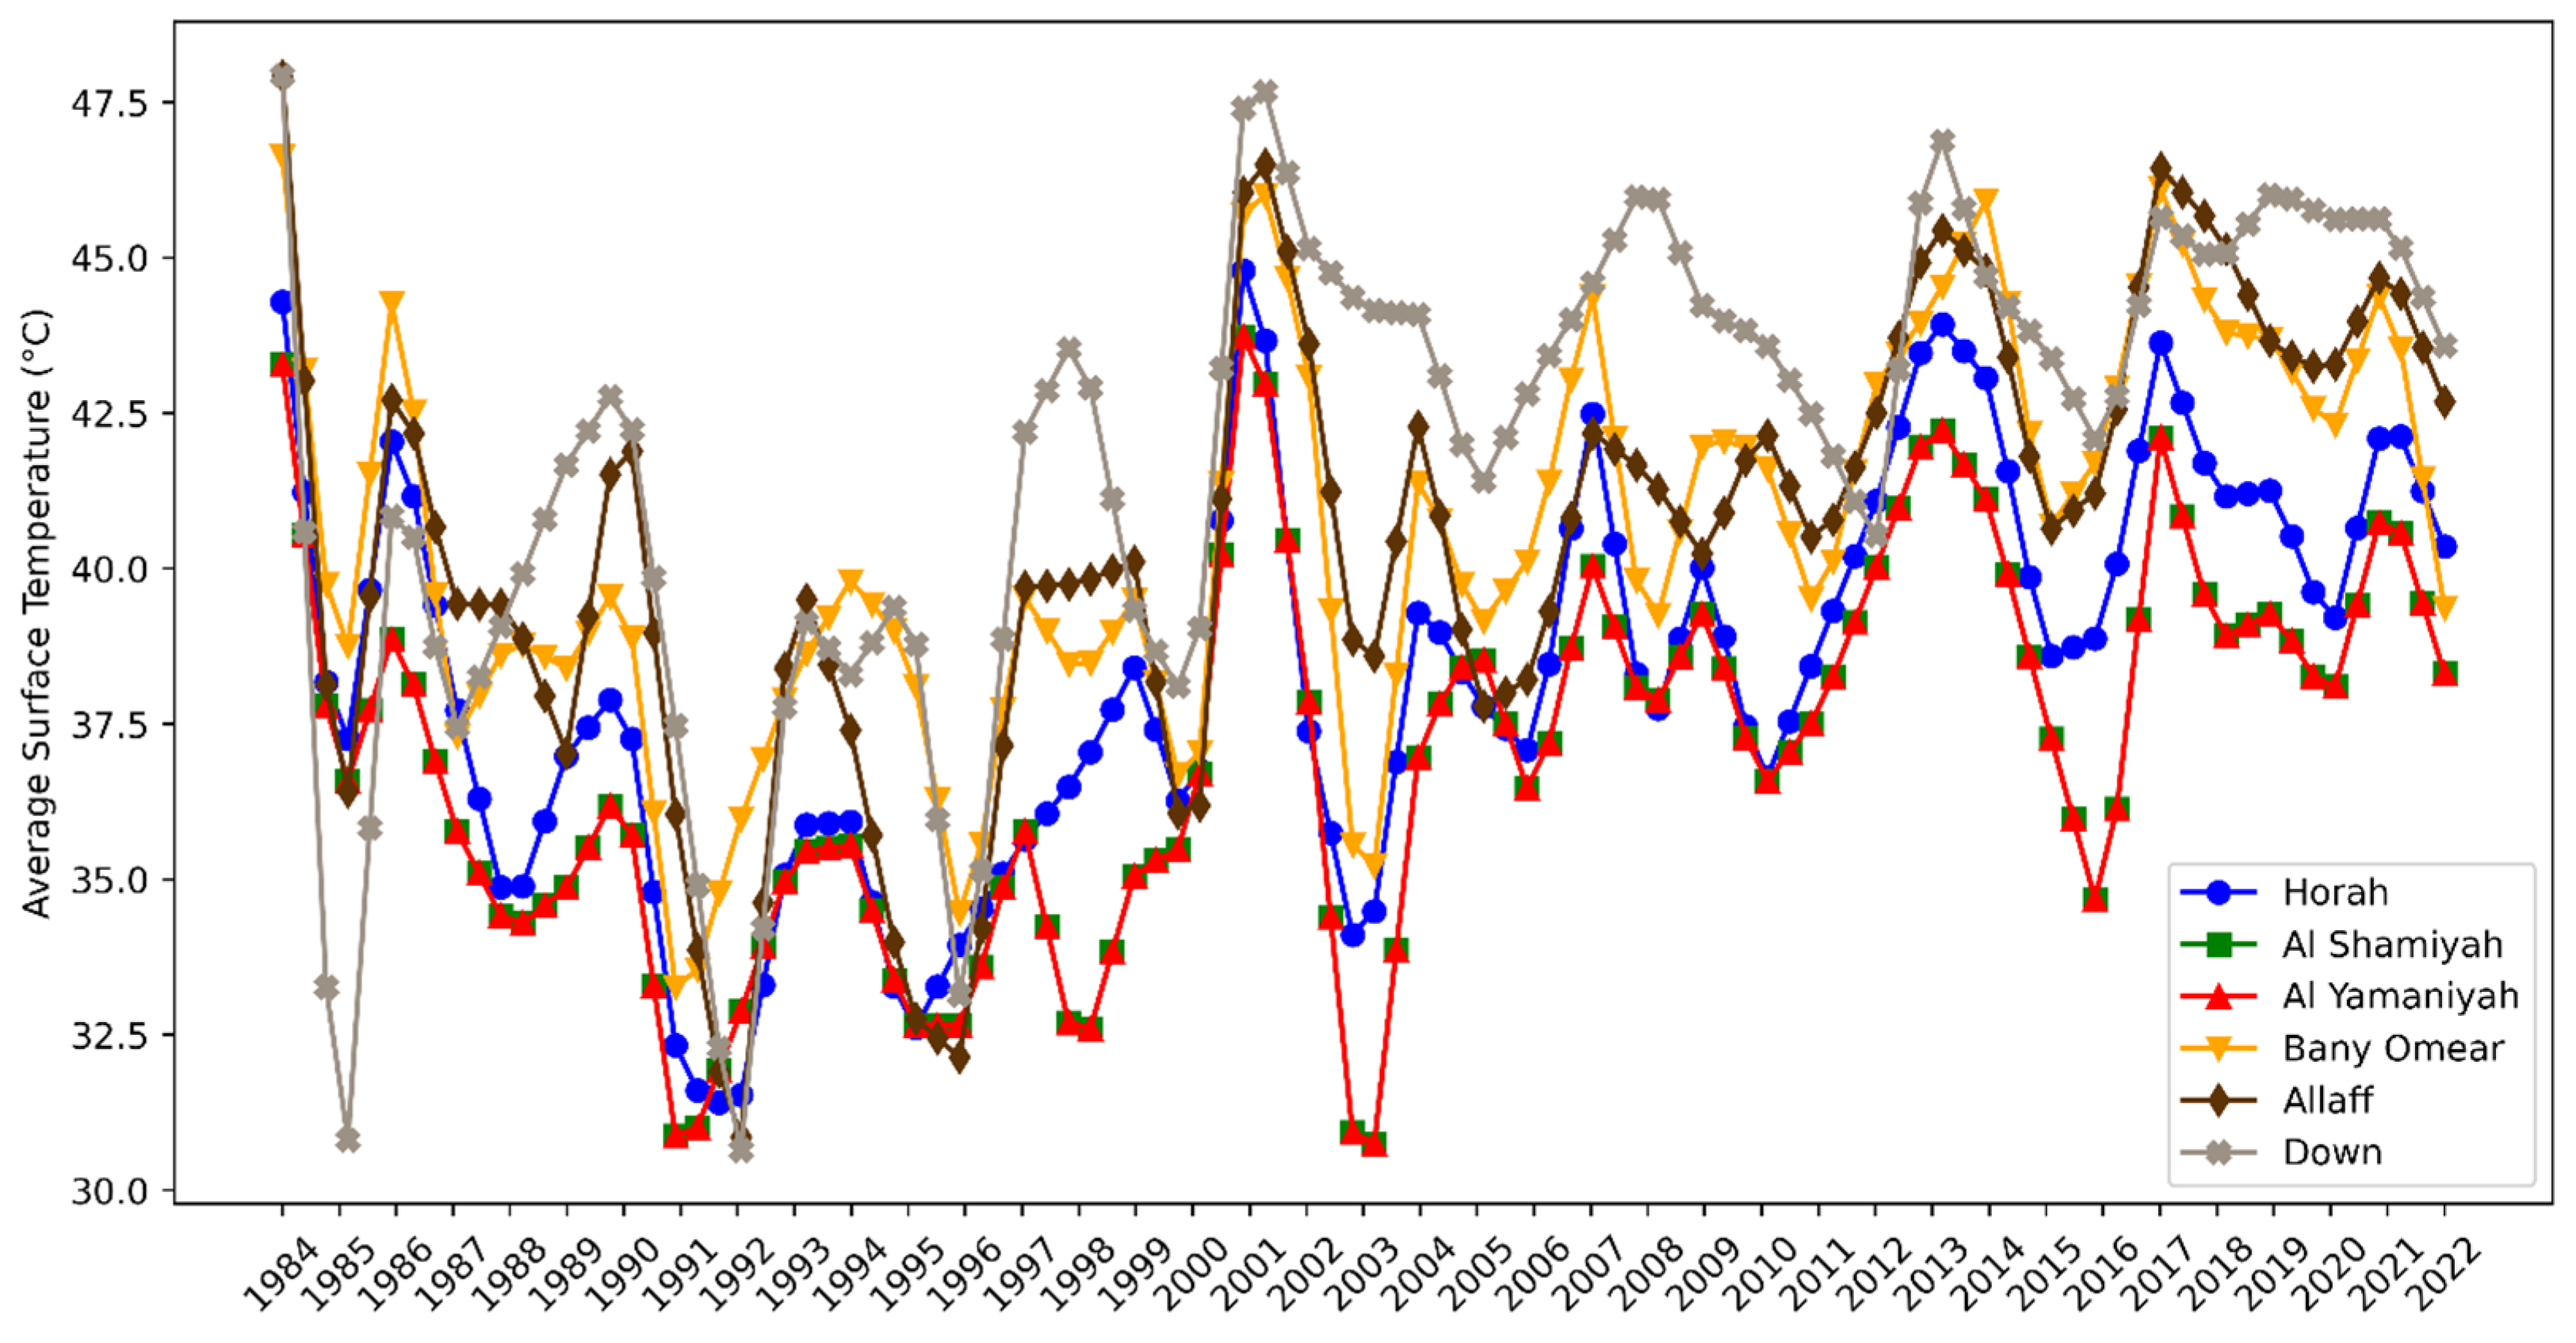
4.2. Land Surface Temperature (LST)
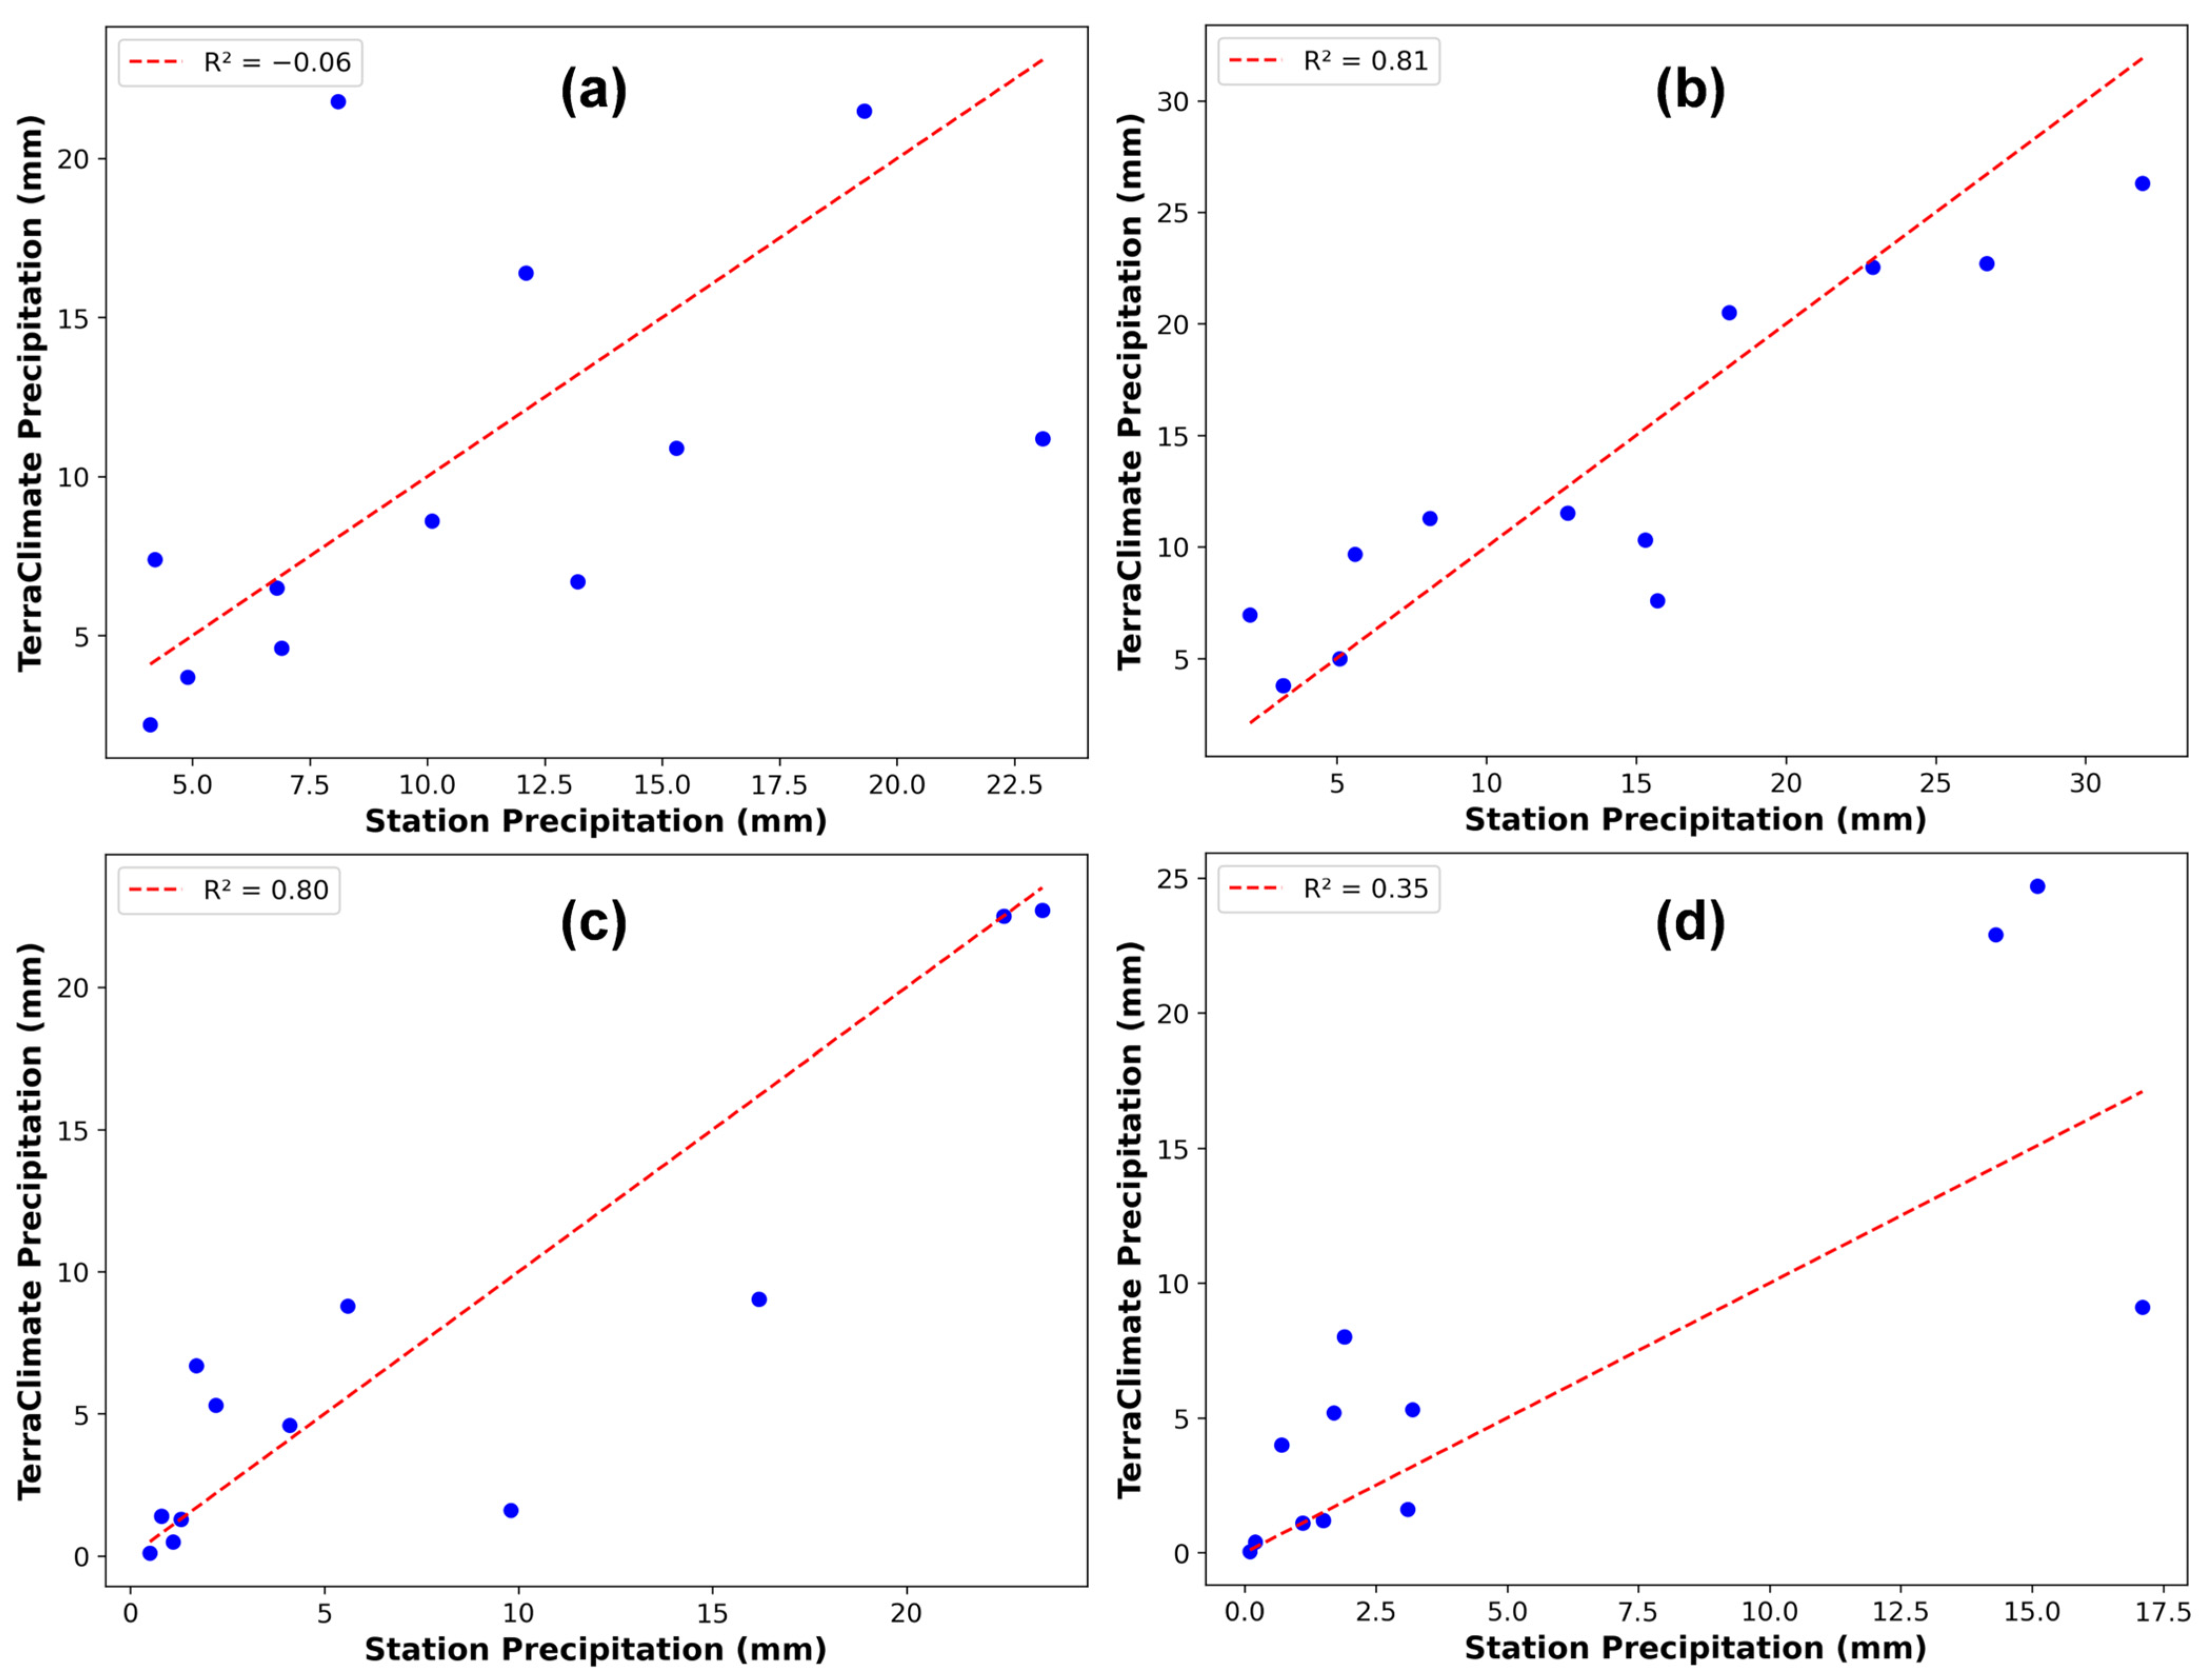
4.3. Climate Data Evaluation
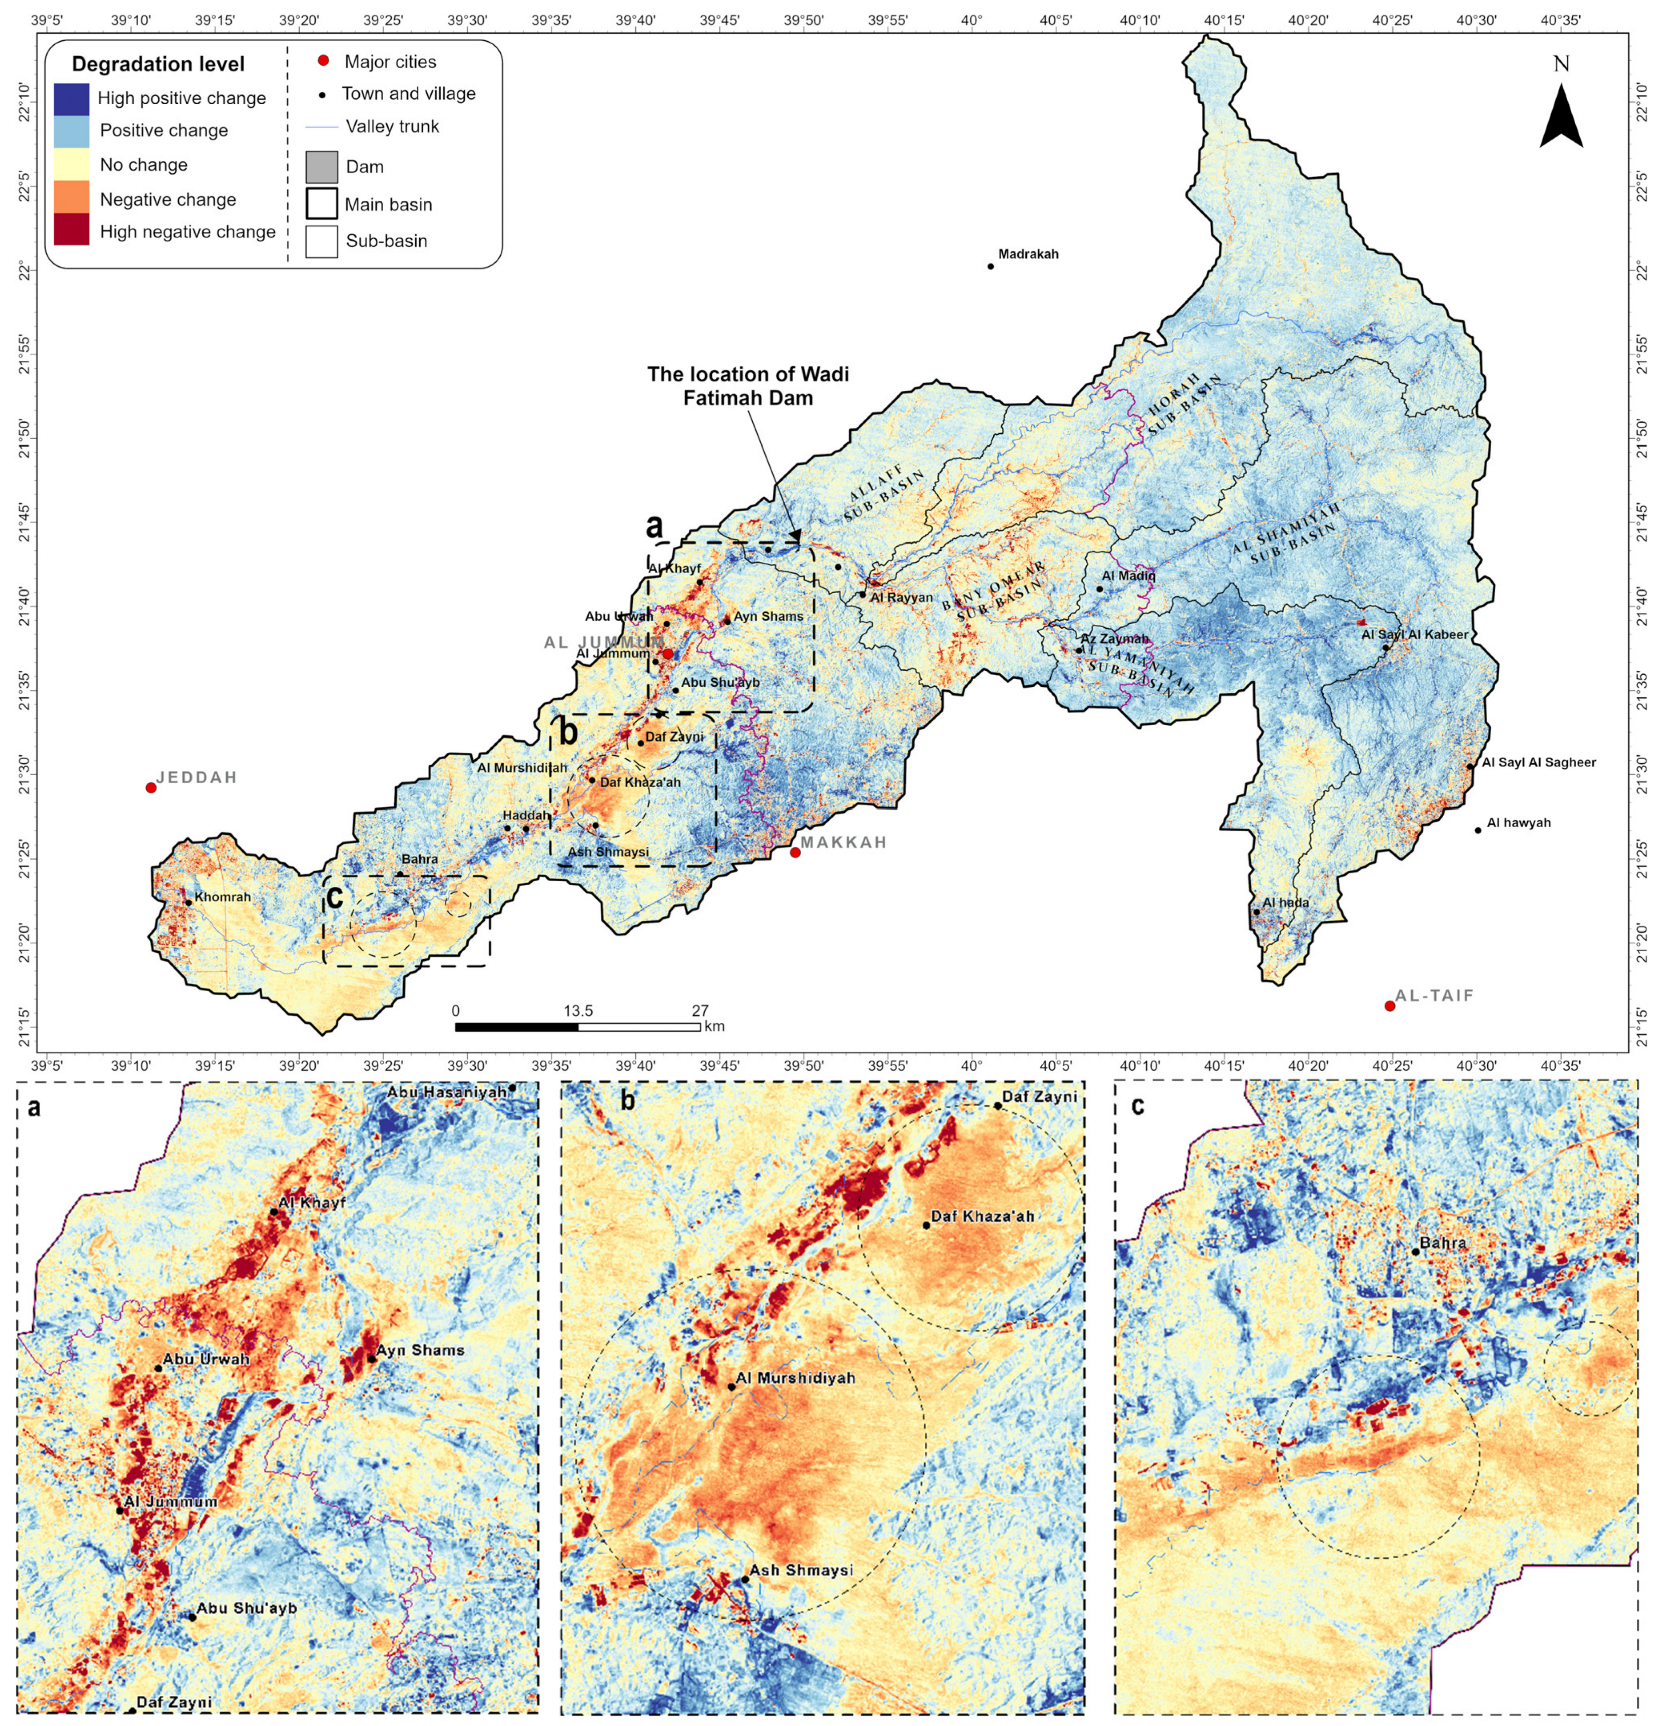
4.4. Land Use and Land Cover Changes and Land Degradation
4.5. Desertification Classification
4.6. Accuracy Assessment of Desertification Classification
5. Discussion
5.1. Land Degradation in Wadi Fatimah
5.1.1. Causes of Land Degradation
5.1.2. Land Degradation Implications
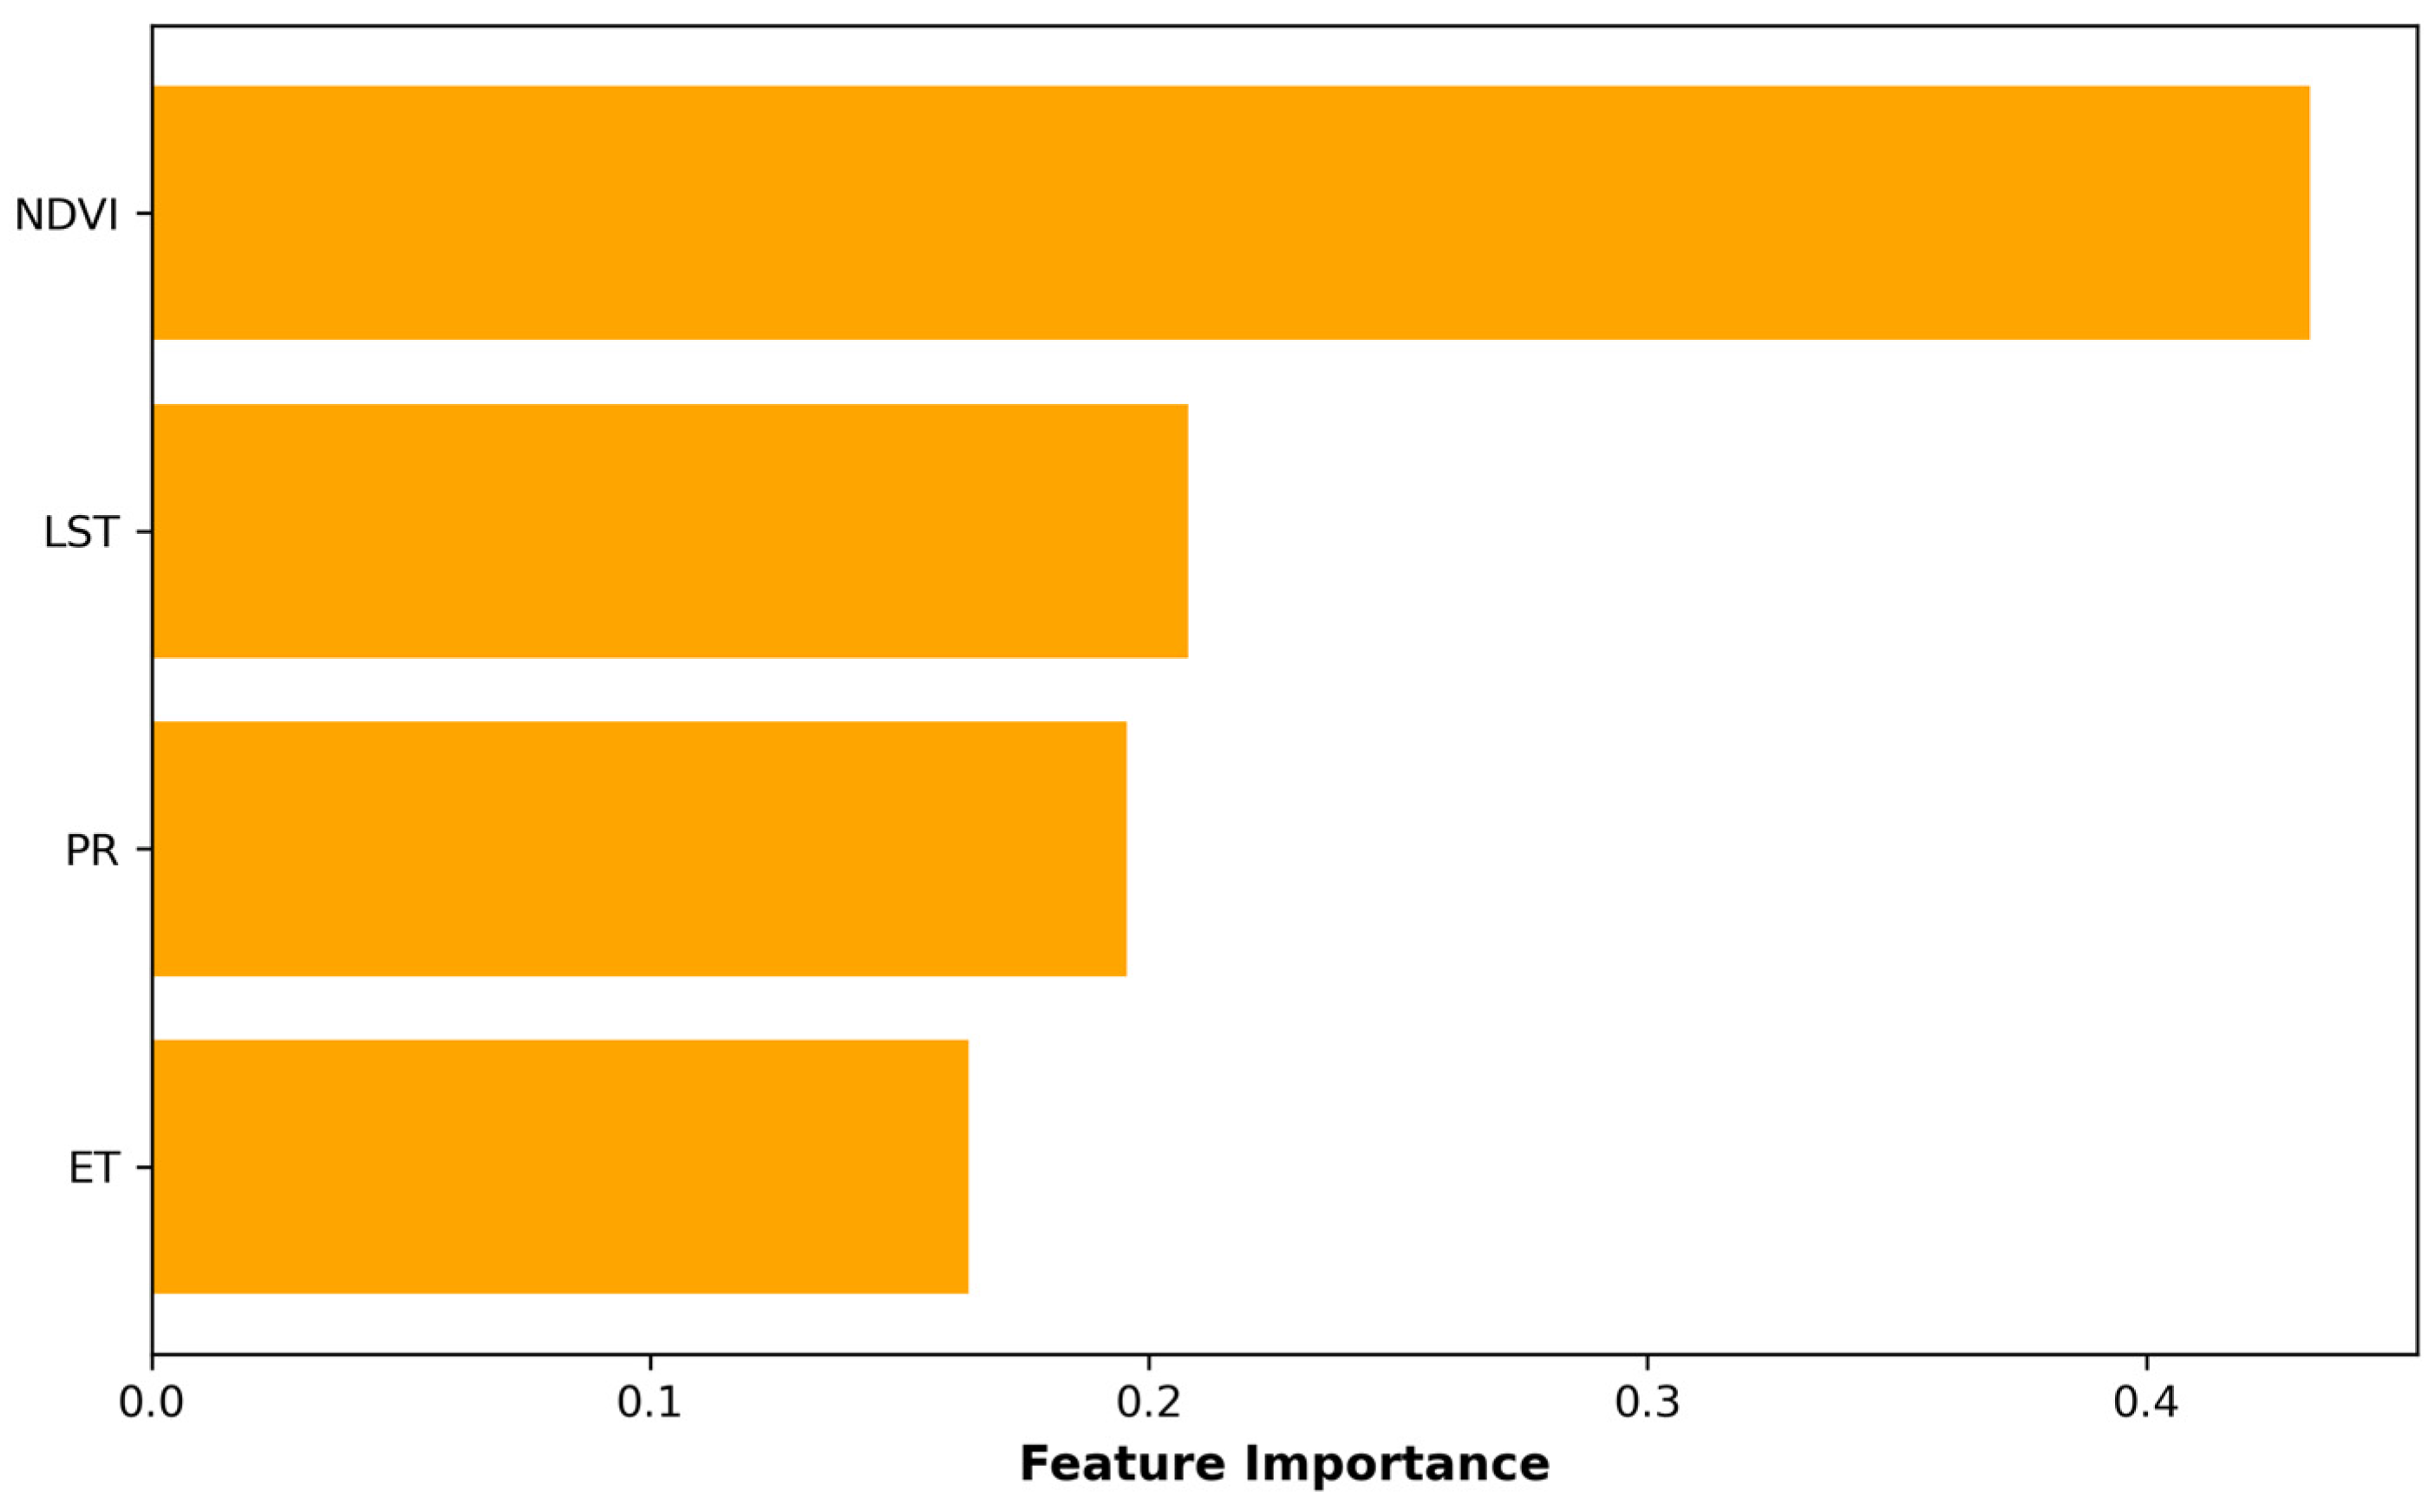
5.1.3. Driving Factors of Desertification
5.2. Remote Sensing Data and Validation
5.2.1. Remote Sensing-Based Desertification Monitoring
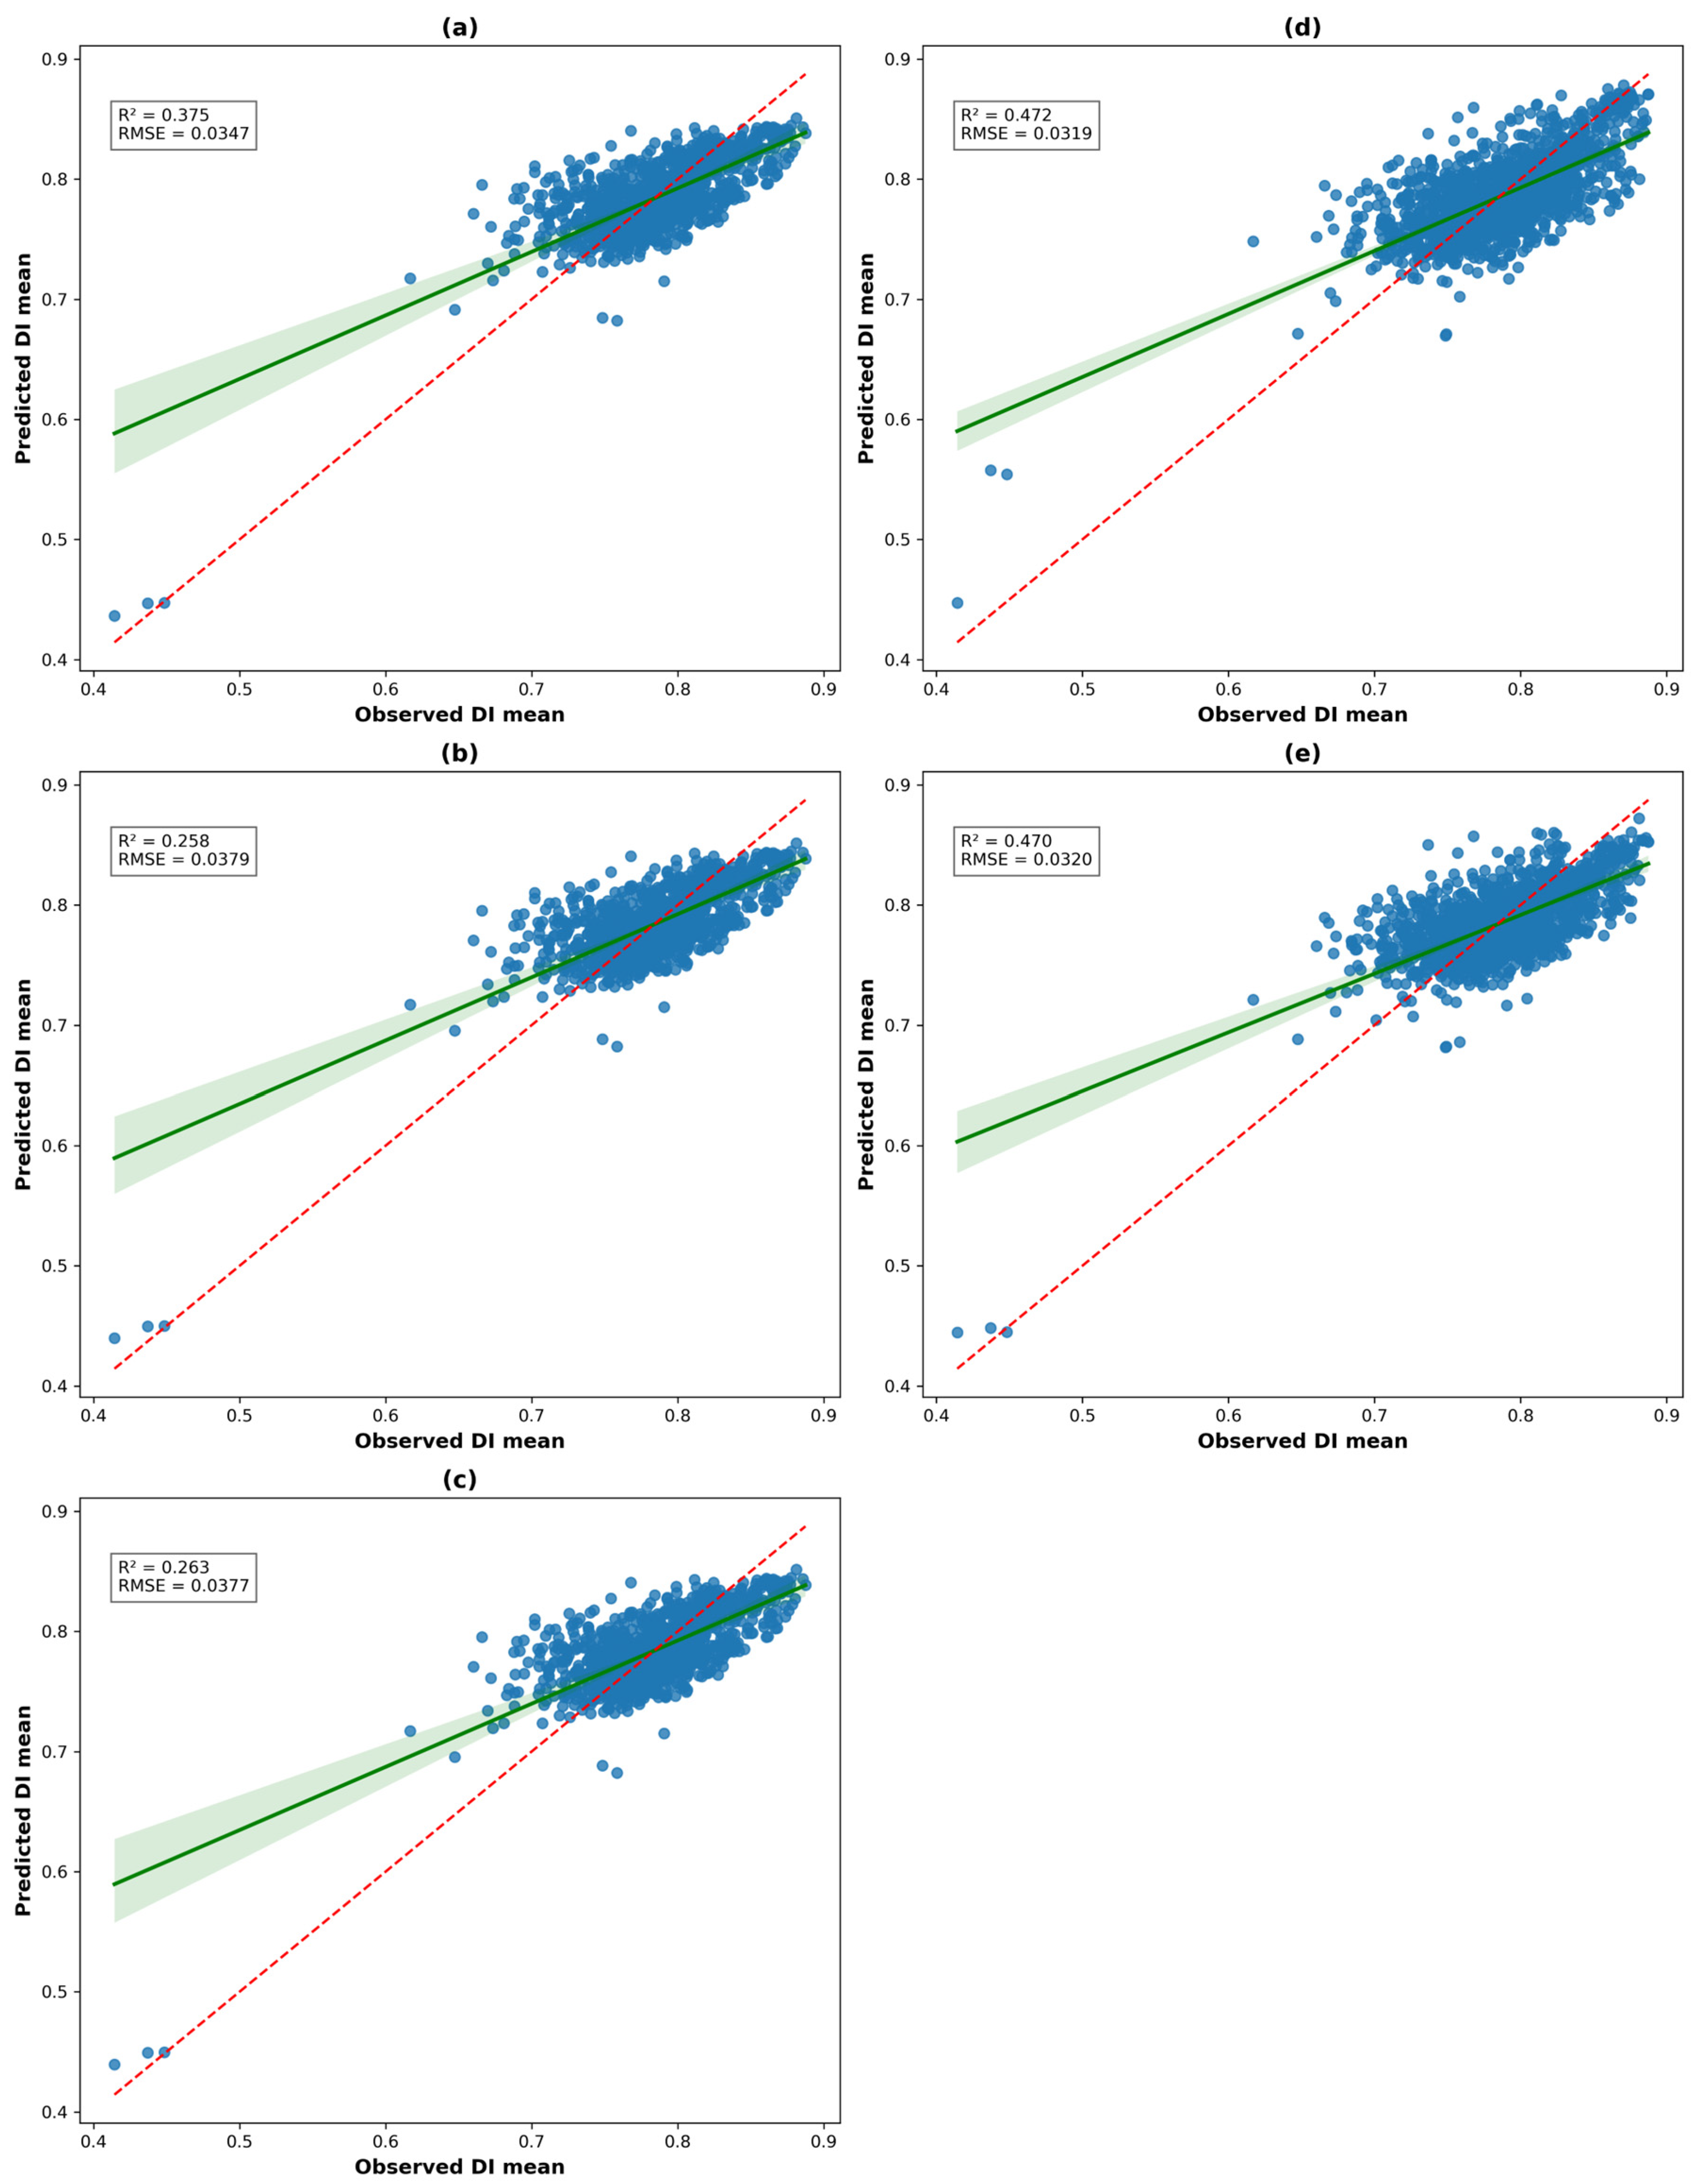
5.2.2. Model Validation
5.3. Advantages and Limitations
6. Conclusions
Author Contributions
Funding
Data Availability Statement
Acknowledgments
Conflicts of Interest
References
- United Nations. United Nations Convention to Combat Desertification in Those Countries Experiencing Serious Drought and/or Desertification, Particularly in Africa; UNEP: Nairobi, Kenya, 1995.
- Feng, Q.; Ma, H.; Jiang, X.; Wang, X.; Cao, S. What Has Caused Desertification in China? Sci. Rep. 2015, 5, 15998. [Google Scholar] [CrossRef] [PubMed]
- Reynolds, J.F.; Smith, D.M.S.; Lambin, E.F.; Turner, B.; Mortimore, M.; Batterbury, S.P.J.; Downing, T.E.; Dowlatabadi, H.; Fernández, R.J.; Herrick, J.E. Global Desertification: Building a Science for Dryland Development. Science 2007, 316, 847–851. [Google Scholar] [CrossRef] [PubMed]
- Mirzabaev, A.; Annagylyjova, J.; Amirova, I. Environmental Degradation. In The Aral Sea Basin; Xenarios, S., Schmidt-Vogt, D., Qadir, M., Janusz-Pawletta, B., Abdullaev, I., Eds.; Routledge: Milton Park, UK, 2019; pp. 67–85. [Google Scholar]
- Zhang, P.; He, M.; Wang, J.; Huang, L.; Yang, H.; Song, G.; Zhao, J.; Li, X. Desertification Reduces Organic Carbon Content and Nutrient Availability in Dryland Soils: Evidence from a Survey in the Amu Darya River Basin. Land Degrad. Dev. 2025, 36, 1181–1194. [Google Scholar] [CrossRef]
- van der Esch, S.; ten Brink, B.; Stehfest, E.; Bakkenes, M.; Sewell, A.; Bouwman, A.; Meijer, J.; Westhoek, H.; van den Berg, M.; van den Born, G.J. Exploring Future Changes in Land Use and Land Condition and the Impacts on Food, Water, Climate Change and Biodiversity: Scenarios for the UNCCD Global Land Outlook; PBL Netherlands Environmental Assessment Agency: The Hague, The Netherlands, 2017.
- Huang, J.; Zhang, G.; Zhang, Y.; Guan, X.; Wei, Y.; Guo, R. Global Desertification Vulnerability to Climate Change and Human Activities. Land Degrad. Dev. 2020, 31, 1380–1391. [Google Scholar] [CrossRef]
- Intergovernmental Panel on Climate Change (IPCC). Desertification; Cambridge University Press: Cambridge, UK, 2019; pp. 249–344.
- Bestelmeyer, B.T.; Okin, G.S.; Duniway, M.C.; Archer, S.R.; Sayre, N.F.; Williamson, J.C.; Herrick, J.E. Desertification, Land Use, and the Transformation of Global Drylands. Front. Ecol. Environ. 2015, 13, 28–36. [Google Scholar] [CrossRef]
- Alqurashi, A.F. Quantification of Urban Patterns and Processes through Space and Time Using Remote Sensing Data: A Comparative Study between Three Saudi Arabian Cities. Sustainability 2021, 13, 12615. [Google Scholar] [CrossRef]
- Vincent, P. Saudi Arabia: An Environmental Overview; CRC Press: Boca Raton, FL, USA, 2008. [Google Scholar]
- Hermas, E.A.; Alharbi, O.; Alqurashi, A.F.; Niang, A.; Al-Ghamdi, K.; Al-Mutiry, M.; Farghaly, A. Characterisation of Sand Accumulations in Wadi Fatmah and Wadi Ash Shumaysi, KSA, Using Multi-Source Remote Sensing Imagery. Remote Sens. 2019, 11, 2824. [Google Scholar] [CrossRef]
- Alqurashi, A.F.; Kumar, L. An assessment of the impact of urbanization and land use changes in the fast-growing cities of Saudi Arabia. Geocarto Int. 2017, 34, 78–97. [Google Scholar] [CrossRef]
- El-Barodi, M.S. Water Balance Estimates of Wadi Fatmah Basin. J. Kuwait Geogr. Soc. 1986, 88, 4–63. (In Arabic) [Google Scholar]
- Al -Suriyani, M.M. Farmers Characteristics in Wadi Fatmah. J. Fac. Soc. Sci. Umm Al-Qura Univ. 1988, 41, 80. (In Arabic) [Google Scholar]
- Sharaf, M.A.; Hussein, M.T.; Al-Bassam, A.M. Upconing and Saline Water Intrusion and the Need for Water Conservation in the Lower Part of Wadi Fatimah, Western Saudi Arabia. Int. J. Water Resour. Dev. 2001, 17, 211–226. [Google Scholar] [CrossRef]
- Al-Mutiry, M.; Hermas, E.A.; Alqurashi, A.F.; Alharbi, O.; Khormi, H.; Al Khallas, S. Desertification Hazards in the Middle Zone of Wadi Fatimah, West Saudi Arabia. Egypt. J. Remote Sens. Space Sci. 2023, 26, 491–503. [Google Scholar] [CrossRef]
- Eliades, F.; Sarris, D.; Bachofer, F.; Michaelides, S.; Hadjimitsis, D. Understanding Tree Mortality Patterns: A Comprehensive Review of Remote Sensing and Meteorological Ground-Based Studies. Forests 2024, 15, 1357. [Google Scholar] [CrossRef]
- Rivera-Marin, D.; Dash, J.; Ogutu, B. The Use of Remote Sensing for Desertification Studies: A Review. J. Arid Environ. 2022, 206, 104829. [Google Scholar] [CrossRef]
- Li, T.; Wang, Y.; Fan, X.; Wang, L.; Li, X.; Zhao, L.; Kattel, G.R.; Guo, X.; Fan, M. Spatiotemporal Changes of Desertification Areas in the Alxa Desert Obtained from Satellite Imagery. Earth Surf. Process. Landf. 2025, 50, e70020. [Google Scholar] [CrossRef]
- Liu, Q.; Liu, G.; Huang, C. Monitoring Desertification Processes in Mongolian Plateau Using MODIS Tasseled Cap Transformation and TGSI Time Series. J. Arid Land 2018, 10, 12–26. [Google Scholar] [CrossRef]
- Meng, X.; Gao, X.; Li, S.; Li, S.; Lei, J. Monitoring Desertification in Mongolia Based on Landsat Images and Google Earth Engine from 1990 to 2020. Ecol. Indic. 2021, 129, 107908. [Google Scholar] [CrossRef]
- Becerril-Piña, R.; Díaz-Delgado, C.; Mastachi-Loza, C.A.; González-Sosa, E. Integration of Remote Sensing Techniques for Monitoring Desertification in Mexico. Hum. Ecol. Risk Assess. Int. J. 2016, 22, 1323–1340. [Google Scholar] [CrossRef]
- Wulder, M.A.; Roy, D.P.; Radeloff, V.C.; Loveland, T.R.; Anderson, M.C.; Johnson, D.M.; Healey, S.; Zhu, Z.; Scambos, T.A.; Pahlevan, N.; et al. Fifty Years of Landsat Science and Impacts. Remote Sens. Environ. 2022, 280, 113195. [Google Scholar] [CrossRef]
- Jiang, L.; Jiapaer, G.; Bao, A.; Kurban, A.; Guo, H.; Zheng, G.; De Maeyer, P. Monitoring the Long-term Desertification Process and Assessing the Relative Roles of its Drivers in Central Asia. Ecol. Indic. 2019, 104, 195–208. [Google Scholar] [CrossRef]
- Abatzoglou, J.T.; Dobrowski, S.Z.; Parks, S.A.; Hegewisch, K.C. TerraClimate, A High-resolution Global Dataset of Monthly Climate and Climatic Water Balance from 1958–2015. Sci. Data 2018, 5, 170191. [Google Scholar] [CrossRef] [PubMed]
- Araghi, A.; Martinez, C.J.; Adamowski, J.F. Evaluation of TerraClimate Gridded Data Across Diverse Climates in Iran. Earth Sci. Inform. 2023, 16, 1347–1358. [Google Scholar] [CrossRef]
- Gorelick, N.; Hancher, M.; Dixon, M.; Ilyushchenko, S.; Thau, D.; Moore, R. Google Earth Engine: Planetary-scale Geospatial Analysis for Everyone. Remote Sens. Environ. 2017, 202, 18–27. [Google Scholar] [CrossRef]
- Kumar, L.; Mutanga, O. Google Earth Engine Applications Since Inception: Usage, Trends, and Potential. Remote Sens. 2018, 10, 1509. [Google Scholar] [CrossRef]
- Tamiminia, H.; Salehi, B.; Mahdianpari, M.; Quackenbush, L.; Adeli, S.; Brisco, B. Google Earth Engine for Geo-big Data Applications: A Meta-analysis and Systematic Review. ISPRS J. Photogramm. Remote Sens. 2020, 164, 152–170. [Google Scholar] [CrossRef]
- Chen, X.; Wang, N.; Peng, S.; Meng, N.; Lv, H. Analysis of Spatiotemporal Dynamics of Land Desertification in Qilian Mountain National Park Based on Google Earth Engine. ISPRS Int. J. Geo-Inf. 2024, 13, 117. [Google Scholar] [CrossRef]
- Sharifi, E.; Saghafian, B.; Steinacker, R. Downscaling Satellite Precipitation Estimates with Multiple Linear Regression, Artificial Neural Networks, and Spline Interpolation Techniques. J. Geophys. Res. Atmos. 2019, 124, 789–805. [Google Scholar] [CrossRef]
- Kofidou, M.; Stathopoulos, S.; Gemitzi, A. Review on Spatial Downscaling of Satellite Derived Precipitation Estimates. Environ. Earth Sci. 2023, 82, 424. [Google Scholar] [CrossRef]
- Dorninger, M.; Schneider, S.; Steinacker, R. On the Interpolation of Precipitation Data over Complex Terrain. Meteorol. Atmos. Phys. 2008, 101, 175–189. [Google Scholar] [CrossRef]
- Abd El-Salam, M.M.; Elhakem, A.H. Desertification and its Effect on the Erosion of Vegetation in the South-western Region of Saudi Arabia. Environ. Monit. Assess. 2016, 188, 164. [Google Scholar] [CrossRef]
- Sen, Z. Desertification and Climate Change: Saudi Arabian Case. Int. J. Glob. Warm. 2013, 5, 270–281. [Google Scholar] [CrossRef]
- Qi, H.; Gao, X.; Lei, J.; Meng, X.; Hu, Z. Transforming Desertification Patterns in Asia: Evaluating Trends, Drivers, and Climate Change Impacts from 1990 to 2022. Ecol. Indic. 2024, 161, 111948. [Google Scholar] [CrossRef]
- Salih, A.; Hassaballa, A.A.; Ganawa, E. Mapping Desertification Degree and Assessing its Severity in Al-Ahsa Oasis, Saudi Arabia, Using Remote Sensing-based Indicators. Arab. J. Geosci. 2021, 14, 192. [Google Scholar] [CrossRef]
- Hasan, S.S.; Alharbi, O.A.; Alqurashi, A.F.; Fahil, A.S. Assessment of Desertification Dynamics in Arid Coastal Areas by Integrating Remote Sensing Data and Statistical Techniques. Sustainability 2024, 16, 4527. [Google Scholar] [CrossRef]
- Schumm, S.A. The Fluvial System; John Wiley & Sons, Inc.: New York, NY, USA, 1977. [Google Scholar]
- Al Sefry, S.A.; Al Ghamdi, S.A.; Ashi, W.A.; Bardi, W.A. Wadi Fatimah Aquifer as Strategic Groundwater Storage for Makkah Area. In Proceedings of the 6th Gulf Water Conference, Riyadh, Saudi Arabia, 8–12 March 2003; pp. 8–12. [Google Scholar]
- Sharaf, M.A.; Alyamani, M.S.; Subyani, A.M. Regional Study of the Rare and Trace Elements in the Groundwater of the Major Wadi Basins (An Numan, Usfan, and Fatimah) in Western Saudi Arabia and Their Suitability for Various Purposes. Final Rep. Proj. 2004, 204, 423. [Google Scholar]
- Es-Saeed, M.; Şen, Z.; Basamad, A.; Dahlawi, A. Strategic Groundwater Storage in Wadi Numan, Makkah Region, Saudi Arabia; Saudi Geological Survey: Jeddah, Saudi Arabia, 2004.
- Jamman, A.M. Hydrogeology of Wadi Naman, Saudi Arabia; King Abdulaziz University: Jeddah, Saudi Arabia, 1978. [Google Scholar]
- Khan, M.Y.A. Evaluating the Spatial Variations in Bed Sediment and Their Depositional Environments Using Particle-Size Analysis of Wadi Fatima, Saudi Arabia. Water 2024, 16, 3553. [Google Scholar] [CrossRef]
- Moore, T.A.; Al-Rehaili, M.H. Geologic Map of the Makkah Quadrangle, Sheet 21D. In Kingdom of Saudi Arabia, Saudi Arabian Directorate General of Mineral Resources Geoscience Map GM-107C Scale; Ministry of Petroleum and Mineral Resources: Riyadh, Saudi Arabia, 1989; p. 1. [Google Scholar]
- Masoud, M.; Niyazi, B.; Elfeki, A.; Zaidi, S. Mapping of Flash Flood Hazard Prone Areas Based on Integration Between Physiographic Features and GIS Techniques (Case Study of Wadi Fatimah, Saudi Arabia). In Proceedings of the 6th International Conference on Water Resources and the Arid Environments (ICWRAE 6), Riyadh, Saudi Arabia, 16–17 December 2014; pp. 334–347. [Google Scholar]
- Gribov, A.; Krivoruchko, K. Empirical Bayesian Kriging Implementation and Usage. Sci. Total Environ. 2020, 722, 137290. [Google Scholar] [CrossRef] [PubMed]
- Zhang, K.; Gann, D.; Ross, M.; Robertson, Q.; Sarmiento, J.; Santana, S.; Rhome, J.; Fritz, C. Accuracy Assessment of ASTER, SRTM, ALOS, and TDX DEMs for Hispaniola and Implications for Mapping Vulnerability to Coastal Flooding. Remote Sens. Environ. 2019, 225, 290–306. [Google Scholar] [CrossRef]
- Krivoruchko, K. Empirical Bayesian Kriging. ArcUser Fall 2012, 6, 1145. [Google Scholar]
- Anderson, M.C.; Kustas, W.P.; Norman, J.M.; Hain, C.R.; Mecikalski, J.R.; Schultz, L.; González-Dugo, M.P.; Cammalleri, C.; d’Urso, G.; Pimstein, A.; et al. Mapping Daily Evapotranspiration at Field to Continental Scales Using Geostationary and Polar Orbiting Satellite Imagery. Hydrol. Earth Syst. Sci. 2011, 15, 223–239. [Google Scholar] [CrossRef]
- Alexander, C. Normalised Difference Spectral Indices and Urban Land Cover as Indicators of Land Surface Temperature (LST). Int. J. Appl. Earth Obs. Geoinf. 2020, 86, 102013. [Google Scholar] [CrossRef]
- Gallego-Elvira, B.; Taylor, C.M.; Harris, P.P.; Ghent, D. Evaluation of Regional-Scale Soil Moisture-Surface Flux Dynamics in Earth System Models Based on Satellite Observations of Land Surface Temperature. Geophys. Res. Lett. 2019, 46, 5480–5488. [Google Scholar] [CrossRef]
- Tajfar, E.; Bateni, S.M.; Lakshmi, V.; Ek, M. Estimation of Surface Heat Fluxes via Variational Assimilation of Land Surface Temperature, Air Temperature and Specific Humidity into a Coupled Land Surface-Atmospheric Boundary Layer Model. J. Hydrol. 2020, 583, 124577. [Google Scholar] [CrossRef]
- Shen, Y.; Shen, H.; Cheng, Q.; Zhang, L. Generating Comparable and Fine-Scale Time Series of Summer Land Surface Temperature for Thermal Environment Monitoring. IEEE J. Sel. Top. Appl. Earth Obs. Remote Sens. 2021, 14, 2136–2147. [Google Scholar] [CrossRef]
- Eskandari Dameneh, H.; Gholami, H.; Telfer, M.W.; Comino, J.R.; Collins, A.L.; Jansen, J.D. Desertification of Iran in the Early Twenty-First Century: Assessment Using Climate and Vegetation Indices. Sci. Rep. 2021, 11, 20548. [Google Scholar] [CrossRef] [PubMed]
- Weng, Q.; Firozjaei, M.K.; Sedighi, A.; Kiavarz, M.; Alavipanah, S.K. Statistical Analysis of Surface Urban heat Island Intensity Variations: A Case Study of Babol City, Iran. GIScience Remote Sens. 2019, 56, 576–604. [Google Scholar] [CrossRef]
- Feng, Y.; Gao, C.; Tong, X.; Chen, S.; Lei, Z.; Wang, J. Spatial Patterns of Land Surface Temperature and Their Influencing Factors: A Case Study in Suzhou, China. Remote Sens. 2019, 11, 182. [Google Scholar] [CrossRef]
- Sobrino, J.A.; Caselles, V.; Coll, C. Theoretical Split-Window Algorithms for Determining the Actual Surface Temperature. Il Nuovo C. C 1993, 16, 219–236. [Google Scholar] [CrossRef]
- Qin, Z.; Karnieli, A.; Berliner, P. A Mono-Window Algorithm for Retrieving Land Surface Temperature from Landsat TM Data and its Application to the Israel-Egypt Border Region. Int. J. Remote Sens. 2001, 22, 3719–3746. [Google Scholar] [CrossRef]
- Ma, Y.; Kuang, Y.; Huang, N. Coupling Urbanization Analyses for Studying Urban Thermal Environment and its Interplay with Biophysical Parameters Based on TM/ETM+ Imagery. Int. J. Appl. Earth Obs. Geoinf. 2010, 12, 110–118. [Google Scholar] [CrossRef]
- Jiménez-Muñoz, J.C.; Sobrino, J.A. A Generalized Single-Channel Method for Retrieving Land Surface Temperature from Remote Sensing Data. J. Geophys. Res. Atmos. 2003, 108, 4688. [Google Scholar] [CrossRef]
- Li, Z.; Wu, H.; Duan, S.; Zhao, W.; Ren, H.; Liu, X.; Leng, P.; Tang, R.; Ye, X.; Zhu, J.; et al. Satellite Remote Sensing of Global Land Surface Temperature: Definition, Methods, Products, and Applications. Rev. Geophys. 2023, 61, e2022RG000777. [Google Scholar] [CrossRef]
- Li, Z.-L.; Tang, B.-H.; Wu, H.; Ren, H.; Yan, G.; Wan, Z.; Trigo, I.F.; Sobrino, J.A. Satellite-Derived Land Surface Temperature: Current Status and Perspectives. Remote Sens. Environ. 2013, 131, 14–37. [Google Scholar] [CrossRef]
- Barsi, J.A.; Schott, J.R.; Hook, S.J.; Raqueno, N.G.; Markham, B.L.; Radocinski, R.G. Landsat-8 Thermal Infrared Sensor (TIRS) Vicarious Radiometric Calibration. Remote Sens. 2014, 6, 11607–11626. [Google Scholar] [CrossRef]
- Sobrino, J.A.; Jiménez-Muñoz, J.C.; Paolini, L. Land Surface Temperature Retrieval from LANDSAT TM 5. Remote Sens. Environ. 2004, 90, 434–440. [Google Scholar] [CrossRef]
- Kalnay, E.; Kanamitsu, M.; Kistler, R.; Collins, W.; Deaven, D.; Gandin, L.; Iredell, M.; Saha, S.; White, G.; Woollen, J. The NCEP/NCAR 40-Year Reanalysis Project. In Renewable Energy; Routledge: Milton Park, UK, 2018; pp. Vol1_146–Vol1_194. [Google Scholar]
- Tucker, C.J. Red and Photographic Infrared Linear Combinations for Monitoring Vegetation. Remote Sens. Environ. 1979, 8, 127–150. [Google Scholar] [CrossRef]
- Sobrino, J.A.; Raissouni, N. Toward Remote Sensing Methods for Land Cover Dynamic Monitoring: Application to Morocco. Int. J. Remote Sens. 2000, 21, 353–366. [Google Scholar] [CrossRef]
- Sekertekin, A.; Bonafoni, S. Land Surface Temperature Retrieval from Landsat 5, 7, and 8 over Rural Areas: Assessment of Different Retrieval Algorithms and Emissivity Models and Toolbox Implementation. Remote Sens. 2020, 12, 294. [Google Scholar] [CrossRef]
- Sobrino, J.A.; Raissouni, N.; Li, Z.-L. A Comparative Study of Land Surface Emissivity Retrieval from NOAA Data. Remote Sens. Environ. 2001, 75, 256–266. [Google Scholar] [CrossRef]
- Ermida, S.L.; Soares, P.; Mantas, V.; Göttsche, F.M.; Trigo, I.F. Google Earth Engine Open-Source Code for Land Surface Temperature Estimation from the Landsat Series. Remote Sens. 2020, 12, 1471. [Google Scholar] [CrossRef]
- Nill, L.; Ullmann, T.; Kneisel, C.; Sobiech-Wolf, J.; Baumhauer, R. Assessing Spatiotemporal Variations of Landsat Land Surface Temperature and Multispectral Indices in the Arctic Mackenzie Delta Region between 1985 and 2018. Remote Sens. 2019, 11, 2329. [Google Scholar] [CrossRef]
- Wan, Z.; Wang, P.; Li, X. Using MODIS Land Surface Temperature and Normalized Difference Vegetation Index Products for Monitoring Drought in the Southern Great Plains, USA. Int. J. Remote Sens. 2004, 25, 61–72. [Google Scholar] [CrossRef]
- Theil, H. A Rank-Invariant Method of Linear and Polynomial Regression Analysis I, II, III; Royal Netherlands Academy of Sciences: Amsterdam, The Netherlands, 1950; Volume 12, pp. 386–392, 521–525, 1397–1412. [Google Scholar]
- Sen, P.K. Estimates of the Regression Coefficient Based on Kendall’s Tau. J. Am. Stat. Assoc. 1968, 63, 1379–1389. [Google Scholar] [CrossRef]
- Kendall, M.G. Rank Correlation Method, 2nd ed.; Charles Griffin: London, UK, 1975. [Google Scholar]
- Silva, J.M.N.; Moreno, M.V.; Le Page, Y.; Oom, D.; Bistinas, I.; Pereira, J.M.C. Spatiotemporal Trends of Area Burnt in the Iberian Peninsula, 1975–2013. Reg. Environ. Change 2019, 19, 515–527. [Google Scholar] [CrossRef]
- Neeti, N.; Eastman, J.R. A Contextual Mann-Kendall Approach for the Assessment of Trend Significance in Image Time Series. Trans. GIS 2011, 15, 599–611. [Google Scholar] [CrossRef]
- Guha, S.; Govil, H. An Assessment on the Relationship Between Land Surface Temperature and Normalized Difference Vegetation Index. Environ. Dev. Sustain. 2021, 23, 1944–1963. [Google Scholar] [CrossRef]
- Wan, Z.; Hook, S.; Hulley, G. MODIS/Terra Land Surface Temperature/Emissivity 8-Day L3 Global 1km SIN Grid V061; NASA EOSDIS Land Processes Distributed Active Archive Center: Sioux Falls, SD, USA, 2021.
- Waseem, M.; Ajmal, M.; Kim, T. Development of A New Composite Drought Index for Multivariate Drought Assessment. J. Hydrol. 2015, 527, 30–37. [Google Scholar] [CrossRef]
- Duan, H.; Wang, T.; Xue, X.; Yan, C. Dynamic Monitoring of Aeolian Desertification Based on Multiple Indicators in Horqin Sandy Land, China. Sci. Total Environ. 2019, 650, 2374–2388. [Google Scholar] [CrossRef]
- Na, R.; Du, H.; Na, L.; Shan, Y.; He, H.S.; Wu, Z.; Zong, S.; Yang, Y.; Huang, L. Spatiotemporal Changes in the Aeolian Desertification of Hulunbuir Grassland and its Driving Factors in China During 1980–2015. CATENA 2019, 182, 104123. [Google Scholar] [CrossRef]
- Gao, W.; Huang, Z.; Li, X.; Ji, B.; Li, N.; Li, S.; Liu, X.; Zeng, Q.; Sun, G.; Zhao, D. The Spatial–Temporal Changes and Driving Factors of Desertification in the Wuliangsuhai Watershed Based on Remote Sensing. Ecol. Indic. 2024, 169, 112851. [Google Scholar] [CrossRef]
- Ogutu, J.O.; Schulz-Streeck, T.; Piepho, H. Genomic Selection Using Regularized Linear Regression Models: Ridge Regression, Lasso, Elastic Net and Their Rxtensions. BMC Proc. 2012, 6, S10. [Google Scholar] [CrossRef] [PubMed]
- Jamali, S.; Seaquist, J.; Eklundh, L.; Ardö, J. Automated Mapping of Vegetation Trends with Polynomials Using NDVI Imagery over the Sahel. Remote Sens. Environ. 2014, 141, 79–89. [Google Scholar] [CrossRef]
- Soltani, A.; Lee, C.L. The Non-Linear Dynamics of South Australian Regional Housing Markets: A Machine Learning Approach. Appl. Geogr. 2024, 166, 103248. [Google Scholar] [CrossRef]
- Congalton, R.G.; Green, K. Assessing the Accuracy of Remotely Sensed Data: Principles and Practices, 3rd ed.; CRC Press: Boca Raton, FL, USA, 2019. [Google Scholar]
- Al-Harbi, N. The natural characteristics of Wadi Fatimah, north of Makkah, Saudi Arabia. Egypt. J. Environ. Change 2020, 12, 105–136. (In Arabic) [Google Scholar] [CrossRef]
- Mohorjy, A.M.; Algamdi, A.H. A Comparison of Environmental Impacts of Wadi Fatima Dam and Ikrema Dam. Eng. Sci. 2000, 12, 3–33. (In Arabic) [Google Scholar] [CrossRef]
- Sharaf, M.A. Major elements Hydrochemistry and Groundwater Quality of Wadi Fatimah, West Central Arabian Shield, Saudi Arabia. Arab. J. Geosci. 2013, 6, 2633–2653. [Google Scholar] [CrossRef]
- Hu, Y.; Han, Y.; Zhang, Y. Land Desertification and its Influencing Factors in Kazakhstan. J. Arid Environ. 2020, 180, 104203. [Google Scholar] [CrossRef]
- Schlesinger, W.H.; Pilmanis, A.M. Plant-soil Interactions in Deserts. Biogeochemistry 1998, 42, 169–187. [Google Scholar] [CrossRef]
- Lancaster, N. Dune Morphology and Dynamics. In Geomorphology of Desert Environments; Abrahams, A.D., Parsons, A.J., Eds.; Springer: Dordrecht, The Netherlands, 1994; pp. 474–505. [Google Scholar]
- Akinyemi, F.O.; Ikanyeng, M.; Muro, J. Land Cover Change Effects on Land Surface Temperature Trends in an African Urbanizing Dryland Region. City Environ. Interact. 2019, 4, 100029. [Google Scholar] [CrossRef]
- Evans, J.P.; Geerken, R. Discrimination Between Climate and Human-Induced Dryland Degradation. J. Arid Environ. 2004, 57, 535–554. [Google Scholar] [CrossRef]
- Wang, Z.; Wang, Y.; Liu, Y.; Wang, F.; Deng, W.; Rao, P. Spatiotemporal Characteristics and Natural Forces of Grassland NDVI Changes in Qilian Mountains from a Sub-Basin Perspective. Ecol. Indic. 2023, 157, 111186. [Google Scholar] [CrossRef]
- Kawabata, A.; Ichii, K.; Yamaguchi, Y. Global Monitoring of Interannual Changes in Vegetation Activities Using NDVI and its Relationships to Temperature and Precipitation. Int. J. Remote Sens. 2001, 22, 1377–1382. [Google Scholar] [CrossRef]
- Churkina, G.; Running, S.W. Contrasting Climatic Controls on the Estimated Productivity of Global Terrestrial Biomes. Ecosystems 1998, 1, 206–215. [Google Scholar] [CrossRef]
- Hoerl, A.E.; Kennard, R.W. Ridge Regression: Biased Estimation for Nonorthogonal Problems. Technometrics 1970, 12, 55–67. [Google Scholar] [CrossRef]
- Tibshirani, R. Regression Shrinkage and Selection via the Lasso. J. R. Stat. Soc. Ser. B (Methodol.) 2018, 58, 267–288. [Google Scholar] [CrossRef]
- Zou, H.; Hastie, T. Regularization and Variable Selection via the Elastic Net. J. R. Stat. Soc. Ser. B Stat. Methodol. 2005, 67, 301–320. [Google Scholar] [CrossRef]
- Breiman, L. Random Forests. Mach. Learn. 2001, 45, 5–32. [Google Scholar] [CrossRef]
- de Jong, R.; de Bruin, S.; de Wit, A.; Schaepman, M.E.; Dent, D.L. Analysis of Monotonic Greening and Browning Trends from Global NDVI Time-Series. Remote Sens. Environ. 2011, 115, 692–702. [Google Scholar] [CrossRef]
- Miller, L.; Pelletier, C.; Webb, G.I. Deep Learning for Satellite Image Time-Series Analysis: A Review. IEEE Geosci. Remote Sens. Mag. 2024, 12, 81–124. [Google Scholar] [CrossRef]
- Hosseini Khezr Abad, A.S.; Vali, A.; Halabian, A.; Mokhtari, M.H.; Mousavi, S.A. Investigating the Impact of Climate Change on the Effective Indicators in Desertification and Predicting its Spatial Changes. Desert 2024, 29, 194–215. [Google Scholar] [CrossRef]
- Han, J.; Wang, J.; Chen, L.; Xiang, J.; Ling, Z.; Li, Q.; Wang, E. Driving Factors of Desertification in Qaidam Basin, China: An 18-Year Analysis Using the Geographic Detector Model. Ecol. Indic. 2021, 124, 107404. [Google Scholar] [CrossRef]
- Mainguet, M.; Da Silva, G.G. Desertification and Drylands Development: What Can Be Done? Land Degrad. Dev. 1998, 9, 375–382. [Google Scholar] [CrossRef]
- Berdyyev, A.; Al-Masnay, Y.A.; Juliev, M.; Abuduwaili, J. Bibliometric Analysis of Desertification in the Period from 1974 to 2024 Based on the Scopus Database. Land 2025, 14, 496. [Google Scholar] [CrossRef]
- Li, J.; Cao, C.; Xu, M.; Yang, X.; Gao, X.; Wang, K.; Guo, H.; Yang, Y. A 20-Year Analysis of the Dynamics and Driving Factors of Grassland Desertification in Xilingol, China. Remote Sens. 2023, 15, 5716. [Google Scholar] [CrossRef]

| No | Data Type | Range (Period) | Purpose | Used Bands | Provider |
|---|---|---|---|---|---|
| 1 | Landsat surface reflectance (SR) data | 1984–2022 (All available data) | LST | Thermal infrared bands | USGS |
| 2 | Landsat Top-of-Atmosphere (TOA) data | 1984–2022 (All available data) | NDVI | Near-infrared bands and red bands | USGS |
| 3 | TerraClimate | 1980–2022 (Monthly) | Actual evapotranspiration | aet | University of California Merced |
| 4 | TerraClimate | 1980–2022 (Monthly) | Precipitation accumulation | pr | University of California Merced |
| 5 | MOD11A2 | 2001–2022 | LST evaluation | LST_Day_1km | USGS |
| Year | RMSE | r Coefficient | Year | RMSE | r Coefficient |
|---|---|---|---|---|---|
| 2001 | 6 | 0.7 | 2012 | 4.8 | 0.3 |
| 2002 | 2.9 | 0.8 | 2013 | 5.1 | 0.6 |
| 2003 | 5.5 | 0.8 | 2014 | 3.6 | 0.7 |
| 2004 | 3.6 | 0.7 | 2015 | 2.4 | 0.8 |
| 2005 | 4.1 | 0.5 | 2016 | 3.1 | 0.8 |
| 2006 | 3.4 | 0.7 | 2017 | 4 | 0.8 |
| 2007 | 3.8 | 0.6 | 2018 | 2.6 | 0.8 |
| 2008 | 3.9 | 0.7 | 2019 | 3 | 0.8 |
| 2009 | 3.3 | 0.6 | 2020 | 2 | 0.9 |
| 2010 | 3.5 | 0.8 | 2021 | 3.4 | 0.7 |
| 2011 | 3 | 0.7 | 2022 | 3.4 | 0.6 |
| Type | Horah | Al Shamiyah | Al Yamaniyah | Bany Omear | Allaff | Down | ||||||
|---|---|---|---|---|---|---|---|---|---|---|---|---|
| km2 | % | km2 | % | km2 | % | km2 | % | km2 | % | km2 | % | |
| High positive change | 117.3 | 17.2 | 156.5 | 22.9 | 91.1 | 13.4 | 48.1 | 7.0 | 25.2 | 3.7 | 244.0 | 35.8 |
| Positive change | 403.0 | 22.1 | 417.9 | 22.9 | 205.1 | 11.2 | 127.7 | 7.0 | 114.1 | 6.3 | 557.2 | 30.5 |
| No change | 424.7 | 20.6 | 442.9 | 21.5 | 179.9 | 8.7 | 115.9 | 5.6 | 146.7 | 7.1 | 746.7 | 36.3 |
| Negative change | 181.0 | 20.1 | 181.7 | 20.2 | 86.0 | 9.6 | 39.9 | 4.4 | 57.5 | 6.4 | 352.2 | 39.2 |
| High negative change | 24.3 | 21.6 | 16.4 | 14.6 | 7.7 | 6.8 | 12.4 | 11.1 | 5.9 | 5.2 | 45.7 | 40.6 |
| Classified Data | Reference Data | |||||
|---|---|---|---|---|---|---|
| Severe | High | Moderate | Low | Total | User Accuracy | |
| Severe | 132 | 4 | 0 | 0 | 136 | 97.1 |
| High | 7 | 120 | 3 | 0 | 130 | 92.3 |
| Moderate | 0 | 5 | 79 | 12 | 96 | 82.3 |
| Low | 0 | 0 | 8 | 129 | 137 | 94.2 |
| Total | 139 | 129 | 90 | 141 | 499 | |
| Producer accuracy | 95.0 | 93.0 | 87.8 | 91.5 | ||
| Overall accuracy | 91.5 | Kappa coefficient | 0.89 | |||
Disclaimer/Publisher’s Note: The statements, opinions and data contained in all publications are solely those of the individual author(s) and contributor(s) and not of MDPI and/or the editor(s). MDPI and/or the editor(s) disclaim responsibility for any injury to people or property resulting from any ideas, methods, instructions or products referred to in the content. |
© 2025 by the authors. Licensee MDPI, Basel, Switzerland. This article is an open access article distributed under the terms and conditions of the Creative Commons Attribution (CC BY) license (https://creativecommons.org/licenses/by/4.0/).
Share and Cite
Alqurashi, A.F.; Alharbi, O.A. Spatiotemporal Assessment of Desertification in Wadi Fatimah. Land 2025, 14, 1293. https://doi.org/10.3390/land14061293
Alqurashi AF, Alharbi OA. Spatiotemporal Assessment of Desertification in Wadi Fatimah. Land. 2025; 14(6):1293. https://doi.org/10.3390/land14061293
Chicago/Turabian StyleAlqurashi, Abdullah F., and Omar A. Alharbi. 2025. "Spatiotemporal Assessment of Desertification in Wadi Fatimah" Land 14, no. 6: 1293. https://doi.org/10.3390/land14061293
APA StyleAlqurashi, A. F., & Alharbi, O. A. (2025). Spatiotemporal Assessment of Desertification in Wadi Fatimah. Land, 14(6), 1293. https://doi.org/10.3390/land14061293