Article

Land Use Dynamics and Ecological Effects of Photovoltaic Development in Xinjiang: A Remote Sensing and Geospatial Analysis

1
School of Geography and Remote Sensing Sciences, Xinjiang University, Urumqi 830017, China
2
Xinjiang Land and Resources Information Center, Urumqi 830017, China
3
Xinjiang Lidar Engineering Technology Center, Urumqi 830002, China
*
Author to whom correspondence should be addressed.
Land 2025, 14(6), 1294; https://doi.org/10.3390/land14061294
Submission received: 18 April 2025 / Revised: 8 June 2025 / Accepted: 10 June 2025 / Published: 17 June 2025

Abstract

:
As an important part of the emerging energy portfolio, the coordinated development of the photovoltaic (PV) industry and ecological environment is a core factor in realizing the high-quality development of the energy industry. Xinjiang, located in northwestern China, possesses vast open land, abundant solar radiation, and low land-use conflict, making it a strategic hub for large-scale PV power station deployment. However, the region’s fragile ecological background is highly sensitive to land-use changes induced by PV infrastructure expansion. Therefore, scientifically evaluating the ecological impacts of PV construction is essential to support environmentally informed operation and maintenance (O&M) strategies.This study investigates the spatial distribution of PV installations and their macro-scale ecological effects across Xinjiang from 2000 to 2020. Utilizing multi-temporal satellite remote sensing data and geospatial analysis techniques on the Google Earth Engine (GEE) platform, we constructed a Remote Sensing Ecological Index (RSEI) model to quantify the long-term ecological response to PV development. It was found that PV installations were concentrated in unutilized land (37.10%) and grassland (34.45%), with the smallest proportion being found in forested land (1.68%). Nearly 70% of the PV areas showed an improving trend in the ecological environment index, and there were significantly more ecological quality-improving areas than degraded areas (69% vs. 31%). There were significant regional differences, and the highest ecological environment index was found in 2020 for the Northern Xinjiang Altay PV area (0.30), while the lowest (0.10) was observed in Hetian in southern Xinjiang. The results of this study provide a spatial optimization basis for the integration of PV development and ecological protection in Xinjiang and provide practical guidance to help the government to formulate a comprehensive management strategy of “PV + ecology”, which will help to realize the synergistic development of clean energy development and ecological safety.

1. Introduction

With the sharp increase in global greenhouse gas emissions [1], environmental pollution and resource scarcity have become more and more prominent, triggering widespread concern worldwide. Reducing the consumption of fossil fuels and increasing the use of renewable energy has become a key path to promote sustainable development and achieve the “carbon balance” goals [2]. Meanwhile, photovoltaic (PV) power generation technology has become an important part of China’s energy strategy due to its clean, efficient, and sustainable characteristics [3], and it plays a crucial role in the transformation of the global energy structure [4,5]. The construction of large-scale photovoltaic (PV) power plants will inject new momentum into regional economic development but will also have far-reaching impacts on the ecological environment. PV power plants can significantly affect local climates and biological communities by altering surface albedo, turbulent fluxes, and soil hydrothermal conditions [6], with significant spatial heterogeneity in the magnitude and direction of these impacts [7].
In recent years, more and more studies have focused on the multidimensional impacts of PV devices on the ecological environment, pointing out that they profoundly affect key ecological factors such as temperature, humidity, wind speed, soil particle size and physicochemical properties, biomass, and species diversity in the area where they are constructed and in the surrounding geographic environment by altering the energy balance and the material cycling process at the surface [8,9]. It has been shown that photovoltaic arrays lead to a significant increase in near-surface air temperature and a concomitant decrease in relative humidity by reducing surface albedo and altering turbulent fluxes [10]. In the desert region of Arizona, USA, Broadbent found that PV installations can cause a significant increase in atmospheric temperature at night at a height of 2.5 m, with a temperature difference of up to 20% from the surrounding atmosphere [11]. In a study of floating photovoltaic (FPV) systems on water in Egypt, adjusting the angle of FPV modules reduced the intensity of evaporation from the water surface, thereby significantly reducing water vapor flux [12]. In addition, the physical barrier effect of PV panels attenuates surface wind speed and significantly reduces sand and dust fluxes [13]. However, it was also noted that the effect of PV panels on wind speed and direction did not reach a statistically significant level within a certain height range [14]. Notably, some studies have also found that PV facilities may produce environmental improvement effects in ecologically fragile areas. Observational data show that PV arrays can improve the ecological environment in desert areas by increasing the relative air humidity [15], increasing the soil moisture content [16], and promoting vegetation growth [9] by reducing the solar radiation and wind speed [17] under PV panels. Overall, current studies have revealed the ecological effect pathways of PV facilities from different perspectives [18,19], but most of them focus on a single ecological factor and lack a comprehensive assessment of the spatial and temporal dimensions as well as multi-factor coupling mechanisms. Especially in ecologically sensitive areas, there is still a lack of systematic analysis of the mechanisms of interaction between PV facilities and regional surface processes, which restricts the accurate determination and regulation of their environmental impacts.
As one of the richest regions in China in terms of light resources [20], Xinjiang’s large deserts and Gobi beaches provide unique spatial conditions for the construction of PV power plants. The construction and promotion of PV facilities have played a positive role in promoting local economic growth and securing the energy supply [21,22]. However, it should not be overlooked that Xinjiang is located in arid and semi-arid areas with high sensitivity coefficients of ecosystems to changes in surface cover, with fragile ecosystem structures, low resilience, and extreme sensitivity to human activities. The changes in surface cover brought about by the large-scale centralized laying of PV arrays may also have far-reaching impacts on the local ecological environment, including land use, vegetation cover, and the hydrological cycle [22,23], and thus bring about non-negligible ecological risks. Therefore, while promoting the optimization of PV industrial layout and the implementation of renewable energy strategies, completing a comprehensive and systematic assessment of the ecological impacts of the construction of PV facilities in Xinjiang and developing an in-depth understanding of their potential impacts on the regional ecosystem have become key issues for achieving sustainable energy development.
In order to deeply analyze the impact mechanisms of PV facilities on the regional ecological environment, this study takes Xinjiang as a typical case area and constructs a framework for the coordinated observation of multi-source remote sensing and geospatial and spatio-temporal big data analysis. Relying on the Google Earth Engine (GEE) platform to obtain remote sensing image data over multiple time periods, a comprehensive ecological environment index model is constructed by considering the greenness (NDVI), humidity (WET), heat (LST), and dryness (NDBSI) indices. This study performs analysis at two levels: first, it identifies the spatial distribution pattern of PV power stations in the Xinjiang region (states and cities) and multiple land use types; second, it assesses their ecological and environmental effects based on the comprehensive ecological and environmental index model and explores the spatial and temporal variation patterns of the ecological and environmental indices. This study aims to provide a quantitative basis for the assessment of the ecological effects of PV equipment in arid and semi-arid zones in Northwest China, as well as to provide a reference for the coordinated development of the environment in PV high-potential and ecologically fragile zones on a global scale.

2. Materials and Methods

2.1. Studied Area

Xinjiang (34°25′~48°10′ N, 73°40′~96°18′ E) is located in the hinterland of the Asian–European continent (Figure 1), with a general geomorphological profile of “three mountains and two basins”, with the “three mountains” referring to the Altai Mountains in the north, the Tianshan Mountains in the center, and the Kunlun Mountains in the south, while the “two basins” refer to the Junggar Basin to the north of the Tianshan Mountains and the Tarim Basin to the south of the Tianshan Mountains; mountainous areas account for 43% of the area of the whole region and basins account for 57%. Xinjiang is an important corridor of the Silk Road and the province with the longest border in China, with a prominent ecological location and geostrategic position. The ecological environment of Xinjiang is fragile, with desert accounting for more than 60% of the total area, low vegetation cover, and uneven spatial and temporal distributions of water resources; the rivers are mostly recharged by glacial snowmelt, with the region being characterized by “drought in spring, flooding in summer, scarcity in autumn, and dryness in winter” [24]. At the same time, the region has a temperate continental climate, high aridity, and low rainfall, with an average annual precipitation of about 135.31 mm. It has the highest annual sunshine hours (2550–3500 h) and the second-highest solar radiation in the country; the average annual sunshine hours in the desert areas amount to 3200–3400 h, and most of this area belongs to the Class I solar energy resource area. Xinjiang has a vast territory with rich desert land resources, and its theoretical reserves of solar energy resources account for 40% of the national technically developable amount, ranking first in the country and providing unique conditions for the development of large-scale PV applications. Xinjiang’s PV industry in the desert, and other non-cultivated land has the potential to achieve large-scale deployment, relying on “PV + sand control”, “PV + ecological restoration”, and other modes, not only promoting the development of new energy but also improving the local ecological environment to a certain extent. It has thus become an important demonstration of PV ecological construction in China.

2.2. Data Collection and Pre-Processing

2.2.1. Data Sources

The land use data used in this study were obtained from the Center for Resource and Environmental Science and Data of the Chinese Academy of Sciences (http://www.resdc.cn/)(accessed on 25 October 2024); the DEM data for the Xinjiang region were obtained from the NASA Earth Data Search platform under the National Aeronautics and Space Administration (https://earthdata.nasa.gov/)(accessed on 25 October 2024). All maps in this study were drawn based on the standard map with review number GS(2023)2767 provided by the standard map service website of the Ministry of Natural Resources (http://bzdt.ch.mnr.gov.cn/)(accessed on 27 October 2024); the core geographic elements such as the boundary and scale of the base map were not modified in any way, and the thematic contents (e.g., sampling points, analytical results, etc.) in the maps were added by the authors. This study integrated the semantic segmentation method in deep learning and high-resolution remote sensing images to construct a set of remote sensing technology systems oriented toward the extraction of large-scale photovoltaic facilities and ecological response analysis. First, 2 m resolution multispectral images acquired by the Gaofen-1, Gaofen-6, and Resource-1 satellites acquired by China Resource Satellite Application Center (http://www.cresda.com/site1/)(accessed on 27 October 2024) were used as the input base maps of the semantic segmentation model after completing standardized preprocessing such as geometric correction, mosaicking, and radiometric homogenization. The spatial distribution of photovoltaic panels was automatically extracted by a deep convolutional neural network that classified the base map image by image element. The extraction results were verified by point-by-point field sampling, and the accuracy rate reached 89%. It should be noted that in this system, the PV data themselves were not directly involved in the calculation process of the ecological index, but were combined with the buffer zone as a spatial mask for defining the distribution range and spatial coordinates of the PV facilities. The ecological environmental index data were interpreted online based on the Google Earth Engine (GEE) platform (https://earthengine.google.com/)(accessed on 29 October 2024) to obtain multi-period MODIS remote sensing image data (Table 1), which were used to calculate the Normalized Difference Vegetation Index (NDVI), the moisture index (WET), the heat index (LST), and the dryness index (NDBSI) in the Xinjiang region in 2000, 2005, 2010, 2015, and 2020.

2.2.2. Data Processing and Research Methods

(1) Greenness Indicator
The Normalized Difference Vegetation Index (NDVI), an important indicator used to monitor the growth status of vegetation and vegetation cover, is closely related to plant biomass, leaf area index, and vegetation cover. Therefore, NDVI was chosen to represent the greenness index in this study, using the following formula:
N D V I = ( ρ 4 ρ 3 ) / ( ρ 4 + ρ 3 )
where ρ 4 is the near-infrared band and ρ 3 is the red band.
(2) Humidity Indicator
The humidity indicator (WET) is the difference between the visible and near-infrared bands and the infrared band. The level of the humidity index can effectively reflect the ecological environmental quality status of the region, which is an important indicator for monitoring the surface environment. In remote sensing technology, the tassel-cap transform can invert the humidity index well and can effectively remove redundant data, so it is widely used. Therefore, in this study, the humidity component of the tasseled cap transform was used to represent the humidity index [25], and the formula is as follows [26]:
W e t = 0.2626 ρ 1 + 0.2141 ρ 2 + 0.0926 ρ 3 + 0.0656 ρ 4 0.7629 ρ 5 0.5388 ρ 6
where ρi (i = 1, …, 5, 7) is the reflectance of each corresponding band of the image, respectively.
(3) Heat Indicator
The land surface temperature (LST) is the temperature of the ground after the absorption of solar heat energy. Surface temperature is a key factor in surface physical processes at regional and global scales and an important parameter in the study of material and energy exchange between the surface and the atmosphere [27]. In this study, LST was used as a thermal indicator, which was expressed by calculating the mean values of daytime surface temperature and nighttime surface temperature and converting them to real degrees Celsius. The formula is the following [28]:
L s t = ( L S T _ D a y + L S T _ N i g h t ) / 2
where LST_Day refers to the daytime surface temperature and LST_Night refers to the nighttime surface temperature.
(4) Dryness index
The index of buildings (IBI) [25,29], based on the normalized building index, is obtained by introducing a soil-adjusted vegetation index and an improved NDVI to represent vegetation and water bodies and normalize them. In the regional environment, there is also a significant portion of bare soil, which also contributes to the “drying” of the surface, represented by the soil index SI. Therefore, for this study, the dryness index (NDBSI) was chosen to be represented by the construction index IBI and the soil index SI. The formulas are as follows [25,30]:
N D B S I = ( I B I + S I ) /   2
I B I = {   2 ρ 5 /   (   ρ 5 + ρ 4 ) [ ( ρ 4   /   (   ρ 4 + ρ 3   ) + ρ 2 /   ( ρ 2 + ρ 5 )   ] }     /   {   2 ρ 5 /   ( ρ 5 + ρ 4 ) + [ ( ρ 4 /   (   ρ 4 + ρ 3 ) + ρ 2   /   (   ρ 2 + ρ 5 )   ]
S I = [ ( ρ 5 + ρ 3 ) ( ρ 4 + ρ 1 ) ] /   [ ( ρ 5 + ρ 3   ) + ( ρ 4 + ρ 1 )   ]
In order to avoid the non-uniformity of the quantitative outline, the four indicators were normalized separately before the principal component analysis was carried out, and the values of the indicators were unified within the range of 0 and 1, which cut down the influence due to the time difference to a certain extent [31]. The specific formula is the following:
N I i = I i I m i n I m a x I m i n
where N I i represents the result of regularization of each indicator; I i indicates the value of each indicator in the quadrant; I m a x is the maximum value of each indicator statistic; and I m i n is the minimum value of each indicator statistic.
(5) Remote Sensing Ecological Environment Index
The Remote Sensing Ecological Environment Index (RSEI), a comprehensive method for evaluating the quality of the ecological environment based on remote sensing technology [25], analyzes and evaluates the health of ecosystems in a quantitative manner by combining multiple ecological indicators [32]. The core concept involves integrating four types of key ecological factors, the vegetation index, humidity component, surface temperature, and dryness index, based on remote sensing images to comprehensively reflect the spatial distribution and dynamic changes observed in the ecological environment. Specifically, principal component analysis is used to construct the RSEI, and the main advantage of this method is that when constructing the RSEI, the weights of each index are not set artificially, but are determined automatically and objectively according to the characteristics of each index itself and its contribution to the principal component. The specific calculation process and formula are as follows:
P C 1 = f ( W E T , L S T , N D B S I , N D V I )
where P C 1 is the first principal component in the results of the principal component analysis, W E T is the humidity indicator, L S T is the heat indicator, N D B S I is the dryness indicator, and N D V I is the greenness indicator.
R S E I 0 = 1 P C 1
where R S E I 0 is the initial value of RSEI and P C 1 is the first principal component.
(6) Quantifying the scope of ecological impact of PV equipment
To quantify the scope of the ecological impacts of PV equipment, we delineated a 1 km buffer zone for the equipment clusters and monitored ecological changes within the construction window of the PV equipment by comparing pixel changes within the zone. Specifically, we refer to the area within the buffer zone as the PV construction zone and the area outside the buffer zone as the unbuilt zone. The choice of a distance of 1 km was borrowed from [33,34] and others, where the impact of PV installations was usually considered to occur within 1 km (1000 m) of their boundaries. The specific equation to quantify the ecological change is the following:
R S E I = R S E I t 2 R S E I t 1
where R S E I is the difference between the ecological environment index of the PV construction area in 2020 and the ecological environment index in 2000, for which a positive value indicates that the ecological environmental quality of this PV construction area was improved during this 20-year period, while a negative value indicates that it has been reduced. R S E I t 2 is the ecological environmental index of the PV construction area at the end of the study period and R S E I t 1 is the ecological environmental index of the PV construction area at the beginning of the study period. Considering that PV power plants were gradually deployed after 2000 and that the PV dataset used in this study comprised the data for 2020, t1 and t2 were chosen to be set to 2000 and 2020, respectively.

3. Results

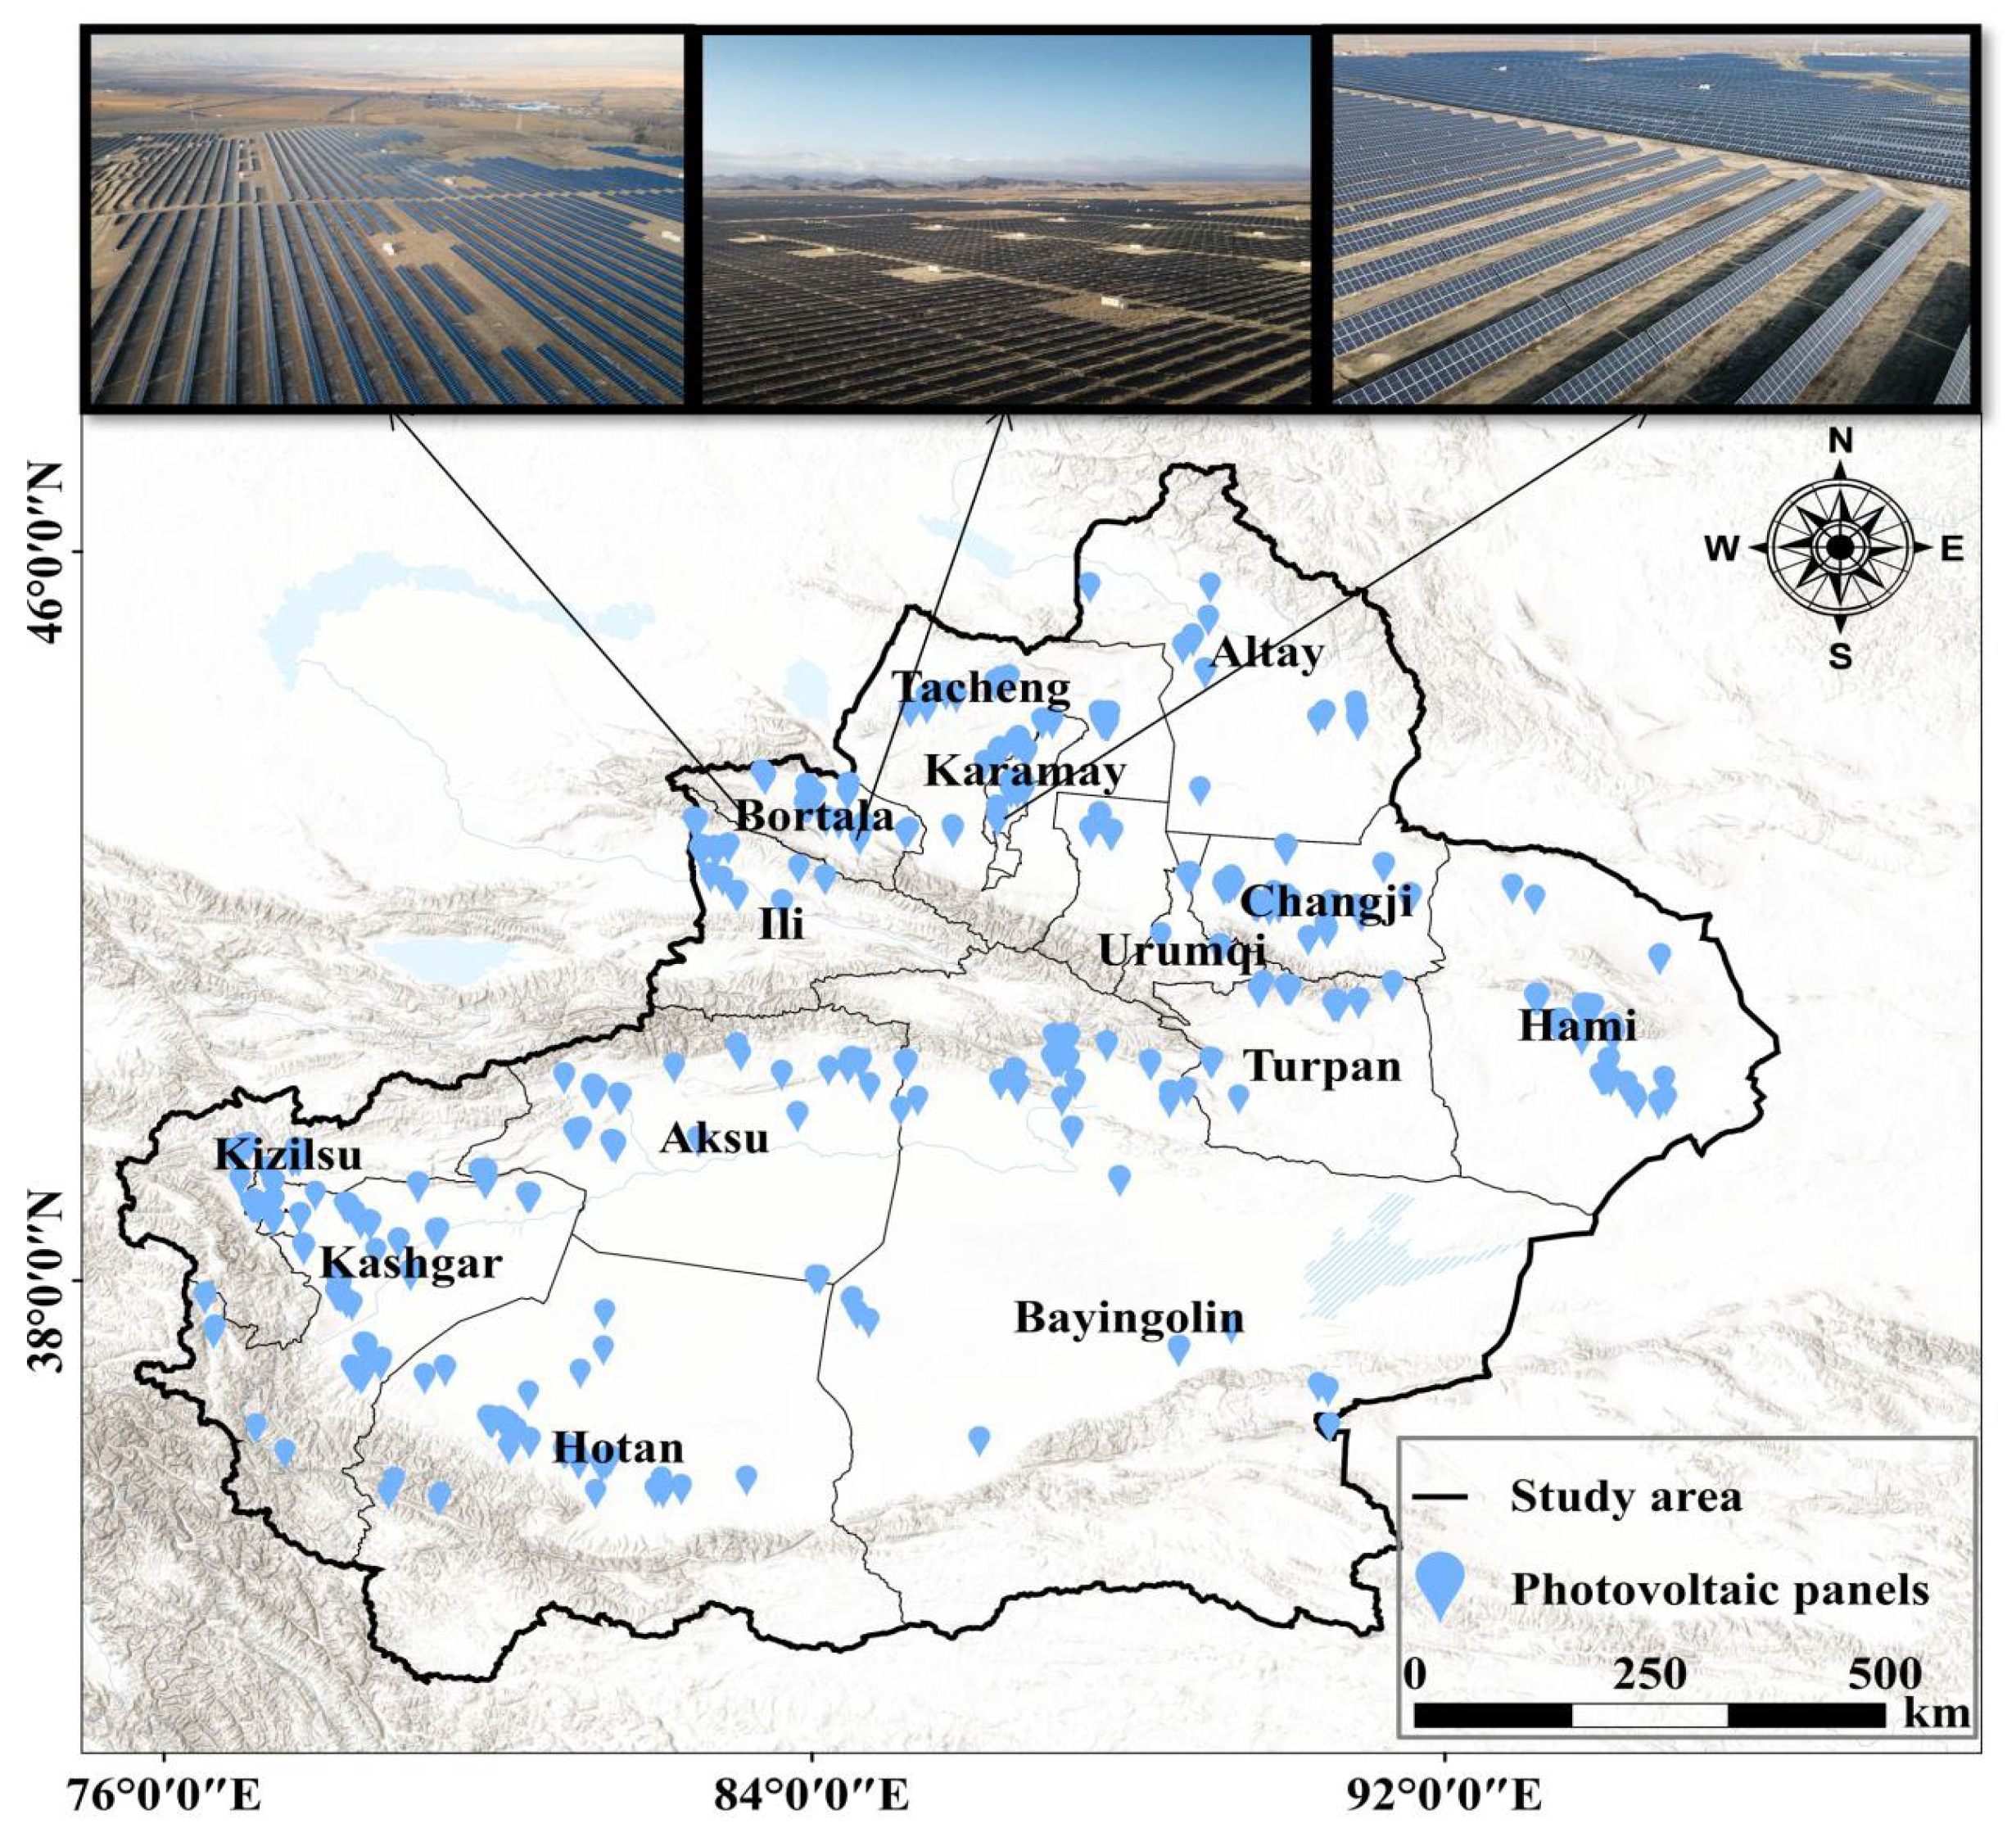
3.1. Characteristics of the Spatial Distribution of PV Equipment in Xinjiang

3.1.1. Overall Spatial Distribution Characteristics

By 2020, the distribution of PV equipment in Xinjiang presented an obvious regional imbalance (Figure 2). PV equipment was mainly concentrated in the northern and eastern regions of Xinjiang, with the largest distribution area in Kashgar (96.19 km2), accounting for 16.87% of the total distribution area of PV equipment, and the smallest distribution area in Altay (7.31 km2), at only 1.28%. At present, the distribution area of PV equipment in each region of Xinjiang differs significantly from the proportions of the total distribution area of PV equipment, and this distribution imbalance may be affected by a combination of factors.

3.1.2. Spatial Distribution Characteristics Under Land Use Types

From the viewpoint of land use type (Figure 3), PV equipment in Xinjiang is mostly distributed in unutilized land and grassland. Unutilized land has the largest distribution area of PV equipment, 211.55 km2, accounting for 37.10% of the total, while grassland has the second largest distribution area, 196.43 km2, accounting for 34.45% of the total. Construction land also has some PV equipment, with an area of 117.49 km2, accounting for 20.62% of the total. The distribution area of PV equipment in water, cultivated land, and forest land is lower, at 21.32 km2, 12.82 km2 and 9.57 km2, respectively, accounting for 3.91%, 2.25%, and 1.68% of the total. This indicates that the layout of PV equipment avoids land with high agricultural value and ecological areas, and the distribution is more concentrated in grassland and unutilized land, further reflecting the selective layout strategy for land use types.

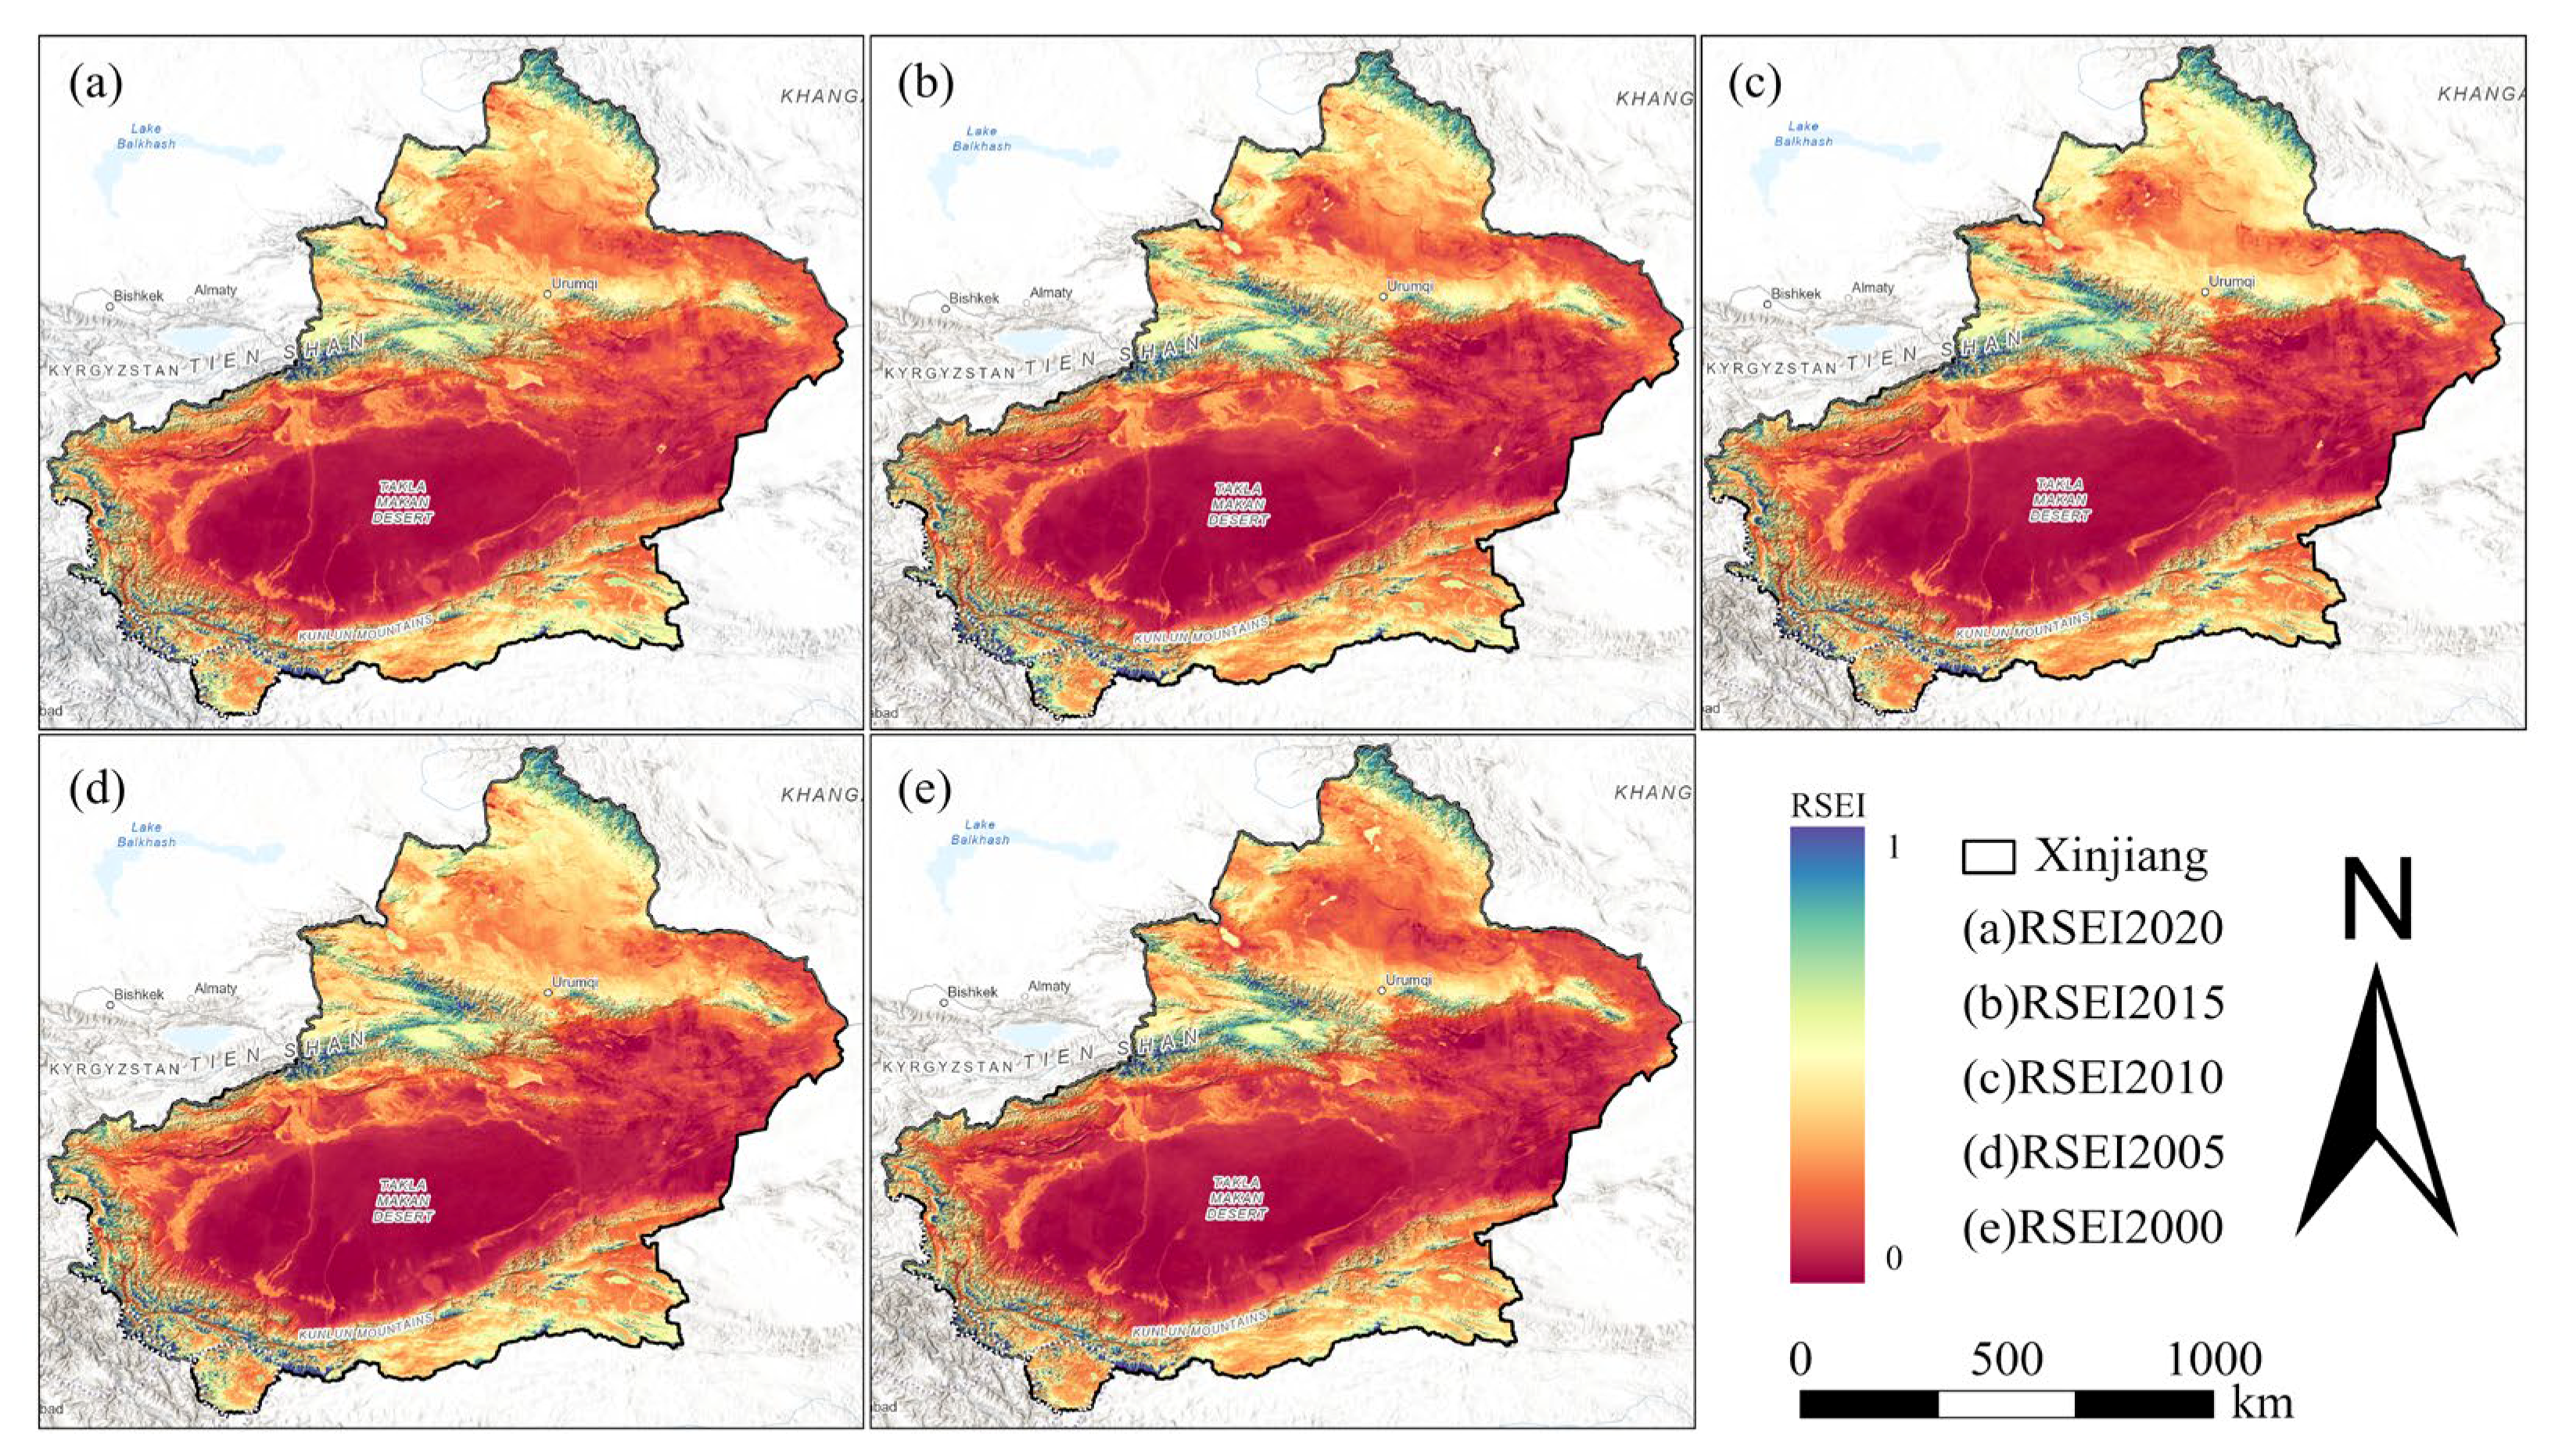
3.2. Evolution of Eco-Environmental Indices in Xinjiang, 2000–2020

Between 2000 and 2020, the spatial distribution of Remote Sensing Ecological Environment Index (RSEI) values showed significant geographical differences (Figure 4). Generally speaking, the ecological environmental quality shows a spatial pattern of “high in the north, low in the south, high in the west, low in the east, and better in the mountains than in the plains”, which is specifically reflected in the fact that the ecological environmental quality is better in the forested mountainous areas of the northern and western border regions, while the desert hinterland in the south and east faces more severe ecological environment pressure. In terms of the distribution of high-value areas, RSEI values are higher in the Tianshan Mountains, Yili Valley, Altay Mountains, Kunlun Mountains, and the areas bordering the Altun Mountains; RSEI values are significantly lower in the Tarim Basin, Taklamakan Desert, Turpan Basin, and Gashun Gobi. In terms of the spatial distribution of the amount of change in RSEI, the regions with higher growth rates are mainly concentrated in the Junggar Basin, the Gashun Gobi, and the Kashgar border region, while the regions with higher reduction rates are mainly distributed in the Tarim Basin. Overall, the average annual change in the RSEI in Xinjiang is −0.0002, and the change in most other elements is distributed between −0.0010 and 0.

3.3. Impact Assessment of Photovoltaic Construction in Xinjiang on the Ecological Environment

By analyzing the ecological environment index in Xinjiang from 2000 to 2020, the spatial distribution of the changes in the ecological environment index of PV construction areas in Xinjiang during the 20-year period was determined as shown in Figure 5. Through statistical analysis, it was found that the ecological environment index of PV construction zones in the whole territory improved in about 69% of the areas and decreased in about 31%, indicating that the ecological environmental quality of most PV construction zones in Xinjiang is gradually improving. Through spatial analysis, it can be found that most of the PV construction areas with improved ecological environmental quality during the 20-year period are distributed to the north of the Tianshan Mountains, in the Tuha Basin, and in the west of southern Xinjiang, and at the same time, there is more PV equipment in these area, whereas the area and distribution of PV construction areas in the north and the southeast of Xinjiang are lower; the ecological environmental quality of the PV construction areas of the Altay region in the north improved compared with that of the Hotan region in the south. The impact of PV equipment construction on the ecological environment in each region of Xinjiang can be specifically divided into temporal and spatial differences for analysis.

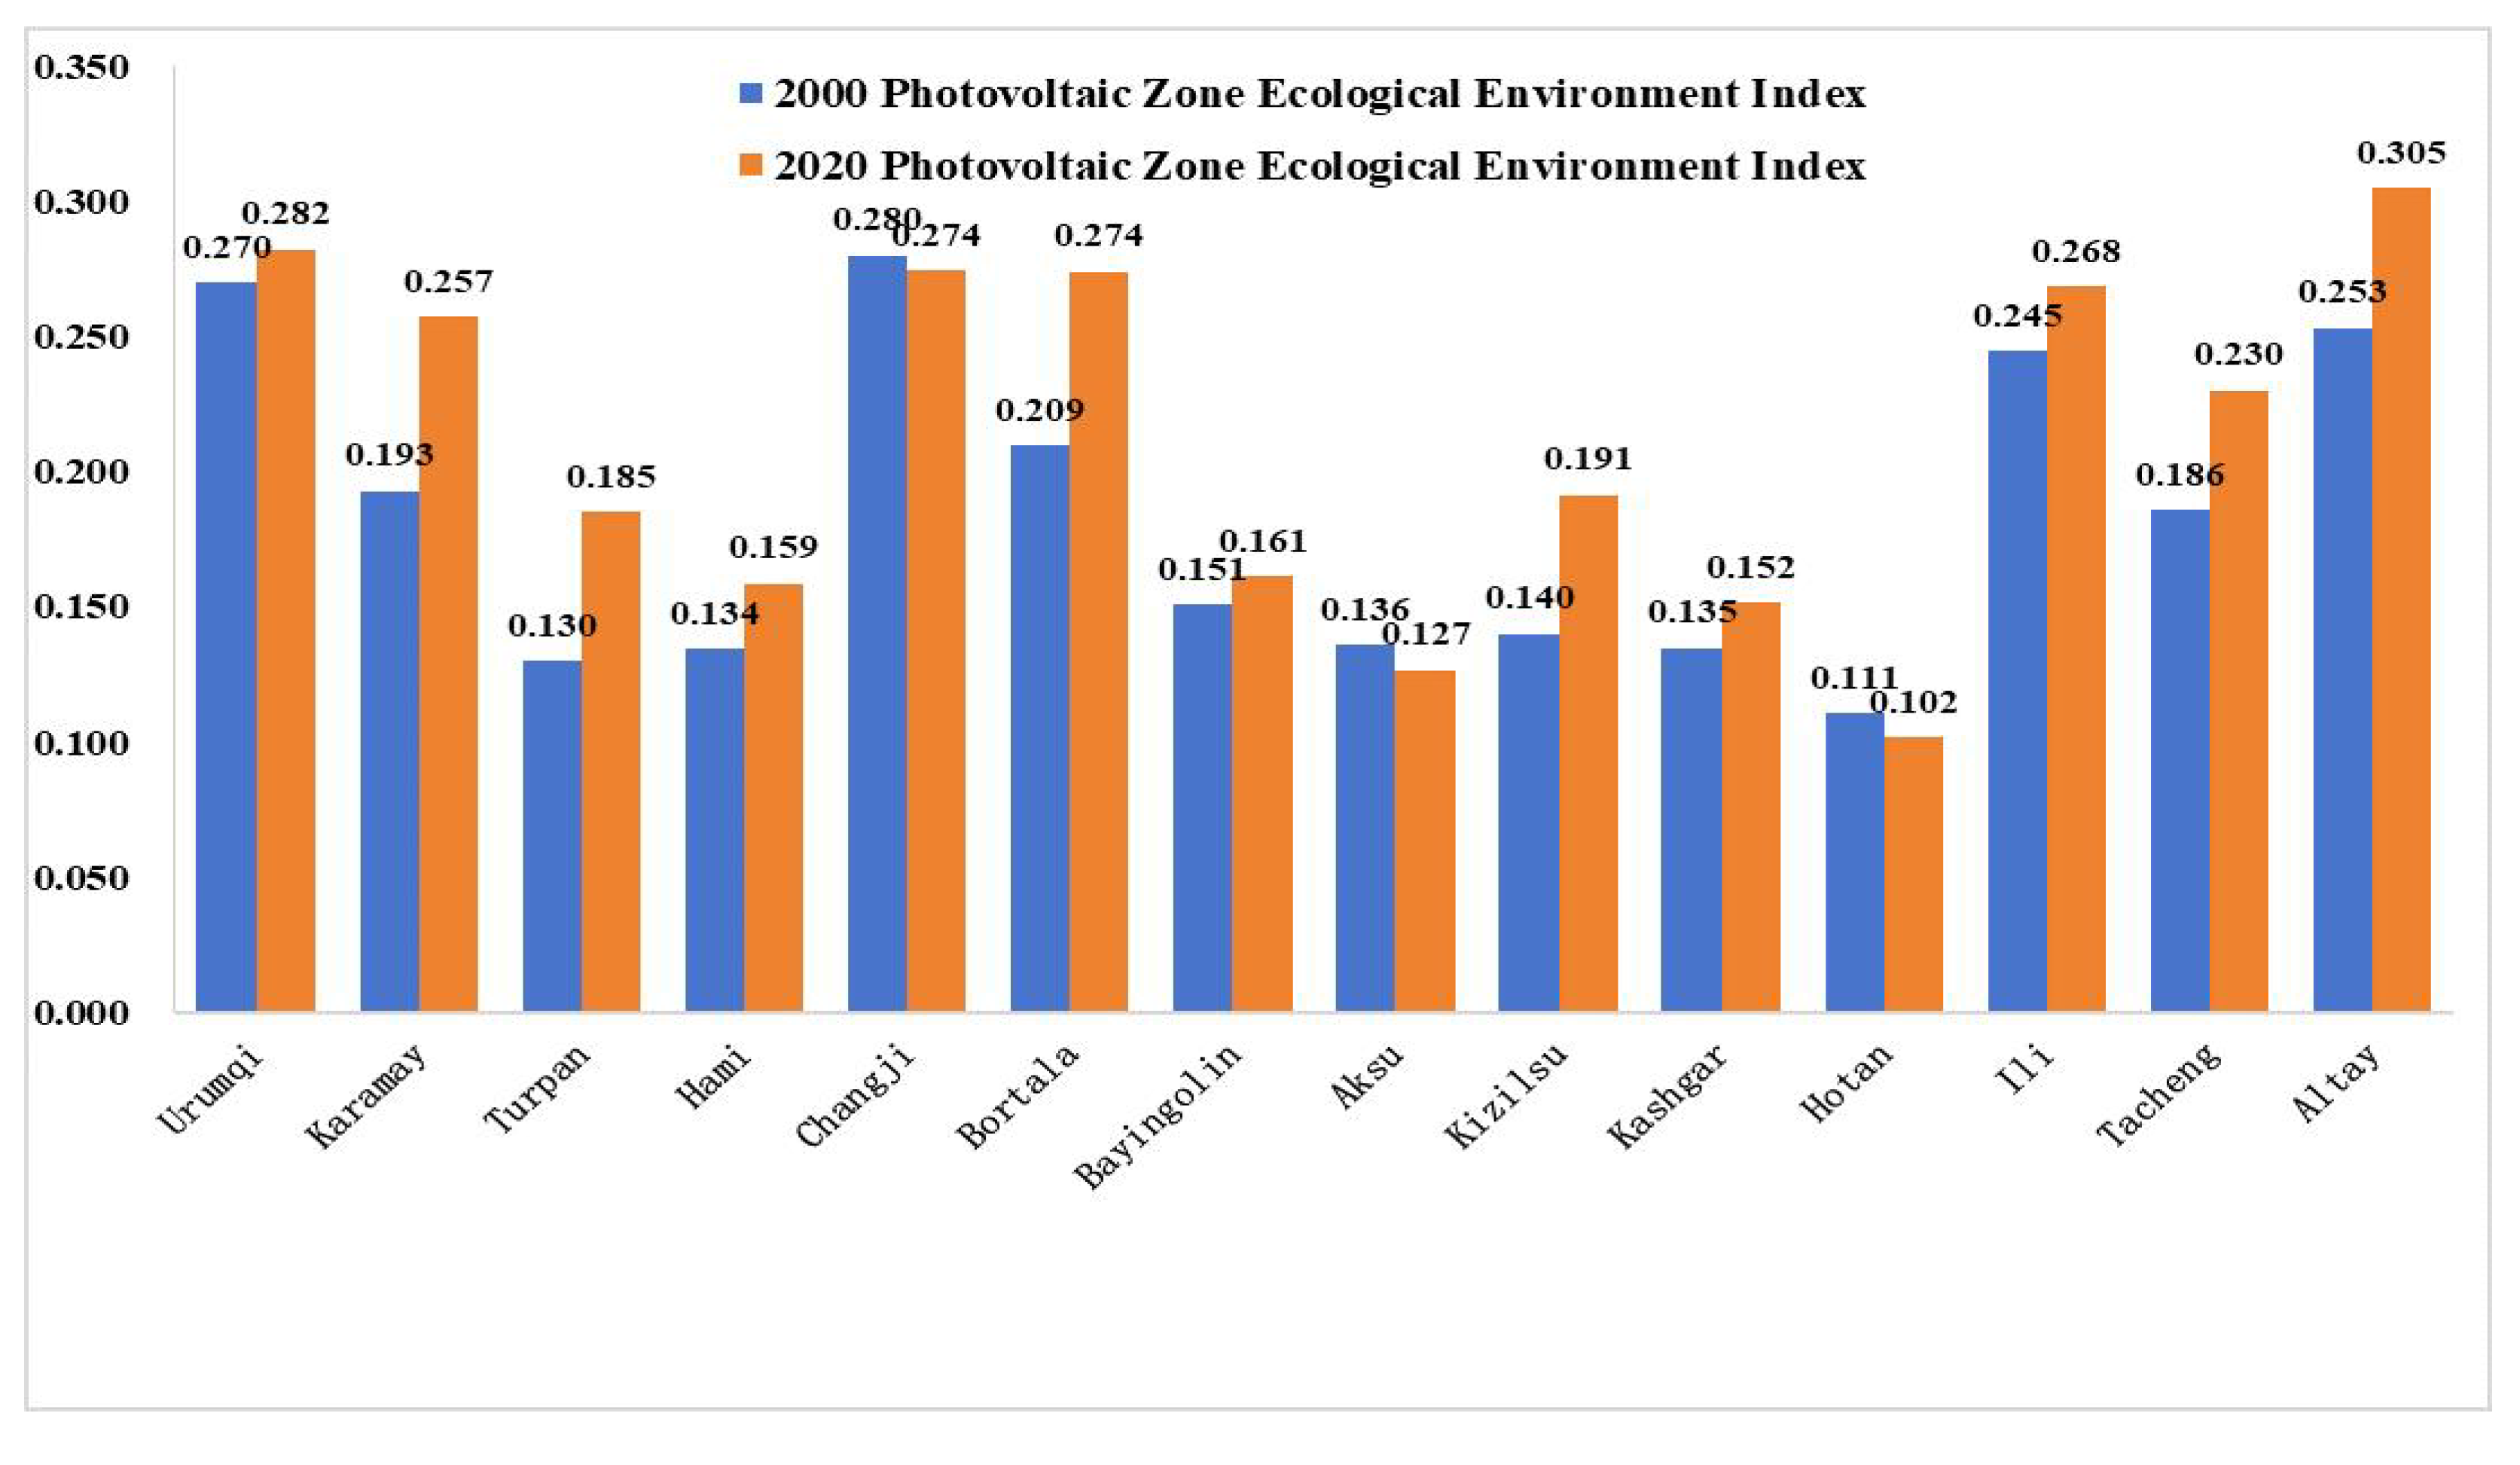
3.3.1. Characteristics of Time Differences

According to the results in Figure 6, there are temporal differences in the trends of the ecological environment index in the 14 prefectural-level administrative regions of Xinjiang. From 2000 to 2020, the ecological environmental quality of the PV regions in Xinjiang varied. Eleven prefectural and municipal cities and towns displayed an improved ecological environment index, among which Bortala Mongol Autonomous Prefecture (+0.065), Kelamayi City (+0.064), and Turpan City (+0.056) displayed the most significant improvement. Three prefectures and cities displayed a slight decrease in the ecological environment index, namely Changji Hui Autonomous Prefecture (−0.006), the Hotan Region (−0.009), and the Aksu Region (−0.009). The average value of the ecological environment index of PV construction areas in the whole of Xinjiang increased from 0.184 in 2000 to 0.212 in 2020, and the proportion of prefectures and states in which the ecological environmental quality of PV construction areas in the whole of Xinjiang improved was close to 80%, which indicates that the construction of PV equipment in various regions of Xinjiang has better ecological environment benefits.
From the comparison of the ecological environment indexes of various states in Xinjiang, it can be found that the ecological environmental quality of Urumqi, Karamay, Turpan, Hami, Changji Hui Autonomous Prefecture, Bortala Mongol Autonomous Prefecture, Bayinguoleng Mongol Autonomous Prefecture, Kizilsu Kirgiz Autonomous Prefecture, Kashgar Region, Ili Kazakh Autonomous Prefecture, Tacheng Region, and Altay Region improved to varying degrees over the 20-year study period. In particular, in Turpan City, the ecological environment index of the region was 0.144 in 2000, which was the lowest in the whole territory, and the ecological foundation was relatively fragile. However, the ecological environment index of the PV area increased from 0.130 in 2000 to 0.185 in 2020, which is higher than that of the neighboring non-constructed areas, indicating that PV construction has effectively improved the local ecological environment. However, the eco-environmental index of the PV construction area in the Aksu and Hotan regions declined, as did the overall eco-environmental quality, so the negative impact of PV equipment construction on the ecological environment in the region may be influenced by other factors, requiring further adjustment of the PV area development strategy.

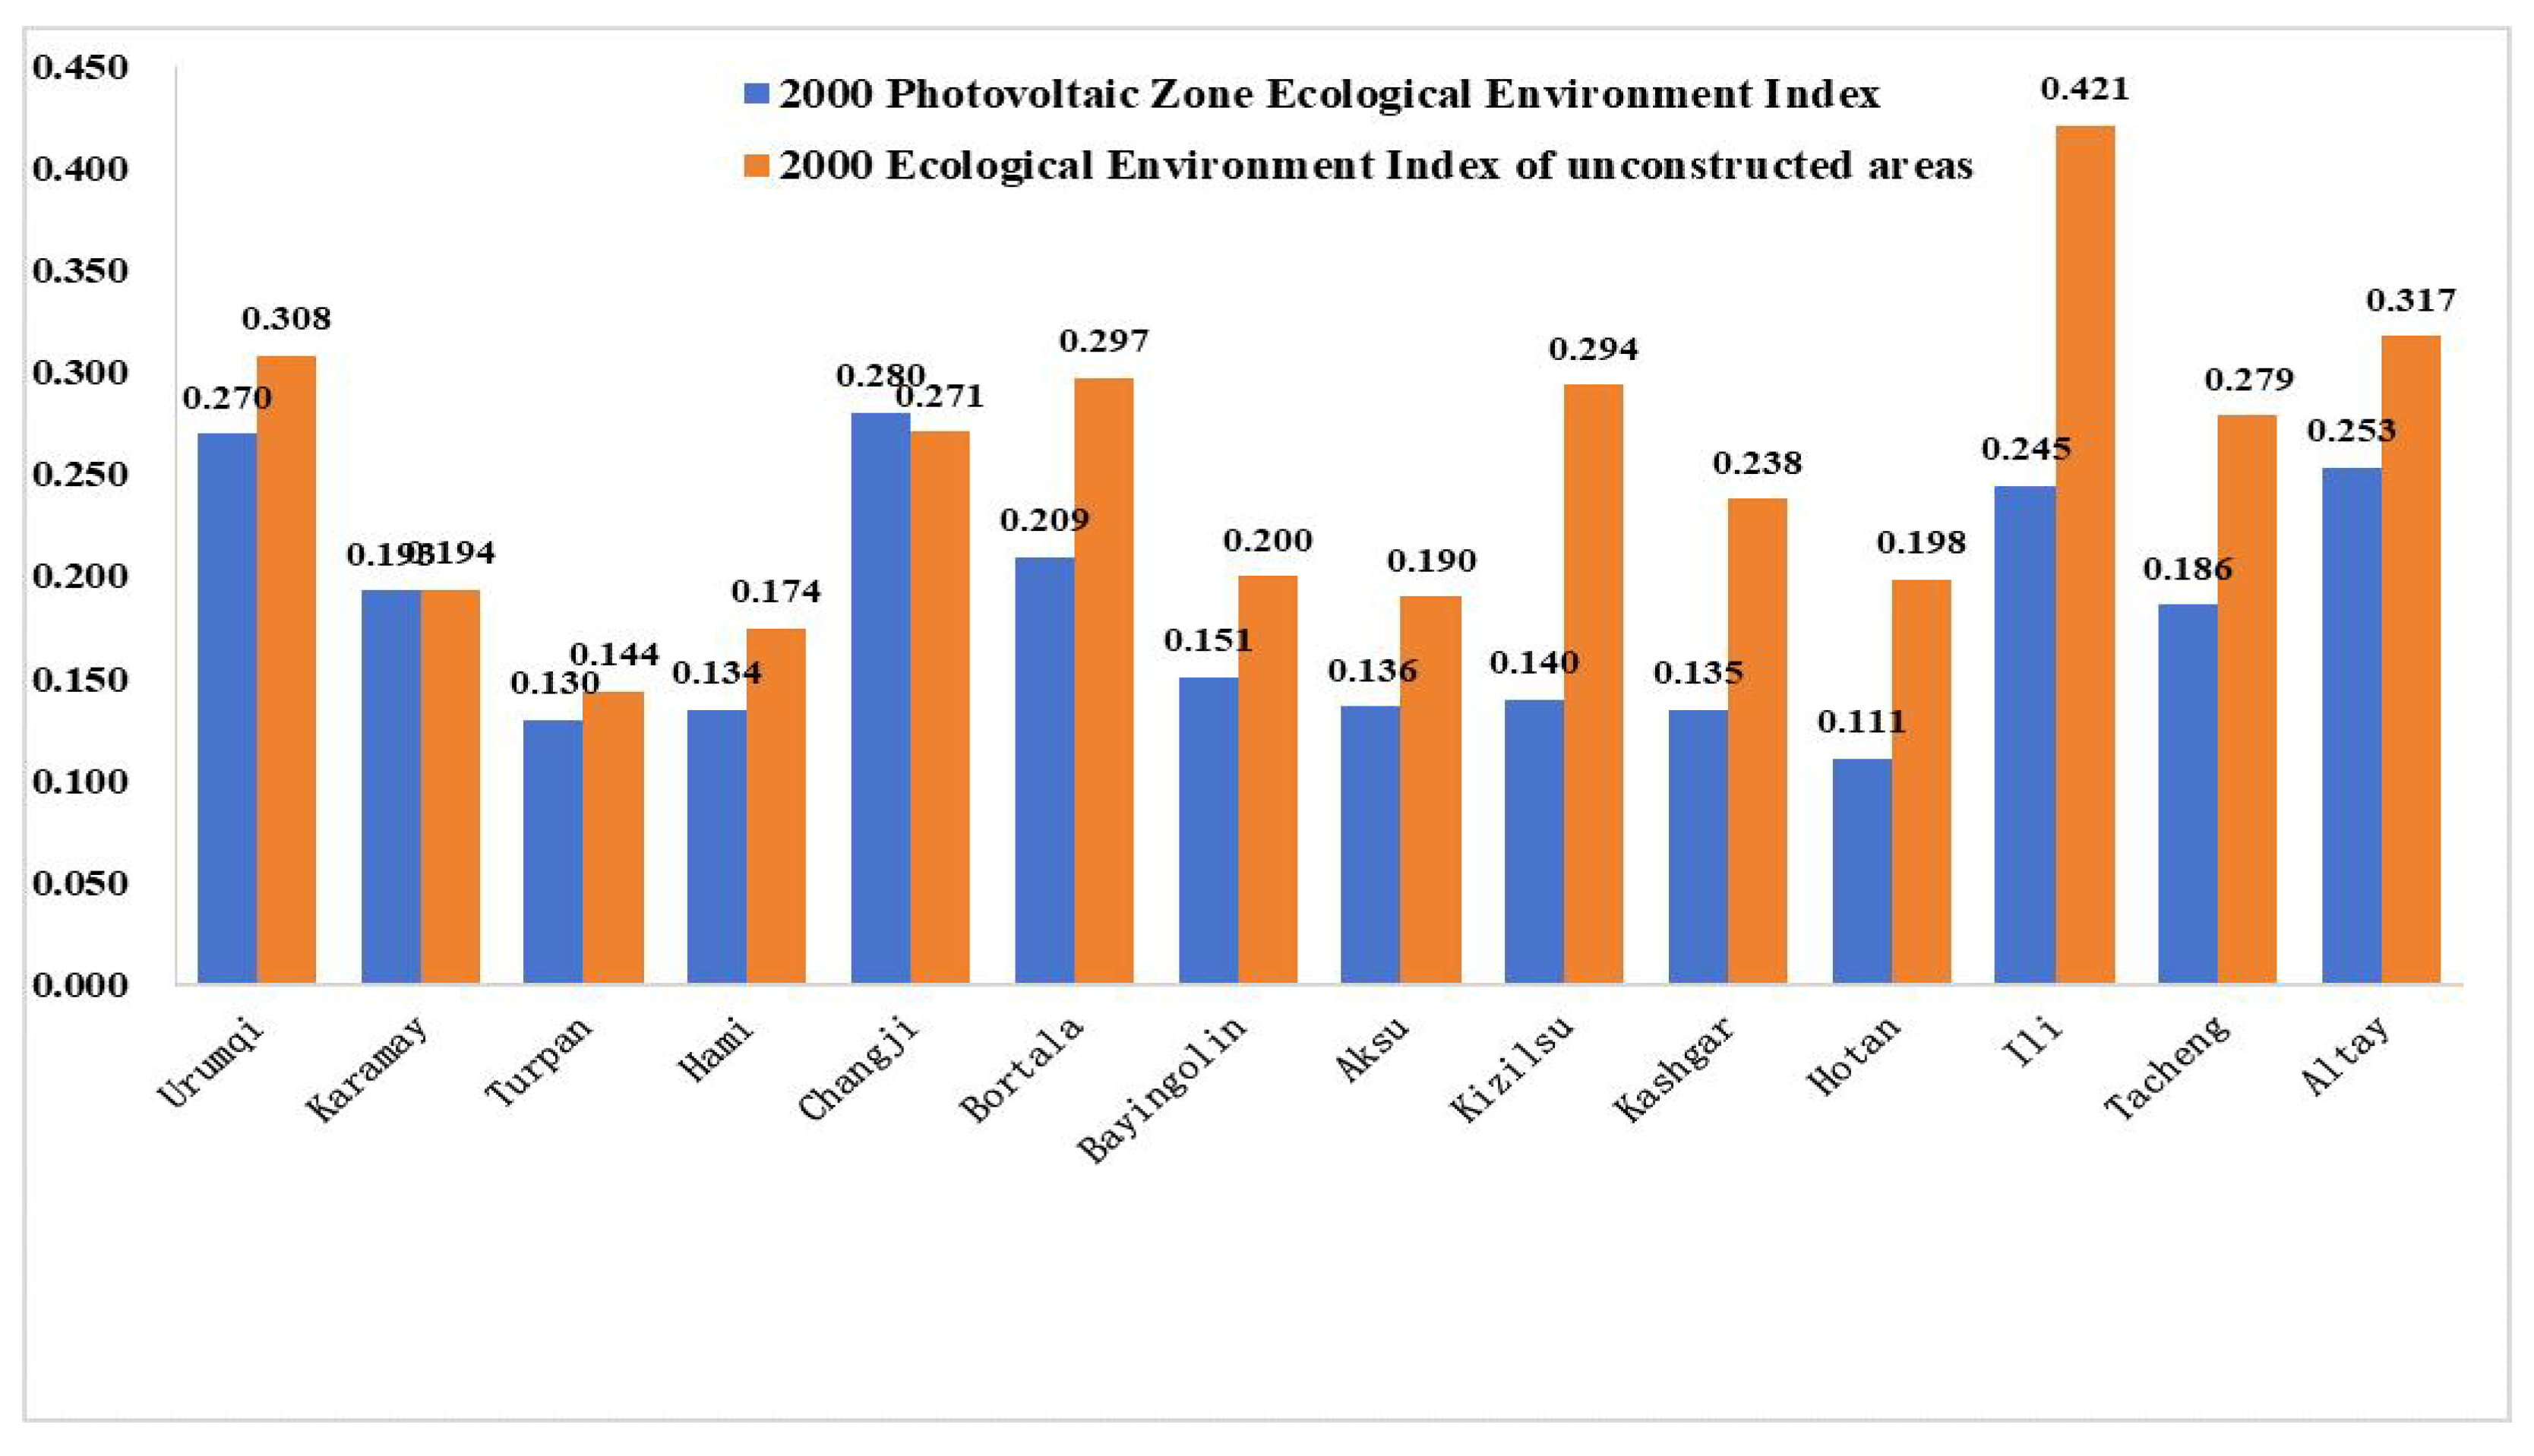
3.3.2. Characteristics of Spatial Variation

There were temporal differences in ecological environmental quality before and after the construction of PV equipment in various regions of Xinjiang, while there were spatial differences in ecological environmental quality between PV construction areas and neighboring unconstructed areas, as well as between different PV construction areas, within the same period (Figure 7). Overall, there were significant differences in the base ecological environment index value before the construction of PV equipment in each region of Xinjiang in 2000. Ili Kazakh Autonomous Prefecture had the highest ecological environment index (0.420), and seven prefectures and cities, including Altay Region and Urumqi City, had ecological environment indexes exceeding the average value and better ecological quality, mostly in northern Xinjiang. Tulufan City has the lowest ecological environment index (0.144), and seven other cities and municipalities, including Hami City and Aksu Region, have below-average ecological environment indexes, indicating poorer ecological quality, mostly in the southern border regions, with the worst ecological quality being observed in the Tuha Region.
By analyzing the eco-environmental indices of PV construction and unconstructed areas in each state of Xinjiang in 2000 (Figure 8), it can be seen that the eco-environmental quality of the PV construction areas in each region is significantly different. From the point of view of regional distribution, the ecological environmental quality in the northern Xinjiang region is relatively good. Among the regions, the ecological environment index of the PV construction area in Changji Hui Autonomous Prefecture is the highest. In addition, the ecological environment index of PV construction zones in seven prefectures and cities, including Urumqi City and the Altay Region, also exceeded the average value, and the ecological quality was at a better level. In contrast, the ecological environmental quality in the southern border regions is relatively poor. The ecological environment index of PV construction zones in seven prefectures and cities, including Bayin’guoleng Mongol Autonomous Prefecture and Kizilsu Kyrgyz Autonomous Prefecture, was lower than the average value, especially in the Hotan region, where the ecological environment index was the lowest and the ecological quality was poor. In conclusion, the ecological environmental quality of PV construction zones in 2000 was generally better in the northern border regions than in the southern border regions.
In 2020, the ecological environmental quality changed in various regions as the construction of PV equipment advanced (Figure 9). The ecological environment index of PV construction areas in the Altay region is the highest at 0.305, and the ecological environmental quality of PV construction areas in most regions in the northern border regions is better, while the ecological environmental quality in the southern border regions, such as the Hotan region (0.102), is worse. Comparing 2000 and 2020, the ecological environmental quality of PV areas improved in 11 regions, including Bortala Mongol Autonomous Prefecture, Kelamayi City, and other regions, among which Turpan City and Kelamayi City improved significantly, with a change in the ecological environmental index of the PV area in Turpan City of 0.055, and a change in the ecological environmental index of the PV area in Kelamayi City of 0.064. The ecological environmental quality of the PV construction area decreased in three regions, with a decrease in ecological environmental quality in the Aksu area, Hotan area and Changji Hui Autonomous Prefecture, including a significant decrease for the Aksu area, indicating the need to put forward a sustainable development strategy for PV equipment construction and ecological restoration according to the problems posed by PV construction areas.

4. Discussion

4.1. Characteristics of Spatial Distribution of Photovoltaic Equipment

Our study is focused on Xinjiang, western China, which has a vast area of desert and abundant solar energy resources. We use the semantic segmentation algorithm in deep learning, combined with high-resolution satellite images, to identify and extract the spatial distribution of all PV panels in the whole region of Xinjiang in detail, with two-meter resolution which can satisfy the demand for accurate identification of the spatial distribution of PV panels. Through this analysis, we find that the land cover types in which PV equipment is mostly installed in Xinjiang are unutilized land (37.10%) and grassland, which is consistent with the findings regarding land use types and policy planning in Xinjiang. This also confirms that PV siting should comprehensively consider land cover, topography, location, and accessibility [35,36]. Governments and enterprises around the world should take into account the uniqueness of PV equipment itself as well as the economic and ecological benefits when siting PV construction land in order to avoid damage to the existing land use functions. The layout of the PV equipment in the study area shows the characteristics of avoiding areas of high agricultural value, and thus PV equipment has a lower proportion of distribution in arable land and forested land, compared to a more centralized distribution in grassland, which further reflects a more selective layout strategy for land use types. Given the overlapping characteristics of ample unutilized land resources and abundant solar energy resources, a large number of utility-scale PV plants have been installed in dry lands [37]. However, large-scale landscape transformation has raised concerns about the risk of land degradation [38], and research on the possible ecological effects of PV power plants is highly desirable. Our study may provide a larger-scale and more comprehensive characterization of PV distribution and impact assessment than previous studies that focused on only one or a few sites.

4.2. Ecological Impact Assessment of Photovoltaic Construction

At present, China’s PV industry is accelerating in desert, and it is necessary to clarify whether the construction of the PV industry has an ecological effect on these regions [19]. In our study, RSEI was selected to represent the local ecological environmental quality, and it has been shown that RSEI has good applicability in ecological environmental monitoring and evaluation. As a comprehensive index, RSEI integrates four key ecological dimensions, namely greenness, humidity, dryness, and heat, avoiding the one-sidedness that may result from single-index assessment, and thus it provides significant advantages in conducting large-scale assessment of the environmental impacts of PV construction. In addition, based on remote sensing image data, RSEI is particularly suitable for assessing the regional ecological change trends before and after the construction of large-scale PV bases, overcoming the limitations of traditional sampling survey methods in terms of spatial coverage and temporal continuity [39]. However, RSEI selects a wide range of indicators involving a variety of data and computational models, and the huge data volume and complex data processing procedures make it difficult to conduct ecological monitoring at large scales [40], so this study carried out the acquisition and processing of large-scale and long-term remote sensing data through the GEE platform, which provided powerful cloud computing support and significantly improved the efficiency of our study; this method is useful for the long-term monitoring of the comprehensive impact of PV development on regional ecosystems, as well as providing a scientific basis for subsequent ecological restoration and sustainable management. Through this study, we found that the oasis areas, river coasts, and mountainous areas in Xinjiang are characterized by higher RSEI values and better ecological environmental quality due to richer water resources and higher vegetation cover, specifically the better ecological environmental quality of the mountainous forest belts in the northern and western border regions, while in arid areas such as the desert the vulnerability of the ecological environment is obvious due to the sparse precipitation and the uneven distribution of water resources, and the RSEI values are lower. The RSEI value is low, which is consistent with the results of existing studies on the northwestern region of China [39]. The trend of RSEI is closely related to the regional topography and water resource conditions. Xinjiang has implemented many ecological protection and restoration measures in recent years, such as returning farmland to forests, artificial irrigation, soil and water conservation, and desert management. These initiatives have alleviated the ecological pressure in localized areas to a certain extent and locally improved the RSEI value.
Many studies have explored the possible impacts of PV power plants on the local environment throughout their life cycle [41]. The siting, laying, and operation and maintenance of PV power plants need to consider the impacts on the local ecological environment [33]; during the laying of PV equipment, the spatial layout of the original land use and subsurface is altered, which affects the local surface energy distribution and microclimate [42], and these impacts are particularly evident in arid regions. In some areas of our study (e.g., Changji Hui Autonomous Prefecture, Aksu area, etc.), the RSEI values after the construction of PV power plants decreased compared to the values before construction, and there was a tendency for deterioration of local ecological quality, which may be due to the fact that land leveling prior to the construction of the PV power plants and continuous vegetation management measures (e.g., weed control) during their operation may have led to a reduction in vegetation in the originally densely vegetated areas, which may have led to negative ecological consequences [37]. It has also been shown that PV construction inevitably affects ecohydrological processes, such as soil function regulation, microclimate adjustment, and vegetation restoration and reestablishment [9], as one of the possible causes.
Despite the negative impacts of PV equipment, it has also been shown that PV panels can have positive ecological effects. Plant species, richness, evenness and dominance, and biomass have been found to increase in PV construction areas relative to areas outside the PV construction zone [43]. We found that RSEI increased in most of the PV construction areas in Xinjiang, and the RSEI increase was often accompanied by an increase in biodiversity [44]. Especially in some areas with poor ecological substrates and poor ecological environments (e.g., Turpan City, Xinjiang), the ecological quality of PV construction zones was higher than that of non-constructed zones, suggesting that PV construction makes a very positive contribution to the ecological quality of the region. Previous studies have proven that, in arid and very arid areas with high wind speed and high evaporation, the wind-resistant effect of PV panels reduces the water loss from the soil, and in areas with high surface temperatures, the cooling effect of PV panels mitigates the high temperature pressure due to high soil temperatures, thus showing better ecological benefits [45], which can also be used as an explanation for the above phenomenon. In addition, PV devices can also play a role in conserving fragile ecosystems, reducing wind and fixing sand, thus promoting the positive development of desert grassland [46], which also indicates that PV devices have positive effects on the ecological environment. In addition, through our analysis, we also found that the impact of PV equipment construction on the ecological environment is not significantly associated with the area of PV equipment and the quality of the local ecological substrate, and the installation scale of PV panels, rotation angle, and other microscopic anthropogenic operational factors may also have a certain impact on the results of the study. These possible factors are worthy of more in-depth discussion and research.

4.3. Policy Recommendations

The development and construction of large-scale photovoltaic power plants play a crucial role in promoting regional socio-economic development. Xinjiang has rich solar light resources and the “Xinjiang ecological environmental protection” 14th Five-Year Plan emphasizes the coordinated development of regional socio-economic construction and ecological civilization, meaning that the development and construction of photovoltaic equipment in Xinjiang can ultimately reach a ‘win–win’ situation in terms of regional economic benefits and ecological benefits. However, the overall ecological environment in Xinjiang is fragile, with high ecological sensitivity, weak recovery capacity, and high carrying pressure. Large-scale PV development may cause multiple pressures on the regional ecosystem, including, but not limited to, the decline in biodiversity triggered by land cover change, ecological and hydrological imbalances caused by increased water consumption, and soil erosion risks that may be induced by the disturbance of the ground surface structure during the construction period. Therefore, in promoting the PV construction process, the dynamic balance between ecological carrying capacity and development intensity needs to be considered in an integrated manner, and sustainable development strategies and recommendations for the PV equipment construction area in Xinjiang need to be put forward in conjunction with sustainable development goals and the need for a peak-carbon and carbon-neutral strategy.
PV development in Xinjiang needs to explore the promotion of energy efficiency, ecological protection, and economic and social benefits as the core of the “four-in-one” optimization program. First, scientific site selection and accurate assessment of the impact of the project on the ecological environment before construction need to be conducted. In the process of site selection, priority should be given to areas with abundant solar energy resources and a relatively good ecological environment and a large environmental carrying capacity, and ecologically sensitive areas, such as nature reserves and water sources, should be avoided as much as possible. Second, a sound monitoring and early warning mechanism should be established, the monitoring network should be installed along with real-time monitoring equipment in the PV base, ecological and environmental data should be collected, and the ecological and environmental dynamics of the construction area should be quickly grasped. Third, an ecological compensation mechanism should be established and policy and financial support for ecological restoration in PV construction areas should be increased. Through the implementation of ecological protection measures, the restoration of vegetation should be prioritized, and grass-planting PV models should be promoted to reduce surface erosion. At the same time, ecological compensation policies should be improved, and differentiated compensation standards should be set up according to the degree of impact of the construction area on the environment. In addition, some studies have shown that active ecological protection measures during construction can help to reduce the negative impacts of PV construction and reduce the risk of land degradation. Fourth, the “PV +” series of industries should be explored to realize multiple benefits. The “PV + Agriculture” model can be promoted, combining local agricultural needs to carry out planting or farming, thus improving land use efficiency. The “PV + energy storage” model could also be developed, introducing energy storage equipment, improving the stability of PV power generation, and helping to balance the regional demand for electricity. At the same time, photovoltaic power generation is a new way to control and treat sand, combining power generation, water-saving agriculture, and desert management, and utilizing the desert’s abundant land and light and heat resources to develop the photovoltaic industry [42]. Remote sensing observations show that China’s PV sand control projects have realized positive greening benefits in desert areas [37]. Utilizing the shading effect of photovoltaic panels to develop the sand and grass industry, improving the ecological environment, and developing the tourism economy in sandy areas while generating electricity is conducive to the greening of the desert, increasing the efficiency of enterprises, adding value to the resources, and fully realizing the “win–win” scenario of ecological, economic, and social benefits.

4.4. Shortcomings and Prospects

Compared with previous studies, this study focuses on the distribution of photovoltaic equipment and its impact on the ecological environment at a macro scale, using remote sensing technology to analyze the distribution of photovoltaic equipment and its impact on the local ecological environment. The results of this research can support the integrated life cycle management of photovoltaic power plants, help formulate ecological compensation measures in advance at the planning stage, and provide a scientific basis for the optimization of operation and maintenance methods at the operational stage of photovoltaic power plants. It can also help in the formulation and implementation of PV construction and sustainable development strategies in various regions from an administrative perspective and support administrative units at all levels in seeking a balance between energy transformation and ecological protection. However, there are some limitations to this study. First, although remote sensing technology has significant advantages in large-scale environmental assessment, satellite observation may hinder the observation of ecological indicators underneath the PV panels, which may lead to the underestimation of RSEI in PV power plants, and thus, the actual ecological benefits of PV power plants in Xinjiang may be higher than in our estimation. In addition, NDVI may bemore affected by the soil background, and therefore indicessuch as SAVI or MSAVI are widely recognized as beingmore robust under low-vegetation conditions.We will further explore the introduction of SAVI or MSAVII as an alternative to NDVl to improve the model’s adaptability and accuracy in arid regions. There are other indicators such as the effects of PV construction on soil structure, vegetation growth, and local climate were not taken into account, and the results of this study still need to be systematically investigated and verified in the field to enhance their reliability. Second, we applied a 20-year time window (10 years before and 10 years after the construction year) and a 1 km buffer zone (1 km was used according to the literature) to estimate the ΔRSEI value of PV plant construction. The choice of window length and buffer distance may affect the results because a longer time window filters out samples constructed close to the beginning or end of the study, while a shorter time window makes the results more sensitive to inter-annual variability, and the size of the buffer zone also has an impact on the results. We will therefore follow up with further experimental analyses of the time window and different buffer zones. According to this study, land cover changes may alter local ecosystem services and biodiversity changes, and land cover changes due to PV construction are yet to be studied in depth [34]. In conclusion, these possible factors need to be further explored due to the lack of site-level data. Future increases in data will help to more accurately assess the dynamic impacts of PV power plants on ecosystems and help to translate the results into concrete recommendations for restoration practices.

5. Conclusions

Based on the spatial distribution data of photovoltaic (PV) equipment, this study combined remote sensing and geospatial information technology to obtain and analyze the spatial distribution characteristics of the construction of PV equipment in Xinjiang as well as the area occupied by PV equipment in each region of Xinjiang. The analysis explores the trend of ecological environmental change before and after the construction of PV panels in each state and extensively discusses the differences in the impact of PV construction on the ecological environment in Xinjiang, with the following specific conclusions:
(1)
PV equipment in Xinjiang shows an obvious regional imbalance in spatial distribution. PV equipment is mainly concentrated in the northern and eastern regions of Xinjiang. The region with the largest area of distribution of PV equipment in Xinjiang is the Kashgar region, covering 96.19 km2; the region with the smallest area of distribution is the Altay region, covering only 7.31 km2. According to the distribution of land use types, the distribution of PV equipment is mainly concentrated in unutilized land, followed by grassland, and forest land has the lowest distribution of PV equipment.
(2)
Between 2000 and 2020, the Remote Sensing Ecological Environment Index in Xinjiang showed significant geographical differences, presenting a spatial pattern of “high in the north and low in the south, high in the west and low in the east, and better in the mountainous areas than in the plains”. The ecological environmental quality is better in the northern and western border mountain forest belt, while the southern and eastern desert hinterland faces greater pressure on its ecological environment.
(3)
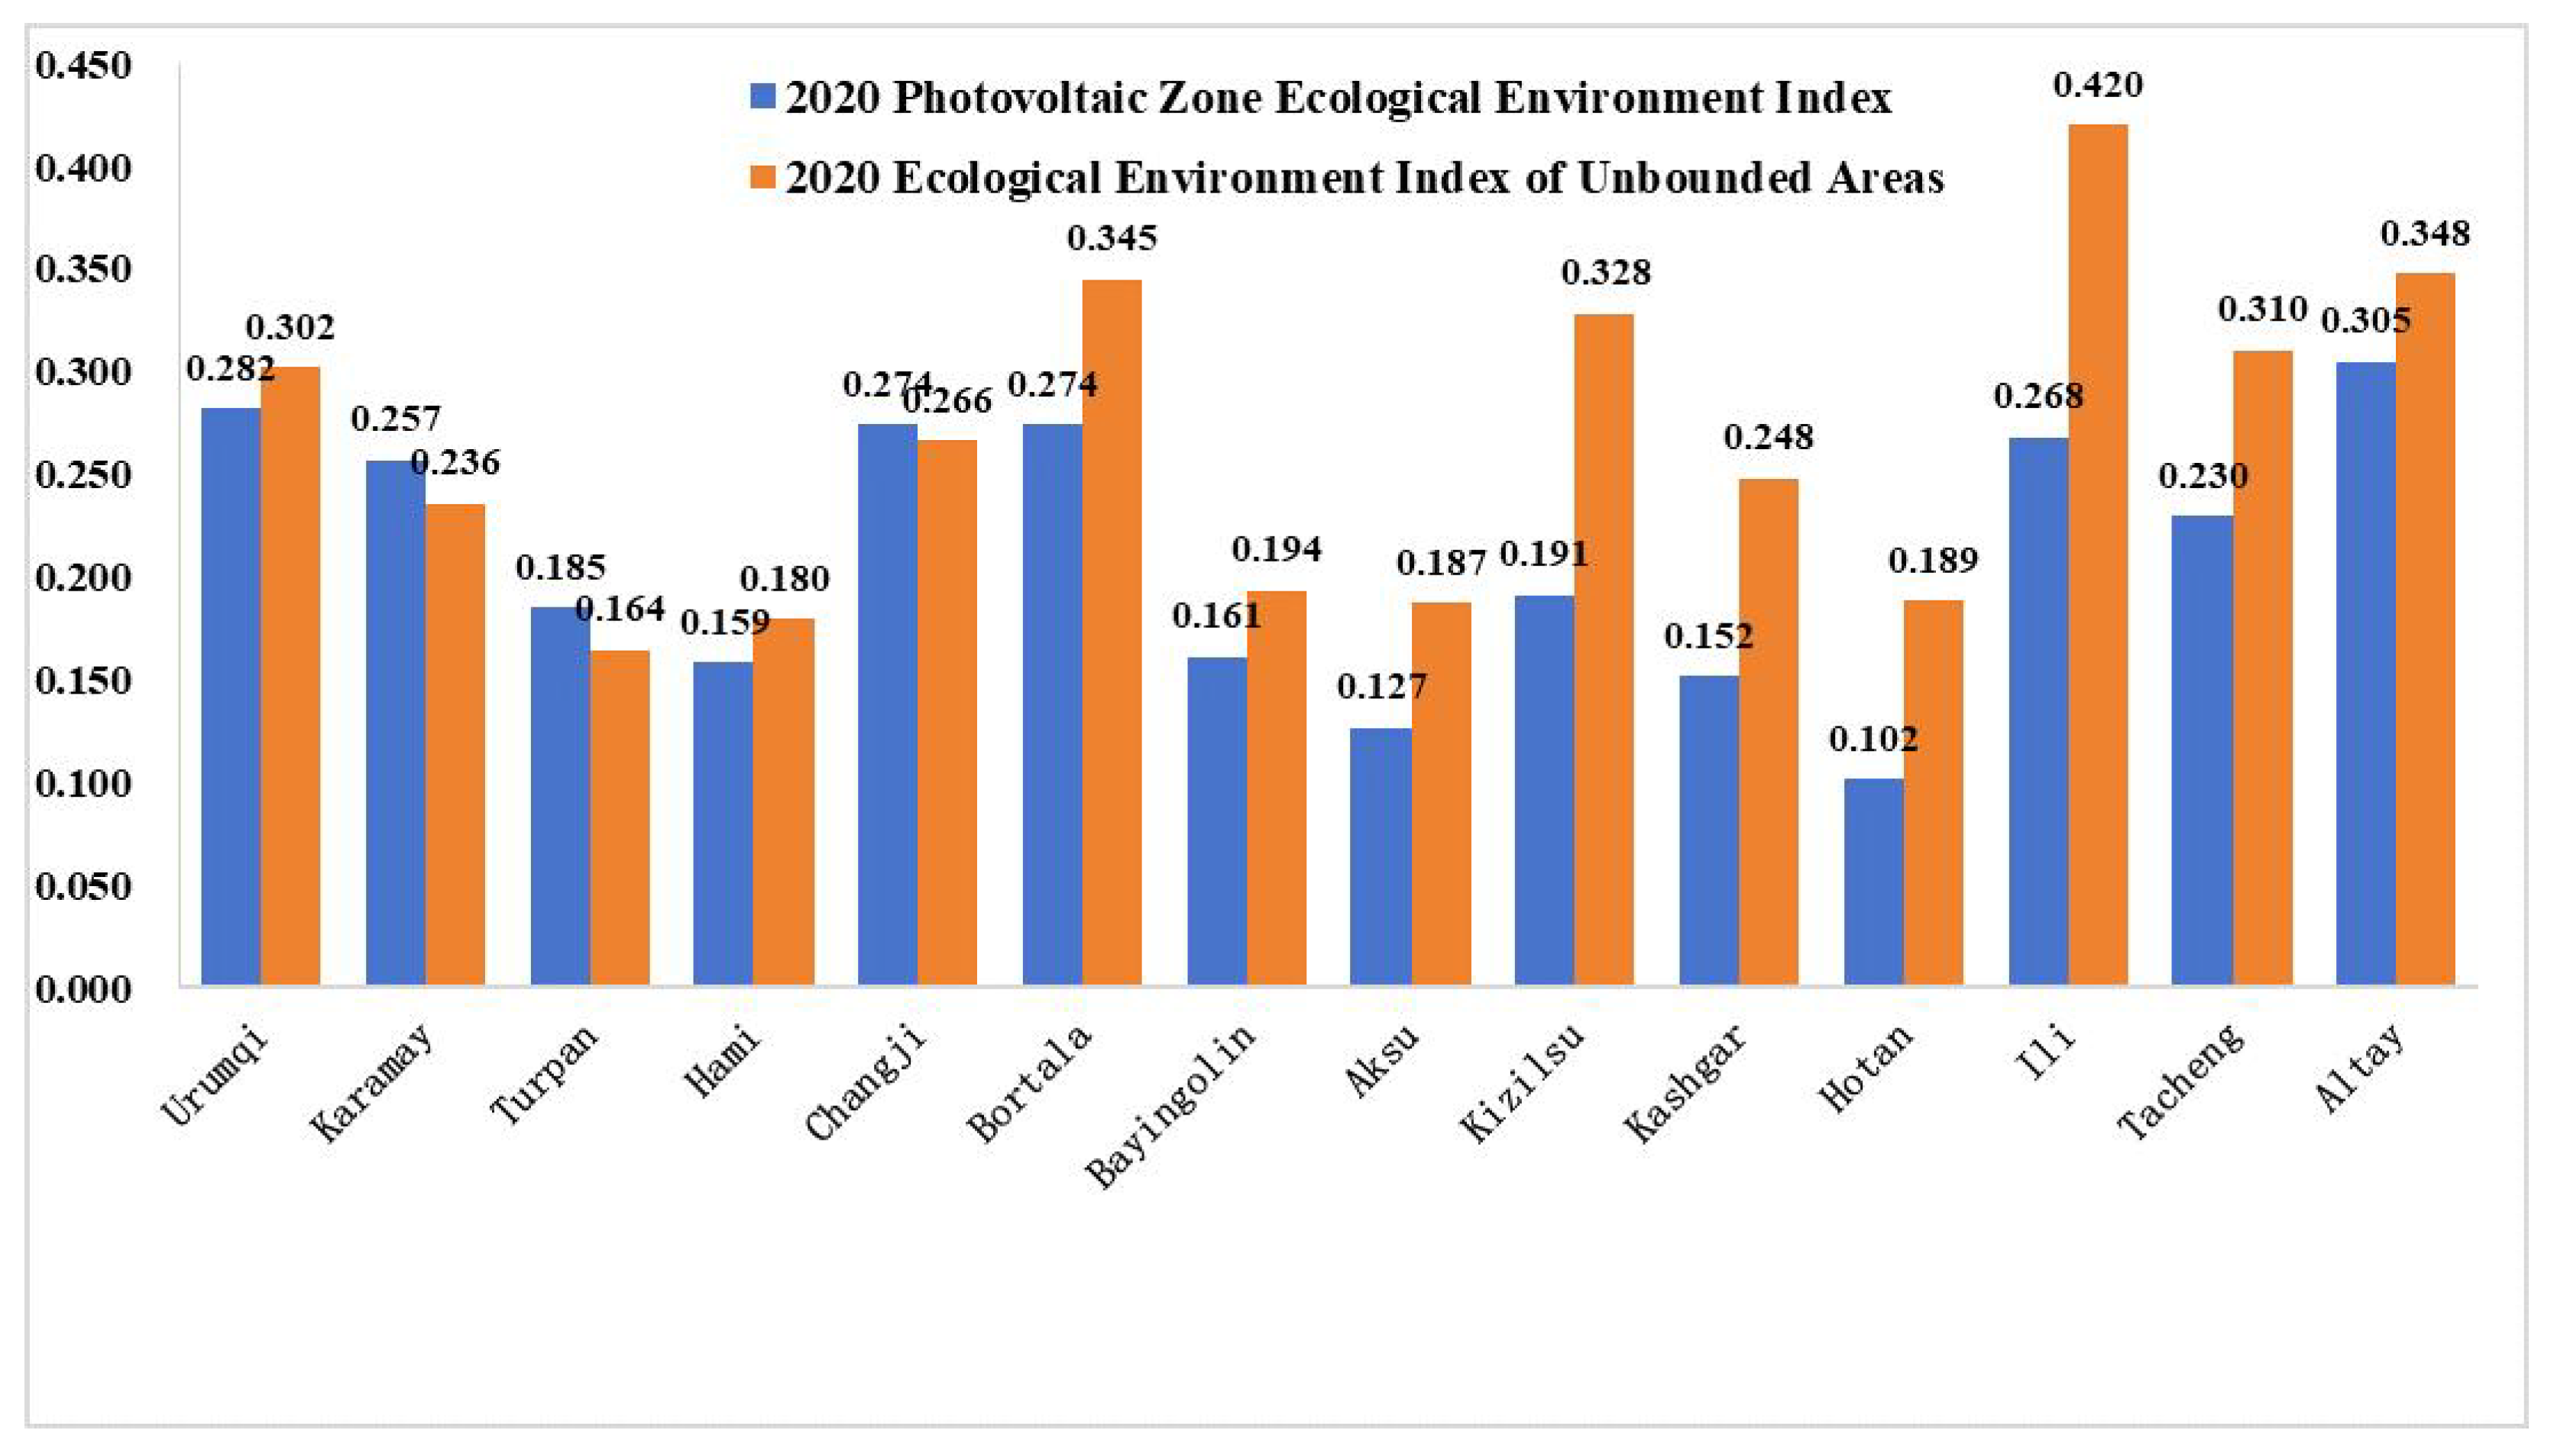
There are obvious spatial and temporal differences in the impact of PV equipment construction on the ecological environment of Xinjiang’s different regions. Comparing the ecological indices of PV construction areas in 2000 and 2020, the ecological environmental quality of PV areas in about 80% (11 regions) of the prefectures improved, e.g., the improvement in Turpan City and Karamay City is particularly significant. However, there are also three regions where the ecological quality of PV construction zones declined, requiring sustainable development strategies and ecological restoration recommendations. In terms of spatial distribution, the highest ecological environment index of PV construction zones in 2020 was found in the Altay region (0.30) in the northern border regions, while the lowest was found in the Hotan region (0.10) in the southern border regions. The areas with better ecological environmental quality in PV construction zones are mostly concentrated in northern Xinjiang, while those with worse quality are concentrated in southern Xinjiang.
This study provides a new perspective and empirical evidence regarding the impact of PV equipment construction on the ecological environment in Xinjiang. The results of this study show that 80% of the prefectures gained ecological benefits from PV construction, indicating that PV construction is a win–win solution for both energy and the environment in most of the prefectures in Xinjiang. Through rational PV construction and planning, the future development of the PV industry can be encouraged to realize positive techno-ecological synergies.

Author Contributions

Conceptualization, B.D. and J.W.; Methodology, L.D.; Investigation, B.D. and C.L.; Resources, J.W. and X.Z.; Data curation, W.G. and H.Z.; Writing—original draft, L.D. and J.Z.; Writing—review and editing, H.W. and L.G. All authors have read and agreed to the published version of the manuscript.

Funding

This study was funded by the National Natural Science Foundation of China program (42461036).

Data Availability Statement

The data are derived from public domain resources.

Conflicts of Interest

The authors declare no conflicts of interest.

References

  1. Zareie, Z.; Ahmadi, R.; Asadi, M. A comprehensive numerical investigation of a branch-inspired channel in roll-bond type PVT system using design of experiments approach. Energy 2024, 286, 129452. [Google Scholar] [CrossRef]
  2. Ren, D.F.; Guo, X.P. The economic use of centralized photovoltaic power generation—Grid connection, hydrogen production or energy storage? J. Energy Storage 2025, 106, 114829. [Google Scholar] [CrossRef]
  3. Shang, X.W.; Wang, Y.Z.; Huo, Y.; Shi, Z.; Li, H.; Zhang, H.; Guo, H.; Xiao, Z. Climate ecological impact mechanism and vegetation restoration modes of desert photovoltaic power stations. Sci. Soil Water Conserv. 2025, 23, 10–20. [Google Scholar]
  4. Rehman, H.U.; Hussain, A.; Haider, W.; Ali, S.A.; Kazmi, S.A.A.; Huzaifa, M. Optimal Planning of Solar Photovoltaic (PV) and Wind-Based DGs for Achieving Techno-Economic Objectives across Various Load Models. Energies 2023, 16, 2444. [Google Scholar] [CrossRef]
  5. Liang, Y.; Rahman, S.U.; Shafaqat, A.; Ali, A.; Ali, M.S.E.; Khan, H. Assessing sustainable development in E-7 countries: Technology innovation, and energy consumption drivers of green growth and environment. Sci. Rep. 2024, 14, 28636. [Google Scholar] [CrossRef]
  6. Kaldellis, J.K.; Kapsali, M.; Kavadias, K.A. Temperature and wind speed impact on the efficiency of PV installations. Experience obtained from outdoor measurements in Greece. Renew. Energy 2014, 66, 612–624. [Google Scholar]
  7. Zhang, H.; Yu, Z.; Zhu, C.; Yang, R.; Yan, B.; Jiang, G. Green or not? Environmental challenges from photovoltaic technology. Environ. Pollut. 2023, 320, 121066. [Google Scholar] [CrossRef]
  8. Li, P.D.; Gao, X.Q. The impact of photovoltaic power plants on ecological environment and climate: A literature review. Plateau Meteorol. 2021, 40, 702–710. [Google Scholar]
  9. Liu, Y.; Zhang, R.Q.; Huang, Z.; Cheng, Z.; López-Vicente, M.; Ma, X.R.; Wu, G.L. Solar photovoltaic panels significantly promote vegetation recovery by modifying the soil surface microhabitats in an arid sandy ecosystem. Land. Degrad. Dev. 2019, 30, 2177–2186. [Google Scholar] [CrossRef]
  10. Gao, X.Q.; Yang, L.W.; Lyu, F.; Ma, L.; Li, H.; Hui, X.; Hu, X. Observational Study on the Impact of the Large Solar Farm on Air Temperature and Humidity in Desert Areas of Golmud. Acta Energ. Sol. Sin. 2016, 37, 2909–2915. [Google Scholar]
  11. Broadbent, A.M.; Krayenhoff, E.S.; Georgescu, M. The observed effects of utility-scale photovoltaics on near-surface air temperature and energy balance. J. Appl. Meteorol. Climatol. 2019, 58, 989–1006. [Google Scholar] [CrossRef]
  12. Elminshawy, N.A.S.; Osama, A.; Gagliano, A. A technical and economic evaluation of floating photovoltaic systems in the context of the water-energy nexus. Energy 2024, 303, 131904. [Google Scholar] [CrossRef]
  13. Chen, X.; Gao, Y.; Zhai, B.; Liu, X.; Cheng, B. Transport of wind-drift sand in photovoltaic electric field in sand area. Arid. Zone Res. 2019, 36, 684–690. [Google Scholar]
  14. Pratt, R.N.; Kopp, G.A. Velocity measurements around low-profile, tilted, solar arrays mounted on large flat-roofs, for wall normal wind directions. J. Wind. Eng. Ind. Aerodyn. 2013, 123, 226–238. [Google Scholar] [CrossRef]
  15. Mahmud, M.A.P.; Huda, N.; Farjana, S.H.; Lang, C. Environmental impacts of solar-photovoltaic and solar-thermal systems with life-cycle assessment. Energies 2018, 11, 2346. [Google Scholar] [CrossRef]
  16. Lambert, Q.; Bischoff, A.; Cueff, S.; Cluchier, A.; Gros, R. Effects of solar park construction and solar panels on soil quality, microclimate, CO2 effluxes, and vegetation under a Mediterranean climate. Land Degrad. 2021, 32, 5190–5202. [Google Scholar] [CrossRef]
  17. Zhang, C.C.; Zhang, W.F.; Dong, Z.J.; Zhan, X. Impact of photovoltaic arrays on microclimate in desert areas under the background of carbon neutral. J. Gansu Agric. Univ. 2023, 59, 228–236+245. [Google Scholar]
  18. Chen, H.; Wu, W.; Li, C.; Lu, G.; Ye, D.; Ma, C.; Ren, L.; Li, G. Ecological and environmental effects of global photovoltaic power plants: A meta-analysis. J. Environ. Manag. 2025, 373, 123785. [Google Scholar] [CrossRef]
  19. Wang, Z.Y.; Wang, J.; Gao, Y.; Dang, X.H.; Meng, Z.J. Impact of photovoltaic power station construction on ecological environment in sandy area. Bull. Soil Water Conserv. 2019, 39, 191–196. [Google Scholar]
  20. Fan, X.; Wang, W.; Shi, R. Hybrid pluripotent coupling system with wind and photovoltaic-hydrogen energy storage and the coal chemical industry in Hami, Xinjiang. Renew. Sustain. Energy Rev. 2017, 72, 950–960. [Google Scholar] [CrossRef]
  21. Li, G.; Li, M.; Taylor, R.; Hao, Y.; Besagni, G.; Markides, C. Solar energy utilisation: Current status and roll-out potential. Appl. Therm. Eng. 2022, 209, 118285. [Google Scholar] [CrossRef]
  22. Cheng, G.S.; Luo, E.C.; Zhao, Y.; Yang, Y.; Chen, B.; Cai, Y.; Wang, X.; Dong, C. Analysis and prediction of green hydrogen production potential by photovoltaic-powered water electrolysis using machine learning in China. Energy 2023, 284, 29302. [Google Scholar] [CrossRef]
  23. Li, Y.; Kalnay, E.; Motesharrei, S.; Rivas, J.; Kucharski, F.; Kirk-Davidoff, D.; Bach, E.; Zeng, N. Climate model shows large-scale wind and solar farms in the Sahara increase rain and vegetation. Science 2018, 361, 1019–1022. [Google Scholar] [CrossRef] [PubMed]
  24. Yue, X.; Zhang, L.X.; Zhou, D.C. Spatio-temporal evolution and driving factors of ecological vulnerability in arid and semi-arid typical ecologically fragile areas. Environ. Ecol. 2023, 5, 1–9+14. [Google Scholar]
  25. Xu, H.Q. Creation and application of urban remote sensing ecological index. Acta Ecol. Sin. 2013, 33, 7853–7862. [Google Scholar]
  26. Huang, C.; Wylie, B.; Yang, L. Derivation of a tasselled cap transformation based on Landsat 7 at-satellite reflectance. Int. J. Remote Sens. 2002, 23, 1741–1748. [Google Scholar] [CrossRef]
  27. Chander, G.; Markham, B.L.; Helder, D.L. Summary of current radiometric calibration coefficients for Landsat MSS, TM, ETM+, and EO-1 ALI sensors. Remote Sens. Environ. 2009, 113, 893–903. [Google Scholar] [CrossRef]
  28. Nichol, J. Remote sensing of urban heat islands by day and night. Photogramm. Eng. Remote Sens. 2005, 71, 613–621. [Google Scholar]
  29. Xu, H. A new index for delineating built-up land features in satellite imagery. Int. J. Remote Sens. 2008, 29, 4269–4276. [Google Scholar] [CrossRef]
  30. Rikimaru, A.; Roy, P.S.; Miyatake, S. Tropical forest cover density mapping. Trop. Ecol. 2002, 43, 39–47. [Google Scholar]
  31. Chang, R.; Luo, Y.; Zhu, R. Simulated local climatic impacts of large-scale photovoltaics over the barren area of Qinghai, China. Renew. Energy 2020, 145, 478–489. [Google Scholar] [CrossRef]
  32. Yang, J.Y.; Tian, W.; Pan, X.Y. Ecological quality assessment of Xiongan New Area based on remote sensing ecological index. Chin. J. Appl. Ecol. 2019, 30, 277–284. [Google Scholar]
  33. Xu, Z.; Li, Y.; Qin, Y.; Bach, E. A global assessment of the effects of solar farms on albedo, vegetation, and land surface temperature using remote sensing. Sol. Energy 2024, 268, 112198. [Google Scholar] [CrossRef]
  34. Xia, Z.; Li, Y.; Guo, S. Satellites reveal spatial heterogeneity in dryland photovoltaic plants’ effects on vegetation dynamics. Earth’s Future 2024, 12, e2024EF004427. [Google Scholar] [CrossRef]
  35. Tahri, M.; Hakdaoui, M.; Maanan, M. The evaluation of solar farm locations applying Geographic Information System and Multi-Criteria Decision-Making methods: Case study in southern Morocco. Renew. Sustain. Energy Rev. 2015, 51, 1354–1362. [Google Scholar] [CrossRef]
  36. Günen, M.A. Determination of the suitable sites for constructing solar photovoltaic (PV) power plants in Kayseri, Turkey using GIS-based ranking and AHP methods. Environ. Sci. Pollut. Res. 2021, 28, 57232–57247. [Google Scholar] [CrossRef]
  37. Xia, Z.; Li, Y.; Chen, R.; Sengupta, D.; Guo, X.; Xiong, B.; Niu, Y. Mapping the rapid development of photovoltaic power stations in northwestern China using remote sensing. Energy Rep. 2022, 8, 4117–4127. [Google Scholar] [CrossRef]
  38. Kim, J.Y.; Koide, D.; Ishihama, F.; Kadoya, T.; Nishihiro, J. Current site planning of medium to large solar power systems accelerates the loss of the remaining semi-natural and agricultural habitats. Sci. Total Environ. 2021, 779, 146475. [Google Scholar] [CrossRef]
  39. Zhang, L.; Li, X.; Liu, X.; Lian, Z.; Zhang, G.; Liu, Z.; An, S.; Ren, Y.; Li, Y.; Liu, S. Dynamic monitoring and drivers of ecological environmental quality in the Three-North region, China: Insights based on remote sensing ecological index. Ecol. Inform. 2025, 85, 102936. [Google Scholar] [CrossRef]
  40. Zhang, Y.; She, J.; Long, X.; Zhang, M. Spatio-temporal evolution and driving factors of eco-environmental quality based on RSEI in Chang-Zhu-Tan metropolitan circle, central China. Ecol. Indic. 2022, 144, 109436. [Google Scholar] [CrossRef]
  41. Wu, C.; Liu, H.; Yu, Y. Ecohydrological effects of photovoltaic solar farms on soil microclimates and moisture regimes in arid Northwest China: A modeling study. Sci. Total Environ. 2022, 802, 149946. [Google Scholar] [CrossRef] [PubMed]
  42. Luo, L.; Zhuang, Y.; Liu, H.; Zhao, W.; Chen, J.; Du, W.; Gao, X. Environmental impacts of photovoltaic power plants in northwest China. Sustain. Energy Technol. Assess. 2023, 56, 103120. [Google Scholar] [CrossRef]
  43. Wang, T. Study on the influence of photovoltaic power station construction on soil and vegetation in Jingbian County. Master’s Thesis, Northwest A&F University, Yangling, China, 2015. [Google Scholar]
  44. Cui, Y.Q.; Fu, Q.; Sun, J.H.; Xiao, J. A Review of Revegetation Patterns of Photovoltaic Plant in Northwest China. Bull. Soil Water Conserv. 2017, 37, 200–203. [Google Scholar]
  45. Li, C.; Fu, B.; Wang, S. Drivers and impacts of changes in China’s drylands. Nat. Rev. Earth Environ. 2021, 2, 858–873. [Google Scholar] [CrossRef]
  46. Liu, S.H.; Gao, Q.; Wang, X.Q. Characteristics of vegetation and soil changes in alpine desert steppe under the interference of photovoltaic power plants. J. Soil Water Conserv. 2016, 30, 325–329. [Google Scholar]
Figure 1. Schematic diagram of the study area.
Land 14 01294 g001
Figure 2. Spatial distribution of PV equipment in Xinjiang.
Land 14 01294 g002
Figure 3. Analysis of land use types for PV equipment in Xinjiang.
Land 14 01294 g003
Figure 4. Remote sensing ecosystem index, 2000–2020.
Land 14 01294 g004
Figure 5. Spatial distribution of changes in ecological environment index in Xinjiang PV construction areas.
Land 14 01294 g005
Figure 6. Comparison of ecological environment indexes before and after PV construction in different states of Xinjiang.
Land 14 01294 g006
Figure 7. Comparison of ecological environment indexes among Xinjiang prefectures.
Land 14 01294 g007
Figure 8. Ecological environment index of Xinjiang prefectures in 2000.
Land 14 01294 g008
Figure 9. Ecological environment index of Xinjiang prefectures in 2020.
Land 14 01294 g009
Table 1. MODIS data resources involved in the calculations.
DatasetSatelliteSensingResolution Parameters Involved
MODIS/061/MOD09A1TerraMODIS500 msur_refl_b01–sur_refl_b07
MODIS/061/MOD11A1TerraMODIS500 mDaily surface temperature (LST) and emissivity values
Disclaimer/Publisher’s Note: The statements, opinions and data contained in all publications are solely those of the individual author(s) and contributor(s) and not of MDPI and/or the editor(s). MDPI and/or the editor(s) disclaim responsibility for any injury to people or property resulting from any ideas, methods, instructions or products referred to in the content.

