Article

A Framework for Multifunctional Green Infrastructure Planning Based on Ecosystem Service Synergy/Trade-Off Analysis: Application in the Qinling–Daba Mountain Area

1
College of Public Administration, Central China Normal University, Wuhan 430079, China
2
Department of Land Resource Management, School of Public Administration, China University of Geosciences, Wuhan 430074, China
3
Southasia Institute of Advanced Studies, Kathmandu 44600, Nepal
4
Nepal Mountain Academy, Tribhuvan University, Kathmandu 44613, Nepal
5
School of Management, Wuhan Institute of Technology, Wuhan 430205, China
*
Author to whom correspondence should be addressed.
Land 2025, 14(6), 1287; https://doi.org/10.3390/land14061287
Submission received: 9 April 2025 / Revised: 30 May 2025 / Accepted: 13 June 2025 / Published: 16 June 2025

Abstract

The multifunctionality of green infrastructure (GI) can be enhanced through intentional planning that promotes synergies among various functions while minimizing trade-offs. Despite its significance, methodologies for implementing this approach remain underexplored. This paper presents an application-oriented framework for GI planning that emphasizes the relationship between GI functional performance and the provision of ecosystem services. By reframing the issues of multifunctional synergies and trade-offs as quantifiable and spatially explicit problems associated with ecosystem services, the framework offers both a conceptual foundation and technical protocols for practical application. This framework was implemented in the Qinling–Daba Mountain Area (QDMB) in China to evaluate its practicality and identify potential challenges. The planned GI system aims to fulfill multiple functions, including biodiversity maintenance, water and soil conservation, eco-farming, and ecotourism development. Additionally, 73 wildlife corridors were established to connect GI elements, thereby enhancing habitat services for biodiversity. Furthermore, the analysis identified 245 townships and 273 sites as strategic areas and points requiring targeted intervention to mitigate potential multifunctional trade-offs. These locations are characterized by their location within protected areas, protected buffer zones, or wildlife corridors, or at the intersection of wildlife corridors with existing transportation infrastructure. The findings validate the framework’s practicality and highlight the necessity for additional research into the capacity of GI to support diverse human activities and the approaches to enhance GI elements’ connectivity for multifunctionality.

1. Introduction

Green infrastructure (GI) has emerged as a widely adopted planning approach to guide spatial development for sustainability since the 1990s [1,2]. Both the World Bank and the Intergovernmental Panel on Climate Change (IPCC) recognize the important role of GI in enhancing urban and rural resilience to climate change [3,4]. The European Union promotes GI as a key strategy to achieve its 2030 biodiversity targets. Many European countries and cities have adopted GI solutions in response to climate change and environmental degradation, recognizing benefits such as increased resilience to floods and urban heat, improved air and water quality [5]. In the United States, the Environmental Protection Agency (EPA) emphasizes efforts at the federal and state levels to integrate green infrastructure into stormwater management, urban planning, and climate resilience initiatives. The EPA also provides various toolkits to support the planning and implementation of green infrastructure for multiple objectives [6].
The European Commission defines GI as a network of natural and semi-natural areas, features, and green spaces that can be found in urban, rural, terrestrial, freshwater, marine, and coastal environments [5]. This network includes individual GI elements and the corridors that connect them. As a result, the terms “GI system” and “GI network” are often used interchangeably with GI. In addition, related terms such as natural infrastructure, nature-based solutions, nature-based climate solutions, and low-impact development are frequently used in similar contexts [2]. However, these concepts differ in important ways from GI. Unlike approaches that focus on specific asset types, GI encompasses natural, semi-natural (enhanced), and engineered systems, providing a comprehensive framework for integrating diverse asset types (see Figure 1).
Early GI planning programs primarily emphasized their ecological function in biodiversity conservation; however, the recognition of GI’s potential to fulfill multiple functions has gradually increased. These functions encompass biodiversity conservation, the promotion of human health and well-being, climate change mitigation and adaptation, soil and water conservation, food production, and support for the development of a green economy [7,8,9,10,11]. Despite two decades of discussion, the multifunctional potential of GI is often assessed only after GI elements are installed, rather than being adequately considered during the planning, design, and construction phases. Intentional planning and design for the multifunctionality of GI systems remain challenging [8,12,13,14].
Encouragingly, a growing body of research is dedicated to addressing this issue from various perspectives. For instance, Hansen and Pauleit [13] propose a social–ecological framework for assessing GI multifunctionality, focusing on the relationships between ecosystem service (ES) supply, demand, and GI function. McPhearson et al. [15] advocate for proactive and systematic approaches to coordinate the various entities responsible for GI planning, design, and construction. Apfelbeck et al. and Karlsson et al. [16,17] emphasize the importance of interdisciplinary design teams and stakeholder involvement in wildlife-inclusive urban design. Cook et al. [8] established an element–objective matrix to discuss the coordination between GI elements and planning objectives for multifunctionality. Based on these studies, promoting multifunctional synergies and minimizing trade-offs is essential for enhancing multifunctionality; however, how to implement this approach remains a focus of ongoing discussion. While these studies often propose conceptual frameworks and approaches, they frequently lack empirical research to validate and test these frameworks or approaches.
Discussions on GI functions and planning in urban areas, particularly in cities and metropolitan regions, have attracted much attention [2,8,18,19]. However, the definition of GI highlights the necessity of studying it across various ecosystems and spatial scales [1,20,21]. The functions of GI at the urban and regional scales differ, which results in different approaches and techniques for its planning. At the urban level, GI primarily aims to improve the quality of the human living environment and enhance climate change resilience. This is achieved through the systematic integration of natural, semi-natural, and constructed elements to create interconnected networks [18,22,23,24]. For instance, urban GI mitigates the urban heat island effect through vegetation cover and water networks; it reduces flood risk through optimizing surface runoff management [23]; and it enhances human health and well-being through the creation of green space networks [19]. At the regional scale, the core function of GI shifts to maintaining ecological security of the large region and conserving biodiversity for sustainable development. The planning emphasizes spatial pattern optimization of natural/semi-natural elements to support the ecological processes. This involves strategies such as establishing ecological corridor networks across administrative boundaries to facilitate species migration, creating ecological buffers to limit the impact of human activities on natural landscapes, and supporting eco-tourism or eco-farming development to avoid degradation of natural and agricultural ecosystems [1,20,21].
The concept of ecosystem services (ESs) is frequently referenced in GI-related literature [8,13,14,15,18]. The relationship between ESs and GI is often articulated as follows: ESs are integral to GI, and GI serves as the unit for ES provision [1]. Some studies even equate GI functions with ESs [25]. Integrating GI and ES theories into a unified framework offers several potential benefits: (1) It enhances the understanding of the interrelations between social and ecological systems in GI planning, as ESs serve as a linkage between the two systems [13,15]. (2) It facilitates multifunctional synergy and trade-off analysis, given that many methods and software have been developed for ES assessment and valuation [14,15].
In light of the identified research gap and the benefits of integrating GI and ES research, we propose an application-oriented framework for multifunctional GI planning at the regional level. This framework aims to enhance the multifunctionality of the GI system by leveraging the interrelations between GI function performance and ES delivery. We implemented the framework in the Qinling–Daba Mountain Area to evaluate its effectiveness and discuss its strengths and challenges.

2. Framework Proposal

This section presents the conceptual framework and technical procedures of the proposed approach for GI planning aimed at enhancing its multifunctionality. The conceptual framework illustrates the goal of multifunctional GI planning, the pathway to attain this goal, and the key challenges that need to be addressed along the pathway. The technical procedure offers a detailed, step-by-step guide to implementing the framework within GI planning processes, ensuring systematic and effective application.

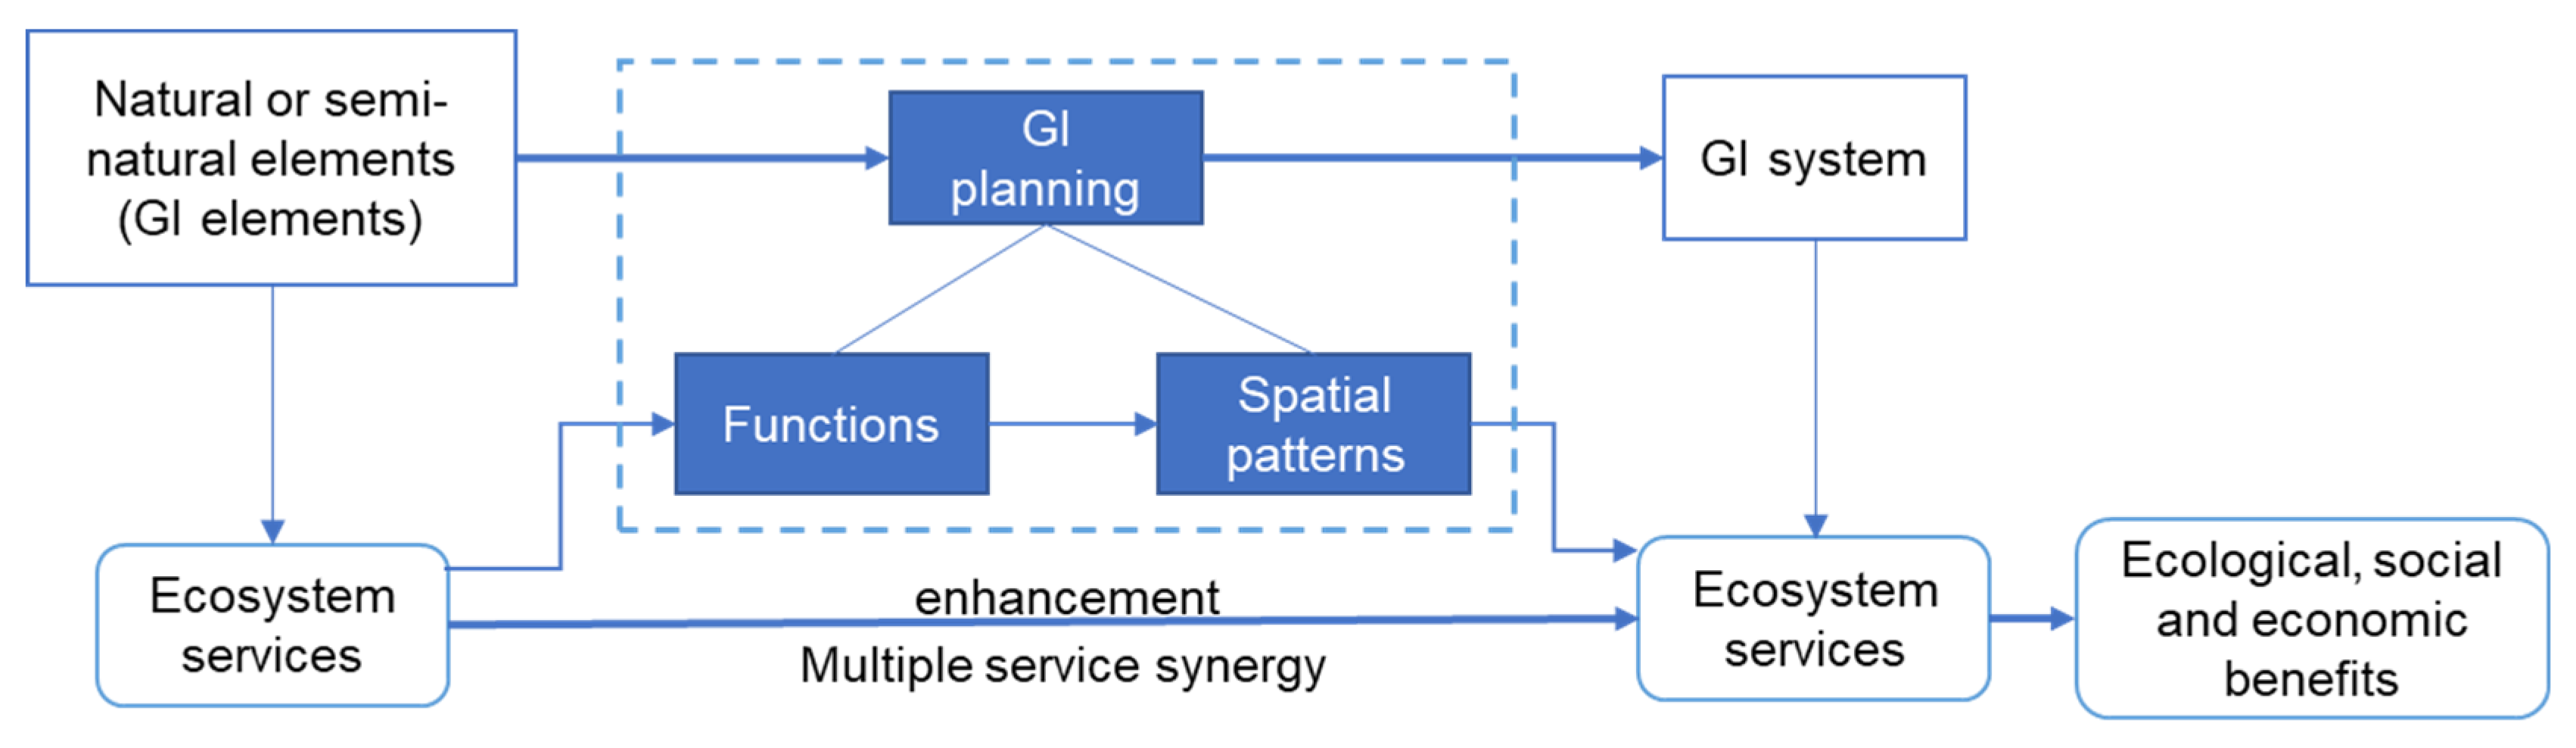
2.1. Conceptual Framework

Both single-function and multifunction-oriented GI planning aim to enhance the ESs provided by natural or semi-natural elements through the design of their spatial configuration. Additionally, multifunction-oriented GI planning seeks to enhance the multifunctionality of the GI system by encouraging synergies among multiple functions and services while reducing trade-offs [8,14].
Regional-level green infrastructure provides ecological, economic, and social benefits through functions such as water source conservation, soil and water retention, flood control and disaster mitigation, windbreak and sand fixation, habitat provision, and support for sustainable development. These functions rely on ESs supplied by natural or semi-natural elements; however, the provisioning of ESs by individual elements is limited in terms of spatial distribution and functional capacity, which challenges the realization of the multi-functionality inherent in GI systems. To address this, multi-functional GI planning involves the systematic integration of natural and semi-natural elements within the region, enhanced by artificial facilities, thereby establishing a multi-functional system [1,20,21]. During the planning process, particular attention should be given to coordinating two key types of ES relationships: (1) synergistic ESs, such as enhanced carbon sequestration through afforestation, which contributes to the multifunctionality of GI by simultaneously addressing climate change and improving air quality; and (2) competitive ESs, such as the trade-off between agricultural production and wildlife habitat preservation, where dominant function planning, prioritizing either intensive cultivation or ecological conservation in specific zones, can help mitigate land–use conflicts (see Figure 2).
The focus of Green Infrastructure (GI) system planning is on how to assemble natural and semi-natural elements to enhance ESs and promote multifunctional synergies. Addressing this challenge requires a thorough understanding of the relationship between the ESs provided by these elements and the functions of the GI system. Specifically, two key questions must be answered:
  • How do the ESs provided by natural or semi-natural elements support the functional performance of the GI system?
  • How does the functional performance of the GI system impact the delivery of ESs, particularly in terms of fostering multiple ES synergies or trade-offs?
The first question can be addressed through ES assessments, which aid in identifying GI elements and their potential functions. The second question informs whether a GI element should be planned for multifunctionality.

2.2. Technical Procedure

The technical procedure for multifunctional GI planning is proposed based on the conceptual framework and composed of six steps as follows.
Step 1: Determine the planning functions of the GI system;
Step 2: Analyze the interrelations between the performance of planning functions and the delivery of ESs;
Step 3: Assess and map the ESs relevant to the planning functions of the GI system;
Step 4: Identify GI elements based on the ES assessment and plan their functions in accordance with the principle of promoting synergy among multiple ESs and functions;
Step 5: Analyze the connectivity of GI elements and map the GI network to enhance ES provision;
Step 6: Identify strategic areas or points that are vulnerable to multifunctional trade-offs and propose strategies to mitigate these trade-offs.
The following section will elaborate on the technical procedure using a case study from the Qinling–Daba Mountain Area to evaluate feasibility and identify challenges.

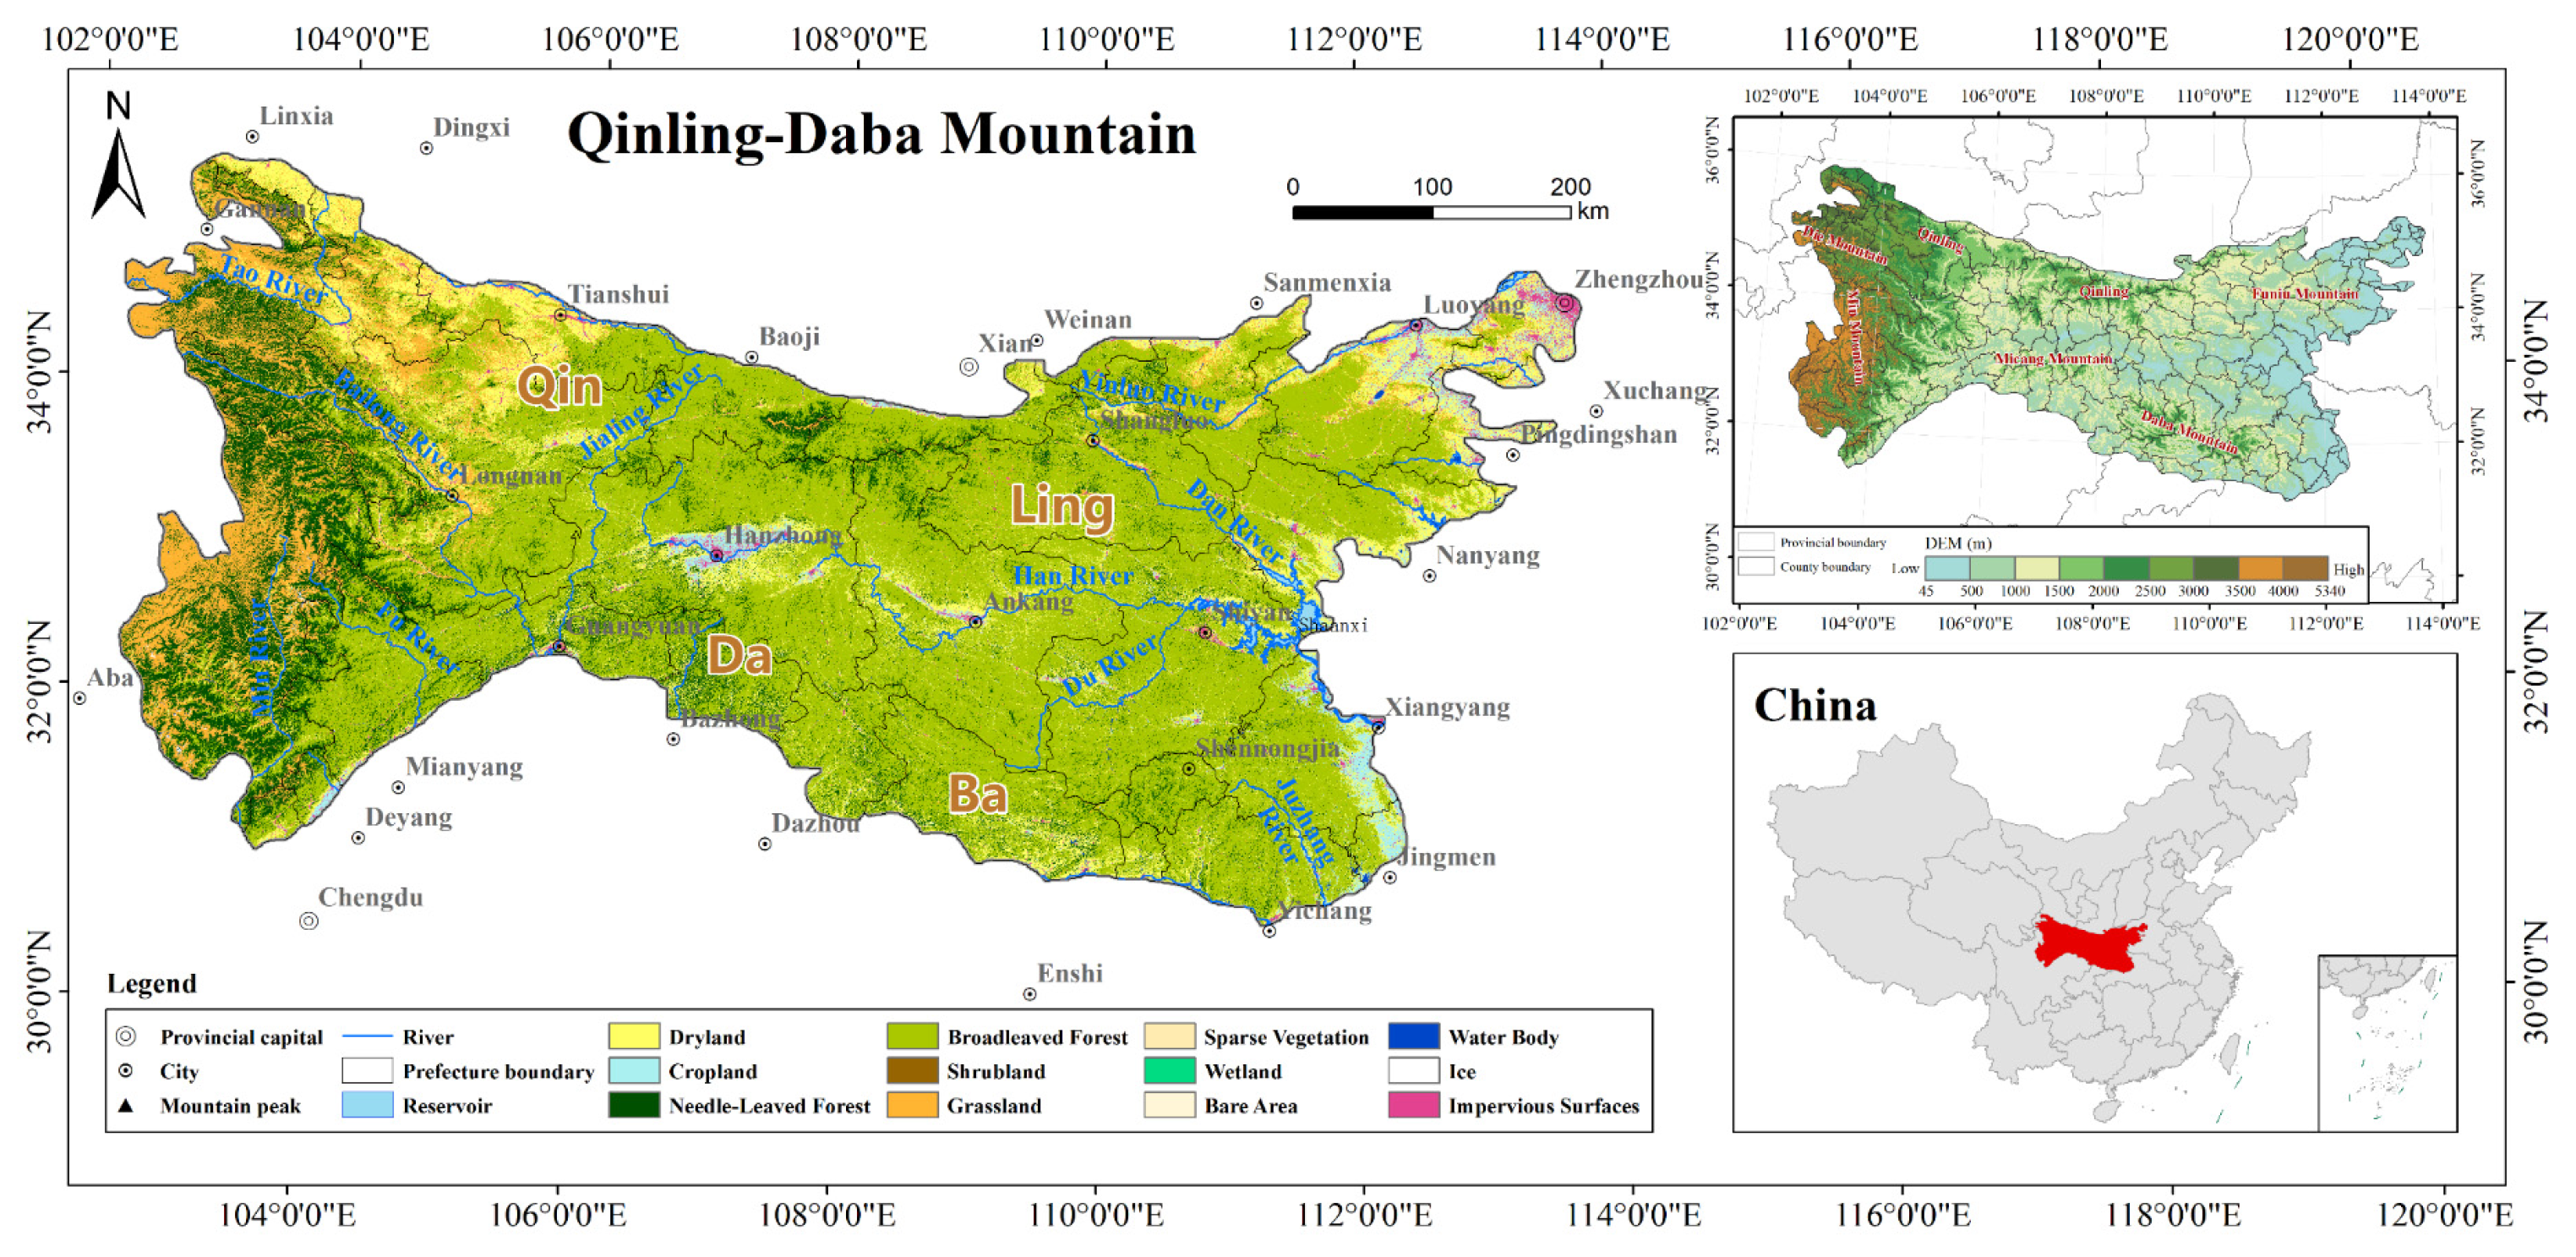
3. Case Study in Qinling–Daba Mountain Area, China

3.1. Study Area and Materials

The Qinling–Daba Mountain Area (QBMA) is located in central China, including parts of Gansu, Shaanxi, Henan, Hubei, Sichuan Province, and Chongqing City, and covers an area of over 300,000 km2 (Figure 3). It is the transitional area of the warm temperate and subtropical zones, where mountains and hills are the prominent landforms, and basins are only scattered in a few places. Because of the specific climate and terrain features, the QBMA is characterized by ecosystem diversity and biodiversity. It is one of China’s NKEFAs that performs critical functions of wildlife conservation, water retention, regulation, and soil conservation. Forests are the dominant ecosystem in the study area, accounting for more than 70 percent of the area.
Except for the above natural features, the QBMA was one of China’s 14 contiguous areas of deep poverty. Although people’s livelihoods have been greatly improved through China’s Poverty Alleviation Project, the area still faces great challenges for ecosystem protection and socioeconomic development. The mountainous terrain limits agricultural and industrial development, but the area is rich in natural reserves, forest parks, scenic spots, and cultural relics, allowing it to develop ecotourism.
Table 1 summarizes the data used for this study and their sources. All datasets were projected to the same coordinate system (WGS_1984_UTM_Zone_49N) and resampled to 1 km × 1 km resolution for ES valuation and GI planning.

3.2. Framework Implementation

3.2.1. Planning Function Determination

The planning functions of the GI system vary across different regions and programs. The initial step in multifunctional GI planning is to clarify these functions. In the QBMA, the study identifies the expected functions of the GI system based on environmental and socioeconomic planning developed and published by government agencies.
Firstly, the QBMA is recognized as one of China’s National Key Ecological Function Areas (NKEFAs) for biodiversity conservation. Maintaining biodiversity is the primary function that the GI system is expected to perform in this region. Additionally, QBMA serves as a crucial strategic water source area in China, facing ecological challenges, such as water erosion and soil degradation. Therefore, the GI system is also anticipated to play a vital role in water and soil conservation [28]. Furthermore, QBMA has historically been one of China’s spatially contiguous deep poverty areas. Developing the economy and improving people’s livelihoods remain priorities for the region. Eco-farming and ecotourism are significant strategies aimed at alleviating poverty while fostering economic development [29,30]. Both strategies leverage the region’s mountainous landscapes and ecological resources, effectively combining nature conservation with sustainable development. The success of eco-farming and ecotourism is closely linked to the GI system, particularly its semi-natural components.
Based on the analysis above, the GI system is anticipated to perform four key functions: maintaining biodiversity, conserving water and soil, and supporting the development of eco-farming and ecotourism. The first two functions aim to achieve ecological benefits, while the latter two primarily target social and ecological advantages. The prioritization of these functions can be ranked as follows: biodiversity conservation > water and soil conservation > eco-farming and ecotourism development.

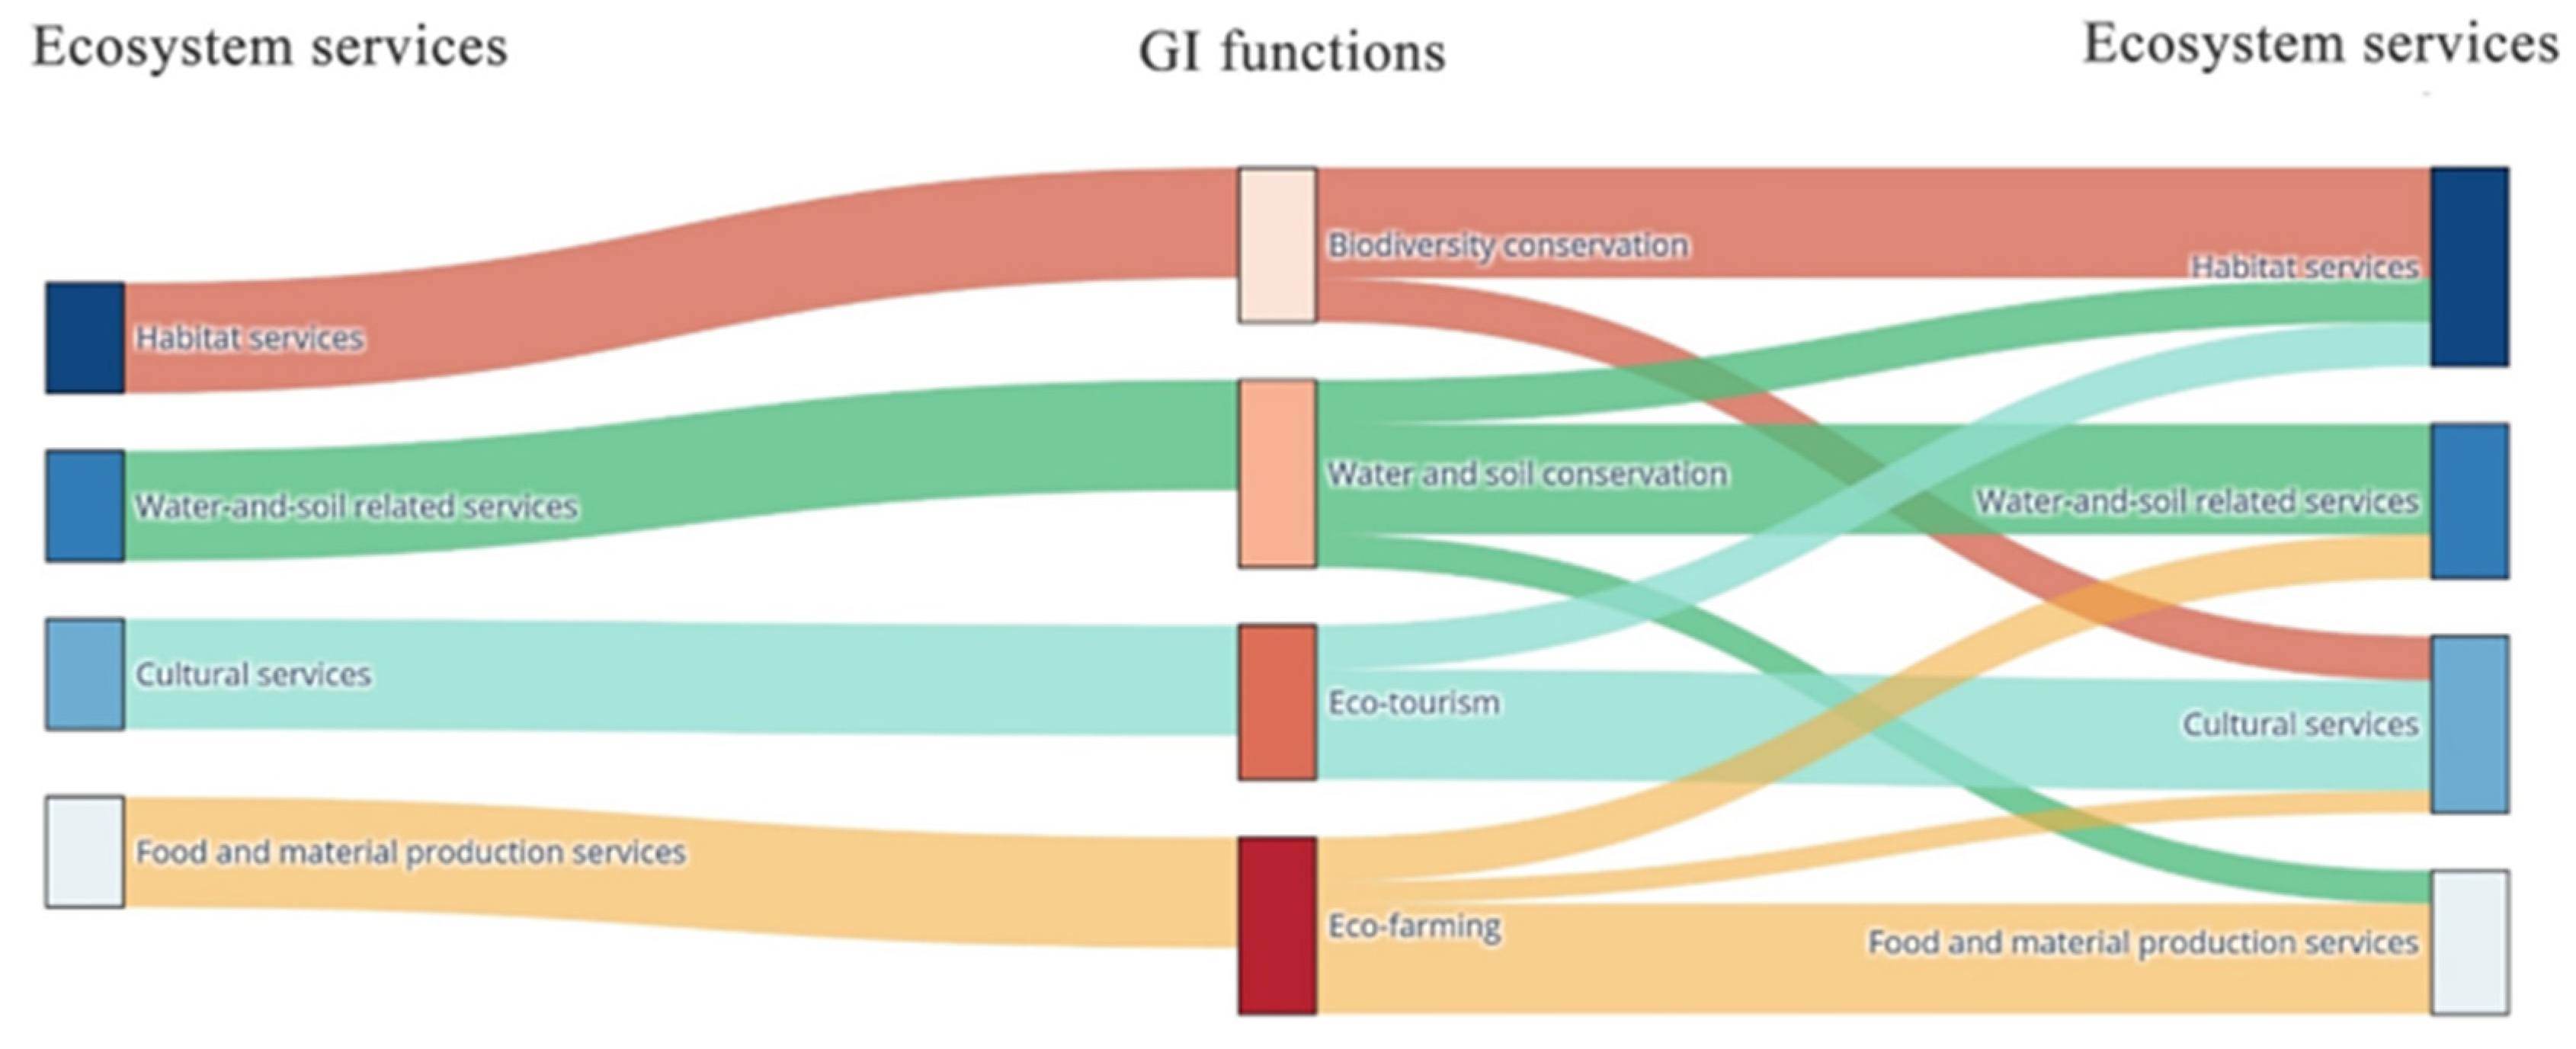
3.2.2. Interrelation Analysis Between GI Function Performance and ES Delivery

A matrix linking the four categories of ESs with the four planning functions of the GI system has been developed. This matrix facilitates the analysis of their relationships from two perspectives: (1) how ESs support the performance of these functions, and (2) how the performance of these functions can give rise to ES synergies or trade-offs. The first perspective assists in identifying GI elements, while the second informs whether a GI element should be planned for multifunctionality (see Figure 4).
Biodiversity is directly dependent on the habitat services (HES) provided by ecosystems. Sufficient and stable habitats for wild plants and animals form the foundation of biodiversity. By performing the biodiversity conservation function, GI enhances the habitat services of ecosystems. This enhancement, in turn, promotes the cultural services of habitats, particularly in terms of their value for scientific research and education.
The water and soil conservation function relies on water–soil-related ecosystem services (WSES), such as water storage, hydrological regulation, erosion prevention, and soil fertility maintenance. Excessive water erosion threatens wildlife and undermines the production of agricultural and forest products, resulting in the loss of both habitat and food production services. By conserving water and soil, GI elements can foster synergies among habitat, water–soil-related, and food production services.
Ecotourism involves sustainable and responsible travel to natural areas, aiming to conserve local and surrounding environments, support local communities, and promote cultural heritage. Its development primarily depends on the cultural ecosystem services (CES) provided by ecosystems. Ecotourism educates tourists about the significance of protecting biodiversity and natural habitats, thereby enhancing both HES and CES of ecosystems.
The farming function is fundamentally linked to the food and material production services (FMPES) provided by ecosystems. Although large-scale farming, especially through deforestation, can boost food production, it often harms other ESs. In contrast, eco-farming techniques integrate modern science with a commitment to nature and biodiversity. For instance, terracing, a method used in the mountainous regions of China, helps prevent soil erosion, conserve water, and enhance agricultural yields. This practice also creates unique landscapes that attract agricultural tourism. Therefore, eco-farming has the potential to harmonize WSES, FMPES, and CES.

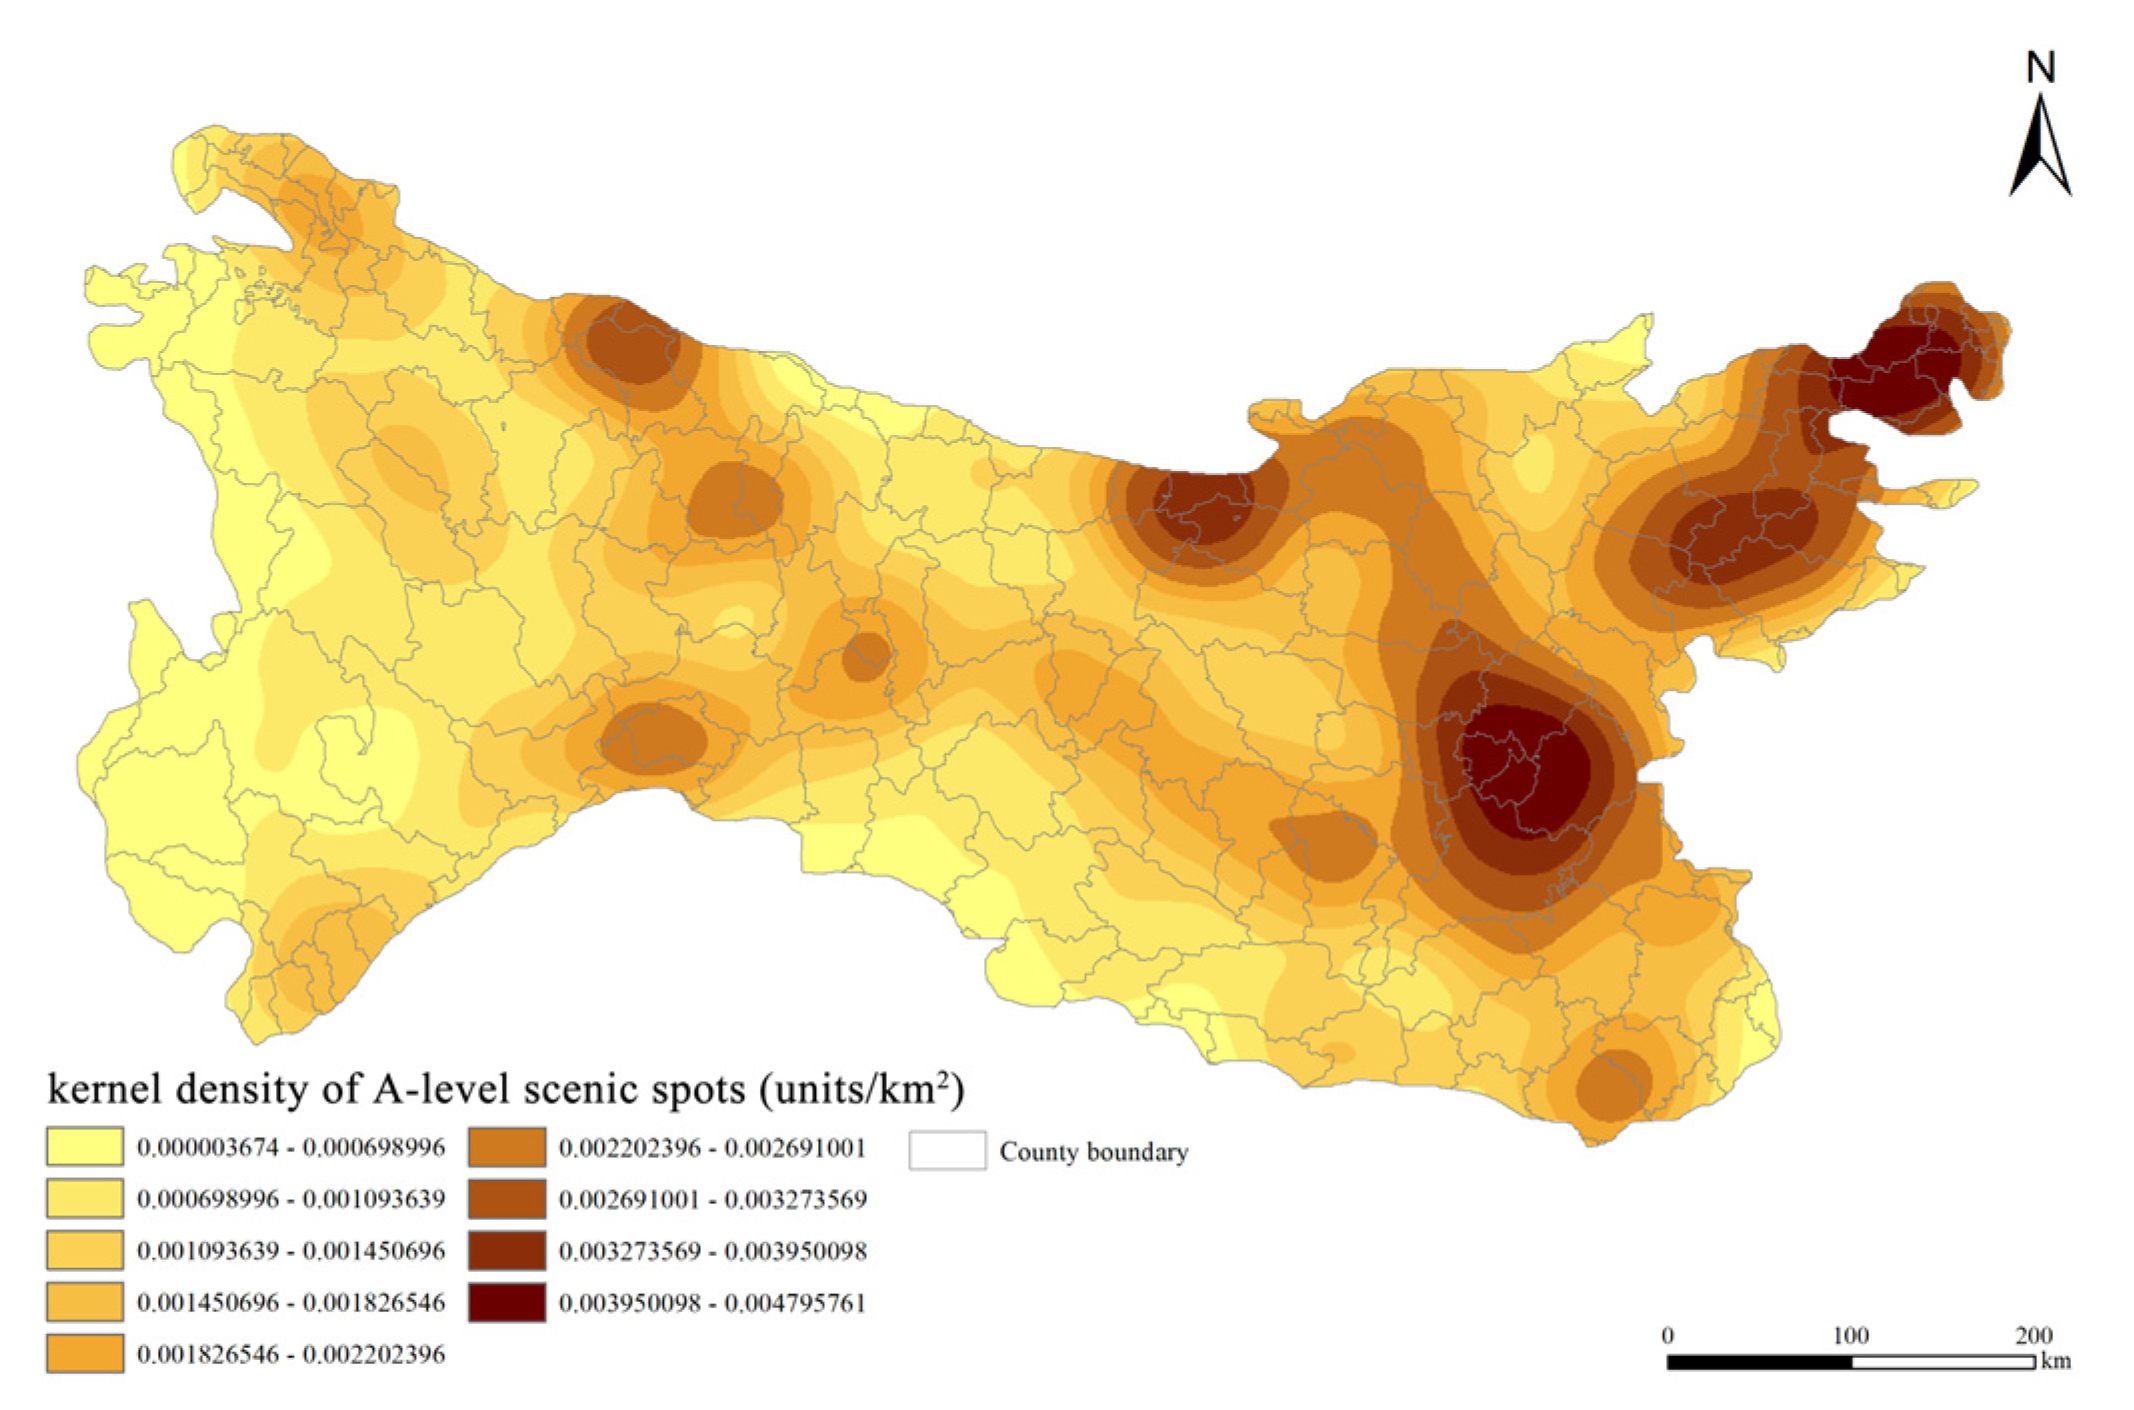
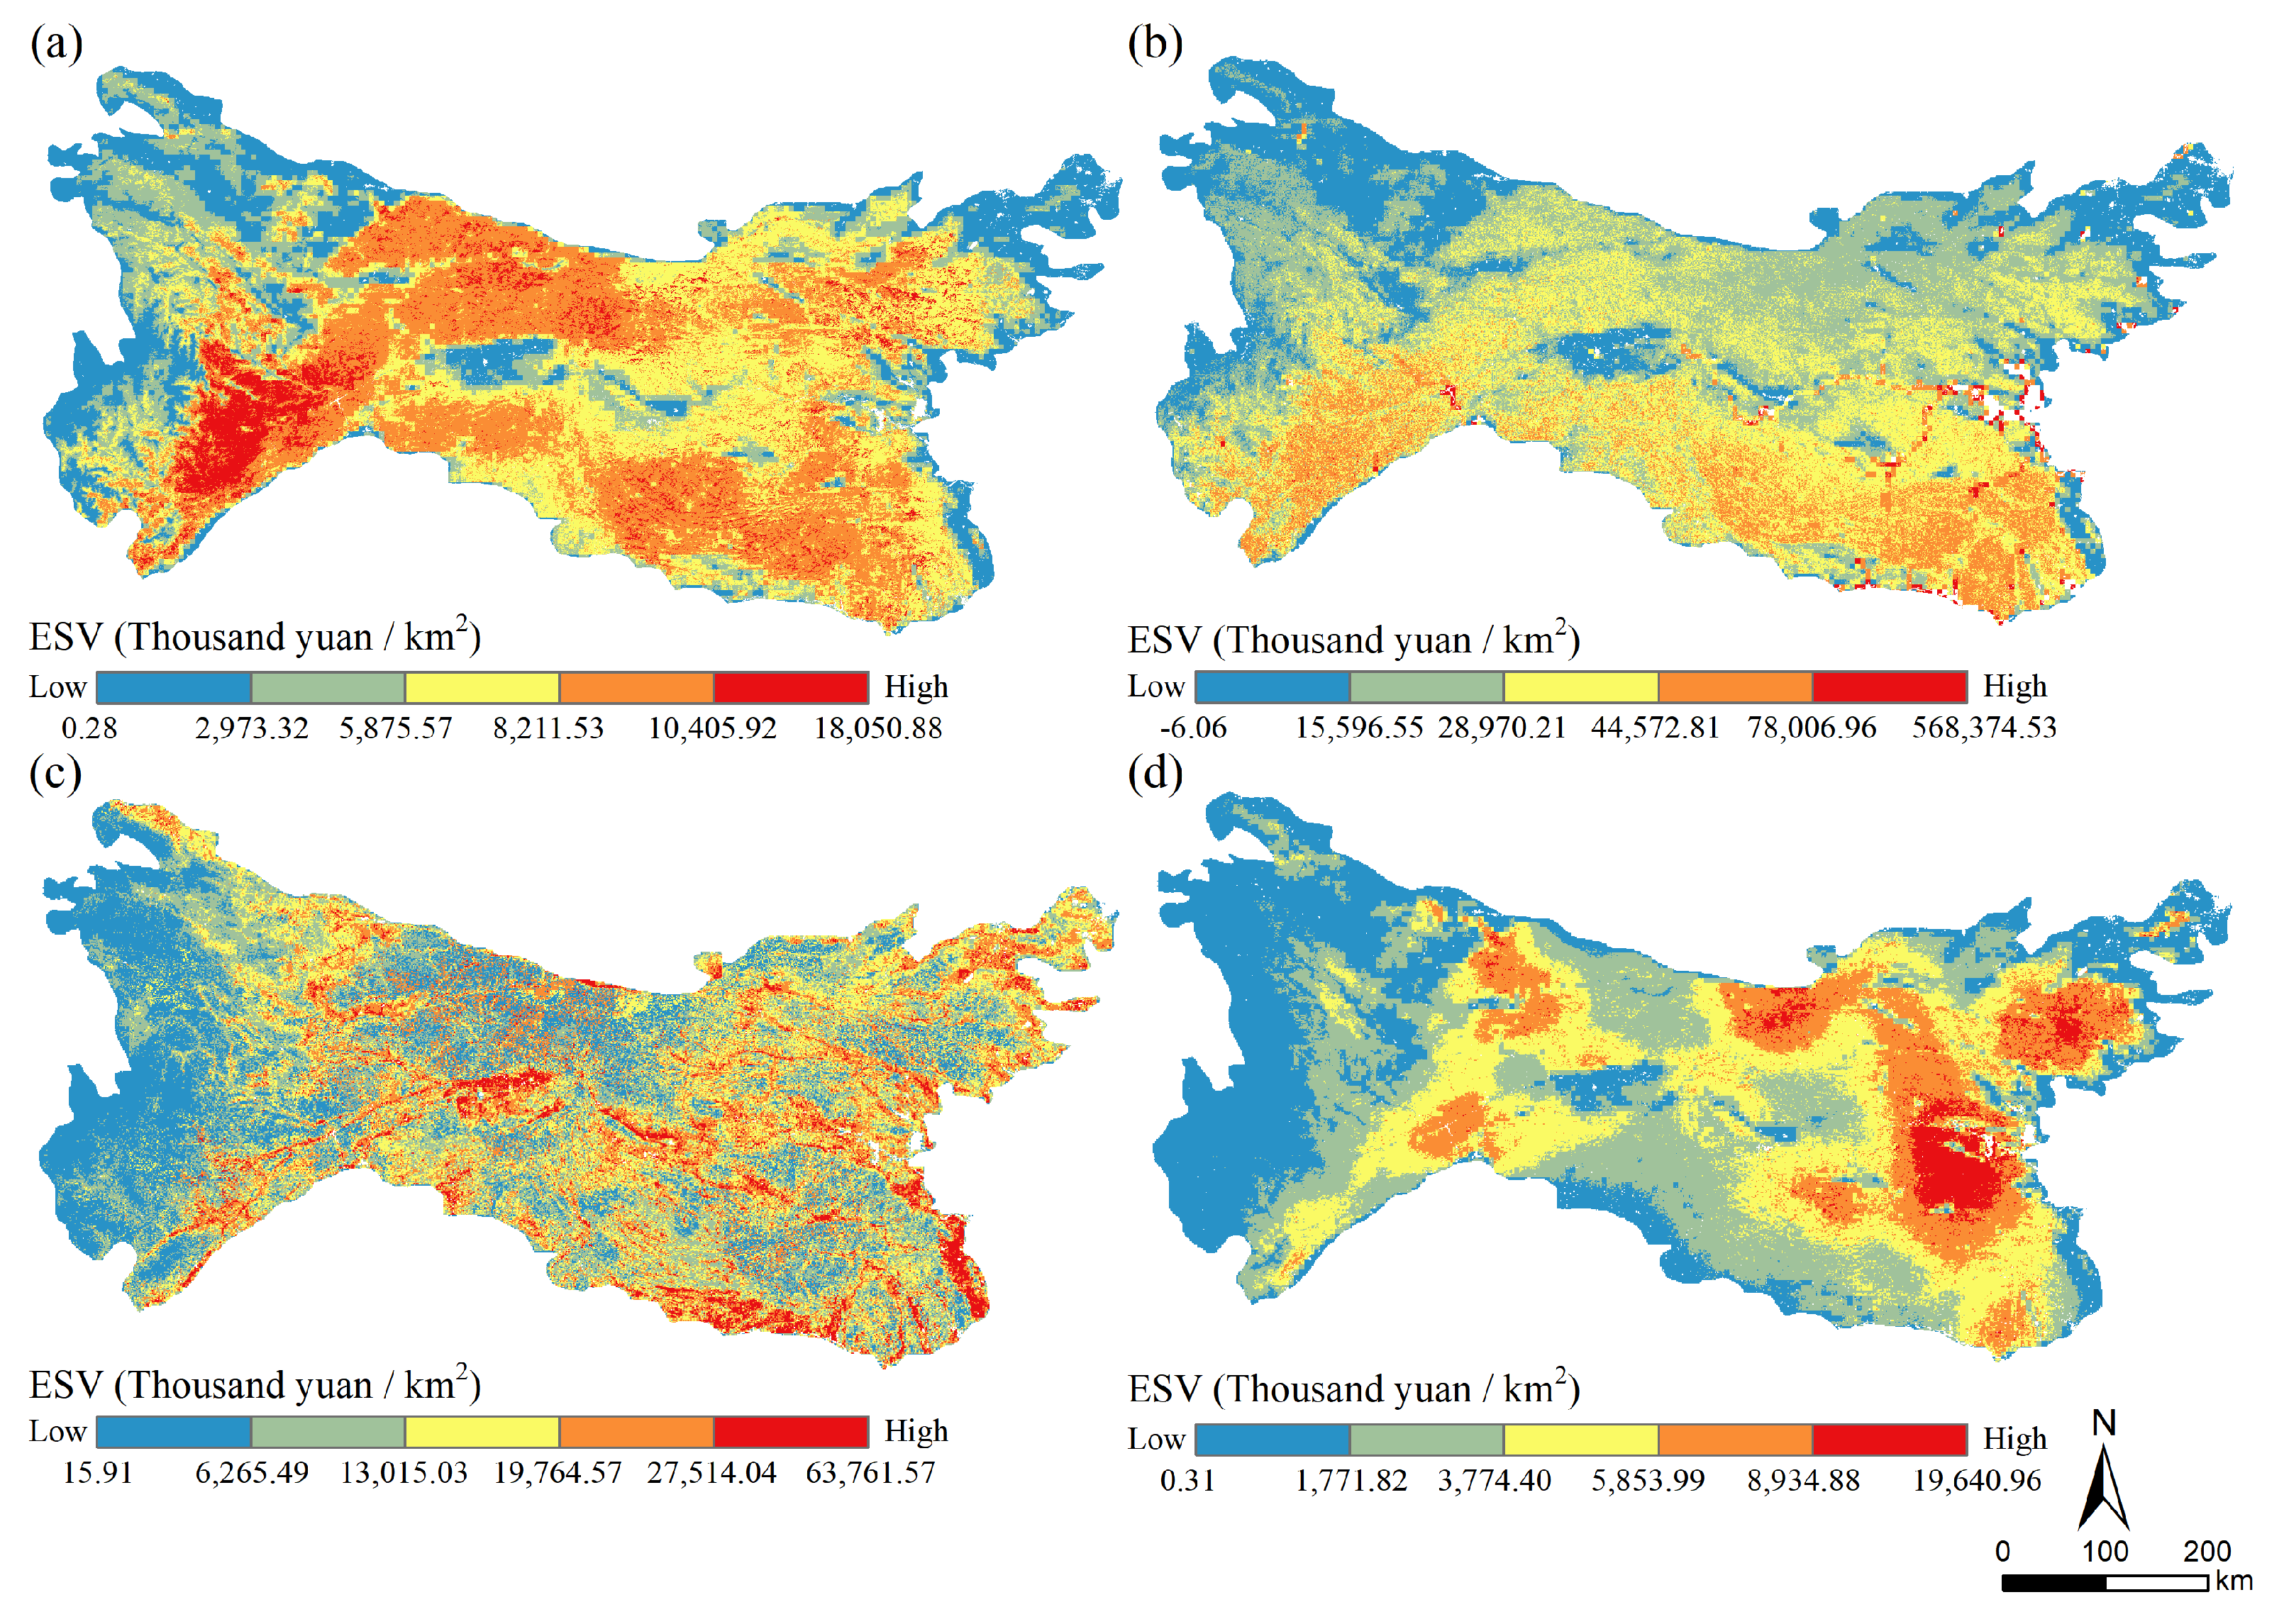
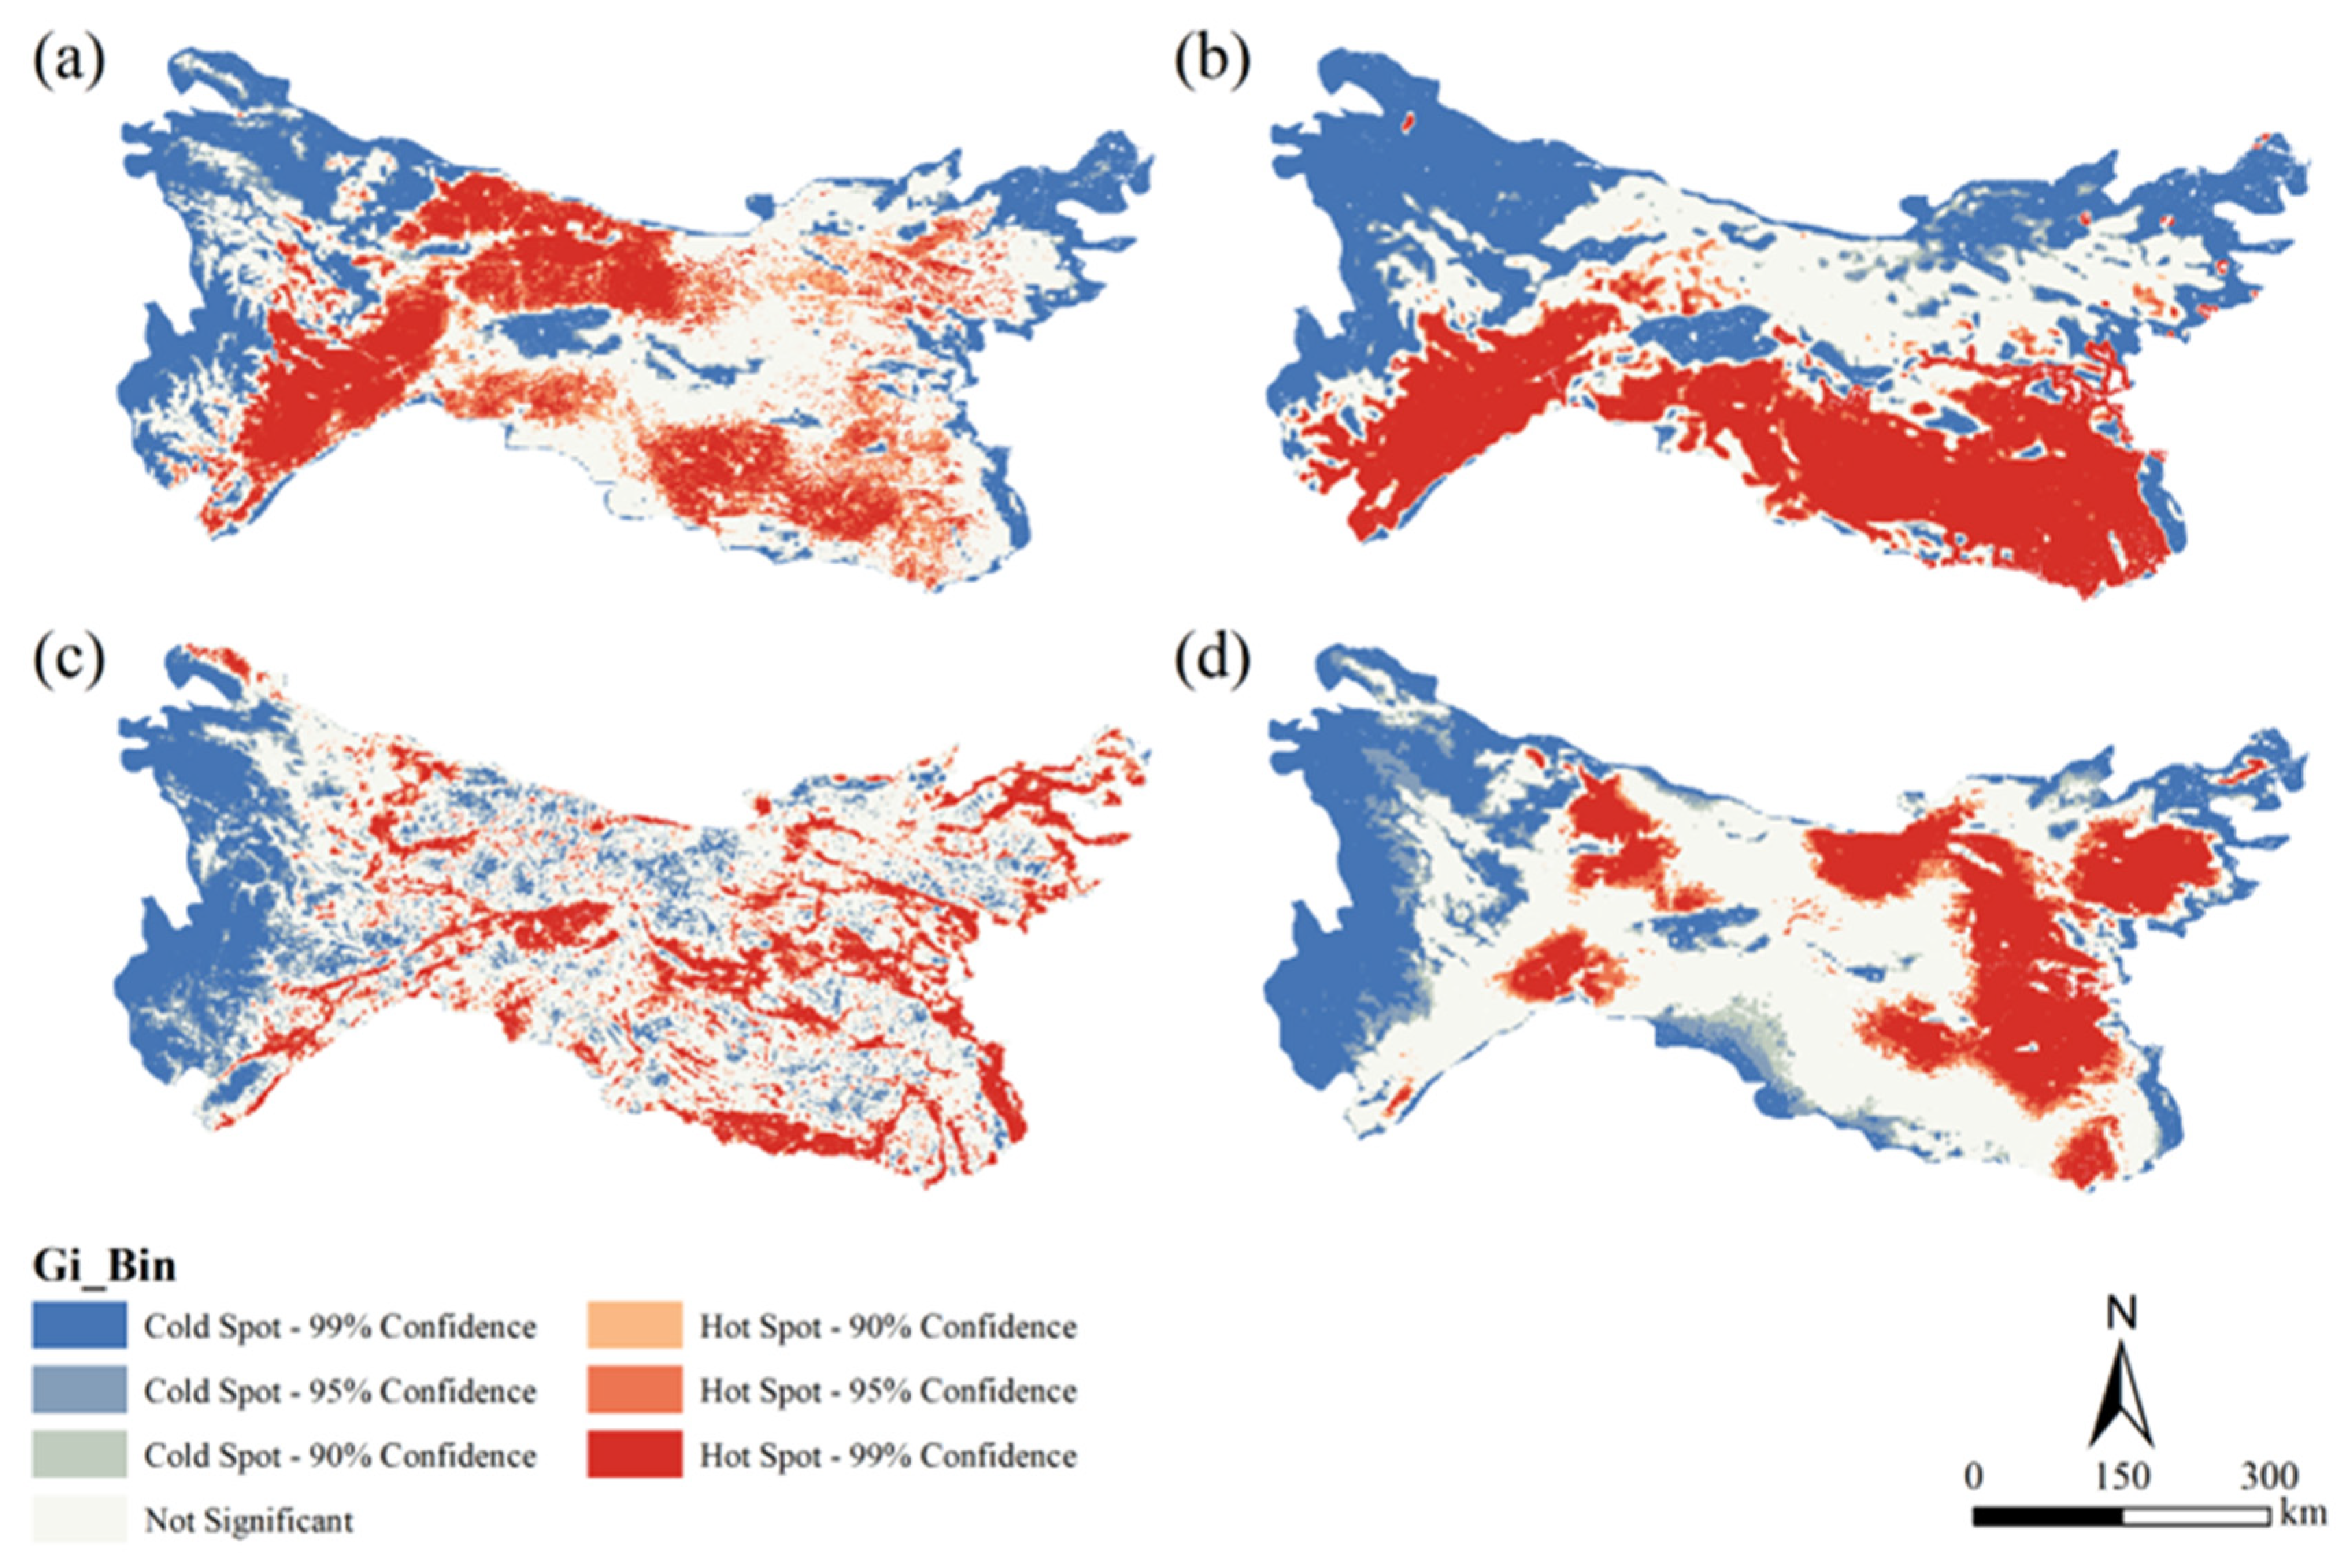
3.2.3. Ecosystem Service Assessment and Hotspots Analysis

The four categories of ESs (including HES, WSES, FMPES and CES) closely related to the four planning functions of the GI system were assessed and valued using the unit-based ES valuation method. The method and its application in this study are illustrated in detail in Appendix A.1. Then, the Hot Spot Analysis in ArcGIS was employed to identify the clusters of high values (hotspots) for each service by calculating the Getis-Ord Gi* statistic and mapping them in Figure 5 [31].
Hotspots of HES and CES are spatially clustered, while hotspots of WSES also exhibit a clustering trend, albeit to a lesser degree. In contrast, hotspots of FMPES are distributed more sporadically across the landscape. HES and WSES hotspots demonstrate strong synchronization in their distribution, with both types concentrated in areas such as the Micang-Daba-Shennongjia Mountain region, the Qinling Mountains, and the Pu River and Bailong River basins at the junction of Gansu and Sichuan provinces. A notable distinction is that in the Qinling area, only WSES hotspots are distributed. Furthermore, while FMPES and CES hotspots show significant differences in spatial distribution compared to HES and WSES hotspots, there are also overlapping regions.

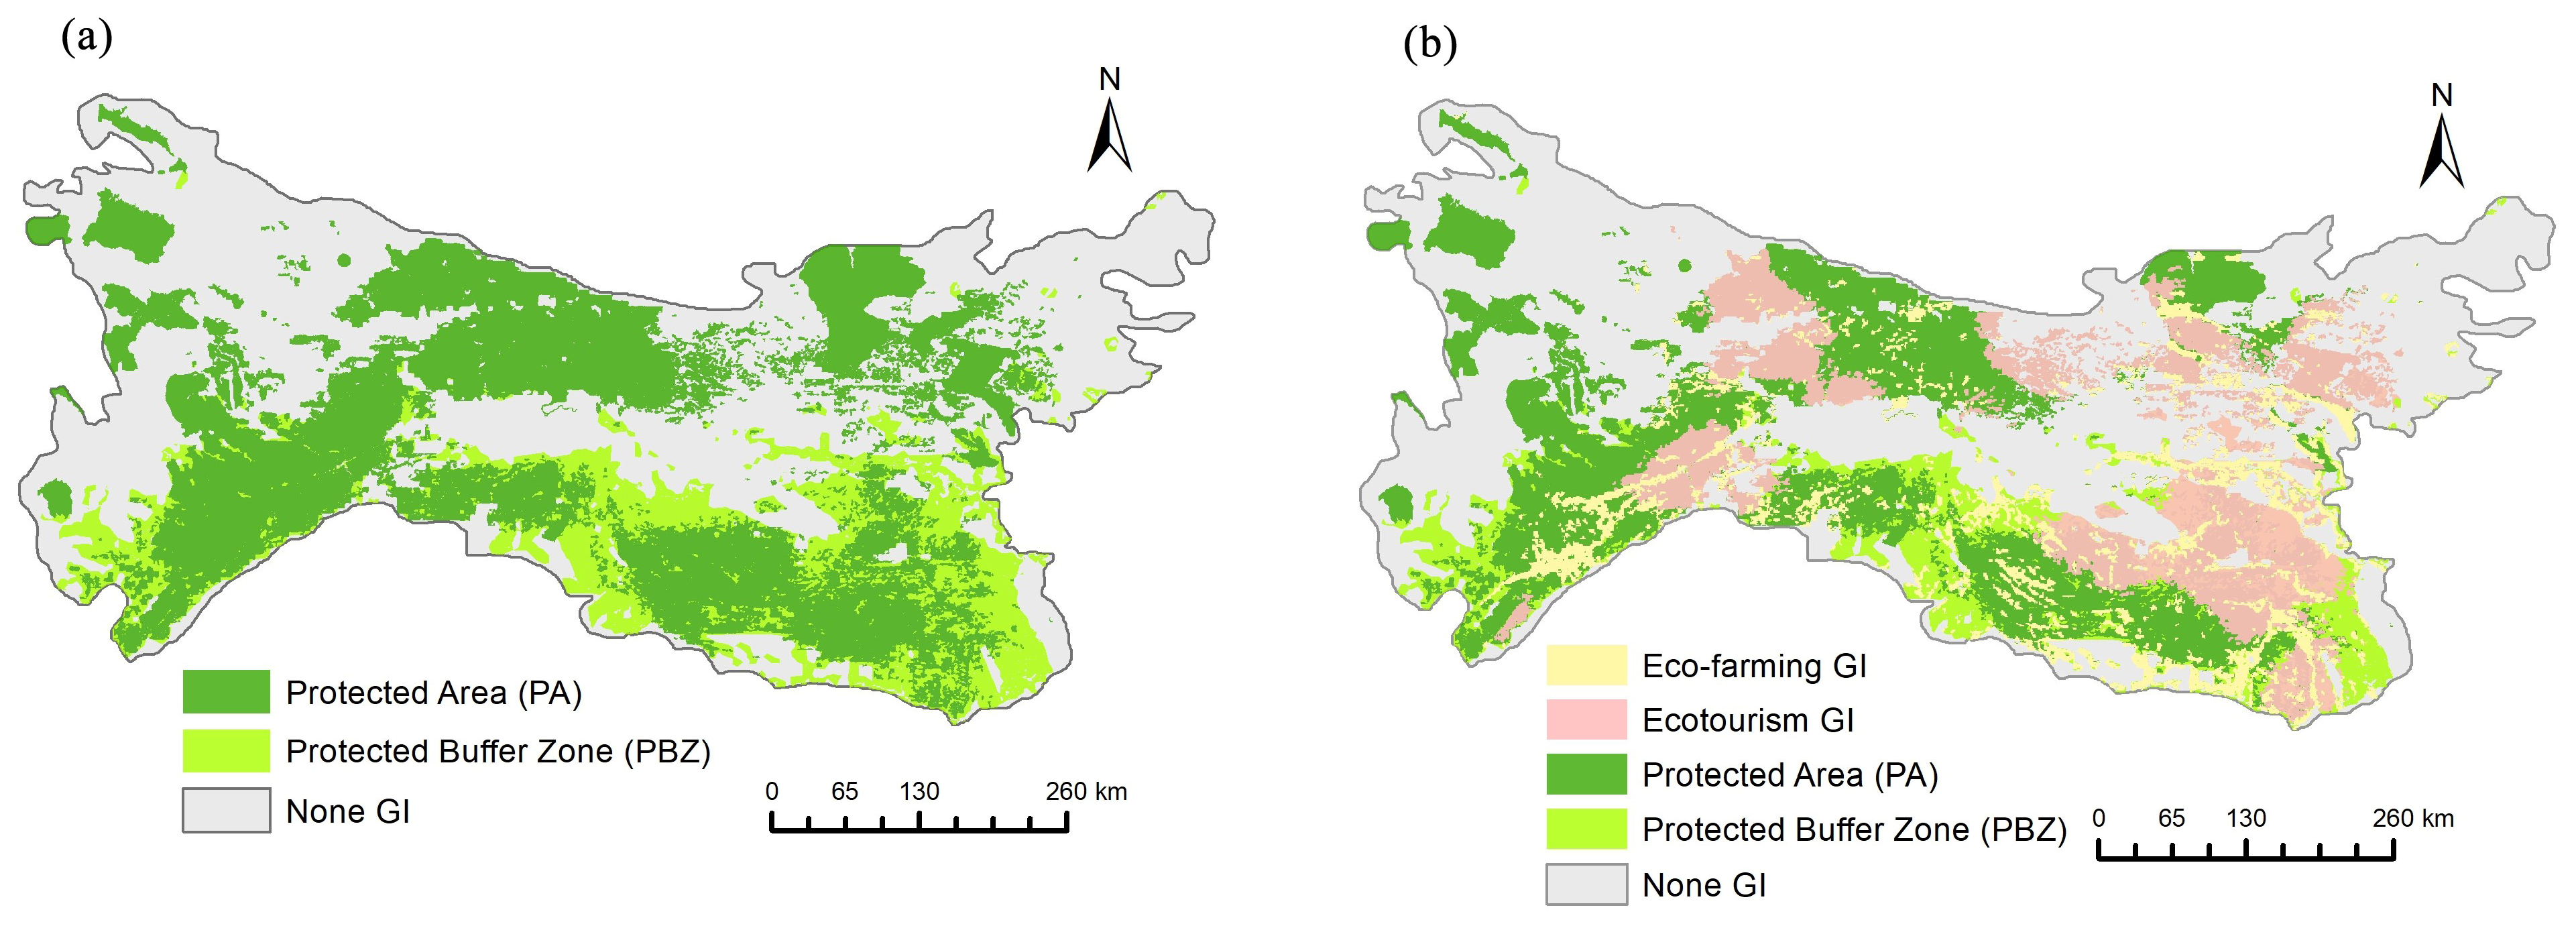
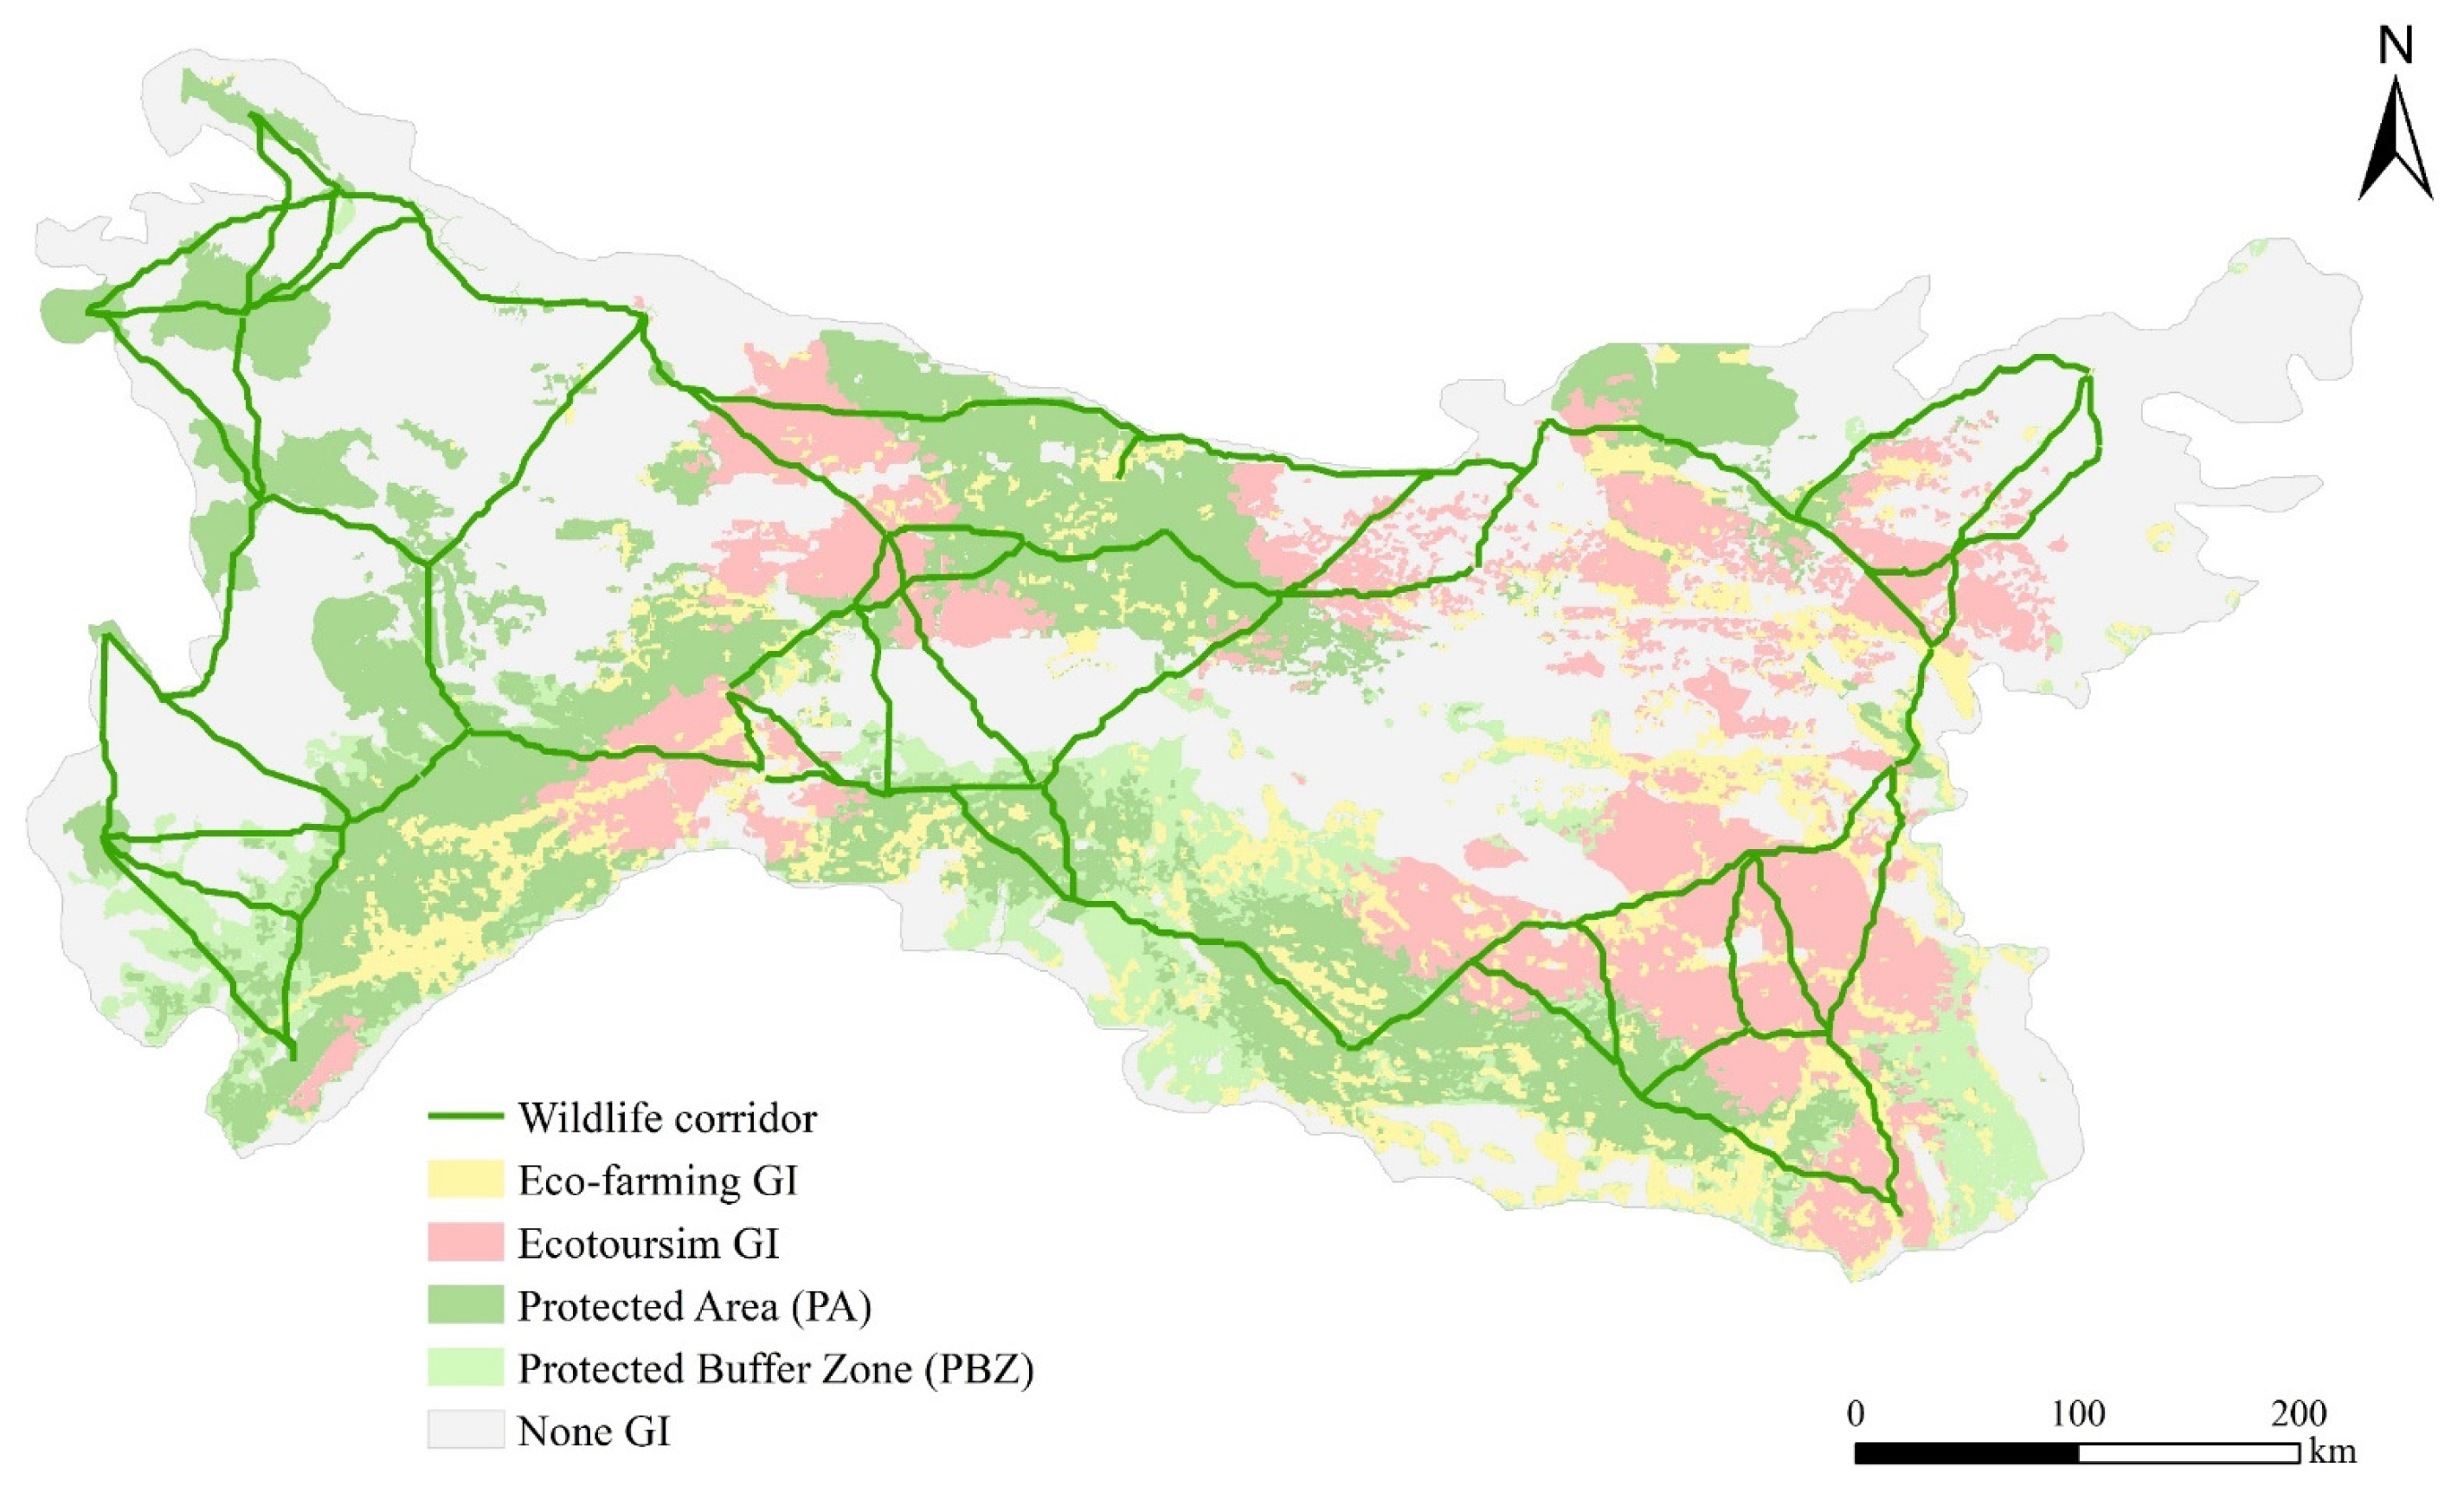
3.2.4. GI Element Identification and Multifunctional Mapping

Although the multifunctionality of GI has been widely recognized, its ecological functions are still regarded as more important and prioritized over other functions. Two principles were adhered to in the process of GI element identification and their function planning: first, prioritizing the ecological functions of GI; second, pursuing synergies between ecological functions and socioeconomic functions. Specifically, based on the interrelation analysis between GI function performance and ES delivery in Section 3.2.2, GI elements for biodiversity conservation and water and soil conservation were first identified and planned as Protected Areas (PAs) and Protected Buffer Zones (PBZs). Next, GI elements suitable for eco-farming and ecotourism development were identified within PAs or PBZs to encourage synergy among multiple ES/functions. The criteria for identifying GI elements are illustrated in Table 2. Figure 6 maps the spatial distribution of GI elements and their functionalities. The mapping results are analyzed below.
First, ecological functions were prioritized. Hotspots of HES and WSES were identified and designated as Protected Areas (PAs) or Protected Buffer Zones (PBZs). The primary function of PAs is to support biodiversity, while they also contribute to water and soil conservation. PBZs were primarily planned for water and soil conservation; they serve as buffers and subsidiary areas for PAs, enhancing the habitat services provided by PAs. Together, PAs and PBZs cover approximately 55% of the study area. They display a spatially clustered pattern, though they are not completely connected.
In addition to ecological functions, the GI system is expected to perform socioeconomic functions to support eco-farming and ecotourism development. In response, we recognized the multifunctional potential of GI elements and identified those suitable for eco-farming and ecotourism within the PAs or PBZs. Approximately 17% of GI elements in the PAs or PBZs are found to be suitable for eco-farming, and these elements are scattered across the study area. In contrast, GI elements suitable for ecotourism development display a clustered pattern, primarily distributed in the North Daba Mountain area, Funiu Mountain area, Middle Qinling Mountain area, and West Micang Mountain area. These elements account for about 33% of the area of PAs and PBZs. The multifunctionality of GI elements in each type is listed in Table 3.

3.2.5. Green Infrastructure Connectivity Analysis and Green Infrastructure Network Mapping

It is widely recognized that the GI system functions as a connected network rather than merely a combination of separate elements. The performance of many ecological functions, such as flood mitigation and biodiversity conservation, requires GI elements to be linked by corridors composed of natural or semi-natural features. In the case study of the QBMA, biodiversity conservation is the primary function that the GI system is expected to perform. Protected Areas (PAs) are combinations of GI elements aimed at biodiversity conservation; however, separated PAs need to be linked to support wild animal migration among them. The habitat services provided by the GI system will be enhanced by constructing such a connected network. We simulate the wildlife corridors linking these PAs using the Minimum Cumulative Resistance (MCR) model. An explanation of the MCR model and its application in this study can be found in Appendix B.
The simulated GI networks are mapped in Figure 7. GI elements are connected by 73 wildlife corridors. The minimum, maximum, and average lengths of the corridors are 30 km, 255 km, and 86 km, respectively.

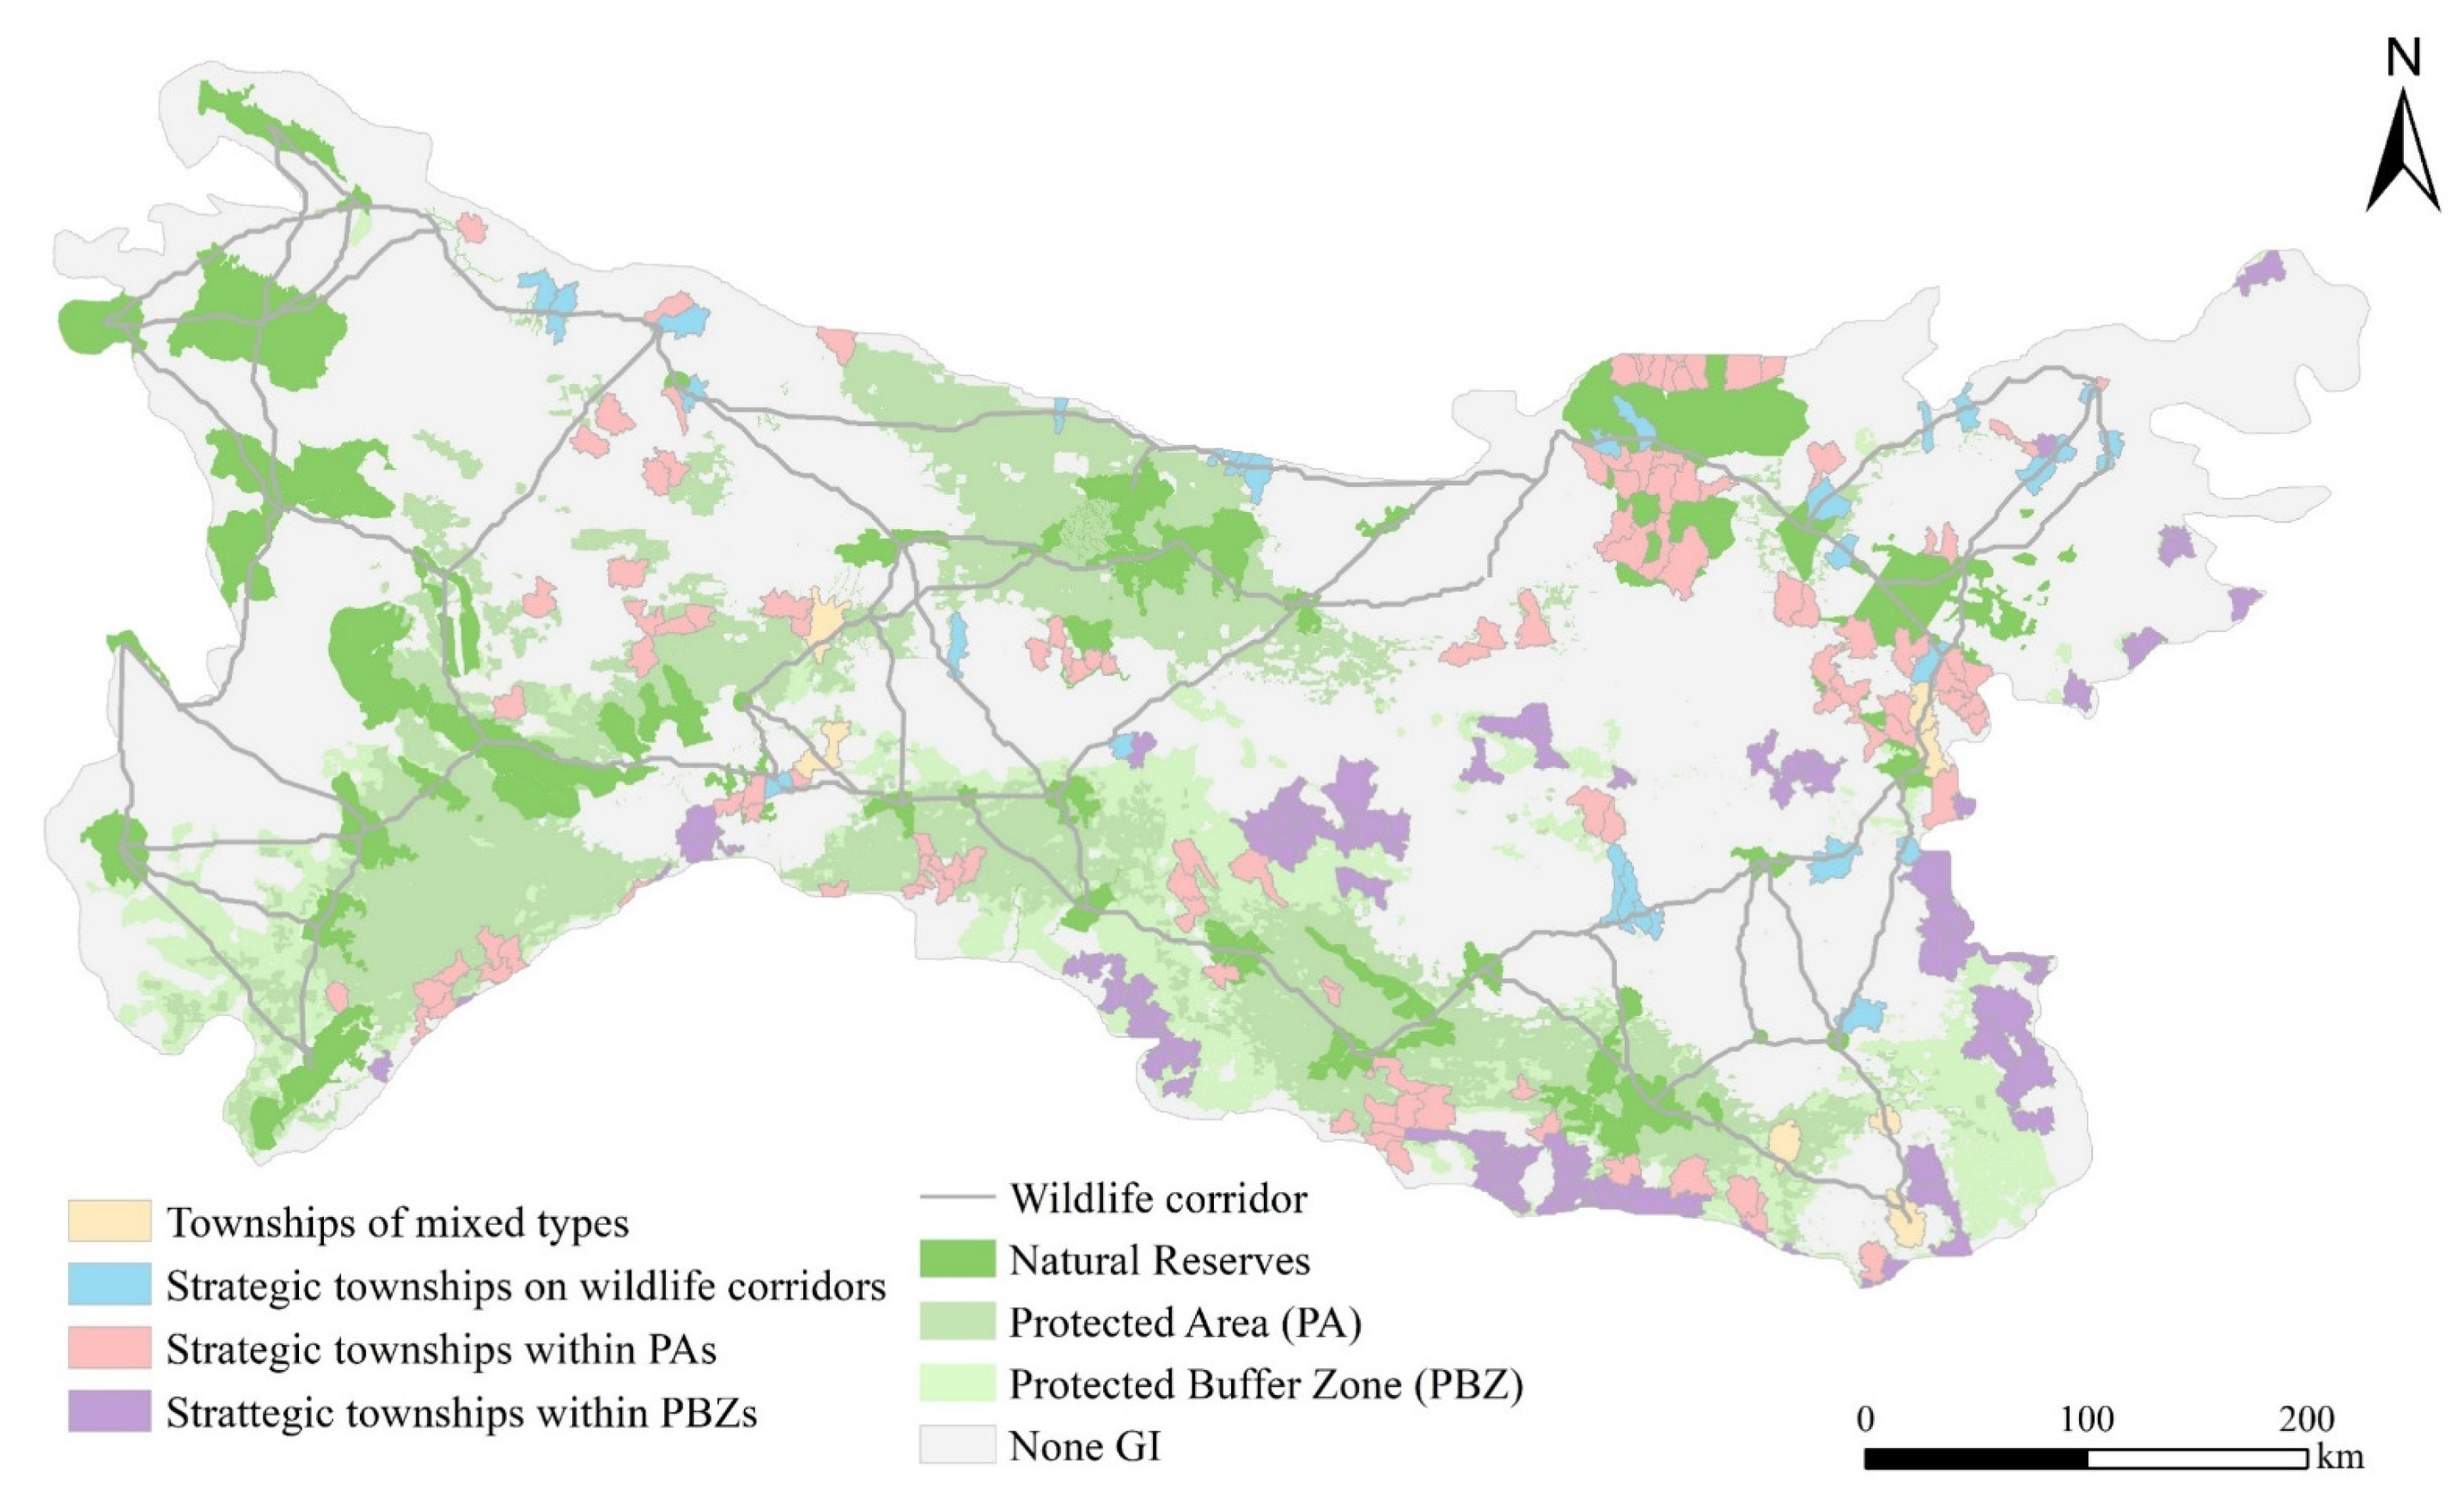
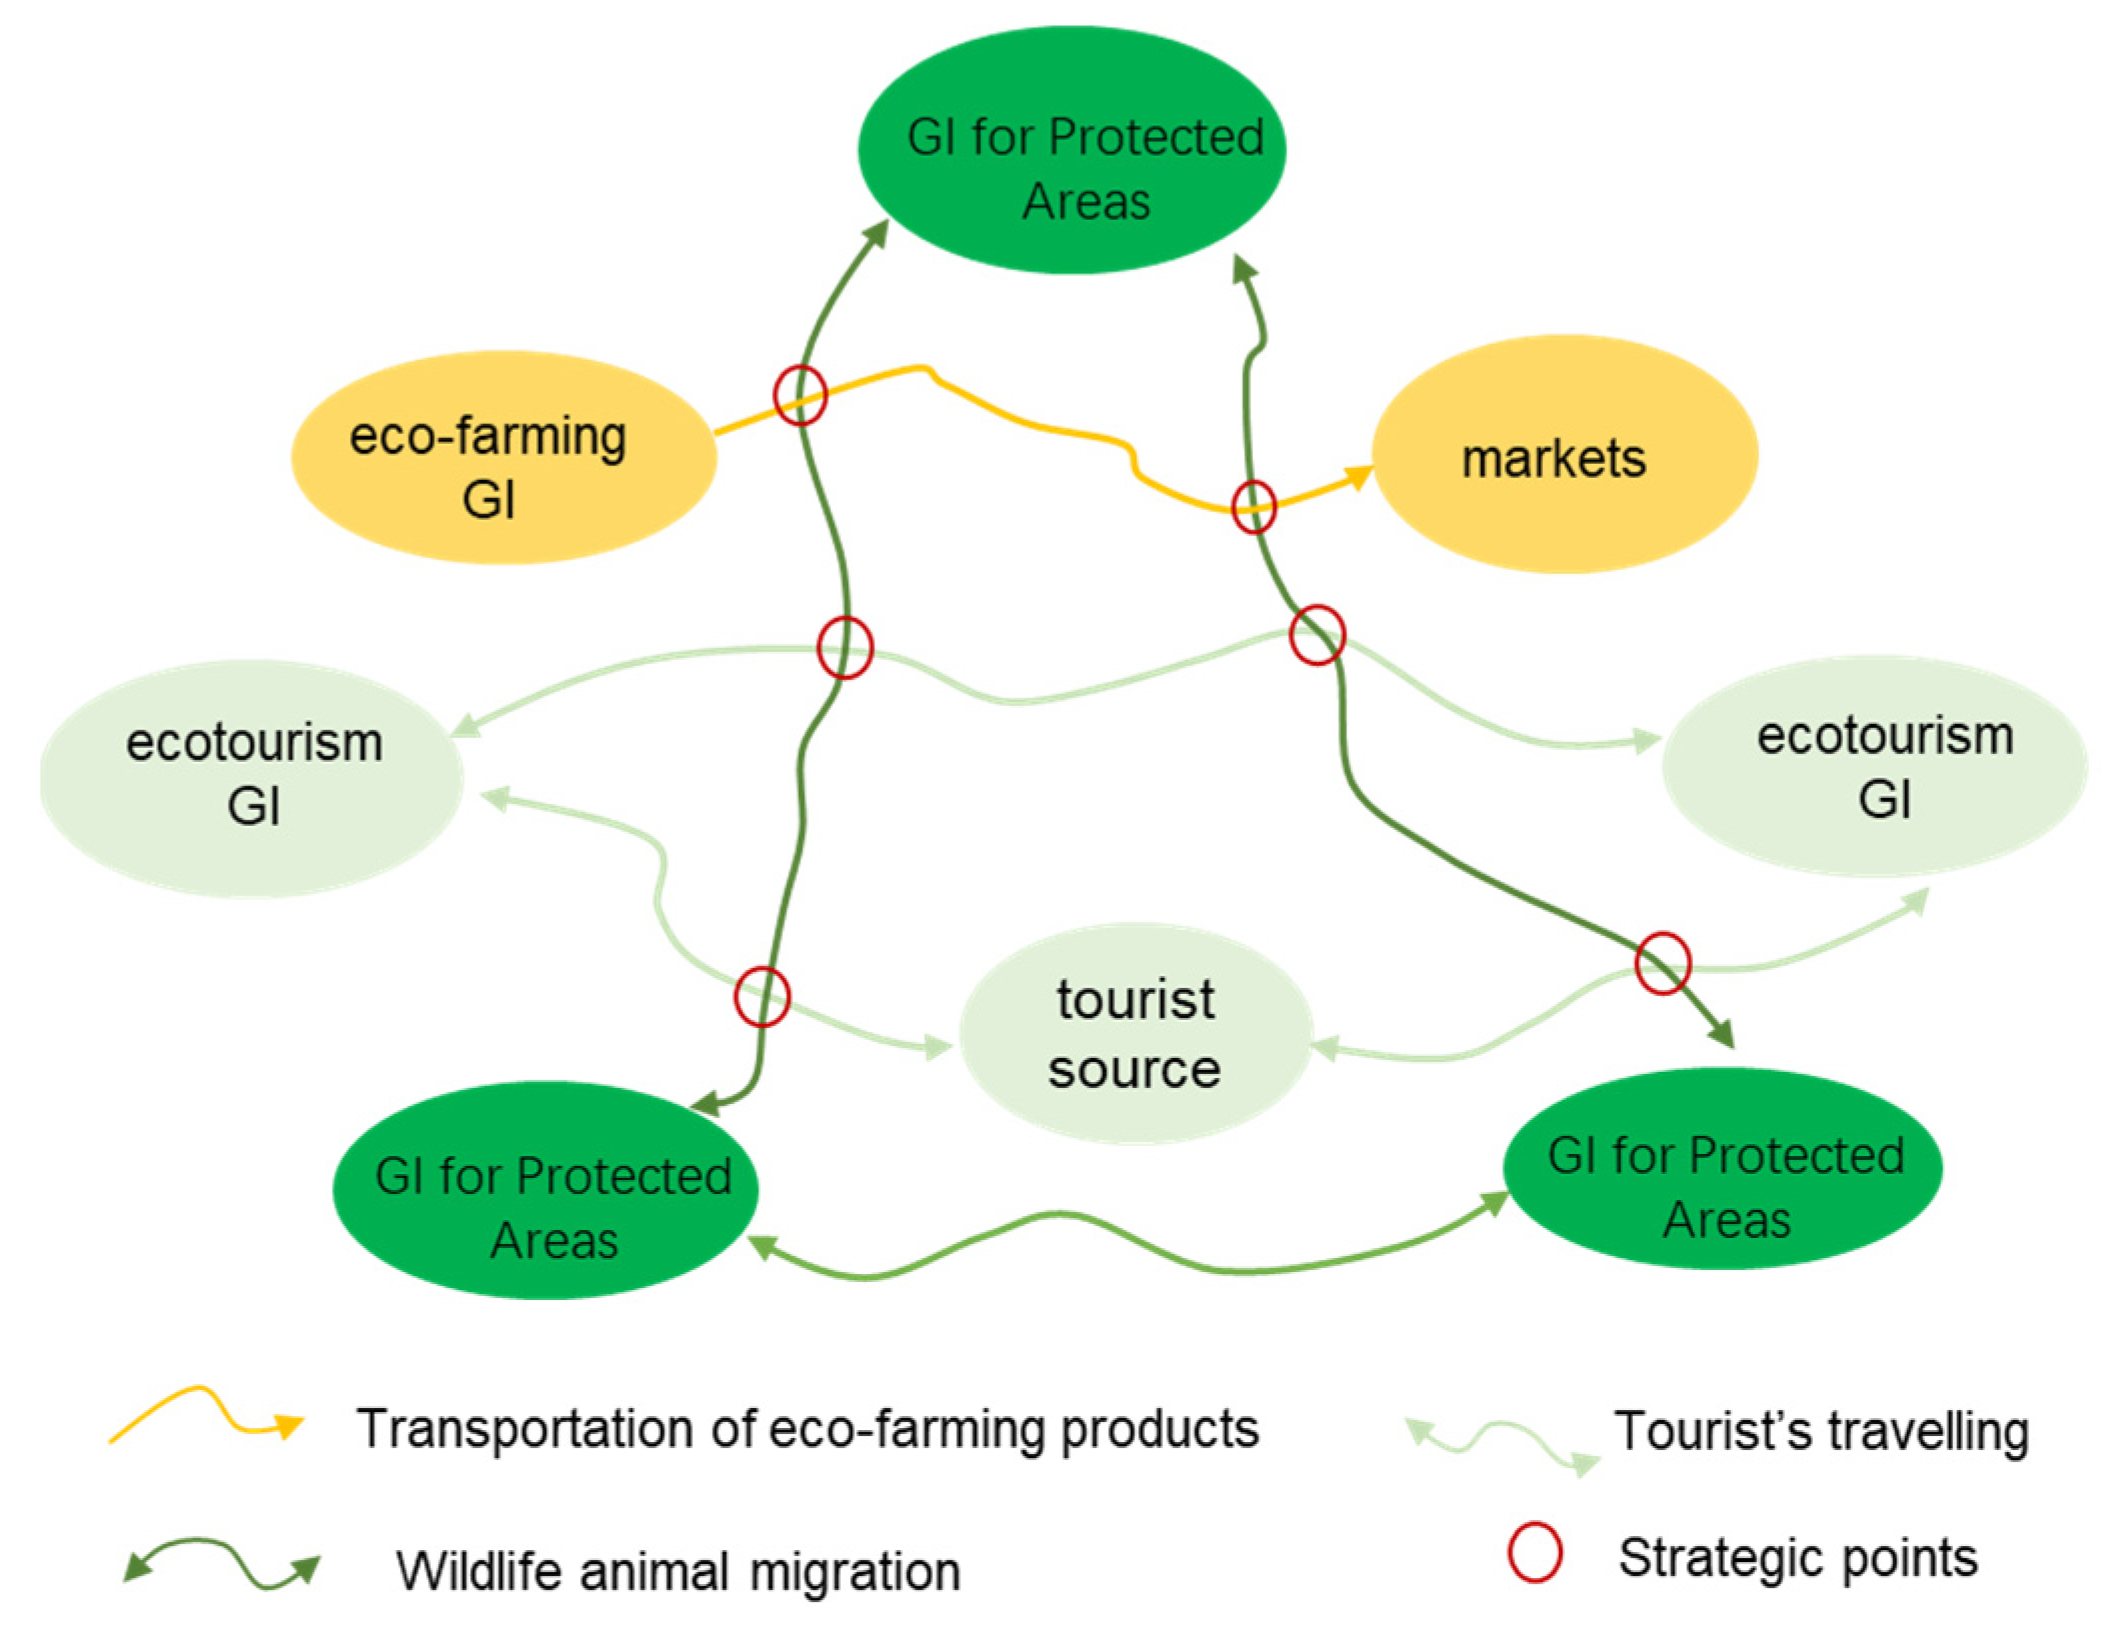
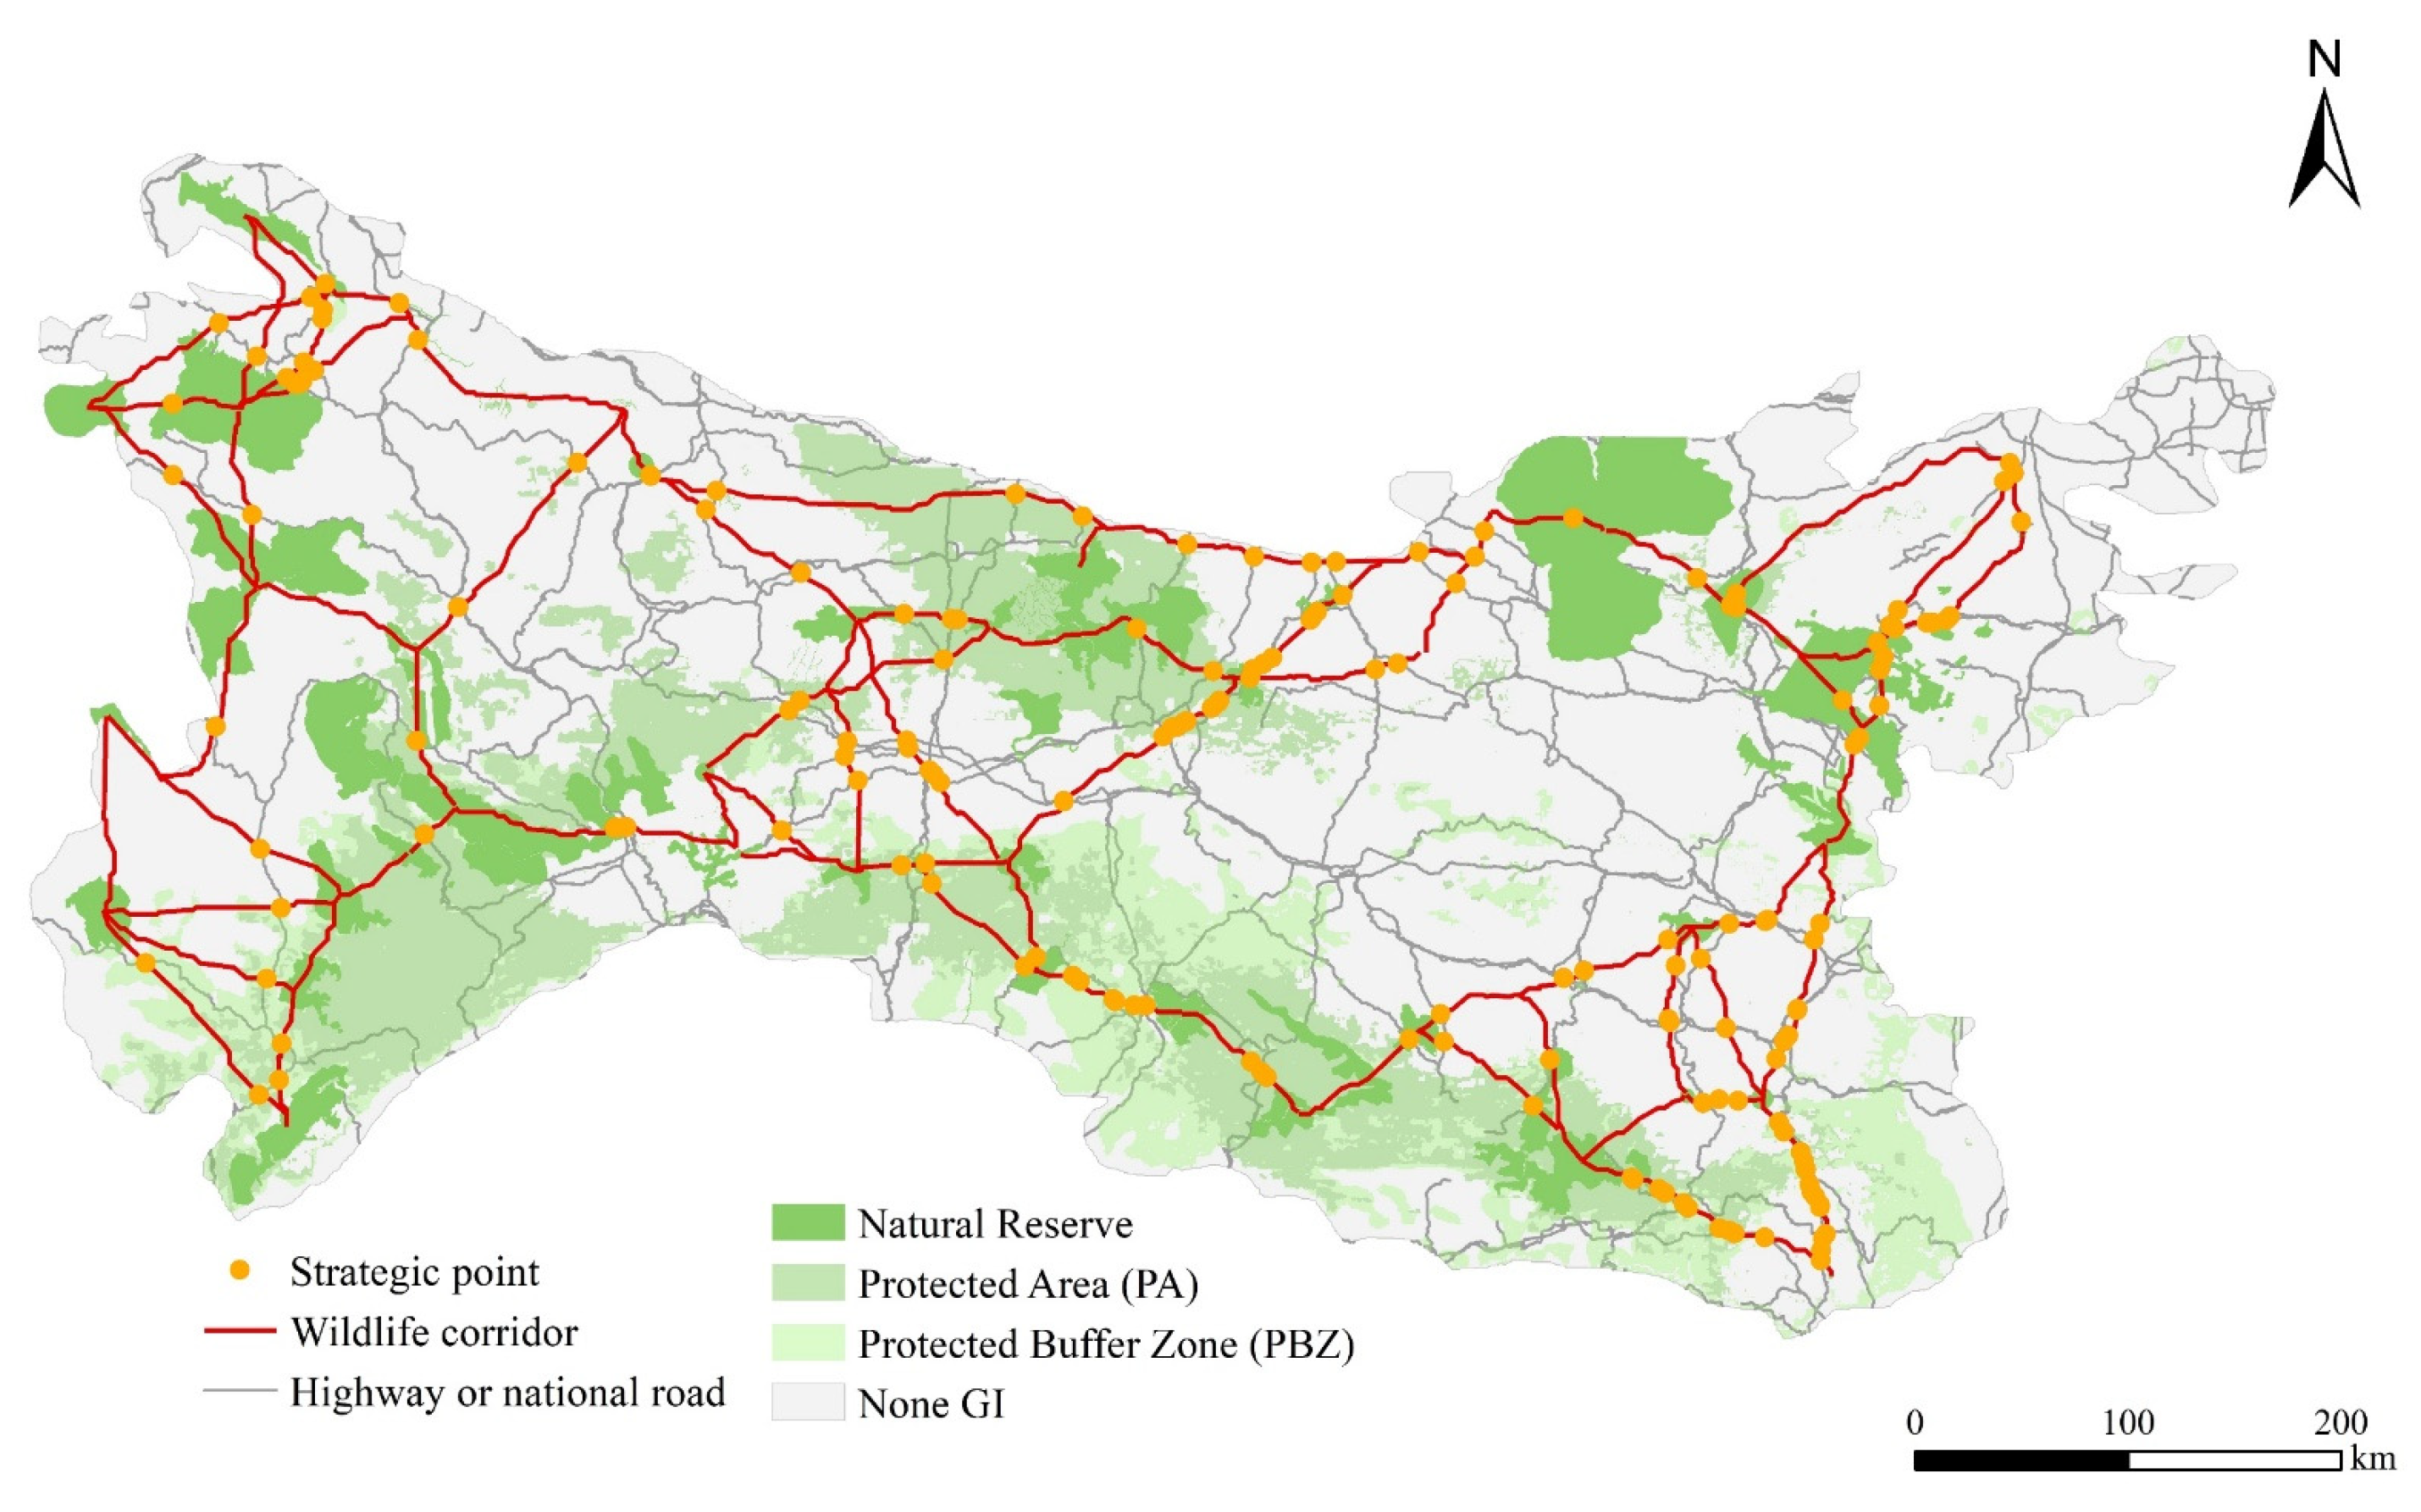
3.2.6. Strategic Areas/Points Identification

The above procedure for identifying GI elements and planning their functions aims to promote multiple ES/function synergies across the entire study area. However, trade-offs among ESs and functions may occur locally. Areas or sites that are susceptible to these trade-offs are strategically important for GI construction and management and are therefore designated as strategic areas or points. In the QBMA, the primary trade-offs are between the ecological functions of biodiversity maintenance and water and soil conservation, and the socioeconomic functions of supporting eco-farming and ecotourism development.
First, population distribution plays a crucial role in these multifunctional trade-offs. Population agglomeration can enhance eco-farming and ecotourism functions by providing human resources, potential markets, and tourists. However, it can also negatively impact HES and compromise WSES, particularly in PAs and PBZs, and on wildlife corridors. Consequently, we identify densely populated townships located within PAs and PBZs, or on wildlife corridors, as strategic areas for GI construction and management. The categories and spatial distributions of these townships are mapped in Figure 8.
A total of 245 townships have been recognized as strategic areas, accounting for 10.3% of all townships in the study area. These townships are dispersed throughout the region, with a significant concentration in the Funiu Mountain and Daba Mountain areas. A large percentage of these townships fall within PAs or PBZs, meaning that part or all of the townships have been designated as such. These townships, on one hand, possess green GI that is significant for biodiversity maintenance, as well as water and soil conservation. On the other hand, they are densely populated, and the livelihoods of the residents need to be supported. Leveraging GI to develop eco-farming and ecotourism is a feasible approach to realize the multifunctional value of GI while generating economic and social benefits for local communities. However, the carrying capacity of GI for farming and tourism activities must be assessed. The development of eco-farming and ecotourism should not exceed the carrying capacity of GI to avoid negative impacts on its ecological functions. Furthermore, the number of townships within PBZs is greater than that within PAs, implying that GI in PBZs is more likely to perform multiple functions. Additionally, 40 of these townships were in wildlife corridors. It is necessary to construct wildlife corridors in these townships to minimize human interference on wildlife migration. Meanwhile, local governments should take responsibility for educating the public on the significance and approach to wildlife protection.
Second, the connectivity of GI is closely related to the trade-off between ecological functions and socioeconomic functions. The connectivity of GI elements facilitates the migration of wild animals among different habitats. Meanwhile, in the development of eco-farming and ecotourism, agricultural products need to be transported from GI elements to markets, and tourists must travel between various tourism destinations via human-constructed transportation routes. However, these artificial transportation networks may intersect with wildlife corridors, disrupting the connectivity of the GI network. Consequently, the pursuit of socioeconomic functions can create trade-offs with biodiversity conservation efforts. These intersections can be regarded as strategic points for GI construction and management, as illustrated in Figure 9.
By identifying the intersections of wildlife corridors and major traffic routes in the study area, we have located and mapped the strategic points, as shown in Figure 10. A total of 273 strategic points have been identified for green infrastructure (GI) construction and management.
In certain road sections, the simulated wildlife corridors are in close proximity to the roads, resulting in a dense concentration of strategic points, particularly in the G421 Baokang and Yuanan sections, the G331 Songxian section, the G210 Ningshan section, and the G347 Xingshan section. In these road sections, it is crucial to establish animal migration corridors alongside the roads. Additionally, installing warning signs to indicate potential animal presence is essential to alert passing vehicles, helping to reduce their speed and minimize the risk of collisions between wildlife and vehicles.
For other dispersed strategic points, field observations should be conducted in the vicinity of the identified locations. In areas where wild animals are frequently sighted, priority should be given to implementing engineering solutions, such as constructing animal passage bridges or culverts. For strategic points where engineering interventions are not feasible, appropriate warning signs should be installed to remind drivers to slow down.

4. Discussion

This study integrates ES evaluation and synergy/trade-off analysis into the planning of GI systems, establishing a planning framework to enhance the multifunctionality of GI at the regional scale. Using the Qinling–Daba Mountain Area (QBMA) as a case study, the practicality of this framework is demonstrated, along with an identification of the challenges encountered during its implementation. This section discusses the study’s contributions, limitations, and remaining challenges.

4.1. Contributions

Despite a growing body of literature on urban green infrastructure, the planning and implementation of regional green infrastructure remain comparatively understudied. This research addresses this gap by providing valuable insights into effective strategies and approaches for regional-scale green infrastructure development.
Urban GI often incorporates engineered elements, such as permeable pavement, infiltration trenches, and perforated pipes [22]. However, at the regional level, GI planning usually prioritizes the identification and conservation of existing natural features, supplemented by semi-natural elements [1,20,21]. This approach aims to balance ecological benefits with the costs associated with construction and ongoing maintenance. Regional GI is often designed and constructed to safeguard regional ecological security and biodiversity. Based on this functional orientation, it exhibits a fundamental alignment with the ecological security patterns extensively investigated by Chinese academia [32,33,34,35]. Both approaches emphasize identifying core areas with critical ecological functions and establishing interconnected networks. Building upon this shared functional grounding, this study innovatively incorporates methods for constructing ecological security patterns into regional green infrastructure planning.
This research employs a “core protection, network construction, and cost control” framework to plan the green infrastructure network in the QBMA. Initially, based on ecological security pattern theory, the case study identifies natural and semi-natural elements that provide essential ESs, such as habitat, water and soil management, food and material production, and cultural benefits, through ES assessment and mapping. Subsequently, using principles from landscape ecology, it selects existing natural and semi-natural features, such as rivers and agricultural shelterbelts, to establish cost-effective wildlife migration corridors connecting core protection zones. Finally, it employs the minimum cumulative resistance model to optimize the network structure, minimizing the development costs for wildlife corridors. This configuration model, which emphasizes natural elements supplemented by semi-natural elements, ensures the functionality of the green infrastructure network while controlling construction expenses.
Building upon prior research on ecological security patterns in the QBMA [36], this study conducts a comparative analysis to highlight key distinctions and concordances. Regarding the identification of ecological sources, both studies exhibit a notably similar spatial distribution of protected areas. However, this work innovatively identifies areas characterized by multiple functions. For instance, within protected areas and their buffer zones, eco-farming is suitable for development in 17% of the area and ecotourism in 33%. Concerning ecological corridor simulation, despite a high degree of consistency in the spatial distribution of key wildlife migration routes identified across both studies, this research yields a greater total number and cumulative length of wild corridors. This discrepancy primarily arises from the different criteria used for core GI/ecological source identification. This study incorporates established nature reserves as core green infrastructure elements, whereas prior investigations did not include nature reserves within the criteria for ecological source determination. However, nature reserves, serving as repositories of representative natural ecosystems, habitats for rare and endangered species, and areas of concentrated natural heritage, represent integral elements of the regional GI system [37,38].

4.2. Challenges and Limitations

A central challenge in implementing the proposed framework for multifunctional green infrastructure planning lies in addressing two fundamental questions: (1) How do the ESs provided by natural and semi-natural elements contribute to the functionality of the GI system? (2) How does the functional performance of the GI system foster multiple ES synergies or trade-offs?
In response to the first question, the case study initially identified four key functions expected of the GI system: biodiversity maintenance, water and soil conservation, support for eco-farming, and promotion of ecotourism. It then analyzed the ESs associated with these functions. Finally, it evaluated and mapped the four categories of ESs in the study area and accordingly identified that GI (natural/semi-natural) elements play significant roles in the provision of these ESs.
The second question, concerning the potential for synergies or trade-offs among ESs, presents a more complex challenge. The occurrence of synergies or trade-offs is influenced not only by the type of function but also by the intensity of its implementation. For instance, in the case study, the development of eco-farming and ecotourism can complement the ecological functions of GI, enhancing services such as habitat provision, water and soil conservation, food production, and cultural benefits. Conversely, if farming and tourism activities exceed the GI’s carrying capacity, it may degrade its ecological functions, leading to trade-offs among various ESs. Thus, assessing the carrying capacity of GI concerning different human activities is essential for promoting multifunctional synergies and minimizing trade-offs. This evaluation is challenging as it must consider the variations in human activities, the differences in green infrastructure, and its surrounding natural and socioeconomic environment. A limitation of our case study is that it did not assess the carrying capacity of GI for farming and tourism activities.
Another challenge in planning multifunctional GI is addressing the connectivity of its elements, a topic that has received little attention in current literature. GI is defined as a strategically planned network of natural and semi-natural areas that provide a wide range of ESs benefiting both biodiversity and society, as noted by the International Union for Conservation of Nature (IUCN) and the European Commission (EC) [5]. The connectivity of GI elements varies based on their functions. In single-function-oriented planning, connectivity can be relatively straightforward to simulate. For example, the connectivity for biodiversity conservation can be mapped by simulating the migration routes of large mammals or aquatic species. However, in a multifunctional system, the connectivity of GI elements becomes more complex. Some functions, such as soil conservation and climate regulation, do not require full connectivity among elements. Additionally, functions like ecotourism development necessitate connections with human-made transportation routes, raising questions about whether these routes should be integrated into the GI system. Consequently, determining which elements should be connected and designing their connectivity patterns is a challenging task in multifunctional GI planning. In our case study, this article focused solely on analyzing the connectivity of GI for biodiversity conservation and how transportation routes disrupt this connectivity. This choice was made to prioritize biodiversity conservation as a primary goal of GI planning while also aiming to simplify the network for effective construction and management.

5. Conclusions

This study presents an application-oriented framework for green infrastructure (GI) planning aimed at enhancing multifunctionality. By integrating ES methodologies, the framework examines the relationships between GI function performance and ES delivery. It reframes challenges related to multiple functions and trade-offs as issues concerning the synergies and trade-offs of ESs, allowing for quantitative and spatial analysis. This framework facilitates the planning of GI systems to promote synergies among various functions while identifying strategic locations for GI construction and management to minimize trade-offs.
The framework was applied in the Qinling–Daba Mountain Area of China, where the planned GI system includes protected areas (PAs), priority biodiversity zones (PBZs), eco-farming GI, and ecotourism GI. These elements are designed to support biodiversity conservation, water and soil preservation, and the development of eco-farming and ecotourism. Four categories of ESs—habitat, water–soil-related, food and material provisioning, and cultural services—were assessed and mapped to inform the identification and functional planning of GI elements. Additionally, 73 wildlife corridors were simulated to connect these GI elements, thereby enhancing habitat services for biodiversity. Strategic areas/points for GI development and management were identified, including densely populated townships within PAs or PBZs, or on wildlife corridors, as well as at intersections of wildlife corridors and human-made roads.
This case study demonstrates the framework’s potential for facilitating multifunctional GI planning. However, it also highlights challenges in its implementation, such as assessing the carrying capacity of GI for various human activities and simulating the connectivity of GI elements to achieve multifunctionality.

Author Contributions

Conceptualization, M.S. and S.L.; methodology, M.S. and S.L.; formal analysis, M.S. and F.P.; writing—original draft preparation, M.S.; writing—review and editing, M.S., S.L. and B.P.; visualization M.S. and F.P.; project administration, S.L.; funding acquisition, M.S., S.L. and F.P. All authors have read and agreed to the published version of the manuscript.

Funding

This research was funded by the Research Project of Humanities and Social Sciences of the Ministry of Education, China (grant number 23YJA630046), the National Natural Science Foundation of China (grant number 42401330, 42001229) and the Foundation of Key Laboratory of Law and Government, Ministry of Natural Resources of China, (grant number CUGFZ-2507).

Data Availability Statement

The data that support the findings of this research will be provided by request.

Conflicts of Interest

The authors declare no conflicts of interest.

Appendix A. Methods for Ecosystem Service Valuation: Unit-Based ES Valuation Method

The planning function of the GI system in the Qinling–Daba Mountain area is closely associated with four categories of ESs: habitat services (HES), water–soil-related services (WSES), food and material production services (FMPES), and cultural services (CES). We utilize the unit-based ES valuation method proposed and developed by [39,40,41] for the valuation of ESs, while extending it by incorporating spatial adjustment factors for FMPES and CES. This method first evaluates ES values based on the ecosystem types of land units and then adjusts these values according to the biophysical and socioeconomic characteristics of the land units. The valuation process involves establishing an equivalent coefficient table (ECT) and calculating the value of the standard equivalent factor (SEF). The method is illustrated below.

Appendix A.1. The Equivalent Coefficient Table (ECT) and the Standard Equivalent Factor (SEF) for ES Valuation

Based on the research conducted by Costanza et al. [42] and TEEB [43], Xie et al. [39] classify ecosystems into seven categories and 14 subcategories, while ESs are categorized into four categories and 11 subcategories. They developed an equivalent coefficient table (ECT) to represent the relative value of ESs provided by different ecosystems in relation to the standard equivalent factor (SEF). The value of the SEF is proposed to be estimated based on the food supply value of one hectare of farmland, which is suggested to be assessed according to the market price of crops. In this study, we construct an equivalent coefficient table (see Table A1) for the four categories of ESs relevant to our research, based on the ECT proposed by Xie et al. [39,40,41]. This table indicates the relative values of ESs in comparison to the SEF. For instance, the coefficient for the erosion prevention service provided by broad-leaved forests is 2.65, meaning that the value of this service from one hectare of broad-leaved forest is 2.65 times greater than that of the SEF.
Table A1. Equivalent coefficient table for ecosystem service valuation.
Ecosystem ServicesFood and Raw Material SupplyWater–Soil-Related ServicesHabitat ServicesCultural Services
Ecosystems
CategorySubcategoryFood SupplyRaw Material SupplyWater RetentionHydrological RegulationErosion PreventionSoil Fertility MaintenanceHabitat ServicesCultural and Recreational Services
farmlanddry land0.850.400.020.271.030.120.130.06
paddy field1.360.09−2.632.720.010.190.210.09
forestconiferous forest0.220.520.273.342.060.161.880.82
broad-leaved forest0.290.660.344.742.650.202.411.06
Bush0.190.430.223.351.720.131.570.69
grasslandprairie0.100.140.080.980.620.050.560.25
shrubs0.380.560.313.822.400.182.180.96
wetlandwetland0.510.502.5924.232.310.187.874.73
Bare landbare land0.000.000.000.030.020.000.020.01
water areawaterbody0.800.238.29102.240.930.072.551.89
glacier and snow0.000.002.167.130.000.000.010.09
construction areaconstruction area0.000.000.000.000.000.000.000.00

Appendix A.2. Spatial Adjustment Factor Designation and Application

The ES value of a unit is influenced not only by its ecosystem type but also by its biophysical and socioeconomic characteristics. Xie et al. [39] proposed several spatial adjustment factors to modify the ES values estimated solely based on ecosystem types. These factors include biomass (net primary productivity), precipitation, and erosion prevention capacity, which integrates soil properties, rainfall, landform, and land cover. For this study, we also incorporate population adjustment factors for food and raw material supply services, as well as scenic spot adjustment factors for cultural services. The adjustment factors are applied to the equivalent coefficient table (ECT) (Table A1) using Formulas (A1) to (A4).
F n i = N i × F n 1 O R R i × F n 2 O R S i × F n 3 O R P i × N i × F n 4 O R C i × N i × F n 5
where Fni is the adjusted equivalent coefficient for unit i. Ni, Ri, Si, Pi, and Ci represent the NPP adjustment factor, rainfall adjustment factor, soil erosion prevention adjustment factor, population adjustment factor, and scenic spot adjustment factor, respectively, for unit i. Fn1 denotes the equivalent coefficient for soil fertility maintenance service, habitat service, or cultural service. Fn2 refers to the equivalent coefficient for water supply service or hydrological regulation service. Fn3 indicates the equivalent coefficient for soil prevention service. Fn4 represents the equivalent coefficient for food or raw material supply service. Finally, Fn5 refers to the equivalent coefficient for cultural service.
Ni, Ri, and Si calculations are similar to that of Xie et al. ’s research [39], illustrated in Formula (A2).
N i = N P P i N P P ¯ , R i = P R E i P R E ¯ , S i = S C i S C ¯
where NPPi, PREi, and SCi are, respectively, the NPP (t/ha), annual precipitation (mm/ha), and soil conservation quantity (t/ha) for unit i. N P P ¯ , P R E ¯ , and S C ¯ are, respectively, the national average values for the above three indicators in China.
The calculation of Pi is informed by the analysis of population distribution in the study area, as outlined in Formula (A3). This indicates that units with higher population densities are assigned greater values for food and raw material provisioning services.
P i = ln P O P i P O P ¯ + N
N = min ( ln P O P i P O P ¯ )
where POPi is the population density of unit i, and P O P ¯ is the average population density in the study area1.
The calculation of Ci is based on the kernel density analysis of A-level scenic spots in the study area. China has established a standardized quality rating system for scenic spots, categorizing them into the 5A, 4A, 3A, 2A, and A grades. The density of A-level scenic spots reflects both the quantity and quality of tourism resources in the area. Kernel density mapping of A-level scenic spots was conducted for the study area using a cell size of 1 km2 (see Figure A1). Subsequently, Ci is calculated using Formula (A4).
C i = S C D i S C D ¯
where SCDi is the kernel density value of A-level scenic spots for unit i, and S C D ¯ is the national average value for this indicator. This calculation implies that a unit with a higher density of scenic spots is assigned a greater cultural service value.
Figure A1. Kernel density map of A-level scenic spots in Qinling–Daba Mountain Area.
Land 14 01287 g0a1

Appendix A.3. Ecosystem Service Valuation

When assessing the ES values of China’s terrestrial ecosystems, Xie et al. [41] proposed that the value of the SEF should be set at one-seventh of the national average market value of crops produced per hectare of farmland for a specific year. We adopt this method but utilize crop production and market data specific to the Qinling–Daba Mountain Area instead of the national average. Based on statistical data provided by the prefecture-level governments in the study area, the estimated value of the SEF for this study is 1794.3 CNY (approximately 260 USD).
Using the ecosystem map (Figure 1), the ECT (Table A1), the adjusted equivalent coefficients (Formulas (A1)–(A4)), and the SEF value, we estimated the values of the eight subcategory ESs. The values for HES, WSES, FMPES, and CES were calculated by combining the corresponding subcategory service values and subsequently mapped using ArcGIS (see Figure A2).
Figure A2. Ecosystem service values (ESV) in Qinling–Daba Mountain Area: (a) ESV of habitat services (HES), (b) ESV of water-and-soil-related services (WSES), (c) ESV of food and material provisioning services (FMPES), (d) ESV of cultural services (CES).
Land 14 01287 g0a2

Appendix B. Method for Green Infrastructure Connectivity Analysis: Minimum Cumulative Resistance Model

The Minimum Cumulative Resistance (MCR) model was employed for connectivity analysis to identify corridors linking Protected Areas (PAs) based on resistance surfaces and Formula (A5) [44,45,46]. The resistance surface was generated by evaluating multiple criteria relevant to the resistance of wildlife movement.
M C R = f min j = n i = m ( D i j × R i )
where MCR is the minimum cumulative resistance value, Dij is the distance between source j to unit i, Ri is the resistance value of unit i, and f indicates the positive correlation function between MCR and Dij and Ri. Since Natural Reserves (NS) are officially designated areas for wildlife protection in China, we use NRs as sources in the wildlife corridor simulation. The value of Ri was calculated through multi-criteria evaluation. The criteria (resistance factors) and their weighting and valuing schemes are shown in Table A2.
Table A2. Criteria, weighting, and valuing scheme for assessing wildlife movement resistance.
Resistance FactorWeightGrading StandardResistance ValueResistance FactorWeightGrading StandardResistance Value
land cover0.4forest, wetland1elevation
(m)
0.15<70010
grassland, waterbodies20700–100030
farmland501000–150050
bare land701500–200070
construction land90>200090
distance to roads (m)0.03<100090Slope (degree)0.10–8°10
1000–3000708–15°30
3000–50005015–25°50
5000–10,0003025–35°70
>10,00010>35°90
distance to railways
(m)
0.03<100090vegetation cover (%)0.210–2090
1000–30007020–4070
3000–50005040–6050
5000–10,0003060–8030
>10,0001080–10010
distance to waterbodies
(m)
0.05<100010distance to build-up areas (m)0.02<100090
1000–2000301000–300070
2000–5000503000–500050
5000–10,000705000–10,00030
>10,00090>10,00010

Note

1
Since the population density varies greatly in the study area, the log transformation is applied to control the impacts of a few extremely high values on the results. N is used for converting negative values to positive values.

References

  1. Liquete, C.; Kleeschulte, S.; Dige, G.; Maes, J.; Grizzetti, B.; Olah, B.; Zulian, G. Mapping Green Infrastructure Based on Ecosystem Services and Ecological Networks: A Pan-European Case Study. Environ. Sci. Policy 2015, 54, 268–280. [Google Scholar] [CrossRef]
  2. Seiwert, A.; Rößler, S. Understanding the Term Green Infrastructure: Origins, Rationales, Semantic Content and Purposes as Well as Its Relevance for Application in Spatial Planning. Land Use Policy 2020, 97, 104785. [Google Scholar] [CrossRef]
  3. World Bank Group. Investing in Urban Resilience: Protecting and Promoting Development in a Changing World; World Bank Group: Washington, DC, USA, 2016. [Google Scholar]
  4. Intergovernmental Panel on Climate Change. Climate Change 2022: Mitigation of Climate Change; Intergovernmental Panel on Climate Change: Geneva, Switzerland, 2022. [Google Scholar]
  5. European Commission. The Multifunctionality of Green Infrastructure. In Science for Environmental Policy; European Commission: Brussels, Belgium, 2012; p. 37. [Google Scholar]
  6. United States Environmental Protection Agency. Available online: https://www.epa.gov/green-infrastructure (accessed on 2 June 2024).
  7. Bohn, K.; Chu, D. Food-Productive Green Infrastructure: Enabling Agroecological Transitions from an Urban Design Perspective. Urban Agric. Reg. Food Syst. 2021, 6, e20017. [Google Scholar] [CrossRef]
  8. Cook, L.M.; Good, K.D.; Moretti, M.; Kremer, P.; Wadzuk, B.; Traver, R.; Smith, V. Towards the Intentional Multifunctionality of Urban Green Infrastructure: A Paradox of Choice? npj Urban Sustain. 2024, 4, 12. [Google Scholar] [CrossRef]
  9. Evans, D.L.; Falagán, N.; Hardman, C.A.; Kourmpetli, S.; Liu, L.; Mead, B.R.; Davies, J.A.C. Ecosystem Service Delivery by Urban Agriculture and Green Infrastructure—A Systematic Review. Ecosyst. Serv. 2022, 54, 101405. [Google Scholar] [CrossRef]
  10. Lourdes, K.T.; Hamel, P.; Gibbins, C.N.; Sanusi, R.; Azhar, B.; Lechner, A.M. Planning for Green Infrastructure Using Multiple Urban Ecosystem Service Models and Multicriteria Analysis. Landsc. Urban Plan. 2022, 226, 104500. [Google Scholar] [CrossRef]
  11. Rigo, R.; Houet, T.; Gonthier, C. Disseminating Land Use Land Cover Change Scenarios for Improving the Role of Blue and Green Infrastructure: Evaluation and Perspectives. Environ. Sci. Policy 2024, 160, 103821. [Google Scholar] [CrossRef]
  12. Connop, S.; Vandergert, P.; Eisenberg, B.; Collier, M.J.; Nash, C.; Clough, J.; Newport, D. Renaturing Cities Using a Regionally-Focused Biodiversity-Led Multifunctional Benefits Approach to Urban Green Infrastructure. Environ. Sci. Policy 2016, 62, 99–111. [Google Scholar] [CrossRef]
  13. Hansen, R.; Pauleit, S. From Multifunctionality to Multiple Ecosystem Services? A Conceptual Framework for Multifunctionality in Green Infrastructure Planning for Urban Areas. AMBIO 2014, 43, 516–529. [Google Scholar] [CrossRef]
  14. Korkou, M.; Tarigan, A.K.M.; Hanslin, H.M. The Multifunctionality Concept in Urban Green Infrastructure Planning: A Systematic Literature Review. Urban For. Urban Green. 2023, 85, 127975. [Google Scholar] [CrossRef]
  15. McPhearson, T.; Cook, E.M.; Berbés-Blázquez, M.; Cheng, C.; Grimm, N.B.; Andersson, E.; Barbosa, O.; Chandler, D.G.; Chang, H.; Chester, M.V.; et al. A Social-Ecological-Technological Systems Framework for Urban Ecosystem Services. One Earth 2022, 5, 505–518. [Google Scholar] [CrossRef]
  16. Apfelbeck, B.; Snep, R.P.H.; Hauck, T.E.; Ferguson, J.; Holy, M.; Jakoby, C.; Scott MacIvor, J.; Schär, L.; Taylor, M.; Weisser, W.W. Designing Wildlife-Inclusive Cities That Support Human-Animal Co-Existence. Landsc. Urban Plan. 2020, 200, 103817. [Google Scholar] [CrossRef]
  17. Karlsson, A.; Guillén, L.A.; Brukas, V. Regional Forest Green Infrastructure Planning and Collaborative Governance: A Case Study from Southern Sweden. Environ. Sci. Policy 2024, 160, 103840. [Google Scholar] [CrossRef]
  18. Serra, V.; Defraia, S.; Ledda, A.; Calia, G.; Corona, F.; De Montis, A.; Mulas, M. Ecological Network, Ecosystem Services, and Green Infrastructure Planning: A Method for the Metropolitan City of Cagliari, Italy. Netw. Spat. Econ. 2025, 25, 95–120. [Google Scholar] [CrossRef]
  19. Barreira, A.P.; Andraz, J.; Ferreira, V.; Panagopoulos, T. Perceptions and Preferences of Urban Residents for Green Infrastructure to Help Cities Adapt to Climate Change Threats. Cities 2023, 141, 104478. [Google Scholar] [CrossRef]
  20. Murkin, K.; Shiode, N.; Shiode, S.; Kidd, D. Biodiversity and the Recreational Value of Green Infrastructure in England. Sustainability 2023, 15, 2915. [Google Scholar] [CrossRef]
  21. Hansen, R.; Mattes, A.; Meier, M.; Kurths, A. Reorienting Urban Green Infrastructure Planning towards Biodiversity—Perspectives and Ongoing Debates from Germany. Urban For. Urban Green. 2023, 90, 128155. [Google Scholar] [CrossRef]
  22. Ignatieva, M.; Mofrad, F. Understanding Urban Green Spaces Typology’s Contribution to Comprehensive Green Infrastructure Planning: A Study of Canberra, the National Capital of Australia. Land 2023, 12, 950. [Google Scholar] [CrossRef]
  23. Wang, Z.; Li, Z.; Wang, Y.; Zheng, X.; Deng, X. Building Green Infrastructure for Mitigating Urban Flood Risk in Beijing, China. Urban For. Urban Green. 2024, 93, 128218. [Google Scholar] [CrossRef]
  24. Wang, A.; Wang, J.; Zhang, R.; Cao, S. Mitigating Urban Heat and Air Pollution Considering Green and Transportation Infrastructure. Transp. Res. Part A Policy Pract. 2024, 184, 104079. [Google Scholar] [CrossRef]
  25. Lovell, S.T.; Taylor, J.R. Supplying Urban Ecosystem Services through Multifunctional Green Infrastructure in the United States. Landsc. Ecol. 2013, 28, 1447–1463. [Google Scholar] [CrossRef]
  26. Sun, Z.; Sun, J.; Guo, H.; Jiang, H.; Gao, J.; Wang, J. A Dataset of Built-up Areas of Chinese Cities in 2020[DS/OL]. Sci. Data Bank 2021, 7, 184–198. [Google Scholar] [CrossRef]
  27. Li, J.; He, H.; Zeng, Q.; Chen, L.; Sun, R. Dataset of Soil Conservation Capacity Preventing Water Erosion in China (1992–2019)[DS/OL]. Sci. Data Bank 2023. [Google Scholar] [CrossRef]
  28. National Forestry Administration, PRC. Planning for Ecosystem Protection and Construction in National Key Ecological Function Areas; China Forestry Publishing Press: Beijing, China, 2017.
  29. National Development and Reform Commission; National Tourism Administration. National Ecotourism Development Plan (2016–2025); National Development and Reform Commission: Beijing, China, 2016.
  30. Office of the Leading Group for Poverty Alleviation and Development of the State Council. Guideline for China’s Rural Poverty Alleviation and Development (2011–2020); International Poverty Reduction Center in China: Beijing, China, 2011. [Google Scholar]
  31. Getis, A.; Ord, J.K. The Analysis of Spatial Association by Use of Distance Statistics. In Perspectives on Spatial Data Analysis; Anselin, L., Rey, S.J., Eds.; Springer: Berlin/Heidelberg, Germany, 2010; pp. 127–145. [Google Scholar]
  32. Yu, K. Security Patterns and Surface Model in Landscape Ecological Planning. Landsc. Urban Plan. 1996, 36, 1–17. [Google Scholar] [CrossRef]
  33. Jiang, H.; Peng, J.; Xu, D.; Tang, H. Constructing Ecological Security Patterns with Differentiated Management Intensity Based on Multifunctional Landscape Identification and Multi-Criteria Decision-Making. Glob. Ecol. Conserv. 2024, 50, e02862. [Google Scholar] [CrossRef]
  34. Ding, M.; Liu, W.; Xiao, L.; Zhong, F.; Lu, N.; Zhang, J.; Zhang, Z.; Xu, X.; Wang, K. Construction and Optimization Strategy of Ecological Security Pattern in a Rapidly Urbanizing Region: A Case Study in Central-South China. Ecol. Indic. 2022, 136, 108604. [Google Scholar] [CrossRef]
  35. Peng, J.; Yang, Y.; Liu, Y.; Hu, Y.; Du, Y.; Meersmans, J.; Qiu, S. Linking Ecosystem Services and Circuit Theory to Identify Ecological Security Patterns. Sci. Total Environ. 2018, 644, 781–790. [Google Scholar] [CrossRef]
  36. Song, T.; Li, D.; Zhang, L.; Wang, G.; Gao, Y.; Yang, C.; Feng, C.; Ma, H. Importance Evaluation of Ecosystem Services and Construction of Ecological Security Pattern in Qinba Mountain Area. Strateg. Study Chin. Acad. Eng. 2020, 22, 64–72. [Google Scholar] [CrossRef]
  37. Li, X.; Ma, B.; Lu, C.; Yang, H.; Sun, M. Spatial Pattern and Development of Protected Areas in the North-South Transitional Zone of China. Chin. Geogr. Sci. 2021, 31, 149–166. [Google Scholar] [CrossRef]
  38. Zhang, Y.; Yin, H.; Zhu, L.; Miao, C. Landscape Fragmentation in Qinling–Daba Mountains Nature Reserves and Its Influencing Factors. Land 2021, 10, 1124. [Google Scholar] [CrossRef]
  39. Xie, G.; Zhang, C.; Zhen, L.; Zhang, L. Dynamic Changes in the Value of China’s Ecosystem Services. Ecosyst. Serv. 2017, 26, 146–154. [Google Scholar] [CrossRef]
  40. Xie, G.; Zhen, L.; Lu, C.; Xiao, Y.; Chen, C. Expert Knowledge Based Valuation Method of Ecosystem Services in China. J. Nat. Resour. 2008, 23, 911–919. [Google Scholar]
  41. Xie, G.; Lu, C.; Leng, Y.; Zheng, D.; Li, S. Ecological Assets Valuation of the Tibetan Plateau. J. Nat. Resour. 2003, 18, 189–196. [Google Scholar]
  42. Costanza, R.; d’Arge, R.; de Groot, R.; Farber, S.; Grasso, M.; Hannon, B.; Limburg, K.; Naeem, S.; O’Neill, R.V.; Paruelo, J.; et al. The Value of the World’s Ecosystem Services and Natural Capital. Nature 1997, 387, 253–260. [Google Scholar] [CrossRef]
  43. TEEB. The Economics of Ecosystems and Biodiversity: Ecological and Economic Foundations; Earthscan: London, UK; Washington, DC, USA, 2010. [Google Scholar]
  44. Jiang, H.; Peng, J.; Dong, J.; Zhang, Z.; Xu, Z.; Meersmans, J. Linking Ecological Background and Demand to Identify Ecological Security Patterns across the Guangdong-Hong Kong-Macao Greater Bay Area in China. Landsc. Ecol. 2021, 36, 2135–2150. [Google Scholar] [CrossRef]
  45. Zhang, Z.; Niu, J.; Cheng, Q.; Wang, Z. Construction of Eco-tourism Corridor and Eco-tourism Area in Xinyang Section of Huaihe River Basin. Xinyang Norm. Univ. (Nat. Sci. Ed.) 2023, 36, 517–522. [Google Scholar]
  46. Zhai, H.; Zhang, Z.; Zhao, X.; Xie, Q.; Cheng, Q.; Hu, Y. Optimization of Green Infrastructure in Xinyang City Based on Network Structure Analysis. J. Xinyang Norm. Univ. (Nat. Sci. Ed.) 2021, 34, 260–266. [Google Scholar]
Figure 1. The differences between green infrastructure and other nature-based development approaches. Source: https://greeninfrastructureontario.org/what-is-green-infrastructure/ (accessed on 4 June 2025).
Land 14 01287 g001
Figure 2. Conceptual framework for green infrastructure planning for multifunctionality.
Land 14 01287 g002
Figure 3. Location, terrain, and ecosystem structure of the Qinling–Daba Mountain Area (QBMA), China.
Land 14 01287 g003
Figure 4. Interrelation between green infrastructure function performance and ecosystem service delivery.
Land 14 01287 g004
Figure 5. Hotspots of ecosystem services in Qinling–Daba Mountain Area. (a) hotspots of habitat service, (b) hotspots of water–soil-related services, (c) hotspots of food and material provisioning services, and (d) hotspots of cultural service.
Land 14 01287 g005
Figure 6. Green infrastructure (GI) elements for ecological functions and multifunctionality: (a) GI elements for ecological functions, (b) GI elements for multifunctionality.
Land 14 01287 g006
Figure 7. Simulated green infrastructure network in Qinling–Daba Mountain Area, China.
Land 14 01287 g007
Figure 8. Strategic areas for the green infrastructure construction and management in Qinling–Daba Moutain Area, China.
Land 14 01287 g008
Figure 9. Conceptual map of green infrastructure connectivity and strategic points.
Land 14 01287 g009
Figure 10. Strategic points for green infrastructure construction and management in Qinling–Daba Mountain Area, China.
Land 14 01287 g010
Table 1. Data sources and processing method.
DataResolution/
Year
SourceProcessing
Digital Elevation Model (DEM)30 m/2020NASA
https://www.nasa.gov (accessed on 19 May 2024)
Processed with ArcGIS 10.8 to obtain elevation and slope.
Land use and land cover30 m/2020CAS Earth Data Sharing and Service Portal
https://data.casearth.cn (accessed on 20 May 2024)
Reclassified into 12 ecosystems.
Normalized Difference Vegetation Index (NDVI)30 m/2020Resources and Environmental Science Data Center
https://www.resdc.cn (accessed on 19 May 2024)
Net Primary Production (NPP)500 m/2020United States Geological Survey (USGS)
https://www.usgs.gov (accessed on 19 May 2024)
Precipitation1000 m/2020National Earth System Science Data Centre
http://www.geodata.cn (accessed on 22 May 2024)
Soil retention data300 m/2020[26]
https://www.scidb.cn/en (accessed on 22 May 2024)
Built-up areas of Chinese cities10 m/2020[27]
https://www.scidb.cn/en (accessed on 25 May 2024)
Rivers and roads/Open Street Map, National Geomatics of China
https://www.openstreetmap.org
https://www.webmap.cn (accessed on 25 May 2024)
Natural reserves (NRs)/Geographic remote sensing ecological network platform
http://www.gisrs.cn/index.html (accessed on 1 June 2024)
Population1000 m/2019OakRidge National Laboratory
https://landscan.ornl.gov (accessed on 2 June 2024)
A-level scenic spots/Official website of Culture and Tourism BureauConverted to points with geographic coordinates in ArcGIS
Table 2. Criteria for planning green infrastructure functionality based on ecosystem service assessment.
CriteriaPlanning Function
Established natural reserves *Protected areas (PAs)
Hot spots of habitat services (HES)Protected areas
Intersections of HES and water-and-soil service (WSES) hotspotsProtected areas
WSES hotspots bot not HES hotspotsProtected buffer zone (PBZs)
Cultural service (CES) hotspots in PAs or PBZsEcotourism
Food and material production service (FMPES) hotspots in PAs or PBZsEco-farming
* Natural reserves in China are designated areas for the protection of specific ecosystems, wildlife species, and natural resources. They play a crucial role in biodiversity conservation.
Table 3. Multifunctionality of GI elements in each category.
Green Infrastructure TypeMultifunctionality
Protected AreaBiodiversity conservation and water and soil conservation
Protected Buffer ZoneWater and soil conservation
Eco-farming GIEco-farming development, biodiversity conservation, and water and soil conservation
Ecotourism GIEcotourism development, biodiversity conservation, and water and soil conservation
Disclaimer/Publisher’s Note: The statements, opinions and data contained in all publications are solely those of the individual author(s) and contributor(s) and not of MDPI and/or the editor(s). MDPI and/or the editor(s) disclaim responsibility for any injury to people or property resulting from any ideas, methods, instructions or products referred to in the content.

