1. Introduction
The forest, as a functional landscape unit, plays a fundamental role in the environmental, economic, and social balance, being one of the most valuable natural resources for many countries, including Portugal [
1,
2]. With about two-thirds of its territory covered by forest areas [
3,
4], the country is challenged by the need for management and ecosystem preservation [
5,
6]. However, in recent decades, the profitability and competitiveness of Portuguese forests have been compromised due to factors such as pests, diseases, and, in particular, forest fires [
6].
The configuration of forest landscapes, historically shaped by the interaction between human communities and local ecosystems, reveals a mosaic of land uses whose complexity reflects both cultural practices and natural dynamics [
7,
8]. However, in recent decades, this balance has been put to the test by increasing environmental, economic, and social pressure [
9], with forest fires being one of the main disruptive factors [
10,
11].
The frequency and intensity of fires have caused profound changes in the Portuguese rural landscape, contributing to the fragmentation of ecosystems, loss of biodiversity, and disruption of local economies [
8,
12].
At the same time, the social dimension of the problem is equally serious. In many interior regions of Portugal, the forest is not only a source of income, but a vital support for ageing and economically vulnerable populations [
9]. Their destruction directly affects the livelihoods of smallholders, whose incomes, often based on very low pensions, require greater dependence on the sustainable exploitation of available natural resources to increase incomes [
13,
14].
According to Van Eetvelde and Antrop (2024), rural landscapes, by definition, are dynamic spaces that result from the interaction between biophysical and socioeconomic elements [
15]. In Portugal, these landscapes have been profoundly altered in recent decades by processes such as agricultural intensification in areas of high suitability and [
9,
16], conversely, the abandonment of marginal and hard-to-reach areas. This second phenomenon has favoured the increased proliferation of spontaneous vegetation, as well as invasive species, resulting in the accumulation of combustible biomass and landscape homogenisation, making it more vulnerable to wildfire spreads [
6,
17].
The impact of fires on biodiversity and ecosystems is equally worrying. The destruction of vegetation cover directly affects wildlife, further fragments habitats, and compromises fundamental ecological processes, such as natural regeneration and water regulation [
18]. Post-fire ecological succession is often interrupted by factors such as erosion, soil compaction, or the introduction of exotic species, preventing the full recovery of ecosystems and contributing to the progressive degradation of the landscape. In addition, recurrent fires reduce the resilience of natural systems, making them susceptible to further disruption and the loss of essential ecosystem services [
19].
Understanding land use and land cover (LULC) and the evolution of land occupation in areas affected by fires is crucial for developing mitigation and adaptation strategies that acknowledge the ecological, cultural, and functional diversity of rural landscapes. Post-fire land cover transitions from forest to agriculture or shrubland occur globally, driven largely by fire size and vegetation diversity, and these patterns are mirrored in Portugal, where similar shifts undermine long-term ecosystem recovery [
20]. In the United States, however, political inertia and limited resources have impeded local land use regulation despite escalating wildfire losses, contrasting with Portugal’s more proactive fire-adapted land policies [
21].
Land use both shapes and is reshaped by fire regimes through ignition patterns, fuel loads, and suppression tactics; Portugal’s extensive post-fire fuel-management efforts exemplify a regional approach to these teleconnections [
22]. In Catalonia, forests and shrublands burn most readily while cultivated lands serve as refuges, underscoring how active agricultural stewardship and community firefighting units (e.g., GRAF) bolster landscape resilience, an approach Portugal has likewise begun to adopt through rural landscape management and traditional mosaic agriculture [
23].
The current research examines the dynamics of land use in areas affected by wildfires in mainland Portugal, highlighting the ecological, economic, and social impacts of these changes. By utilising thematic cartography developed by the Directorate-General for the Territory and conducting comparative analyses across different periods, this study aims to identify the spatial and temporal patterns of land use changes and the key factors influencing them. This approach will enhance our understanding of the effects of wildfires on land and assist in developing more effective management strategies that integrate conservation goals, rural development, and risk prevention.
To propose sustainable solutions, it is crucial to analyse rural landscapes as integrated socio-ecological systems. The enhancement of agroforestry systems, the promotion of diverse landscape mosaics, and the implementation of community management policies for natural resources are approaches recommended in the scientific literature [
11,
24,
25,
26]. These solutions not only reduce fire risk, but also enhance territorial cohesion and preserve local cultural identities.
The present study is, therefore, part of an interdisciplinary perspective that recognises forest fires as a complex phenomenon whose impacts go far beyond the immediate destruction of vegetation. Understanding the dynamics of land occupation, in the context of the transformations of Portuguese rural landscapes, is essential for an effective response to the environmental and social challenges of the twenty-first century. By conducting spatial and statistical analyses of the available data, this work seeks to offer a solid scientific basis for territorial planning, the creation of public policies, and the construction of more resilient, equitable, and adaptive forest management models.
2. Materials and Methods
This study aims to identify and characterise the main dynamics of the landscape in mainland Portugal following the occurrence of catastrophic events, with an emphasis on wildfires. To this end, the LULC (COS) maps for the years 1995, 2007, and 2018 were used, provided by the Directorate-General for Territory (DGT). The maps are accessible to the public through the portal of the National Geographic Information System (consulted on 25 January 2025) at the following address:
https://snig.dgterritorio.gov.pt/.
According to the Portuguese denomination (COS), the LULC used in this paper is a thematic cartography composed of polygons that represent homogeneous land use and occupation units. Each unit corresponds to a minimum area of 1 hectare, with a minimum width of 20 m and a predominance of 75% or more of a specific class of use and occupation [
3]. This data is homogenised by the DGT, guaranteeing that the degree of thematic accuracy is no less than 85%, which allows for a precise spatial representation that is comparable over time [
3].
The typology of land use and occupation is hierarchically organised into four detailed levels. At the least detailed level (level 1), nine main classes are defined: artificial territories, agriculture, pastures, agroforestry areas, forests, bushes (scrubland), bare or sparsely vegetated spaces, wetlands, and surface water bodies. These classes are later disaggregated into 83 classes that correspond to species associations at the most detailed level (level 4).
The COS used in this study allowed for a multitemporal and spatial assessment of changes in land use and occupation, contributing to the identification of relevant patterns of landscape transformation associated with the occurrence of forest fires.
To complement this observation, data on burned areas in mainland Portugal for the period from 1996 to 2018 was obtained from the Institute for the Conservation of Nature and Forests (ICNF), which is the official entity responsible for managing geographic information regarding areas affected by fires, accessible online (25 January 2025) at
https://geocatalogo.icnf.pt/. These data allow for the quantification and spatialisation of fires that occur over time.
To ensure the consistency of the analysed data, a selection criterion was adopted that focused on burned areas of at least 5 hectares. In some years during the study period, geographic information in vector format included all burned areas; however, for this analysis, only areas that were greater than 5 hectares were considered. This choice is justified by the fact that, in certain years, only fires with an area greater than this limit were mapped. Moreover, this minimum area is used in fire hazard mapping in Portugal [
27], ensuring the comparability of data over time.
2.1. Study Area
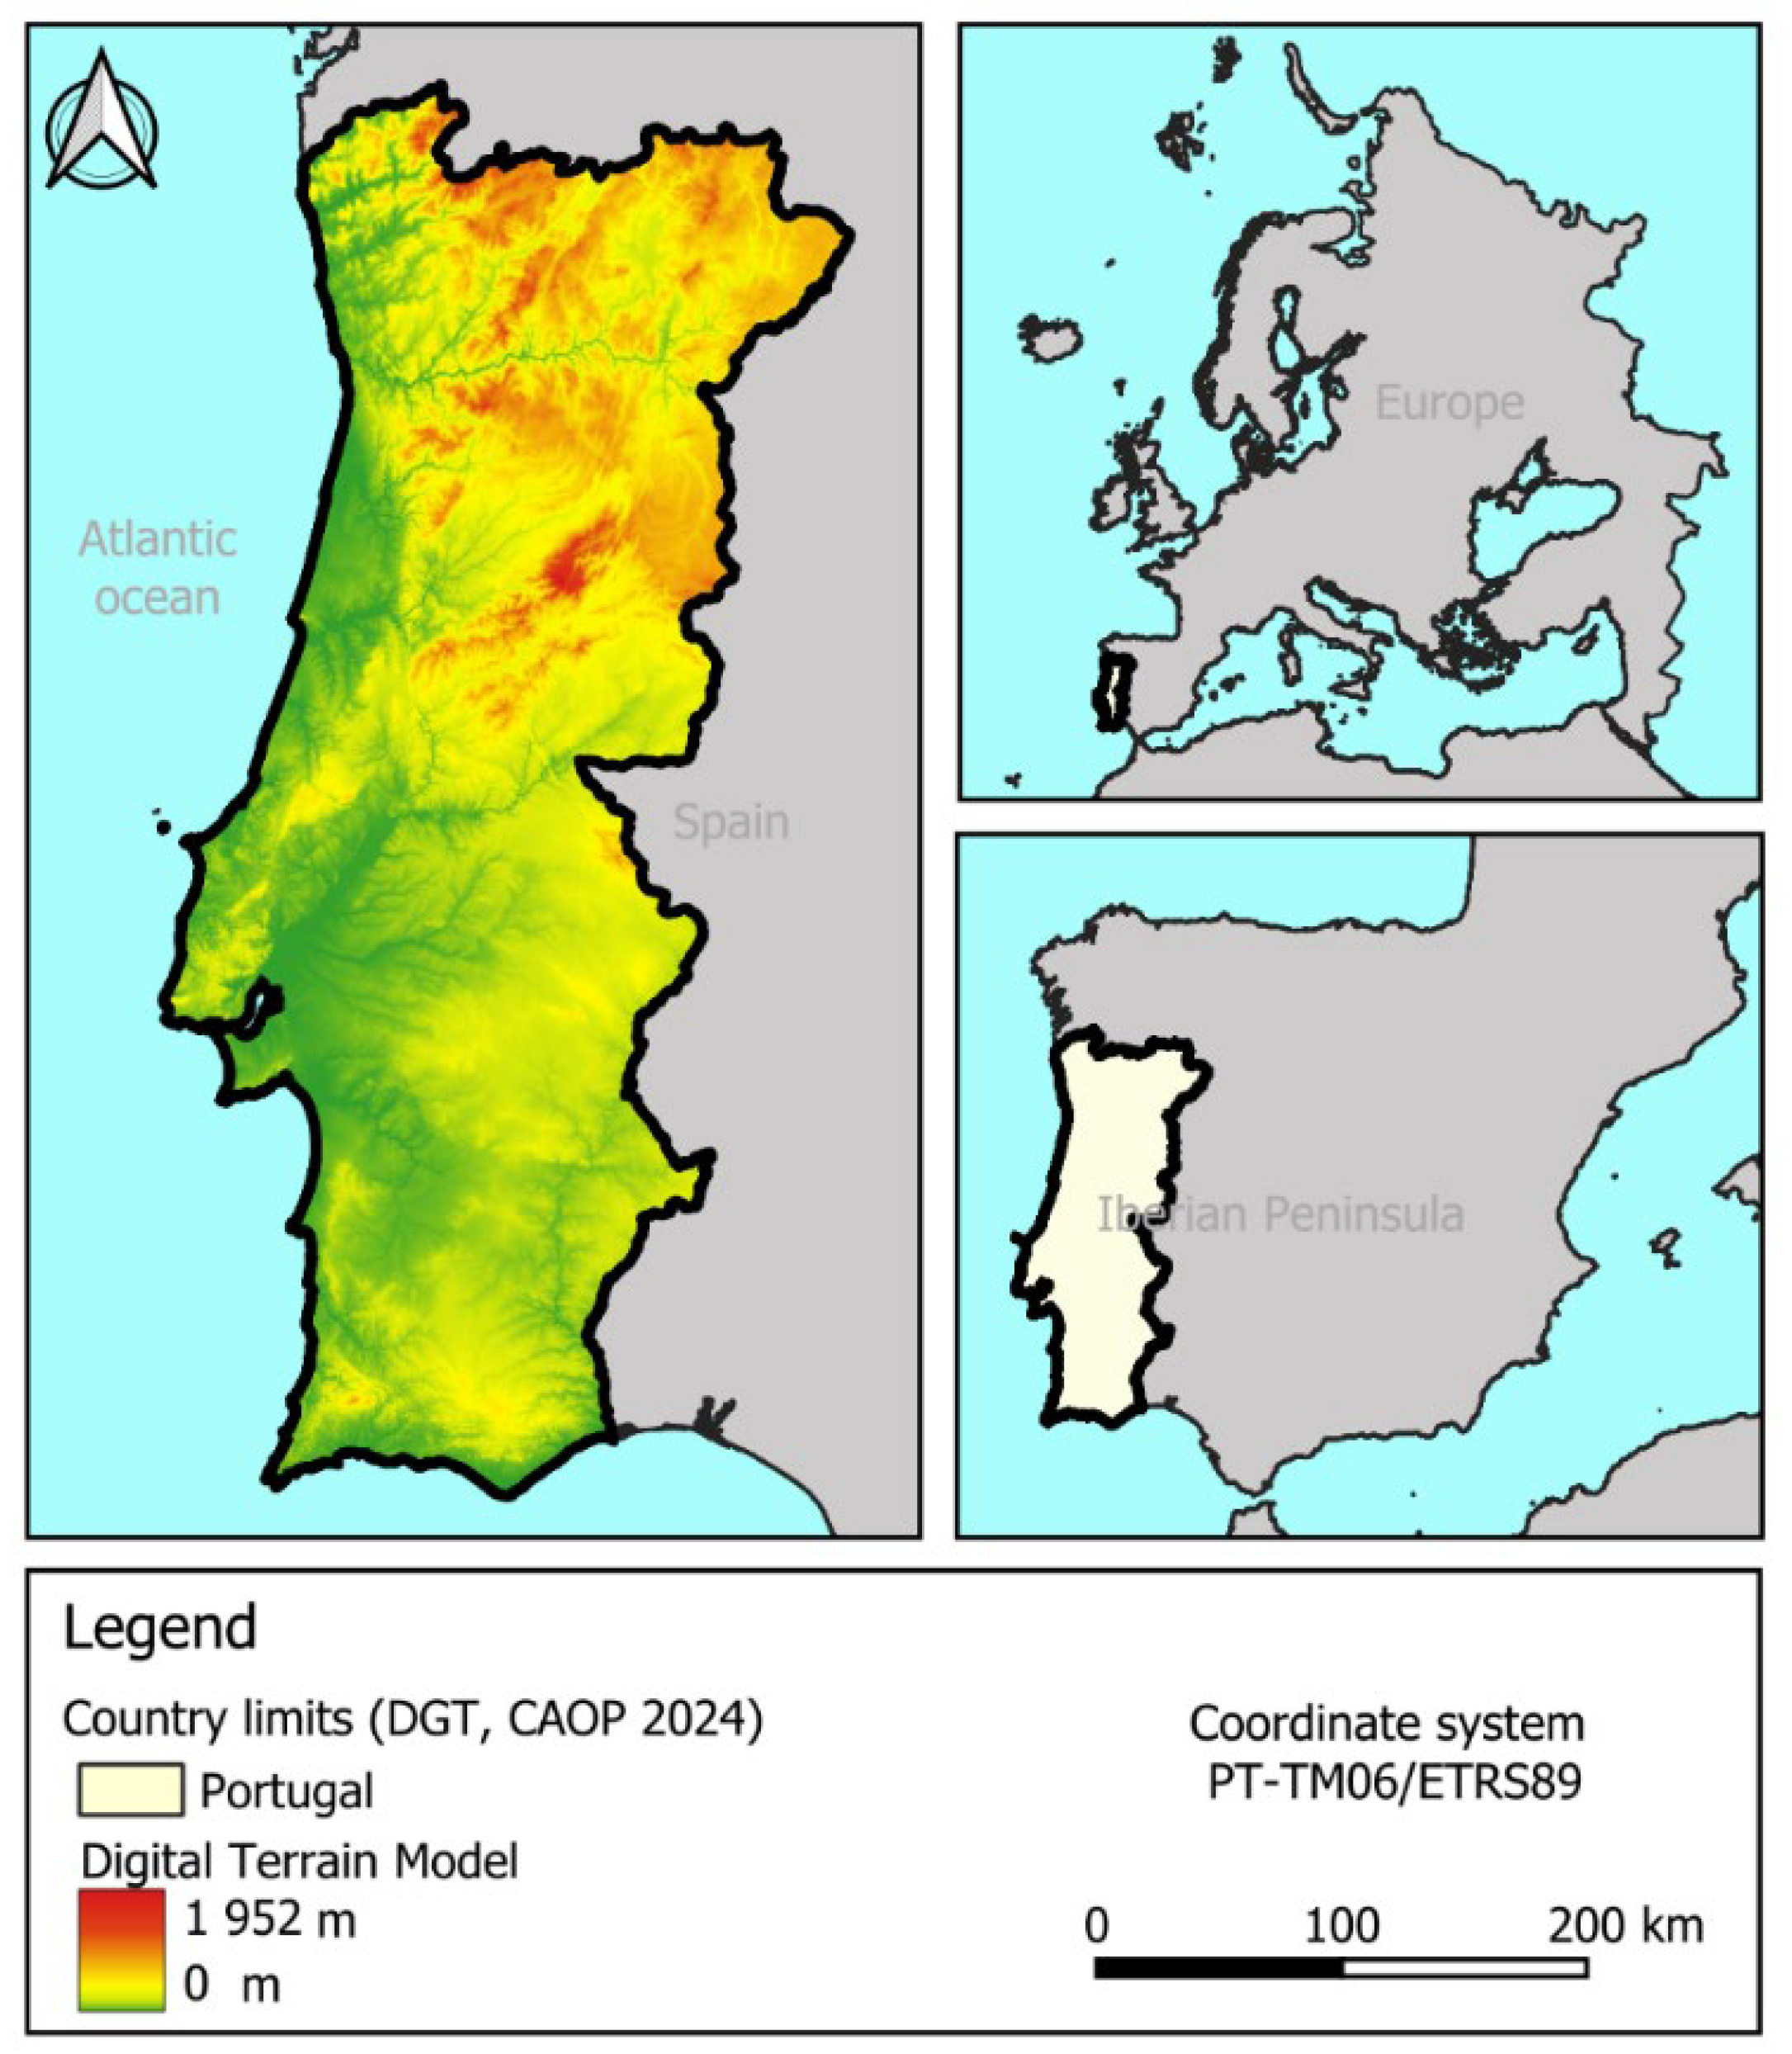
Mainland Portugal is in the extreme southwest of Europe, located in the Iberian Peninsula. The territory lies between Spain to the east and north and the Atlantic Ocean to the west and south, and is only a few hundred kilometres from North Africa. With an area of approximately 90,000 km
2, Portugal has a north–south significant geographical and climatic diversity that directly influences land use and occupation (
Figure 1).
The territory has a distinct relief between the north and south regions. In the north, mountainous regions predominate, particularly Serra da Estrela, which is home to the highest point in mainland Portugal, Torre, at an altitude of 1993 metres. To the south, the topography becomes progressively smoother, characterised by extensive plains. The Tagus River crosses the country in an east–west direction, dividing Portugal into two large regions with distinct geomorphological and land use characteristics.
The 2018 LULC Map (COS2018) illustrates how topographic differences influence vegetation distribution. In the northern region, forests and scrubland dominate, covering about 35% of the landscape. In contrast, south of the Tagus River, land use is more varied, comprising agricultural areas, pastures, and agroforestry surfaces (24%), along with forests and scrubland, which account for approximately 17% of the vegetation cover.
This territorial and environmental diversity makes mainland Portugal vulnerable to forest fires, especially in areas of greater vegetation density and rugged terrain, where the accumulation of biomass and climatic conditions favour the spread of fires [
28].
2.2. Methodology
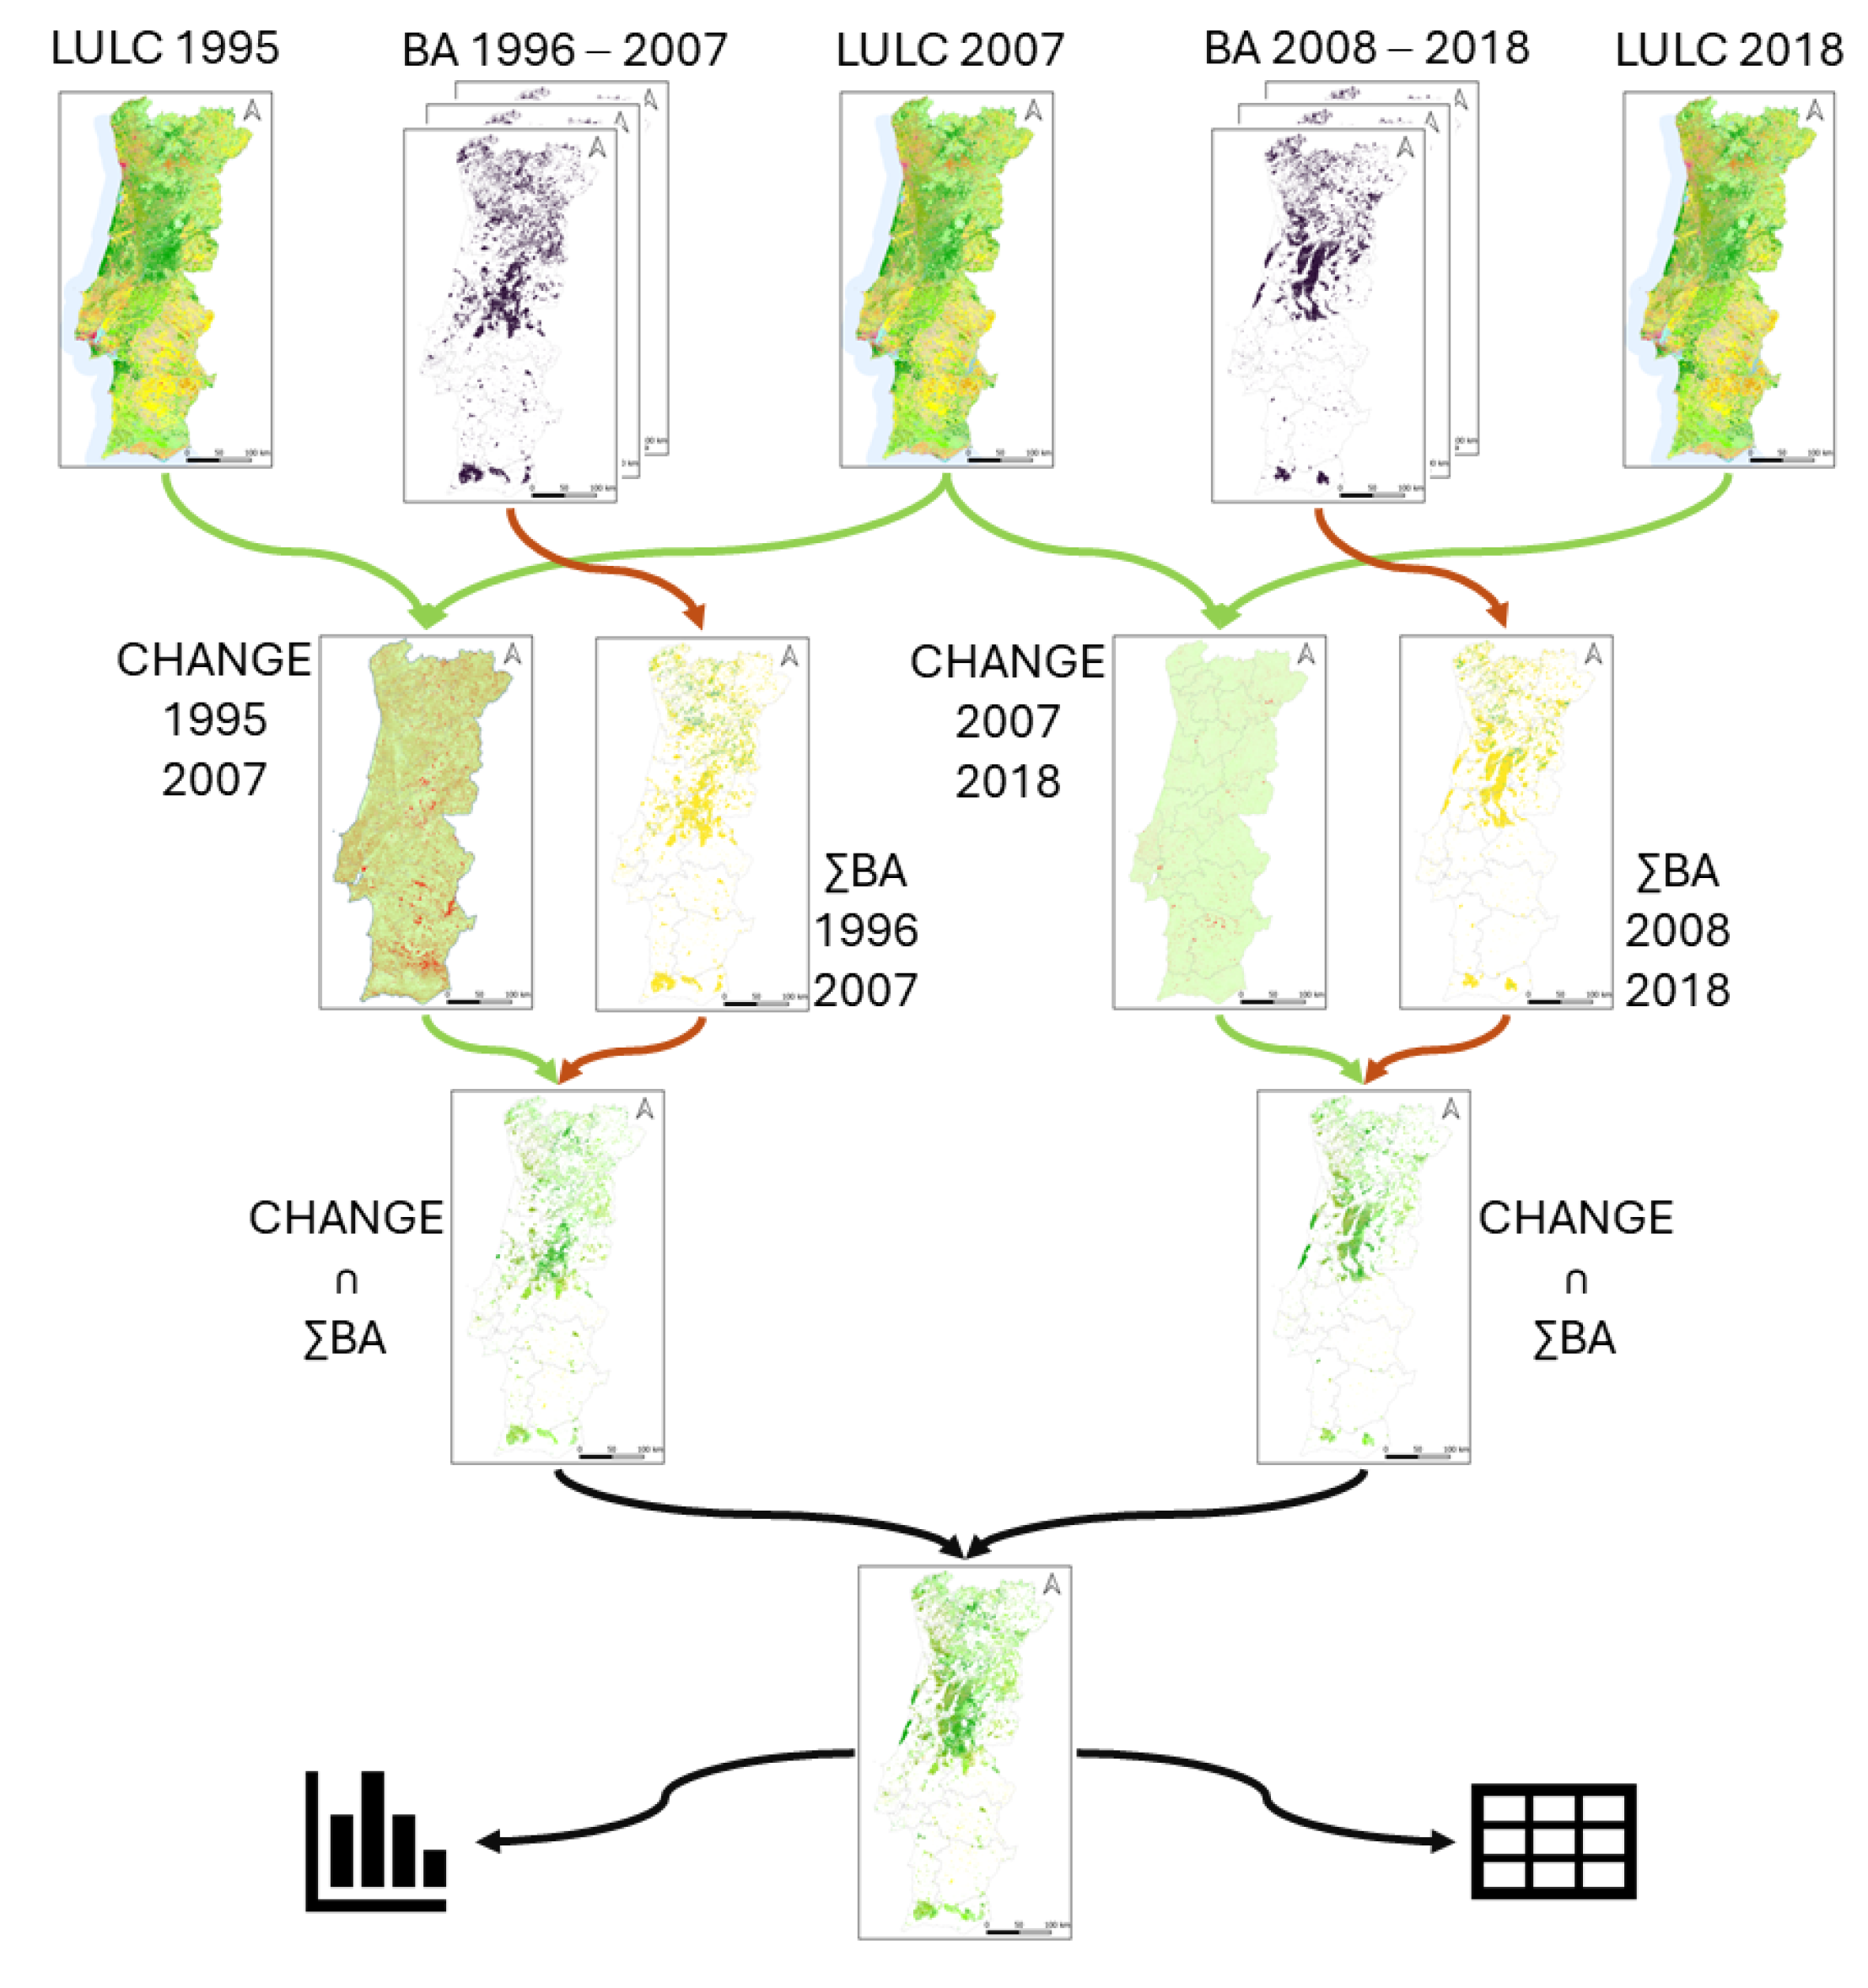
The analysis of landscape dynamics was conducted by examining the spatial overlap between LU and LC (LULC) maps and data related to burned areas, as shown in
Figure 2. This approach enabled the identification of landscape transformation patterns, comparing territories that have never been affected by fires with those that have burned one or more times, with some burning seven times in each of the periods under study (1995–2007 and 2007–2018). This made it possible to assess the changes in land use across various contexts and identify the types of vegetation cover that experienced the most significant alterations.
The study period was defined based on the availability of land use and occupation cartography for mainland Portugal. The LULC (COS) layers corresponding to the years 1995, 2007, and 2018 were used, as well as data on burned areas greater than 5 hectares, covering the interval between 1996 and 2018.
The choice of the initial year (1996) for the analysis of the burned areas stems from the fact that the 1995 COS (LULC) was elaborated from orthophoto maps acquired during the summer of that year, a process that has been adopted since, enabling error-free comparisons and allowing for the accurate assessment of post-fire landscape changes.
Data analysis was carried out using Geographic Information Systems (GIS) with the open-source software QGIS 3.34, focusing on the spatial intersection between burned areas and land occupation cartography. This approach enables a detailed understanding of the impacts of forest fires on land cover in Portugal.
The first procedure was to standardise the vector layers to ensure compatibility between the different reference years. The burned areas were grouped into two time periods: the first from 1996 to 2007 and the second from 2008 to 2018. The following procedure involved joining the burned areas layers corresponding to each period with the corresponding land cover layers, allowing for the identification of changes in burnt and non-burned areas of the landscape.
From the final layer obtained, the attribute table was extracted to perform statistical analyses on the dynamics of the landscape in each of the periods considered. The nine classes of COS (LULC) level 1 (least detailed level) were analysed, with a special focus on the transitions between forestry, bush (Scrubland), and agricultural classes in the areas affected by the fires. This approach enabled the mapping of mainland Portugal’s landscape dynamics, thus furthering our comprehension of land use change drivers.
3. Results
The analysis carried out in this study allows us to understand the dynamics of land occupation in mainland Portugal between the years 1995 and 2018.
Table 1 displays the distribution of land use, showing absolute (hectares) and relative (percentage) changes. Green indicates increases, red indicates decreases, and yellow indicates no change from the previous period.
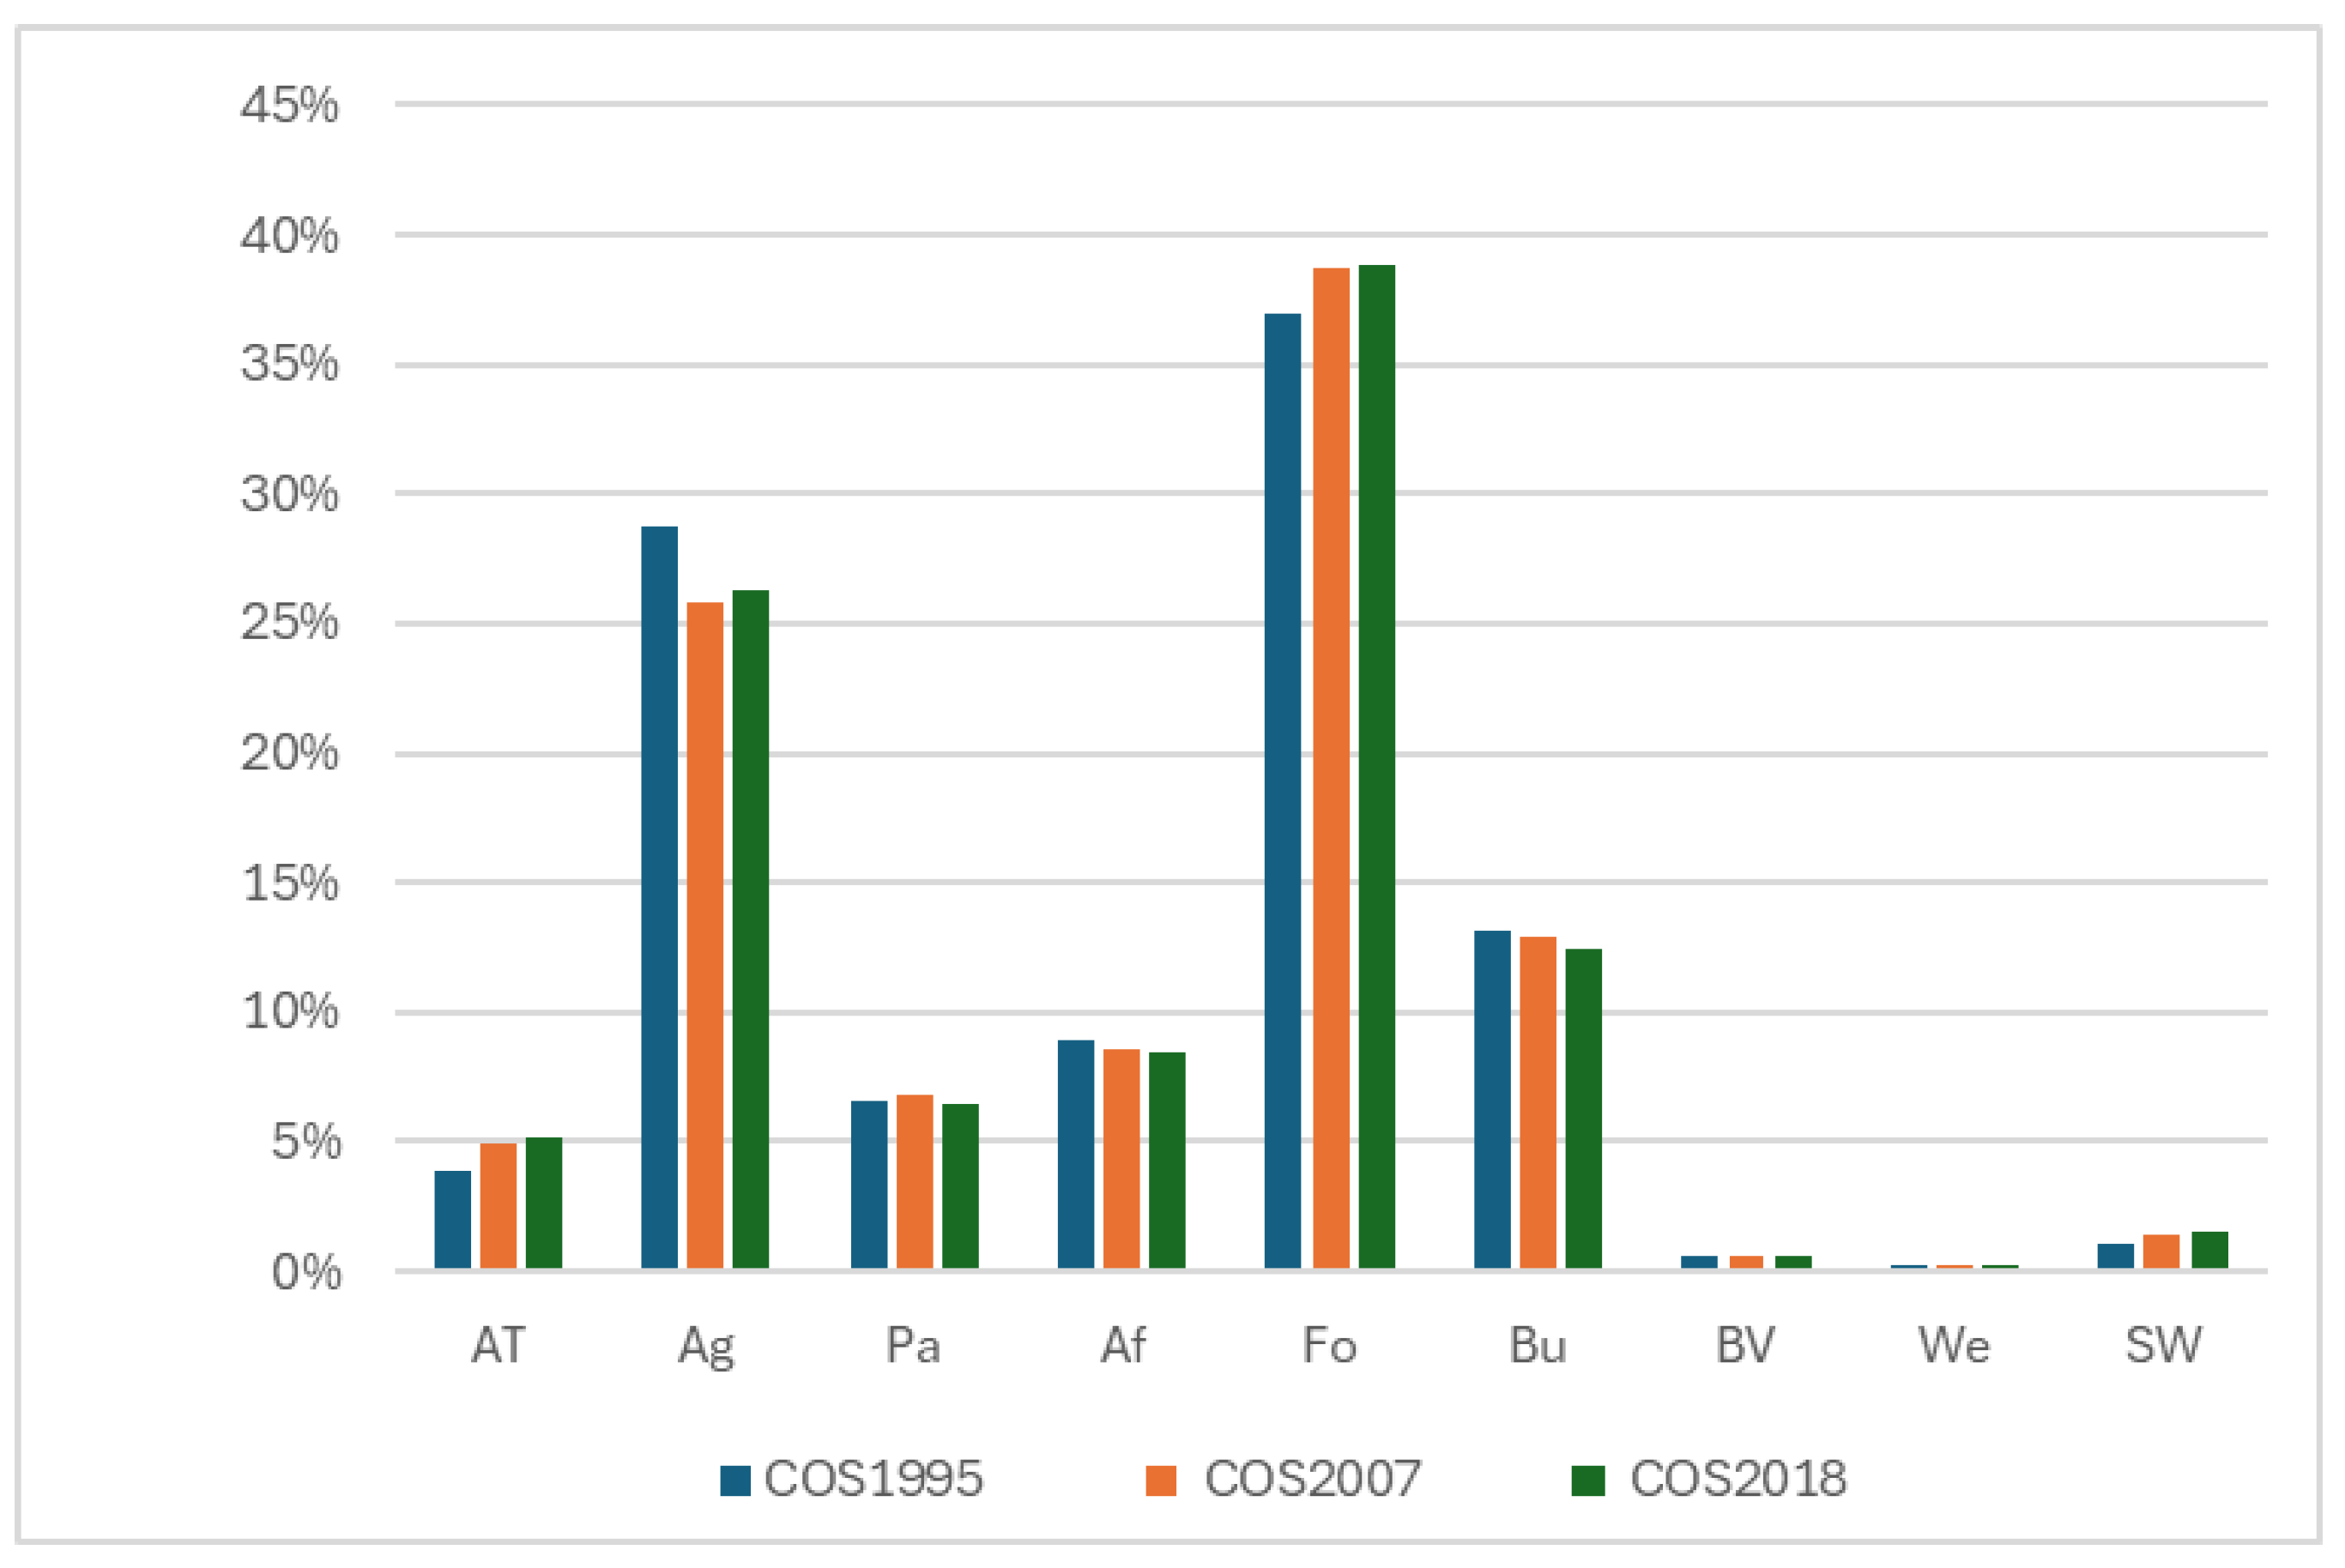
The results indicate that the most representative class over the analysed periods is forests. In 1995, this class occupied 36.9% of the total area, increasing to 38.7% in 2007 and to 38.8% in 2018. The absolute growth was 151,761 ha between 1995 and 2007 and there was an increase of 7126 ha between 2007 and 2018, possibly attributed to the fast-growing and economically more profitable Eucalyptus plantation.
The second most representative class is agriculture, which had 28.7% of the area in 1995, reducing to 25.9% in 2007 and later increasing to 26.3% in 2018. The absolute reduction between 1995 and 2007 was 250,469 ha, followed by a slight growth of 35,866 ha between 2007 and 2018; the decrease can be attributed to the rural exodus, and the increase can be attributed to agricultural policies in the European Union (CAP).
Scrubland represents the third most significant class, with 13.2% of the area in 1995, decreasing to 12.9% in 2007 and to 12.5% in 2018, revealing a downward trend over the period, possibly attributed to the need to use these spaces for forest conversion or natural ecological succession.
The analysis of the percentage variations in the land cover classes over the three periods allows us to identify the following main trends: Continuous increases in the classes of artificial territories, forests, and surface water bodies show continuous growth, expected throughout the studied period. The increase in the urbanised area stands out, which exhibits a growth from 3.9% in 1995 to 4.9% in 2007 and 5.2% in 2018, while the continuous decrease is observed in the classes of agroforestry surfaces, bushes, bare spaces, and wetlands show a trend of reduction over the years, although in different magnitudes, also justified by the facts presented with less visibility.
The agricultural class suffered a significant decrease between 1995 and 2007, followed by a slight increase until 2018 (
Figure 3). Pastureland exhibited the reversed trend between 1995 and 2018, expanding initially and then contracting slightly. Prolonged drought during this period probably necessitated the diversification of agricultural practices.
The descriptive statistical analysis confirms that, despite some oscillations, the distribution of land cover in mainland Portugal remained relatively stable throughout the studied period. The key changes observed were the expansion of urban areas and forests, while agricultural land and shrubland contracted. However, the global variations, except for some categories, were less than 1% of the total area studied, indicating relative stability in land use and occupation considering the COS (LULC) level 1 classes.
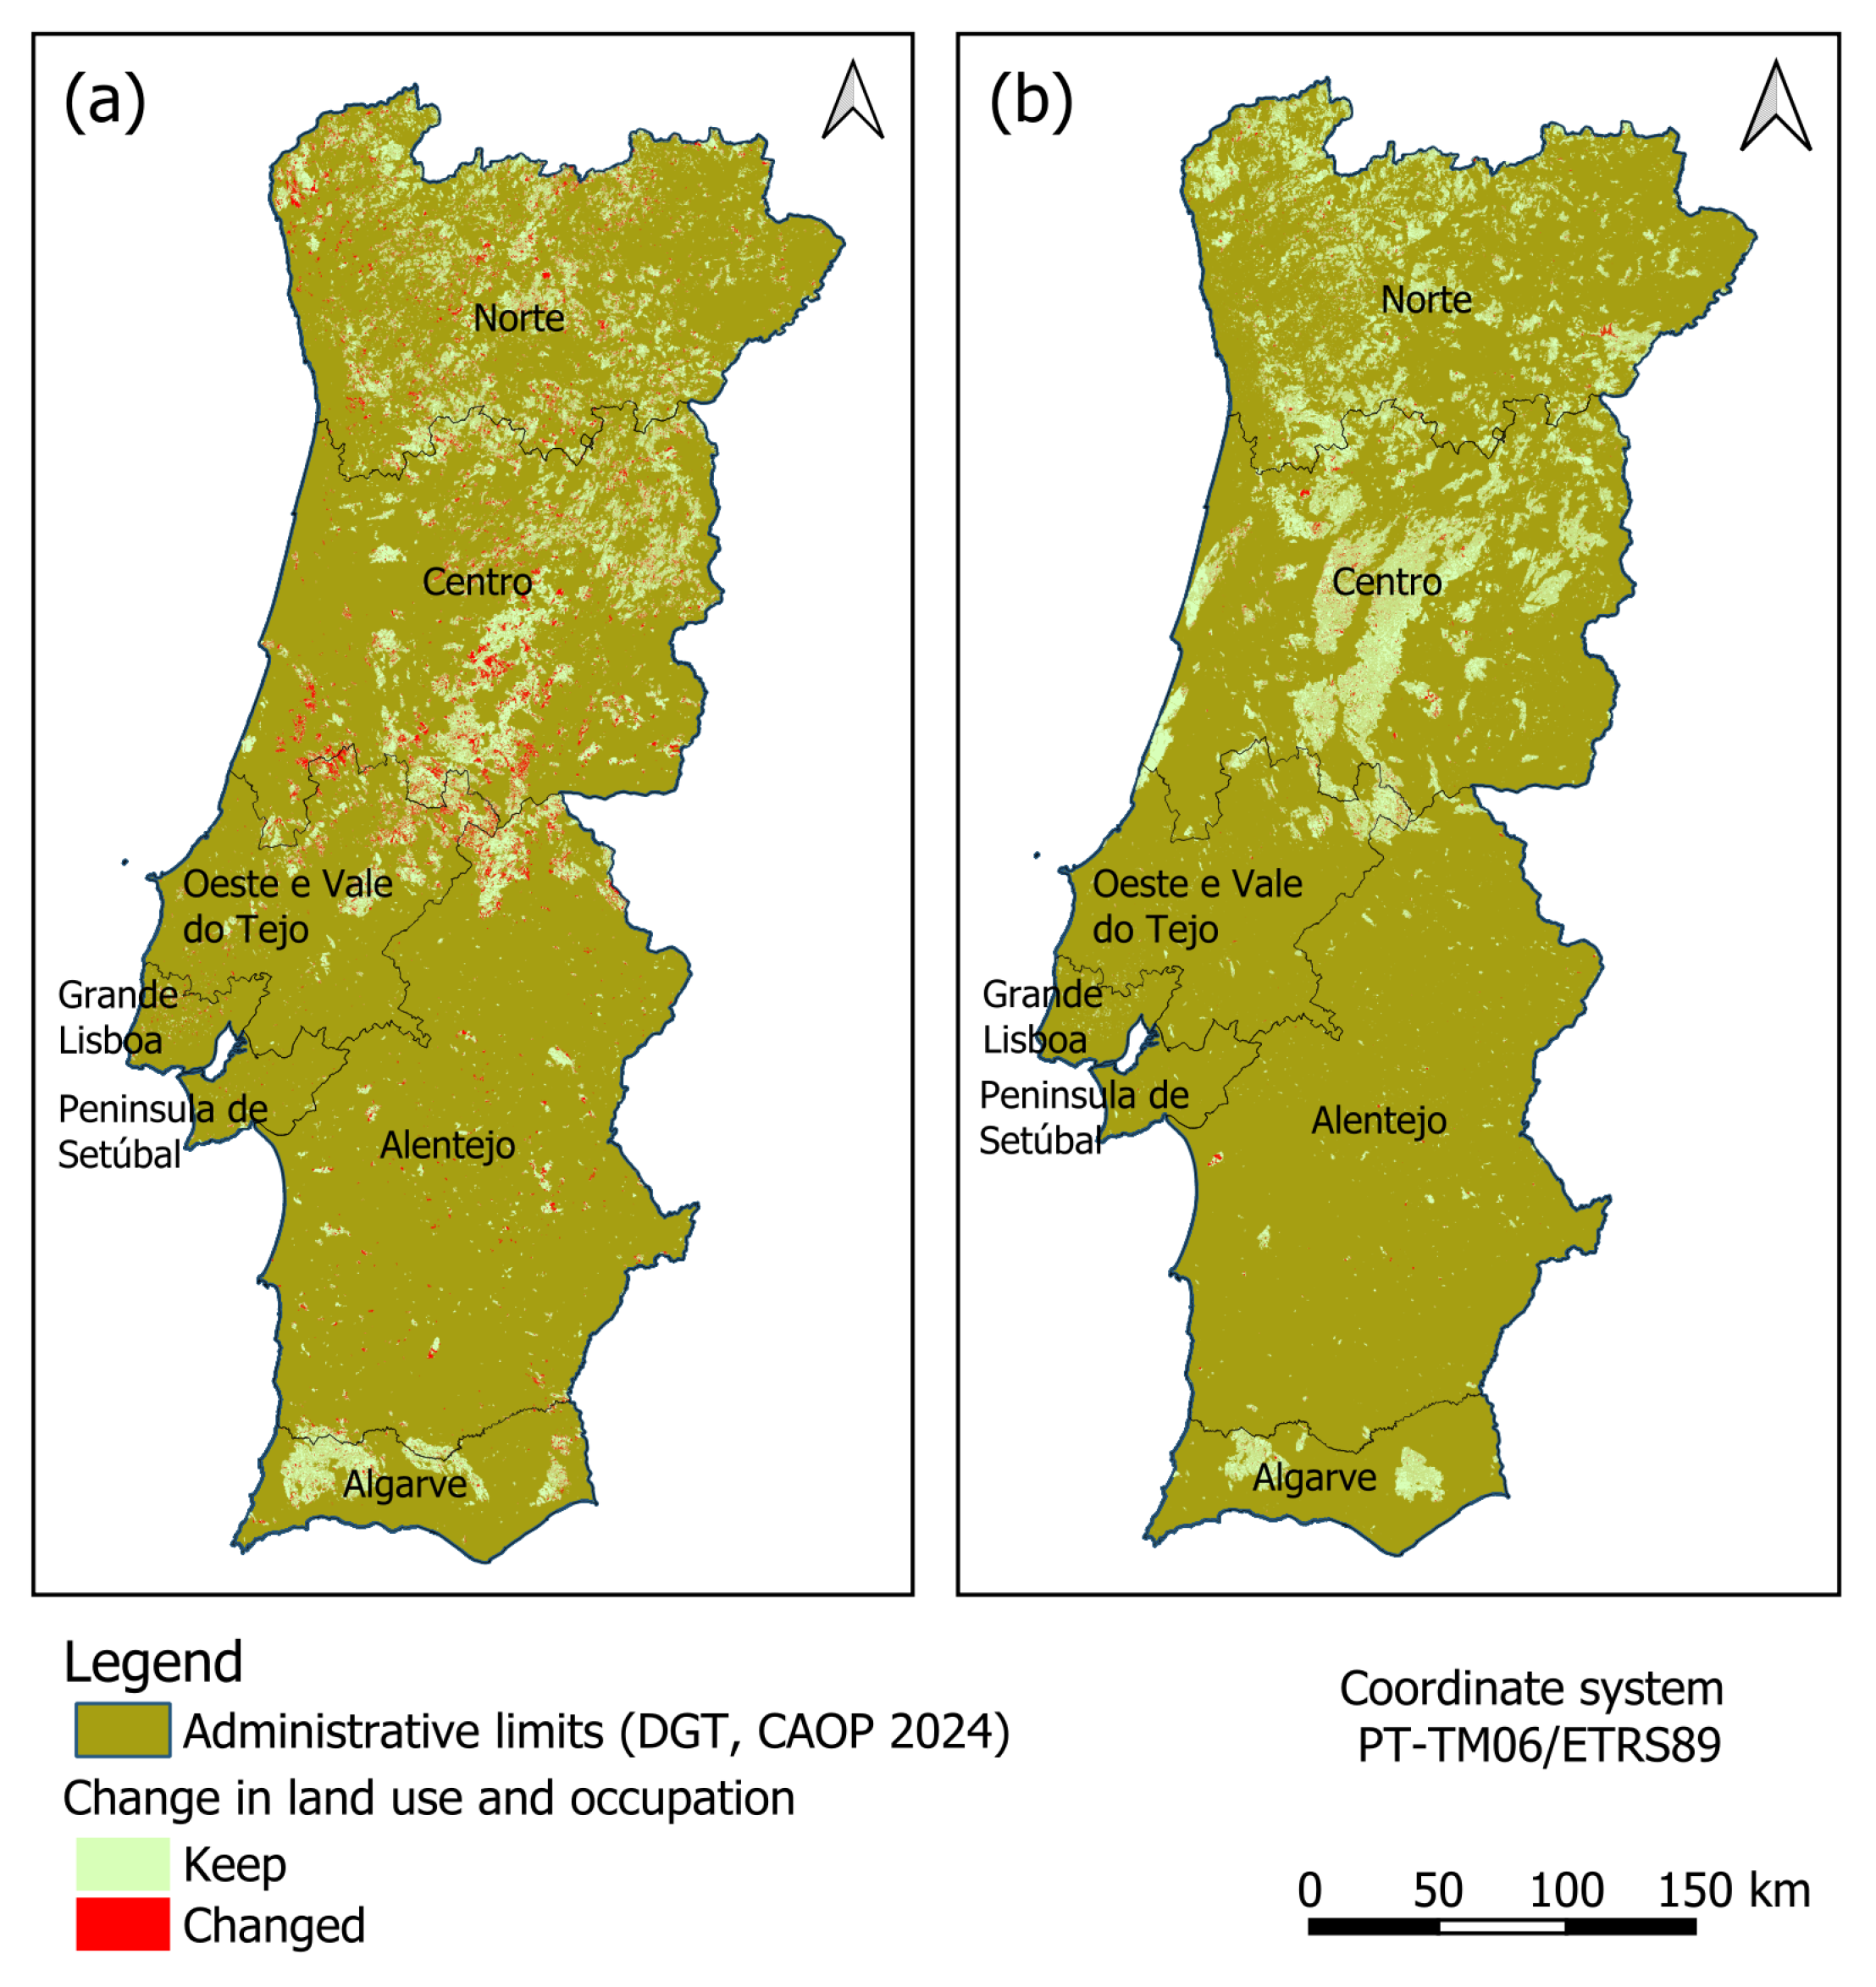
The spatial distribution of the changes does not occur homogeneously throughout the territory, as evidenced in the maps presented in
Figure 4. Map (a) corresponds to the union of COS1995 with COS2007, while map (b) corresponds to the second period, which joins COS2007 with COS2018. The results presented in maps (a) and (b) refer to the areas in which there are changes in the level 1 classes of the COS (LULC), with red representing the areas in which there was a change in classes and green the areas that remained unchanged.
At the national level, there was a significant reduction in total variations between the two periods. The period from 1995 to 2007 experienced greater variation than the period from 2007 to 2018, during which class changes were lower.
The largest variations in the first period (1995–2007) occurred in the regions south of the Tagus River, as shown in map (a) of
Figure 4, while in the second period (2007–2018), there was a generalised drop in variations in all regions, with small continuous patches, as seen in map (b).
In the first period (1995–2007) (map a), there was a greater change among the main level 1 classes of the land use and occupation chart; in the second period (2007–2018) (map b), these changes were no longer so significant. To better quantify the changes recorded in each class and each period,
Table 2 was constructed, where the results are presented regarding the changes observed in the areas that were not covered by fire in each of the periods, with the values in green corresponding to increases concerning the previous period, red corresponding to decreases, and yellow to those that remained stable.
The initials (ha) represent the differences between the lost and gained areas in each of the classes, the (%) is the presentation of the area in terms of percentage, and the (∆%) corresponds to the increase or decrease in the class concerning the initial area of that same class in terms of percentage.
An analysis of
Table 2 enables a better understanding of LULC class variation dynamics over the two periods (1995–2007 and 2007–2018). The classes of bushes and agroforestry areas showed a continuous reduction in both periods. In contrast, the agricultural sector experienced a 9.6% decrease between 1995 and 2007; this was followed by a small 1.3% recovery between 2007 and 2018.
The pasture class increased by 4.0% between 1995 and 2007 and then decreased by 5.3% between 2007 and 2018. Forestry, in turn, was the class that increased the most over the total period, with a significant growth of 156,152 hectares (6%) between 1995 and 2007, followed by a very small growth of only 302 hectares between 2007 and 2018.
The class of artificialized territories did not have a significant change, increasing from 1.2% (1995–2007) and only 0.3% (2007–2018), associated with modest urbanisation and road infrastructure. Likewise, surface water bodies grew 28.3% in the first period and 5.3% in the second, demonstrating the expansion of flooded areas due to the construction of several dams, including the Alqueva dam, considered the largest artificial lake in Portugal.
In order to understand the impacts caused by fires on land use change between the periods 1995–2007 and 2007–2018,
Table 3 was constructed, expressing LULC variation in classes in hectares (ha) and percentage (%) of the areas that fit in each of the periods, and the sum of
Table 2 and
Table 3 correspond to the total values of Portugal. Similar results were obtained by ALVES et al., 2022 [
29].
Artificial territories showed an increase in both periods, with a growth of 3441 ha (0.3%) between 1995 and 2007 and of 3008 ha (0.2%) between 2007 and 2018. In contrast, the agricultural class observed a significant reduction of 17,875 ha (−1.5%) in the first period, but showed an increase of 6952 ha (0.5%) in the second period.
Bush class behaviour differed markedly between periods. While there was an increase of 8197 ha (0.7%) between 1995 and 2007, there was a significant reduction of less than 16,552 ha (−1.1%) between 2007 and 2018, possibly due to changes in Portuguese forestry legislation in 2013 following the 2009 global financial crisis, which encouraged the conversion of these areas into forest plantations where the
Eucalyptus globulus species predominates, with economic interests for the pulp and paper industry [
30].
On the other hand, the forest class showed a constant growth over the analysed periods, with an increase of 5609 ha (0.5%) between 1995 and 2007 and 6825 ha (0.5%) between 2007 and 2018. This growth is consistent with the incentive for reforestation and the replacement of burnt areas by other forest occupations based on European funds [
31].
The spatial distribution of changes in the areas covered by fire does not occur homogeneously throughout the territory, as evidenced in the maps in
Figure 5. The changes are further pronounced in the period 1995–2007 in the regions of Alentejo and Oeste e Vale do Tejo, and in the Norte, Centro, and Algarve (NUTS II) regions, there was a smaller variation in land occupation in the burned areas, as can be seen in map (a) of
Figure 5; in the second period (2007–2018), there was a generalised drop in variations throughout the country, and in the burned areas, the same trends are observed as in those that did not burn, as shown in map (b) of
Figure 5.
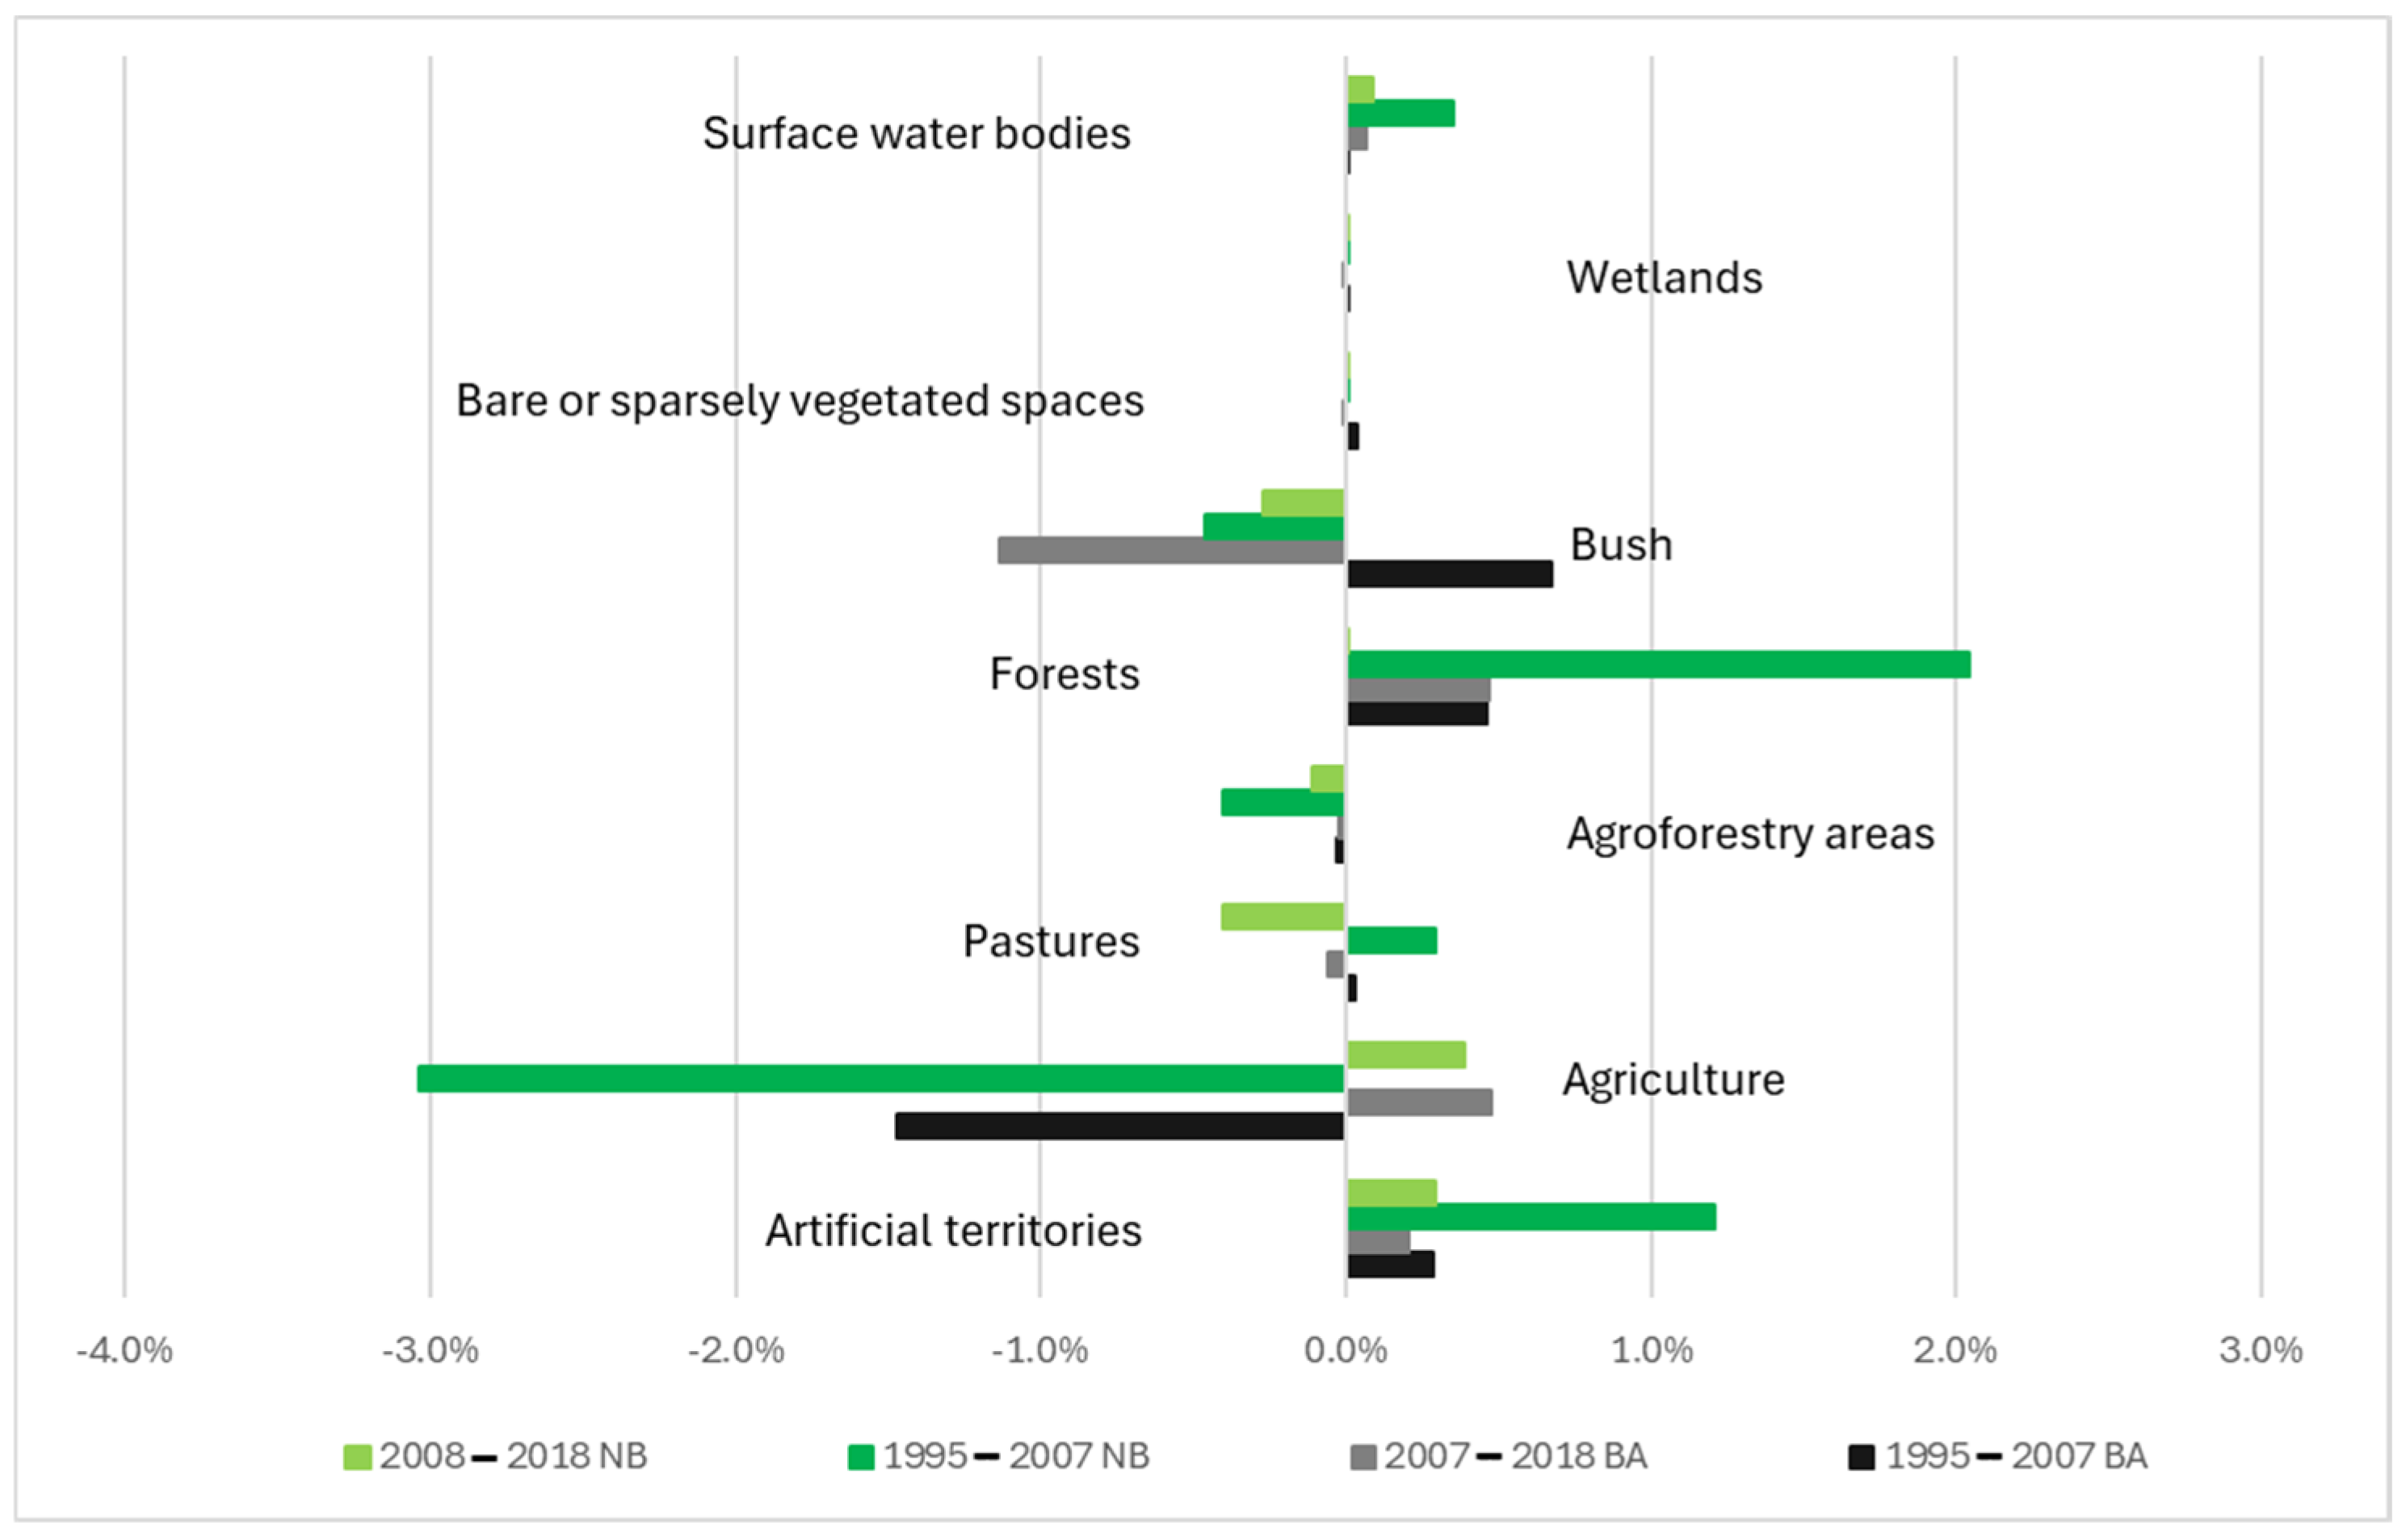
To evaluate the influence of fires on the dynamics of land occupation, the burned area data were compared with the non-burned area data. In this way, we were able to present, in a graphical form (
Figure 6), the data exhibited in
Table 2 and
Table 3, where it is possible to observe the percentage that each class increases or decreases by in each of the periods in the the areas that did not burn as well as those that did.
The agricultural class observed a loss of −1.5% in burnt areas, while in non-burnt areas, the reduction was even greater, reaching −3% in the first period (1995–2007). In the following period (2007–2018), there was a growth of 0.5% in burned areas and 7.3% in non-burned areas.
The bush class denoted an increase in the areas covered by fires until 2007, followed by a strong reduction between 2007 and 2018. This suggests that, after fire occurrence, part of these areas are occupied by other types of vegetation.
Forests and artificial territories, on the other hand, showed an increase in both periods, regardless of the occurrence of fires. This growth suggests a pattern of conversion of areas from bush and agriculture to forest.
To be able to identify which plant associations or species contribute most to the dynamics of the landscape, the classes, agriculture, bushes, and forests (level 1) that represent more than 75% of the area of the national territory were analysed, considering that, in these three classes, there are four forest compositions, bushes, and temporary rainfed and irrigated crops, which represent 70% of the areas that did not burn and 90% of the areas that did.
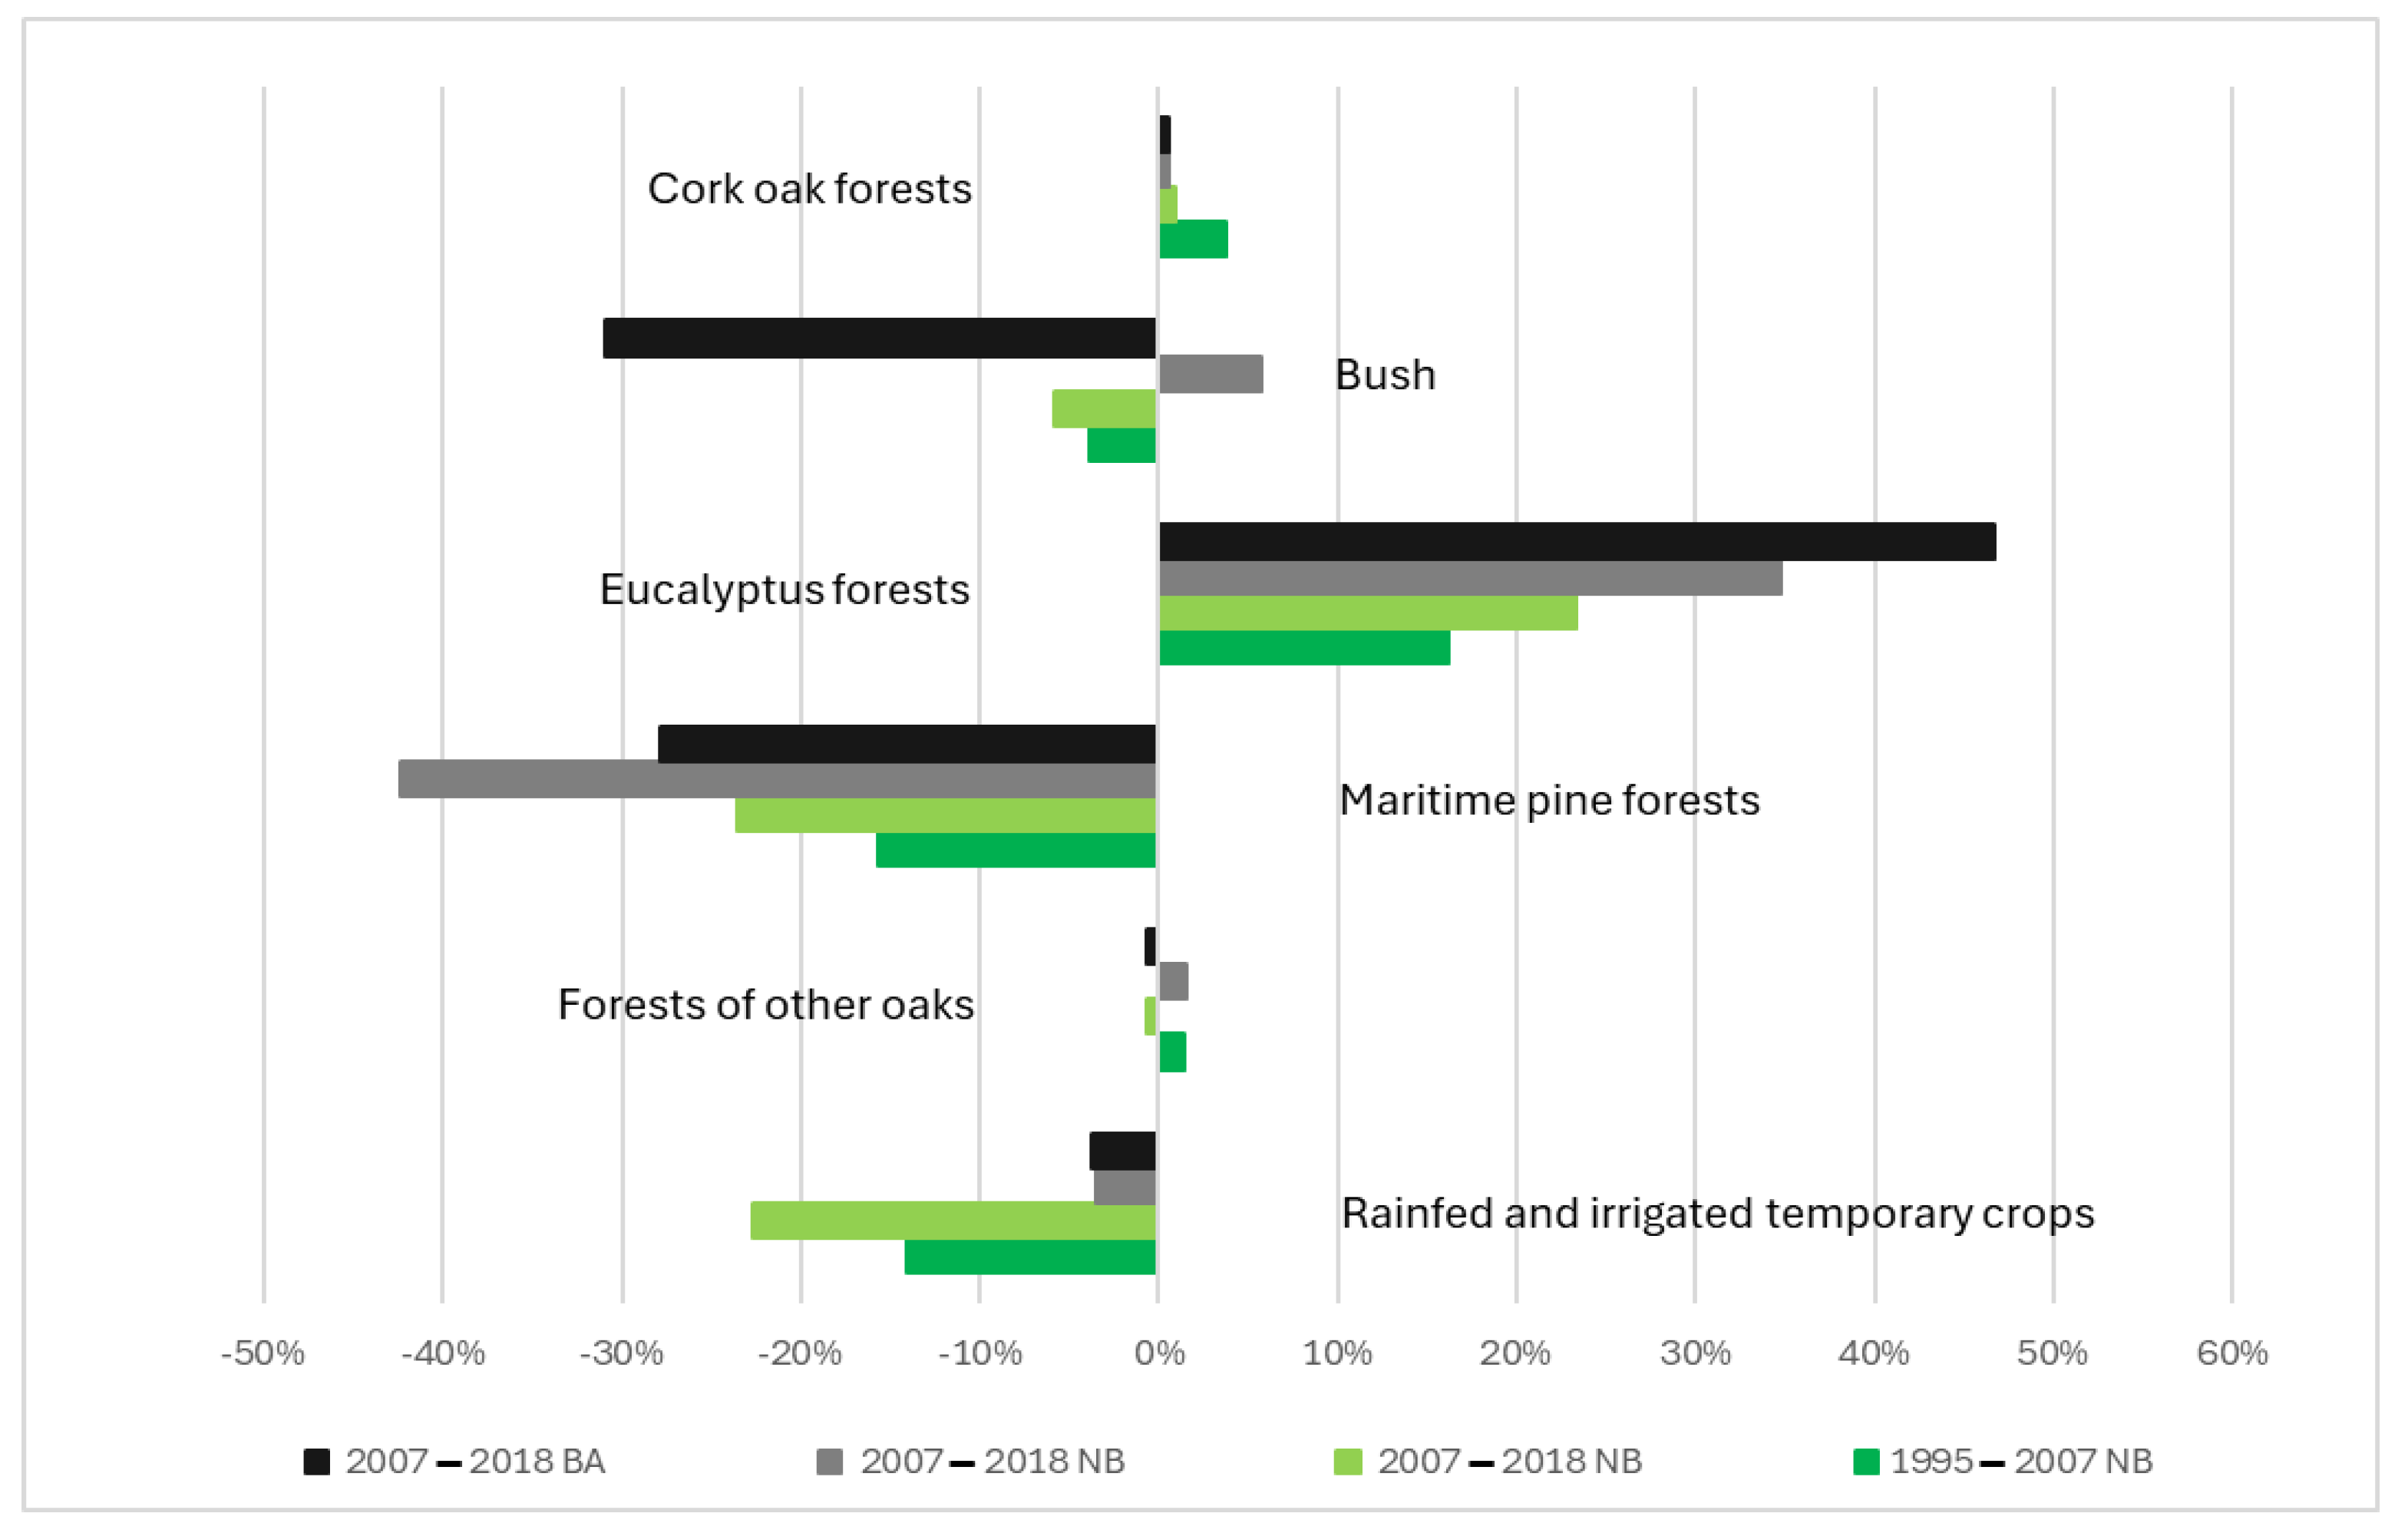
The graph in
Figure 7 shows the percentage change in the main land use (LU) classes at the most detailed level of COS (level 4) in areas travelled (BA) and not travelled (NB) by forest fires over the periods 1995–2007 and 2007–2018. The observed trends show distinct patterns of transformation of the territory, reflecting both post-fire ecological dynamics and public policies [
32] and changes in productive land uses [
14,
33].
Rainfed and irrigated temporary crops show a trend of marked regression of this class, with a reduction in −14% (NB) and −4% (BA) in the period 1995–2007, intensified in the period 2007–2018 to −23% (NB), maintaining −4% in burned areas. These data point to the progressive abandonment of extensive agriculture, especially in regions not affected by fires, possibly due to urbanisation, the ageing of the rural population, and the lack of incentives to maintain traditional agricultural activity and climate change.
Eucalyptus forests are the class that showed continuous and expressive growth, being the one with the highest percentage increase among all classes. Between 1995 and 2007, there was a growth of 16% (NB) and 35% (BA), which increased further in the following period to 23% (NB) and 47% (BA). This pattern emphasises an active process of forest replacement, with special incidence in areas affected by fires, which can be attributed to the rapid regeneration of eucalyptus and the liberalisation of its plantation in the period from 2013 onwards.
Maritime pine forests were the class that showed the highest relative losses, particularly in burnt areas, with reductions of −42% (BA) in 1995–2007 and −28% in 2007–2018. Even in non-burnt areas, the decline was significant (−16% and −23%). Maritime pine’s vulnerability to fire and limited post-fire regeneration, exacerbated by increasing fire frequency in some regions, has led to its gradual replacement by more resilient and economically viable species. Moreover, this species has been the target of pests, nematodes, and processionary caterpillars, which aggravates this fact [
34].
Cork oak forests showed relative stability, with moderate percentage increases between 1% and 4%, both in burnt and unburned areas. Its stability likely stems from its legal protection and socio-economic importance, especially in cork production. The slow growth rate, which discourages economic interest, explains the slight growth.
The occupation that remained relatively stable was forests made up of other oaks, with minimal variations. There was a slight increase in the period 1995–2007 (1% NB and 2% BA), followed by a slight reduction in the second interval (−1% in both areas). The absence of strong policies to encourage the regeneration of oak trees may justify this stagnation, as well as their low use in important economic activities.
On the other hand, the bushes show variable behaviour: a slight growth (6%) in burnt areas in the first period, followed by a drastic reduction (−31%) in the second period (2007–2018). In the non-burnt areas, the losses were less pronounced (−4% and −6%). The post-2007 reduction in burnt areas may be related to forest conversions encouraged by national and European public policies, such as the promotion of eucalyptus and other commercial species.
The classes most impacted by fires are maritime pine (negatively) and eucalyptus (positively).
Agriculture shows a trend of abandonment, both in burnt and non-burnt areas, resulting in a landscape conversion of remote regions of the Portuguese interior with the loss of human occupation and consequent practice of traditional agriculture in favour of the cultivation of eucalyptus with rapid growth and relevant economic value. This change, associated with the growth of digitalisation, is concerning for the future of the Portuguese rural landscape, when the abandonment of eucalyptus plantations will become a reality.
4. Discussion
The results obtained in this study reveal a transformation of land occupation and use in mainland Portugal between 1995 and 2018, evidencing a complex interaction between ecological dynamics, socioeconomic factors, and public policies. Despite the apparent global stability of the landscape, when analysed at a more aggregate level (COS level 1), significant changes are observed at more detailed scales, with emphasis being placed on the decline of traditional agriculture, the regression of bushes, and the significant growth of exotic species forests, particularly eucalyptus [
12,
31].
This forest replacement, which intensifies especially in areas covered by fires, points to a conversion pattern guided by short-term logics, favouring fast-growing species to the detriment of more resilient and multifunctional systems.
The abandonment of temporary rainfed and irrigated crops, both in burnt and unburned areas, reflects a continuous process of devaluation of extensive agricultural practices, strongly conditioned by the ageing of the rural population and the lack of structural incentives to maintain agricultural activity [
9,
10].
Concurrently, the decrease in maritime pine, with accentuated losses especially in burnt areas, reinforces its fragility, not only due to diseases and pests, but also due to the increase in the frequency and intensity of fires, aggravated by poor natural regeneration and the absence of effective protection policies [
9,
34]. In contrast, eucalyptus emerged as the dominant species in expansion, especially after 2013, reflecting the liberalisation of the plantation regime and its high capacity for post-fire regeneration. This trend has serious implications for the ecological sustainability of the landscape, given the association this species has with the greater flammability of ecosystems and soil degradation [
31,
35]. This liberalisation has given rise to an intriguing social and economic trend in which abandoned properties are acquired at low prices to plant eucalyptus trees as an investment. After the first harvest at seven years, the initial costs of purchase and planting are recouped, while subsequent harvests at fourteen and twenty-one years generate substantial profits with minimal additional investment, as this species naturally regenerates. This scenario has been promoted as an economic alternative for low-production lands, but, unfortunately, it has also extended to productive lands.
The relative stability of classes such as cork oak and oak forests, although positive, denounces the active policies for native species valorisation, which continue to occupy small areas and show minor dynamics in terms of expansion.
Spatial analysis also shows that the greatest changes occurred in the first period (1995–2007), especially in the regions south of the Tagus, suggesting that the first decade of the 21st century was particularly critical in the reconfiguration of land use [
4,
9]. Furthermore, Portugal’s accession to the Schengen area in 1995 contributed indirectly to the further abandonment of interior regions, as populations sought better livelihoods in cities and other Schengen countries [
36].
The areas covered by fires reveal distinct patterns compared to those not burned, which allows us to infer the determining influence of fires as an agent of landscape transformation, acting both as a factor of destruction and reconfiguration [
37].
Public policy emerges in this scenario as an ambivalent element: on the one hand, being historically marked by fragmentation and disarticulation with local actors, it has contributed to the homogenization and fragility of the landscape [
38]; on the other hand, recent initiatives such as the Landscape Transformation Programme may signal a paradigm shift, albeit one that is still incipient [
25]. In short, our results reinforce the urgent need for an integrated approach to land management, focused on the multifunctionality of the landscape, the enhancement of local knowledge, and the promotion of production systems resilient to climate change and forest fires [
39,
40].
5. Conclusions
The analysis of changes in land use in mainland Portugal between 1995, 2007, and 2018 reveals significant patterns, despite the overall land use structure percentual variation remaining relatively stable. The forest class stands out as the most representative throughout the period, with sustained growth, reflecting reforestation policies and replacement of burned areas, especially by the eucalyptus species. Agriculture, in turn, suffered a sharp decline until 2007, followed by a slight recovery until 2018, signalling a process landscape.
Scrubland and agroforestry surfaces disclose a continuous downward trajectory, especially in areas unaffected by fires, which may be related to the reconversion to other uses, including forestry and urban uses. Urbanisation, although with modest percentage increases, shows a steady progression, reinforcing the trend of territorial artificialisation, especially in regions with higher population density, particularly along the main roads.
The spatial distribution of the changes is not homogeneous, being more pronounced in the south of the country during the first period (1995–2007), while the second (2007–2018) shows a stabilisation in the rate of transformation. This deceleration suggests a maturation in land use processes or a lower pressure for transformation, possibly associated with factors such as national and European public policies for forest certification, changes in rural demographic profile, and greater regulation of forest management [
25,
41].
The influence of forest fires on the dynamics of land use is significant, particularly in the replacement of less resilient species, such as maritime pine, with species of greater regeneration capacity and economic interest, such as eucalyptus. This phenomenon is particularly evident in burnt areas, where a more accelerated reconversion pattern is observed. The expansion of eucalyptus forests, both in areas covered and not covered by fire, raises questions about the ecological sustainability and future resilience of the Portuguese forest landscape.
The data also reveal a sharp decline in temporary rainfed and irrigated crops, especially in non-burnt areas, pointing to a progressive abandonment of traditional agriculture. This process can be attributed to the ageing of the rural population, the lack of economic incentives, and the attractiveness of alternative land uses.
Finally, the results allow us to conclude that, despite punctual and localised changes, the Portuguese territory maintains a certain stability in the distribution of the major classes of land use and occupation. However, this stability conceals important structural transformations in ecological, economic, and social dynamics, such as agricultural abandonment, forest conversion, and urban development. Such trends must be carefully considered in future Portuguese territorial planning and management through the implementation of public policies to ensure a more sustainable, balanced, and resilient use of national soil. Further research should prioritise investigating the ecological sustainability and long-term fire resilience of expanding eucalyptus monocultures, particularly their impacts on biodiversity, water resources, and fuel loads under climate change. It should also deeply analyse the socio-economic drivers of agricultural abandonment and the nature of its recent recovery, alongside exploring sustainable alternatives like agroforestry. Understanding the ecological value loss from declining scrubland, the precise drivers and impacts of urbanisation (especially peri-urban sprawl) and the complex feedback loops between fire regimes and land use conversion is crucial. Research must explicitly link demographic shifts and policy frameworks (EU/national) to on-the-ground land decisions, utilise higher-resolution spatio-temporal data to detect finer-scale changes masked by apparent stability, and develop integrated future scenario models to assess the trade-offs between economic, ecological, and social resilience across Portugal’s heterogeneous landscapes.


