


Spatial Pattern and Driving Mechanisms of Settlements in the Agro-Pastoral Ecotone of Northern China: A Case Study of Eastern Inner Mongolia

 , , ,
, , ,
Abstract
1. Introduction
2. Materials and Methods
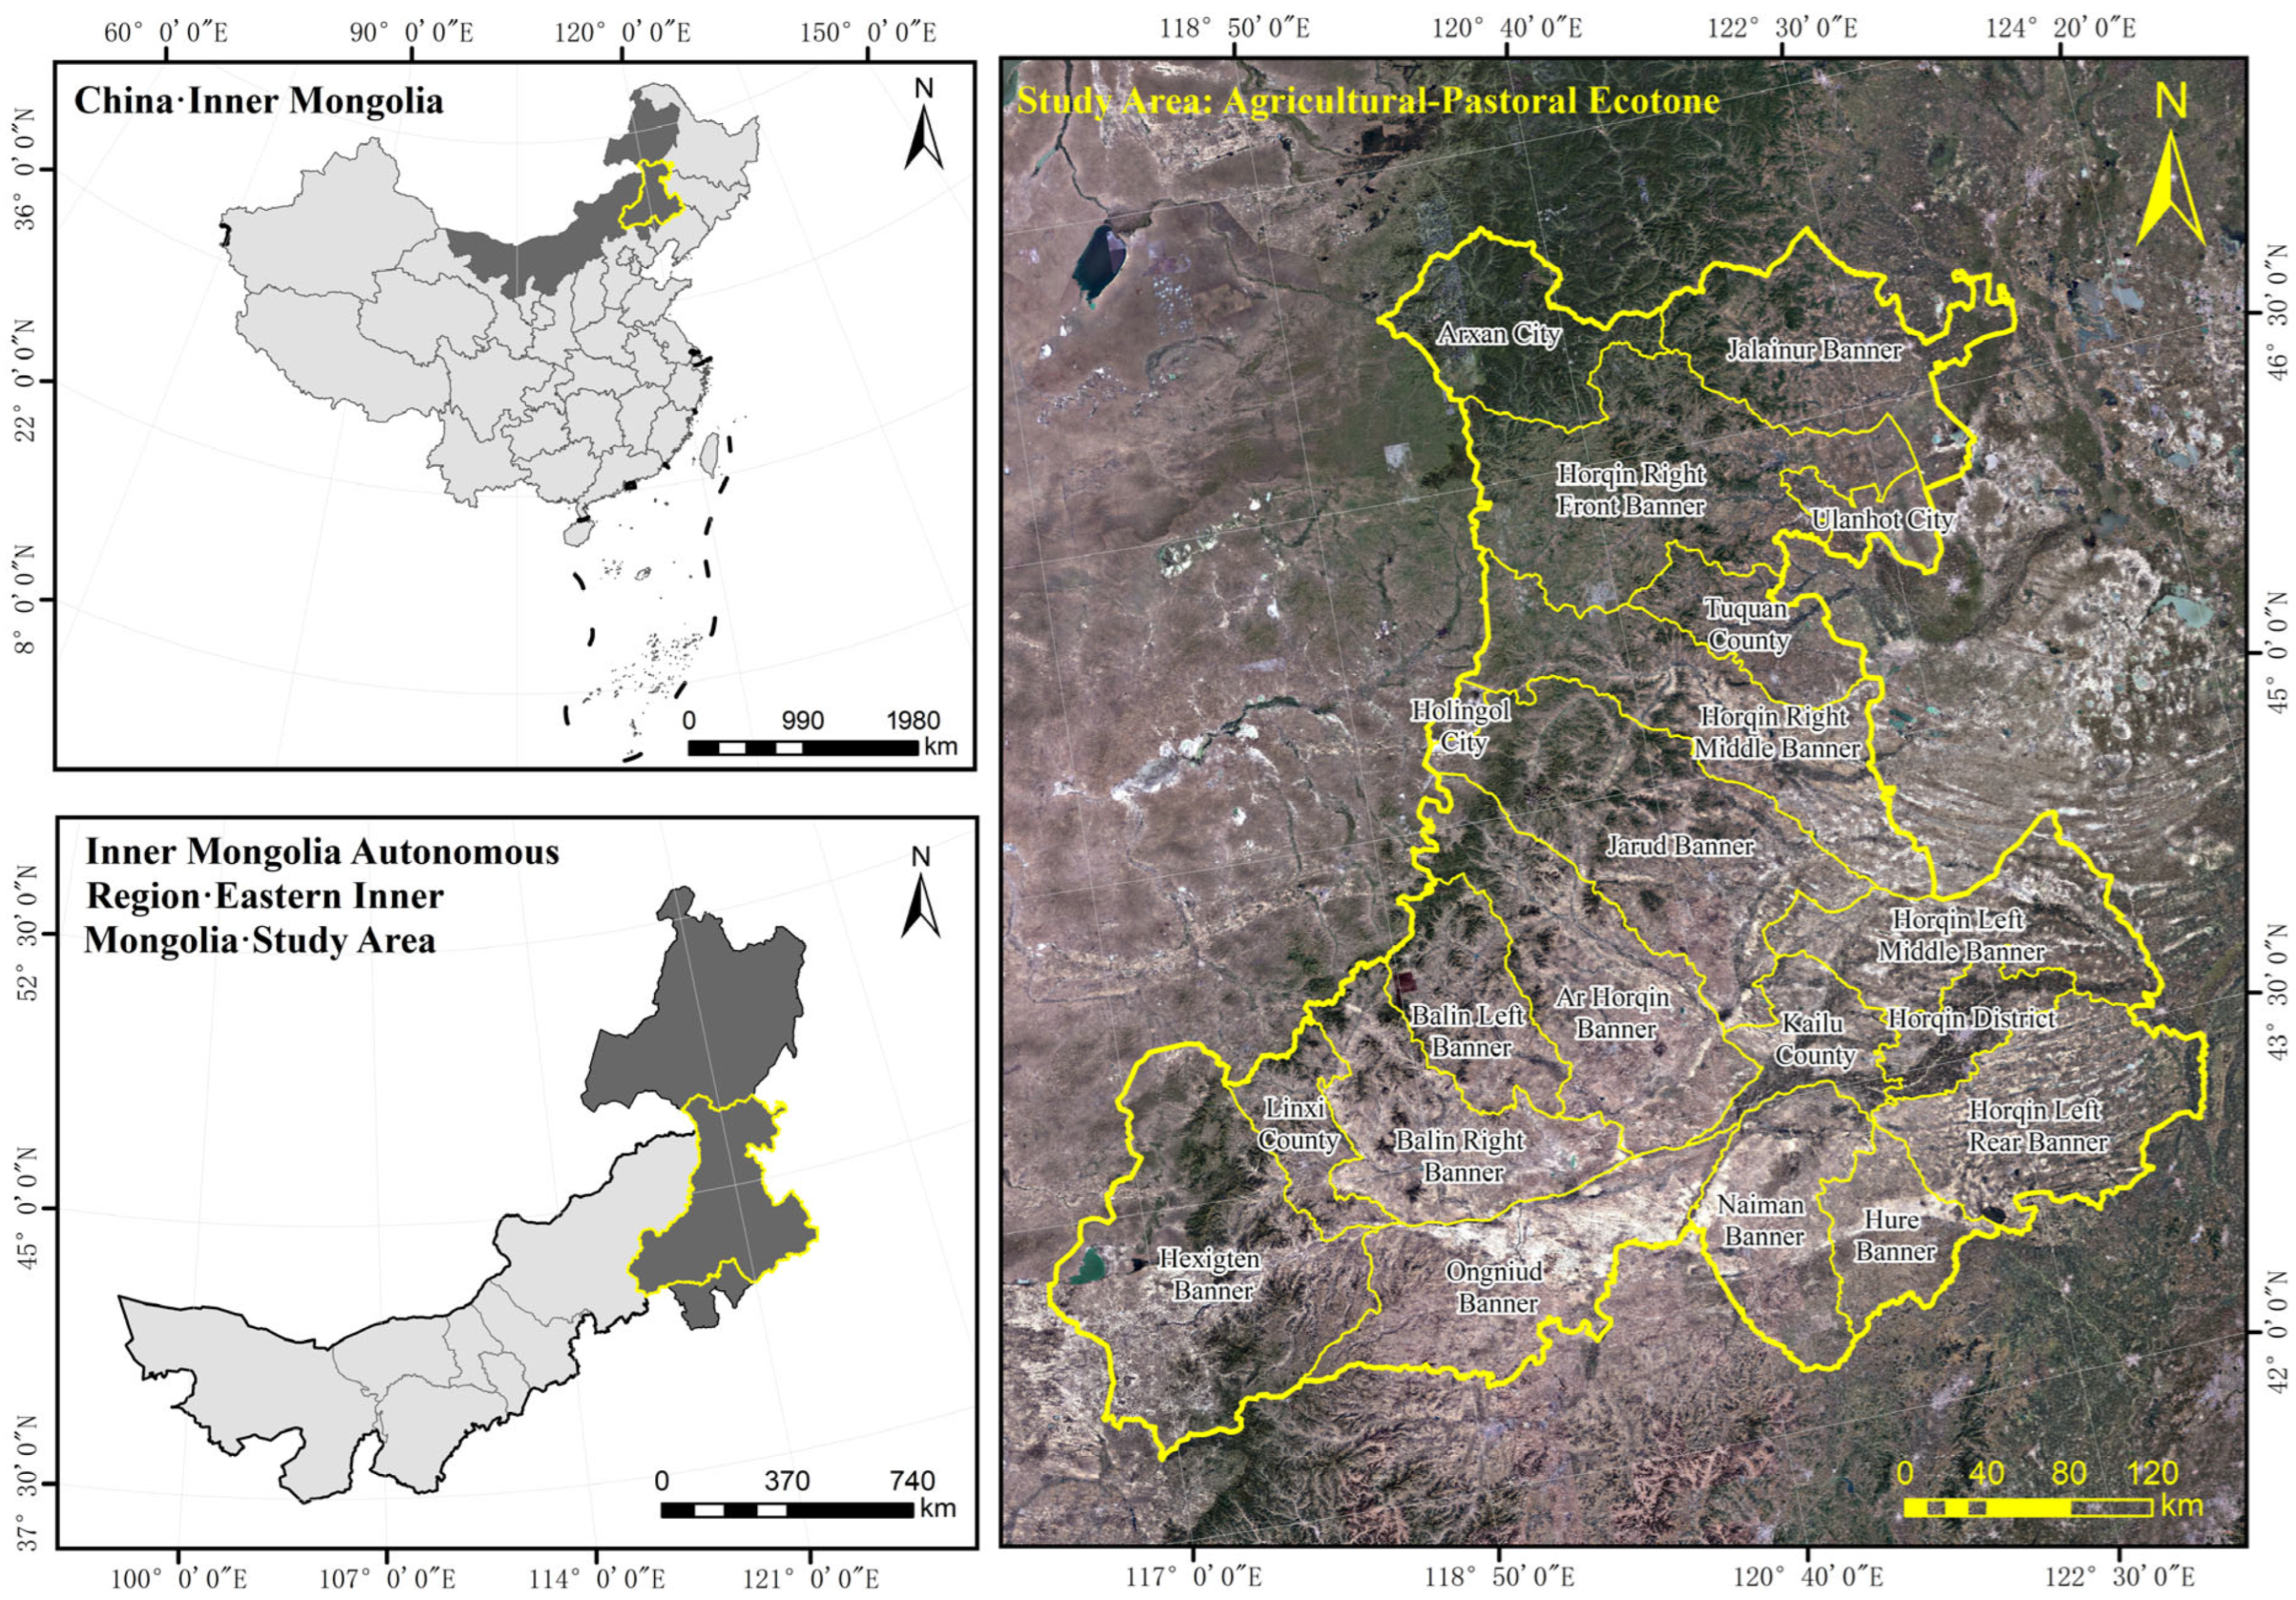
2.1. Study Area
2.2. Data Sources
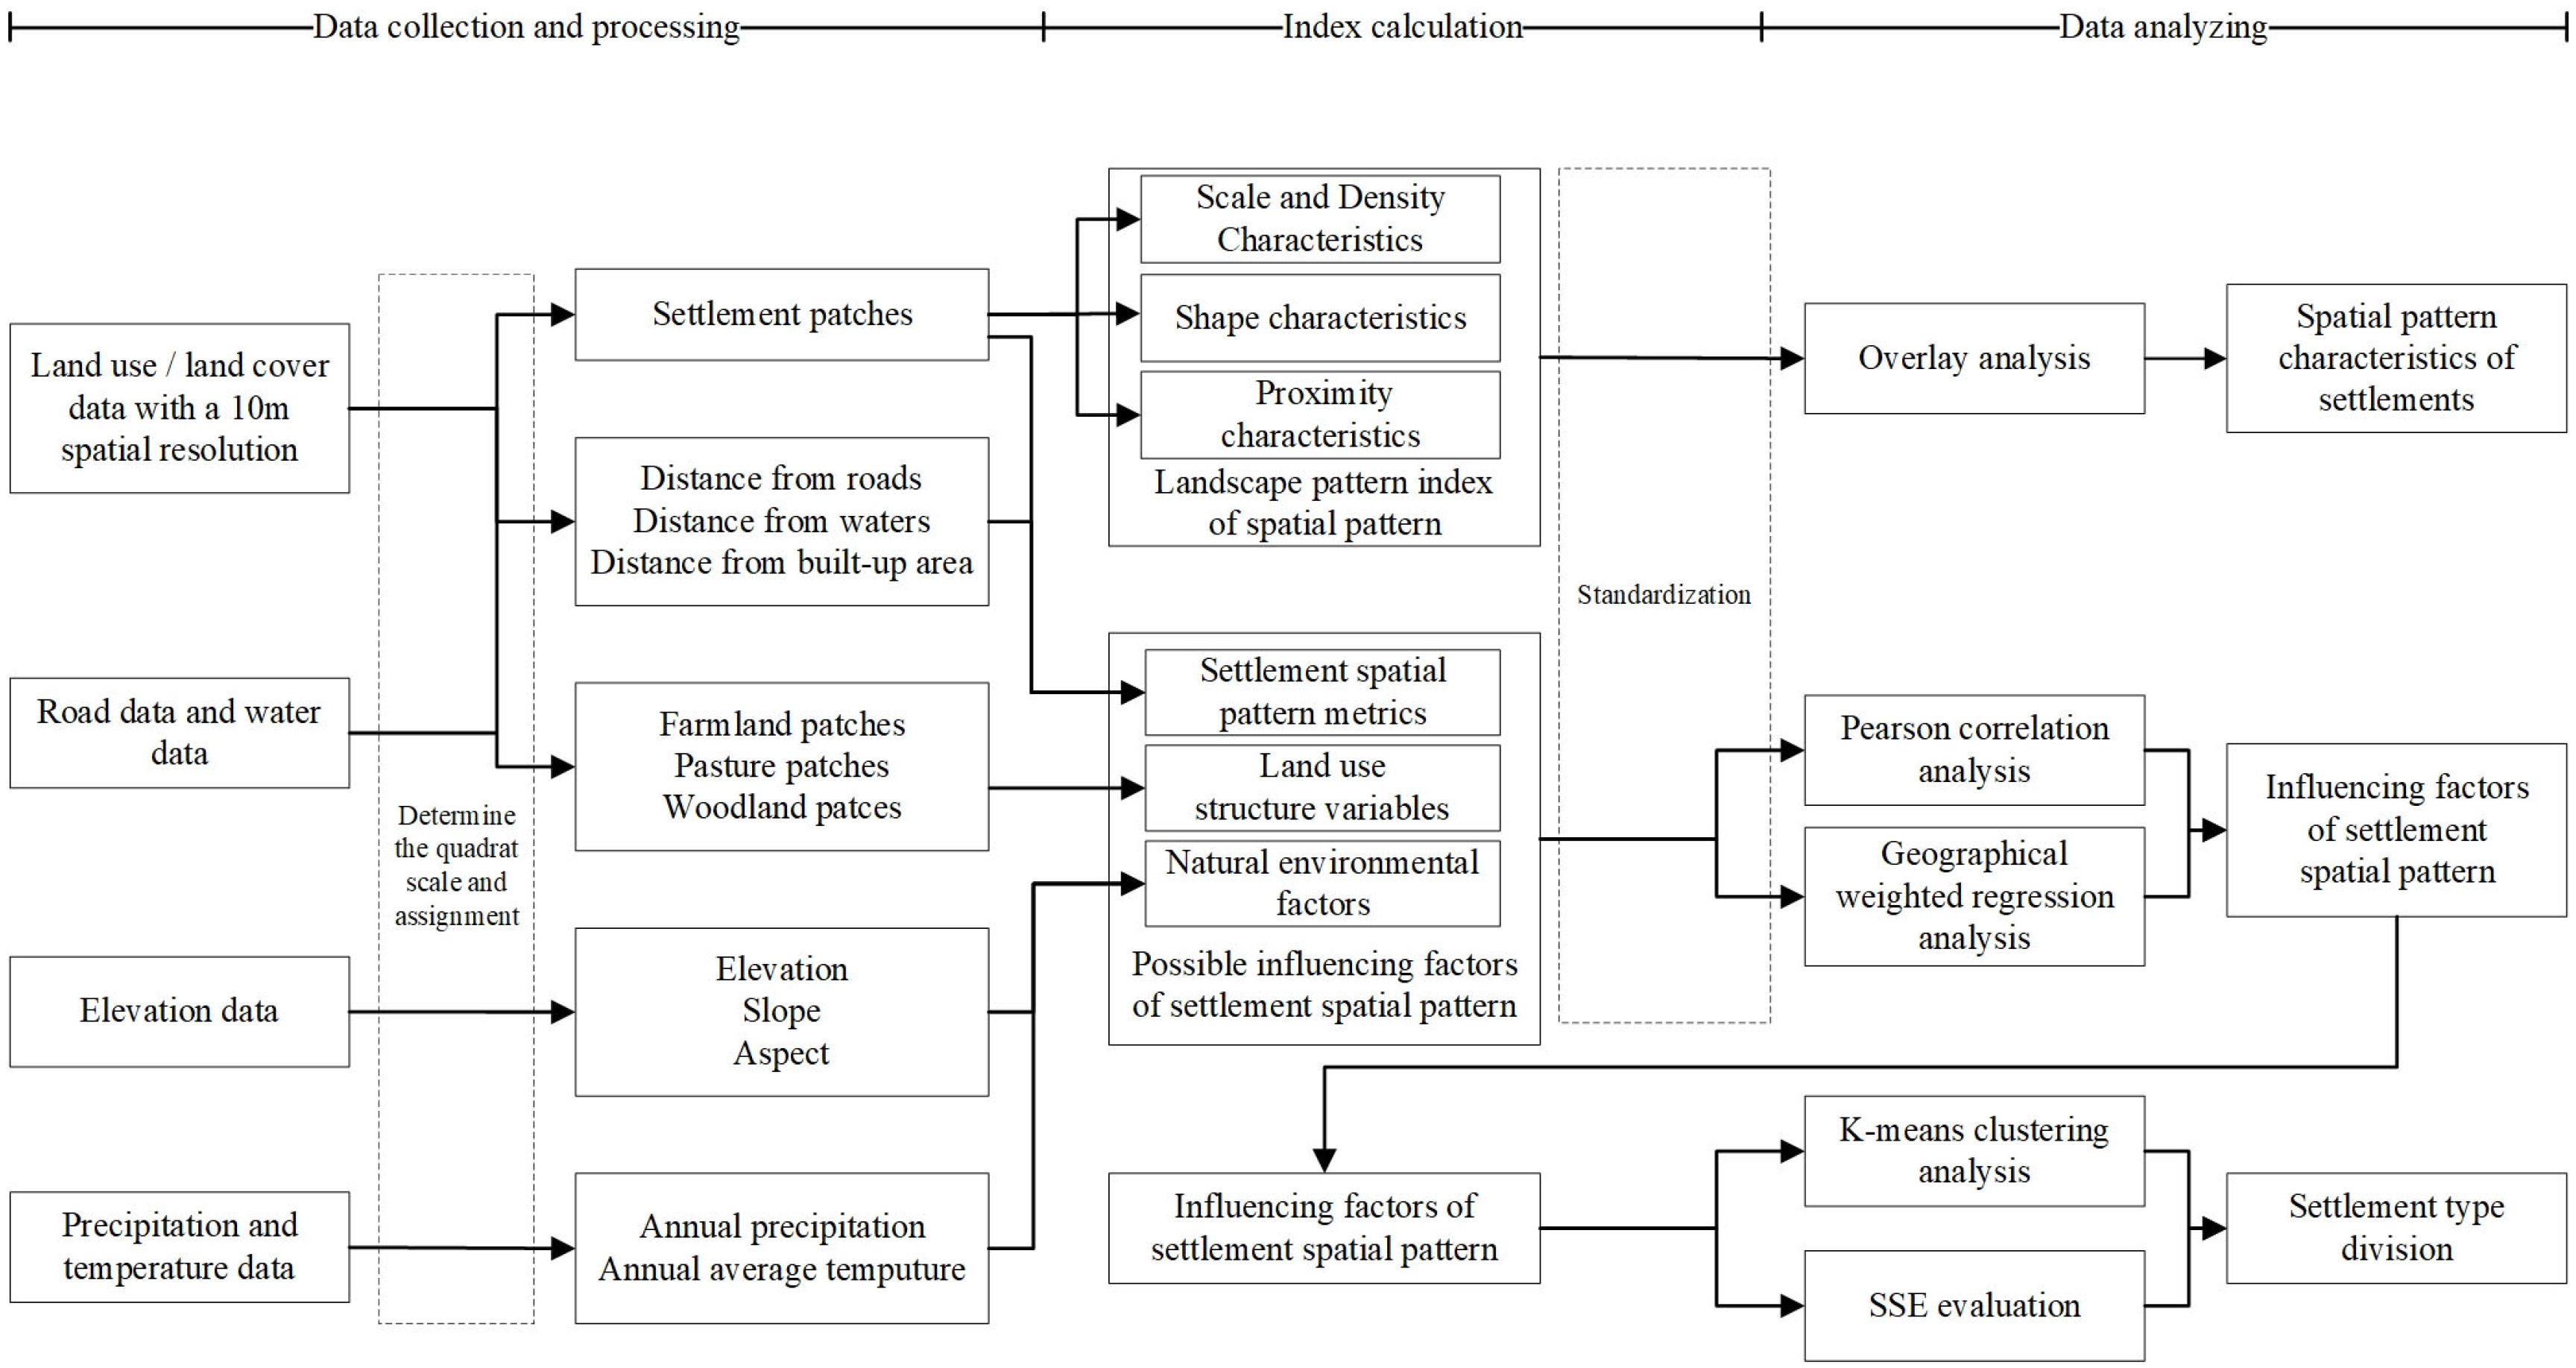
2.3. Methods
2.3.1. Quadrat-Based Spatial Analysis
2.3.2. Landscape Pattern Indices
2.3.3. Correlation Analysis
2.3.4. GWR Analysis
2.3.5. K-Means Clustering
3. Results
3.1. Spatial Characteristics of Rural Settlement Patterns
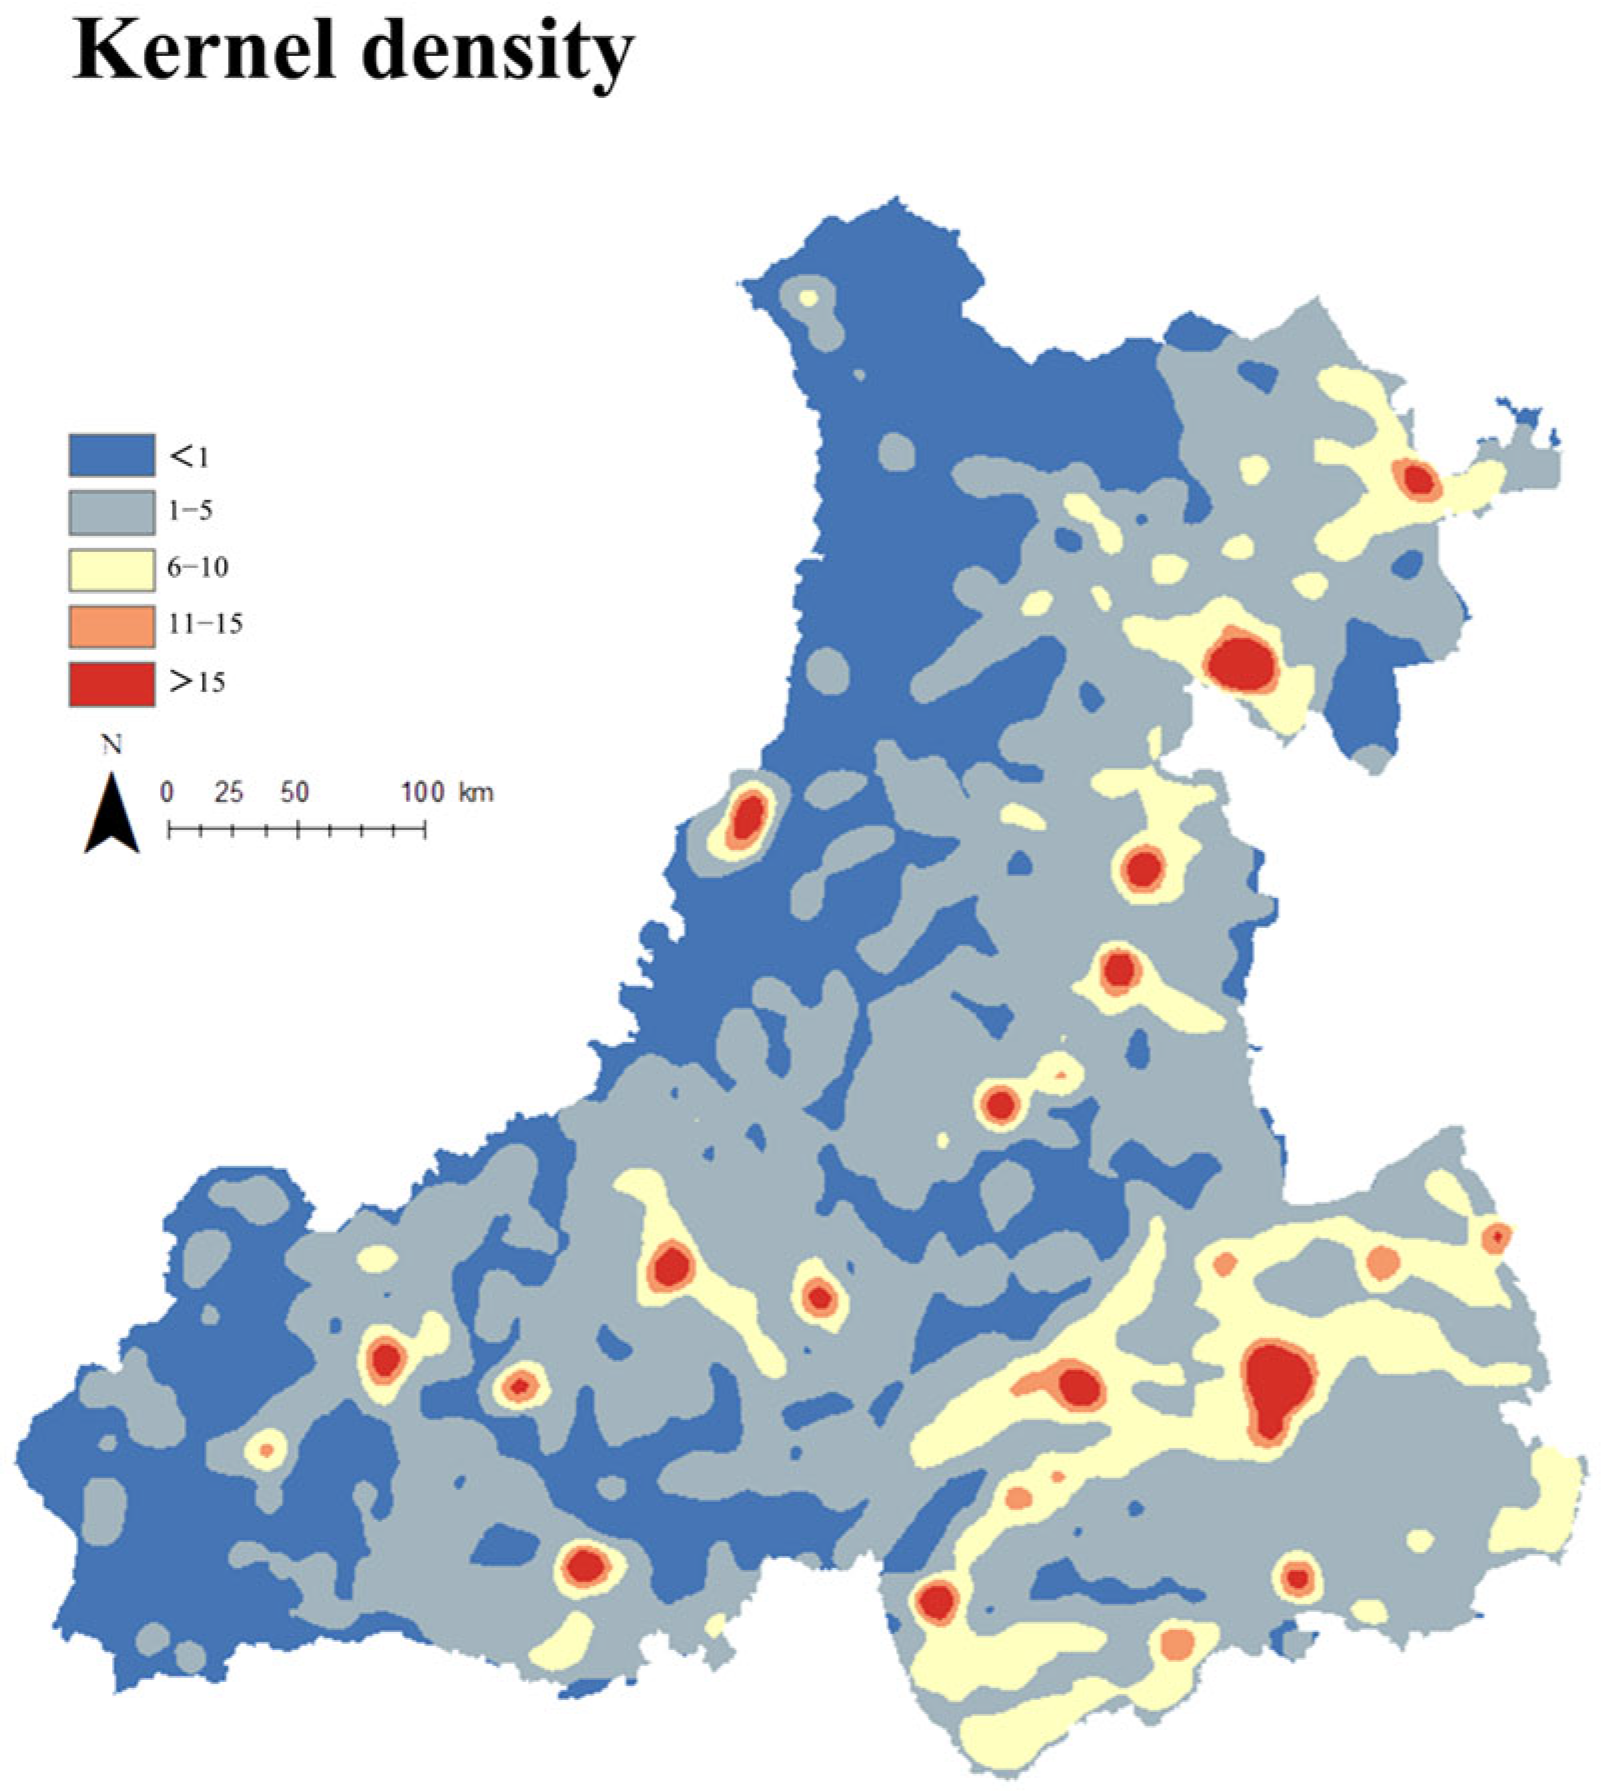
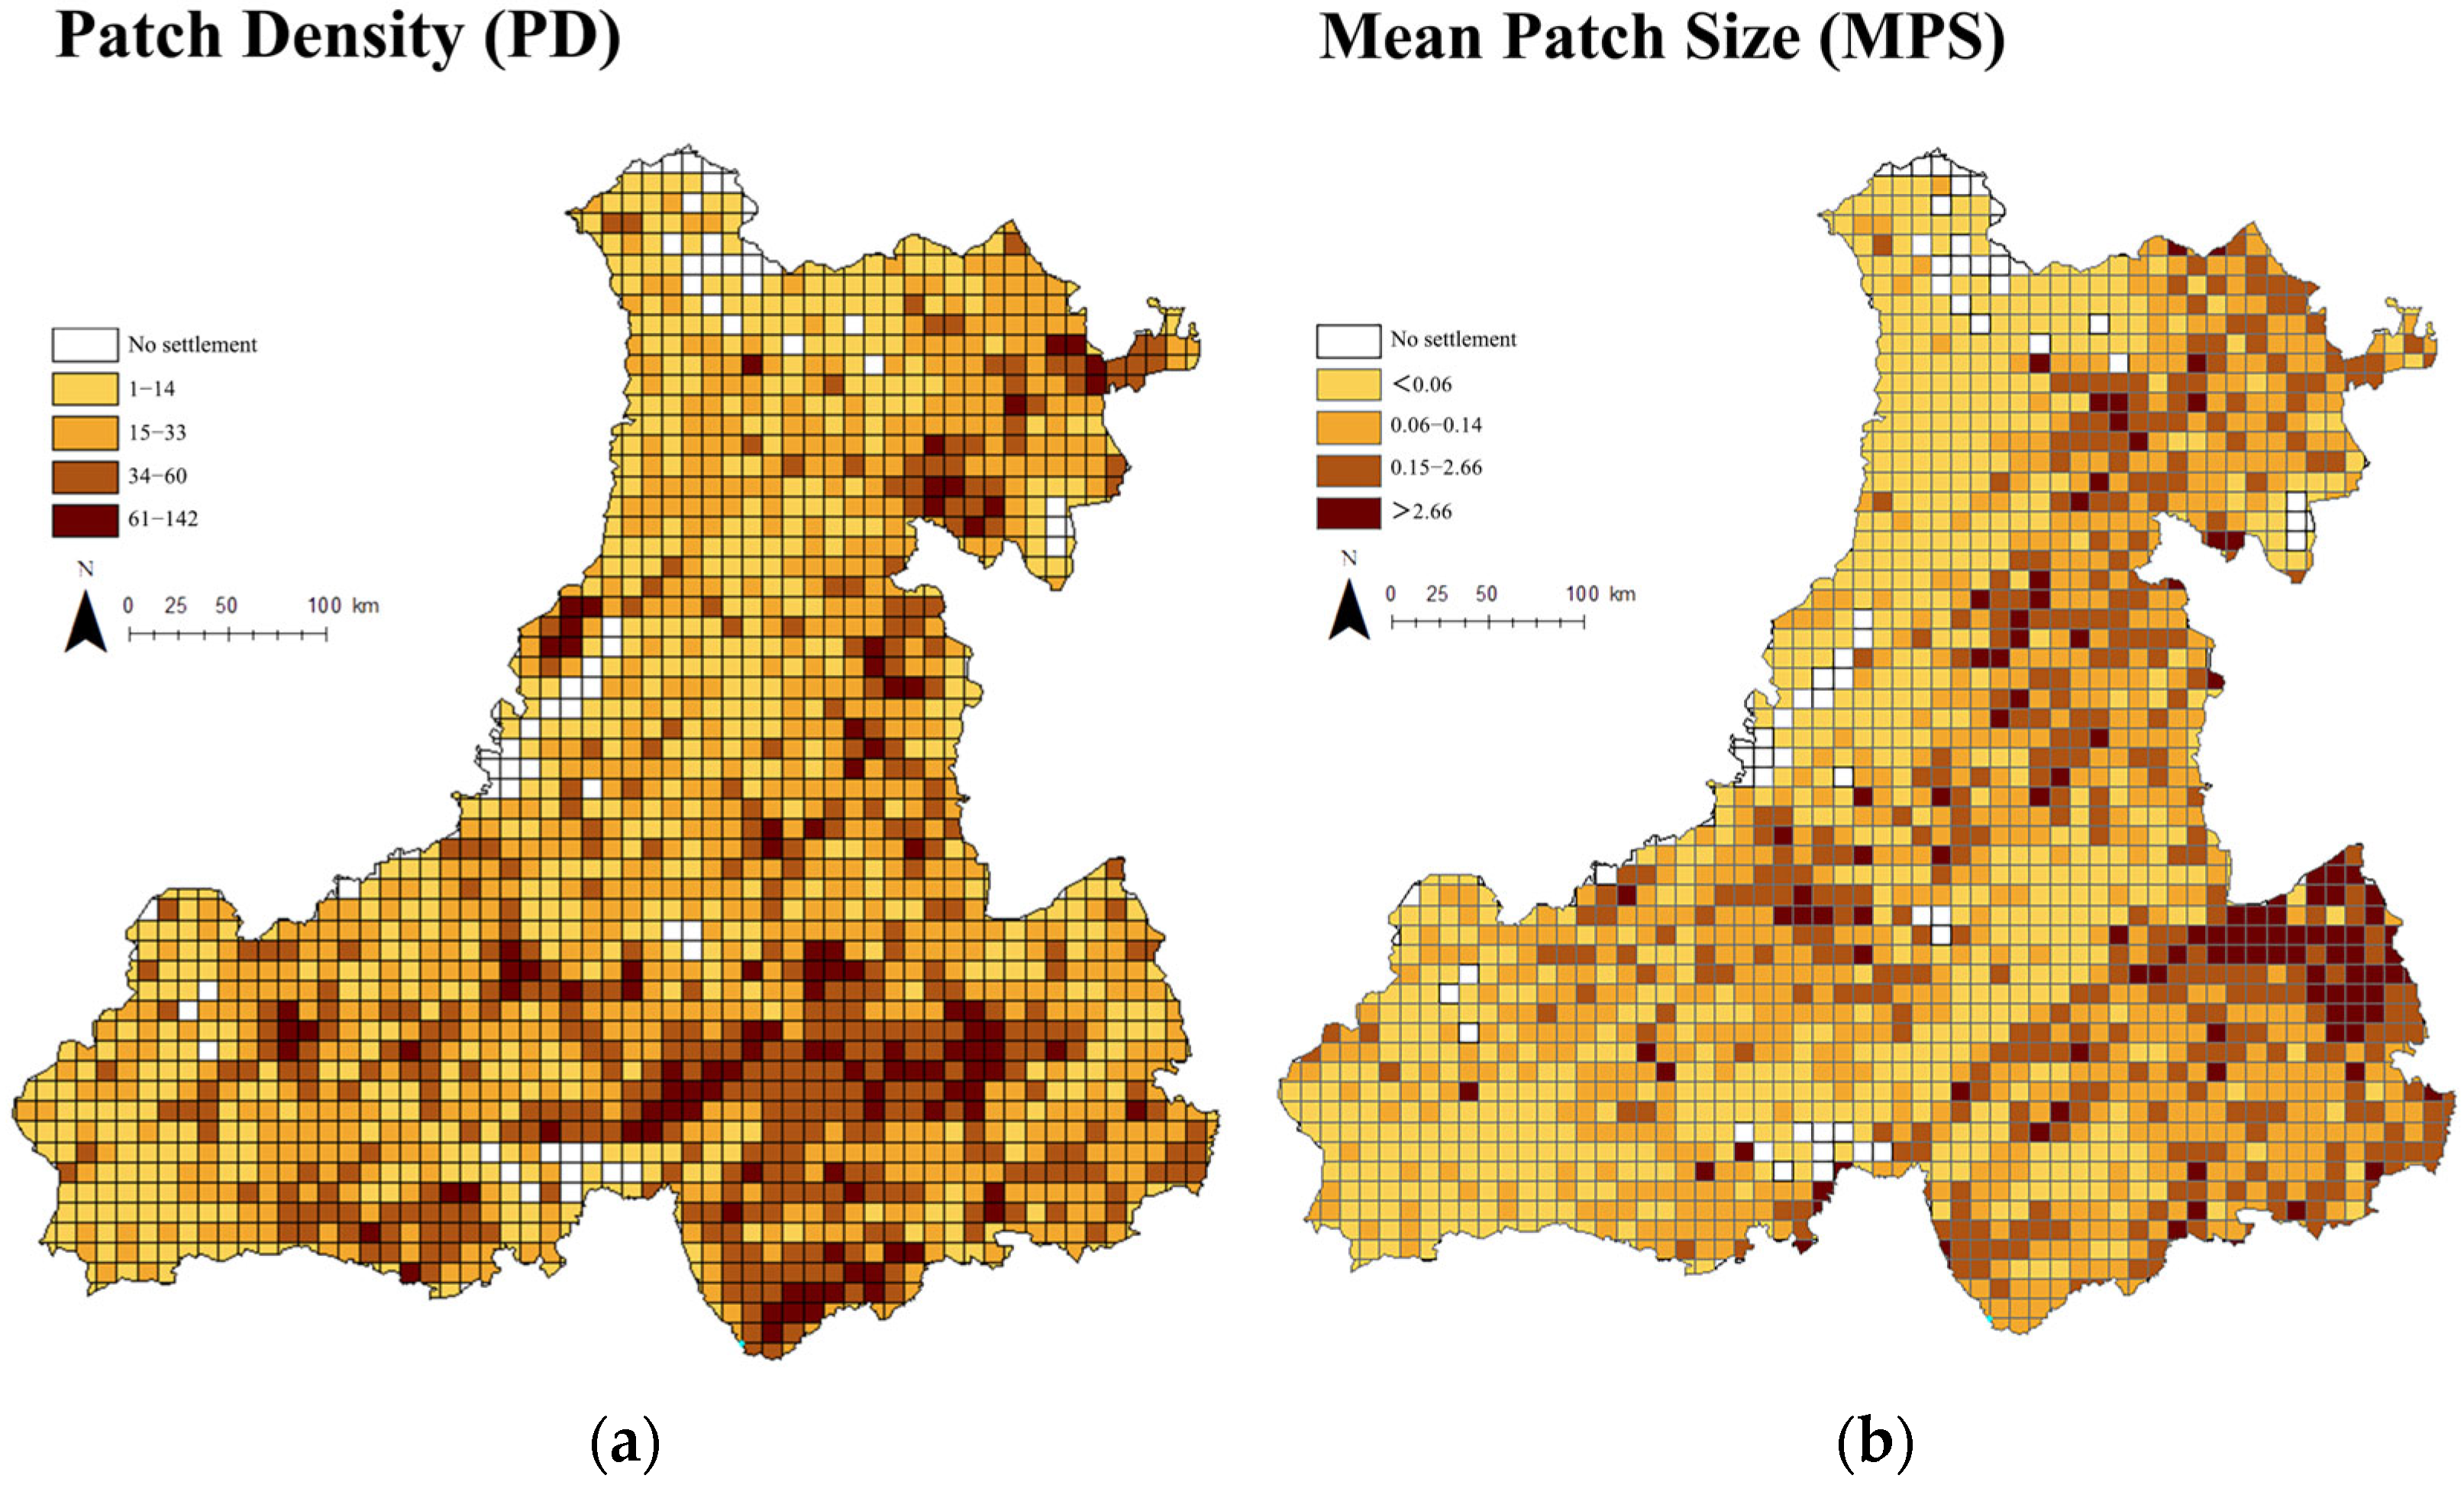
3.1.1. Scale and Density Characteristics
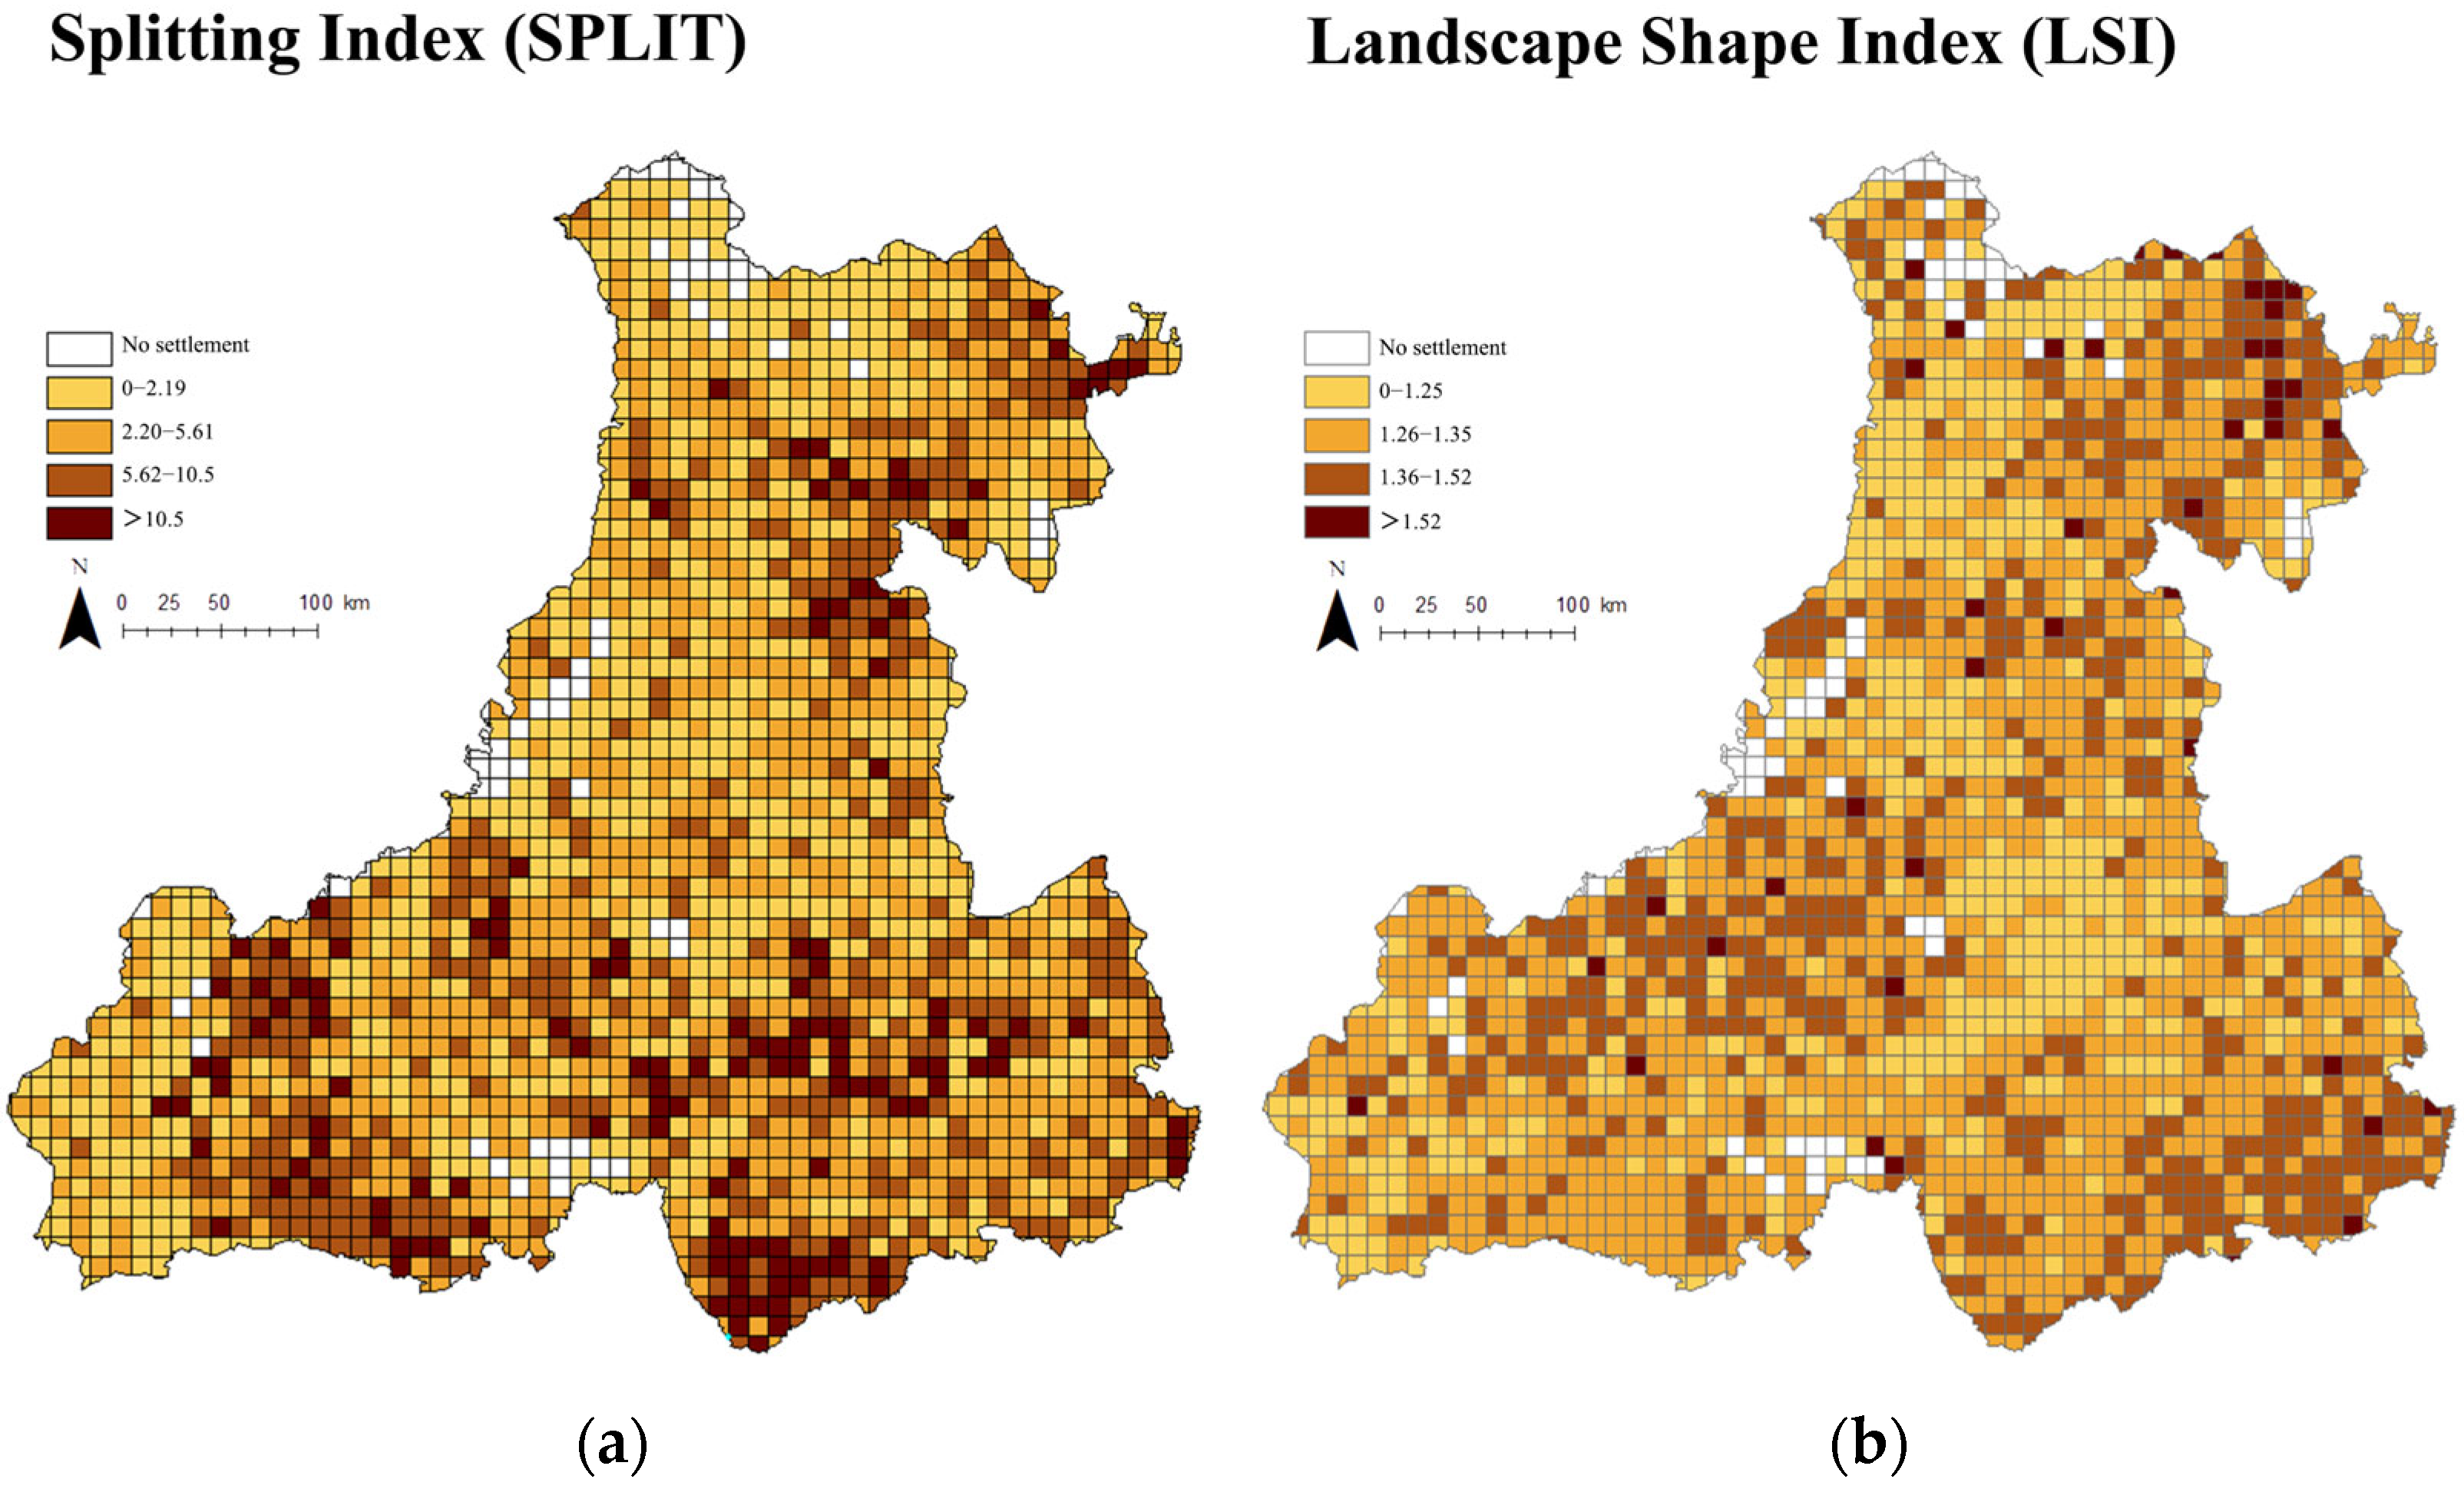
3.1.2. Shape Characteristics
3.1.3. Proximity Characteristics
3.2. Analysis of Influencing Factors on Settlement Spatial Patterns
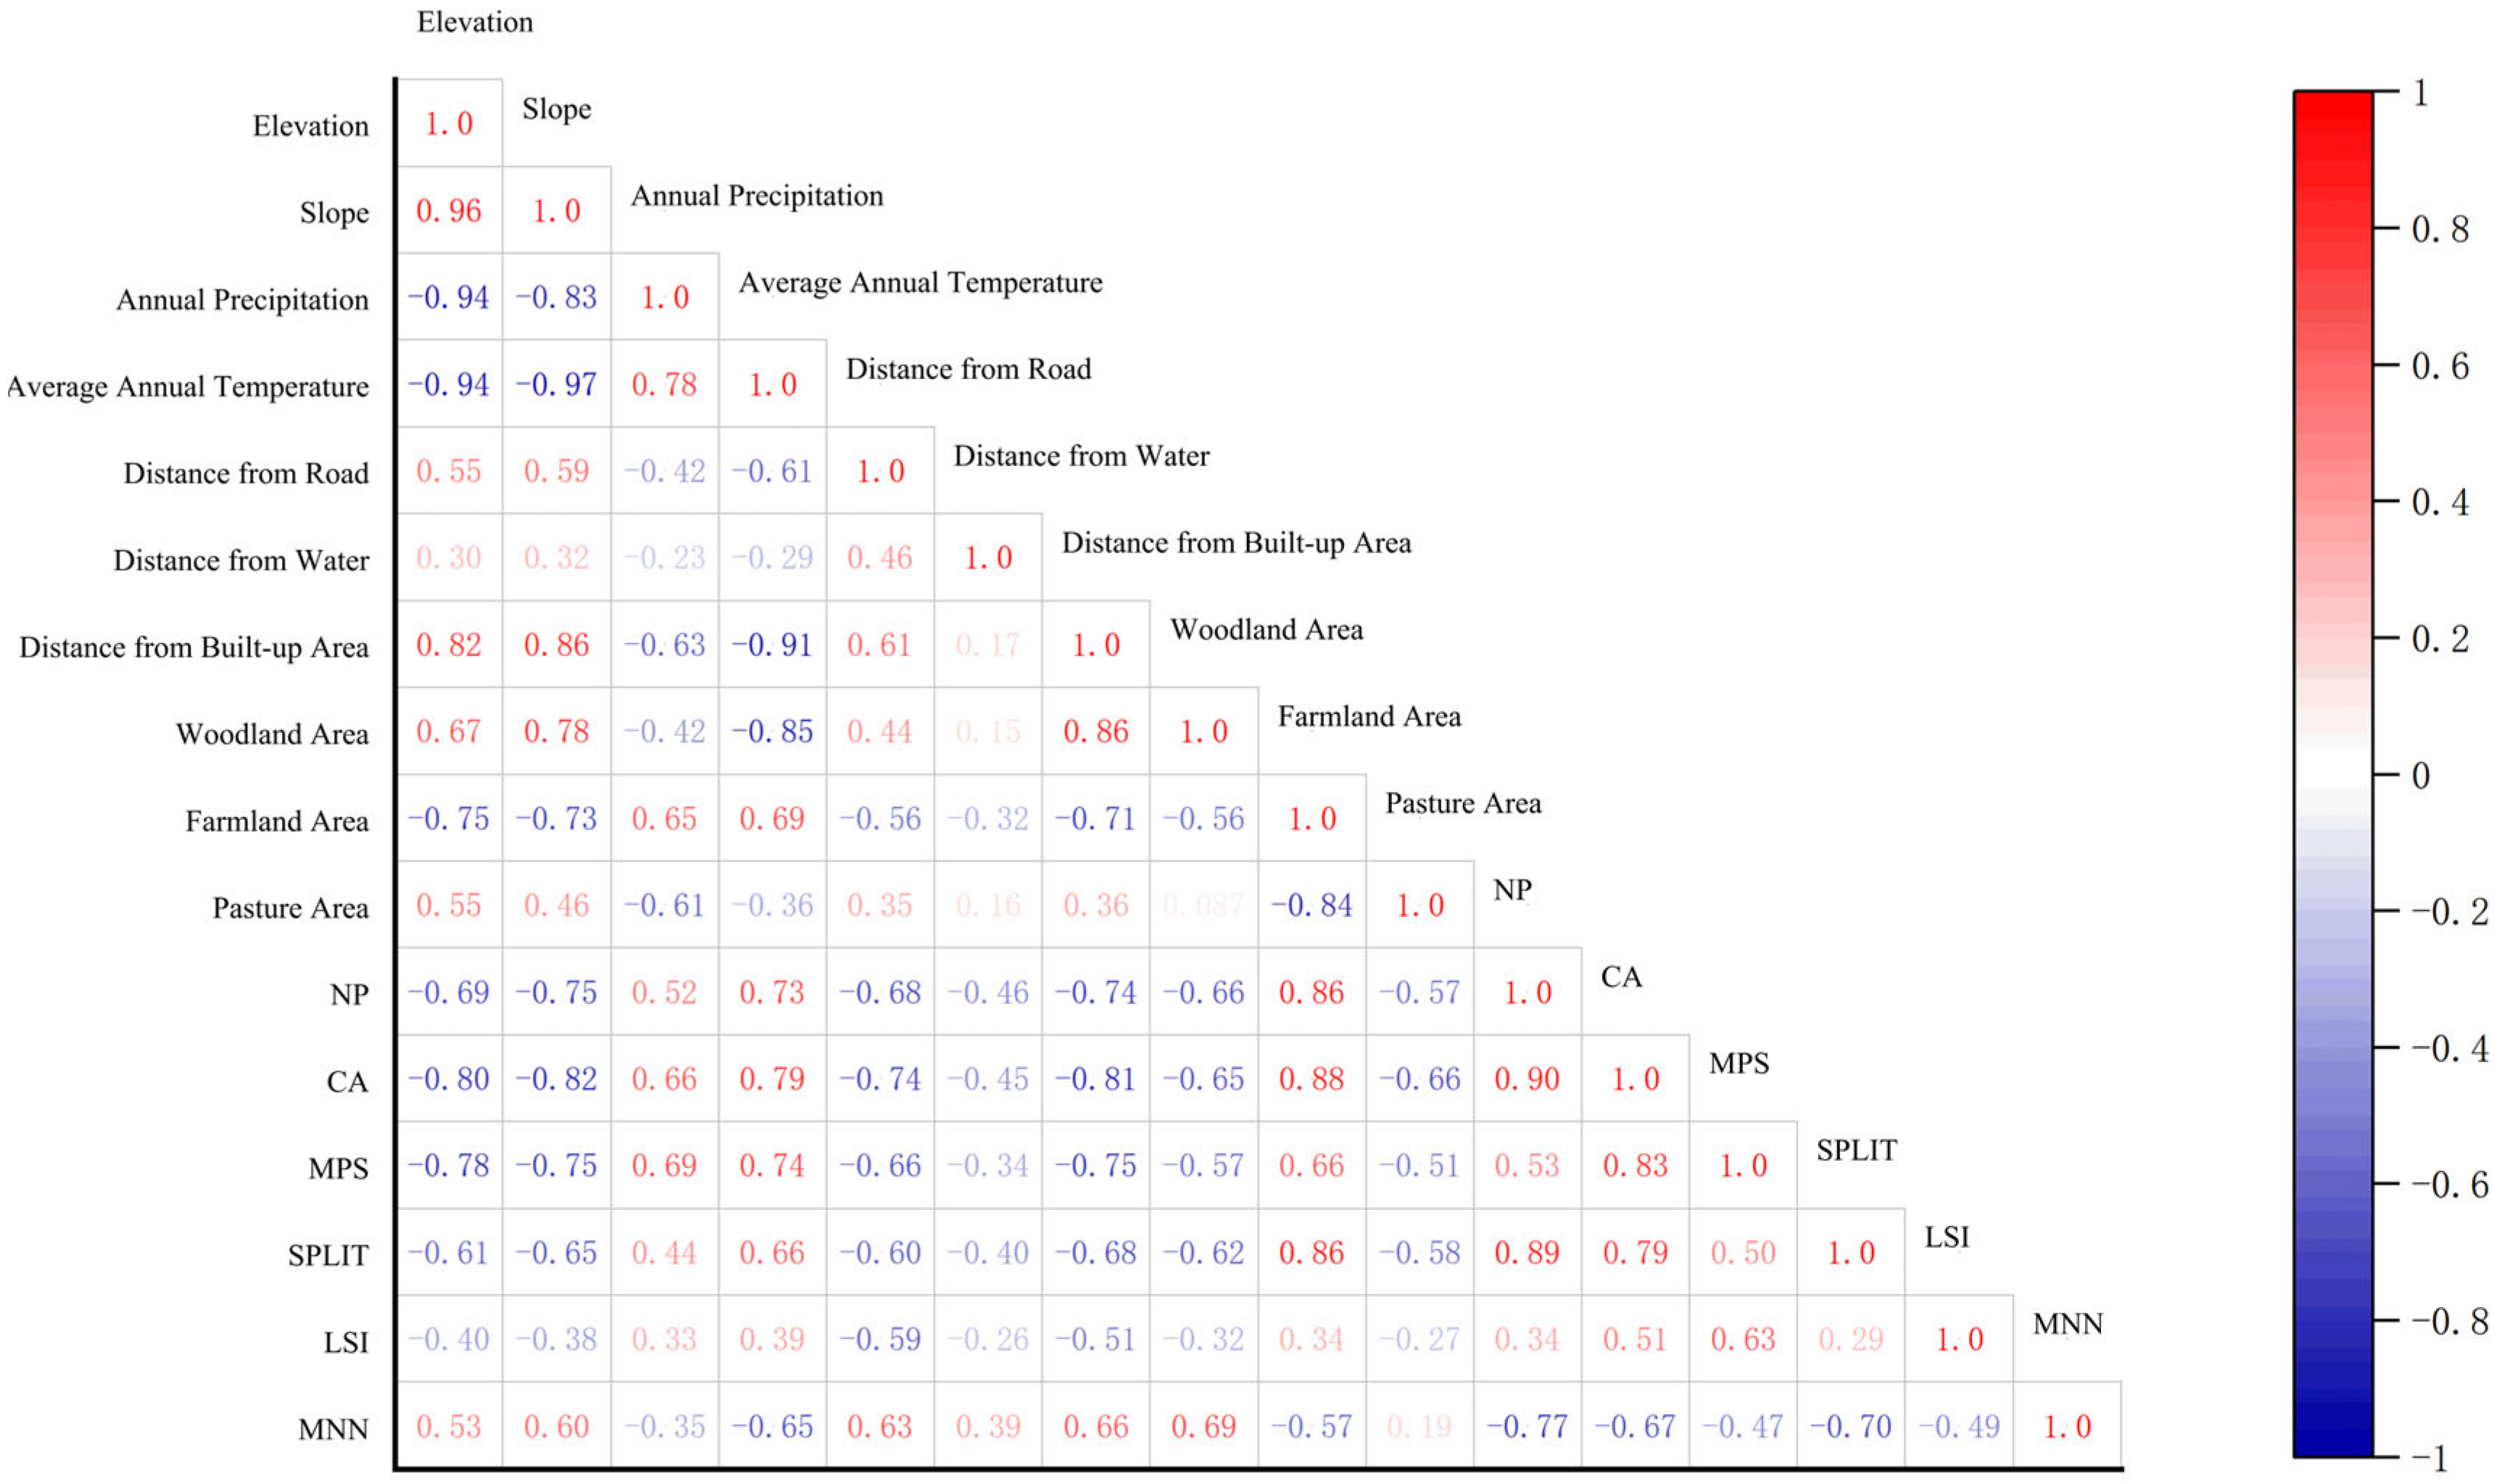
3.2.1. Selection and Correlation Analysis of Influencing Factors
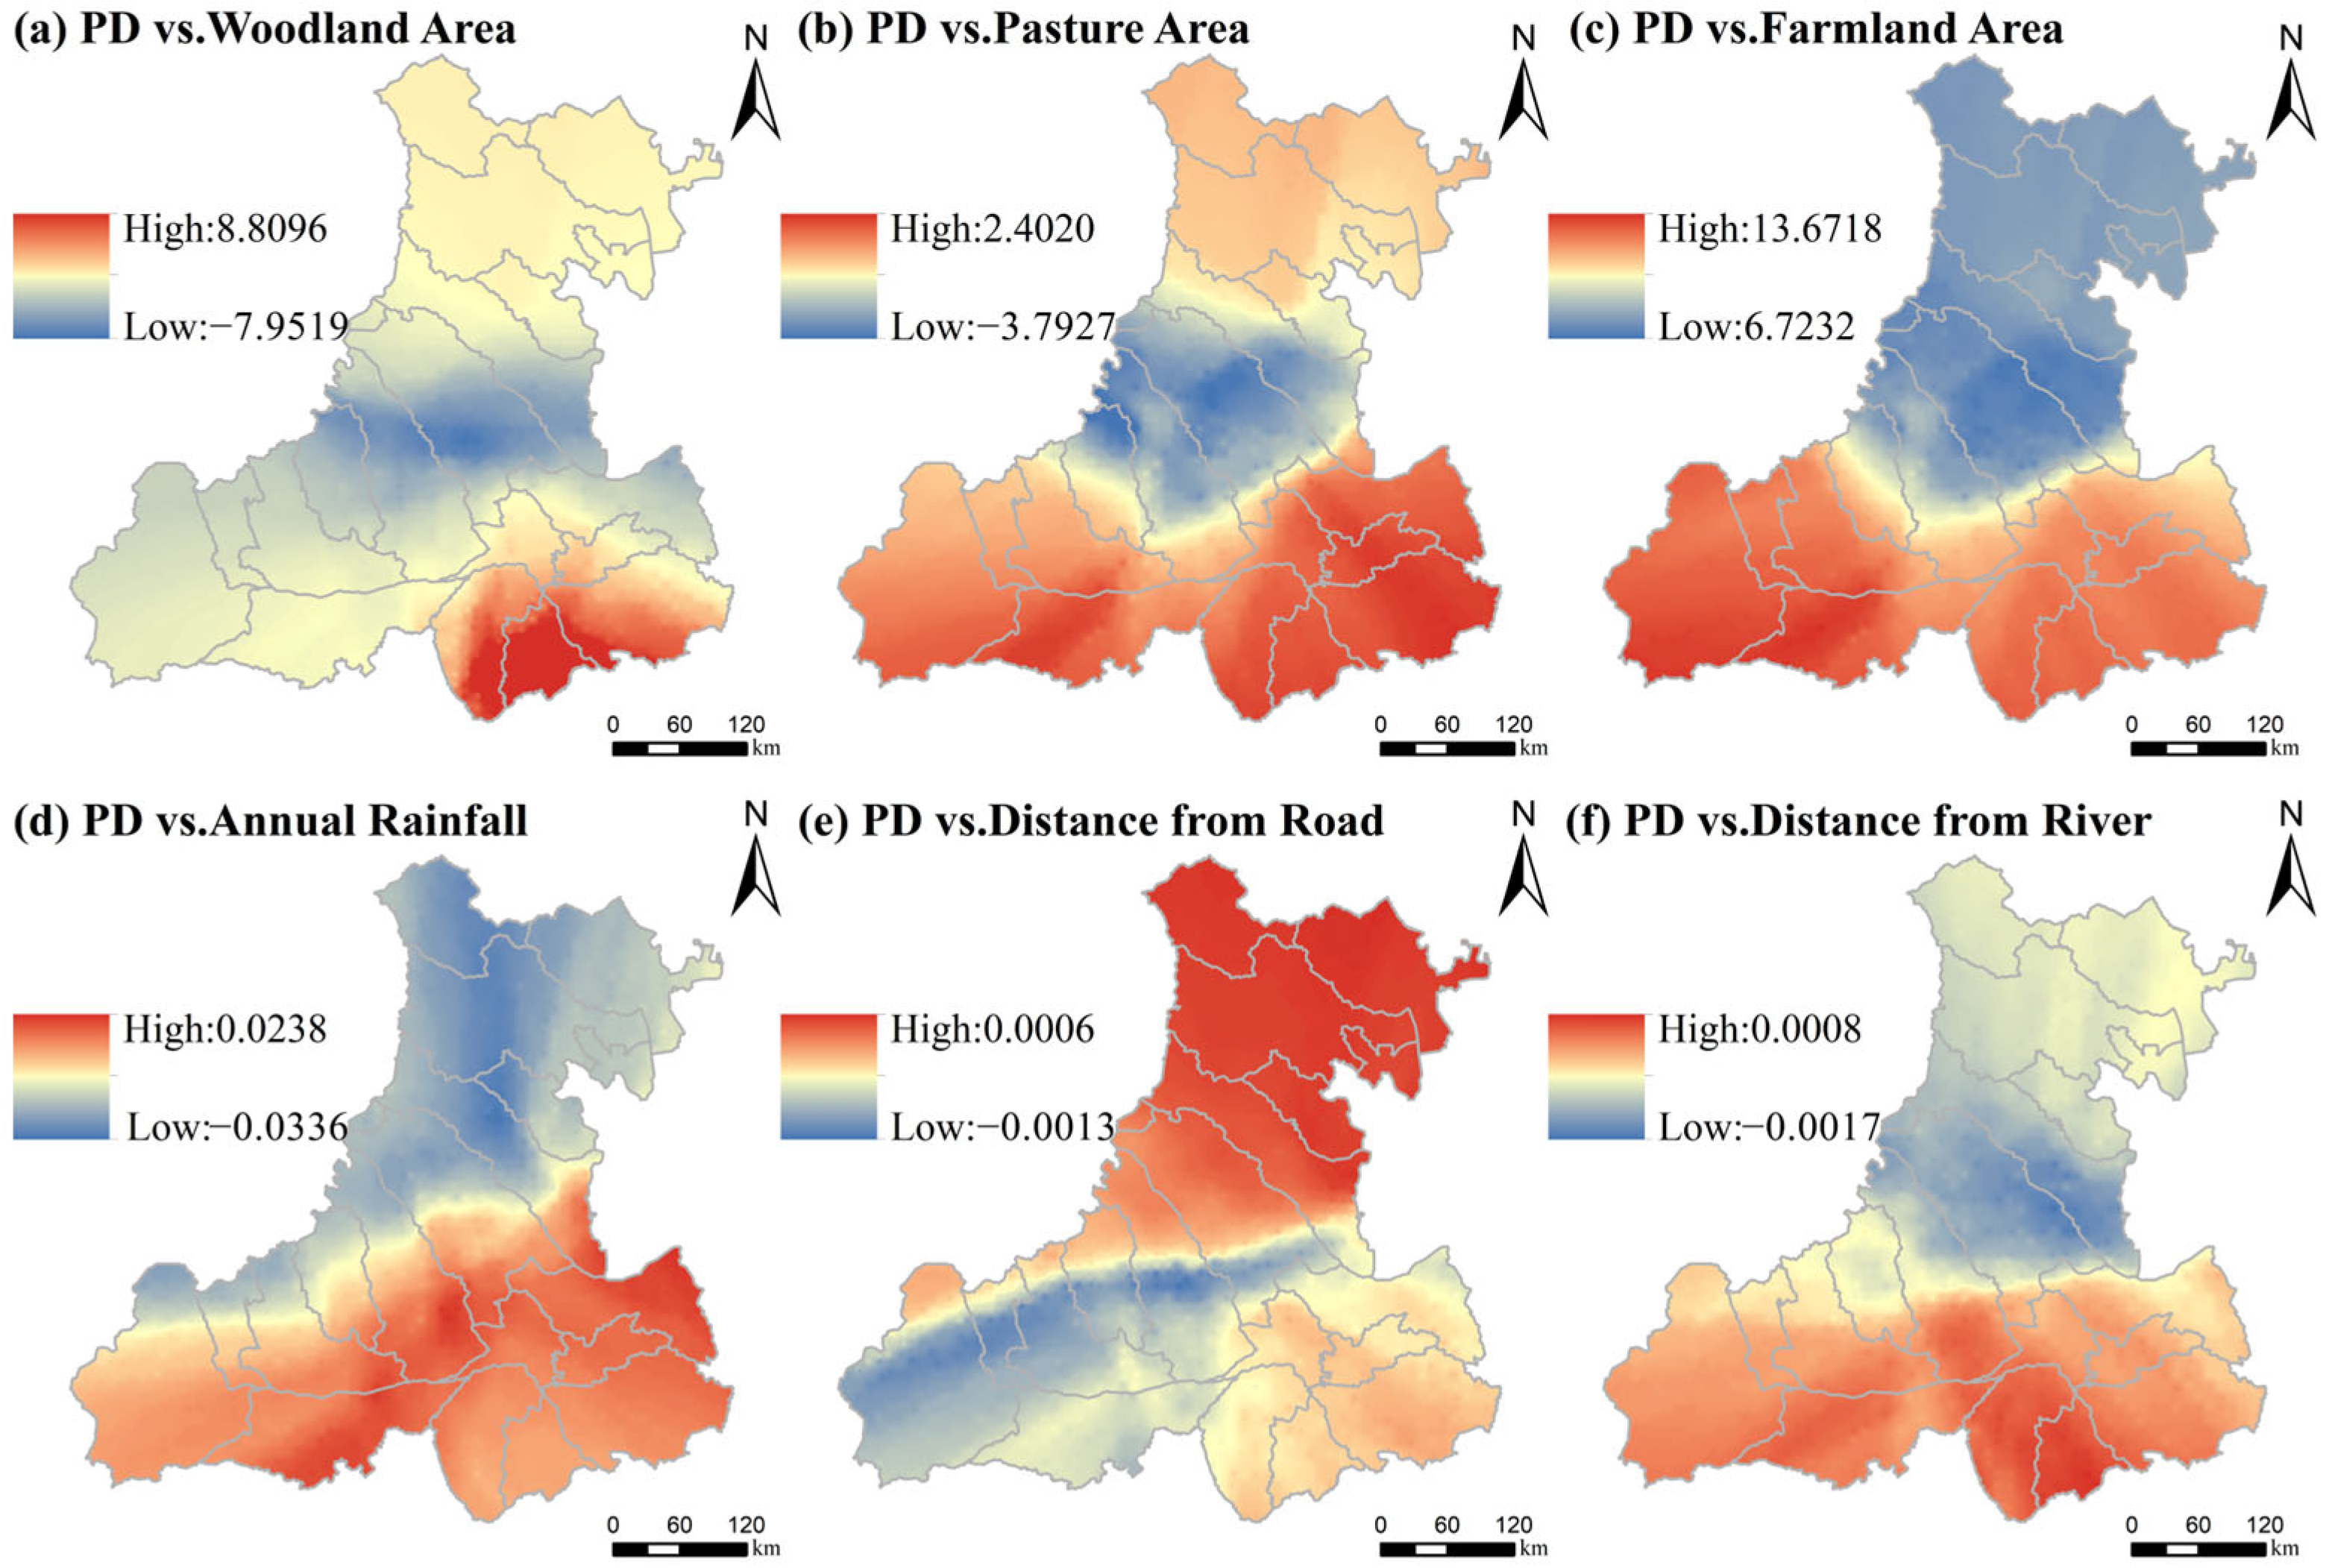
3.2.2. Influencing Factors on Settlement Patterns
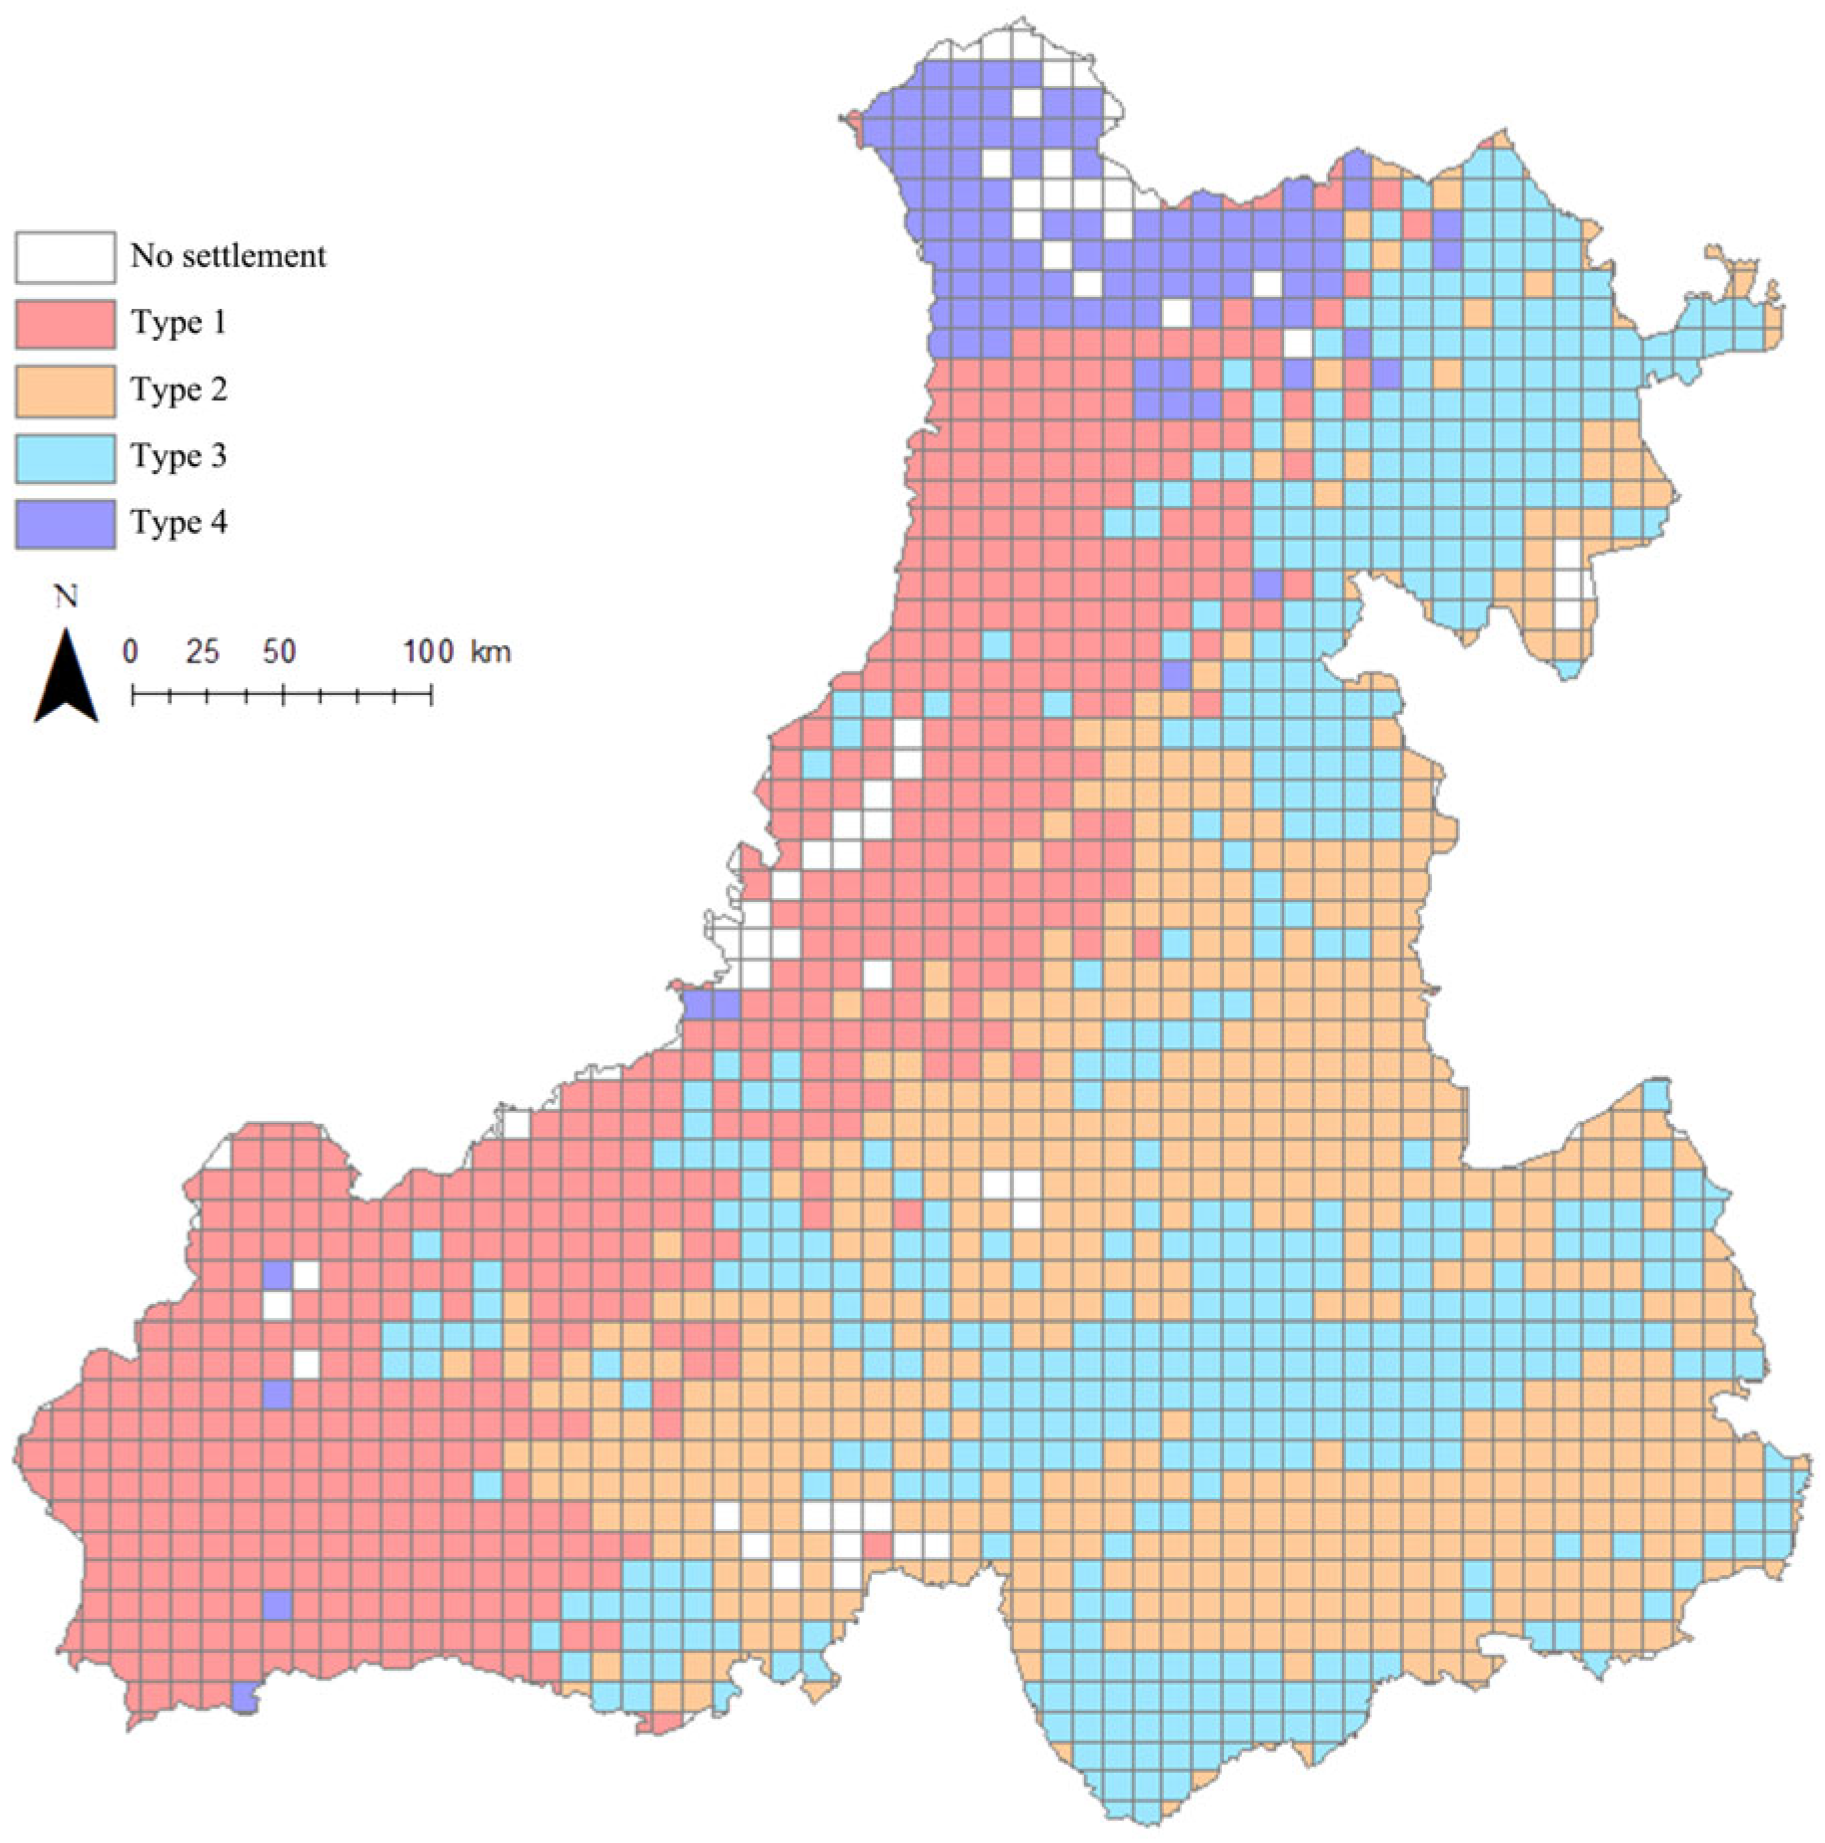
3.3. Settlement Landscape Cluster Analysis
4. Discussion
4.1. Settlement Landscape Characteristics in Agro-Pastoral Zones
4.1.1. Moderate Overall Settlement Scale with a Prevalence of Small Settlements
4.1.2. Distinct East–West Spatial Differentiation Shaped by Greater Khingan Mountains
4.2. Driving Mechanisms of Settlements
4.3. Formation Mechanisms and Development Strategies for Different Settlement Types
4.3.1. Alpine Pastoral Settlements
4.3.2. Agro-Pastoral Transitional Settlements
4.3.3. River Valley Agricultural Settlements
4.3.4. Highland Forested Settlements
4.4. Limitations and Prospects
5. Conclusions
Author Contributions
Funding
Data Availability Statement
Conflicts of Interest
References
- Huo, X.; Xu, X.; Tang, Y.; Zhang, Z. An analysis of the spatial evolution and influencing factors of rural settlements along the Shandong section of the Grand Canal of China. River Res. Appl. 2023, 39, 1283–1299. [Google Scholar] [CrossRef]
- Chen, Z.; Li, Y.; Liu, Z.; Wang, J.; Liu, X. Impacts of Different Rural Settlement Expansion Patterns on Eco-Environment and Implications in the Loess Hilly and Gully Region, China. Front. Environ. Sci. 2022, 10, 857776. [Google Scholar] [CrossRef]
- Gorgun, E.K.; Salata, S. Settlement Expansion Versus Environmental Protection: Ecosystem Services for Environmental Regulation Planning in Izmir, Turkiye. Sustainability 2025, 17, 3237. [Google Scholar] [CrossRef]
- Shi, F.; Liu, S.; Sun, Y.; An, Y.; Zhao, S.; Liu, Y.; Li, M. Ecological network construction of the heterogeneous agro-pastoral areas in the upper Yellow River basin. Agric. Ecosyst. Environ. 2020, 302, 107069. [Google Scholar] [CrossRef]
- Tian, Y.; Jiang, G.; Wu, S.; Zhou, D.; Zhou, T.; Tian, Y.; Chen, T. Cropland-grassland use conversions in the agro-pastoral areas of the Tibetan Plateau: Spatiotemporal pattern and driving mechanisms. Ecol. Indic. 2023, 146, 109819. [Google Scholar] [CrossRef]
- Kaya, I.A.; Gorgun, E.K. Land use and land cover change monitoring in Bandirma (Turkey) using remote sensing and geographic information systems. Environ. Monit. Assess. 2020, 192, 430. [Google Scholar] [CrossRef]
- Karakus, C.B.; Kavak, K.S.; Cerit, O. Determination of variations in land cover and land use by remote sensing and geographic information systems around the city of sivas (turkey). Fresenius Environ. Bull. 2014, 23, 667–677. [Google Scholar]
- Qi, L.; Wu, Y.; Tang, Z.; He, J.; Wang, Y.; Yang, Z.; Chen, L. Research on parametric analysis and simulation application of spatial texture in traditional villages: A case study of Cantonese traditional villages. J. Asian Archit. Build. Eng. 2024, 23, 1–26. [Google Scholar] [CrossRef]
- Huang, X.; Liu, Y.; Stouffs, R. Exploring spatio-temporal heterogeneity of rural settlement patterns on carbon emission across more than 2800 Chinese counties using multiple supervised machine learning models. J. Environ. Manag. 2025, 373, 123932. [Google Scholar] [CrossRef]
- Onaolapo, T.F.; Okello, T.W.; Adelabu, S.A.; Adagbasa, E.G. Change in the Urban Landscape of the Drakensberg Mountain Region, South Africa: A Case Study of Phuthaditjhaba. Mt. Res. Dev. 2022, 42, 63–74. [Google Scholar] [CrossRef]
- Tian, G.; Qiao, Z.; Zhang, Y. The investigation of relationship between rural settlement density, size, spatial distribution and its geophysical parameters of China using Landsat TM images. Ecol. Model. 2012, 231, 25–36. [Google Scholar] [CrossRef]
- Li, X.; Li, H.; Zhang, Y.; Yang, L. Spatial Patterns and the Regional Differences of Rural Settlements in Jilin Province, China. Sustainability 2017, 9, 2170. [Google Scholar] [CrossRef]
- Sun, D.; Hong, B.; Ren, P. Spatiotemporal evolution and driving factors of the rural settlements in the mountain-plain transitional zone. Int. J. Agric. Biol. Eng. 2022, 15, 149–155. [Google Scholar] [CrossRef]
- Chenxi, F. The Study on Spatial Form of Traditional Villages in Central and Western Agriculture and Graziery Mixed Area of Inner Mongolia. Master’s Thesis, Inner Mongolia University of Science and Technology, Baotou, China, 2020. [Google Scholar]
- Li, B.; Lu, Y.; Li, Y.; Zuo, H.; Ding, Z. Research on the Spatiotemporal Distribution Characteristics and Accessibility of Traditional Villages Based on Geographic Information Systems-A Case Study of Shandong Province, China. Land 2024, 13, 1049. [Google Scholar] [CrossRef]
- Li, W.; Diehl, J.A.; Chen, M.; Herr, C.M.; Stouffs, R. The combined effects of multiple factors on farmland and built-up land landscape patterns-A case study of Chengdu, China. Ecol. Indic. 2024, 167, 112572. [Google Scholar] [CrossRef]
- Chen, S.; Mehmood, M.S.; Liu, S.; Gao, Y. Spatial Pattern and Influencing Factors of Rural Settlements in Qinba Mountains, Shaanxi Province, China. Sustainability 2022, 14, 10095. [Google Scholar] [CrossRef]
- Dandan, M.; Chaoketu, S.; Tuya, W.; Ying, H.; Yongfang, W. Spatial evolution and influencing factors of rural settlements in eastern inner mongolia, china. Mt. Res. 2023, 41, 863–878. [Google Scholar]
- Li, Y.; Wang, L.; Yu, Y.; Zang, D.; Dai, X.; Zheng, S. Cropland Zoning Based on District and County Scales in the Black Soil Region of Northeastern China. Sustainability 2024, 16, 3341. [Google Scholar] [CrossRef]
- Wang, S.; Xu, X.; Huang, L. Spatial and Temporal Variability of Soil Erosion in Northeast China from 2000 to 2020. Remote Sens. 2023, 15, 225. [Google Scholar] [CrossRef]
- Liao, Z.; Su, K.; Jiang, X.; Wang, J.; You, Y.; Wang, L.; Chang, S.; Wei, C.; Zhang, Y.; Li, C. Spatiotemporal variation and coupling of grazing intensity and ecosystem based on four quadrant model on the Inner Mongolia. Ecol. Indic. 2023, 152, 110379. [Google Scholar] [CrossRef]
- Chen, D.; Zhang, B.; Fadda, C.; Jarvis, D.; Bergamini, N.; Han, G.; Zhao, M.; Bai, K.; Zhang, Z. Spontaneous grassland recovery on abandoned croplands in northern China: Different vegetation patterns in desert and typical steppe. Sci. Total Environ. 2021, 790, 148155. [Google Scholar] [CrossRef]
- Feng, S.; Liu, X.; Zhao, W.; Yao, Y.; Zhou, A.; Liu, X.; Pereira, P. Key Areas of Ecological Restoration in Inner Mongolia Based on Ecosystem Vulnerability and Ecosystem Service. Remote Sens. 2022, 14, 2729. [Google Scholar] [CrossRef]
- Mi, J.; Ou, J.; Liu, H.; Shi, J.; Chen, D.; Bai, Y. The loss of plant species diversity dominated by temperature promotes local productivity in the steppe of eastern Inner Mongolia. Ecol. Indic. 2022, 139, 108953. [Google Scholar] [CrossRef]
- Li, Z.; Bagan, H.; Yamagata, Y. Analysis of spatiotemporal land cover changes in Inner Mongolia using self-organizing map neural network and grid cells method. Sci. Total Environ. 2018, 636, 1180–1191. [Google Scholar] [CrossRef] [PubMed]
- Zhang, Y.; Zhang, Y.; Hu, S.; Zhou, X.; Liu, L.; Liu, J.; Zhao, K.; Li, X. Pastoralism and Millet Cultivation During the Bronze Age in the Temperate Steppe Region of Northern China. Front. Earth Sci. 2021, 9, 748327. [Google Scholar] [CrossRef]
- Xu, H.; Guo, Q.; Siqin, C.; Li, Y.; Gao, F. Study of Settlement Patterns in Farming-Pastoral Zones in Eastern Inner Mongolia Using Planar Quantization and Cluster Analysis. Sustainability 2023, 15, 15077. [Google Scholar] [CrossRef]
- Rasmussen, L.V.; Rasmussen, K.; Reenberg, A.; Proud, S. A system dynamics approach to land use changes in agro-pastoral systems on the desert margins of Sahel. Agric. Syst. 2012, 107, 56–64. [Google Scholar] [CrossRef]
- Pierre, C.; Hiernaux, P.; Rajot, J.L.; Kergoat, L.; Webb, N.P.; Toure, A.A. Marticorena and C. Bouet. Wind erosion response to past and future agro-pastoral trajectories in the Sahel (Niger). Landsc. Ecol. 2022, 37, 529–550. [Google Scholar] [CrossRef]
- Viglizzo, E.F.; Frank, F.; Bernardos, J.; Buschiazzo, D.E.; Cabo, S. A rapid method for assessing the environmental performance of commercial farms in the Pampas of Argentina. Environ. Monit. Assess. 2006, 117, 109–134. [Google Scholar] [CrossRef]
- Bilenca, D.; Codesido, M.; Fischer, C.G.; Carusi, L.P.; Zufiaurre, E.; Abba, A. Impactos de la transformación agropecuaria sobre la biodiversidad en la provincia de Buenos Aires. Rev. Mus. Argent. Cienc. Nat. 2012, 14, 189–198. [Google Scholar] [CrossRef]
- Wang, J.; Deng, C.; Wan, X. Reconsideration of the origins of the pastoral nomadic economy in the Eurasian Steppe. Sci. China-Earth Sci. 2022, 65, 2057–2067. [Google Scholar] [CrossRef]
- Ren, W.; Xue, B.; Yang, J.; Lu, C. Effects of the Northeast China Revitalization Strategy on Regional Economic Growth and Social Development. Chin. Geogr. Sci. 2020, 30, 791–809. [Google Scholar] [CrossRef]
- Dondokov, Z.B.D.; Namzhilova, V.O. China–mongolia–russia economic corridor: Building infrastructure connectivity in the face of global challenges. Reg. Res. Russ. 2023, 13, 568–576. [Google Scholar] [CrossRef]
- Ji, Z.; Lu, Y.; Lu, L.; Duan, Y.; Li, Y.; Huang, A. Research progress and prospects for spatial optimization of rural settlements. China Land Sci. 2021, 35, 95–104. [Google Scholar]
- Chen, W.; Yang, L.; Wu, J.; Wu, J.; Wang, G.; Bian, J.; Zeng, J.; Liu, Z. Spatio-temporal characteristics and influencing factors of traditional villages in the Yangtze River Basin: A Geodetector model. Herit. Sci. 2023, 11, 111. [Google Scholar] [CrossRef]
- Lu, X.; Zhao, Q.; Ye, H.; Li, Y.; Zheng, W.; Li, S.; Li, Y. Analysis of landscape change and driving factors ofcoastal wetlands in yancheng, jiangsu province. Ansactions Oceanol. Limnol. 2022, 44, 23–32. [Google Scholar]
- Guo, L.; Guo, Z.; Jia, H.; Fan, R. Residents electric larceny detection based on pearson correlation coefficient and SVM. J. Hebei Univ. Nat. Sci. Ed. 2023, 43, 357–363. [Google Scholar]
- Yang, Y.; Ni, K.; Guo, W.; Chen, C.; Li, Y. Research and analysis of habitat landscape features in irrigation areas based on k-means clustering algorithm: Taking the world heritage irrigation structures dongfeng weir asan example. J. Hum. Settl. West China 2023, 38, 77–84. [Google Scholar]
- Anjun, T. Spatial differentiation pattern and comprehensive regionalization of rural settlement characteristics in China. Geogr. Sin. 2023, 78, 3144–3160. [Google Scholar]
- Lin, L.; Li, X.; Ma, Z. Quantifying the Geomorphology of the Drainage Basins Along the Greater Khingan Mountains in NE China. Front. Earth Sci. 2021, 9, 796610. [Google Scholar] [CrossRef]
- Li, T.; Li, C.; Zhang, R.; Cong, Z.; Mao, Y. Spatial Heterogeneity and Influence Factors of Traditional Villages in the Wuling Mountain Area, Hunan Province, China Based on Multiscale Geographically Weighted Regression. Buildings 2023, 13, 294. [Google Scholar] [CrossRef]
- Zou, Z.; Li, C.; Wu, X.; Meng, Z.; Cheng, C. The effect of day-to-day temperature variability on agricultural productivity. Environ. Res. Lett. 2024, 19, 124046. [Google Scholar] [CrossRef]
- Luo, G.; Wang, B.; Luo, D.; Fei, C. Research on spatial correlation between rural settlements and cultivated lands in poor mountainous areas in southwest china. Fresenius Environ. Bull. 2020, 29, 5860–5869. [Google Scholar]
- Wana, D.; Smith, S.W.; Coleman, K.E.R.; Speed, J.D.M. Proximity to high densities of pastoral settlements reduces grassland regrowth in a protected tropical savanna. Biotropica 2021, 53, 1316–1327. [Google Scholar] [CrossRef]
- Liu, J.-H.; Gao, J.-X.; Lv, S.-H.; Han, Y.-W.; Nie, Y.-H. Shifting farming-pastoral ecotone in China under climate and land use changes. J. Arid Environ. 2011, 75, 298–308. [Google Scholar] [CrossRef]
- Zhang, H.; Chen, W.; Liu, W.; Liu, Z.; Liu, H. The evolution of settlement system and the paths of rural revitalization in alpine pastoral areas of the Qinghai-Tibet Plateau: A case study of Nagqu County. Ecol. Indic. 2023, 150, 110274. [Google Scholar] [CrossRef]
- Meng, F.L.; He, Y. Study on the spatiotemporal features and evolution of alpine nomadic settlements from the perspective of ecological wisdom: Case study of qiongkushitai village in xinjiang, china. Appl. Ecol. Environ. Res. 2019, 17, 13057–13073. [Google Scholar] [CrossRef]
- Liu, C.; Li, W.; Xu, J.; Zhou, H.; Wang, W.; Wang, H. Temporal and spatial variations of ecological security on the northeastern Tibetan Plateau integrating ecosystem health-risk-services framework. Ecol. Indic. 2024, 158, 111365. [Google Scholar] [CrossRef]


| Data Category | Data Name | Data Source | Specification (Resolution/Scale) | Processing Tools |
|---|---|---|---|---|
| Natural Environment | Elevation (m) | Geospatial Data Cloud (https://www.gscloud.cn/search (accessed on 20 September 2024)) | 30 m, 5 m | GIS |
| Slope (°) | Geospatial Data Cloud | 30 m | Derived from DEM using GIS | |
| Aspect | Geospatial Data Cloud | 30 m | Derived from DEM using GIS | |
| Annual Precipitation (mm) | Resource and Environment Science & Data Center (https://www.resdc.cn/ (accessed on 18 September 2024)) | 30 m | GIS | |
| Lakes | Geofabrik Download Server (https://download.geofabrik.de/ (accessed on 24 September 2024)) | — | GIS | |
| River Networks | Geospatial Data Cloud | 30 m | Derived from DEM using GIS | |
| High-resolution Imagery | Google Earth | 0.5–2.5 m | GIS | |
| Socio-Economic | Road Network | Geofabrik Download Server | 30 m | GIS |
| Population Distribution | WorldPop (https://hub.worldpop.org/ (accessed on 5 October 2024)) | 100 m | GIS | |
| Built-up Areas (2020) | Resource and Environment Science & Data Center (https://www.resdc.cn/ (accessed on 27 September 2024)) | 30 m | GIS | |
| Settlement patch (2023) | Sentinel-2 Land Cover Explorer (https://livingatlas.arcgis.com/landcoverexplorer (accessed on 24 February 2025)) | 10 m | GIS | |
| GDP | National Tibetan Plateau Science Data Center (http://data.tpdc.ac.cn/zh-hans/ (accessed on 6 January 2025)) | — | GIS | |
| Land Use (2020) | Resource and Environment Science & Data Center | 30 m | GIS |
| Spatial Pattern Feature | Landscape Metric | Description |
|---|---|---|
| Scale and Density | Patch Density (PD) | Number of patches per 100 km2 |
| Mean Patch Size (MPS) | Average patch area within each grid cell (km2) | |
| Shape Complexity | Splitting Index (SPLIT) | Indicates degree of fragmentation; higher values denote greater dispersion |
| Landscape Shape Index (LSI) | Measures patch boundary complexity relative to a square baseline | |
| Spatial Proximity | Mean Nearest Neighbor Distance (MNN) | Average Euclidean distance between patches (km) |
| Driving Factor | STD | Robust_SE | Robust_t | p | VIF |
|---|---|---|---|---|---|
| Distance from Built-up Area | 6.848154 | 7.452350 | 1.839169 | 0.066054 | --- |
| Elevation | 0.002422 | 0.002172 | 5.316906 | 0.000000 * | 7.337293 |
| Slope | 0.146924 | 0.109742 | −7.134488 | 0.000000 * | 2.553408 |
| Aspect | 0.026538 | 0.035446 | 0.552522 | 0.580666 | 1.007989 |
| Annual Precipitation | 0.007222 | 0.007048 | −0.724715 | 0.468712 | 3.401655 |
| Average Annual Temperature | 0.281337 | 0.283416 | 8.085078 | 0.000000 * | 4.019192 |
| Woodland Area | 0.566052 | 0.402226 | 4.223385 | 0.000030 * | 2.551190 |
| Farmland Area | 0.561533 | 0.531298 | 20.156815 | 0.000000 * | 2.508411 |
| Pasture Area | 0.568564 | 0.512372 | 2.980651 | 0.002925 * | 2.571708 |
| Distance from Road | 0.000095 | 0.000072 | −7.634840 | 0.000000 * | 1.200317 |
| Distance from Water | 0.000190 | 0.000161 | −7.077612 | 0.000000 * | 1.130285 |
| Cluster Type | Annual Precipitation | Woodland Area | Farmland Area | Pasture Area | Distance from Road | Distance from Water | PD | MPS | SPLIT | LSI | MNN |
|---|---|---|---|---|---|---|---|---|---|---|---|
| Type I | 467.3 | 1,355,978.0 | 24,599,066.97 | 62,433,027.07 | 1894.03 | 2106.75 | 28.15 | 0.093 | 5.09 | 1.32 | 677.85 |
| Type II | 448.79 | 1,345,129.41 | 30,563,112.4 | 60,979,527.4 | 2317.24 | 2160.43 | 26.77 | 0.12 | 4.31 | 1.31 | 728.56 |
| Type III | 490.05 | 7,063,550.10 | 37,372,565.86 | 44,784,305.79 | 4601.37 | 2466.31 | 21.69 | 0.09 | 3.86 | 1.31 | 917.87 |
| Type IV | 485.32 | 41,676,498.4 | 16,862,602.98 | 21,358,811.19 | 3500.34 | 1971.17 | 10.31 | 0.06 | 1.94 | 1.32 | 1843.83 |
| Cluster Type | Dominant Landscape Context | Spatial Distribution Characteristics | Illustration (per 100 km2) |
|---|---|---|---|
| Type I | Alpine Pastoral Zones | Predominantly distributed in mountainous areas with steep slopes and limited arable land; settlements are aligned with ecological edges, roads, and waterways. |  |
| Type II | Agro-Pastoral Transitional Zones | Located in ecotonal foothills and transitional belts where farming and herding intersect; moderate terrain constraints and mixed land potential. | 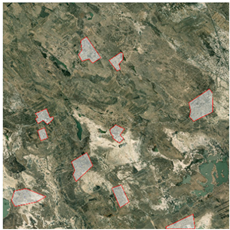 |
| Type III | River Valley and Agricultural Zones | Concentrated in fertile river valleys and alluvial plains; favorable topography supports intensive agriculture and infrastructural accessibility. |  |
| Type IV | Highland Forested Regions | Confined to high-altitude, densely forested zones with strong ecological restrictions and poor development conditions. |  |
Disclaimer/Publisher’s Note: The statements, opinions and data contained in all publications are solely those of the individual author(s) and contributor(s) and not of MDPI and/or the editor(s). MDPI and/or the editor(s) disclaim responsibility for any injury to people or property resulting from any ideas, methods, instructions or products referred to in the content. |
© 2025 by the authors. Licensee MDPI, Basel, Switzerland. This article is an open access article distributed under the terms and conditions of the Creative Commons Attribution (CC BY) license (https://creativecommons.org/licenses/by/4.0/).
Share and Cite
Zhang, Z.; Wu, X.; Chen, S.; Jia, L.; Wang, Q.; Zhang, Z.; Li, M.; Jia, R.; Lin, Q. Spatial Pattern and Driving Mechanisms of Settlements in the Agro-Pastoral Ecotone of Northern China: A Case Study of Eastern Inner Mongolia. Land 2025, 14, 1268. https://doi.org/10.3390/land14061268
Zhang Z, Wu X, Chen S, Jia L, Wang Q, Zhang Z, Li M, Jia R, Lin Q. Spatial Pattern and Driving Mechanisms of Settlements in the Agro-Pastoral Ecotone of Northern China: A Case Study of Eastern Inner Mongolia. Land. 2025; 14(6):1268. https://doi.org/10.3390/land14061268
Chicago/Turabian StyleZhang, Ziqi, Xiaotong Wu, Song Chen, Lyuyuan Jia, Qianhui Wang, Zhiqing Zhang, Mingzhe Li, Ruofei Jia, and Qing Lin. 2025. "Spatial Pattern and Driving Mechanisms of Settlements in the Agro-Pastoral Ecotone of Northern China: A Case Study of Eastern Inner Mongolia" Land 14, no. 6: 1268. https://doi.org/10.3390/land14061268
APA StyleZhang, Z., Wu, X., Chen, S., Jia, L., Wang, Q., Zhang, Z., Li, M., Jia, R., & Lin, Q. (2025). Spatial Pattern and Driving Mechanisms of Settlements in the Agro-Pastoral Ecotone of Northern China: A Case Study of Eastern Inner Mongolia. Land, 14(6), 1268. https://doi.org/10.3390/land14061268