Article

AI-Based Identification and Redevelopment Prioritization of Inefficient Industrial Land Using Street View Imagery and Multi-Criteria Modeling

1
School of Resources and Environmental Engineering, Wuhan University of Technology, Wuhan 430070, China
2
Zhejiang Space-Time Sophon Big Data Co., Ltd., Ningbo 315101, China
3
School of Resource and Environmental Science, Wuhan University, Wuhan 430070, China
*
Author to whom correspondence should be addressed.
Land 2025, 14(6), 1254; https://doi.org/10.3390/land14061254
Submission received: 28 April 2025 / Revised: 3 June 2025 / Accepted: 6 June 2025 / Published: 11 June 2025

Abstract

:
The strategic prioritization of inefficient industrial land (IIL) redevelopment is critical for directing capital allocation toward sustainable urban regeneration. However, current redevelopment prioritization suffers from inefficient identification of IIL and ambiguous characterization of redevelopment potential, which hinders the efficiency of land resource allocation. To address these challenges, this study develops an AI-driven redevelopment prioritization framework for identifying IIL, evaluating redevelopment potential, and establishing implementation priorities. For land identification we propose an improved YOLOv11 model with an AdditiveBlock module to enhance feature extraction in complex street view scenes, achieving an 80.1% mAP on a self-built dataset of abandoned industrial buildings. On this basis, a redevelopment potential evaluation index system is constructed based on the necessity, maturity, and urgency of redevelopment, and the Particle Swarm Optimization-Projection Pursuit (PSO-PP) model is introduced to objectively evaluate redevelopment potential by adaptively reducing the reliance on expert judgment. Subsequently, the redevelopment priorities were classified according to the calculated potential values. The proposed framework is empirically tested in the central urban area of Ningbo City, China, where inefficient industrial land is successfully identified and redevelopment priority is categorized into near-term, medium-term, and long-term stages. Results show that the framework integrating computer vision and machine learning technology can effectively provide decision support for the redevelopment of IIL and offer a new method for promoting the smart growth of urban space.

1. Introduction

Rational layout arrangement and advantageous development of urban industrial spaces are crucial for accelerating industrial restructuring [1]. However, many cities are suffering from disordered urban expansion and extensive land-use patterns, which have led to long-term inefficient land occupation. As urban sprawl slows, the inefficient land occupation has further intensified land supply constraints during industrial transformation and upgrading [2]. The scarcity of industrial land not only restricts the development space for emerging industries but also hinders sustainable urban renewal [3]. The redevelopment of inefficient industrial land (IIL) can effectively alleviate land shortages and support industrial upgrading, making it a crucial strategy for optimizing urban spatial structure [4]. Nevertheless, many cities face financial constraints in redevelopment projects, which requires a more refined planning approach that maximizes the use of resources and prioritizes cost-effective redevelopment [5,6]. Therefore, targeted and phased planning for IIL redevelopment is crucial for maximizing the value of scarce urban land resources and supporting industrial restructuring and upgrading [7].
Carrying out the redevelopment planning requires determining the sequence of redevelopment lands, which involves identifying IIL and setting effective redevelopment priorities. At present most studies concentrate on the identification of IIL, for instance, Jin et al. proposed an indicator system to identify IIL across the three dimensions of site attributes, urban services, and production efficiency [8]. Wang et al. developed a comprehensive environmental assessment system that integrates historical imagery, statistical data, and land monitoring data to identify IIL [9]. These studies mostly identify the IIL according to its economic profit and development intensity, ignoring the characteristic of building aging. However, the aging condition of the buildings largely determines whether the IIL should be reconstructed or upgraded, which will further affect the redevelopment methods and priorities of IIL [10]. Therefore, some scholars began to introduce the aging condition of buildings into the identification progress, for example, Yin and Silverman et al. used field survey data and geospatial data to predict building abandonment in Buffalo, New York, in order to conduct a detailed analysis of abandonment and demolition patterns in traditional American cities [11]. Although field surveys can provide an accurate assessment of a building’s condition, this approach is time-consuming and costly, hindering the intelligent development of urban spaces. In recent years, street view images (SVIs) have emerged as a novel form of geographic big data, providing valuable insights into urban physical spaces [12]. By integrating deep learning algorithms, building deterioration features can be automatically extracted from SVI, enhancing the efficiency and accuracy of IIL identification [13]. This approach facilitates a data-driven transition in urban redevelopment.
At present, most studies determine the priority of industrial land redevelopment by evaluating its redevelopment potential [14,15,16]. For example, Teng proposed a comprehensive evaluation framework for inefficient land redevelopment, incorporating multiple dimensions such as regional planning, land-use intensity, and economic benefits. Using a multi-criteria evaluation method the study assessed both dimensional and comprehensive indicators of inefficient land in Rencheng District, Jining City, and ranked its redevelopment priority [17]. Similarly, Cheng et al. developed a framework integrating social, economic, and environmental criteria to assess the redevelopment potential of IIL, prioritizing sites through multi-criteria analysis based on assessment scores [18]. These studies provide valuable methodological support for redevelopment prioritization. However, previous research has primarily focused on the intrinsic characteristics of the land while largely overlooking the surrounding environmental conditions. Since the external environment directly influences the feasibility of redevelopment, it plays a crucial role in investment decisions and redevelopment sequencing [19]. In this context, SVI has emerged as a powerful tool in urban renewal and spatial planning, offering high-precision environmental perception data that facilitate the quantification of key factors such as street vitality and green coverage [16]. By integrating SVI, redevelopment potential assessments can incorporate a more comprehensive set of environmental factors, leading to more robust decision-making [20].
Additionally, conventional potential evaluation methods often struggle to account for regional differences in indicator weighting and are heavily influenced by expert judgment, limiting their generalizability [21]. To address this limitation, recent studies have applied projection pursuit (PP) models to slope stability evaluation [22], water environment evaluation [23], and soil–water resource composite evaluation [24]. The PP model projects high-dimensional data into a low-dimensional space, enabling direct extraction of structural patterns while reducing reliance on predefined samples and expert experience [25]. Given these advantages, introducing PP into IIL potential evaluation could enhance objectivity and reflect the true redevelopment potential more accurately.
To address the above shortcomings, we aim to develop a framework for identifying and prioritizing inefficient industrial land and conduct empirical research using the central urban area of Ningbo, China, as a case study. Our framework’s goals are (1) to further identify IIL by using SVI data and computer vision algorithms after screening economically inefficient industrial land, (2) to construct a redevelopment potential evaluation index system from three dimensions of the necessity, maturity, and urgency so as to deeply explore the redevelopment potential of IIL, and (3) to employ PSO-PP to evaluate the redevelopment potential of the identified IIL and determine the redevelopment priority of IIL by potential evaluation values.

2. Materials and Methods

The framework for identification and redevelopment prioritization of IIL proposed in this study is illustrated in Figure 1. It consists of the following two components: the identification of IIL and the redevelopment prioritization of IIL.

2.1. Identification of IIL

2.1.1. Screening of Economically Inefficient Industrial Land

Currently, urban redevelopment typically involves upgrading or reconstructing the existing built-up areas [26]. Upgrading industrial land is suitable for land with poor economic benefits but acceptable building conditions and is primarily driven by enterprises through autonomous modifications or technological upgrades. In contrast, the reconstruction of industrial land prioritizes areas characterized by low economic benefits and substandard building conditions which are slated for demolition and subsequent rebuilding under government guidance. The industrial land that needs to be reconstructed is the focus of this study.
The efficiency of land first depends on its economic benefits [27]. Therefore, in the process of identifying IIL it is essential to first assess the economic output generated by the land. This study primarily evaluates the economic benefits of industrial land by measuring the economic contributions of enterprises on the land [28]. To this end, six key indicators have been selected to assess the economic contributions of enterprises, including per-mu tax revenue, per-mu value added, value added per unit of energy consumption, value added per unit of emissions, overall labor productivity, and R&D expenses to operating revenue. By weighting these indicators the comprehensive value of each land parcel is calculated and classified into the following four categories: A, B, C, and D. The proportion of each category can be dynamically adjusted according to the development conditions of different regions. It is worth noting that the division of industry sectors can be based on the characteristics of local industries, and the grading of enterprises should be compared within the same industry sector.

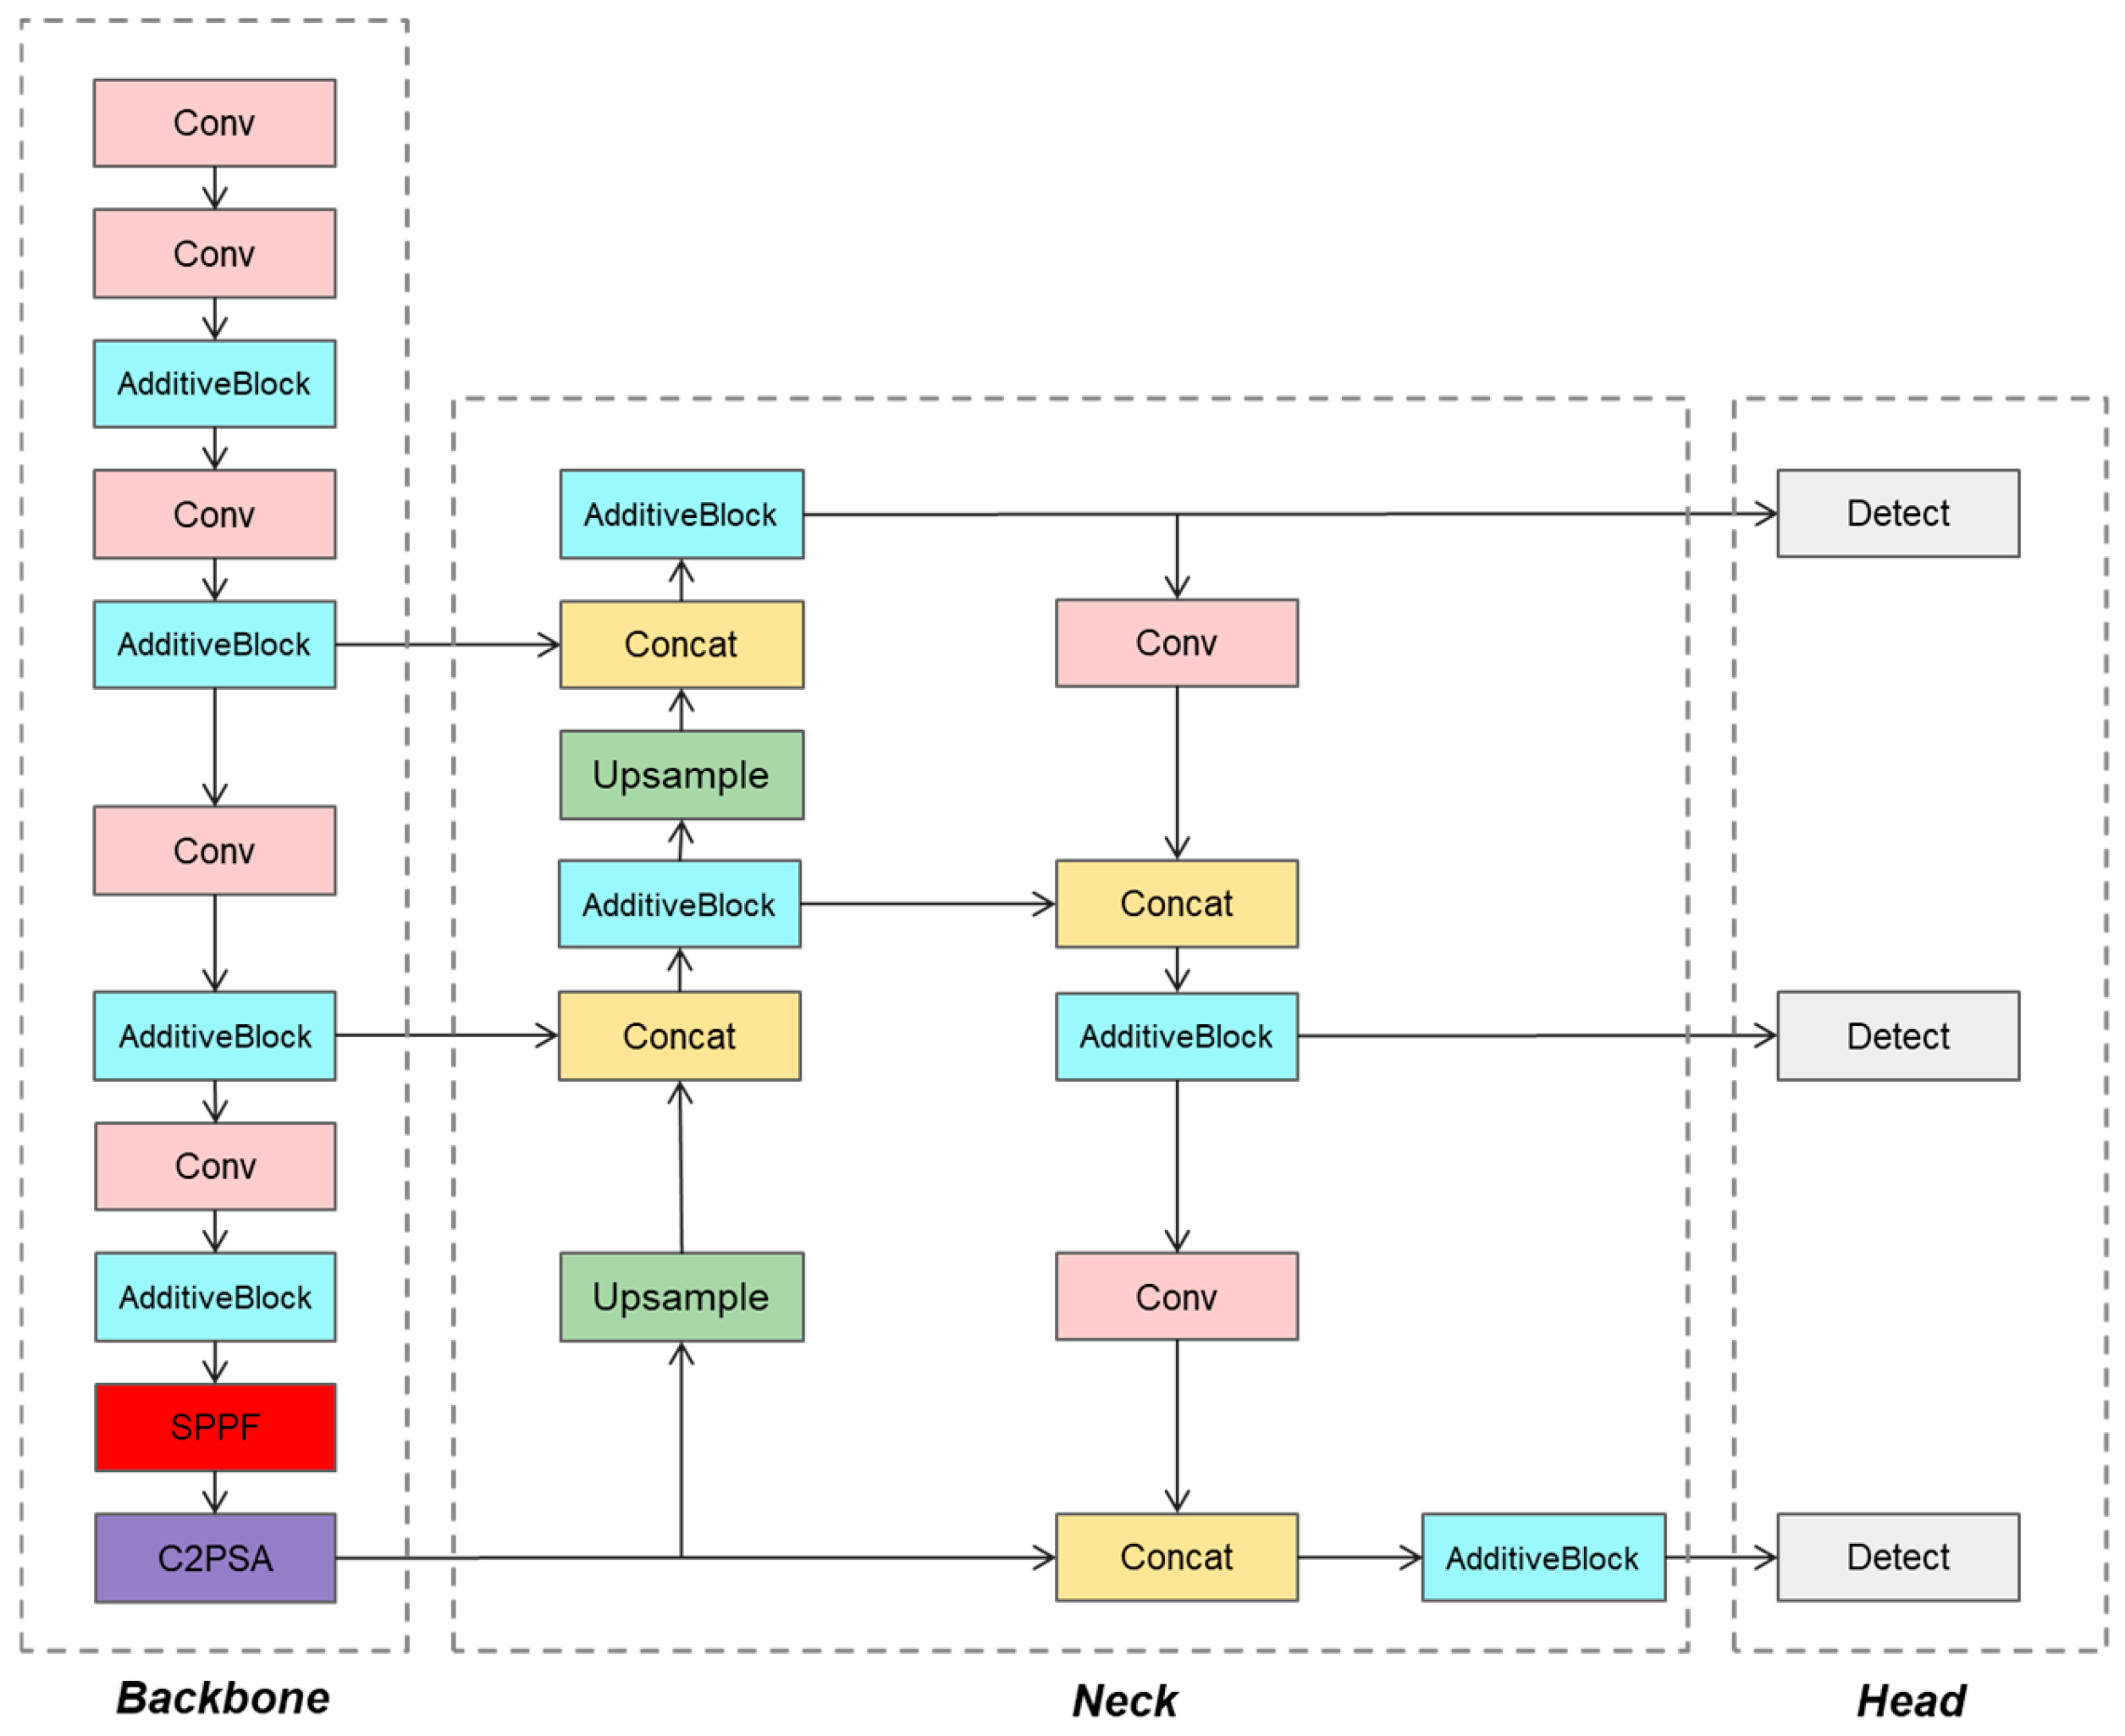
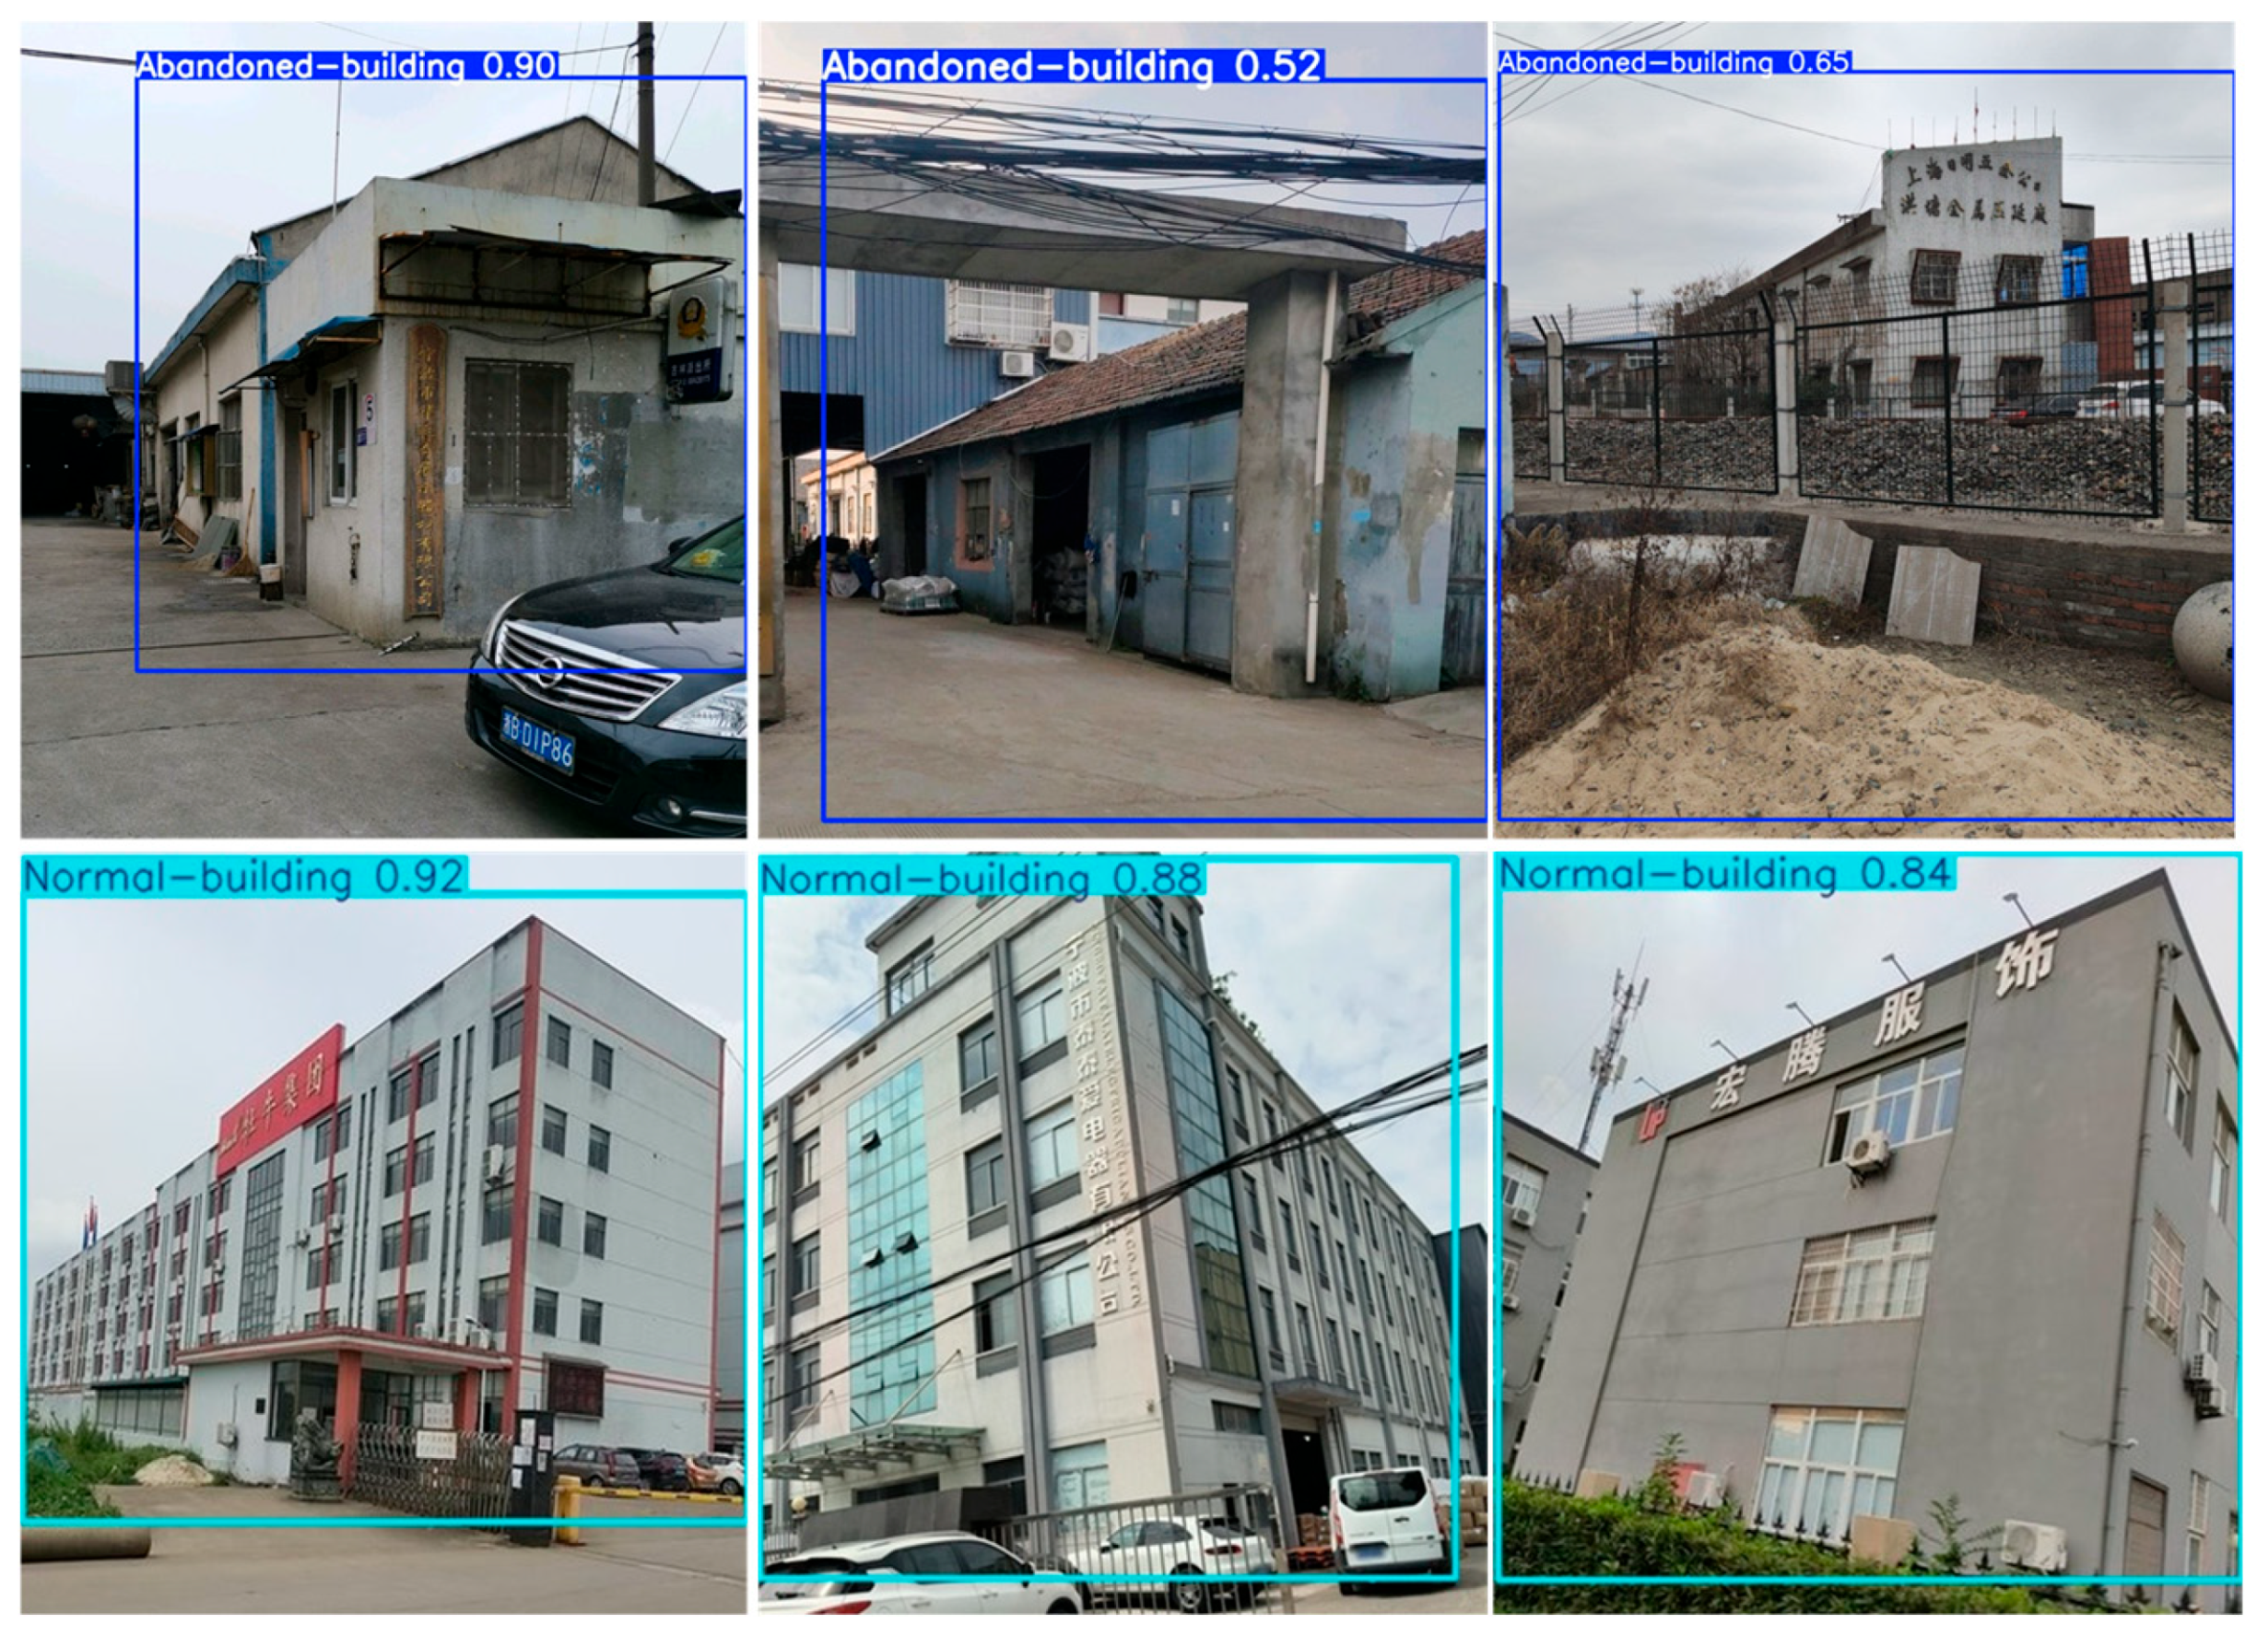
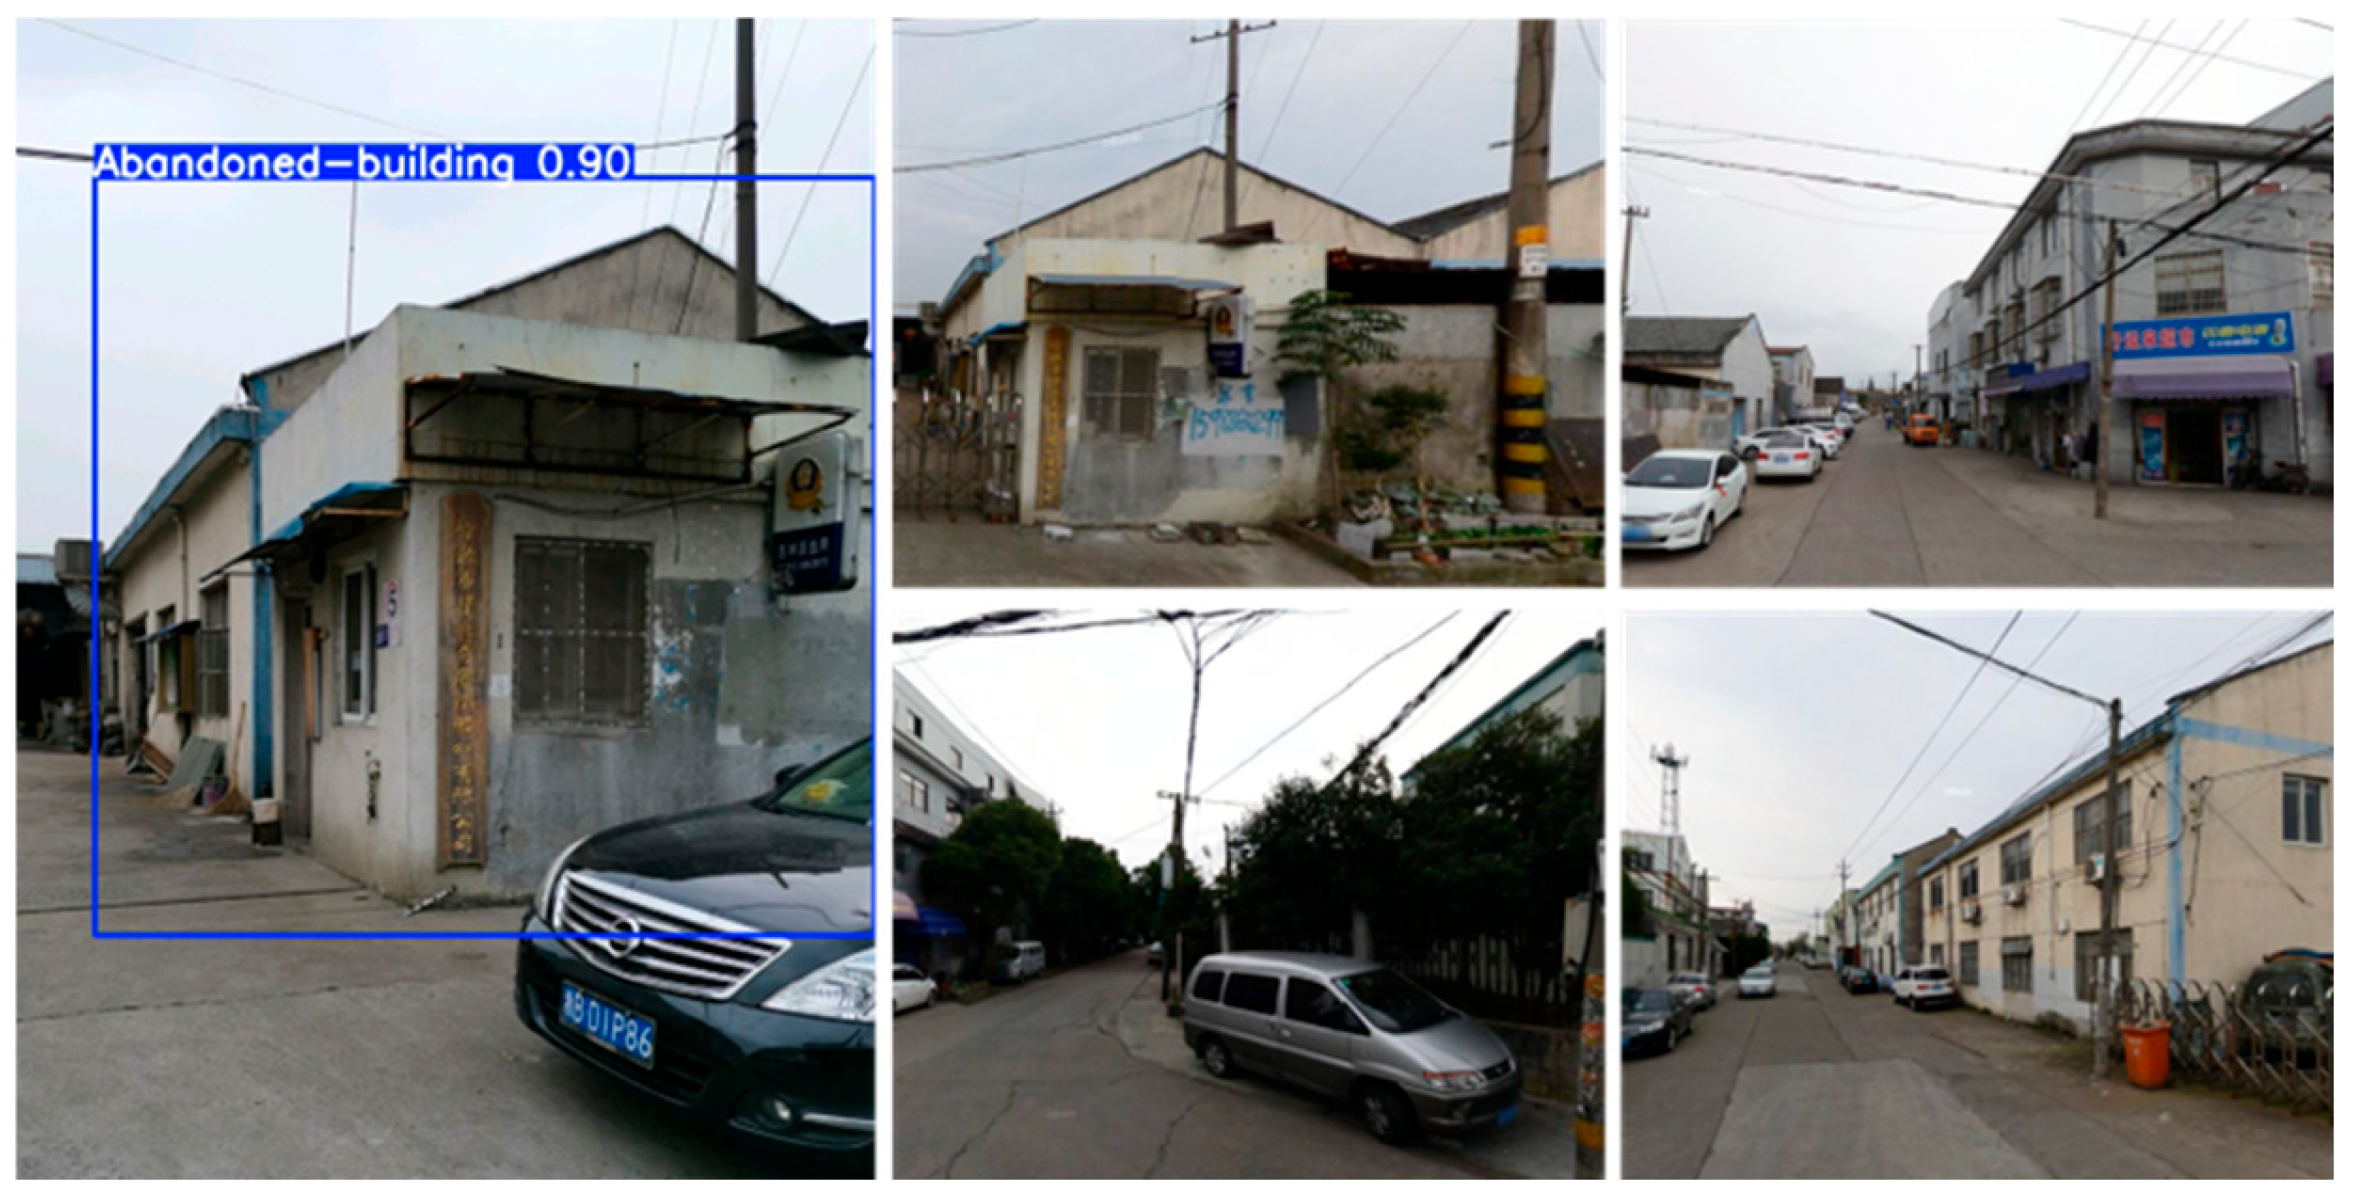
2.1.2. Abandoned Building Identification Model Based on Improved YOLOv11

The redevelopment of land needs to take into account not only economic considerations but also the aging of the buildings [29]. The aging of the building determines whether the redevelopment method should consider reconstruction or renovation. Therefore, this study constructed an SVI building dataset and trained an abandoned building identification model based on improved YOLOv11 to identify IIL that requires reconstruction.
In street view images, buildings usually occupy a large proportion or are easily obscured by trees. Therefore, algorithms which demonstrate robust global contextual awareness and multi-scale feature fusion mechanisms should be emphasized to enhance the accuracy of building recognition. With its multi-scale feature fusion capability and global context awareness mechanism the YOLO (You Only Look Once) series algorithm can effectively deal with the contour extraction of large-size targets and feature reasoning under partial occlusion [30]. YOLOv11 is a significant upgrade in the YOLO series, which offers notable improvements in accuracy, speed, and computational efficiency, making it more suitable for the abandoned building recognition task in this study [31]. Its core architecture comprises the following three components: a backbone network for multi-scale feature extraction (Backbone), a feature pyramid network (Neck) for feature fusion, and a detection head (Head) for generating final predictions [32].
However, in abandoned building detection tasks the YOLOv11 model fails to effectively capture discriminative features of buildings due to the following three critical challenges: structural homogeneity between buildings and their surroundings, complex illumination dynamics, and severe partial occlusion. To address this limitation, this study referred to CAS-ViT (Convolutional Additive Self-attention Vision Transformer) [33] and designed an AdditiveBlock module to replace C3K2 in YOLOv11, thereby improving feature discriminability and computational efficiency. The improved YOLOv11 will serve as the abandoned building identification model for this study. The architecture of AdditiveBlock is shown in Figure 2. The AdditiveBlock module comprises the following three parts with residual shortcuts: (1) an integration subnet for local feature aggregation and positional encoding, (2) a Convolutional Additive Token Mixer (CATM) that replaces conventional matrix multiplication with lightweight spatial-channel attention interactions, thereby reducing computational complexity to linear scale, and (3) a multilayer perceptron (MLP) for feature refinement. Specifically, the CATM facilitates global–local feature fusion through additive token mixing, while the MLP enhances representation capacity.
The AdditiveBlock module integrates convolutional operations with additive self-attention, effectively capturing both global contextual dependencies and local structural patterns. This design enhances detection accuracy in complex scenes (e.g., cluttered street view images) and enables robust multi-scale object recognition. Figure 3 shows the structure of the improved YOLOv11.
In order to train the abandoned building identification model based on improved YOLOv11, this study constructed a street view building image dataset with a total of 1368 corporate building street view images (covering 2098 buildings). Subsequently, the LabelMe segmentation tool was used to annotate each building instance in the street view images and the buildings were classified as either ‘abandoned buildings’ or ‘normal buildings’. The dataset was partitioned into training, validation, and test sets at an 8:1:1 ratio to facilitate model training, convergence verification, and performance evaluation. The specific division of the dataset is detailed in Table 1.
To validate the model’s precision, we employed evaluation metrics such as precision (P), mean average precision (mAP), and recall (R) [34]. These metrics quantify model performance and verify its applicability in practical scenarios. The formulas for these metrics are defined as follows:
P = T P T P + F P  
R = T P T P + F N
m A P = 1 N i = 1 N A P i
where TP is the actual number of positive class samples predicted as positive class; FP is the actual number of negative class samples predicted as positive class samples; FN is the actual number of positive class samples predicted as negative class samples; A P i represents the average accuracy of category i; and N represents the total number of categories.

2.1.3. IIL Identification Integrating Economic and Building Features

Based on the methodology outlined in Section 2.1.1 plots exhibiting low economic efficiency are first identified. Subsequently, street view images corresponding to these target plots are collected. The abandoned building identification model trained in Section 2.1.2 is then deployed to analyze the imagery. Those identified plots containing structures classified as “abandoned buildings” will be designated as IIL.

2.2. Redevelopment Prioritization of IIL

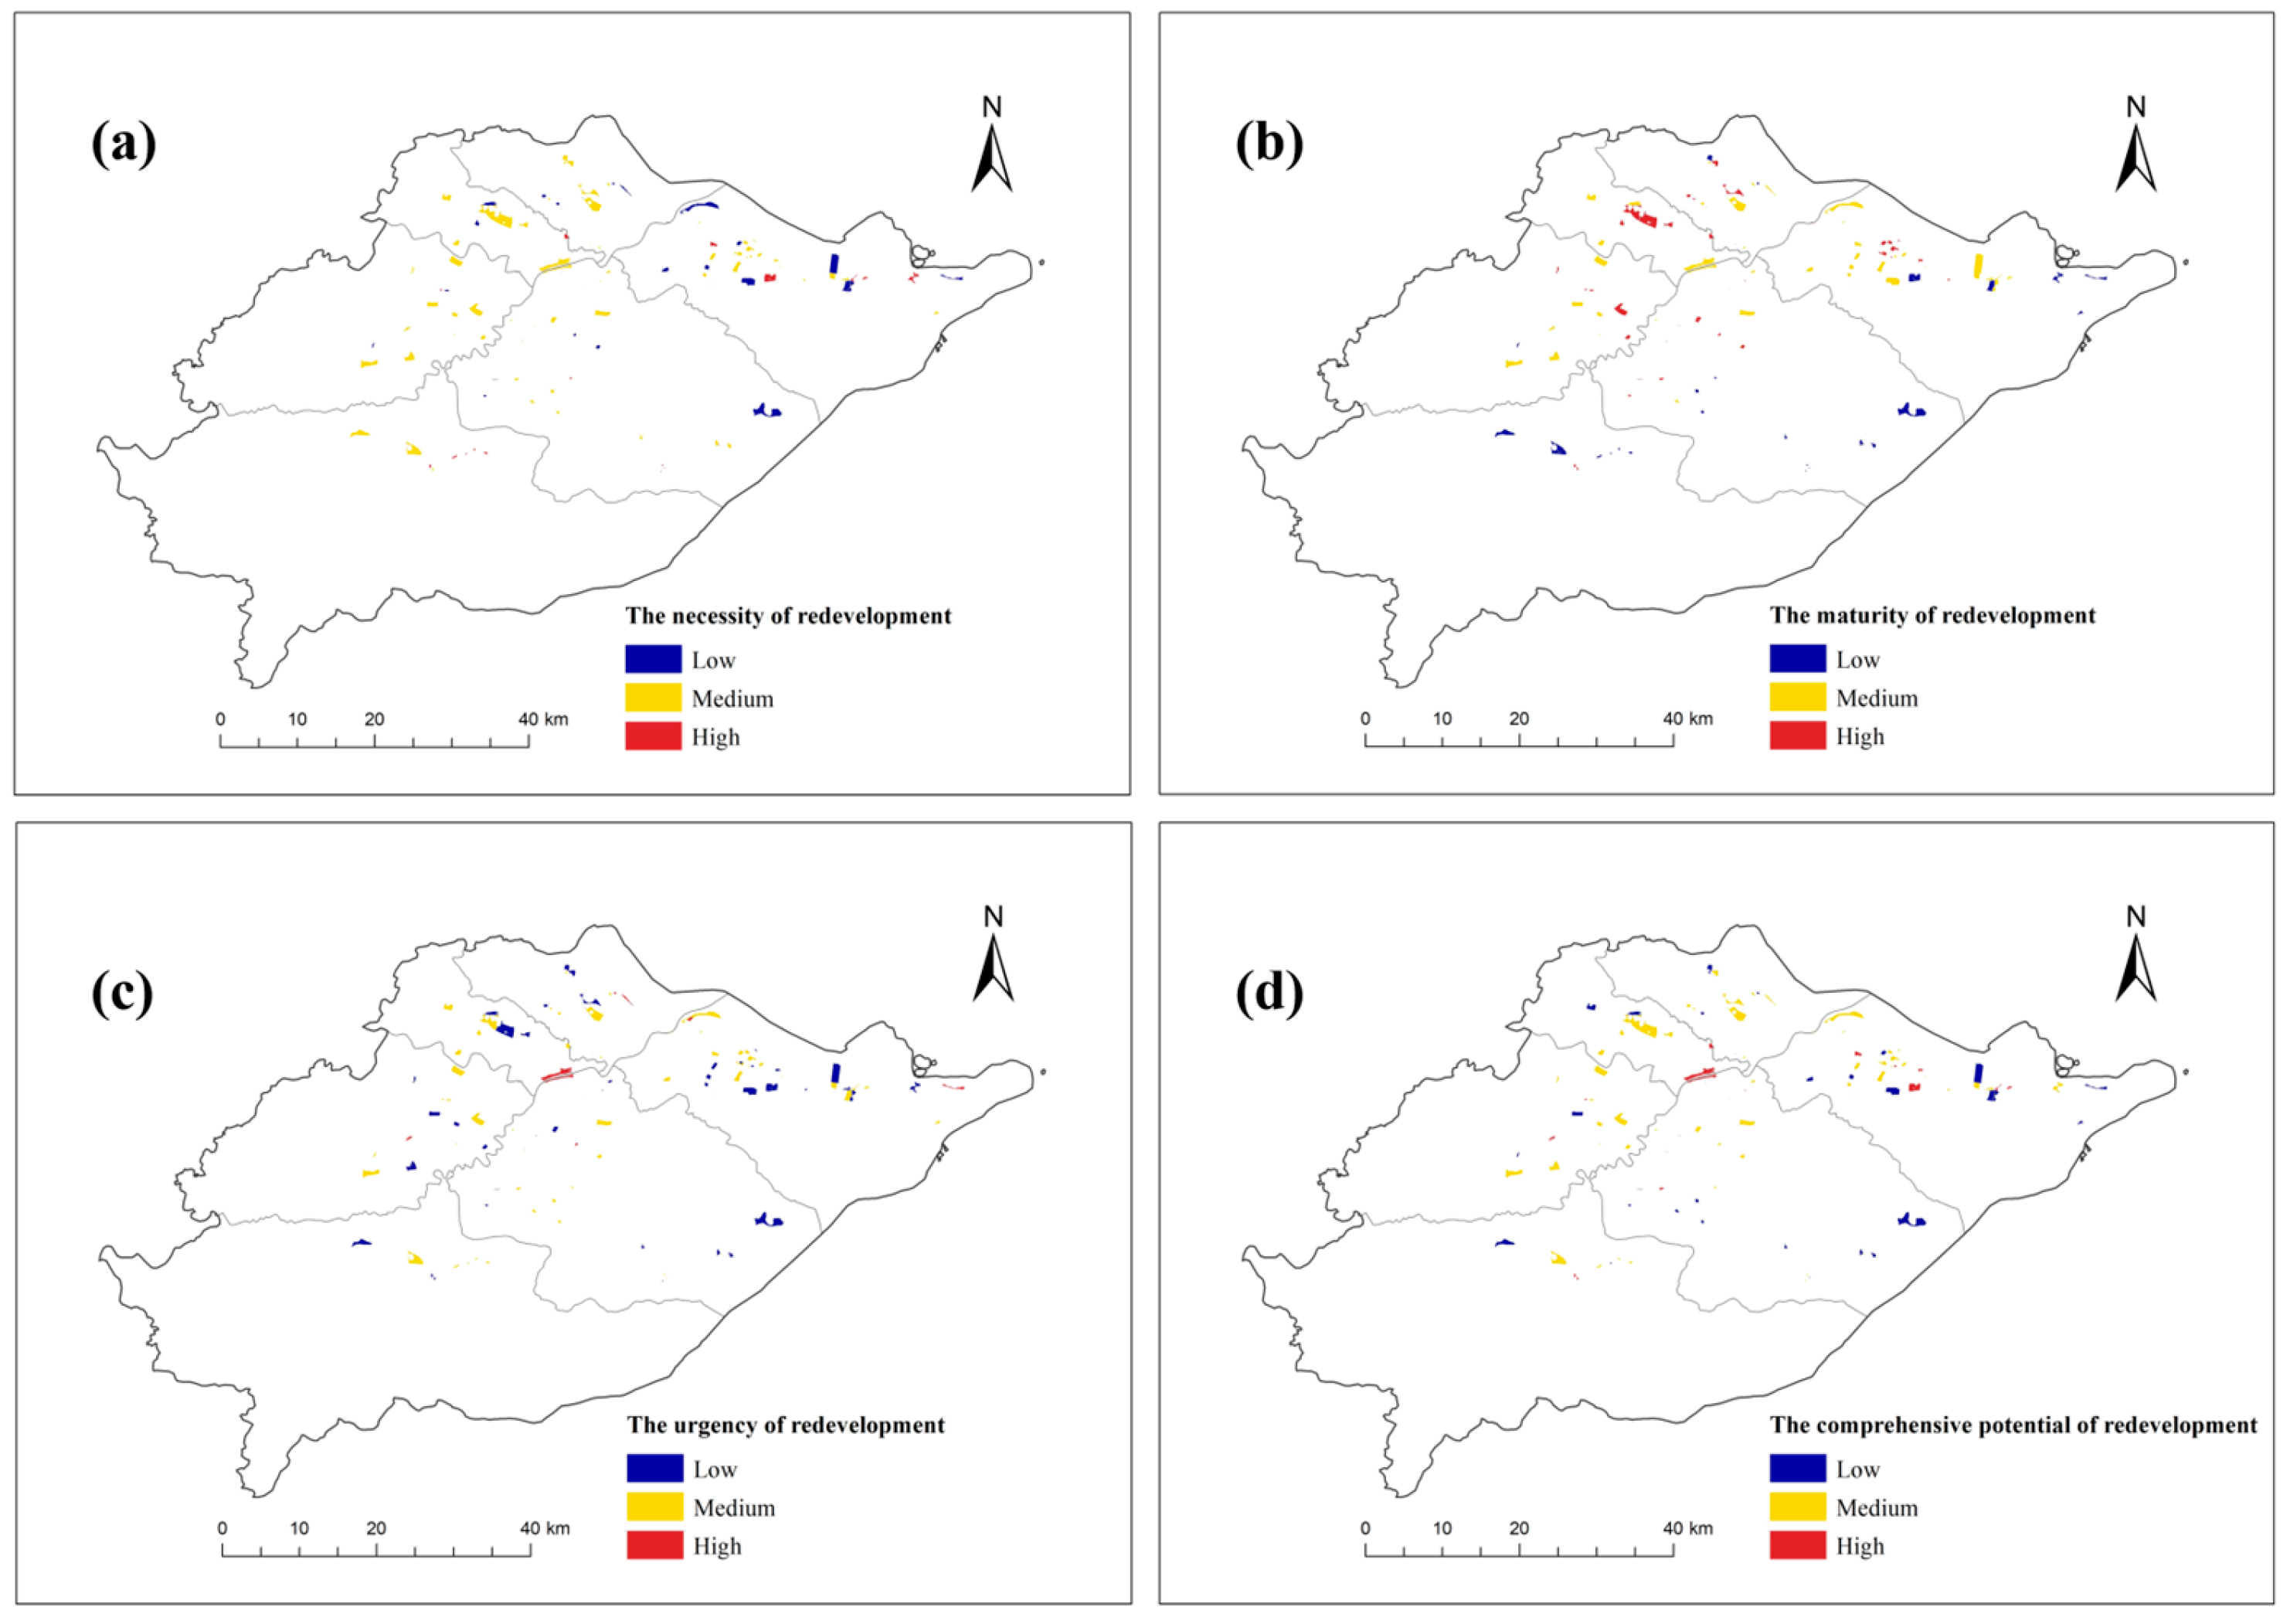
2.2.1. Redevelopment Potential Evaluation Index System of IIL

The evaluation of the redevelopment potential of IIL can provide a scientific basis and support for the determination of subsequent redevelopment priorities [35]. This study established a redevelopment potential index system based on existing research [36,37,38,39], incorporating 15 indicators across the following 3 perspectives: necessity, maturity, and urgency. The detailed index system is presented in Table 2.
The necessity perspective measures the economic benefits and development intensity of plots. Economic benefits include average employment, per-mu tax revenue, per-mu output value, per-mu industrial added value, and annual revenue, while development intensity is reflected by building height and building density. Poorer economic performance of industrial land will lead to greater potential for its redevelopment to revitalize regional economic vitality. Additionally, the lower the land development intensity, the lower the redevelopment costs, and the greater the redevelopment potential. Therefore, land with poor economic performance or low development intensity should be prioritized for redevelopment.
The maturity perspective measures the environmental condition and completeness of supporting facilities around the plot. This study selected traffic convenience, street network density, industrial agglomeration, sky view factor, greenery coverage ratio, and waterfront accessibility as evaluation indicators. The higher these indicators, the greater the area’s maturity, making it more attractive to investors. Therefore, these areas should be prioritized for redevelopment.
The urgency perspective screens those enterprises on the plot that are either environmentally damaging or technologically outdated. The more severe the environmental pollution is then the greater the need for redevelopment is to improve environmental quality. The more backward the enterprise’s technology is, the more necessary it is to carry out redevelopment to improve production efficiency. As a result, the redevelopment of such land is more urgent and should be prioritized.

2.2.2. Evaluation of Redevelopment Potential

This study employs the Particle Swarm Optimization Projection Pursuit (PSO-PP) model to evaluate the redevelopment potential of IIL based on the potential index system constructed above. The PP model can define the optimal observation perspective from sample data, providing an objective reflection of each indicator’s contribution to the overall evaluation. The PSO algorithm is introduced as an efficient global optimization method to approximates the optimal solution by intelligently adjusting particle trajectories [40]. By optimizing the PP model with the PSO algorithm, the PSO-PP model effectively addresses nonlinear optimization challenges in multidimensional spaces, determining the redevelopment potential of each plot. The model construction process is detailed as follows:
Step 1. Normalize the indicators in the evaluation system of IIL redevelopment potential to standardize the range of variation across all indicators.
For negative indicators (higher values mean lower potential) this is performed as follows:
x i , j = x j m a x x i j x j m a x x j m i n
For positive indicators (the higher the value, the higher the potential) this is performed as follows:
x i , j = x i j x j m i n x j m a x x j m i n  
where x j m a x and x j m i n are the maximum and minimum values of the jth indicator, respectively, and x i , j is the normalized indicator value.
Step 2. Construct the projection objective function to project the p-dimensional data onto one-dimensional directions. By projecting each dimension of the IIL redevelopment potential evaluation index system onto the projection vector a = {a(1), a(2), a(3), …, a(p)} (where a represents the unit length vector), the potential evaluation value z(i) is obtained. The equation is as follows:
z i = j = 1 p a j x i , j
and the objective function equations are as follows:
Q a = S Z D Z
S Z = i = 1 n z i E z 2 n 1
D Z = i = 1 n j = 1 n R r i , j · u ( R r i , j )
where z (i) is the projection value, which represents the value of redevelopment potential. Q (a) is the objective function. Sz represents the standard deviation of the projection value z (i). Dz represents the local density of z (i). E (z) represents the average value of z (i). R represents the radius of the local density window and the value is 0.1 Sz. r (i, j) represents the distance between samples. u ( R r i , j ) represents the unit step function and when R r i , j ≥ 0 the value is 1 and when R r i , j < 0 the value is 0.
Step 3. The PSO algorithm is used to find the best projection objective function. By iteratively adjusting the position of the particles (i.e., the projection direction a) the projection value z (i) and the objective function Q (a) are calculated to find the optimal projection direction a* and the optimal projection index function Q* (a).
Step 4. Bring the best projection direction a* calculated in the second step into Formula (6) to obtain the optimal projection value z* (i), which can retain the relevant information in the original data to the greatest extent and reduce the dimension and complexity of the data. z* (i) is an effective representation of the original data and can reflect the characteristics and laws of the data in each dimension.
According to the calculation of the redevelopment potential value of each plot, the natural breakpoint method is used to divide the redevelopment priority of the plot into the following three stages: near-term redevelopment, medium-term redevelopment, and long-term redevelopment.

3. Study Area and Data
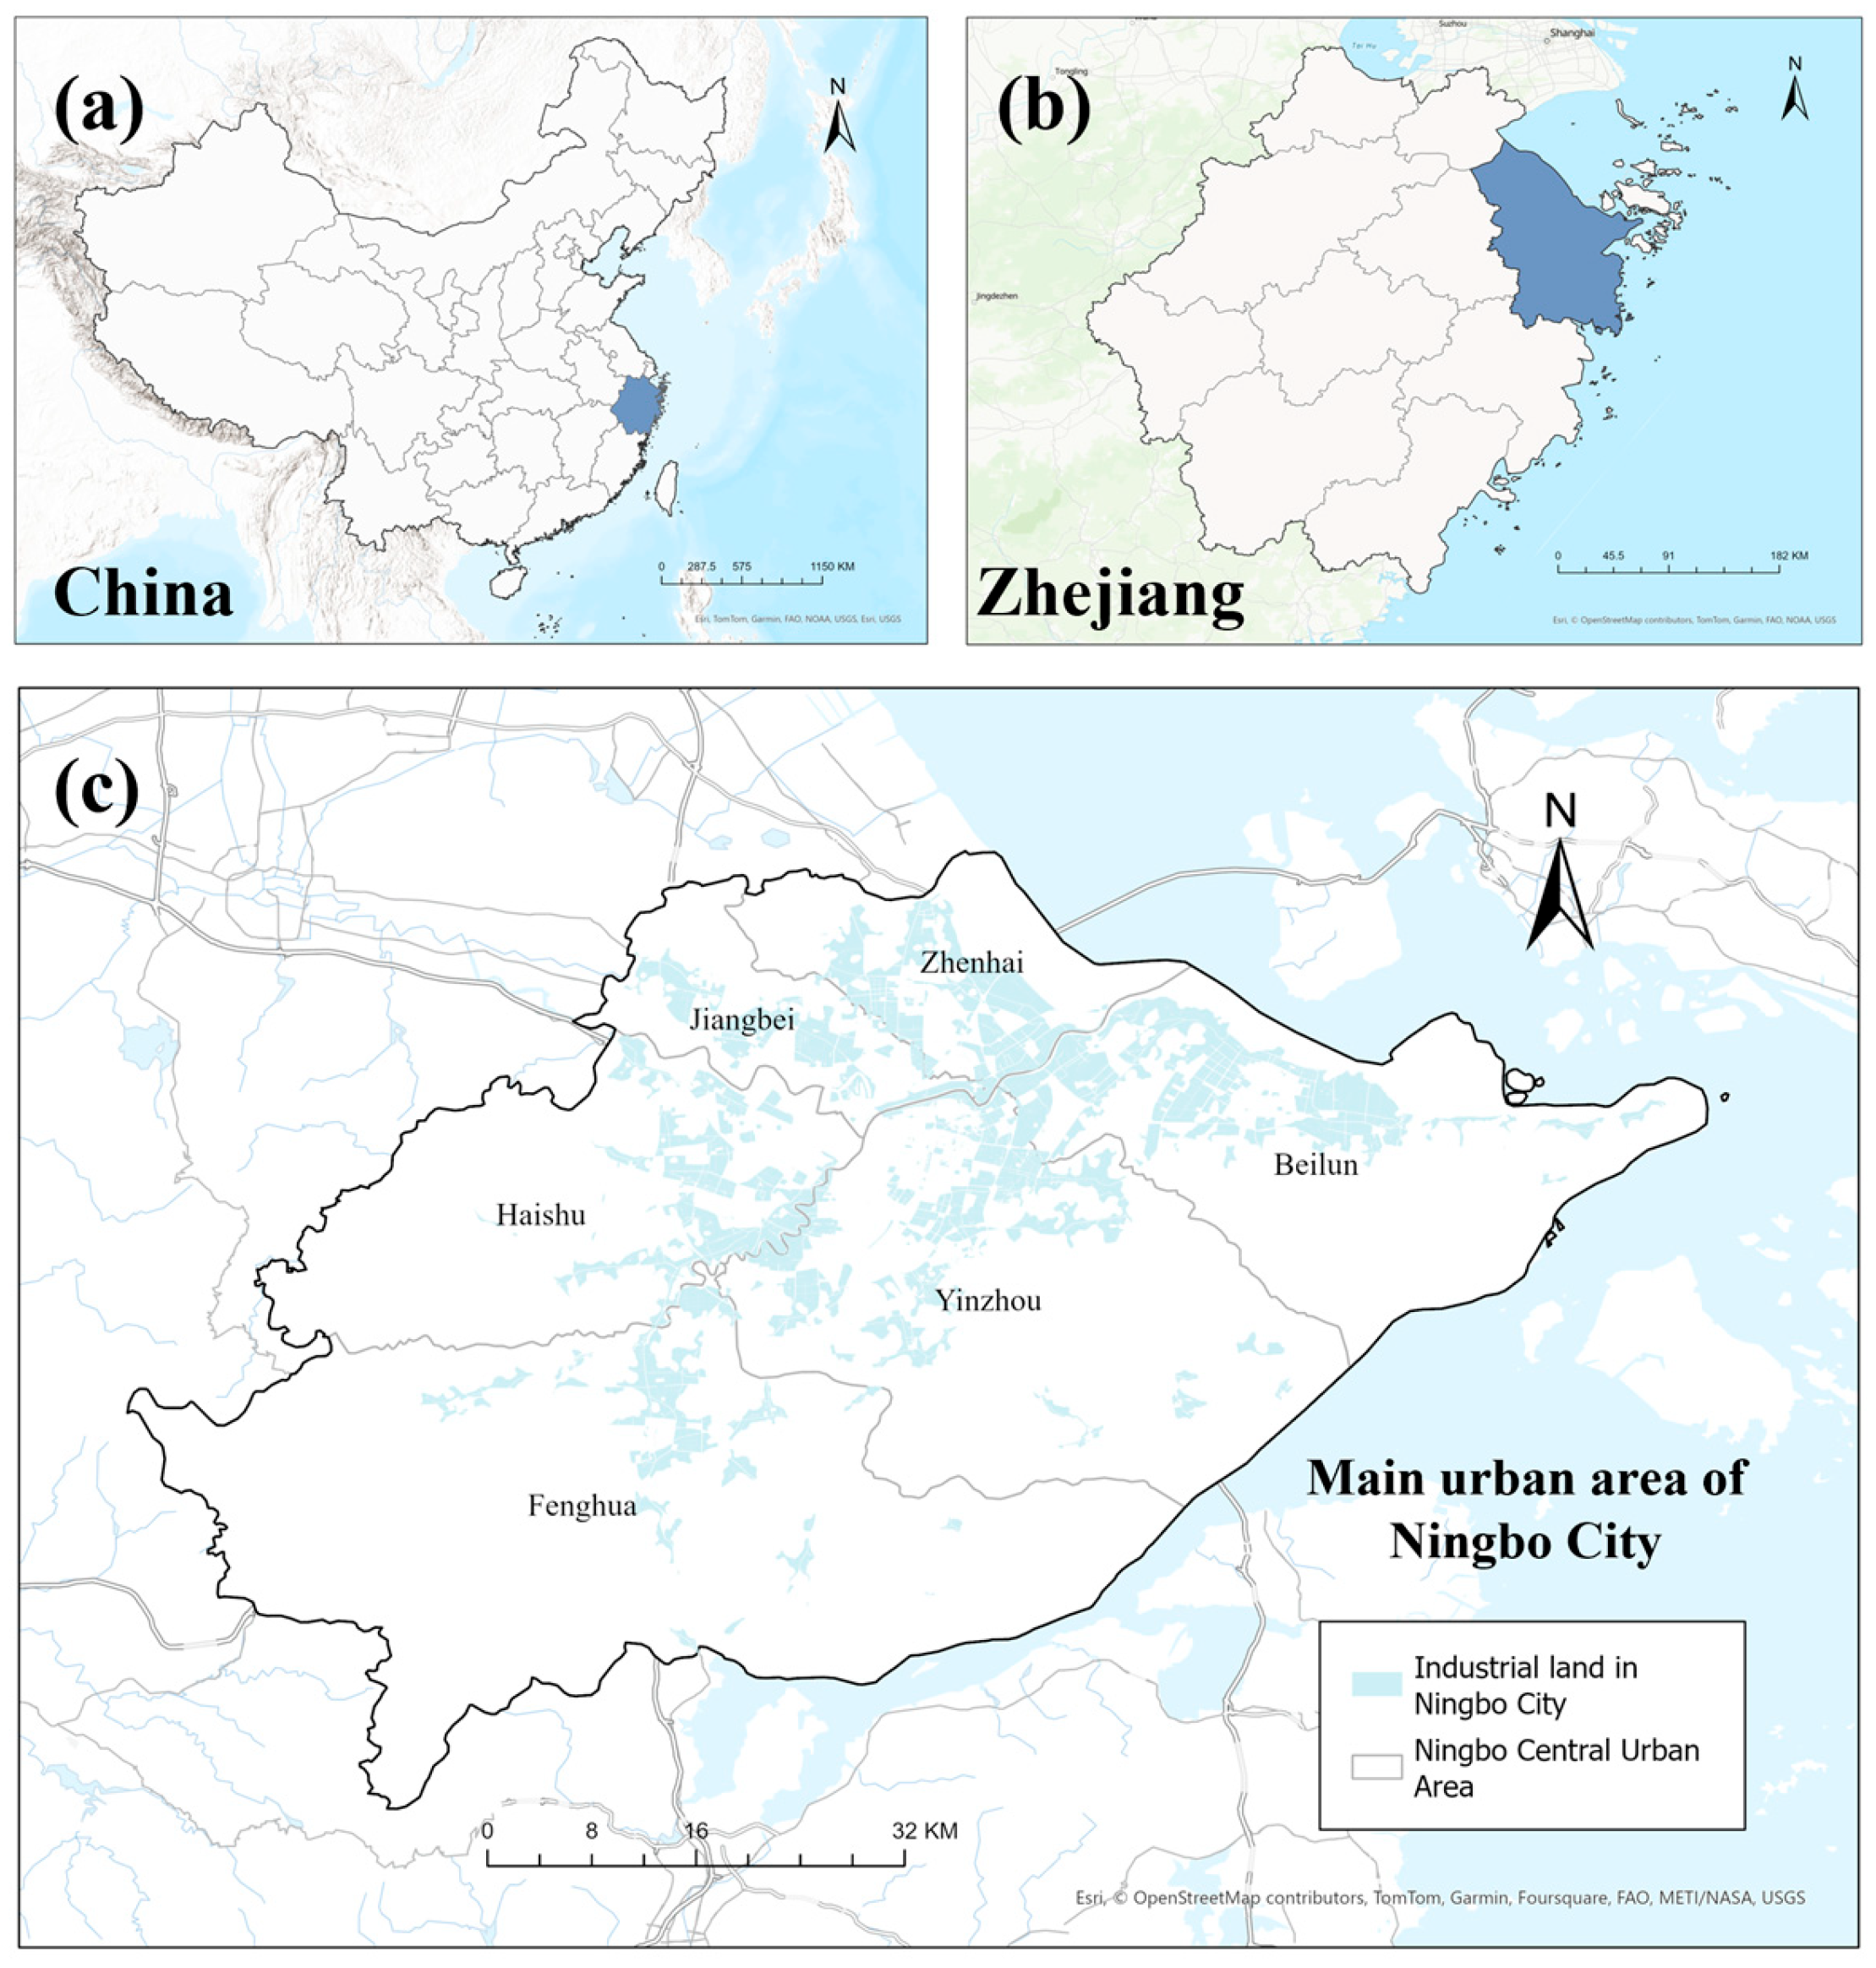
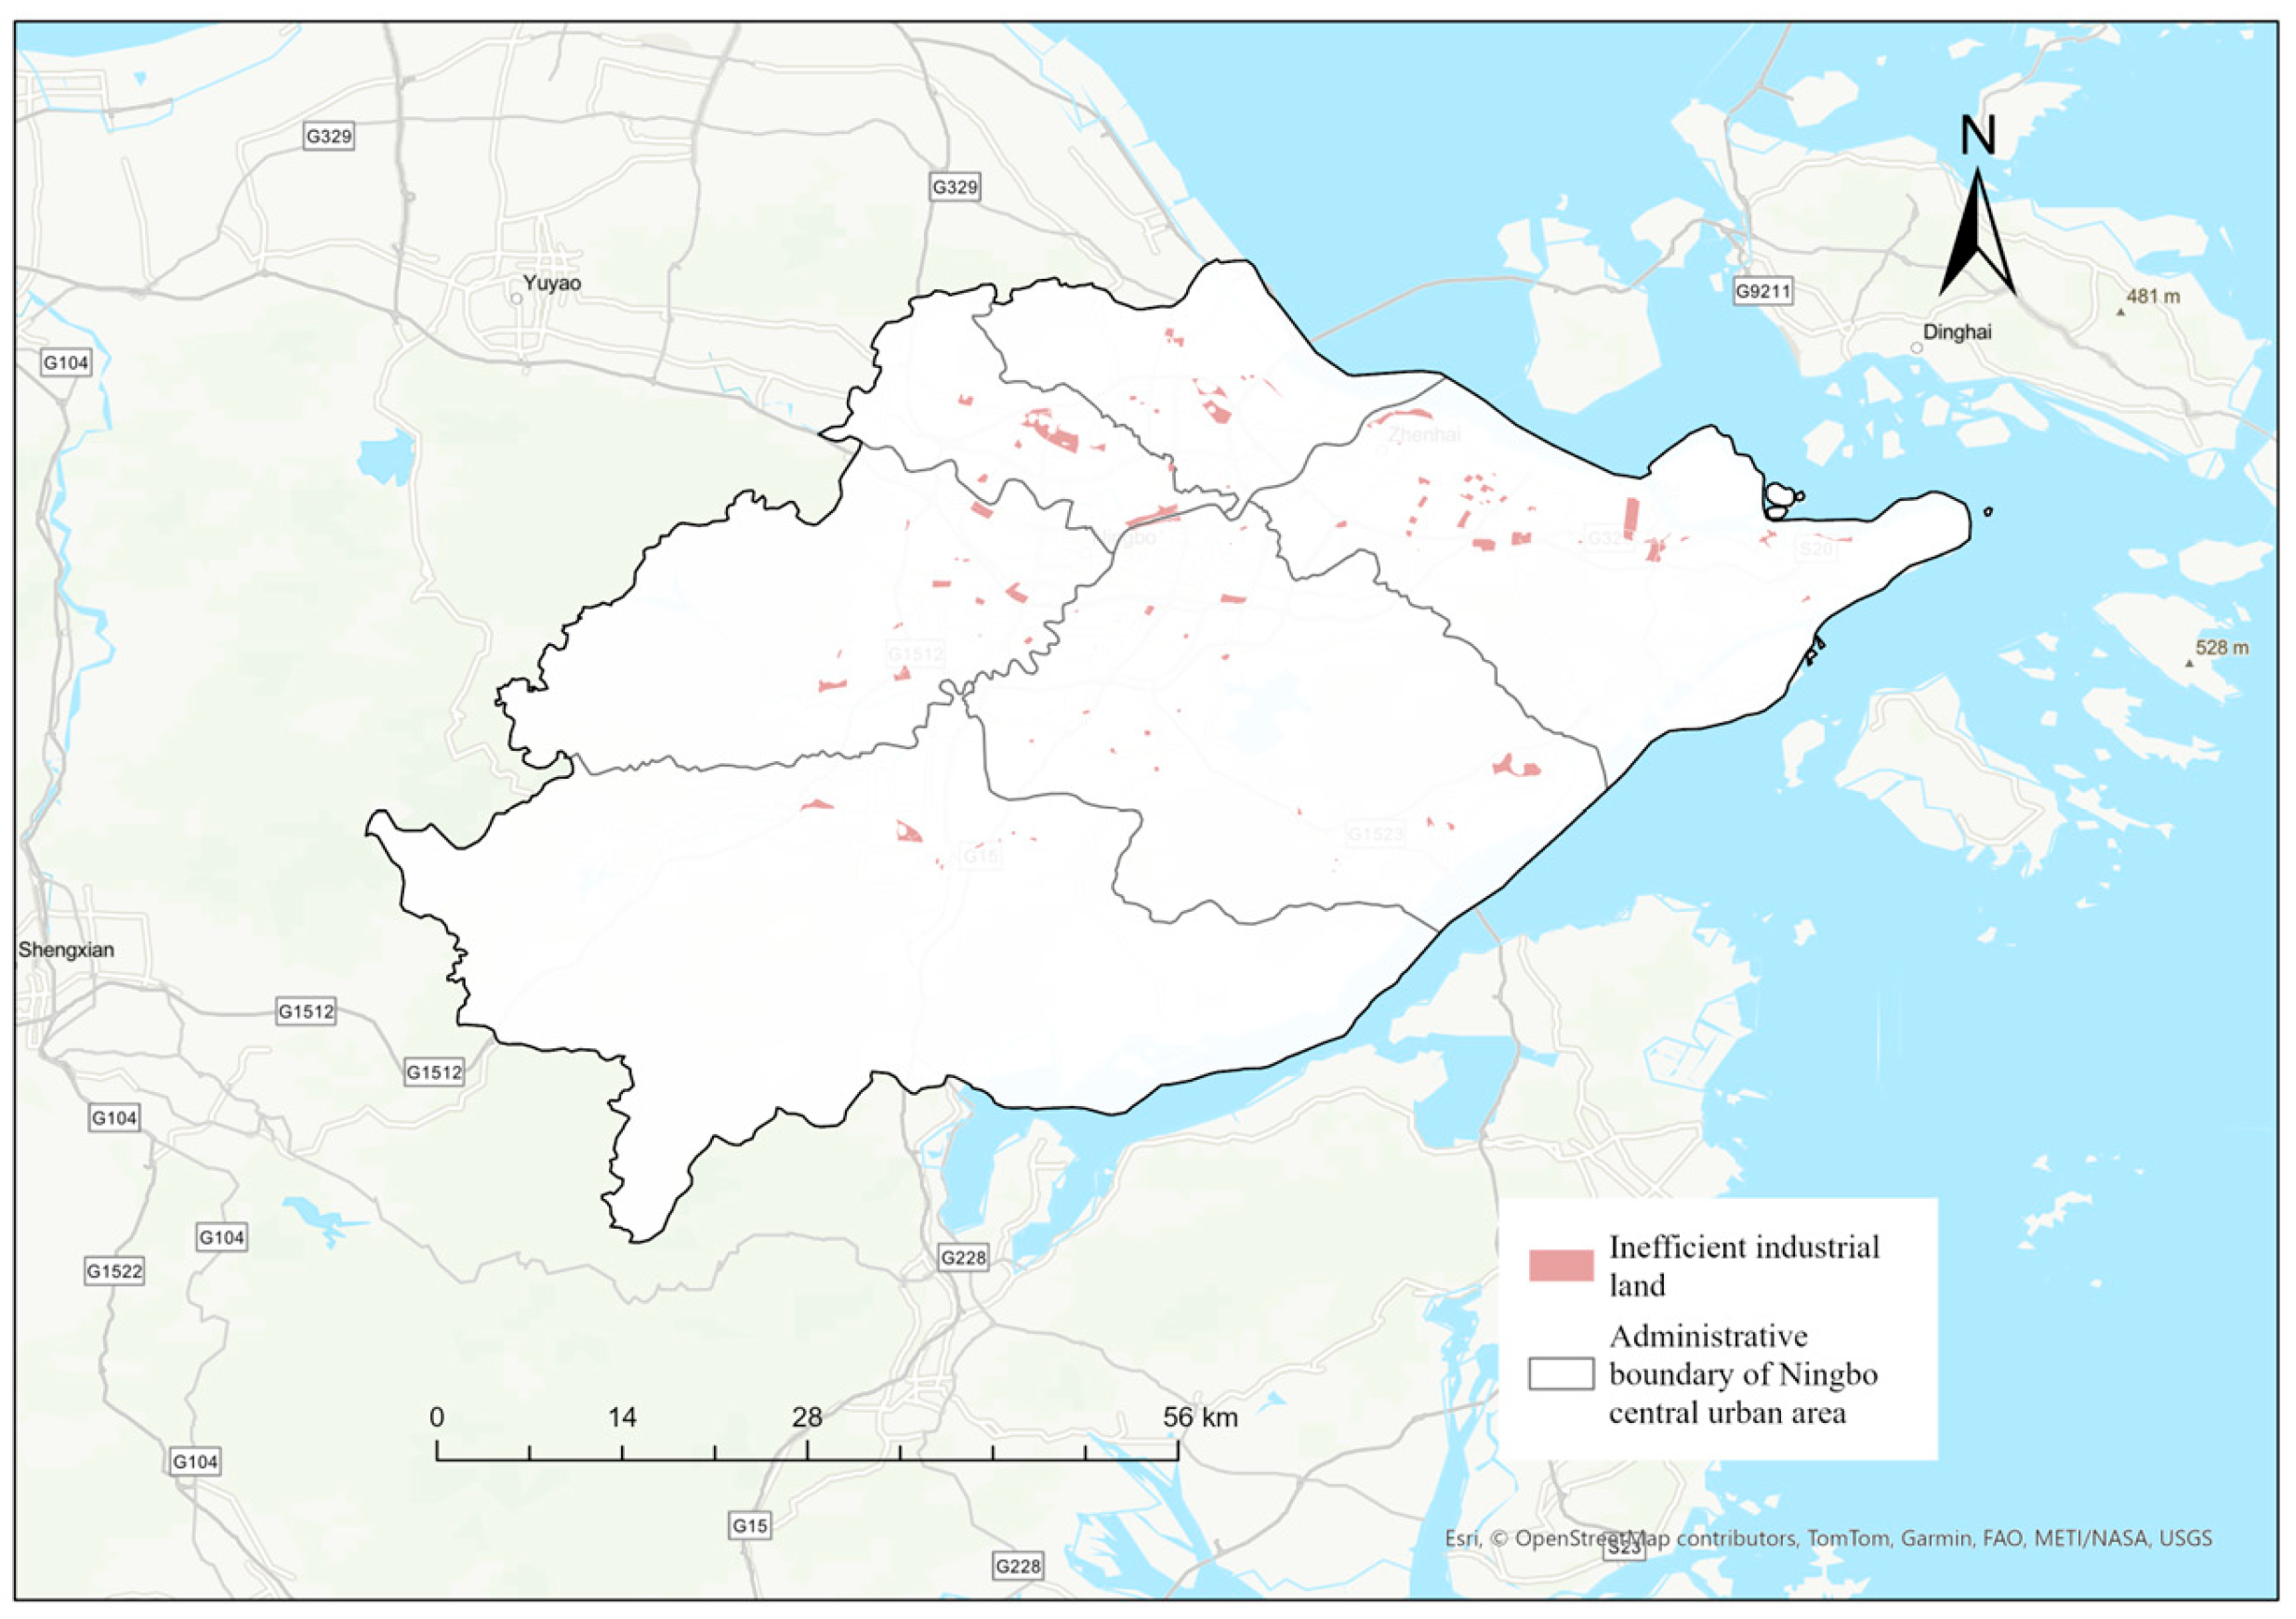
3.1. Study Area

This study selects Ningbo City, a significant foreign trade port city in China, as the case study to analyze the redevelopment priorities of IIL [41]. The research scope encompasses the six administrative districts within Ningbo’s central urban area of Haishu, Jiangbei, Beilun, Zhenhai, Yinzhou, and Fenghua (as shown in Figure 4b). To achieve its goal of becoming a global hub for smart manufacturing and innovation, accelerating industrial modernization and transformation has become an imperative for Ningbo [42]. However, the existing industrial land in the central urban area of Ningbo is insufficient to support the expansion and upgrading of industries. A large amount of IIL in urban areas presents a significant challenge to the city’s high-quality development. Therefore, it is essential to prioritize the redevelopment of IIL in Ningbo to ensure the timely availability of land resources to support industrial growth and modernization. Figure 4 illustrates the location of the research area and the spatial distribution of industrial land.

3.2. Data Sources

This study combines multiple data sources to identify and prioritize the redevelopment of IIL, including SVIs, enterprise big data, remote sensing images, government planning data, POIs, and the road network. The specific data sources are detailed in Table 3.
SVIs are photographs taken at eye-level, capturing various features of the built environment, which offer a visual representation of the urban landscape and extract relevant information, making them widely used in studies that examine the urban built environment [44]. The SVI data used in this study are divided into the following two categories:
(1) Street view imagery of buildings on IIL, which was used to detect abandoned buildings and then identify IIL. In this study, we first screened enterprises located on plots with poor economic performance in the central urban area of Ningbo. Next, this study obtained the names of enterprises located on economically inefficient industrial land and downloaded static street view images from the corresponding photo albums using the Place Name Query API provided by Baidu Maps. After data cleaning, we selected the most representative street view image of corporate buildings for each plot to reflect its architectural condition. These images were used to assess the abandonment degree of buildings on economically inefficient industrial land. The assessment process and results are detailed in Section 4.1.2.
(2) Street view imagery of the surrounding environment of IIL, which was used to calculate the maturity of the surrounding environment by factors like sky view factor and greenery coverage ratio. First, this study selected street view sampling points from OpenStreetMap which are located at the intersection of IIL and roads in the central urban area of Ningbo City, or at points where plots are perpendicular to roads. Next, the coordinates of these points were converted to Baidu coordinates, and the Baidu Street View API was used to capture four images (0°, 90°, 180°, and 270°) at each point, representing the front, right, back, and left views. In this study, a total of 118 sampling points were selected in the central urban area of Ningbo and 472 effective street images were obtained.
After collecting SVIs around the plot, the SegFormer model pre-trained based on the Cityscapes dataset was used for semantic segmentation, and sky and vegetation areas were extracted to achieve indicators calculation. Cityscapes is a large-scale urban dataset with dense pixel annotations for 19 categories (97% coverage), 8 of which include instance-level segmentation [45]. SegFormer combines a hierarchical transformer encoder with a lightweight multi-layer perceptron decoder, significantly reducing computational complexity and parameter size while maintaining high performance [46]. On the Cityscapes dataset SegFormer achieved a mean intersection-over-union (mIoU) score of 84.0%. Figure 5 shows the semantic segmentation results for the surrounding environment of the selected plots. The model accurately segmented 19 environmental elements, such as vegetation, roads, buildings, and the sky. Based on the segmentation results, this study calculated the area ratio of the two key environmental elements, the sky and vegetation, and obtained two potential indicators: sky view factor and greenery coverage ratio. These two indicators are used to assess the maturity of the IIL’s surroundings.

4. Results

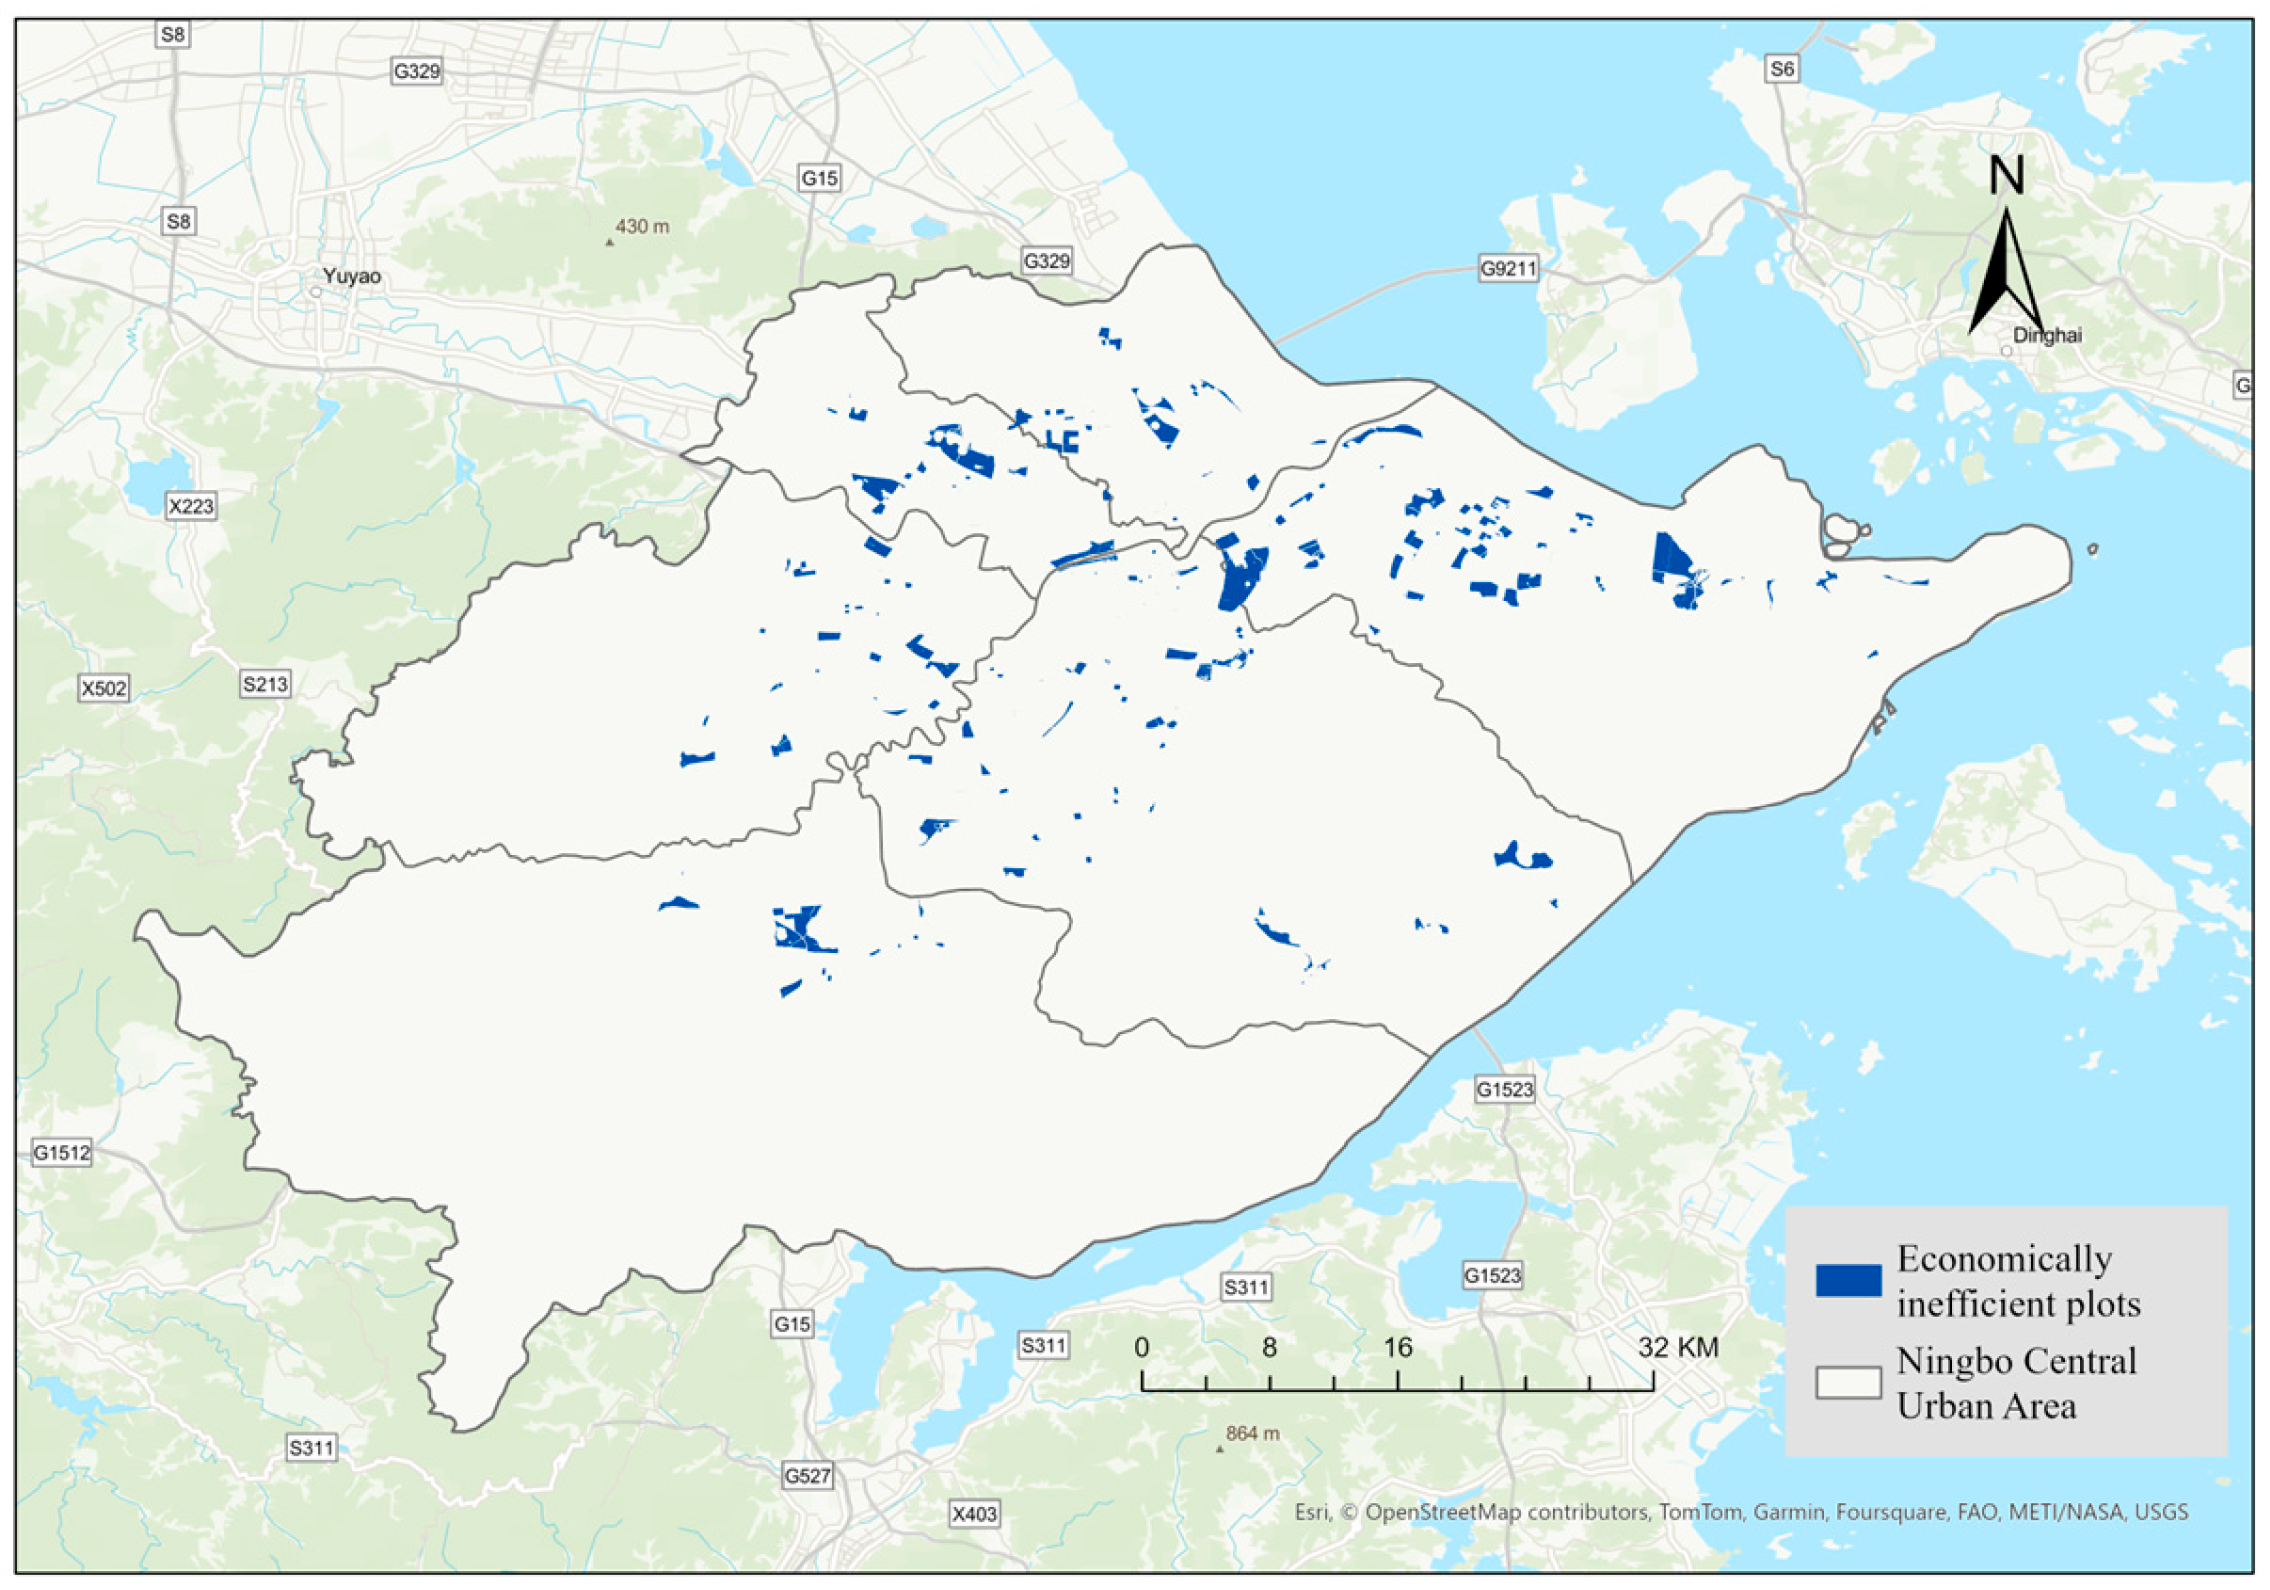
4.1. Identification Results of IIL in the Central Urban Area of Ningbo City

4.1.1. Identification Results of Economically IIL in the Central Urban Area of Ningbo City

This study obtained economic indicators from the Digital Economy Platform provided by the Ningbo Bureau of Economy and Information Technology, including per-mu tax revenue, per-mu value added, value added per unit of energy consumption, value added per unit of emissions, overall labor productivity, and R&D expenses to operating revenue. These indicators were normalized and weighted to produce a comprehensive evaluation score for each enterprise. The enterprises were ranked within their respective industry sectors based on their comprehensive scores, and the results were classified into four categories (A, B, C, and D). This study defines that enterprises with grades ‘A’ or ‘B’ have high economic efficiency, while enterprises with grades ‘C’ or ‘D’ need to be redeveloped to improve land-use efficiency. Therefore, a total of 250 pieces of industrial land with low economic efficiency were identified in the central area of Ningbo City, as shown in Figure 6.

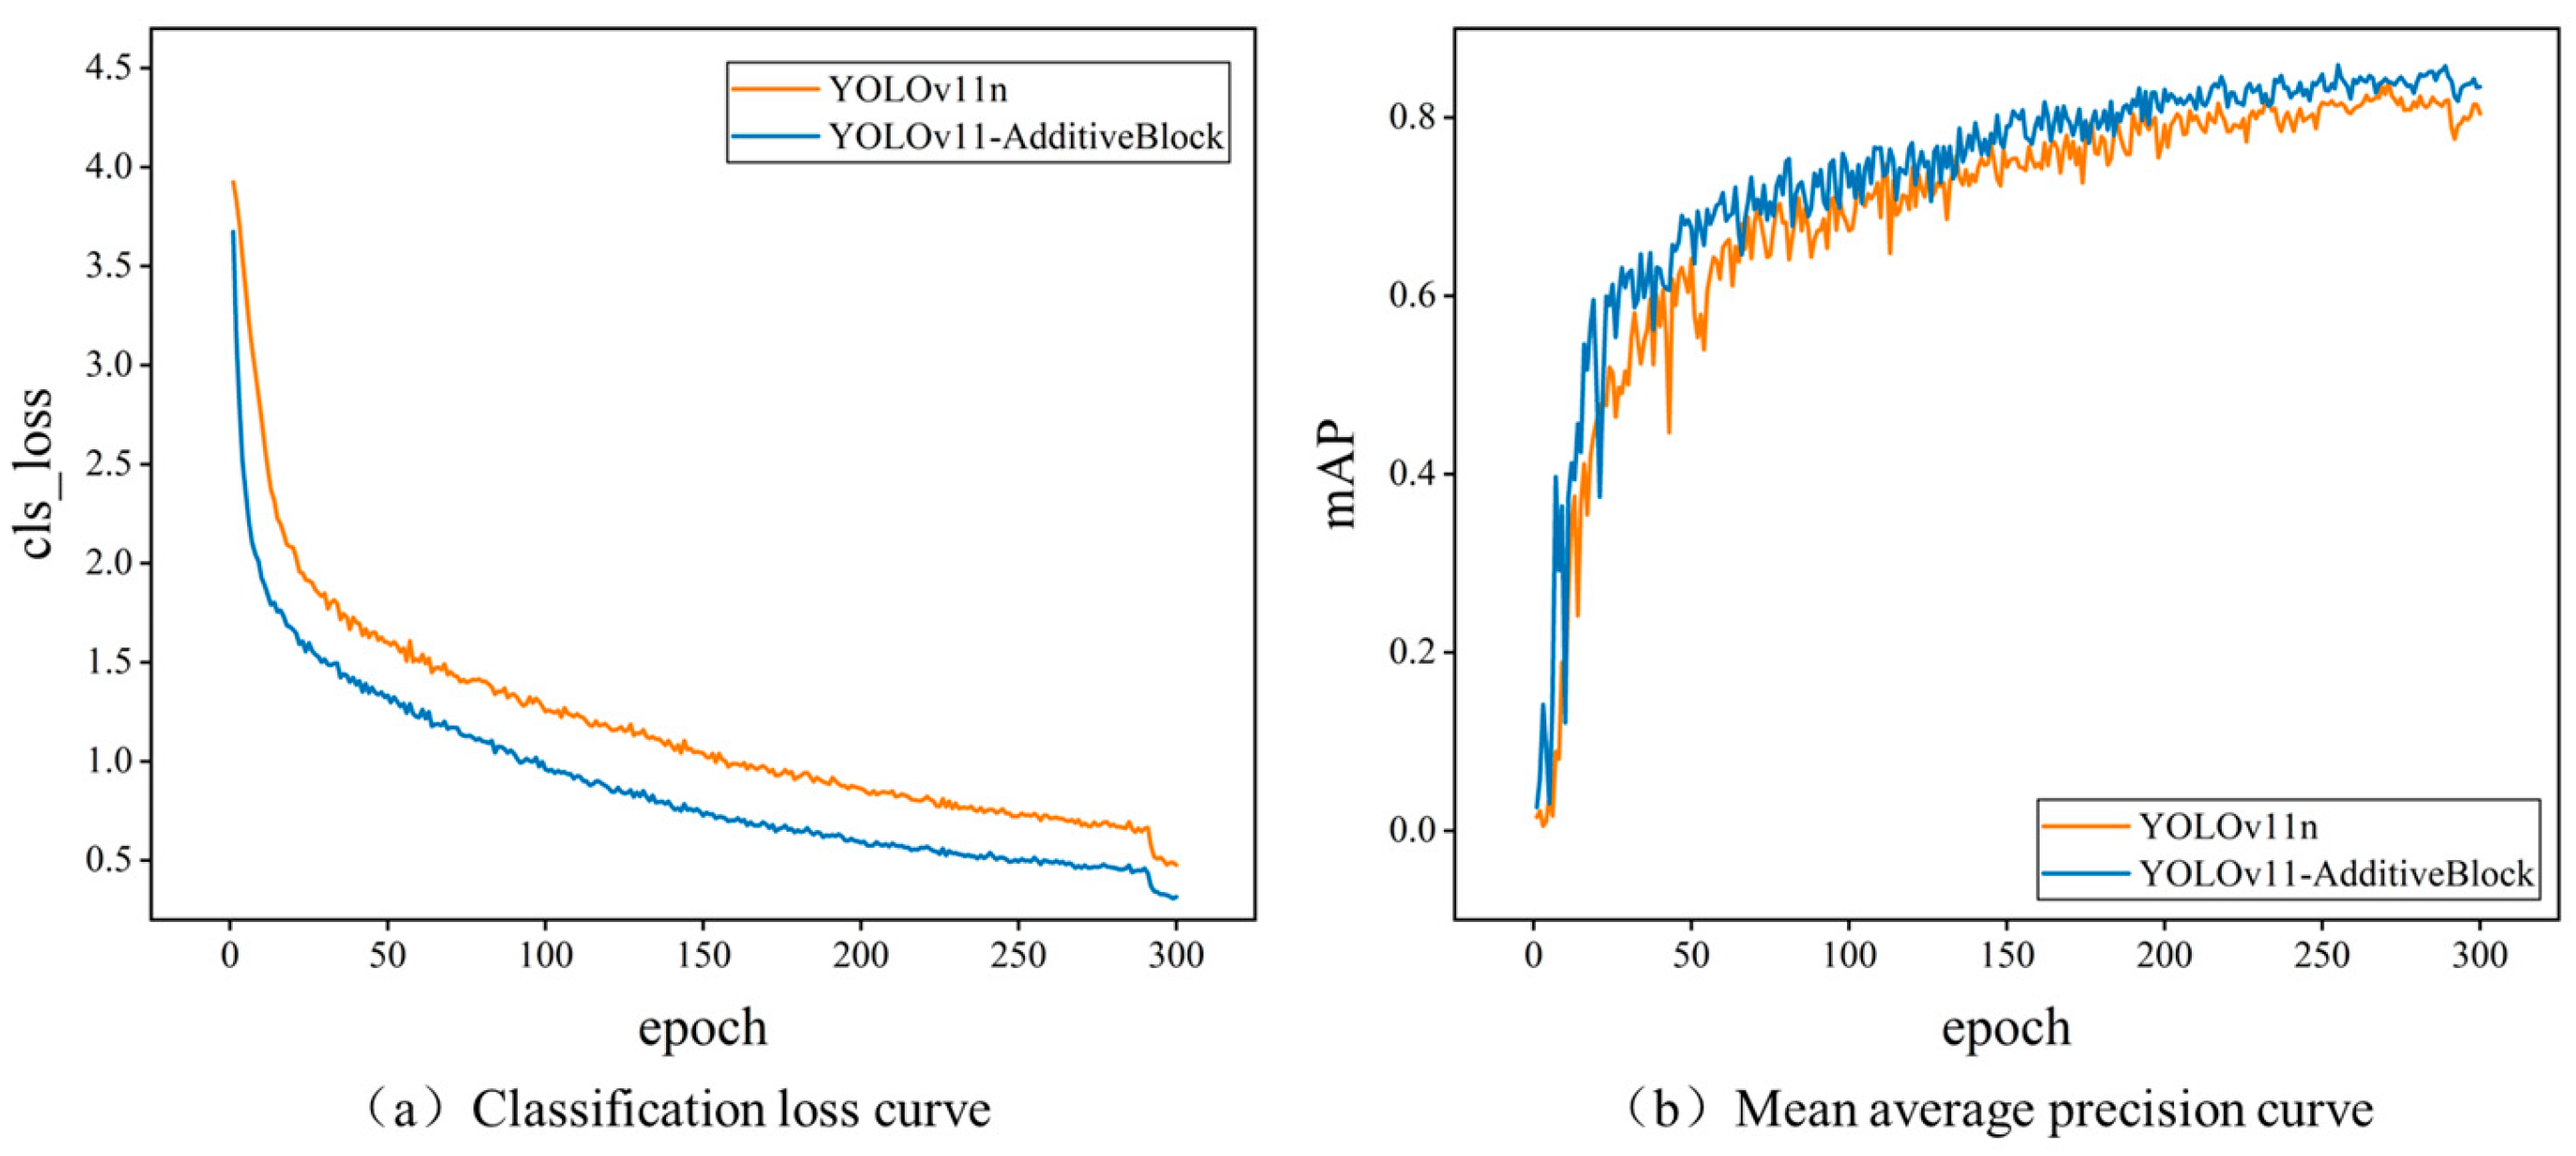
4.1.2. Training and Verification of Abandoned Building Identification Model

Based on the street view image building dataset established in Section 2.1.2, this study trained an abandoned building identification model using an improved YOLOv11, enabling its application in the future target detection of buildings in SVIs of economically inefficient industrial land. During the pre-processing stage the input images were uniformly scaled to a resolution of 640 × 640 pixels to meet the model’s input tensor dimension requirements. The experimental platform operated on the Windows 11 operating system and utilized an NVIDIA GeForce RTX 4060 GPU (8 GB video memory) for hardware acceleration, with CUDA 12.2 parallel computing architecture and the cuDNN acceleration library. The model was optimized using the Stochastic Gradient Descent (SGD) algorithm, with an initial learning rate set to 0.01. The training process lasted for 300 epochs, and the batch size was set to 16 to accommodate the GPU’s video memory capacity. Additionally, a data caching mechanism (cache = True) was enabled to enhance data loading efficiency. To avoid potential compatibility issues with multi-threaded data loading in Windows, the study set workers = 0 to disable multi-process acceleration. An independent test set containing 146 street view images was used to evaluate the model’s performance in terms of precision, recall, and mAP, as shown in Table 3. As indicated in Table 4, the total mAP of the abandoned building identification model reached 80.1%, demonstrating that the model achieved high classification accuracy in identifying buildings within street view images.

4.1.3. Identification Results of IIL Based on Abandoned Building Identification Model

As stated in Section 4.1.1, this study identified a total of 250 economically inefficient industrial land plots. SVIs corresponding to these plots were downloaded from the Baidu Maps platform. After data cleaning, 200 street view images of economically inefficient enterprises were retained. Then, this study used the trained abandoned building identification model in Section 4.1.2 to identify abandoned buildings on SVIs corresponding to economically inefficient industrial land. If the SVIs identified “abandoned buildings” then the plot corresponding to them will be classify as IIL, which happened for a total of 68 IIL plots. Some of the identification results are shown in Figure 7. In the result visualization the bounding boxes indicate the localization results of buildings detected by the model. The text above each box denotes the predicted object category (either ‘abandoned buildings’ or ‘normal buildings’), and the numerical value represents the confidence score of the detection (i.e., the probability that the model assigns to the object within the bounding box belonging to the predicted category).
This study selected a specific enterprise located in Ningbo City as a case for verification. Street view images of the surrounding area were obtained via the Baidu Street View platform, as illustrated in Figure 8 below. As can be observed from the figure the surrounding environment of this plot is suboptimal, and the buildings exhibit significant signs of aging. This aligns with the results generated by the abandoned building identification model proposed in this study, which classified the building status as “abandoned” with a confidence level of 0.9. This further validates the efficacy of the model in identifying abandoned buildings.
The remaining 50 enterprises whose street view images were not collected were found to be generally small in scale or have low social influence after investigation. Therefore, these 50 plots were directly classified as IIL requiring redevelopment. Ultimately, 118 inefficient industrial land plots were identified in Ningbo’s central urban area. The final recognition results are shown in Figure 9.

4.2. Redevelopment Prioritization Results of IIL in the Central Urban Area of Ningbo City

4.2.1. Redevelopment Potential Evaluation Results of IIL

Based on the index system of redevelopment potential constructed in Section 2.2.1, the framework employs the PSO-PP model to calculate the optimal projection values of 118 IIL plots in four dimensions, respectively, including the necessity, maturity, and urgency of redevelopment as well as the comprehensive potential of redevelopment. These optimal projection values represent the redevelopment potential of IIL, where higher values indicate greater redevelopment potential and lower values correspond to weaker potential.
From Figure 10a, it can be seen that the total proportion of plots with high and medium necessity for redevelopment reaches 84.7%, illustrating that most IIL has poor economic efficiency or low development intensity and therefore requires redevelopment. Figure 10b shows that there are fewer plots with low redevelopment maturity, and these plots are mainly located at the edge of the urban area so the redevelopment of these plots should pay attention to the construction of surrounding traffic and supporting facilities. Figure 10c shows that the number of plots with high urgency for redevelopment is relatively small, which indicates that the inefficiency of most industrial land in Ningbo’s central urban area is not due to serious environmental pollution or outdated technology. From Figure 10d, the redevelopment potential of IIL shows obvious spatial characteristics. IIL plots with medium or high redevelopment potential are mostly distributed in core areas, while IIL with low redevelopment potential are most located in fringe areas.
To promote efficient allocation of limited funds and activate higher land values with as few inputs as possible, it is necessary to determine redevelopment priorities according to different comprehensive redevelopment potentials to achieve orderly urban development.

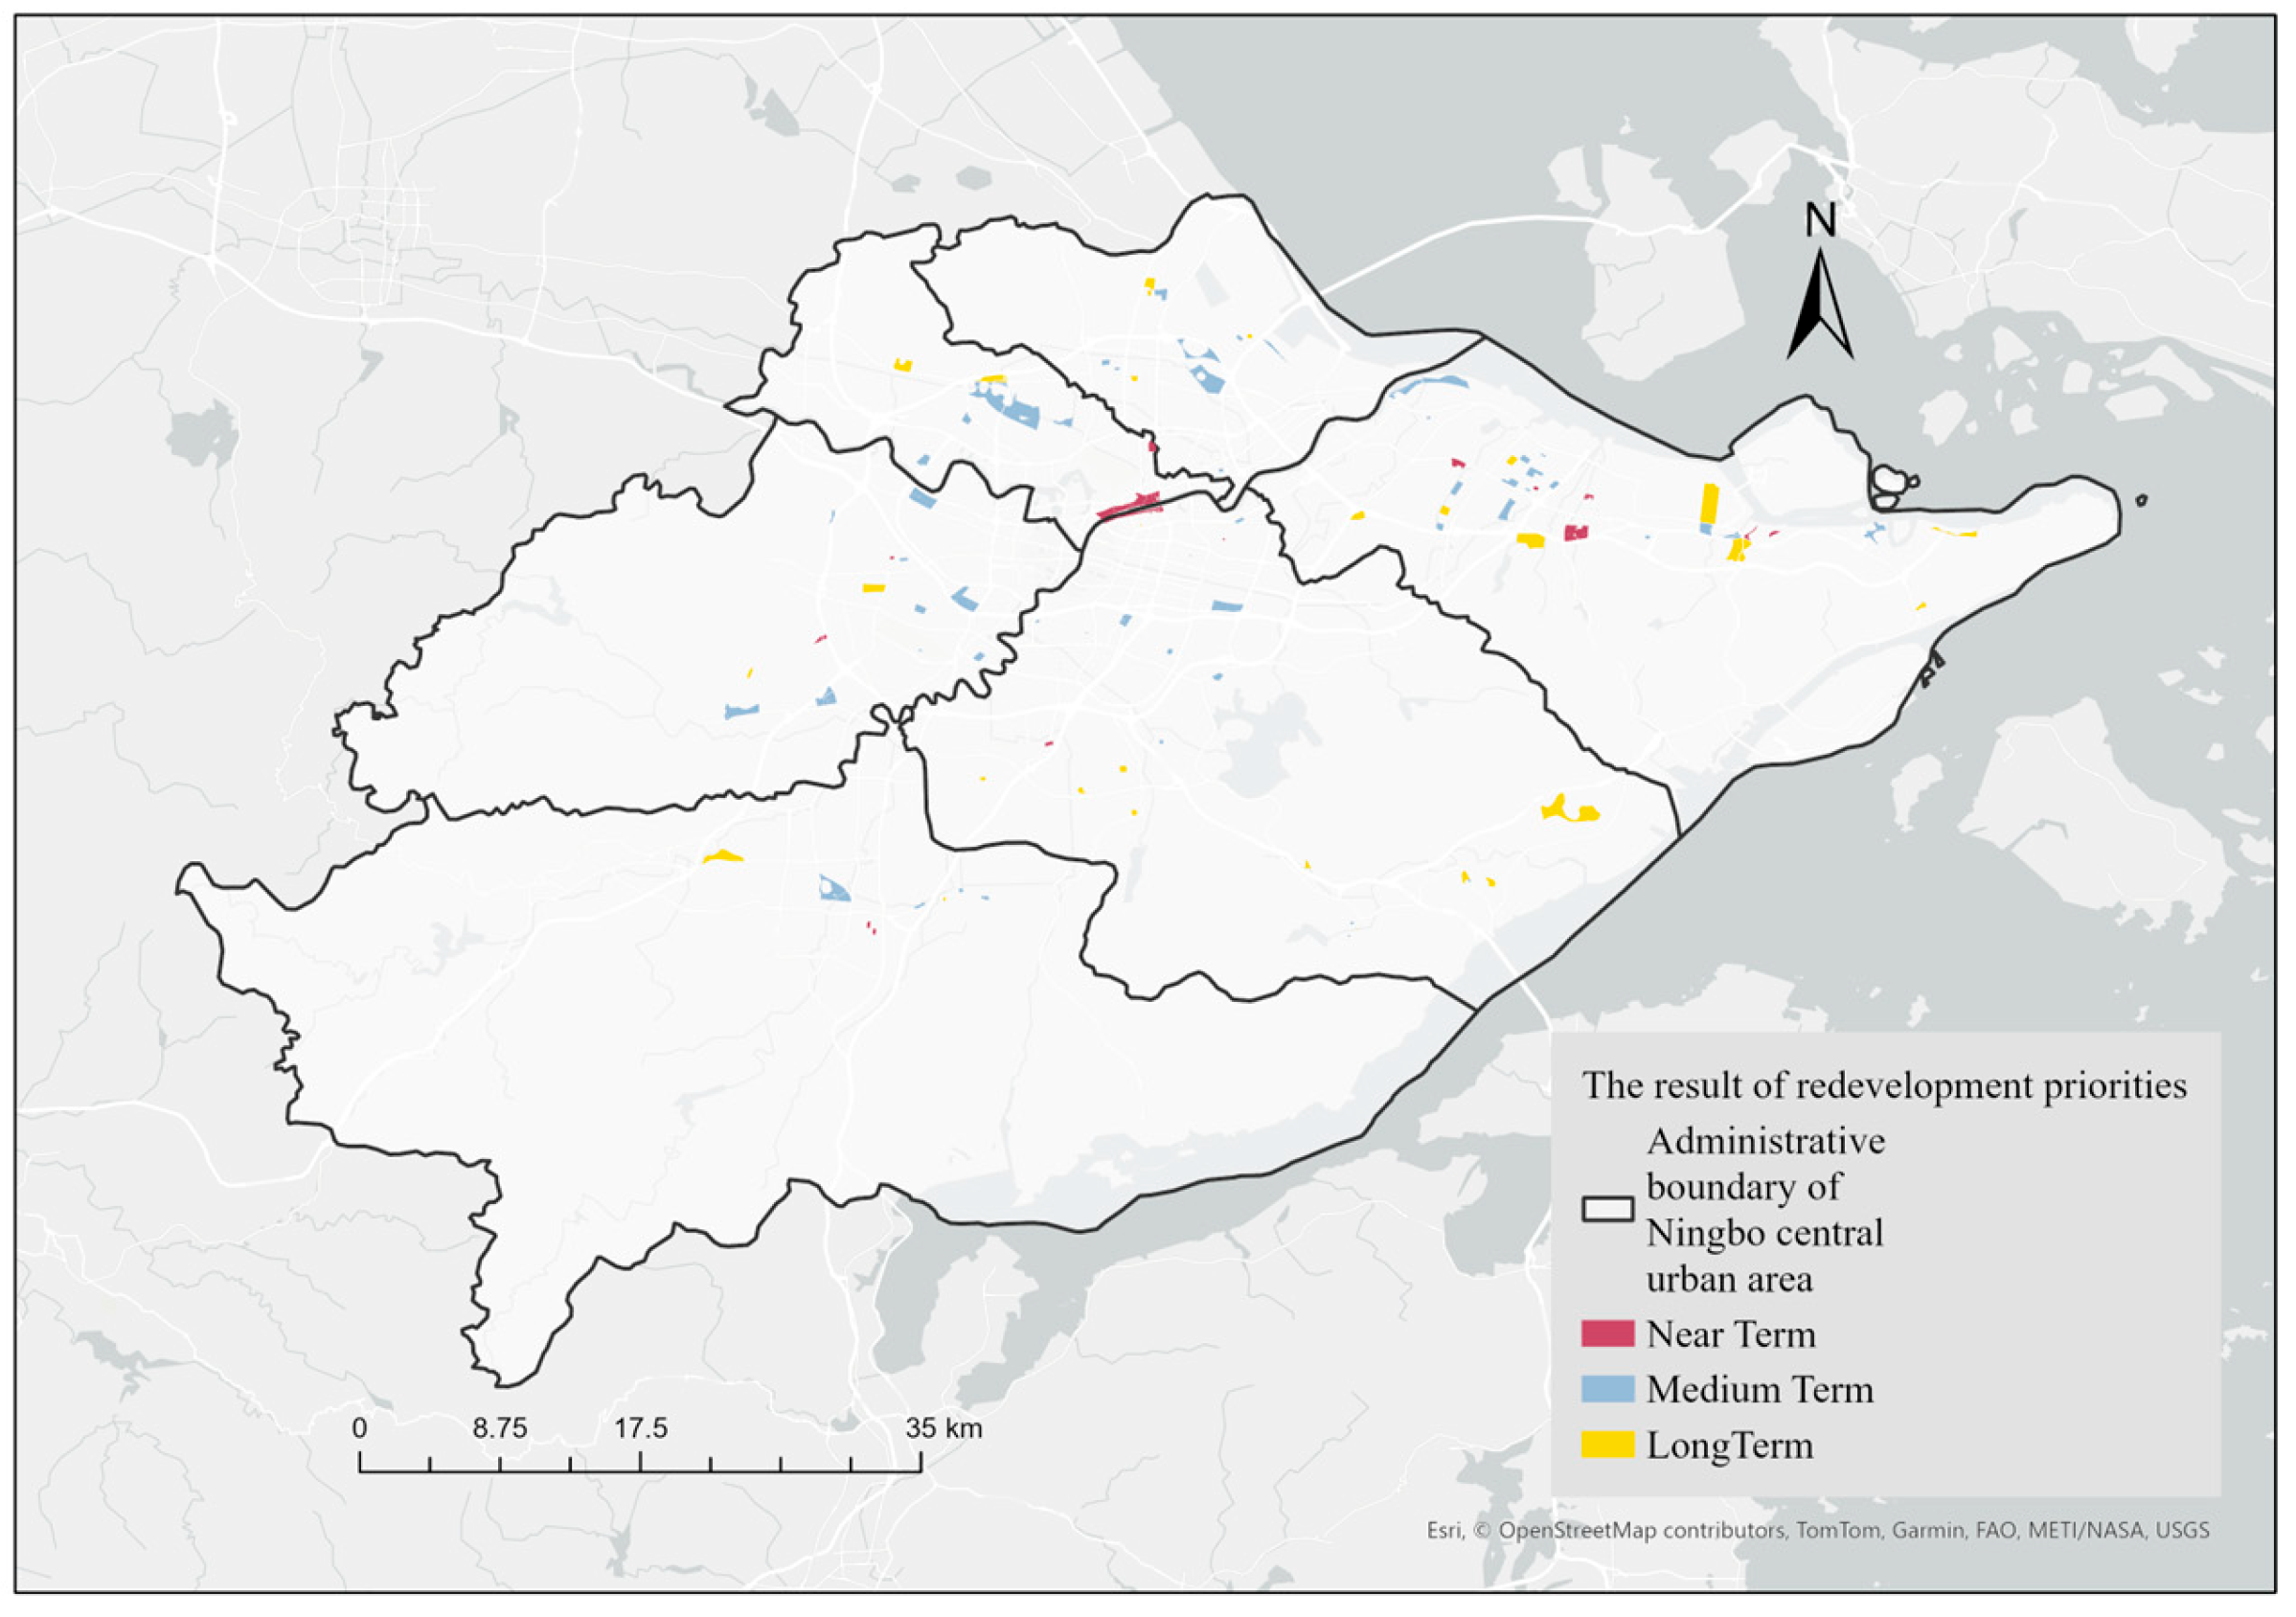
4.2.2. Redevelopment Priority Determination Results of IIL

According to the comprehensive potential of redevelopment, we divide the priority of each plot into three stages through the natural breakpoint method, labelling them as either near-term, medium-term, and long-term. Furthermore, combining the results of dimensional evaluation can help provide decision-making suggestions for development methods. Figure 11 below shows the results for the priority of IIL redevelopment.
In the near-term a total of 20 IIL plots are scheduled for redevelopment. These plots are mainly located in the Jiangbei and Beilun districts, which are in the core development location of the Yongjiang Science and Technology Innovation Zone. The strategic positioning of the Yongjiang Science and Technology Innovation Zone as a key science and technology innovation highland in Ningbo further confirms the scientific and realistic fit of the prioritization in this study. Prioritizing the redevelopment of these plots can fully leverage their locational advantages and industrial foundation, establishing integrated industry–city demonstration zones.
In the medium-term a total of 66 IIL plots are scheduled for redevelopment. These plots are scattered throughout the region, primarily along the Hangzhou Bay Cross-Sea Bridge corridor and adjacent industrial corridors. Their redevelopment should be gradually advanced based on near-term redevelopment efforts, in alignment with market demand and industrial upgrading trends.
In the long-term a total of 33 IIL plots are scheduled for redevelopment. These plots are scattered on the urban periphery, primarily in outer city areas. Due to current development constraints, redevelopment should be postponed until market demand, transportation conditions, and infrastructure are further improved. Additionally, as many peripheral areas fall within ecological protection zones redevelopment should balance ecological conservation with sustainable development goals. It is recommended to implement a gradual renewal approach for inefficient land in coordination with ecological restoration projects.

5. Discussion

5.1. Precision Comparison of Abandoned Building Identification Models

In this study the improved YOLOv11 and the original YOLOv11n are compared on the self-built street view image building dataset, and the results are shown in the figure below. As can be seen from the classification loss curve in Figure 12a, the classification loss value of the improved YOLOv11-AdditiveBlock is significantly lower than that of the YOLOv11n, indicating that the improved model has a better fitting degree to the training data which helps to improve the model’s performance on the test set. Figure 12b shows the mAP of validation set. It can be seen that the mAP of the improved YOLOv11-AdditiveBlock is significantly higher than that of the YOLOv11n. This suggests that the improved model improves expressive and perceptual capabilities, resulting in superior detection performance.
The trained abandoned building identification model was used to predict the independent test set containing 146 street view images, and the detection performance of the model was evaluated by the following three indexes: precision, recall and mAP. A comparison of the detection accuracy of YOLOv11n and the improved YOLOv11-AdditiveBlock is shown in Table 5. The experimental results demonstrate that the improved YOLOv11-AdditiveBlock model outperforms the YOLOv11n model across multiple evaluation metrics. Precision increased by 8.9%, recall by 4.4%, and mAP by 5.6%. The enhanced model not only reduces the missed detection rate but also further improves detection accuracy, significantly optimizing its performance on the street view building dataset. Additionally, the data in the table shows that the total mAP of the abandoned building recognition model reaches 80.1%, indicating a high classification accuracy in street view building recognition tasks.

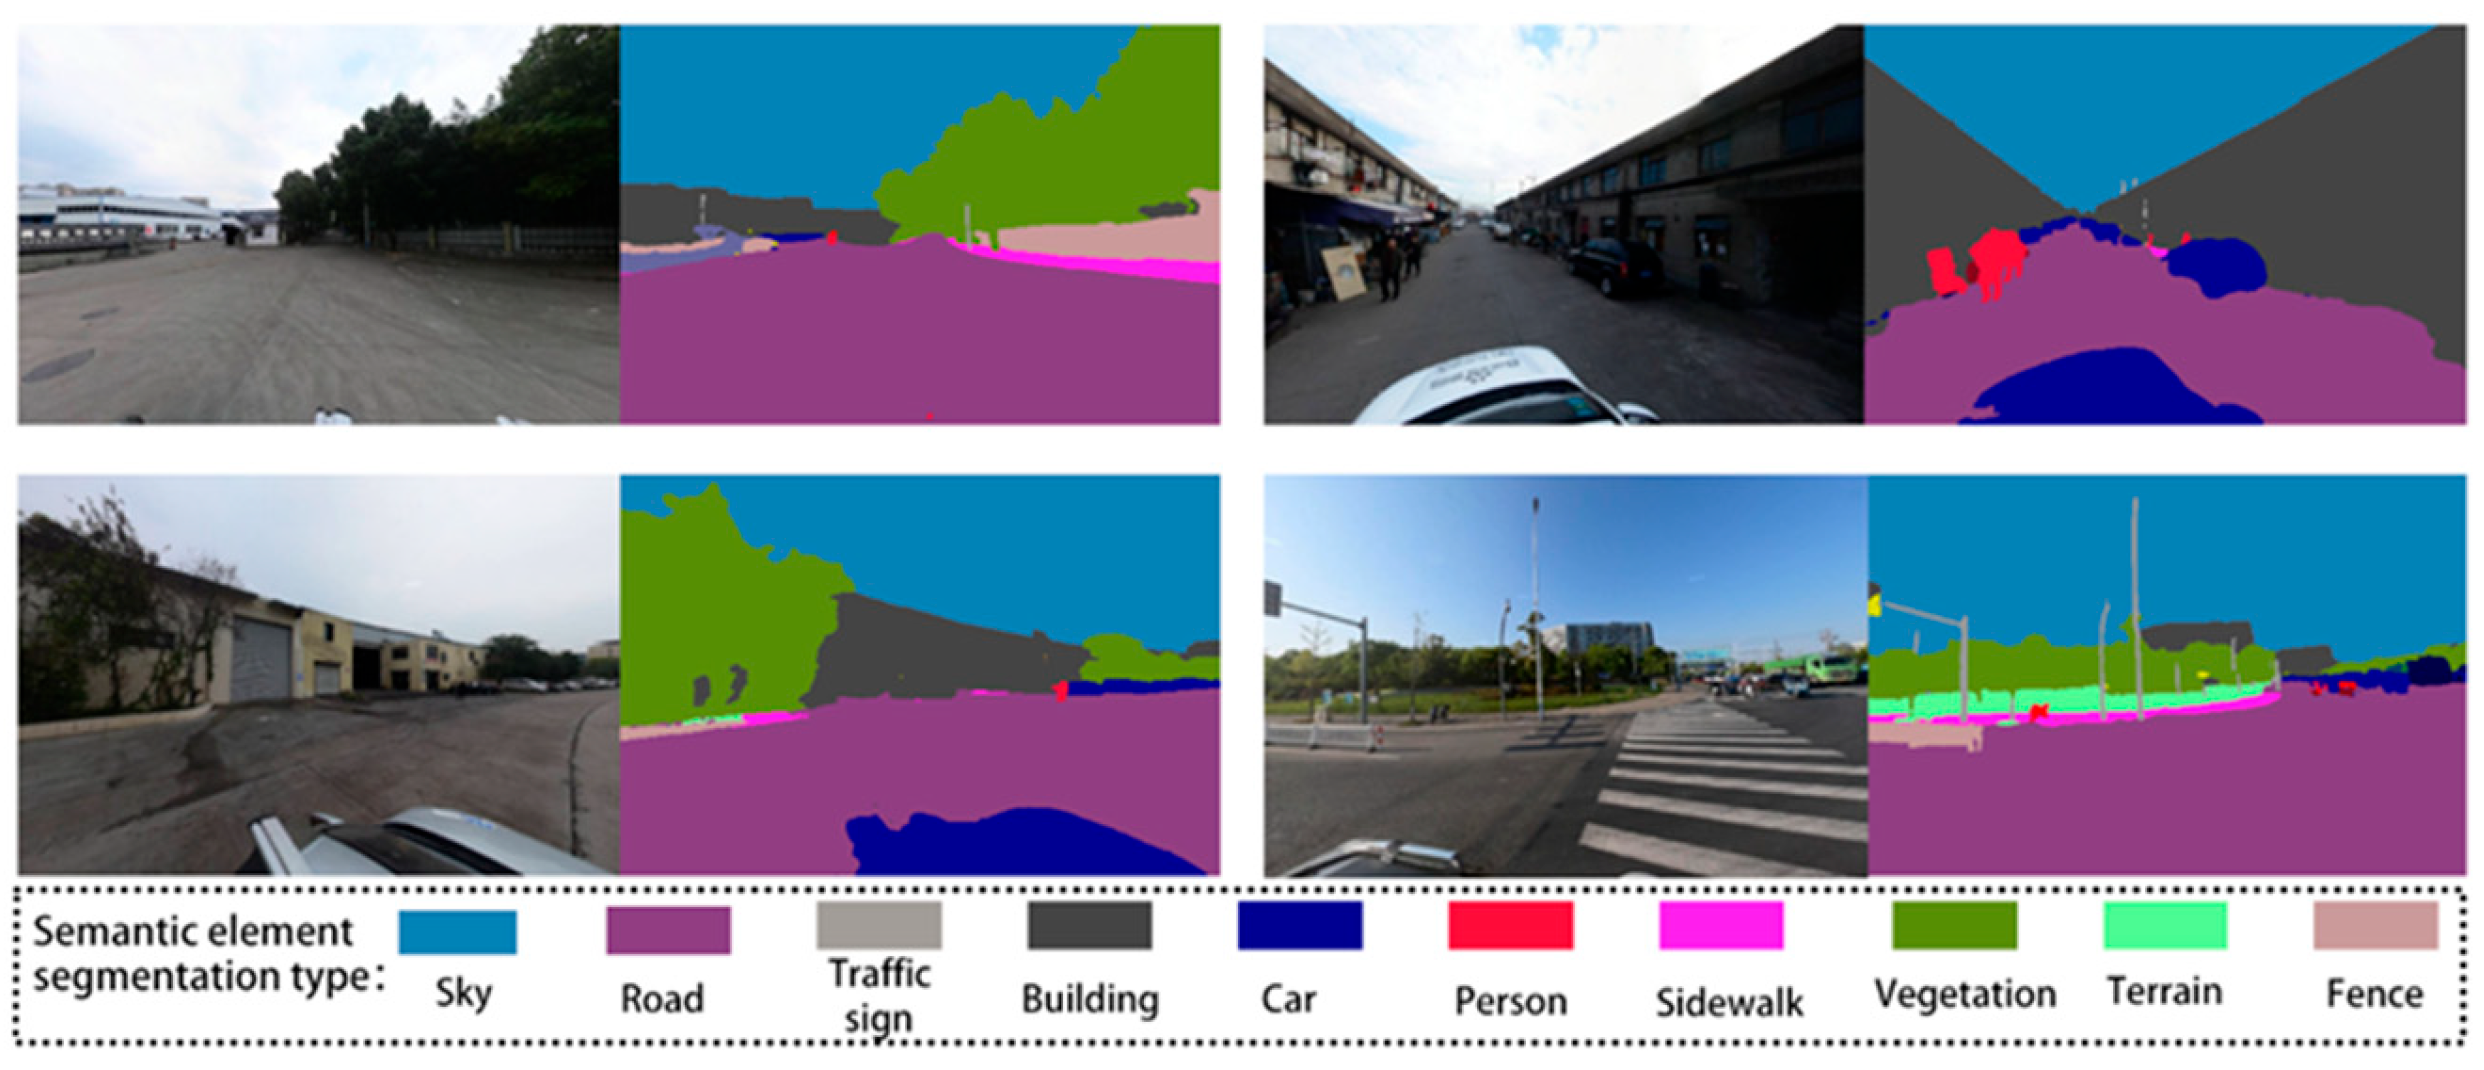
5.2. Effective Use of Street View Images

SVI data provide an essential and innovative foundation for the redevelopment prioritization of IIL. Unlike traditional field surveys, SVI enables large-scale, fine-grained identification of IIL plots through object detection techniques, achieving a level of spatial coverage and efficiency that on-site investigations cannot match. Furthermore, by applying semantic segmentation to SVI imagery, critical environmental indicators—such as sky view factor and greenery coverage—can be extracted to assess spatial openness and ecological conditions, thereby enriching the redevelopment potential index system.
Importantly, practical application has demonstrated that SVIs, when combined with computer vision techniques, achieve high identification accuracy, proving their reliability and effectiveness for IIL recognition. This not only reduces the time and cost associated with manual surveys but also provides robust technical support for urban land redevelopment.

5.3. Portability of the Framework

Traditional methods for evaluating IIL potential largely rely on expert experience, such as the Analytic Hierarchy Process, the Entropy Method, or the Comprehensive Evaluation Method. These methods are often tailored to specific regions or cases, making them highly personalized and less adaptable for broader use. This study introduces PSO-PP into the redevelopment prioritization framework to evaluate the redevelopment potential, thereby reducing the subjectivity and reliance on expert experience in prioritization and providing a more objective ranking methodology for the redevelopment of IIL plots in different regions.

5.4. Policy Impact and Space Utilization Suggestions

The redevelopment priority zones identified in this study provide a scientific basis for policy-making. Based on the results, we propose the following policy directions:
(1)
Funding prioritization for near-term redevelopment areas: For parcels classified by the model as “near-term redevelopment,” it is recommended that they be included in the scope of urban renewal special funds, accompanied by tax incentives to attract private investment.
(2)
Public–private partnership (PPP) guidance: For high-readiness sites, we suggest that the government lead infrastructure upgrades and introduce industrial operators through PPP models to develop “industrial–innovation” integrated zones.
(3)
Environmental regulation and industrial exit mechanisms: For polluted parcels identified under the “urgency” dimension we recommend enforcing compulsory relocation in line with the Key Environmental Supervision Entity List and prioritizing the introduction of green manufacturing or digital economy industries.

6. Conclusions

The identification of IIL and its orderly redevelopment contribute to alleviating land resource constraints in urban development and ensuring more efficient allocation of redevelopment funds. This study proposes a priority decision-making framework for the redevelopment of IIL and validates its effectiveness through a case study in the central urban area of Ningbo City. The main conclusions are as follows:
(1)
This study integrates street view imagery (SVI) with deep learning to identify IIL, improving both the accuracy and efficiency of the identification process. An abandoned building identification model based on an improved YOLOv11 architecture, trained on a self-constructed dataset (achieving a mAP of 80.1%) was applied to detect object-level features in economically inefficient plots. The results demonstrate the effectiveness and scalability of this image-based identification approach.
(2)
A redevelopment potential evaluation index system was established from the following three perspectives: necessity, maturity, and urgency. By incorporating SVI-derived indicators the model captures physical and environmental characteristics often overlooked in traditional evaluation systems. The use of the PSO-PP model further ensures an objective, data-driven evaluation process, reducing reliance on expert judgment and enabling adaptive prioritization.
(3)
Based on the comprehensive redevelopment potential scores, the identified IIL plots were categorized into the following three priority phases: near-term, medium-term, and long-term. This provides urban planners and public managers with a practical and systematic reference for phased redevelopment, enhancing the efficiency and orderliness of urban land revitalization.
Beyond methodological innovation, this study contributes to urban planning practice by offering a low-cost, scalable solution for the identification and prioritization of redevelopment projects. It also advances the theoretical integration of machine learning, computer vision, and land-use planning. Despite these contributions, the study has limitations. Due to the constraints of SVI data availability the analysis was limited to Ningbo’s central urban area, excluding peripheral counties and towns. Future research could address this by expanding SVI data collection, enabling a more comprehensive and citywide redevelopment timeline for inefficient industrial land.

Author Contributions

Conceptualization, Y.Y. and Q.Y.; methodology, Y.Y.; software, Q.Y. and C.Z.; validation, Y.G., Z.H. and L.L.; formal analysis, Q.Y. and C.Z.; investigation, Q.Y.; data curation, Y.G. and C.Z.; writing—original draft preparation, C.Z. and Q.Y.; writing—review and editing, Y.Y. and Q.Y.; visualization, Z.H. and L.L. All authors have read and agreed to the published version of the manuscript.

Funding

This research was funded by the National Natural Science Foundation of China (No. 42471445, 42171260).

Data Availability Statement

Data can be provided when needed.

Conflicts of Interest

Yu Guo is employed by Zhejiang Space-Time Sophon Big Data Co., Ltd. The authors declare no conflicts of interest.

References

  1. Feng, X.; Xu, M.; Li, J.; Gao, Z. Analysis of China’s Industrial Network Structure and Its Resilience from the Sectoral Perspective. Habitat Int. 2024, 153, 103192. [Google Scholar] [CrossRef]
  2. Wei, C.; Qiao, L.; Sun, Z.; Xue, Z. Can Industrial Structure Upgrading Restrain Industrial Land Expan- Sion? Evidence from China. Chin. Geogr. Sci. 2024, 34, 504–518. [Google Scholar]
  3. Tian, C.; Luan, W.; Wang, X.; Jin, X. Land price, government debt, and land-use efficiency in the coastal cities of China under the constraint of land scarcity. J. Environ. Manag. 2024, 371, 123144. [Google Scholar] [CrossRef] [PubMed]
  4. He, F.; Yi, Y.; Si, Y. Evolution Process of Urban Industrial Land Redevelopment in China: A Perspective of Original Land Users. Land 2024, 13, 548. [Google Scholar] [CrossRef]
  5. Han, Q.; Ke, G.Y. Analyzing the Financing Dilemma of Brownfield Remediation in China by Using GMCR. In Proceedings of the 2016 IEEE International Conference on Systems, Man, and Cybernetics (SMC), Budapest, Hungary, 9–12 October 2016; pp. 2431–2435. [Google Scholar]
  6. Zhang, H.; Liu, G.; Han, Q.; Chen, G. Mapping the Barriers of Utilizing Public Private Partnership into Brownfield Remediation Projects in the Public Land Ownership. Land 2023, 12, 73. [Google Scholar] [CrossRef]
  7. Pamuković, J.K.; Rogulj, K.; Jajac, N.; Mastelić-Ivić, S. Model of Priority Ranking of Cadastral Parcels for Planning the Implementation of Urban Consolidation. Land 2023, 12, 148. [Google Scholar] [CrossRef]
  8. Jin, R.; Huang, C.; Wang, P.; Ma, J.; Wan, Y. Identification of Inefficient Urban Land for Urban Regeneration Considering Land Use Differentiation. Land 2023, 12, 1957. [Google Scholar] [CrossRef]
  9. Wang, Z.; Chen, X.; Huang, N.; Yang, Y.; Wang, L.; Wang, Y. Spatial Identification and Redevelopment Evaluation of Brownfields in the Perspective of Urban Complex Ecosystems: A Case of Wuhu City, China. Int. J. Environ. Res. Public Health 2022, 19, 478. [Google Scholar] [CrossRef]
  10. Kurowska, A.; Nowogońska, B. Influence of the Decision to Select Renovated Elements in a Heritage Building on Further Stages of the Aging Process of the Building—A Case Study. Sustainability 2023, 15, 16926. [Google Scholar] [CrossRef]
  11. Yin, L.; Silverman, R.M. Housing Abandonment and Demolition: Exploring the Use of Micro-Level and Multi-Year Models. ISPRS Int. J. Geo-Inf. 2015, 4, 1184–1200. [Google Scholar] [CrossRef]
  12. Xu, F.; Jin, A.; Chen, X.; Li, G. New Data, Integrated Methods and Multiple Applications: A Review of Urban Studies Based on Street View Images. In Proceedings of the 2021 IEEE International Geoscience and Remote Sensing Symposium IGARSS, Brussels, Belgium, 11–16 July 2021; pp. 6532–6535. [Google Scholar]
  13. Roussel, R.; Jacoby, S.; Asadipour, A. Robust Building Identification from Street Views Using Deep Convolutional Neural Networks. Buildings 2024, 14, 578. [Google Scholar] [CrossRef]
  14. Yang, Z.; Li, S.; Sun, D.; Li, C.; Wu, J. Intensive Evaluation and High-Quality Redevelopment of Enterprise Land Use: A Case Study in China. Land 2022, 11, 432. [Google Scholar] [CrossRef]
  15. Preston, P.D.; Dunk, R.M.; Smith, G.R.; Cavan, G. Not all brownfields are equal: A typological assessment reveals hidden green space in the city. Landsc. Urban Plan. 2023, 229, 104590. [Google Scholar] [CrossRef]
  16. Hammond, E.B.; Coulon, F.; Hallett, S.H.; Thomas, R.; Dick, A.; Hardy, D.; Dickens, M.; Washbourn, E.; Beriro, D.J. From data to decisions: Empowering brownfield redevelopment with a novel decision support system. J. Environ. Manag. 2023, 347, 119145. [Google Scholar] [CrossRef]
  17. Teng, J.K. Research on Benefit Measurement of Urban Inefficient Land Redevelopment Based on Smart Growth Theory. Master’s Thesis, Shandong Jianzhu University, Jinan, China, 2024. [Google Scholar]
  18. Cheng, F.; Geertman, S.; Kuffer, M.; Zhan, Q. An integrative methodology to improve brownfield redevelopment planning in Chinese cities: A case study of Futian, Shenzhen. Comput. Environ. Urban Syst. 2011, 35, 388–398. [Google Scholar] [CrossRef]
  19. Pan, W.; Du, J. Towards Sustainable Urban Transition: A Critical Review of Strategies and Policies of Urban Village Renewal in Shenzhen, China. Land Use Policy 2021, 111, 105744. [Google Scholar] [CrossRef]
  20. He, J.; Zhang, J.; Yao, Y.; Li, X. Extracting Human Perceptions from Street View Images for Better Assessing Urban Renewal Potential. Cities 2023, 134, 104189. [Google Scholar] [CrossRef]
  21. Jian, H.; Hao, H.; Haidan, J.; Haize, P.; Chuan, L. Brownfield Redevelopment Evaluation Based on Structure-Process-Outcome Theory and Continuous Ordered Weighted Averaging Operator-Topology Method. Sci. Rep. 2023, 13, 17530. [Google Scholar] [CrossRef]
  22. Wang, K.; Xu, F. Slope Stability Evaluation Based on PSO-PP. Appl. Mech. Mater. 2014, 580–583, 486–489. [Google Scholar] [CrossRef]
  23. Liu, D.; Zhang, G.; Li, H.; Fu, Q.; Li, M.; Faiz, M.A.; Ali, S.; Li, T.; Imran Khan, M. Projection Pursuit Evaluation Model of a Regional Surface Water Environment Based on an Ameliorative Moth-Flame Optimization Algorithm. Ecol. Indic. 2019, 107, 105674. [Google Scholar] [CrossRef]
  24. Xu, D.; Liu, D.; Liu, D.; Fu, Q.; Huang, Y.; Li, M.; Li, T. New Method for Diagnosing Resilience of Agricultural Soil-Water Resource Composite System: Projection Pursuit Model Modified by Sparrow Search Algorithm. J. Hydrol. 2022, 610, 127814. [Google Scholar] [CrossRef]
  25. Perschewski, J.-O.; Schmidt, J.; Stober, S. Pursuing the Perfect Projection: A Projection Pursuit Framework for Deep Learning. In Advances in Self-Organizing Maps, Learning Vector Quantization, Interpretable Machine Learning, and Beyond; Villmann, T., Kaden, M., Geweniger, T., Schleif, F.-M., Eds.; Springer: Cham, Switzerland, 2024; pp. 43–52. [Google Scholar]
  26. Han, Z.; Long, Y.; Wang, X.; Hou, J. Urban Redevelopment at the Block Level: Methodology and Its Application to All Chinese Cities. Environ. Plan. B Urban Anal. City Sci. 2019, 47, 1725–1744. [Google Scholar] [CrossRef]
  27. Foley, T.; Wolf, A.M.; Jackson, C.; Stephenson, R. Development of a Brownfield Inventory for Prioritizing Funding Outreach in Tucson, Arizona. Geospat. Inf. Sci. 2021, 24, 742–754. [Google Scholar] [CrossRef]
  28. Greenaway-McGrevy, R.; Pacheco, G.; Sorensen, K. The Effect of Upzoning on House Prices and Redevelopment Premiums in Auckland, New Zealand. Urban Stud. 2021, 58, 959–976. [Google Scholar] [CrossRef]
  29. Wedding, G.C.; Crawford-Brown, D. Measuring Site-Level Success in Brownfield Redevelopments: A Focus on Sustainability and Green Building. J. Environ. Manag. 2007, 85, 483–495. [Google Scholar] [CrossRef]
  30. Hussain, M. YOLO-v1 to YOLO-v8, the Rise of YOLO and Its Complementary Nature toward Digital Manufacturing and Industrial Defect Detection. Machines 2023, 11, 677. [Google Scholar] [CrossRef]
  31. Cheng, S.; Han, Y.; Wang, Z.; Liu, S.; Yang, B.; Li, J. An Underwater Object Recognition System Based on Improved YOLOv11. Electronics 2025, 14, 201. [Google Scholar] [CrossRef]
  32. Zou, C.; Yu, S.; Yu, Y.; Gu, H.; Xu, X. Side-Scan Sonar Small Objects Detection Based on Improved YOLOv11. J. Mar. Sci. Eng. 2025, 13, 162. [Google Scholar] [CrossRef]
  33. Zhang, T.; Li, L.; Zhou, Y.; Liu, W.; Qian, C.; Hwang, J.N.; Ji, X. Cas-ViT: Convolutional Additive Self-Attention Vision Transformers for Efficient Mobile Applications. arXiv 2024, arXiv:2408.03703. [Google Scholar]
  34. Tian, Z.; Yang, F.; Yang, L.; Wu, Y.; Chen, J.; Qian, P. An Optimized YOLOv11 Framework for the Efficient Multi-Category Defect Detection of Concrete Surface. Sensors 2025, 25, 1291. [Google Scholar] [CrossRef]
  35. Liu, Y.; Zhu, A.-X.; Wang, J.; Li, W.; Hu, G.; Hu, Y. Land-Use Decision Support in Brownfield Redevelopment for Urban Renewal Based on Crowdsourced Data and a Presence-and-Background Learning (PBL) Method. Land Use Policy 2019, 88, 104188. [Google Scholar] [CrossRef]
  36. Hou, D.; Al-Tabbaa, A.; Chen, H.; Mamic, I. Factor Analysis and Structural Equation Modelling of Sustainable Behaviour in Contaminated Land Remediation. J. Clean. Prod. 2014, 84, 439–449. [Google Scholar] [CrossRef]
  37. Szabó, M.; Bozsoki, F. Redevelopment of Brownfields for Cultural Use from ERDF Fund—The Case of Hungary between 2014 and 2020. J. Risk Financ. Manag. 2022, 15, 181. [Google Scholar] [CrossRef]
  38. Turečková, K.; Nevima, J.; Duda, D.; Tuleja, P. Latent Structures of Brownfield Regeneration: A Case Study of Regions of the Czech Republic. J. Clean. Prod. 2021, 311, 127478. [Google Scholar] [CrossRef]
  39. Ahmad, N.; Zhu, Y.; Ibrahim, M.; Waqas, M.; Waheed, A. Development of a Standard Brownfield Definition, Guidelines, and Evaluation Index System for Brownfield Redevelopment in Developing Countries: The Case of Pakistan. Sustainability 2018, 10, 4347. [Google Scholar] [CrossRef]
  40. Shami, T.M.; El-Saleh, A.A.; Alswaitti, M.; Al-Tashi, Q.; Summakieh, M.A.; Mirjalili, S. Particle Swarm Optimization: A Comprehensive Survey. IEEE Access 2022, 10, 10031–10061. [Google Scholar] [CrossRef]
  41. Zeng, S.; Fang, Z.; He, Y.; Huang, L. An Integrated Entropy-COPRAS Framework for Ningbo-Zhoushan Port Logistics Development from the Perspective of Dual Circulation. Systems 2022, 10, 131. [Google Scholar] [CrossRef]
  42. Fang, Y.; Yu, H.; Chen, Y.; Fu, X. Spatial Distribution Characteristics and Influencing Factors of the Retail Industry in Ningbo City in Eastern China Based on POI Data. Sustainability 2024, 16, 7525. [Google Scholar] [CrossRef]
  43. Che, Y.; Li, X.; Liu, X.; Wang, Y.; Liao, W.; Zheng, X.; Zhang, X.; Xu, X.; Shi, Q.; Zhu, J.; et al. 3D-GloBFP: The First Global Three-Dimensional Building Footprint Dataset. Earth Syst. Sci. Data Discuss. 2024, 16, 5357–5374. [Google Scholar] [CrossRef]
  44. Hu, W.; Zhang, Y.; Liang, Y.; Yin, Y.; Georgescu, A.; Tran, A.; Kruppa, H.; Ng, S.K.; Zimmermann, R. Beyond Geo-Localization: Fine-Grained Orientation of Street-View Images by Cross-View Matching with Satellite Imagery. In Proceedings of the 30th ACM International Conference on Multimedia (MM ’22), Lisbon, Portugal, 10 October 2022; ACM: New York, NY, USA, 2022; pp. 6155–6164. [Google Scholar]
  45. Cordts, M.; Omran, M.; Ramos, S.; Rehfeld, T.; Enzweiler, M.; Benenson, R.; Franke, U.; Roth, S.; Schiele, B. The Cityscapes Dataset for Semantic Urban Scene Understanding. In Proceedings of the IEEE Conference on Computer Vision and Pattern Recognition (CVPR), Las Vegas, NV, USA, 27–30 June 2016; IEEE: New York, NY, USA, 2016; pp. 3213–3223. [Google Scholar]
  46. Xie, E.; Wang, W.; Yu, Z.; Anandkumar, A.; Alvarez, J.M.; Luo, P. SegFormer: Simple and Efficient Design for Semantic Segmentation with Transformers. Adv. Neural Inf. Process. Syst. 2021, 34, 12077–12090. [Google Scholar]
Figure 1. IIL identification and redevelopment priority framework of this study.
Land 14 01254 g001
Figure 2. AdditiveBlock module architecture.
Land 14 01254 g002
Figure 3. The structure of YOLOv11-AdditiveBlock.
Land 14 01254 g003
Figure 4. Location of study area: (a) geographic location in China; (b) geographic location in Zhejiang Province; and (c) spatial distribution of industrial land in the central urban area of Ningbo City.
Land 14 01254 g004
Figure 5. Results of semantic segmentation of some plots’ surroundings.
Land 14 01254 g005
Figure 6. Spatial distribution of economically inefficient industrial land.
Land 14 01254 g006
Figure 7. Identification results of abandoned buildings in some plots.
Land 14 01254 g007
Figure 8. Street view images around the case enterprise.
Land 14 01254 g008
Figure 9. Spatial distribution of IIL in central urban area of Ningbo City.
Land 14 01254 g009
Figure 10. (ad) Results of the evaluation of redevelopment potential.
Land 14 01254 g010
Figure 11. Priority results for redevelopment of IIL.
Land 14 01254 g011
Figure 12. Comparison of model accuracy.
Land 14 01254 g012
Table 1. Street view images building dataset division.
SubsetsImagesInstancesAbandoned Buildings
Training set1076164142.4%
Validation set14622343.0%
Test set14623442.3%
Table 2. IIL redevelopment potential evaluation index system.
Guideline LayerIndicatorDescription
NecessityAverage employmentThe number of employees per unit area in each plot.
Per-mu tax revenueThe annual tax value per unit area in the plot.
Per-mu output valueThe annual output value per unit area in the plot.
Per-mu industrial added valueThe industrial added value per unit area in the plot.
Annual revenueThe total annual income in the plot.
Building heightThe average building height of each plot
Building densityThe ratio of total building area to land area in each plot.
MaturityTraffic convenienceThe ratio of the total number of traffic type POIs within the plot to the area size.
Street network densityThe ratio of the total street network length within the plot to the area size.
Industrial agglomerationThe ratio of the total number of enterprises and companies POIs within the plot to the area size.
Sky view factorMeasures the fraction of the sky visible from SVI, indicating the openness of a plot.
Greenery coverage ratioRepresents the proportion of an area covered by vegetation, reflecting the availability of green spaces.
Waterfront accessibilityThe density of water resources around the plot.
UrgencyProhibited and eliminated industrial landDetermines whether the enterprises on this plot belong to eliminated and prohibited enterprises.
Environmentally unfriendly landDetermines whether the enterprises on this land are enterprises that cause serious pollution.
Table 3. Description of data sources.
Data TypeData SourceData Interpretation
Enterprise big dataNingbo Municipal Bureau of Natural Resources and Planning Big Data PlatformIt evaluates the economic benefits of the enterprise
Remote sensing imagehttps://zenodo.org/ (17 April 2023)It provides building data including building height and building density. [43]
Government planning datahttp://sthjj.ningbo.gov.cn/art/2022/4/8/art_1229051647_58908376.html (18 May 2023)It contains the ‘List of Key Environmental Supervision Units’
https://www.gov.cn/lianbo/bumen/202307/content_6893707.htm (18 May 2023)It contains the ‘Industrial Structure Adjustment Document’
POIhttps://lbs.amap.com (18 May 2023)It identifies the location and category of different urban functions and services.
Road networkhttps://www.openstreetmap.org/ (17 April 2023)It depicts the distribution of urban roads.
Street View Imageshttps://map.baidu.com/ (17 April 2023)It provides a detailed representation of the city’s urban morphology and architectural characteristics.
Table 4. Results of model evaluation metrics.
ClassInstancesPrecision (P)Recall (R)Mean Average Precision (mAP)
Abandoned building990.8110.780.816
Normal building1350.8190.7410.787
All2340.8150.760.801
Table 5. Comparison results of detection accuracy.
ModelPrecision (P)Recall (R)Mean Average Precision (mAP)
YOLOv11n0.7260.7160.745
YOLOv11-AdditiveBlock0.8150.760.801
Disclaimer/Publisher’s Note: The statements, opinions and data contained in all publications are solely those of the individual author(s) and contributor(s) and not of MDPI and/or the editor(s). MDPI and/or the editor(s) disclaim responsibility for any injury to people or property resulting from any ideas, methods, instructions or products referred to in the content.

