Article

Source Apportionment and Ecological-Health Risk Assessments of Potentially Toxic Elements in Topsoil of an Agricultural Region in Southwest China

1
Faculty of Geosciences and Engineering, Southwest Jiaotong University, Chengdu 611756, China
2
Yibin Research Institute, Southwest Jiaotong University, Yibin 644000, China
3
Sichuan Province Engineering Technology Research Center of Ecological Mitigation of Geohazards in Tibet Plateau Transportation Corridors, Southwest Jiaotong University, Chengdu 611756, China
4
Sichuan Institute of Comprehensive Geological Survey, Chengdu 610081, China
*
Author to whom correspondence should be addressed.
Land 2025, 14(6), 1192; https://doi.org/10.3390/land14061192
Submission received: 7 May 2025 / Revised: 26 May 2025 / Accepted: 29 May 2025 / Published: 2 June 2025

Abstract

:
Soil potentially toxic element (PTE) contamination remains a global concern, particularly in rural agricultural regions. This study collected 157 agricultural topsoil samples within a rural area in SW China. Combined with multivariate statistical analysis in the compositional data analysis (CoDa) perspective, the PMF model was applied to identify key contamination sources and quantify their contributions. Potential ecological risk assessment and Monte Carlo simulation were employed to estimate ecological-health risks associated with PTE exposure. The results revealed that the main exceeding PTEs (Mercury—Hg and Cadmium—Cd) are rich in urbanized areas and the GFGP (Grain for Green Program) regions. Source apportionment indicated that soil parent materials constituted the dominant contributor (32.48%), followed by traffic emissions (28.31%), atmospheric deposition (21.48%), and legacy agricultural effects (17.86%). Ecological risk assessment showed that 60.51% of soil samples exhibited higher potential ecological risk (PERI > 150), with moderate-risk areas concentrated in the GFGP regions. The elements Cd and Hg from legacy agricultural effects and atmospheric deposition contributed the most to ecological risk. Health risk assessment demonstrated that most risk indices fell within acceptable ranges for all populations, while only children showed elevated non-carcinogenic risk (THImax > 1.0). Among PTEs, the element As, mainly from traffic emissions, was identified as a priority control element due to its significant health implications. Geospatial distributions showed significant risk enrichment in the GFGP regions (legacy agricultural areas). These findings present associated risk levels in sustainable agricultural regions, providing valuable data to support soil environmental management in regions requiring urgent intervention worldwide.

Graphical Abstract

1. Introduction

Soil, as the material basis for ecosystem and agricultural productivity, plays a critical role in sustaining global socio-economic development [1,2,3,4]. However, rapid industrialization and urbanization have led to the widespread accumulation of potentially toxic elements (PTEs) in soils through anthropogenic activities, including mining operations, fossil fuel combustion, and intensive application of agrochemicals [5,6,7]. These contaminants, characterized by high toxicity, persistence, and bioaccumulation potential [8,9], not only deteriorate the soil environment and disrupt ecological balance but also pose substantial threats to human health via the food chain [10,11,12,13]. Recent studies have shown severe ecological and health impacts associated with soil PTEs across various regions. Refs. [14,15,16,17] found that Hg and Cd were particularly concerning elements in agricultural soils of western Asia, demonstrating significant ecological-health risks. Refs [18] reported that Cd and As contamination in Indian soils caused irreversible DNA damage in plants and elevated carcinogenic risks to human health. Notably, sustainable agricultural development (SAD), such as China’s Grain for Green Program (GFGP) and pollution-free stereoscopic agriculture, has introduced novel paradigms for soil environmental management [19,20]. While these policies have demonstrated efficacy in reducing PTE concentrations [21,22], legacy agricultural effects still cannot be underestimated. Persistent exceedance of PTEs in soils has been observed in some afforested areas [23,24,25,26], meaning that seemingly safe areas may still pose risks to human health or ecosystems. Therefore, the source apportionment and comprehensive risk assessments associated with PTEs need to be quantified for these regions.
Recently, although the research about soil PTEs has made some advanced progress, there are some challenges in accurately quantifying their sources and assessing associated ecological-health risks [27,28]. The main obstacle is attributed to the limitations of traditional source apportionment methods. These approaches often fail to account for the compositional nature of geochemical data, leading to spurious correlations and influenced results [29,30]. For instance, the results of both correlation analysis [31] and principal component analysis (PCA) are usually affected by closure effects [32,33,34]. This limitation obscures the true relationships between PTEs and their sources, especially in complex environments with mixed natural and anthropogenic inputs. On the other hand, ecological environmental improvement is generally evaluated based on visible outcomes such as increased vegetation cover [35]. Furthermore, health risk assessments used to depend on deterministic models, which overlook the variability and uncertainty in exposure parameters such as ingestion rate (Ring), body weight (BW), and exposure frequency (EF) [36,37]. This may make the results of risk estimations inaccurate, particularly for vulnerable populations such as children [38,39].
To address these challenges, recent advancements in compositional data analysis (CoDa) and receptor models have provided valuable solutions for source apportionment and risk assessments [40,41]. CoDa, through transformations such as the centered log-ratio (clr) and isometric log-ratio (ilr), avoids the closure effects in geochemical data, enabling reliable multivariate statistical analysis [42,43]. Meanwhile, receptor models such as Positive Matrix Factorization (PMF) have been powerful tools for quantifying source contributions by decomposing complex raw datasets into source profiles and contributions [44,45]. Additionally, potential ecological risk assessment (PERI) objectively reflects the potential impact on the ecosystem by combining with the toxicity coefficients of the PTEs [46,47,48]. The probabilistic risk assessment method, Monte Carlo simulation, has been increasingly adopted due to considering parameter uncertainty and variability, providing more realistic evaluations of health risks [49,50,51]. For instance, recent studies have integrated CoDa and PMF to distinguish between natural and anthropogenic sources in urban and agricultural soils [41]. PERI is carried out to qualify risk levels of PTEs in soil ecosystems, while Monte Carlo simulations have been used to identify vulnerable populations and prioritize pollutants [52,53,54]. These methods can overcome the limitations of traditional approaches.
The accumulation of PTEs in agricultural soils has emerged as a pressing environmental concern, posing significant threats to ecosystem stability, food safety, and human health [55,56]. In response, the implementation of SAD policies has been a global trend as a strategy to rehabilitate degraded lands and safeguard the soil environment. While these measures have effectively mitigated excessive PTE concentrations in soils, the long-term legacy effects of historical agricultural practices remain understudied, particularly in SAD regions where quantitative risk assessments and source apportionment approaches are limited. Previous studies have primarily focused on PTE contamination in heavily polluted areas, often neglecting regions undergoing sustainable remediation. Moreover, conventional source apportionment methods frequently ignore the compositional nature of soil data, leading to biased interpretations. Crucially, integrated frameworks combining CoDa, advanced receptor modeling, and probabilistic health risk assessment are scarce, leaving gaps in realistic risk evaluations for policy-making. To fill these gaps, the detailed objectives are determined as follows:
  • To understand pollution levels and geospatial characteristics of PTE concentrations;
  • To accurately identify the main sources and quantify contributions by the PMF model combining multivariate statistical analysis in the CoDa perspective;
  • To assess potential ecological risk associated with PTEs through PERI;
  • To obtain more realistic assessments of health risks using Monte Carlo simulations.
These findings highlight the effects of sustainable agricultural practices in reducing the risks of PTEs to human health and ecosystems, offering critical data-driven insights to support soil environment management in regions worldwide facing similar environmental challenges.

2. Materials and Methods
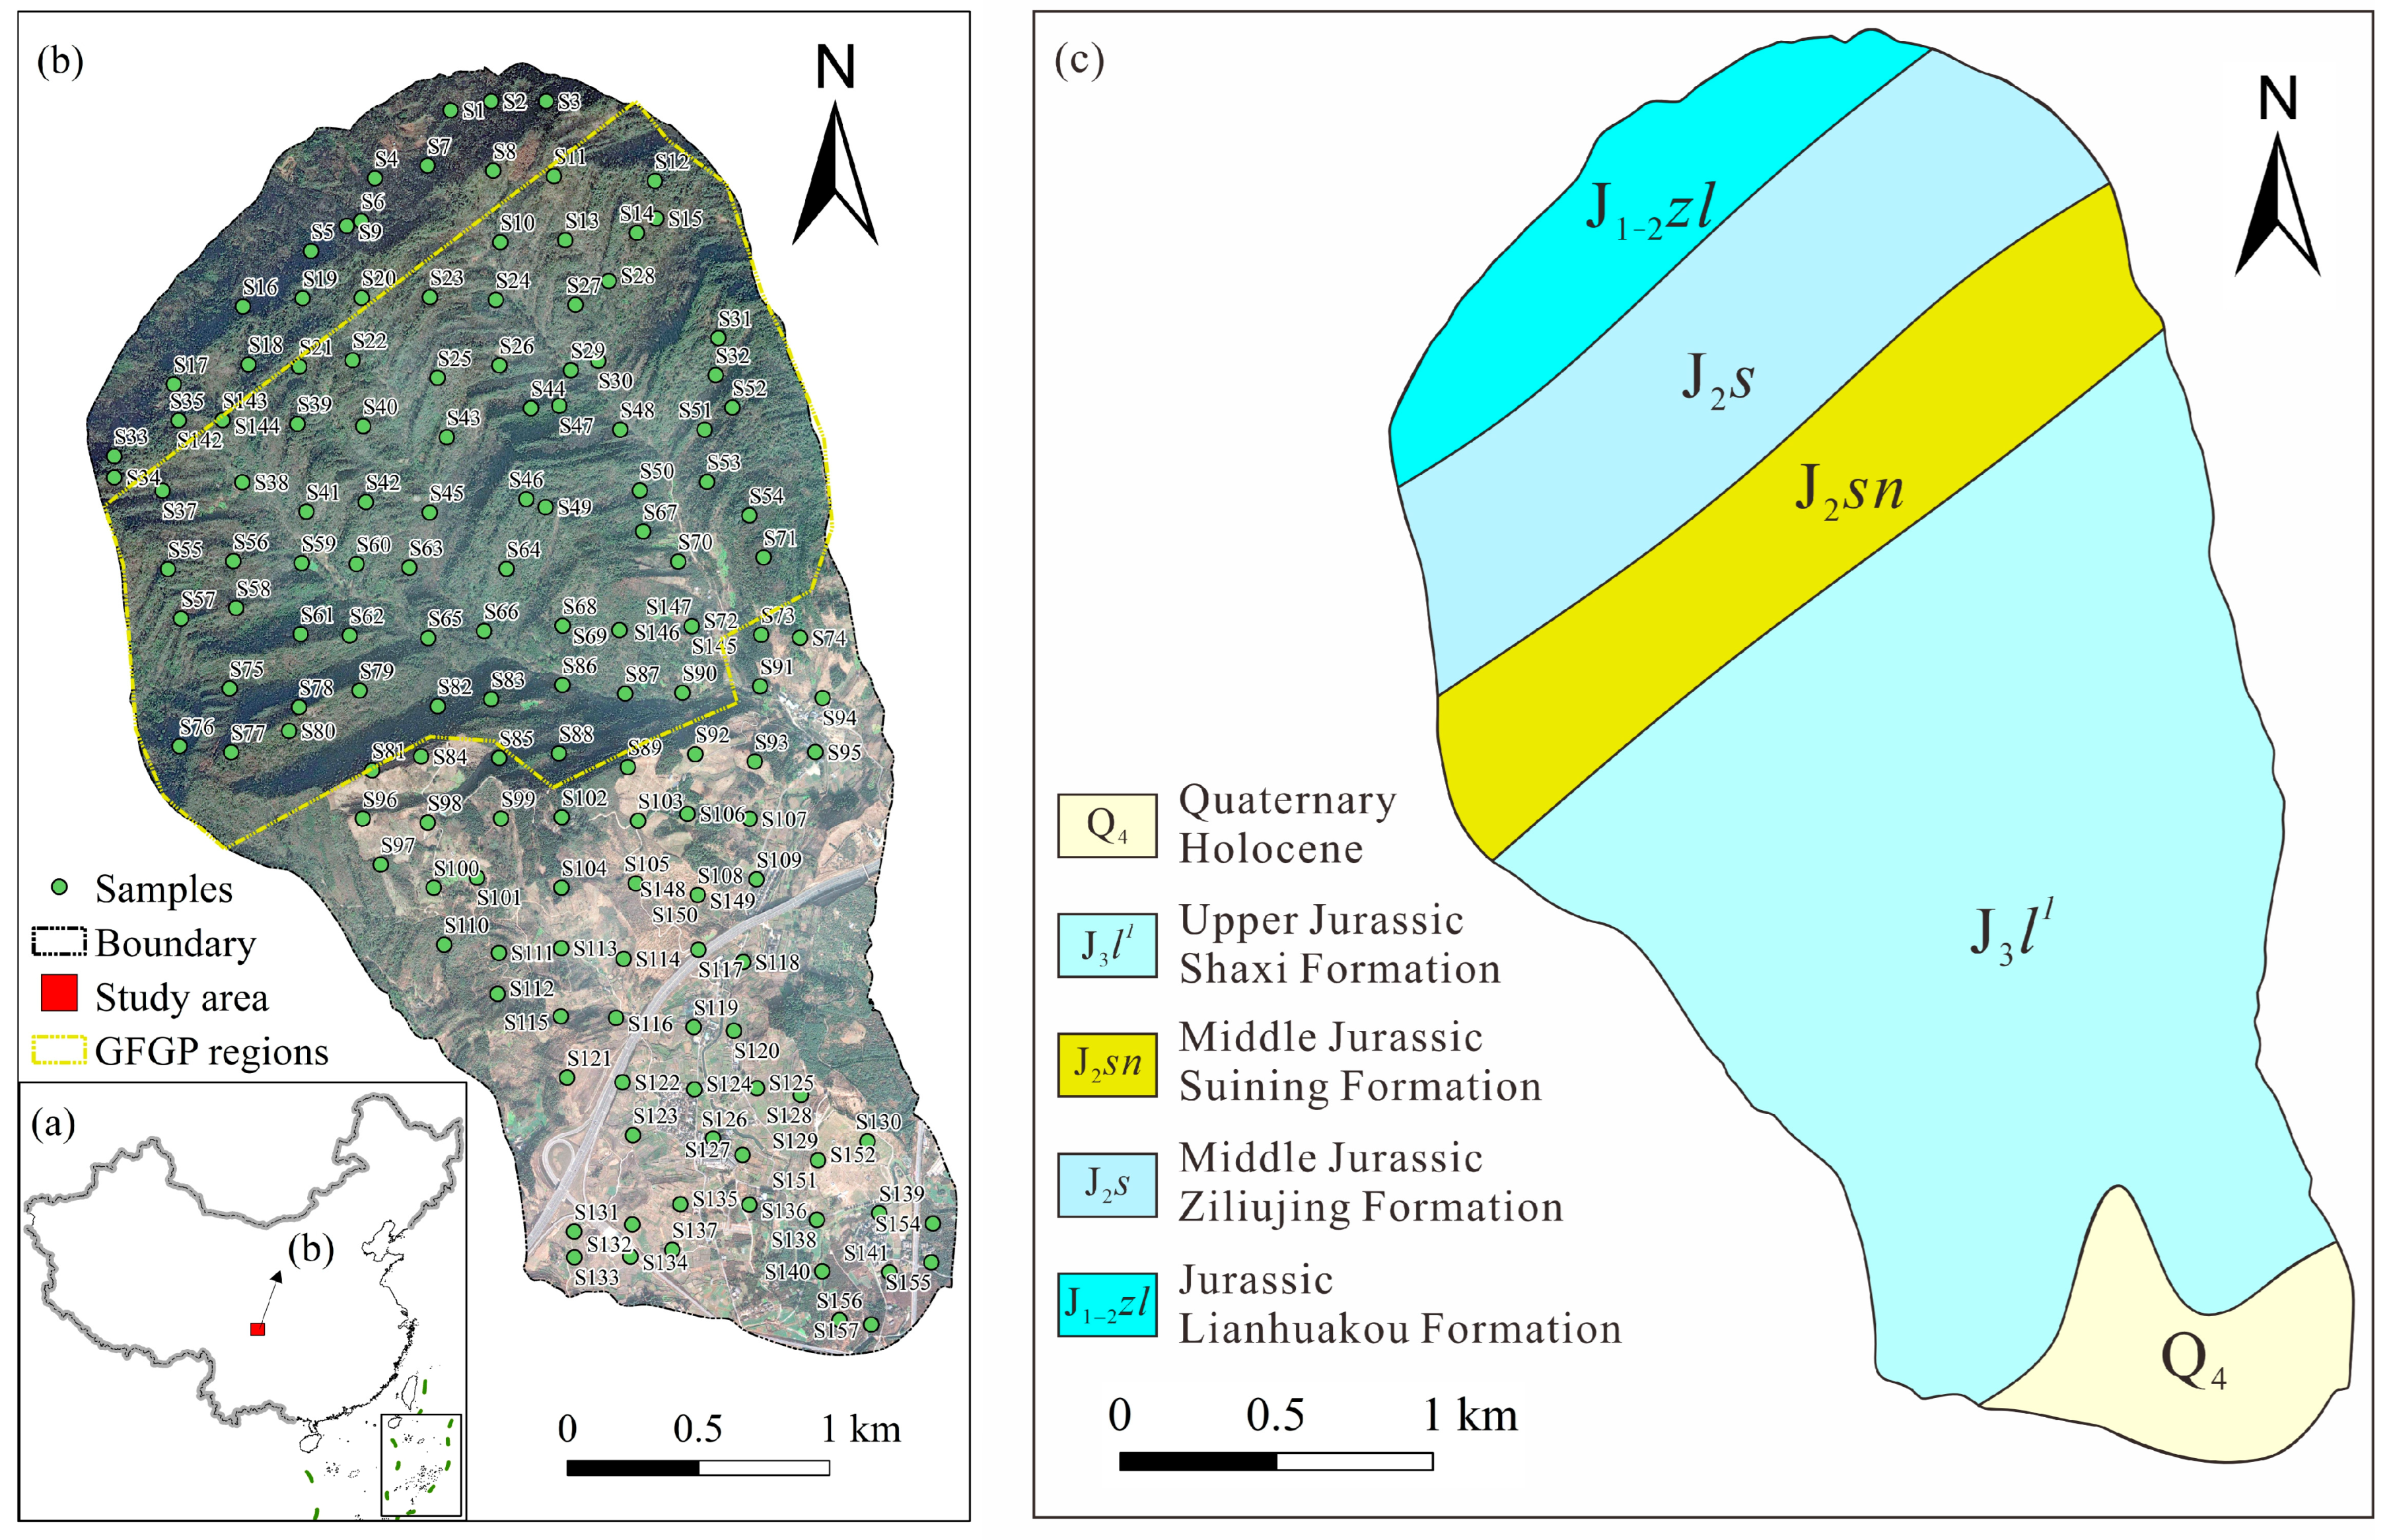
2.1. Study Area

The study area is located in southwest China and belongs to the rural agricultural area (Figure 1a), which belongs to a subtropical humid monsoon climate. The mean annual temperature and precipitation reach 15.5 °C and 1000 mm, respectively. The terrain exhibits significant elevational variation (611–1346 m), sloping from higher elevations in the north to lower areas in the south. The study area is predominantly underlain by Jurassic strata, including the Suining Formation, Ziliujing Formation, Lianhuakou Formation, and Shaxi Formation, with sparse Quaternary sediments overlying these units. The lithology is predominantly composed of mudstones and sandstones. The strata exhibit a northeast–southwest structural strike (Figure 1c). Land use patterns show distinct spatial differentiation, with forest dominating the northern sector and built-up areas mixed with cropland in the southern sector. Except for the northernmost areas, parts of the northern forest are the GFGP regions (Figure 1b). There are multiple types of soils, particularly paddy soils, accounting for 35% of the total land area in the region. The paddy soils are determined as cropland, which has a proportion of 75.7% of the total cropland areas.
Before implementing the policy, a field investigation found that the local survival focused on traditional agriculture, causing the overuse of agrochemicals, especially phosphate fertilizers. In the past decades, large numbers of studies showed that the PTE concentrations of the study area exhibited significantly exceeding features [57,58]. Nowadays, the economic development in the study area is dominated by pollution-free stereoscopic agriculture, followed by stock farming. The GFGP regions are covered by various commercial crops, including fruits and excellent forages. Additionally, the southern cropland is primarily planted with pollution-free vegetables. These product industries not only reduce excessive rates of soil PTEs but also make tourist industries gradually become the pillar of the economy in this region. There are rich coal reserves in the city governing the study area, and some thermal power stations are built in the urbanized areas. Because of the unique climate, the study area has no source of heavy pollution. Abundant groundwater and surface reservoirs supply the demand of the social economy and daily life with good water quality.

2.2. Soil Sampling and Testing

To ensure the representativeness of soil samples, a systematic network point method was adopted, collecting 157 samples across the study area in January 2022. Each sample, obtained from a depth of 0–20 cm, adhered to a density of 20 samples per 1 km2 and a minimum mass of 1 kg. Sampling sites were strategically selected in areas with minimal anthropogenic disturbance to reflect natural conditions. Surface debris was removed before collection, and samples were sealed in pre-cleaned, contamination-free bags. The collected samples were air-dried, sieved, and transported to the laboratory for chemical analysis. The analyzed parameters included the concentrations of PTEs (Arsenic—As, Cadmium—Cd, Chromium—Cr, Copper—Cu, Mercury—Hg, Nickel—Ni, Lead—Pb, and Zinc—Zn), as well as soil pH.
Elemental analysis was conducted using advanced spectroscopic techniques. All analytical-grade reagents used in this study were sourced from China National Pharmaceutical Group Corporation (Sinopharm Group) (Beijing, China) to ensure trace metal-grade purity. For the determination of Cr, Cu, Ni, and Zn, approximately 0.1000 g of soil sample was moistened with distilled water (18.2 MΩ·cm), digested with a mixture of HNO3 (1.42 g/mL), HF (1.15 g/mL), and HClO4 (1.67 mg/L), and extracted using 5% HNO3 before dilution to 25.00 mL and homogenization. The concentrations of these elements were quantified via Inductively Coupled Plasma Optical Emission Spectrometry (ICP-OES, iCAP 7600, ThermoScientific, Waltham, MA, USA). For Cd and Pb, 5.00 mL of the supernatant was diluted to 20.00 mL with low-concentration HNO3 and measured using Inductively Coupled Plasma Mass Spectrometry (ICP-MS, Agilent 7500, ThermoScientific, USA). As and Hg were determined by first oven-drying the sample at 105 °C, followed by digesting 0.2000 g of the dried sample with 10 mL of aqua regia [HNO3 (1.42 g/mL): HCl (1.19 g/mL) 1:3, v:v] in a 50 mL container; their concentrations were determined by Atomic Fluorescence Spectrometry (AFS, PSAnalytical, Orpington, UK). Soil pH was measured (soil/water ratio of 1:2.5) using the Ion Selective Electrode (ISE) method after suspending 10.0 g of sample in deionized water, stirring vigorously for 1 min, and allowing the mixture to settle for 30 min. The detection limits of these PTEs are 1 mg/kg for As, 0.03 mg/kg for Cd, 5 mg/kg for Cr, 1 mg/kg for Cu, 0.0005 mg/kg for Hg, 2 mg/kg for Ni, 2 mg/kg for Pb, and 4 mg/kg for Zn.
To ensure data reliability, a rigorous quality assurance and quality control (QA/QC) protocol was implemented. Soil samples were analyzed in three batches following the ‘Specification for Multi-Purpose Regional Geochemical Survey (1:250,000)’ (DZ/T 0258-2014) [59], with certified Chinese national standard reference materials (GBW) used for instrument calibration and method validation. The accuracy of the analytical methodology was assessed through the relative deviation between measured and certified values, while precision was evaluated using the coefficient of variation (CV). Both accuracy and precision achieved 100% compliance rates. Additionally, replicate analyses were performed for every batch of 30 samples, with accuracy and precision exceeding 98% for all PTEs. The overall reporting rate for soil samples surpassed 99%, and the repeatability test compliance rate remained above 90%, ensuring the robustness and reproducibility of the results.

2.3. Improved Nemerow Index

The Improved Nemerow Index (INI) is employed to evaluate the pollution level of PTEs in soils [60,61]. This enhanced approach addresses the limitations of the conventional Nemerow index by incorporating both the mean and maximum contamination factors [62]. The calculation procedure is shown by following the formulas.
I g e o = l o g 2 C i 1.5 B i
I N I = I 2 g e o ( m a x ) + I 2 g e o ( a v e ) 2
where Ci represents the measured concentration of PTE i in soil (mg/kg), and Bi denotes the corresponding background value or soil quality standard (mg/kg). In this study, to ensure the accuracy and comparability of the research results, local background levels are selected to calculate the Igeo (geochemical accumulation index). The Igeo is applied to assess the contamination degree of PTEs in soils, considering both their measured concentrations and natural background levels [63]. Igeo(max) and Igeo(ave) are the maximum and average values of the geochemical accumulation indexes, respectively. The detailed classifications of the INI and Igeo are shown in Table A1.

2.4. Compositional Data Analysis

In this study, multivariate statistical analysis includes correlation analysis and principal component analysis (PCA), which are employed to elucidate the relationships among PTE concentrations and the pollutant sources in the soils. Before this analysis, the compositional nature of the data is disposed of using compositional data analysis (CoDa) to avoid unreasonable results arising from closure effects. CoDa is a robust statistical framework specifically designed to handle data that represents parts of a whole. This method emphasizes the transformation of soil PTE concentrations and is realized by multiple pathways, mainly including Centered Log-Ratio (clr), Additive Log-Ratio (alr), and Isometric Log-Ratio (ilr) transformations. In this study, raw PTE concentrations were transformed using the clr transformation to address the issue of closure effects. The mentioned transformation methods are calculated as follows.
c l r x = l n x 1 g x , l n x 2 g x , . , l n x D g x
a l r x = l n x 1 x D , l n x 2 x D , . , l n x D 1 x D
i l r x = V c l r x
where x 1 , x 2 , …, and x D express the concentrations of the first to Dth components in the composition. D is the total number of components in the composition. g x means the geometric mean of all components in the composition x = ( x 1 ,   x 2 ,     ,   x D ) . V represents a matrix which defines an orthonormal coordinate system within the clr-plane.

2.5. Ecological Risk Index

The potential ecological risk index (PERI), initially developed by [64], was employed to evaluate the ecological impact of PTEs in soil ecosystems. The method quantifies the risk through two key indices: the single factor pollution index (Pi) and PERI. The formulas are defined as follows:
P i = C i S i
E i = T i × P i
P E R I = i = 1 n E i
where Ci represents the measured concentration of PTE i in the soils, Si denotes the reference concentration of PTE i, and Ti is the toxicity coefficient of the PTE i, reflecting its inherent toxicity and the soil’s sensitivity to contamination. Local background levels are determined as the reference concentrations of the PTEs. The toxicity coefficients are 10 for As, 30 for Cd, 2 for Cr, 5 for Cu, 40 for Hg, 5 for Ni, 5 for Pb, and 1 for Zn. Ei represents the ecological risk for a single PTE. The PERI is the integrated ecological risk index, summing the contributions of all PTEs. The detailed classifications [65] are shown in Table 1.

2.6. Positive Matrix Factorization Model

The Positive Matrix Factorization (PMF) model, conducted with EPA PMF 5.0 software, is a receptor modeling tool that utilizes chemical composition data to identify pollution sources and qualify their contributions to soil environment degradation [66]. This method decomposes the original concentration matrix X i j into three key components: the source contribution matrix g i k , the source profile matrix f k i , and the residual error matrix e i j . The decomposition process aims to minimize the objective function Q, which quantifies the difference between the observed and predicted concentrations. A lower Q value indicates a better fit between the model and the observed data. The mathematical formulation of the PMF model is expressed as:
X i j = k = 1 p g i k f k j + e i j
Q = i = 1 n j = 1 m ( X i j k = 1 p g i k f k j σ i j ) 2
where n and m represent the number of the samples and the element species, respectively; σ i j is considered as the uncertainty of the jth element in the ith samples, which can be gained by the following formula: the MDL, concentration, SD, d j , and c j express the detection limit, the element concentration, the standard deviation, and the ratio coefficient of uncertainty. If the concentration is lower than the MDL, σ i j of that can be referred to as five-sixths of the MDL.
σ i j = M D L + d j × X i j
σ i j = ( c j × S D ) 2 + ( 0.05 × X i j ) 2

2.7. Health Risk Assessment Model

Health risk assessment, a methodology established by the United States Environmental Protection Agency (US EPA) [67], is employed to quantify the potential adverse effects of environmental pollutants on human health. In this study, elevated concentrations of PTEs in soils are evaluated for their health risks through multiple exposure pathways: direct ingestion (ing), dermal exposure (der), and oral nasal inhalation (inh). These pathways contribute to the average daily dose (ADD) of PTEs absorbed by humans, which serves as a critical metric for risk quantification. The ADD for each exposure route is calculated using the following equations:
A D D i n g = C s × R i n g × E F × E D B W × A T × 10 6
A D D i n h = C s × R i n h × E F × E D P E F × B W × A T
A D D d e r = C s × A F × S A × A B S × E F × E D B W × A T × 10 6
where Cs expresses the concentration of the PTEs; these parameters, including Ring, Rinh, EF, ED, SA, AF, ABS, PEF, AT, and BW, are shown in Table A2.
HI and CR represent the non-carcinogenic risk index and carcinogenic risk index, respectively. The calculated equations are as below.
H I i = i n A D D i R f D i
C R i = i n ( A D D i × S F i )
T H I = i n H I i = ( H I i n g + H I i n h + H I d e r )
T C R = i n C R i
where n is the number of PTEs, and HIi and CRi denote the total non-carcinogenic risk index and carcinogenic risk index of all exposure pathways for a single PTE, respectively. RfDi and SFi are considered the non-carcinogenic and carcinogenic average daily reference dose for PTE i, respectively (Table A3). Based on the calculated values of the total non-carcinogenic risk (THI) and total carcinogenic risk (TCR), health risks are categorized into distinct grades. For THI, risks are classified as negligible (THI < 1.00) or unacceptable (THI ≥ 1.00). Similarly, TCR values are categorized into negligible risk (TCR < 1.0 × 10⁻⁶), acceptable risk (1.00 × 10⁻⁶ < TCR < 1.00 × 10⁻⁴), and unacceptable risk (TCR > 1.00 × 10⁻⁴). To further refine the risk assessment, a Monte Carlo simulation is employed to evaluate the probabilistic health risks associated with soil PTEs. This method is achieved through using the following Python 3.11.5 packages: Pandas 2.2.3 [68], Numpy 1.26.4 [69], Scipy 1.10.1 [70], and Matplotlib 3.7.1 [71]. The probability distributions of key input parameters, including exposure frequency, body weight, and ingestion rate, are detailed in Table A4, realizing a comprehensive quantification of uncertainty and variability in the risk assessments.

3. Results

3.1. Contamination Characteristics of Potentially Toxic Elements

The descriptive statistics for PTEs are summarized in Table 2, including minimum (Min), maximum (Max), mean, coefficients of variation (CVs), risk screening values (RSVs), and threshold values (TVs).
The pH values range from 4.26 to 8.29, with a mean of 6.31, indicating predominantly acidic soil conditions. The mean concentrations of PTEs in the soils can be ordered as Zn > Cr > Ni > Pb > Cu > As > Cd > Hg. The high CVs observed for certain PTEs suggest significant variability in their distribution, likely influenced by anthropogenic activities [61,72]. Notably, the element Hg exhibits the highest CV (59.41%), followed by Cu (35.23%) and Cd (33.08%). The concentrations of all PTEs fall within the acceptable ranges of the RSVs, indicating negligible risk to crops. However, the mean concentrations of Cd and Hg elements significantly exceed their TVs, highlighting potential environmental concerns.
Table 2. The descriptive statistics results for PTEs in soils.
IndexpHAsCdCrCuHgNiPbZn
Min4.264.430.1035.1611.190.0213.0214.0045.67
Max8.2913.950.5981.2850.820.4046.2538.4899.90
Mean6.318.360.2659.1623.800.0728.4725.2470.46
CVs19.92%21.46%33.08%17.01%35.23%59.41%24.17%18.44%16.69%
RSVs---20.000.30150.0050.000.5060.0070.00200.00
TVs---10.40.07979.0031.100.0632.6030.9086.50
Notes: The pH and CVs are dimensionless. The unit for Min, Max, Mean, RSVs, and TVs is mg/kg. The TVs are from the reference [73].
Further analysis using the Igeo reveals that only Cd and Hg exhibit Igeo values above 1, confirming anthropogenic influence on their accumulation (Figure 2a). In contrast, the remaining PTEs show Igeo values below 1, suggesting minimal contamination, and 35.03% of the areas show moderate pollution levels according to the INI (Figure 2b), while geospatial analysis identifies that moderate pollution sites focus on the GFGP regions (Figure 2c). The combined evaluation of CVs, TVs, the Igeo, and the INI underscores the need for prioritized attention toward Cd and Hg in terms of their sources and associated risks.

3.2. Geospatial Distributions of Potentially Toxic Elements

To investigate the spatial patterns of PTEs, the inverse distance weighted (IDW) method is carried out in this study. The GFGP and urbanized regions show alkaline soil (Figure 3a). Previous studies have demonstrated that soil acidification (i.e., decreased pH) enhances the bioavailability of PTEs [74]. Consequently, elevated PTE concentrations in the southern and central regions need particular attention. The element Cd exhibits elevated concentrations predominantly in the GFGP regions (Figure 3c). Cr, Cu, Ni, and Zn demonstrate similar spatial distributions, with higher concentrations clustered in the northernmost and southern zones (Figure 3d,e,g,i). These regions are characterized by natural forests and pollution-free agricultural lands. As and Pb concentrations are primarily enriched in the southwestern areas, particularly near expressway toll gates (Figure 3b,h). The concentration of Hg shows significant accumulation in the southern and eastern urbanized zones (Figure 3f).

4. Discussion

4.1. Soil Acidity and Its Implications for Agriculture

The soil properties in the study area are influenced by multiple factors. For instance, high rainfall accelerates the dissolution of relevant ions in the strata, while long-term agricultural practices create anaerobic conditions that promote sulfide oxidation. These factors may collectively contribute to soil acidification. Strongly acidic soils (pH < 5.5) pose risks to crop production, leading to nutrient deficiencies and increased bioavailability of heavy metals [7], as evidenced by elevated Cd concentrations in the soils of some GFGP regions. To mitigate these issues, agricultural measures such as lime application and organic fertilization are recommended to raise the pH to 6.0–7.0, thereby reducing metal toxicity and enhancing soil fertility [75]. Additionally, regular monitoring of soil pH is essential to assess ecosystem health under acidic conditions.

4.2. Source Apportionment of Potentially Toxic Elements

4.2.1. Compositional Associations of the PTEs

To elucidate the relationships among PTEs in soils, this study employs correlation analysis (p < 0.05) and PCA within the CoDa framework. After accounting for closure effects inherent in soil compositional data, significant positive correlations persist between specific PTEs, including Ni-Zn, Ni-Cu, Cr-Ni, and Cd-Pb (Figure 4). These correlations suggest potential co-occurrence patterns [76], particularly implicating Ni as a key element in shared contamination sources. The PCA results further clarify some associations (Figure 4), with Bartlett’s test of sphericity (p < 0.001) and the Kaiser–Meyer–Olkin measure (KMO = 0.707) confirming the validity and appropriateness of the factor analysis [44]. Three PCs are retained in the PCA based on the eigenvalues greater than 1. PC1, accounting for 32.1% of the total variance, exhibits strong loadings for Ni, Cu, Zn, and Cr. Given that Cr and Ni are predominantly associated with soil parent materials in numerous studies [77,78,79], PC1 likely represents natural sources. PC2 explains 21.5% of the variance and is primarily influenced by Pb and Cd. These elements are well documented to originate from anthropogenic activities such as fossil fuel combustion, agricultural activities, traffic emissions, and industrial processes [80,81,82,83]. PC3 (17.44%) is mainly impacted by the element As, highlighting a specific source. This element is generally associated with non-ferrous metal mining, fossil fuel combustion, and industrial smelting processes [84]. Thus, PC2 and PC3 are possibly interpreted as reflecting anthropogenic contributions.

4.2.2. Source Identification Based on the PMF Model

In this study, a PMF model is used to quantitatively assess the contributions of potential sources to soil PTEs (Figure 5). The PMF model only involves special parameters expressed as concentration. Thus, the source apportionment considers these parameters, including As, Cd, Cr, Cu, Hg, Ni, Pb, and Zn. Before model execution, the uncertainty of each element was evaluated by applying an error fraction of 0.3, and all elements were classified as having a ‘strong’ signal-to-noise ratio (S/N). The model was iterated 20 times with four predetermined factors to ensure stability. The robustness of the model was confirmed through several validation metrics. Specifically, the residuals for all PTEs fell within the acceptable range of −3 to 3. In addition, except Cr (0.46), the remaining PTEs had R2 values spanning from 0.80 to 0.99. The ratio of Qtrue to Qexpected (Qtrue/Qexp = 0.16) was below the threshold of 2, further supporting the reliability of the source apportionment results.
Factor 1 is predominantly associated with Cu (63.29%), Ni (48.94%), Cr (36.74%), and Zn (37.78%), with a high contribution of 32.48%. The concentrations of these PTEs in nearly all samples are below both TVs and RSVs. Additionally, samples with elevated concentrations are primarily located in natural forests and pollution-free agricultural areas. The observed enrichment pattern in natural forest soils indicates that natural sources predominantly contribute to these PTEs. The northeast/southwest structural strike of the strata further aligns with the spatial distribution of associated PTE hotspots, supporting a lithogenic origin. The existing literature generally attributes Ni and Cr to geogenic origins, such as soil parent materials [85]. Therefore, factor 1 can be interpreted as soil parent materials.
Factor 2, accounting for 28.31% of the total variance in PTEs, is dominated by the element As (51.95%), followed by Pb (33.42%), Cr (38.43%), Ni (38.67%), and Zn (31.46%). In general, As and Pb are derived from combustion processes, such as coal burning and fossil fuel combustion [86]. The concentrations of Cr, Ni, and Zn in soils originate from multiple sources, including natural weathering, vehicular component wear, and lubricant additives [87,88]. In this study, these PTEs exhibited higher concentrations near the southern toll gates of expressways, likely due to intensive traffic activity and prolonged exposure to vehicle emissions. Thus, factor 2 can be attributed to traffic emissions.
Factor 3 contributes the most to Hg (73.42%), with a percentage of 21.48%. The strong spatial variability and enrichment of Hg suggest significant anthropogenic influence. Previous studies have proved that Hg content in soils is controlled by industrial and mining activities [89,90]. Notably, the concentrations of Hg are particularly high in southern and eastern urbanized regions, where there are some thermal power stations. Empirical field investigations demonstrate that soil Hg concentrations display a significant negative relationship with increasing distance from thermal power station emission sources. Given that coal combustion serves as a primary energy source for residents, long-term emissions such as fly ash deposition have likely contributed to Hg accumulation in surface soils. Therefore, factor 3 can be recognized as atmospheric deposition.
The contribution of factor 4 (17.86%) largely focuses on the element Cd (57.36%) in soils, followed by the element Pb (26.63%). Notably, Cd exhibits stronger spatial variability and higher exceedance of threshold values compared to other PTEs. Additionally, the geospatial distribution of Cd hardly exhibits similarity with the structural strike of the strata, potentially meaning the impact of human activities. Field investigations reveal excessive application of phosphate fertilizers in former croplands converted to orchards through afforestation programs. Historical application of fertilizers in these farmlands contributed to persistent PTE accumulation in soils, particularly the element Cd. Currently, thousands of fruit trees are planted to improve the soil environment of the northern part. However, this special way is without the need for frequent tilling and irrigation and induces soil compaction problems due to fruit picking in orchards [91], potentially slowing Cd degradation rates. Therefore, combined with the mentioned findings, factor 4 represents legacy agricultural effects.
Integrated with correlation analysis and PCA, the PMF model reveals distinct source apportionment patterns for PTEs. Zn, Cr, and Ni exhibit mixed sources, combining contributions from soil parent materials and traffic emissions. Cd predominantly originates from legacy agricultural effects, while Cu derives mainly from soil parent materials, and Hg shows a strong association with atmospheric deposition. As and Pb are primarily attributed to traffic emissions, with Pb additionally influenced by secondary contributions from soil parent materials and legacy agricultural effects.

4.3. Potential Ecological Risk Assessment

Source apportionment analysis of PTEs reveals persistent legacy effects of agricultural activities in the GFGP regions. To evaluate the associated environmental impacts, a potential ecological risk assessment was conducted. According to the mean Ei values, PTEs are ranked by ecological risk contribution as follows: Cd > Hg > As > Ni > Pb > Cu > Cr > Zn (Figure 6a). Notably, Cd and Hg from legacy agricultural effects and atmospheric deposition exhibit moderate to high ecological risks (Ei ≥ 40), while other PTEs remain at low-risk levels (Ei < 40). This phenomenon can be attributed to the fact that Cd and Hg possess significantly higher toxicity coefficients and more stringent environmental quality standards compared to other PTEs. The comprehensive assessment using the PERI demonstrates that 60.51% of PERI values (mean > 150) exceed the threshold for low ecological risk (Figure 6b).
Geospatial distribution patterns further identify GFGP implementation areas as the moderate zones, while southern urbanized regions belong to the moderate- to high-risk area (Figure 6c). This spatial correlation highlights historical agricultural practices continue to pose significant ecological risks despite the reduction in PTE concentration through land-use conversion. The findings underscore the long-term environmental impacts of legacy agricultural contamination in ecologically vulnerable regions. Notably, the ecological risk degree in urbanized areas should be paid more attention than in the GFGP regions.

4.4. Human Health Risk Assessment

Soil PTEs present significant human health hazards, necessitating a comprehensive evaluation of both non-carcinogenic and carcinogenic risks. Through the health risk assessment methodology provided by USEPA [67], all PTEs in this study are used to conduct non-carcinogenic risk assessment. Given the toxicity, source, and chemical forms of these PTEs, some PTEs involved in carcinogenic risk assessment include As, Cd, and Pb elements.

4.4.1. Deterministic Human Health Risk Assessment

The non-carcinogenic risk assessment reveals distinct contributions from PTEs, with mean HI values ranking as As > Cr > Pb > Ni > Cu > Cd > Zn > Hg (Table 3). The THI for children ranges from 0.53 to 1.09, with an average of 0.74, indicating potential non-carcinogenic risks from soil PTEs. In contrast, the THI values for adults remain below the safety threshold (1.00). Carcinogenic risk assessment identified that As exhibits risk values exceeding those of Cd and Pb by approximately 7- to 52-fold despite all elements remaining below the 1.00 × 10⁻⁴ safety threshold. The TCR values for both populations fall within acceptable ranges, suggesting generally manageable risk levels under current exposure scenarios.
In summary, the integrated risk assessment demonstrates that the element As from traffic emissions represents the predominant risk factor, serving as the primary contributor to both non-carcinogenic and carcinogenic health risks. This is mainly attributed to the fact that As has a high geological background and SF, as well as a low RfD. Cr and Pb emerge as secondary contaminants of concern, exhibiting significantly higher risk potentials than other PTEs. Notably, children demonstrate greater susceptibility to PTE exposure than adults, as evidenced by both non-carcinogenic risk (HIchild/HIadult = 6.73) and carcinogenic risk ratios (CRchild/CRadult = 1.78). These findings are consistent with previous studies [92,93,94,95].
The geospatial distributions of THI and TCR can effectively locate high-risk areas, providing critical insights for targeted environmental management. As illustrated in Figure 7, elevated non-carcinogenic and carcinogenic risks predominantly cluster in northern regions, where legacy agricultural practices represent the primary contamination source. These spatial patterns demonstrate that health problems caused by legacy agricultural effects need to be given importance in the study area despite decreased exceeding rates for PTEs with the help of ecological restoration initiatives.
A comparative analysis of land-use practices reveals striking differences between the northern (high-risk) and southern (low-risk) regions. The southern area’s success in maintaining lower risk levels can be attributed to the implementation of pollution-free stereoscopic agriculture, which integrates vertical farming techniques with strict contamination controls. This contrast underscores the effectiveness of sustainable agricultural practices in mitigating soil pollution and associated health risks.

4.4.2. Probabilistic Human Health Risk Assessment

Given the variations such as body weight (BW) and chemical intake from diverse populations, probabilistic human health risk assessment is carried out to accurately qualify health risk degrees to the human body. In the results of non-carcinogenic risk assessment, the HI caused by each PTE is less than 1.00, showing that single PTEs in soils cannot pose a potential health risk (Figure 8). Consistent with deterministic results, As, Cr, and Pb contribute the most to the non-carcinogenic risk levels (Figure 8a,c,g), in which the maximum risk value of the element As is close to 1.00 and should be of concern (Figure 8a). The THI values for children have a maximum value exceeding the limit of 1.00, for which the percentage reaches 12.82% (Figure 8i). Compared to children, the total non-carcinogenic risks of these PTEs to adults are below the limit due to their strong immune systems.
The carcinogenic health risk assessment model reveals that the percentages of CR < 1 for As, Cd, and Pb are 100%, indicating low carcinogenic risks to both populations (Figure 9). Likewise, As is identified as the major contributor of carcinogenic risk levels (Figure 9a). The maximum values of TCR for children and adults are 4.00 × 10⁻⁵ and 2.30 × 10⁻⁵, respectively, demonstrating that the total carcinogenic risks from PTEs are negligible for various populations (Figure 9d).

4.4.3. Sensitivity Analysis

In this study, a sensitivity analysis was used to evaluate influential levels of various factors on health risk assessments. The results revealed that the Ring emerges as the most sensitive parameter for both non-carcinogenic and carcinogenic risks (Figure 10), suggesting that oral ingestion serves as the predominant exposure pathway for PTEs in soils. This finding is particularly significant for pediatric populations, as children exhibit heightened vulnerability due to frequent hand-to-mouth behaviors and contact with contaminated surfaces in hygienically compromised environments [96]. The inverse correlation between body weight (BW) sensitivity and health risk levels further explains the increased susceptibility of children compared to adults. Zn and Cr have much greater sensitivities than other PTEs, suggesting the risk accumulation in the human body (Figure 10a). This pattern suggests that long-term exposure to these elements may pose substantial health concerns despite their concentrations below the safety threshold values.

4.5. Comparison with Some Agricultural Regions

Incorporating regional comparisons into this study can enhance the objectivity of this research result and potentially reveal potential patterns and drivers of soil contamination, such as the types of land use and anthropogenic activities. This can provide a more comprehensive understanding of pollution dynamics.
Numerous studies have established that Cd represents the predominant PTE in agricultural systems, with its accumulation primarily driven by prolonged application of phosphate fertilizers [97,98,99,100,101]. Meanwhile, Cd is considered a priority control pollutant due to its high toxicity and bioavailability [102,103,104]. Additionally, according to various findings of human health risk assessments, children are exposed to a greater risk compared to adults, while the element As is listed as the predominant contributor to potential health risks [105,106]. These conclusions are consistent with these results. Inversely, this research exhibits lower PTE concentrations (especially Cd, Hg, and As) compared to most other agricultural regions, demonstrating minimal ecological-health risk levels (Figure 11). The relatively lower risk levels observed in this study area can be linked to the successful implementation of SAD.

4.6. Limitations and Future Scope

The findings of this study reveal the characteristics of PTE concentrations, the main sources of pollutants, and the ecological-health risk levels. These results provide scientific evidence for the favorable soil environment in the study area. However, this research has certain limitations. Specifically, it does not account for long-term risk assessment based on PTE transport dynamics or detailed changes in water quality. Therefore, future studies should incorporate continuous soil and water monitoring, along with machine learning techniques and numerical simulations, to better characterize PTE mobility and associated environmental risks [119]. On the other hand, while this study focused on total PTE concentrations for source/risk nexus analysis, future investigations could incorporate soil texture, organic matter content, and CEC measurements to assess bioavailable fractions and refine risk predictions [74].
To maximize the broader environmental and socio-economic benefits, subsequent studies should explore synergies between PTE remediation and global sustainability agendas, such as carbon neutrality, peak carbon emissions, and new quality productive forces (NQPF). For example, the carbon sequestration potential of the GFGP regions could be quantified to support climate goals, while sustainable agricultural activities could be optimized to align with low-carbon development strategies [120,121]. The energy sector could develop NQPF and promote carbon neutrality to reduce pollution sources [122]. By aligning soil contamination remediation with these forward-looking policies, future studies can contribute to a holistic approach that simultaneously addresses environmental degradation, climate change, and sustainable development.

5. Conclusions

This research conducted quantitative source apportionment and comprehensive risk assessments in a typical SAD region of SW China. An integrated analytical approach combining multivariate statistical analysis with CoDa techniques and the PMF model was employed to accurately identify the sources of PTEs and quantify source contributions. Health risk assessment models incorporating Monte Carlo simulation were used to evaluate both non-carcinogenic and carcinogenic risk levels across different populations. The key findings of this study are summarized as follows:
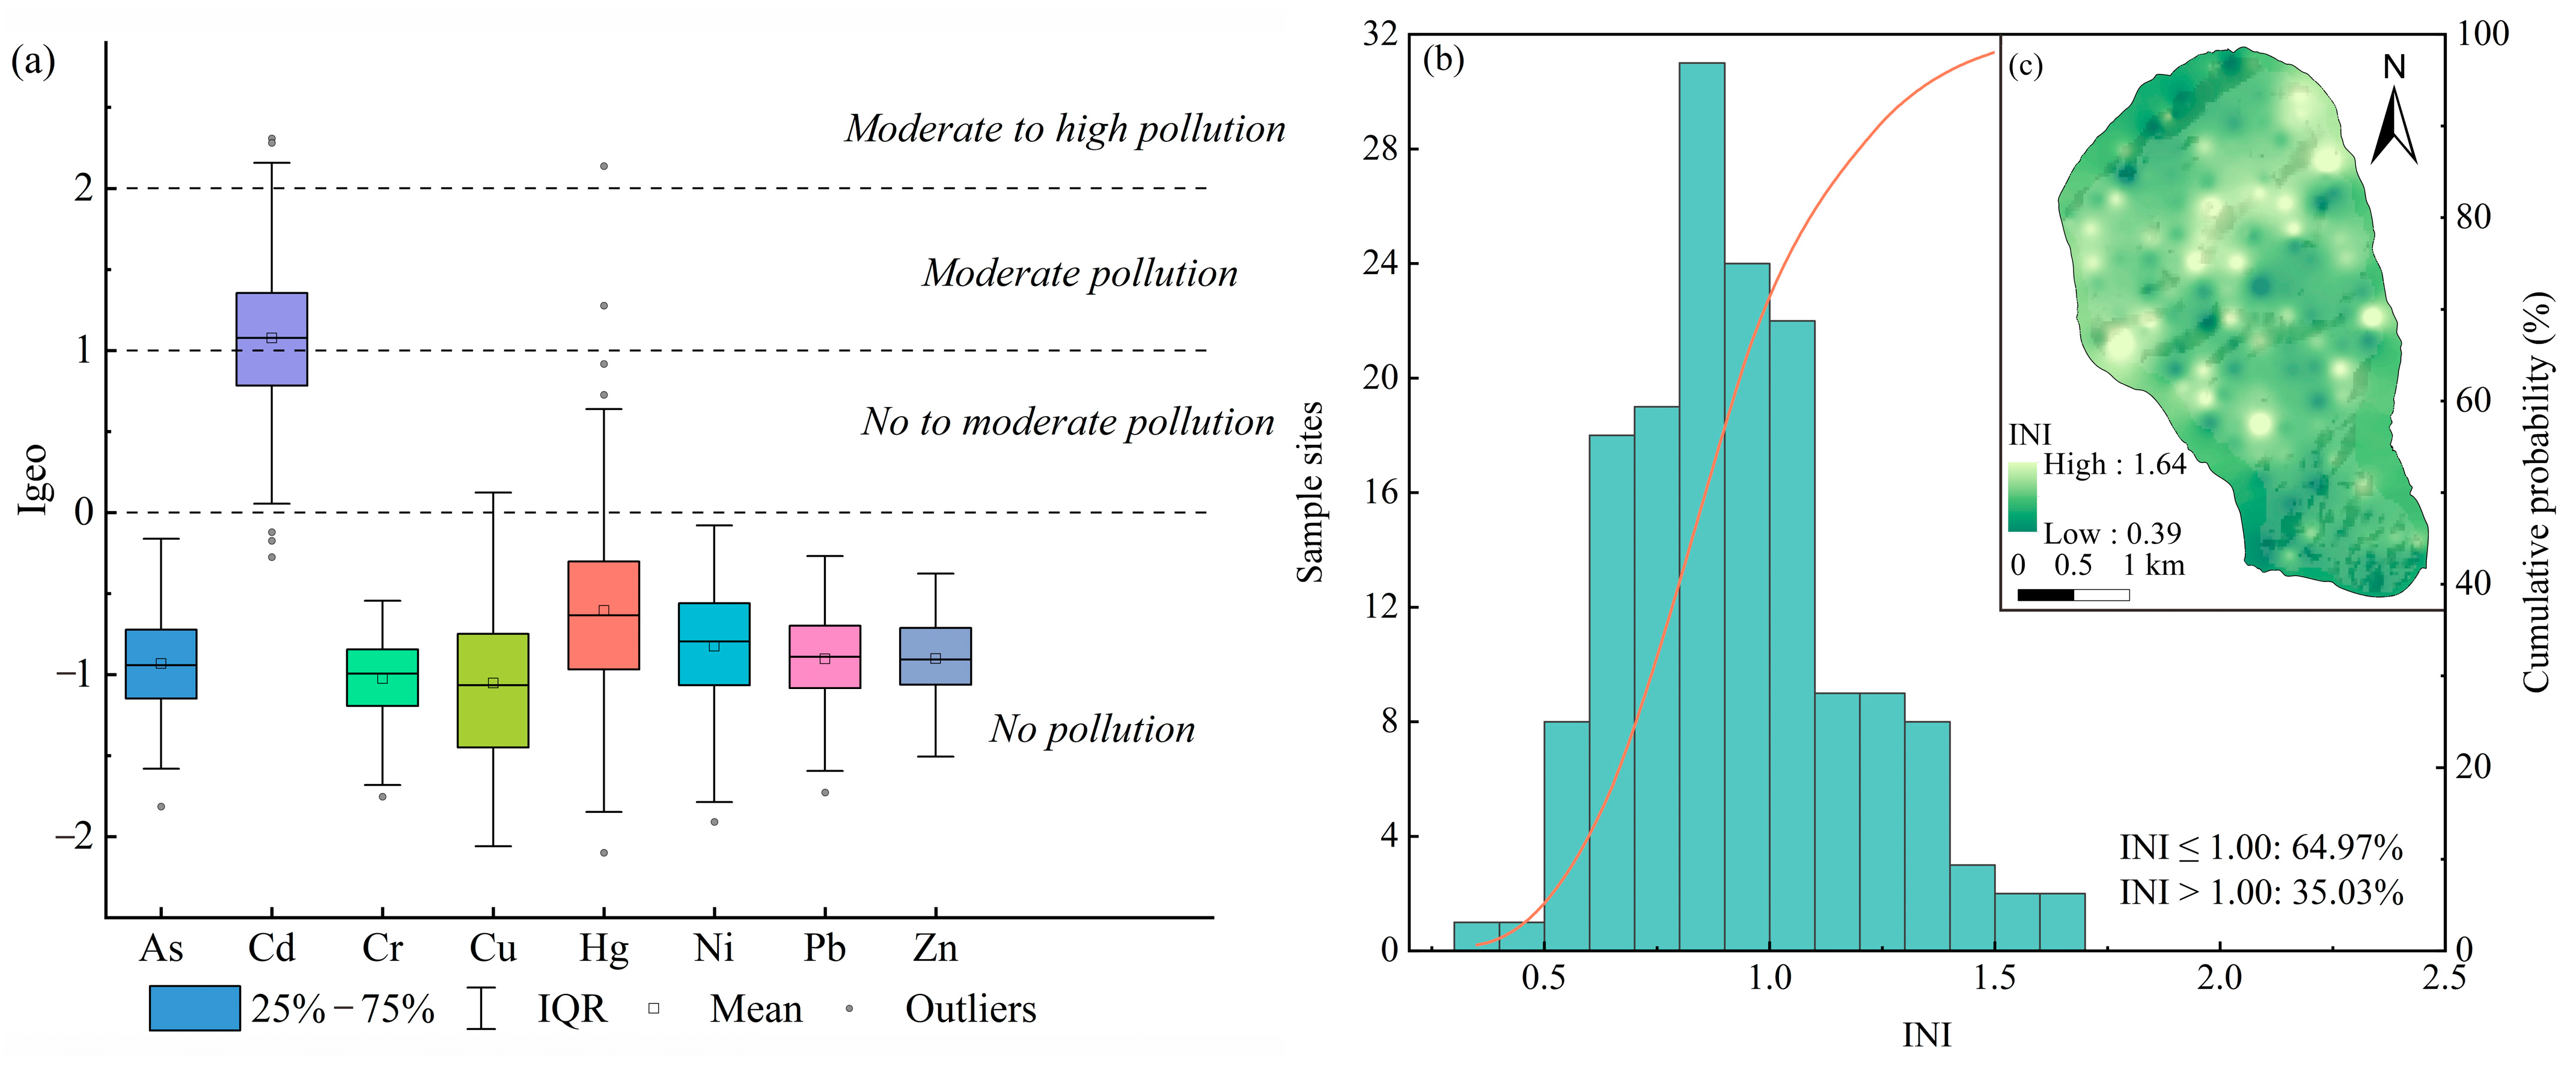
  • Elevated elemental concentrations of Cd (mean: 0.26 mg/kg; CV: 33.08%) and Hg (mean: 0.07 mg/kg; CV: 59.41%) were observed, exceeding their respective threshold values (Cd: 0.079 mg/kg; Hg: 0.06 mg/kg). Spatial analysis revealed distinct distribution patterns, with Cd enrichment predominantly occurring in GFGP implementation areas, while Hg accumulation was concentrated in urbanized areas.
  • Source apportionment identified four primary contributors to PTE concentrations: soil parent materials (32.48%), traffic emissions (28.31%), atmospheric deposition (21.48%), and agricultural activities (17.86%). Cd, Cu, and Hg are mainly sourced from legacy agricultural effects, soil parent materials, and atmospheric deposition, respectively. Zn, Cr, and Ni exhibited mixed sources (soil parent materials and traffic emissions). The elements As and Pb were primarily associated with traffic emissions, with Pb showing secondary influences from soil parent materials and legacy agricultural effects.
  • In total, 60.51% of the sample sites exhibited PERI values (mean > 150) exceeding the threshold for low ecological risk, falling in legacy agricultural regions.
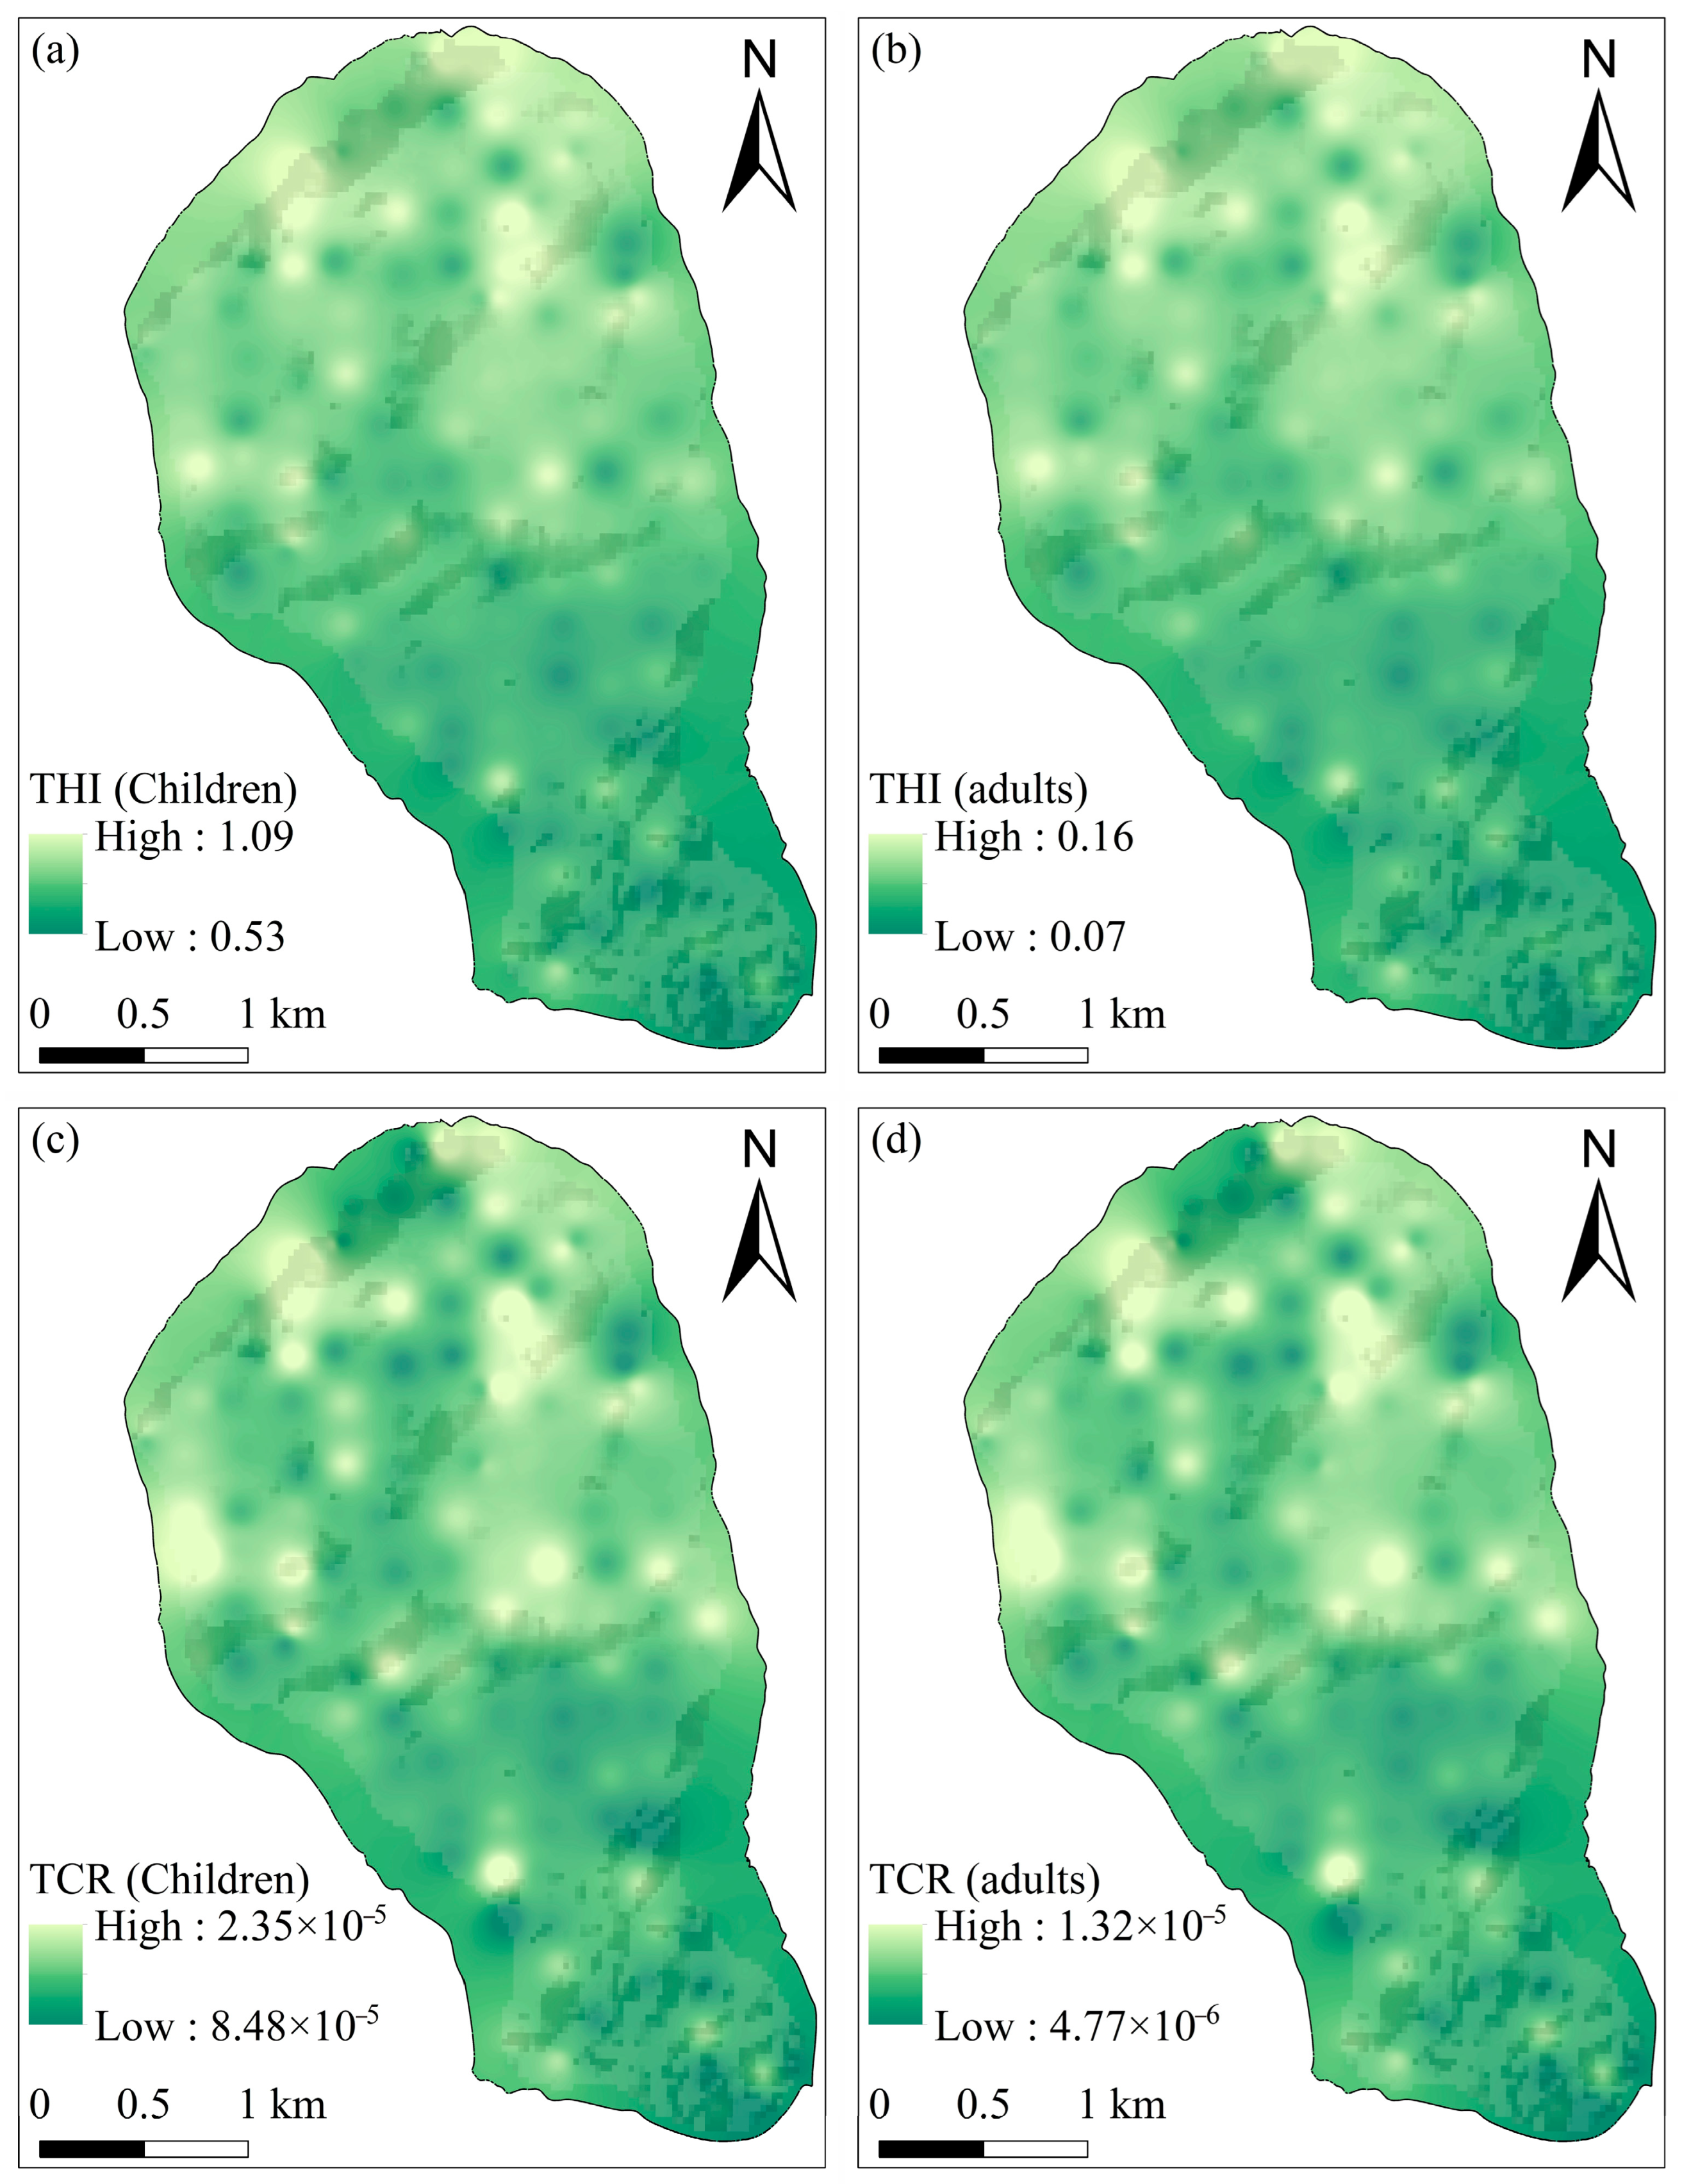
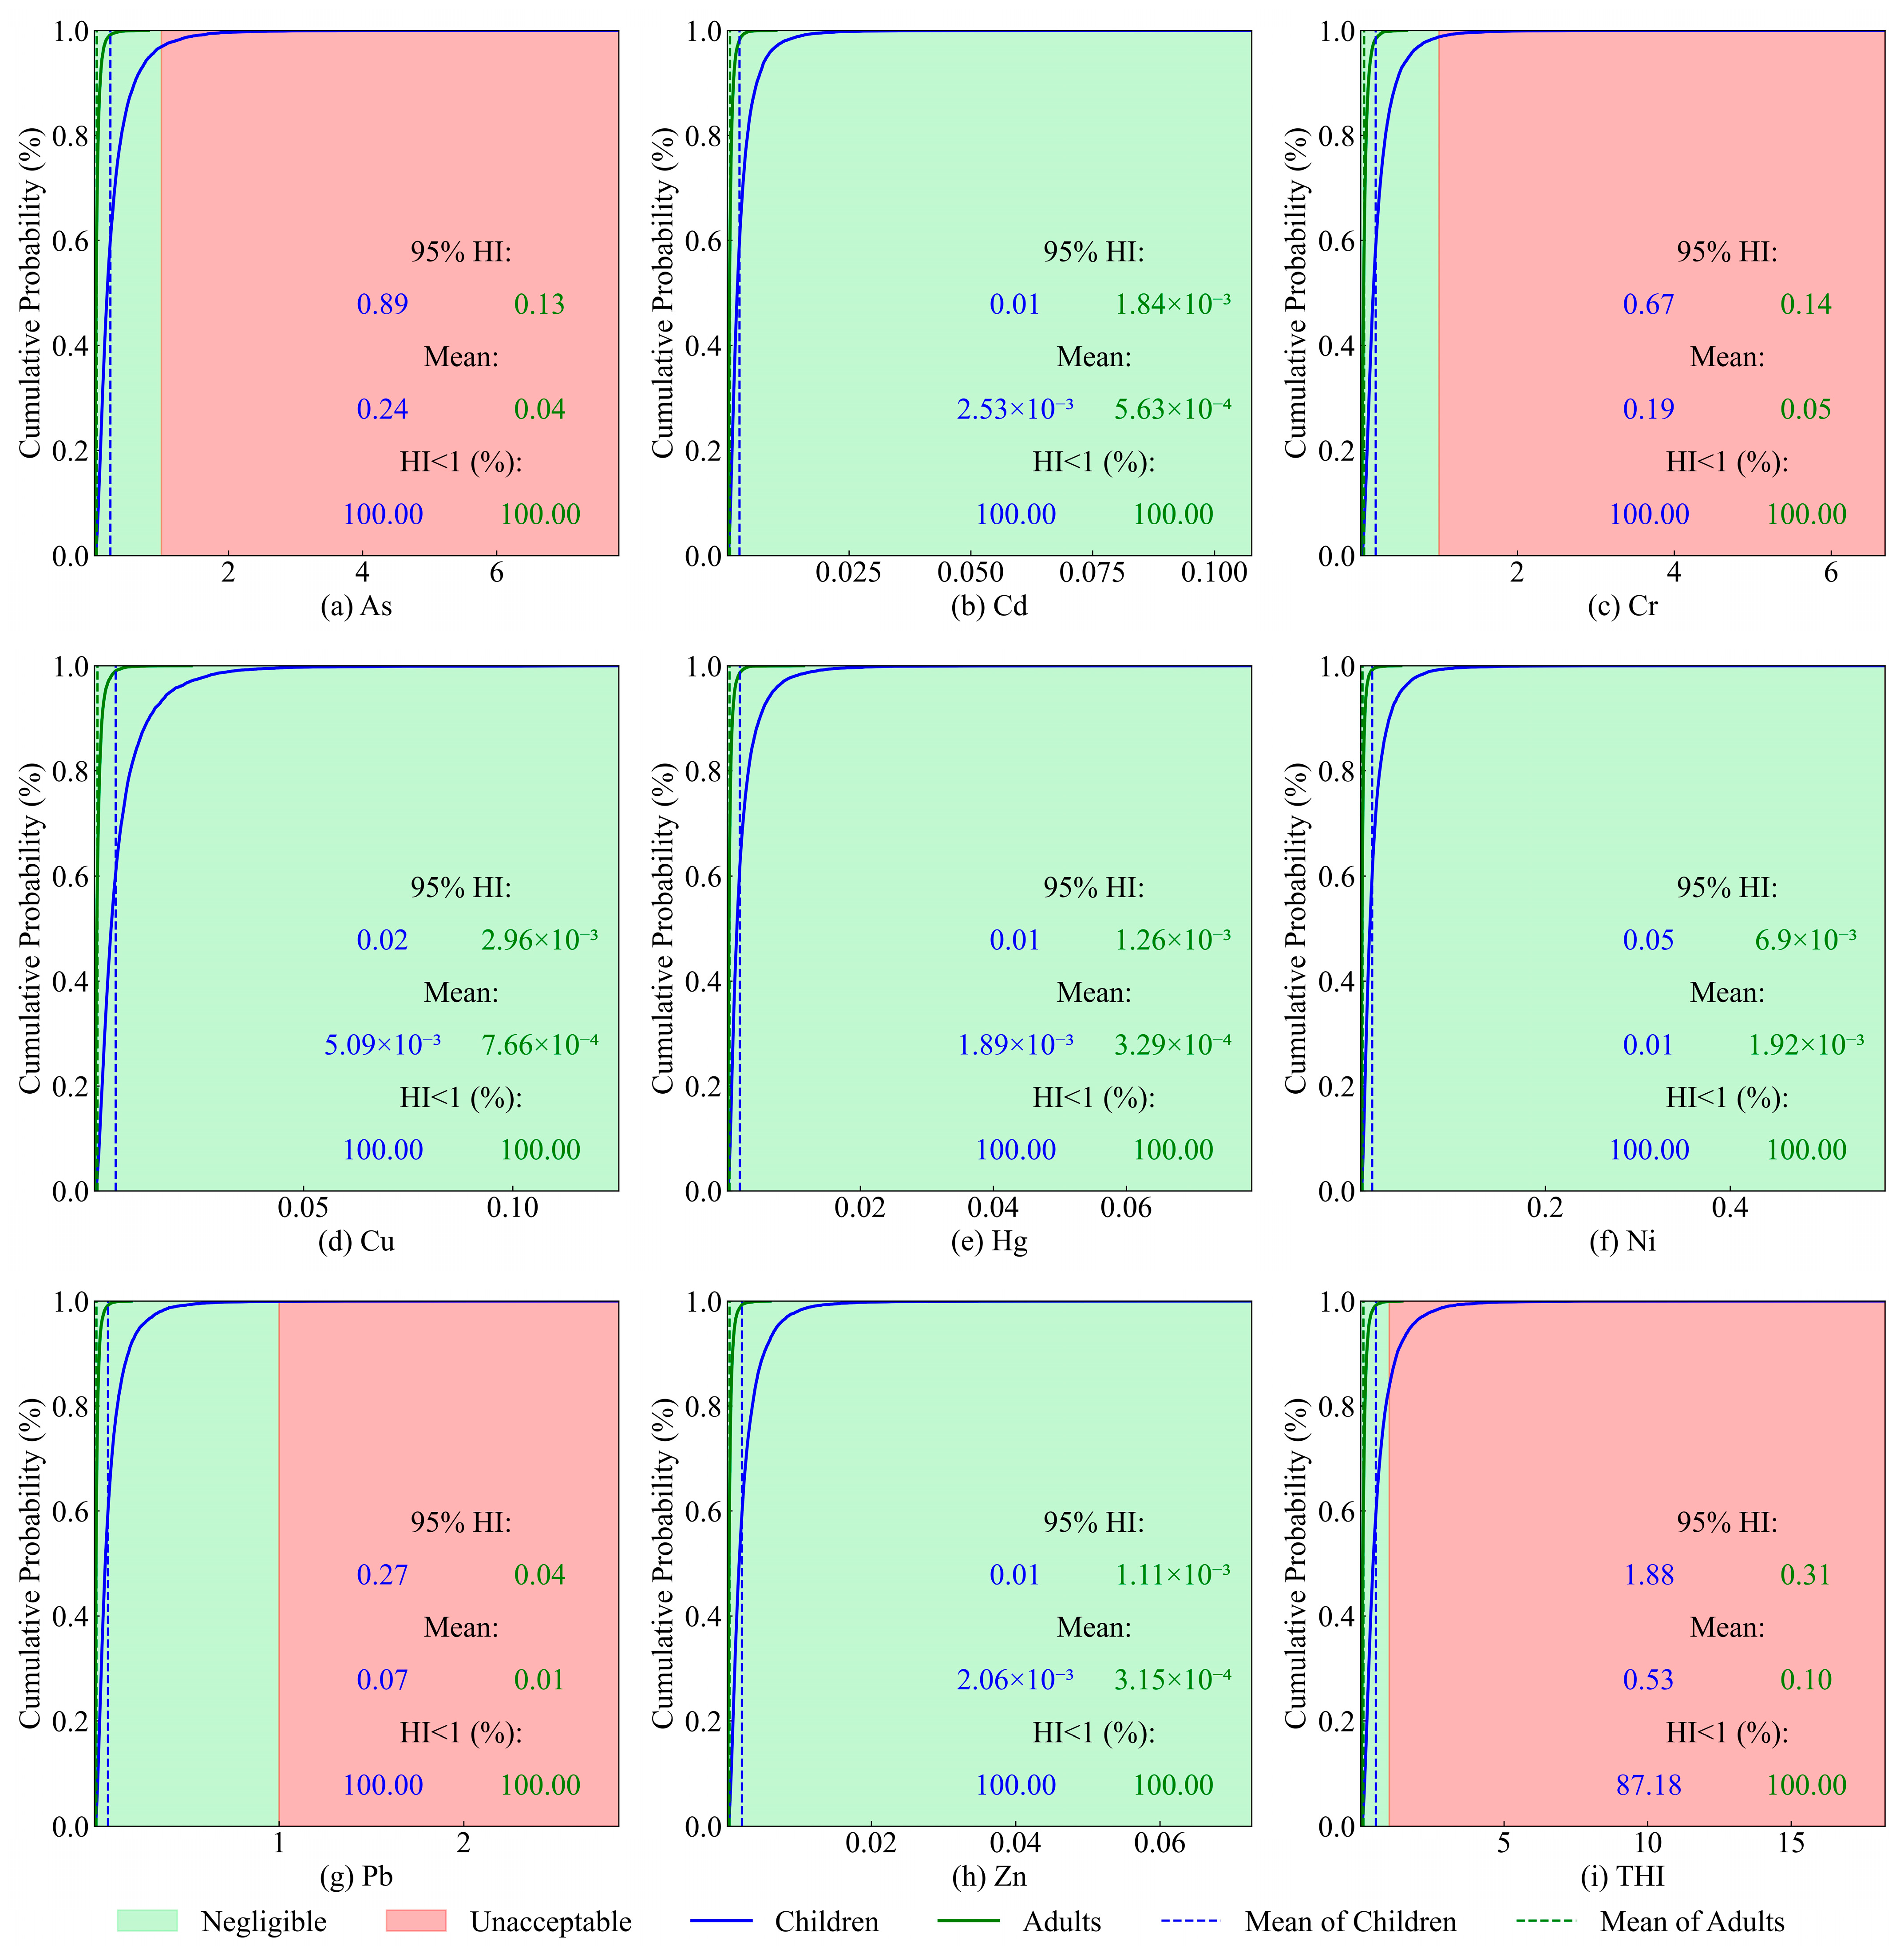
  • The PTEs in soils were found to pose a potential non-carcinogenic health risk exclusively to children, while carcinogenic risk assessment results indicated negligible risks for both children and adults. Notably, the risk levels for children consistently exceeded those for adults, highlighting their greater vulnerability to PTE exposure. Among the elements analyzed, As was identified as the most hazardous PTE. Geospatial analysis revealed that the relatively high-risk areas were predominantly concentrated in the GFGP region.
Although this study cannot present dynamic risk assessment results, the research findings still provide valuable insights into an agricultural region conducting ecological restoration policies.

Author Contributions

Conceptualization, Y.W. (Yangshuang Wang) and Y.Z.; Data curation, D.W.; Formal analysis, S.Y.; Funding acquisition, Y.Z.; Investigation, M.L.; Methodology, Y.W. (Yangshuang Wang) and H.L.; Project administration, Y.W. (Ying Wang); Resources, Y.W. (Ying Wang); Software, S.Y. and D.W.; Supervision, X.Z., Y.Z. and Y.W. (Ying Wang); Writing—original draft, Y.W. (Yangshuang Wang); Writing—review and editing, Y.W. (Ying Wang). All authors have read and agreed to the published version of the manuscript.

Funding

This research was funded by the Sichuan Science and Technology Program (2025YFHZ0269, 2025ZNSFSC0307), the Scientific Program of Yibin City (SWJTU2021020007, SWJTU2021020008, YBSCXY2023020006, YBSCXY2023020007) and Fundamental Research Funds for the Central Universities (2682024CX068).

Data Availability Statement

The data presented in this study are available upon request from the corresponding author.

Conflicts of Interest

The authors declare no conflicts of interest.

Appendix A

Table A1. Classification of the PTE contamination risk assessment indexes.
ClassificationDescriptionClassificationDescription
Igeo < 0No contaminationINI ≤ 0.5No pollution
0 ≤ Igeo < 1Slight to moderate contamination0.5 < INI ≤ 1Warning limit
1 ≤ Igeo < 2Moderate contamination1 < INI ≤ 2Slight pollution
2 ≤ Igeo < 3Moderate to high contamination2 < INI ≤ 3Moderate pollution
3 ≤ Igeo < 4High contaminationINI > 3High pollution
4 ≤ Igeo < 5High to extreme contamination
Igeo ≥ 5Extremely serious contamination
Table A2. Input parameters to characterize the daily exposure dose of PTEs via various exposure pathways.
ParameterValueUnitReferences
Ingestion rate (Ring)children200mg/day[123]
adults100
Inhalation rate (Rinh)children7.5m3/day[123]
adults14.5
Exposure frequency (EF)-350day/a[124]
Exposure duration (ED)children6a[124]
adults24
Exposed skin area (SA)children2448cm2[124]
adults5075
Skin adherence factor (AF)children0.2mg/m2·day[123]
adults0.07
Dermal absorption factor (ABS)-0.001unitless[123]
Particle emission factor (PEF)-1.36 × 10⁹m3/kg[123]
Average exposure time (AT)carcinogens70 × 365days[125]
non-carcinogensED × 365
Average body weight (BW)children15.9kg[124]
adults56.8
Table A3. Values of the reference dose (RfD; mg/kg/day) and the slope factor (SF; per mg/kg/day) for PTEs [126].
PTERfD (mg/kg/day)SF (per mg/kg/day)
IngestionInhalationDermalIngestionInhalationDermal
Cr3.00 × 1032.86 × 1056.00 × 105
Hg3.00 × 1047.04 × 1052.10 × 105
Ni2.00 × 1029.00 × 1055.40 × 103
Cu4.00 × 1024.00 × 1021.20 × 102
Zn3.00 × 1013.00 × 1016.00 × 102
As3.00 × 1041.23 × 1041.20 × 1041.515.13.66
Cd1.00 × 1032.86 × 1062.50 × 1056.16.320
Pb3.00 × 1033.52 × 1035.25 × 1048.50 × 1034.20 × 1024.25 × 101
Table A4. Distribution settings for each parameter in the Monte Carlo simulation.
ParametersProbabilistic DistributionReference
Ingestion rate (Ring)Lognormal[127]
Inhalation rate (Rinh)Lognormal[127]
Exposure frequency (EF)Triangular[128]
Exposure duration (ED)Uniform[129]
Exposed skin area (SA)lognormal[129]
Skin adherence factor (AF)Beta[125]
Dermal absorption factor (ABS)Point[125]
Particle emission factor (PEF)Point[129]
Average exposure time (AT)Point[127]
Average body weight (BW)Normal[127]

References

  1. Gomiero, T. Soil Degradation, Land Scarcity and Food Security: Reviewing a Complex Challenge. Sustainability 2016, 8, 281. [Google Scholar] [CrossRef]
  2. Greiner, L.; Keller, A.; Grêt-Regamey, A.; Papritz, A. Soil function assessment: Review of methods for quantifying the contributions of soils to ecosystem services. Land Use Policy 2017, 69, 224–237. [Google Scholar] [CrossRef]
  3. Lal, R.; Bouma, J.; Brevik, E.; Dawson, L.; Field, D.J.; Glaser, B.; Hatano, R.; Hartemink, A.E.; Kosaki, T.; Lascelles, B.; et al. Soils and sustainable development goals of the United Nations: An International Union of Soil Sciences perspective. Geoderma Reg. 2021, 25, e00398. [Google Scholar] [CrossRef]
  4. Christensen, M. Sustainable Agriculture; Springer Nature: Dordrecht, The Netherlands, 2011; Volume 2. [Google Scholar] [CrossRef]
  5. Agyeman, P.C.; Ahado, S.K.; Borůvka, L.; Biney, J.K.M.; Sarkodie, V.Y.O.; Kebonye, N.M.; Kingsley, J. Trend analysis of global usage of digital soil mapping models in the prediction of potentially toxic elements in soil/sediments: A bibliometric review. Environ. Geochem. Health 2021, 43, 1715–1739. [Google Scholar] [CrossRef]
  6. Pobi, K.K.; Nayek, S.; Gope, M.; Rai, A.K.; Saha, R. Sources evaluation, ecological and health risk assessment of potential toxic metals (PTMs) in surface soils of an industrial area, India. Environ. Geochem. Health 2020, 42, 4159–4180. [Google Scholar] [CrossRef]
  7. Yadav, M.; George, N.; Dwibedi, V. Emergence of toxic trace elements in plant environment: Insights into potential of silica nanoparticles for mitigation of metal toxicity in plants. Environ. Pollut. 2023, 333, 122112. [Google Scholar] [CrossRef]
  8. Galhardi, J.A.; de Mello, J.W.; Wilkinson, K.J. Bioaccumulation of potentially toxic elements from the soils surrounding a legacy uranium mine in Brazil. Chemosphere 2020, 261, 127679. [Google Scholar] [CrossRef]
  9. Naimi, N.; Pilevar, Z.; Ranaei, V.; Mahmudiono, T.; Fakhri, Y.; Paseban, A.; Atamaleki, A.; Janghorban, F.; Khaneghah, A.M. The concentration of potentially toxic elements (PTEs) in apple fruit: A global systematic review, meta-analysis, and health risk assessment. Environ. Sci. Pollut. Res. 2022, 29, 54013–54024. [Google Scholar] [CrossRef] [PubMed]
  10. Zhang, H.; Pu, M.; Li, H.; Lu, B.; Zhang, X.; Li, S.; Zhao, C.; Pu, W.; Liu, R.; Guo, K.; et al. Progress and prospects for remediation of soil potentially toxic elements pollution: A state-of-the-art review. Environ. Technol. Innov. 2024, 35, 103703. [Google Scholar] [CrossRef]
  11. Jiang, F.; Ren, B.; Hursthouse, A.; Deng, R.; Wang, Z. Distribution, source identification, and ecological-health risks of potentially toxic elements (PTEs) in soil of thallium mine area (southwestern Guizhou, China). Environ. Sci. Pollut. Res. 2019, 26, 16556–16567. [Google Scholar] [CrossRef]
  12. Luo, X.; Ren, B.; Hursthouse, A.S.; Jiang, F.; Deng, R.-J. Potentially toxic elements (PTEs) in crops, soil, and water near Xiangtan manganese mine, China: Potential risk to health in the food chain. Environ. Geochem. Health 2020, 42, 1965–1976. [Google Scholar] [CrossRef] [PubMed]
  13. Terzano, R.; Rascio, I.; Allegretta, I.; Porfido, C.; Spagnuolo, M.; Khanghahi, M.Y.; Crecchio, C.; Sakellariadou, F.; Gattullo, C.E. Fire effects on the distribution and bioavailability of potentially toxic elements (PTEs) in agricultural soils. Chemosphere 2021, 281, 130752. [Google Scholar] [CrossRef] [PubMed]
  14. More, S.; Dhakate, R. Geogenic and anthropogenic sources of heavy metals in soil: An ecological and health risk assessment in the granitic terrain of South India. CATENA 2025, 254, 108960. [Google Scholar] [CrossRef]
  15. Safadoust, A.; Khaleghi, S.; Kolahchi, Z. Environmental risks of heavy metals in railway soils: Challenges to ecosystem management. Sci. Total. Environ. 2025, 974, 179217. [Google Scholar] [CrossRef]
  16. Wang, P.; Yu, F.; Lv, H.; Wu, L.; Zhou, H. Potential risk of heavy metals release in sediments and soils of the Yellow River Basin (Henan section): A perspective on bioavailability and bioaccessibility. Ecotoxicol. Environ. Saf. 2025, 291, 117799. [Google Scholar] [CrossRef]
  17. Sharafi, S.; Salehi, F. Comprehensive assessment of heavy metal (HMs) contamination and associated health risks in agricultural soils and groundwater proximal to industrial sites. Sci. Rep. 2025, 15, 7518. [Google Scholar] [CrossRef]
  18. Mondal, S.; Sen, A. Deciphering the consequences of heavy metals and metalloid hazard in agricultural soil of West Bengal: A comprehensive soil to health risk analysis. Sci. Total. Environ. 2025, 970, 178976. [Google Scholar] [CrossRef]
  19. Chen, X.; Luo, Z.; Wang, Z.; Zhang, W.; Wang, T.; Su, X.; Zeng, C.; Li, Z. Trade-offs between grain supply and soil conservation in the Grain for Green Program under changing climate: A case study in the Three Gorges Reservoir region. Sci. Total. Environ. 2024, 945, 173786. [Google Scholar] [CrossRef]
  20. Lei, Q.; Qi, C.; Ye, C.; Fang, G. Health shock, the Green for Grain Program and medical expenses: Empirical Evidence on the well-being of Chinese Farmers. Econ. Anal. Policy 2023, 78, 406–418. [Google Scholar] [CrossRef]
  21. Chen, L.; Beiyuan, J.; Hu, W.; Zhang, Z.; Duan, C.; Cui, Q.; Zhu, X.; He, H.; Huang, X.; Fang, L. Phytoremediation of potentially toxic elements (PTEs) contaminated soils using alfalfa (Medicago sativa L.): A comprehensive review. Chemosphere 2022, 293, 133577. [Google Scholar] [CrossRef]
  22. Peco, J.D.; Higueras, P.; Campos, J.A.; Esbrí, J.M.; Moreno, M.M.; Battaglia-Brunet, F.; Sandalio, L.M. Abandoned Mine Lands Reclamation by Plant Remediation Technologies. Sustainability 2021, 13, 6555. [Google Scholar] [CrossRef]
  23. Liu, L.; Wang, J.; Zhai, J.; Yan, D.; Lin, Z. Regional disparities and technological approaches in heavy metal remediation: A comprehensive analysis of soil contamination in Asia. Chemosphere 2024, 366, 143485. [Google Scholar] [CrossRef] [PubMed]
  24. Cheng, J.; Ding, C.; Li, X.; Zhang, T.; Wang, X. Heavy metals in navel orange orchards of Xinfeng County and their transfer from soils to navel oranges. Ecotoxicol. Environ. Saf. 2015, 122, 153–158. [Google Scholar] [CrossRef] [PubMed]
  25. Nowack, B.; Schulin, R.; Luster, J. Metal fractionation in a contaminated soil after reforestation: Temporal changes versus spatial variability. Environ. Pollut. 2010, 158, 3272–3278. [Google Scholar] [CrossRef]
  26. Römkens, P.; Bouwman, L.; Boon, G. Effect of plant growth on copper solubility and speciation in soil solution samples. Environ. Pollut. 1999, 106, 315–321. [Google Scholar] [CrossRef]
  27. Chen, H.; Tian, Y.; Cai, Y.; Liu, Q.; Ma, J.; Wei, Y.; Yang, A. A 50-year systemic review of bioavailability application in Soil environmental criteria and risk assessment. Environ. Pollut. 2023, 335, 122272. [Google Scholar] [CrossRef]
  28. Shi, B.; Meng, J.; Wang, T.; Li, Q.; Zhang, Q.; Su, G. The main strategies for soil pollution apportionment: A review of the numerical methods. J. Environ. Sci. 2024, 136, 95–109. [Google Scholar] [CrossRef]
  29. Wei, D.; Yang, S.; Zou, L.; Torres-Martínez, J.A.; Zheng, Y.; Hu, Q.; Zhang, Y. Appraisal of potential toxic elements pollution, sources apportionment, and health risks in groundwater from a coastal area of SE China. J. Environ. Manag. 2025, 377, 124691. [Google Scholar] [CrossRef]
  30. Xie, Z.; Liu, W.; Chen, S.; Yao, R.; Yang, C.; Zhang, X.; Li, J.; Wang, Y.; Zhang, Y. Machine learning approaches to identify hydrochemical processes and predict drinking water quality for groundwater environment in a metropolis. J. Hydrol. Reg. Stud. 2025, 58, 102227. [Google Scholar] [CrossRef]
  31. Zhao, P.; Wang, Y.; Xie, Y.; Uddin, G.; Xu, Z.; Chang, X.; Zhang, Y. Landslide susceptibility assessment using information quantity and machine learning integrated models: A case study of Sichuan province, southwestern China. Earth Sci. Informatics 2025, 18, 190. [Google Scholar] [CrossRef]
  32. Razum, I.; Pavlaković, S.M.; Rubinić, V.; Durn, G. New soil weathering index based on compositional data analyses of silt to sand sized parent mineral assemblages of terra rossa soils. J. Geochem. Explor. 2024, 263, 107513. [Google Scholar] [CrossRef]
  33. Tepanosyan, G.; Poghosyan, Z.; Sahakyan, L. Identification of spatial clusters of potentially toxic elements in different soil types using unsupervised machine learning and compositional data analysis. Soil Environ. Health 2024, 2, 100085. [Google Scholar] [CrossRef]
  34. Wang, Y.; Yuan, X.; Zhang, Y.; Zhang, X.; Xiao, Y.; Duo, J.; Huang, X.; Sun, M.; Lv, G. Hydrochemical, D–O–Sr isotopic and electromagnetic characteristics of geothermal waters from the Erdaoqiao area, SW China: Insights into genetic mechanism and scaling potential. Ore Geol. Rev. 2023, 158, 105486. [Google Scholar] [CrossRef]
  35. Deng, L.; Shangguan, Z.-P.; Li, R. Effects of the grain-for-green program on soil erosion in China. Int. J. Sediment Res. 2012, 27, 120–127. [Google Scholar] [CrossRef]
  36. Nde, S.C.; Palamuleni, L.G.; Aruwajoye, G.S.; Massoukou, R.Y.M.; Richard, G.; Felicite, O.M.; Bett, S.K. Human health risk assessment of potentially toxic elements in soils and rice grains (Oryza sativa) using a combination of probabilistic indices and carcinogenic risk modelling. J. Hazard. Mater. Adv. 2025, 18, 100664. [Google Scholar] [CrossRef]
  37. Siddig, M.M.; Brevik, E.C.; Sauer, D. Human health risk assessment from potentially toxic elements in the soils of Sudan: A meta-analysis. Sci. Total Environ. 2025, 958, 178196. [Google Scholar] [CrossRef]
  38. Moriarity, R.J.; Wilton, M.J.; Tsuji, L.J.; Sarkar, A.; Liberda, E.N. Evaluating human health risks from exposure to agricultural soil contaminants using one- and two-dimensional Monte Carlo simulations. Environ. Res. 2025, 265, 120391. [Google Scholar] [CrossRef]
  39. Shen, H.; Li, X.; Dong, J.; Zheng, X.; Jiang, Y.; Jin, P.; Kui, X.; Liu, H.; Zhang, X.; Yan, X. Risk assessment based on Cr, Mn, Co, Ni, Cu, Zn, Ba, Pb, and Sc contents in soils and blood Pb levels in children: Seasonable variations and Monte Carlo simulations. Soil Environ. Health 2025, 3, 100131. [Google Scholar] [CrossRef]
  40. Čakmak, D.; Perović, V.; Pavlović, D.; Matić, M.; Jakšić, D.; Tanirbergenov, S.; Pavlović, P. Development of optimisation methods to identify sources of pollution and assess potential health risks in the vicinity of antimony mines. Env. Geochem. Health 2025, 47, 73. [Google Scholar] [CrossRef]
  41. Khan, M.U.; Rai, N.; Shahwaar, M.; Musahib, M.; Rahman, A. Understanding arsenic and manganese enrichment in the aquifers of the Ghaghara river basin, Middle Gangetic Plain (MGP), India: A multivariate statistical, compositional data analysis (CoDA), and receptor model approach. J. Geochem. Explor. 2024, 264, 107532. [Google Scholar] [CrossRef]
  42. Ali, W.; Muhammad, S. Compositional data analysis of heavy metal contamination and eco-environmental risks in Himalayan agricultural soils, northern Pakistan. J. Geochem. Explor. 2023, 255, 107323. [Google Scholar] [CrossRef]
  43. Tepanosyan, G.; Sahakyan, L.; Maghakyan, N.; Saghatelyan, A. Combination of compositional data analysis and machine learning approaches to identify sources and geochemical associations of potentially toxic elements in soil and assess the associated human health risk in a mining city. Environ. Pollut. 2020, 261, 114210. [Google Scholar] [CrossRef] [PubMed]
  44. Liu, Z.; Wang, L.; Yan, M.; Ma, B.; Cao, R. Source apportionment of soil heavy metals based on multivariate statistical analysis and the PMF model: A case study of the Nanyang Basin, China. Environ. Technol. Innov. 2024, 33, 103537. [Google Scholar] [CrossRef]
  45. Zhang, Y.; Yan, Y.; Yao, R.; Wei, D.; Huang, X.; Luo, M.; Wei, C.; Chen, S.; Yang, C. Natural background levels, source apportionment and health risks of potentially toxic elements in groundwater of highly urbanized area. Sci. Total Environ. 2024, 935, 173276. [Google Scholar] [CrossRef]
  46. Mai, X.; Tang, J.; Tang, J.; Zhu, X.; Yang, Z.; Liu, X.; Zhuang, X.; Feng, G.; Tang, L. Research progress on the environmental risk assessment and remediation technologies of heavy metal pollution in agricultural soil. J. Environ. Sci. 2025, 149, 1–20. [Google Scholar] [CrossRef]
  47. Xiang, Q.; Yu, H.; Chu, H.; Hu, M.; Xu, T.; Xu, X.; He, Z. The potential ecological risk assessment of soil heavy metals using self-organizing map. Sci. Total Environ. 2022, 843, 156978. [Google Scholar] [CrossRef]
  48. Korkanç, S.Y.; Korkanç, M.; Amiri, A.F. Effects of land use/cover change on heavy metal distribution of soils in wetlands and ecological risk assessment. Sci. Total. Environ. 2024, 923, 171603. [Google Scholar] [CrossRef] [PubMed]
  49. Fei, X.; Lou, Z.; Sheng, M.; Xiaonan, L.; Ren, Z.; Xiao, R. Source-oriented stochastic health risk assessment of toxic metals in soil via a hybrid model and Monte Carlo simulation. Ecotoxicol. Environ. Saf. 2024, 286, 117209. [Google Scholar] [CrossRef]
  50. Panqing, Y.; Abliz, A.; Xiaoli, S.; Aisaiduli, H. Human health-risk assessment of heavy metal–contaminated soil based on Monte Carlo simulation. Sci. Rep. 2023, 13, 7033. [Google Scholar] [CrossRef]
  51. Zhang, Y.; Dai, Y.; Wang, Y.; Huang, X.; Xiao, Y.; Pei, Q. Hydrochemistry, quality and potential health risk appraisal of nitrate enriched groundwater in the Nanchong area, southwestern China. Sci. Total. Environ. 2021, 784, 147186. [Google Scholar] [CrossRef]
  52. Kravchenko, E.; Minkina, T.; Mandzhieva, S.; Bauer, T.; Lacynnik, E.; Wong, M.H.; Nazarenko, O. Ecological and health risk assessments of heavy metal contamination in soils surrounding a coal power plant. J. Hazard. Mater. 2025, 484, 136751. [Google Scholar] [CrossRef]
  53. Ma, J.; Ren, W.; Dai, S.; Wang, H.; Chen, S.; Song, J.; Jia, J.; Chen, H.; Tan, C.; Sui, Y.; et al. Spatial distribution and ecological-health risks associated with herbicides in soils and crop kernels of the black soil region in China. Sci. Total. Environ. 2024, 908, 168439. [Google Scholar] [CrossRef]
  54. Li, R.; Yan, Y.; Xu, J.; Yang, C.; Chen, S.; Wang, Y.; Zhang, Y. Evaluate the groundwater quality and human health risks for sustainable drinking and irrigation purposes in mountainous region of Chongqing, Southwest China. J. Contam. Hydrol. 2024, 264, 104344. [Google Scholar] [CrossRef] [PubMed]
  55. Guo, G.; Wang, Y.; Zhang, D.; Lei, M. Source-specific ecological and health risks of potentially toxic elements in agricultural soils in Southern Yunnan Province and associated uncertainty analysis. J. Hazard. Mater. 2021, 417, 126144. [Google Scholar] [CrossRef]
  56. Environmental Biotechnology: For Sustainable Future; Springer: Singapore, 2019. [CrossRef]
  57. Chen, H.; Teng, Y.; Lu, S.; Wang, Y.; Wang, J. Contamination features and health risk of soil heavy metals in China. Sci. Total Environ. 2015, 512–513, 143–153. [Google Scholar] [CrossRef] [PubMed]
  58. Guo, G.; Wu, F.; Xie, F.; Zhang, R. Spatial distribution and pollution assessment of heavy metals in urban soils from southwest China. J. Environ. Sci. 2012, 24, 410–418. [Google Scholar] [CrossRef] [PubMed]
  59. DZ/T 0258-2014; Specification for Multi-Purpose Regional Geochemical Survey (1:250,000). Ministry of Land and Resources of the People’s Republic of China: Beijing, China, 2014.
  60. Rao, L.; Zheng, C.; Chen, J.-B.; Cai, J.-Z.; Yang, Z.-B.; Xu, X.-X.; Lv, G.-C.; Xu, C.-L.; Wang, G.-Y.; Man, Y.-B.; et al. Ecological and human health hazards of soil heavy metals after wildfire: A case study of Liangshan Yi autonomous prefecture, China. Chemosphere 2024, 352, 141506. [Google Scholar] [CrossRef]
  61. Yang, Y.; Lu, X.; Yu, B.; Wang, Z.; Wang, L.; Lei, K.; Zuo, L.; Fan, P.; Liang, T. Exploring the environmental risks and seasonal variations of potentially toxic elements (PTEs) in fine road dust in resource-based cities based on Monte Carlo simulation, geo-detector and random forest model. J. Hazard. Mater. 2024, 473, 134708. [Google Scholar] [CrossRef]
  62. Luo, J.; Feng, S.; Ning, W.; Liu, Q.; Cao, M. Integrated source analysis and network ecological risk assessment of soil heavy metals in Qinghai–Tibet plateau pastoral regions. J. Hazard. Mater. 2025, 490, 137780. [Google Scholar] [CrossRef]
  63. Muller, G. Index of Geoaccumulation in Sediments of the Rhine River. GeoJournal 1969, 2, 108–118. [Google Scholar]
  64. Hakanson, L. An ecological risk index for aquatic pollution control. A sedimentological approach. Water Res. 1980, 14, 975–1001. [Google Scholar] [CrossRef]
  65. Nematollahi, M.J.; Keshavarzi, B.; Zaremoaiedi, F.; Rajabzadeh, M.A.; Moore, F. Ecological-health risk assessment and bioavailability of potentially toxic elements (PTEs) in soil and plant around a copper smelter. Environ. Monit. Assess. 2020, 192, 639. [Google Scholar] [CrossRef] [PubMed]
  66. Zhang, Q.; Wang, H.; Xu, Z.; Li, G.; Yang, M.; Liu, J. Quantitative identification of groundwater contamination sources by combining isotope tracer technique with PMF model in an arid area of northwestern China. J. Environ. Manag. 2023, 325, 116588. [Google Scholar] [CrossRef]
  67. US EPA. Exposure Factors Handbook; U.S. Environmental Protection Agency: Washington, DC, USA, 1997.
  68. McKinney, W. Data structures for statistical computing in python. In Proceedings of the 9th Python in Science Conference, Austin, TX, USA, 28 June–3 July 2010; Volume 445, pp. 51–56. [Google Scholar] [CrossRef]
  69. Harris, C.R.; Millman, K.J.; van der Walt, S.J.; Gommers, R.; Virtanen, P.; Cournapeau, D.; Wieser, E.; Taylor, J.; Berg, S.; Smith, N.J.; et al. Array programming with NumPy. Nature 2020, 585, 357–362. [Google Scholar] [CrossRef]
  70. Virtanen, P.; Gommers, R.; Oliphant, T.E.; Haberland, M.; Reddy, T.; Cournapeau, D.; Burovski, E.; Peterson, P.; Weckesser, W.; Bright, J.; et al. SciPy 1.0 Contributors. SciPy 1.0 Fundamental algorithms for scientific computing in Python. Nat. Methods 2020, 17, 261–272. [Google Scholar] [CrossRef] [PubMed]
  71. Hunter, J.D. Matplotlib: A 2D graphics environment. Comput. Sci. Eng. 2007, 9, 90–95. [Google Scholar] [CrossRef]
  72. Wang, J.; Yuan, J.; Hou, Q.; Yang, Z.; You, Y.; Yu, T.; Ji, J.; Dou, L.; Ha, X.; Sheng, W.; et al. Distribution of potentially toxic elements in soils and sediments in Pearl River Delta, China: Natural versus anthropogenic source discrimination. Sci. Total. Environ. 2023, 903, 166573. [Google Scholar] [CrossRef]
  73. He, L.; Wu, C.; Zeng, D.; Chen, X.; Sun, B. Distribution of Heavy Metals and Ecological Risk of Soils in the Typical Geological Background Region of Southwest China. Rock Miner. Anal. 2021, 40, 384–396. [Google Scholar]
  74. Wang, Y.; Zhang, Z.; Li, Y.; Liang, C.; Huang, H.; Wang, S. Available heavy metals concentrations in agricultural soils: Relationship with soil properties and total heavy metals concentrations in different industries. J. Hazard. Mater. 2024, 471, 134410. [Google Scholar] [CrossRef]
  75. Sharma, U.C.; Datta, M.; Sharma, V. Soil Acidity: Management Options for Higher Crop Productivity; Springer Nature: Cham, Switzerland, 2025. [Google Scholar] [CrossRef]
  76. Xiang, M.; Li, Y.; Yang, J.; Lei, K.; Li, Y.; Li, F.; Zheng, D.; Fang, X.; Cao, Y. Heavy metal contamination risk assessment and correlation analysis of heavy metal contents in soil and crops. Environ. Pollut. 2021, 278, 116911. [Google Scholar] [CrossRef]
  77. Bonifacio, E.; Falsone, G.; Piazza, S. Linking Ni and Cr concentrations to soil mineralogy: Does it help to assess metal contamination when the natural background is high? J. Soils Sediments 2010, 10, 1475–1486. [Google Scholar] [CrossRef]
  78. Hu, Z.; Wu, Z.; Luo, W.; Liu, S.; Tu, C. Spatial distribution, risk assessment, and source apportionment of soil heavy metals in a karst county based on grid survey. Sci. Total. Environ. 2024, 953, 176049. [Google Scholar] [CrossRef]
  79. Kelepertzis, E.; Galanos, E.; Mitsis, I. Origin, mineral speciation and geochemical baseline mapping of Ni and Cr in agricultural topsoils of Thiva Valley (central Greece). J. Geochem. Explor. 2013, 125, 56–68. [Google Scholar] [CrossRef]
  80. Liu, H.; Zhang, Y.; Yang, J.; Wang, H.; Li, Y.; Shi, Y.; Li, D.; Holm, P.E.; Ou, Q.; Hu, W. Quantitative source apportionment, risk assessment and distribution of heavy metals in agricultural soils from southern Shandong Peninsula of China. Sci. Total Environ. 2021, 767, 144879. [Google Scholar] [CrossRef] [PubMed]
  81. Zhu, Y.; Hou, K.; Liu, J.; Zhang, L.; Yang, K.; Li, Y.; Yuan, B.; Li, R.; Xue, Y.; Li, H.; et al. Multimodel-based quantitative source apportionment and risk assessment of soil heavy metals: A reliable method to achieve regional pollution traceability and management. Sci. Total Environ. 2024, 956, 177368. [Google Scholar] [CrossRef]
  82. Zhou, W.; Yu, R.; Guo, F.; Shen, C.; Liu, Y.; Huang, Y. Source apportionment and risk assessment of soil heavy metals in the Huangshui River Basin using a hybrid model. Ecol. Indic. 2024, 160, 111906. [Google Scholar] [CrossRef]
  83. Qiao, P.; Wang, S.; Lei, M.; Guo, G.; Yang, J.; Wei, Y.; Gou, Y.; Li, P.; Zhang, Z. Influencing factors identification and the nested structure analysis of heavy metals in soils in entire city and surrounding the multiple pollution sources. J. Hazard. Mater. 2023, 449, 130961. [Google Scholar] [CrossRef] [PubMed]
  84. Zhang, Y.; Jiang, B.; Gao, Z.; Wang, M.; Feng, J.; Xia, L.; Liu, J. Health risk assessment of soil heavy metals in a typical mining town in north China based on Monte Carlo simulation coupled with Positive matrix factorization model. Environ. Res. 2024, 251, 118696. [Google Scholar] [CrossRef]
  85. Łukaszek-Chmielewska, A.; Rakowska, J.; Rachwał, M.; Stawarz, O. Assessment of forest soil contamination by heavy metals in the Polish National Park near Warsaw. Sci. Rep. 2025, 15, 4099. [Google Scholar] [CrossRef]
  86. Zhang, Y.; Shang, P.; Wang, J.; Norris, P.; Romero, C.E.; Pan, W.-P. Trace element (Hg, As, Cr, Cd, Pb) distribution and speciation in coal-fired power plants. Fuel 2017, 208, 647–654. [Google Scholar] [CrossRef]
  87. Gałuszka, A. Different Approaches in Using and Understanding the Term “Geochemical Background”–Practical Implications for Environmental Studies. Pol. J. Environ. Stud. 2006, 16, 3. [Google Scholar]
  88. Prasad, S.; Yadav, K.K.; Kumar, S.; Gupta, N.; Cabral-Pinto, M.M.; Rezania, S.; Radwan, N.; Alam, J. Chromium contamination and effect on environmental health and its remediation: A sustainable approaches. J. Environ. Manag. 2021, 285, 112174. [Google Scholar] [CrossRef] [PubMed]
  89. Liu, S.; Wang, X.; Guo, G.; Yan, Z. Status and environmental management of soil mercury pollution in China: A review. J. Environ. Manag. 2021, 277, 111442. [Google Scholar] [CrossRef]
  90. Zhao, B.; O’Connor, D.; Zhang, H.; Jin, Y.; Wang, Y.; Yang, X.; Hou, R.; Hou, D. Assessing mercury pollution at a primary ore site with both ancient and industrial mining and smelting activities. Environ. Pollut. 2023, 336, 122413. [Google Scholar] [CrossRef] [PubMed]
  91. Yang, J.; Ma, H.; Zhang, R.; Ji, W. Effects of “Grain for Green” program on soil hydraulic properties: A meta-analysis. Geoderma 2025, 453, 117130. [Google Scholar] [CrossRef]
  92. Khan, A.; Khan, M.S.; Hadi, F.; Khan, Q.; Ali, K.; Saddiq, G. Risk assessment and soil heavy metal contamination near marble processing plants (MPPs) in district Malakand, Pakistan. Sci. Rep. 2024, 14, 21533. [Google Scholar] [CrossRef]
  93. Man, Y.B.; Sun, X.L.; Zhao, Y.G.; Lopez, B.N.; Chung, S.S.; Wu, S.C.; Cheung, K.C.; Wong, M.H. Health risk assessment of abandoned agricultural soils based on heavy metal contents in Hong Kong, the world’s most populated city. Environ. Int. 2010, 36, 570–576. [Google Scholar] [CrossRef]
  94. Olawoyin, R.; Oyewole, S.A.; Grayson, R.L. Potential risk effect from elevated levels of soil heavy metals on human health in the Niger delta. Ecotoxicol. Environ. Saf. 2012, 85, 120–130. [Google Scholar] [CrossRef]
  95. Zhang, Y.; Jiang, B.; Gao, Z.; Liu, J. Source-specific probabilistic health risk judgement of soil heavy metals in a typical resource-based town in North China. Ecol. Indic. 2024, 169, 112854. [Google Scholar] [CrossRef]
  96. Cai, L.-M.; Wang, Q.-S.; Luo, J.; Chen, L.-G.; Zhu, R.-L.; Wang, S.; Tang, C.-H. Heavy metal contamination and health risk assessment for children near a large Cu-smelter in central China. Sci. Total Environ. 2019, 650, 725–733. [Google Scholar] [CrossRef]
  97. de Carvalho, M.R.; de Almeida, T.A.; Van Opbergen, G.A.Z.; Bispo, F.H.A.; Botelho, L.; de Lima, A.B.; Marchiori, P.E.R.; Guilherme, L.R.G. Arsenic, cadmium, and chromium concentrations in contrasting phosphate fertilizers and their bioaccumulation by crops: Towards a green label? Environ. Res. 2024, 263, 120171. [Google Scholar] [CrossRef] [PubMed]
  98. Guo, G.; Chen, S.; Lei, M.; Wang, L.; Yang, J.; Qiao, P. Spatiotemporal distribution characteristics of potentially toxic elements in agricultural soils across China and associated health risks and driving mechanism. Sci. Total Environ. 2023, 887, 163897. [Google Scholar] [CrossRef]
  99. Suciu, N.A.; De Vivo, R.; Rizzati, N.; Capri, E. Cd content in phosphate fertilizer: Which potential risk for the environment and human health? Curr. Opin. Environ. Sci. Health 2022, 30, 100392. [Google Scholar] [CrossRef]
  100. Jiao, W.; Chen, W.; Chang, A.C.; Page, A.L. Environmental risks of trace elements associated with long-term phosphate fertilizers applications: A review. Environ. Pollut. 2012, 168, 44–53. [Google Scholar] [CrossRef]
  101. Nziguheba, G.; Smolders, E. Inputs of trace elements in agricultural soils via phosphate fertilizers in European countries. Sci. Total Environ. 2008, 390, 53–57. [Google Scholar] [CrossRef] [PubMed]
  102. Gao, L.; Wang, Z.; Li, S.; Chen, J. Bioavailability and toxicity of trace metals (Cd, Cr, Cu, Ni, and Zn) in sediment cores from the Shima River, South China. Chemosphere 2018, 192, 31–42. [Google Scholar] [CrossRef]
  103. Li, Y.; Rahman, S.U.; Qiu, Z.; Shahzad, S.M.; Nawaz, M.F.; Huang, J.; Naveed, S.; Li, L.; Wang, X.; Cheng, H. Toxic effects of cadmium on the physiological and biochemical attributes of plants, and phytoremediation strategies: A review. Environ. Pollut. 2023, 325, 121433. [Google Scholar] [CrossRef] [PubMed]
  104. Nour, H.; Ramadan, F.; Wahed, N.A.; Rakha, A. Spatial distribution and contamination of specific heavy metals in the sediment of Bahr Mouse, Egypt. Egypt. J. Chem. 2024, 67, 99–109. [Google Scholar] [CrossRef]
  105. Deng, W.; Hao, G.; Liu, W. Source-specific risks apportionment and critical sources identification of potentially harmful elements in urban road dust combining positive matrix factorization model with multiple attribute decision making method. Ecol. Indic. 2022, 144, 109449. [Google Scholar] [CrossRef]
  106. Jin, Z.; Lv, J. Evaluating source-oriented human health risk of potentially toxic elements: A new exploration of multiple age groups division. Sci. Total Environ. 2021, 787, 147502. [Google Scholar] [CrossRef]
  107. Rocha, F.; Ratola, N.; Homem, V. Heavy metal(loid)s and nutrients in sewage sludge in Portugal–Suitability for use in agricultural soils and assessment of potential risks. Sci. Total Environ. 2025, 964, 178595. [Google Scholar] [CrossRef] [PubMed]
  108. Wu, Z.-Q.; Li, H.-Y.; Lu, L.-Y.; Liang, G.-J.; Wu, T.-T.; Zhu, J.-X. Distributions and risk assessment of heavy metals in solid waste in lead-zinc mining areas and across the soil water body sediment agricultural product ecosystem in their surrounding areas. China Geol. 2024, 7, 92–106. [Google Scholar] [CrossRef]
  109. Yang, J.; Han, Z.; Yan, Y.; Guo, G.; Wang, L.; Shi, H.; Liao, X. Neglected pathways of heavy metal input into agricultural soil: Water–land migration of heavy metals due to flooding events. Water Res. 2024, 267, 122469. [Google Scholar] [CrossRef]
  110. Castañeda, M.; Avila, B.S.; Ríos, S.E.G.; Peñuela, G.A. Levels of heavy metals in tropical fruits and soils from agricultural crops in Antioquia, Colombia. A probabilistic assessment of health risk associated with their consumption. Food Humanit. 2025, 4, 100503. [Google Scholar] [CrossRef]
  111. Eliyan, C.; McConville, J.; Zurbrügg, C.; Koottatep, T.; Sothea, K.; Vinnerås, B. Heavy metal contamination of faecal sludge for agricultural production in Phnom Penh, Cambodia. J. Environ. Manag. 2024, 349, 119436. [Google Scholar] [CrossRef]
  112. Suh, G.C.; Afahnwie, N.A.; Tiabou, A.F.; Djibril, K.N.G.; Meniemoh, A.R.; Yiika, L.P. Source apportionment, ecological and toxicological risk assessment of trace metals in agricultural soils of Wabane, South West Region, Cameroon. J. Trace Elements Miner. 2025, 12, 100218. [Google Scholar] [CrossRef]
  113. Khodrani, N.E.; Omrania, S.; Zouahri, A.; Douaik, A.; Iaaich, H.; Yahyaoui, A.; Fekhaoui, M. Spatial Distribution and Mapping of Heavy Metals in Agricultural Soils of the Sfafaa region (Gharb, Morocco). Mater. Today Proc. 2019, 13, 832–840. [Google Scholar] [CrossRef]
  114. Barsova, N.; Yakimenko, O.; Tolpeshta, I.; Motuzova, G. Current state and dynamics of heavy metal soil pollution in Russian Federation—A review. Environ. Pollut. 2019, 249, 200–207. [Google Scholar] [CrossRef]
  115. Suska-Malawska, M.; Vyrakhamanova, A.; Ibraeva, M.; Poshanov, M.; Sulwiński, M.; Toderich, K.; Mętrak, M. Spatial and In-Depth Distribution of Soil Salinity and Heavy Metals (Pb, Zn, Cd, Ni, Cu) in Arable Irrigated Soils in Southern Kazakhstan. Agronomy 2022, 12, 1207. [Google Scholar] [CrossRef]
  116. Ramazanova, E.; Lee, S.H.; Lee, W. Stochastic risk assessment of urban soils contaminated by heavy metals in Kazakhstan. Sci. Total. Environ. 2021, 750, 141535. [Google Scholar] [CrossRef]
  117. Obada, M.C.C.; Oliveira, M.E.F.Z.; Elguera, N.Y.M.; Pulcha, S.E.S.; Banda, A.A.P.; Ortiz, J.A.Q.; Murillo, V.S.; Pacheco, H.G.J. Assessment of heavy metal contamination in surface sediments: Seasonal influence in the Majes-Camaná basin of the Arequipa region, Peru. Results Eng. 2025, 25, 103673. [Google Scholar] [CrossRef]
  118. Alharbi, T.; Nour, H.E.; El-Sorogy, A.S.; Al-Kahtany, K.; Giacobbe, S.; Alarifi, S.S. Evaluation of health risks and heavy metals toxicity in agricultural soils in Central Saudi Arabia. Environ. Monit. Assess. 2025, 197, 419. [Google Scholar] [CrossRef] [PubMed]
  119. Qi, C.; Hu, T.; Zheng, Y.; Wu, M.; Tang, F.H.M.; Liu, M.; Zhang, B.; Derrible, S.; Chen, Q.; Hu, G.; et al. Global and regional patterns of soil metal(loid) mobility and associated risks. Nat. Commun. 2025, 16, 2947. [Google Scholar] [CrossRef] [PubMed]
  120. Ma, Y.; Huang, L.; Li, J.; Cao, W.; Cai, Y. Carbon potential of China’s Grain to Green Program and its contribution to the carbon target. Resour. Conserv. Recycl. 2024, 200, 107272. [Google Scholar] [CrossRef]
  121. Persson, M.; Moberg, J.; Ostwald, M.; Xu, J. The Chinese Grain for Green Programme: Assessing the carbon sequestered via land reform. J. Environ. Manag. 2013, 126, 142–146. [Google Scholar] [CrossRef]
  122. Zhang, L. Understanding the new quality productive forces in the energy sector. Energy Nexus 2024, 16, 100352. [Google Scholar] [CrossRef]
  123. US EPA. Soil Screening Guidance: Technical Background Document; Superfund US EPA: Washington, DC, USA, 1996. [Google Scholar]
  124. HJ 25.3-2014; Technical Guidelines for Risk Assessment of Contaminated Sites. Ministry of Environmental Protection of the People’s Republic of China (MEPPRC): Beijing, China, 2014. (In Chinese)
  125. EPA/600/R-09/052F; Exposure Factors Handbook: 2011 Edition. National Center for Environmental Assessment Office of Research and Development U.S. Environmental Protection Agency (US EPA): Washington, DC, USA, 2011.
  126. US EPA. Region IX. Regional Screening Levels (Formerly PRGs); US EPA: San Francisco, CA, USA, 2013. Available online: http://www.epa.gov/region9/superfund/prg/ (accessed on 2 May 2025).
  127. Duan, X.L.; Zhao, X.G.; Wang, B.B.; Chen, Y.T.; Cao, S.Z. Highlight of the Chinese Exposure Factors Handbook (Adults); China Environmental Science Press: Beijing, China, 2014. [Google Scholar]
  128. Chen, G.; Wang, X.; Wang, R.; Liu, G. Health risk assessment of potentially harmful elements in subsidence water bodies using a Monte Carlo approach: An example from the Huainan coal mining area, China. Ecotoxicol. Environ. Saf. 2019, 171, 737–745. [Google Scholar] [CrossRef]
  129. OSWER 9355.4-24; Supplemental Guidance for Developing Soil Screening Levels for Superfund Sites. Office of Solid Waste and Emergency Response: Washington, DC, USA, 2001.
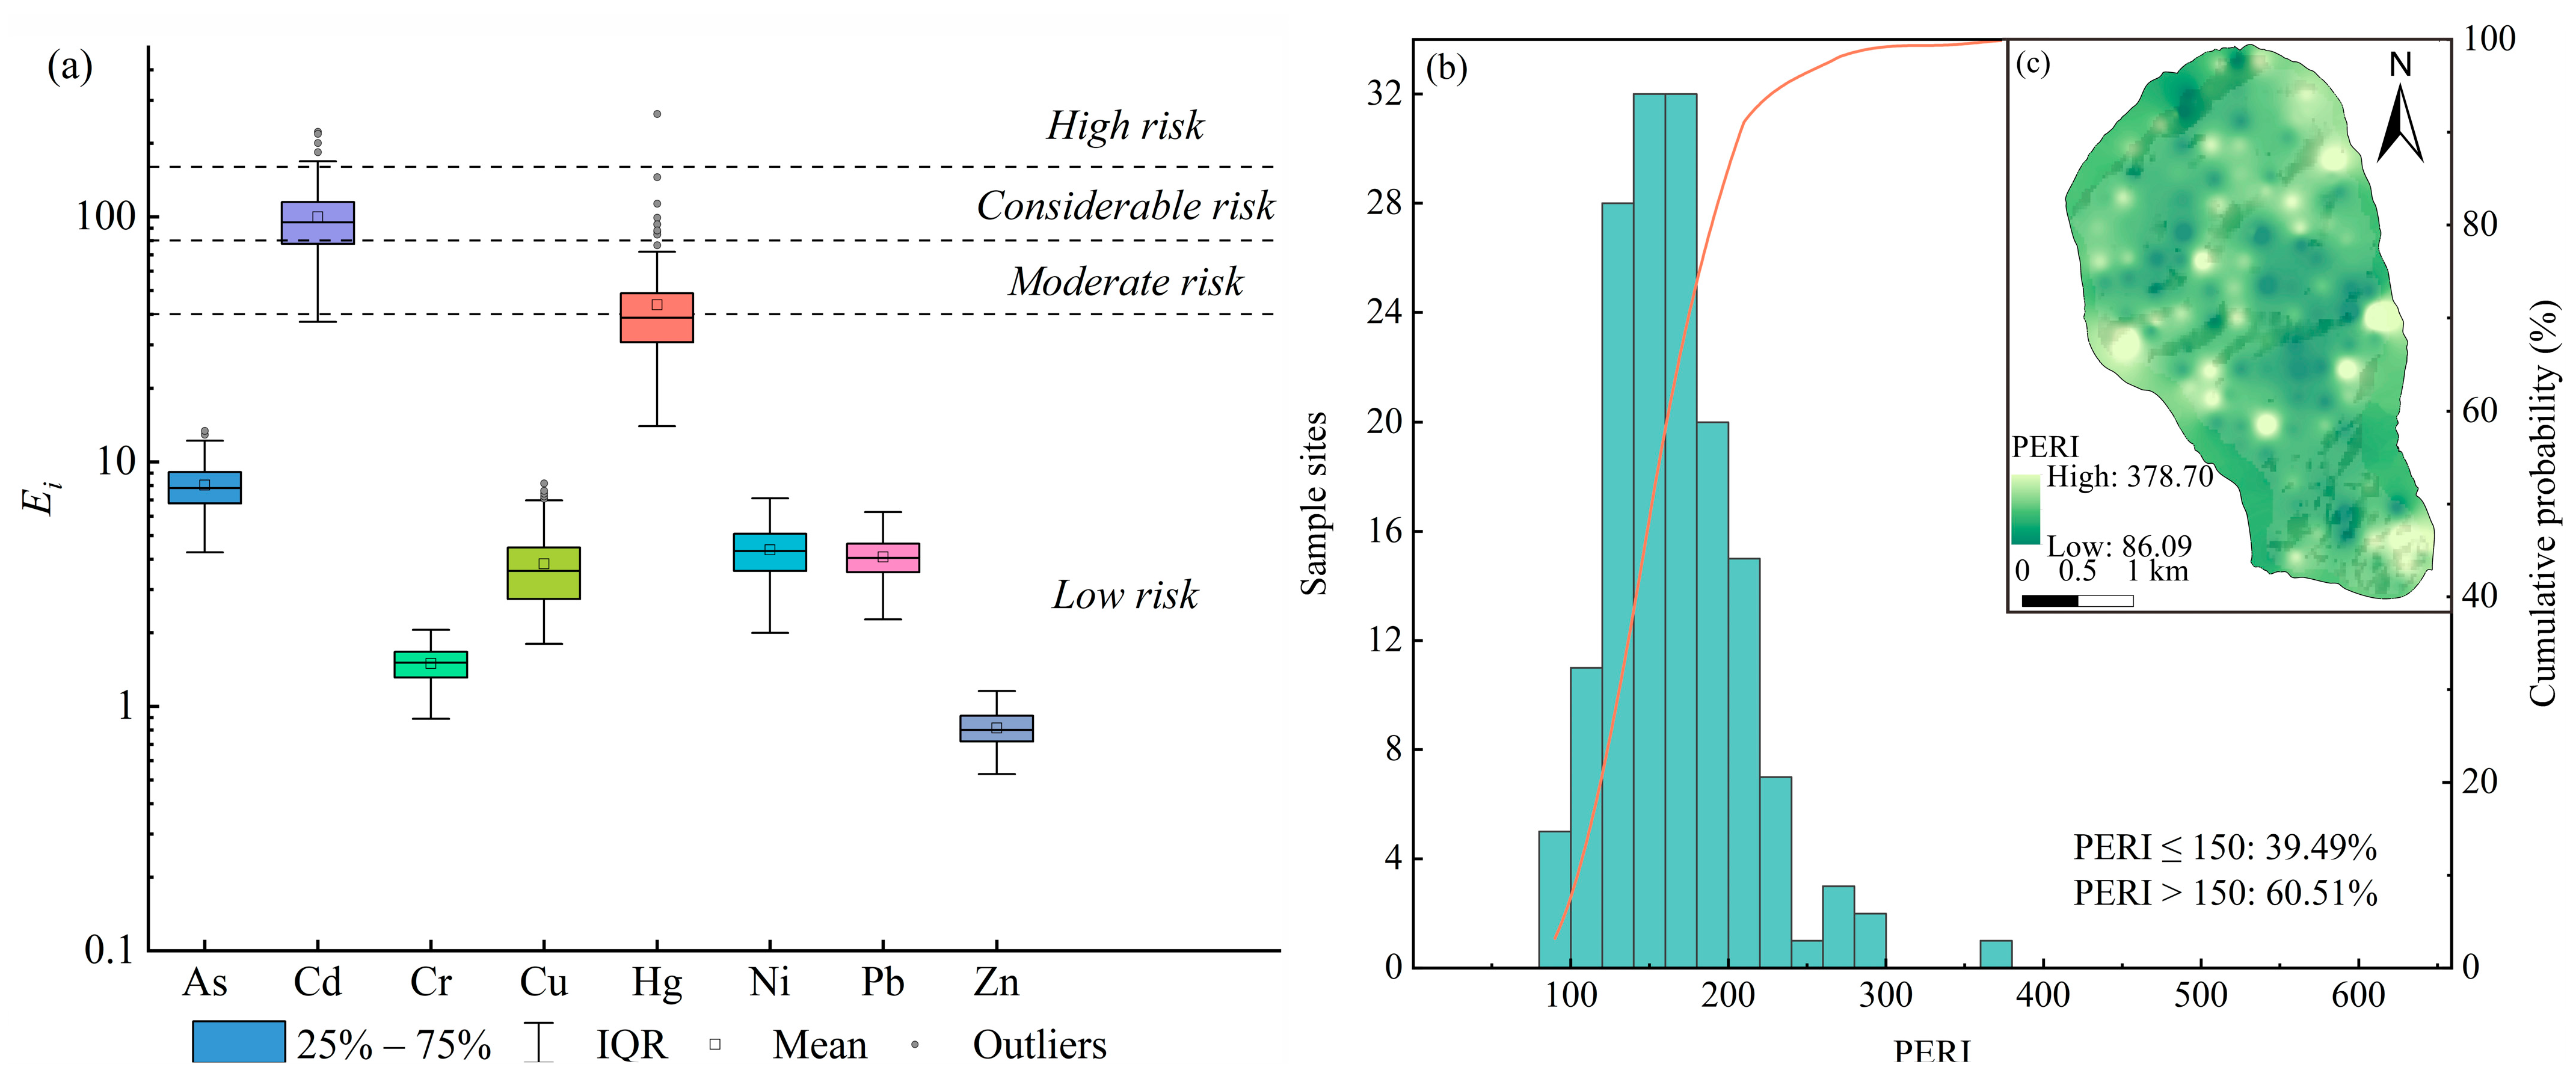
Figure 1. The location of the study area and sample sites. (a) Location of the study area in China. (b) The study area with the location of topsoil sample sites. (c) Geological map of the study area.
Land 14 01192 g001
Figure 2. The pollution levels of PTEs in the soils. (a) The box plots of Igeo for various PTEs, (b) the cumulative probability of INI, and (c) the geospatial pattern of INI.
Land 14 01192 g002
Figure 3. The geospatial distributions of the PTEs in the soils. (a) pH, (b) As, (c) Cd, (d) Cr, (e) Cu, (f) Hg, (g) Ni, (h) Pb, (i) Zn.
Land 14 01192 g003
Figure 4. The results of correlation analysis and PCA in the CoDa perspective.
Land 14 01192 g004
Figure 5. The results of source apportionment based on the PMF model.
Land 14 01192 g005
Figure 6. The potential ecological risk levels of PTEs in the soils. (a) The box plots of various Ei, (b) the cumulative probability of PERI, (c) the geospatial pattern of PERI.
Land 14 01192 g006
Figure 7. The characteristics of spatial distributions of health risk. (a) THI for children, (b) THI for adults, (c) TCR for children, and (d) TCR for adults.
Land 14 01192 g007
Figure 8. The results of the deterministic health risk model. (a) HI for As, (b) HI for Cd, (c) HI for Cr, (d) HI for Cu, (e) HI for Hg, (f) HI for Ni, (g) HI for Pb, (h) HI for Zn, and (i) THI.
Land 14 01192 g008
Figure 9. The results of the Monte Carlo simulation. (a) CR for As, (b) CR for Cd, (c) CR for Pb, and (d) TCR.
Land 14 01192 g009
Figure 10. The results of the sensitivity analysis. (a) Sensitivity analysis of non-carcinogenic health risk assessment for children and adults. (b) Sensitivity analysis of carcinogenic health risk assessment for children and adults.
Land 14 01192 g010
Figure 11. The levels of soil PTE concentrations (mg/kg) in different regions. (a) [107], (b) [108], (c) [18], (d) [109], (e) [110], (f) [111], (g) [112], (h) [113], (i) [114], (j) [115], (k) [116], (l) [116], (m) [117], (n) [118]. The red line is the boundaries between continents.
Land 14 01192 g011
Table 1. The classification of Ei and PERI.
EiPERIClassification
<40<150Low risk
40–80150–300Moderate risk
80–160300–600Considerable risk
160–320600–1200High risk
≥320≥1200Extremely high risk
Table 3. The statistical results of non-carcinogenic and carcinogenic risks.
PTEsPopulationNon-Carcinogenic RiskCarcinogenic Risk
MinMaxMeanMinMaxMean
AsChildren0.180.560.346.92 × 10−62.18 × 10−51.3 × 10−5
Adults2.52 × 10−27.92 × 10−24.75 × 10−23.89 × 10−61.22 × 10−57.33 × 10⁻⁶
CdChildren1.31 × 10−37.84 × 10−33.52 × 10−36.23 × 10−73.73 × 10−61.67 × 10⁻⁶
Adults1.95 × 10−41.17 × 10−35.24 × 10−43.5 × 10−72.1 × 10−69.41 × 10⁻⁷
CrChildren0.160.370.27---------
Adults2.35 × 10−25.44 × 10−23.96 × 10−2---------
CuChildren3.40 × 10−31.54 × 10−27.24 × 10−3---------
Adults4.78 × 10−42.17 × 10−31.02 × 10−3---------
HgChildren8.74 × 10−41.65 × 10−22.73 × 10−3---------
Adults1.24 × 10−42.34 × 10−33.87 × 10−4---------
NiChildren7.97 × 10−32.65 × 10−21.74 × 10−2---------
Adults1.14 × 10−33.79 × 10−32.49 × 10−3---------
PbChildren5.71 × 10−20.160.101.38 × 10−73.8 × 10−72.49 × 10−7
Adults8.04 × 10−32.21 × 10−21.45 × 10−28.11 × 10−82.23 × 10−71.46 × 10⁻⁷
ZnChildren1.86 × 10−34.07 × 10−42.87 × 10−3---------
Adults2.62 × 10−45.72 × 10−44.04 × 10−4---------
TotalChildren0.531.090.748.48 × 10−62.35 × 10−51.5 × 10−5
Adults0.070.160.114.77 × 10−61.32 × 10−58.42 × 10−6
Note: “---” refers to not being included in the associated calculation.
Disclaimer/Publisher’s Note: The statements, opinions and data contained in all publications are solely those of the individual author(s) and contributor(s) and not of MDPI and/or the editor(s). MDPI and/or the editor(s) disclaim responsibility for any injury to people or property resulting from any ideas, methods, instructions or products referred to in the content.

