Article

Does Ecotourism Really Benefit the Environment? A Trend Analysis of Forest Cover Loss in Indonesia

by
Saraswati Sisriany
* and
Katsunori Furuya
Graduate School of Horticulture, Chiba University, Chiba 271-8510, Japan
*
Author to whom correspondence should be addressed.
Land 2025, 14(6), 1237; https://doi.org/10.3390/land14061237
Submission received: 5 May 2025 / Revised: 29 May 2025 / Accepted: 6 June 2025 / Published: 9 June 2025
(This article belongs to the Section Land Planning and Landscape Architecture)

Abstract

:
Ecotourism is widely promoted as a sustainable tourism model that harmonizes environmental conservation with local community benefits. Indonesia, celebrated for its extraordinary biodiversity, has long adopted ecotourism as a strategy to safeguard its natural ecosystems. Despite this, evidence of its environmental impact at a national scale remains sparse. This study bridges this gap by examining forest loss trends from 2014 to 2023 across ecotourism sites in Indonesia to assess whether ecotourism contributes to forest protection. The analysis reveals that most ecotourism sites exhibit no significant reduction in forest loss, with some even experiencing accelerated deforestation. While a few sites demonstrate positive outcomes, these successes are rare and insufficient to indicate widespread environmental benefits. The findings call into question whether the ecotourism model, in its current form, is an effective conservation strategy. A reevaluation of its use is imperative, along with critical reflection on whether ecotourism is genuinely suited to addressing Indonesia’s deforestation challenges. This study underscores the need for alternative or complementary approaches to conservation, as well as a robust examination of ecotourism’s limitations and potential within the broader context of sustainable development.

1. Introduction

Recent studies underscore the complex dynamics of global forest loss, particularly in tropical regions where biodiversity and carbon storage are critical. While protected areas tend to have lower deforestation rates compared to unprotected lands, they remain vulnerable to threats such as agricultural encroachment, illegal logging, and infrastructure expansion [1,2]. Fire is a major contributor to global forest loss, accounting for 38% of total loss between 2003 and 2018, with significant regional variations, particularly in tropical forests where both natural and anthropogenic fires exacerbate deforestation [3].
In Indonesia, the drivers of forest loss reflect these global trends, with plantations and smallholder agriculture being primary contributors from 2012 to 2019 [4]. Despite this, the overall rate of deforestation in Indonesia has shown a gradual decline since 2012, attributed in part to strengthened policies and international conservation initiatives. However, forest loss in the region remains sensitive to non-market factors such as climate anomalies and policy shifts, as seen in other tropical countries like Brazil and the Democratic Republic of Congo [5,6]. These dynamics highlight the urgent need for adaptive and region-specific strategies to mitigate forest loss effectively.
In response to this environmental crisis, ecotourism has emerged as a potential solution that balances conservation with economic growth. Ecotourism is rooted in the principles of sustainable development, aiming to protect biodiversity while providing economic benefits to local communities [7]. Recognizing its potential, Indonesia has implemented policies to promote ecotourism as an alternative to extractive industries. Theoretically, ecotourism offers a pathway to forest conservation by creating financial incentives to protect natural landscapes and fostering environmentally responsible visitor behavior [8]. Despite these promises, the actual environmental impact of ecotourism remains underexplored, especially in the Indonesian context. Evidence on whether ecotourism effectively curbs deforestation or merely shifts environmental pressures to other areas is sparse and inconsistent [9].
This study addresses the critical knowledge gap by examining the relationship between ecotourism and forest cover changes in Indonesia. Through a combination of temporal and spatial analyses, it investigates whether ecotourism sites experience less deforestation compared to non-ecotourism areas. Additionally, this study seeks to identify specific ecotourism practices, such as visitor management strategies and waste disposal systems, that contribute to positive environmental outcomes. By exploring the conditions under which ecotourism succeeds or fails in promoting forest conservation, this research aims to provide evidence-based insights for policymakers and stakeholders.
Ultimately, this research will contribute to a growing body of knowledge on sustainable tourism and environmental conservation, offering practical recommendations for enhancing the effectiveness of ecotourism in Indonesia. It aspires to bridge the gap between ecotourism theory and practice, fostering a sustainable future for Indonesia’s invaluable forests and the diverse life they support.

2. Literature Review

2.1. Global Perspective on Ecotourism Outcomes

Globally, ecotourism has been recognized as a tool for both conservation and sustainable development, with mixed success in achieving its environmental objectives [10]. In Kenya, challenges such as marketing limitations, security concerns, and a lack of innovative strategies have impeded efforts to strengthen stakeholder linkages in ecotourism development [11]. A case study from Italy’s Monviso Transboundary Biosphere Reserve highlighted that while ecotourism facilitated stakeholder cooperation, its impact was constrained by negative public perceptions, potentially stemming from insufficient environmental education initiatives [12]. In Costa Rica, the Lapa Rios Eco-lodge showcased the dual benefits of ecotourism by supporting both community livelihoods and ecological restoration, evidenced by notable reforestation achievements [13]. Nonetheless, another investigation in Costa Rica presented a more complex picture, indicating that while ecotourism had some conservation benefits, legal frameworks were perceived to have a stronger role in curbing deforestation and wildlife exploitation [14].
However, several success stories provide optimism. In Costa Rica, ecotourism has supported biodiversity conservation by funding protected areas and promoting sustainable land-use practices, demonstrating the compatibility of tourism and ecological preservation when properly managed [15]. Community-based ecotourism initiatives in Kenya have empowered local populations to engage in wildlife conservation, reducing habitat loss and poaching [16]. In New Zealand, community-led ecological restoration initiatives have incorporated ecotourism as a mechanism to support conservation financing and environmental education, although their financial sustainability through tourism varies by location [17]. Comparable outcomes have been observed in Langkawi, Malaysia, where participatory ecotourism has contributed to the conservation of limestone forests by offering immersive, experiential learning opportunities [18]. The case of the Dadia-Lefkimi-Soufli Forest Reserve in Greece illustrates how WWF Greece employed ecotourism as a dual-purpose tool—supporting raptor conservation while addressing local socio-economic needs [19].
Global case studies reveal that ecotourism’s environmental benefits are not guaranteed and often depend on governance, community involvement, and education. Despite its potential, outcomes remain mixed, with many initiatives falling short of their conservation goals. These inconsistencies highlight the need for context-specific evaluation. This study responds to that need by examining whether ecotourism in Indonesia delivers on its environmental promises through an analysis of forest cover trends around ecotourism sites.

2.2. Ecotourism Benefits to the Environment in Indonesia

Building on global evidence that ecotourism can lead to both positive and negative environmental outcomes, Indonesia presents a similarly complex picture. Negative impacts often arise from exceeding the carrying capacity of ecotourism sites, causing ecosystem distress and habitat degradation [20]. Specific cases include pollution and habitat disturbances in regions such as the Tangkoko Dua Sudara Nature Reserve, where unchecked tourism has disrupted wildlife behavior [21]. Additionally, the opening of land for tourism or agriculture near ecotourism hotspots has contributed to ecosystem imbalance, as observed in Taman Wisata Alam Telogo Warno Telogo Pengilon [22].
However, positive environmental effects are also evident. Revenue from ecotourism has directly funded conservation efforts, aligning local community empowerment with sustainable development [23]. Initiatives in Bali, such as Tukad Bindu, highlight how ecotourism can mitigate negative impacts by promoting environmental awareness and responsible tourism behaviors [24]. Comprehensive management planning, as demonstrated in Indonesia’s national parks, has led to improved forest management and biodiversity protection [25]. Furthermore, community-based ecotourism models in rural areas have increased local environmental awareness and sustainable waste management practices, underscoring the role of education in fostering pro-conservation values [26].
Despite these findings, it is noteworthy that most studies on the environmental effects of ecotourism in Indonesia focus on localized case studies, with limited understanding of nationwide impacts. In contrast to international research that has begun to evaluate ecotourism’s cumulative or landscape-scale effects, Indonesia still lacks a comprehensive assessment. This study addresses that gap by using geospatial data to evaluate forest cover loss across ecotourism sites nationwide, offering an evidence-based understanding of whether ecotourism in Indonesia aligns with its environmental promise.

2.3. Methodological Approaches to Assessing Ecotourism

Understanding the environmental impacts of ecotourism requires the application of diverse and context-sensitive research methodologies. Case studies have been a cornerstone of ecotourism research, offering in-depth analyses of specific destinations to capture localized complexities and dynamics. For example, Chaplin & Brabyn (2013) used remote sensing and a Geographic Information System (GIS) to examine forest cover changes in the Annapurna Conservation Area, revealing how proximity to tourism villages influenced deforestation patterns [27]. Surveys and interviews are also valuable tools, providing qualitative and quantitative insights into the perceptions and experiences of stakeholders, including tourists, local communities, and park officials [15].
However, at the nationwide scale, conducting interviews and surveys can be logistically challenging and resource-intensive, especially in Indonesia, where the implementation of the One Map Policy (OMP) has revealed substantial barriers related to manual data collection, institutional fragmentation, and inconsistent spatial datasets [28,29]. Therefore, advanced technological approaches, such as remote sensing, are the most feasible alternative. Remote sensing and GIS enable the monitoring of land-use changes, forest cover, and ecological indicators across vast areas, offering a macroscopic view of ecotourism’s environmental impacts. For instance, Brandt et al. (2019) used counterfactual analyses combined with satellite imagery to assess forest loss across multiple ecotourism hubs in the Himalayan region, demonstrating the effectiveness of such methods in large-scale studies [30].
In Indonesia, where ecotourism sites are dispersed across a geographically diverse archipelago, adopting remote sensing and GIS as primary methodologies is highly relevant. These technologies not only overcome logistical barriers but also enable consistent, replicable analysis across different regions and time periods. In this study, we employ GIS-based spatial analysis of forest loss around ecotourism areas to investigate whether ecotourism leads to measurable environmental benefits at the national level.

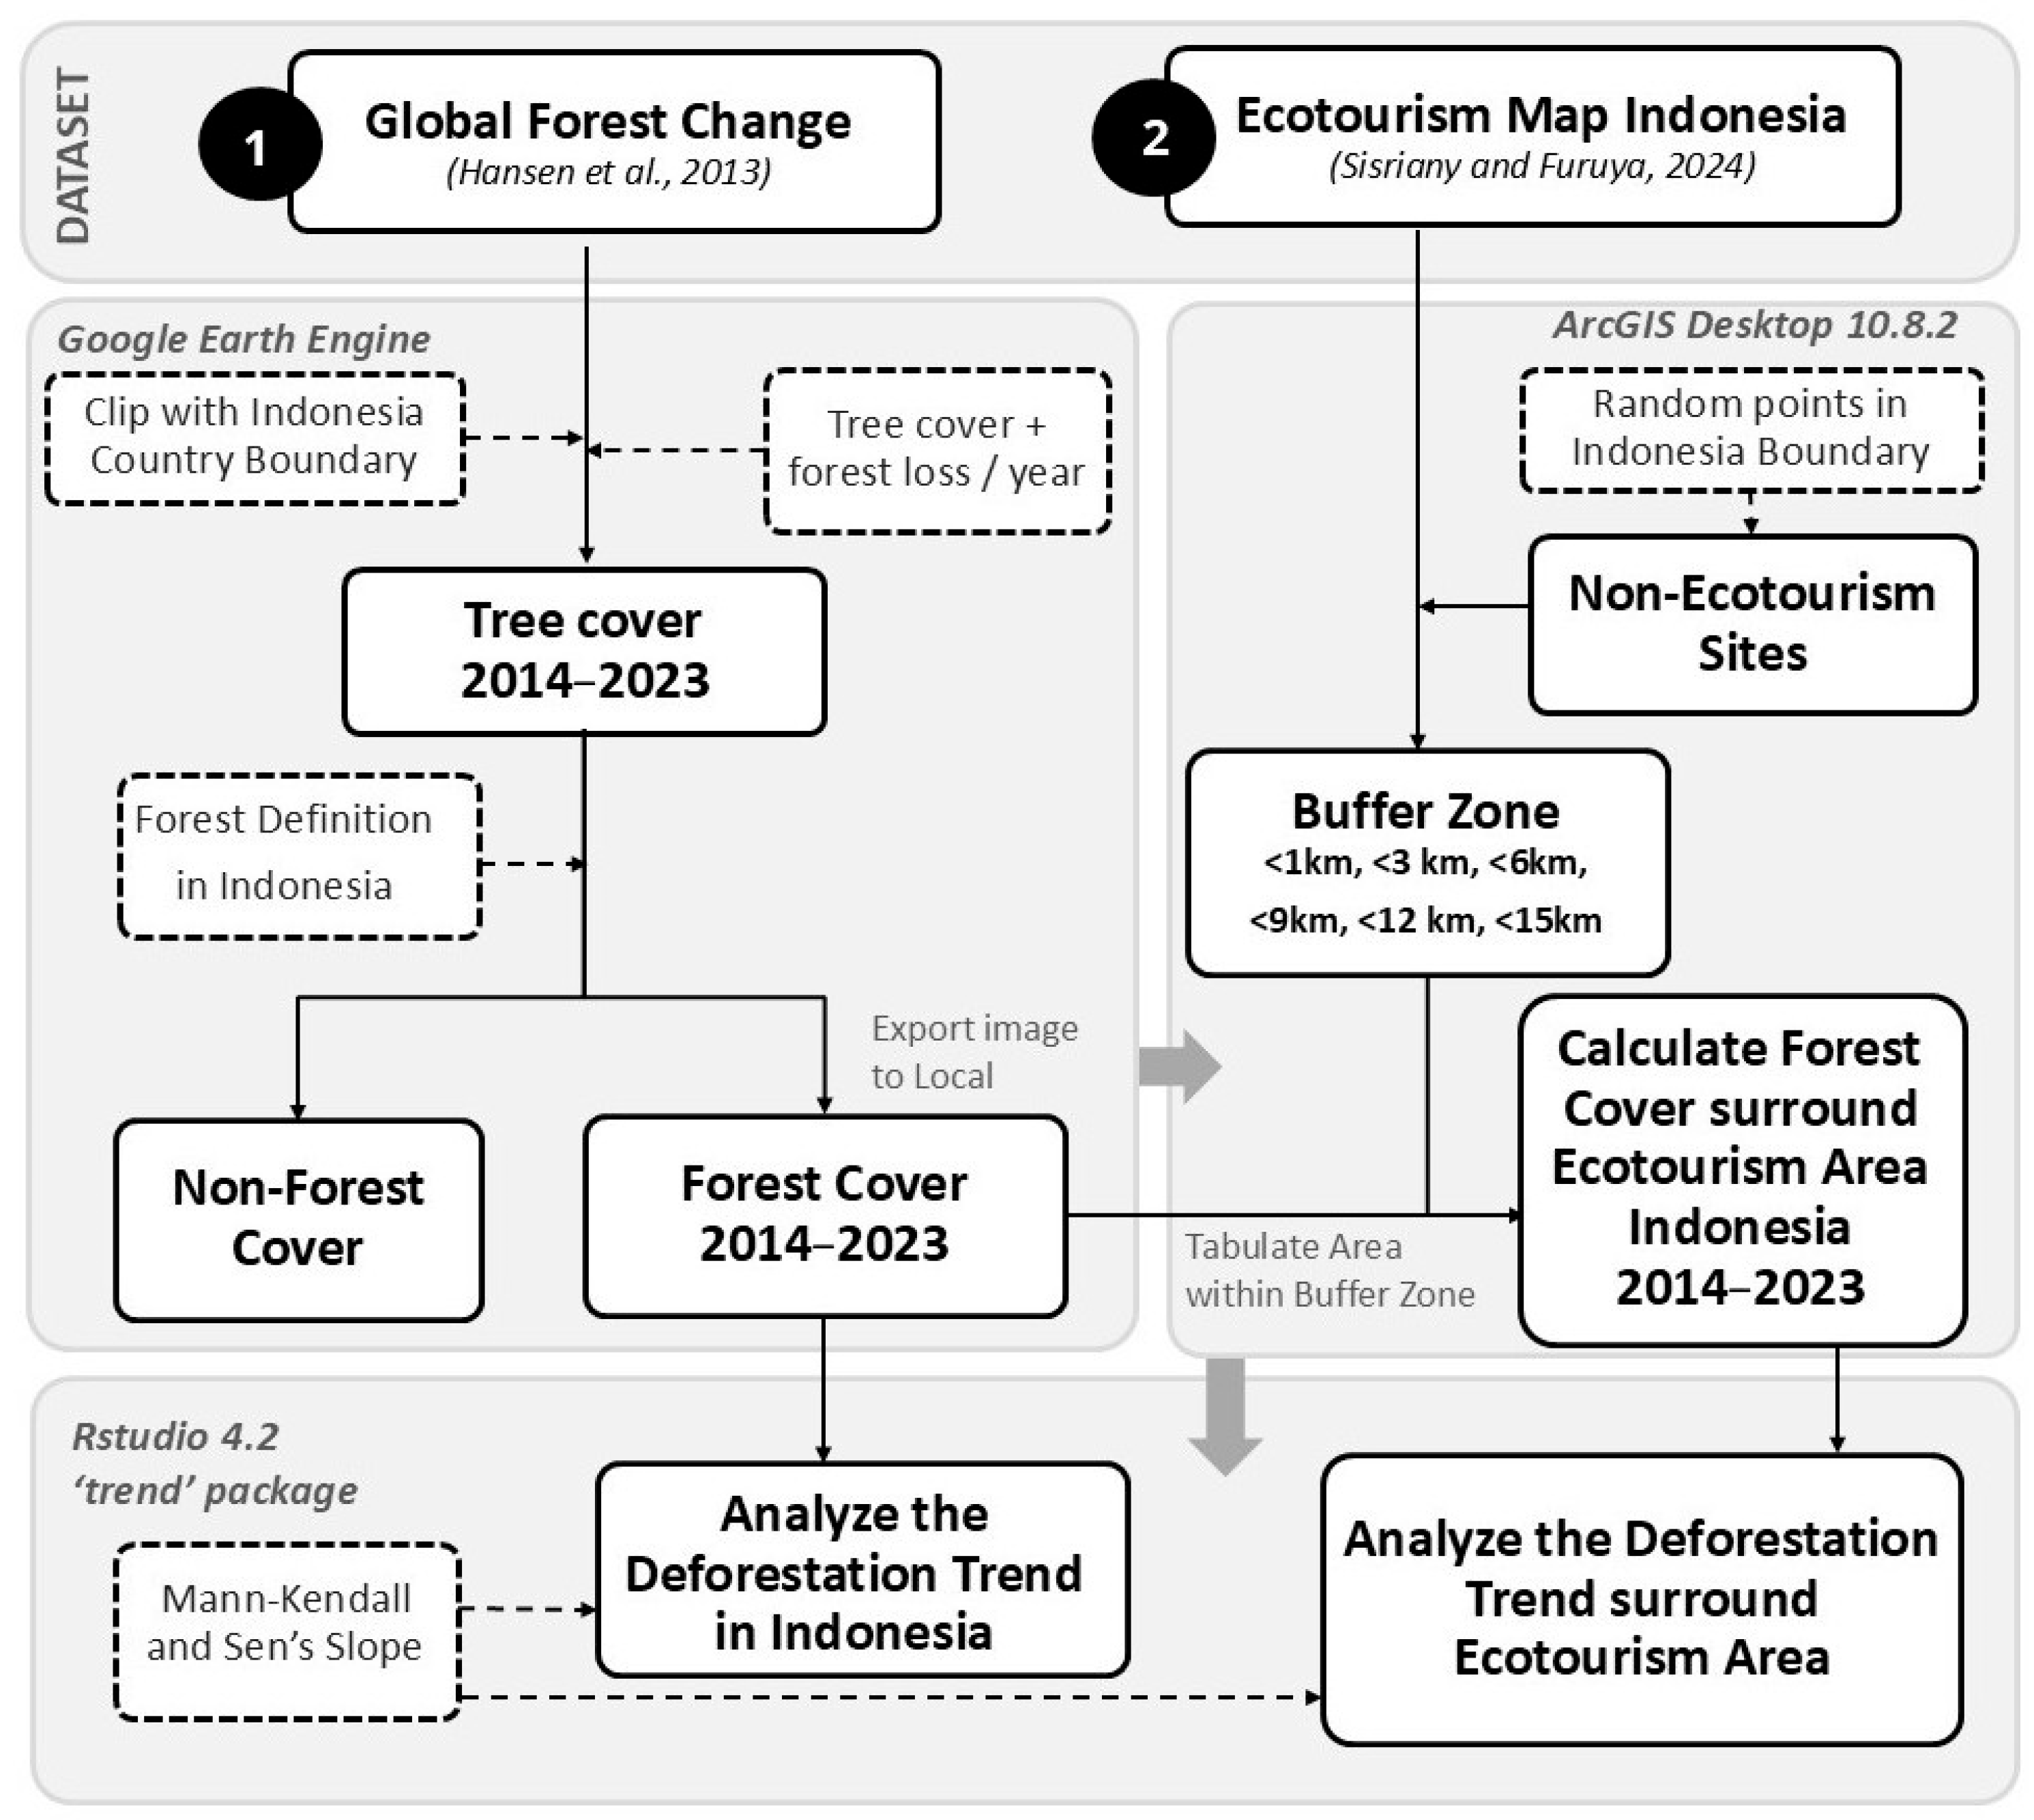
3. Materials and Methods
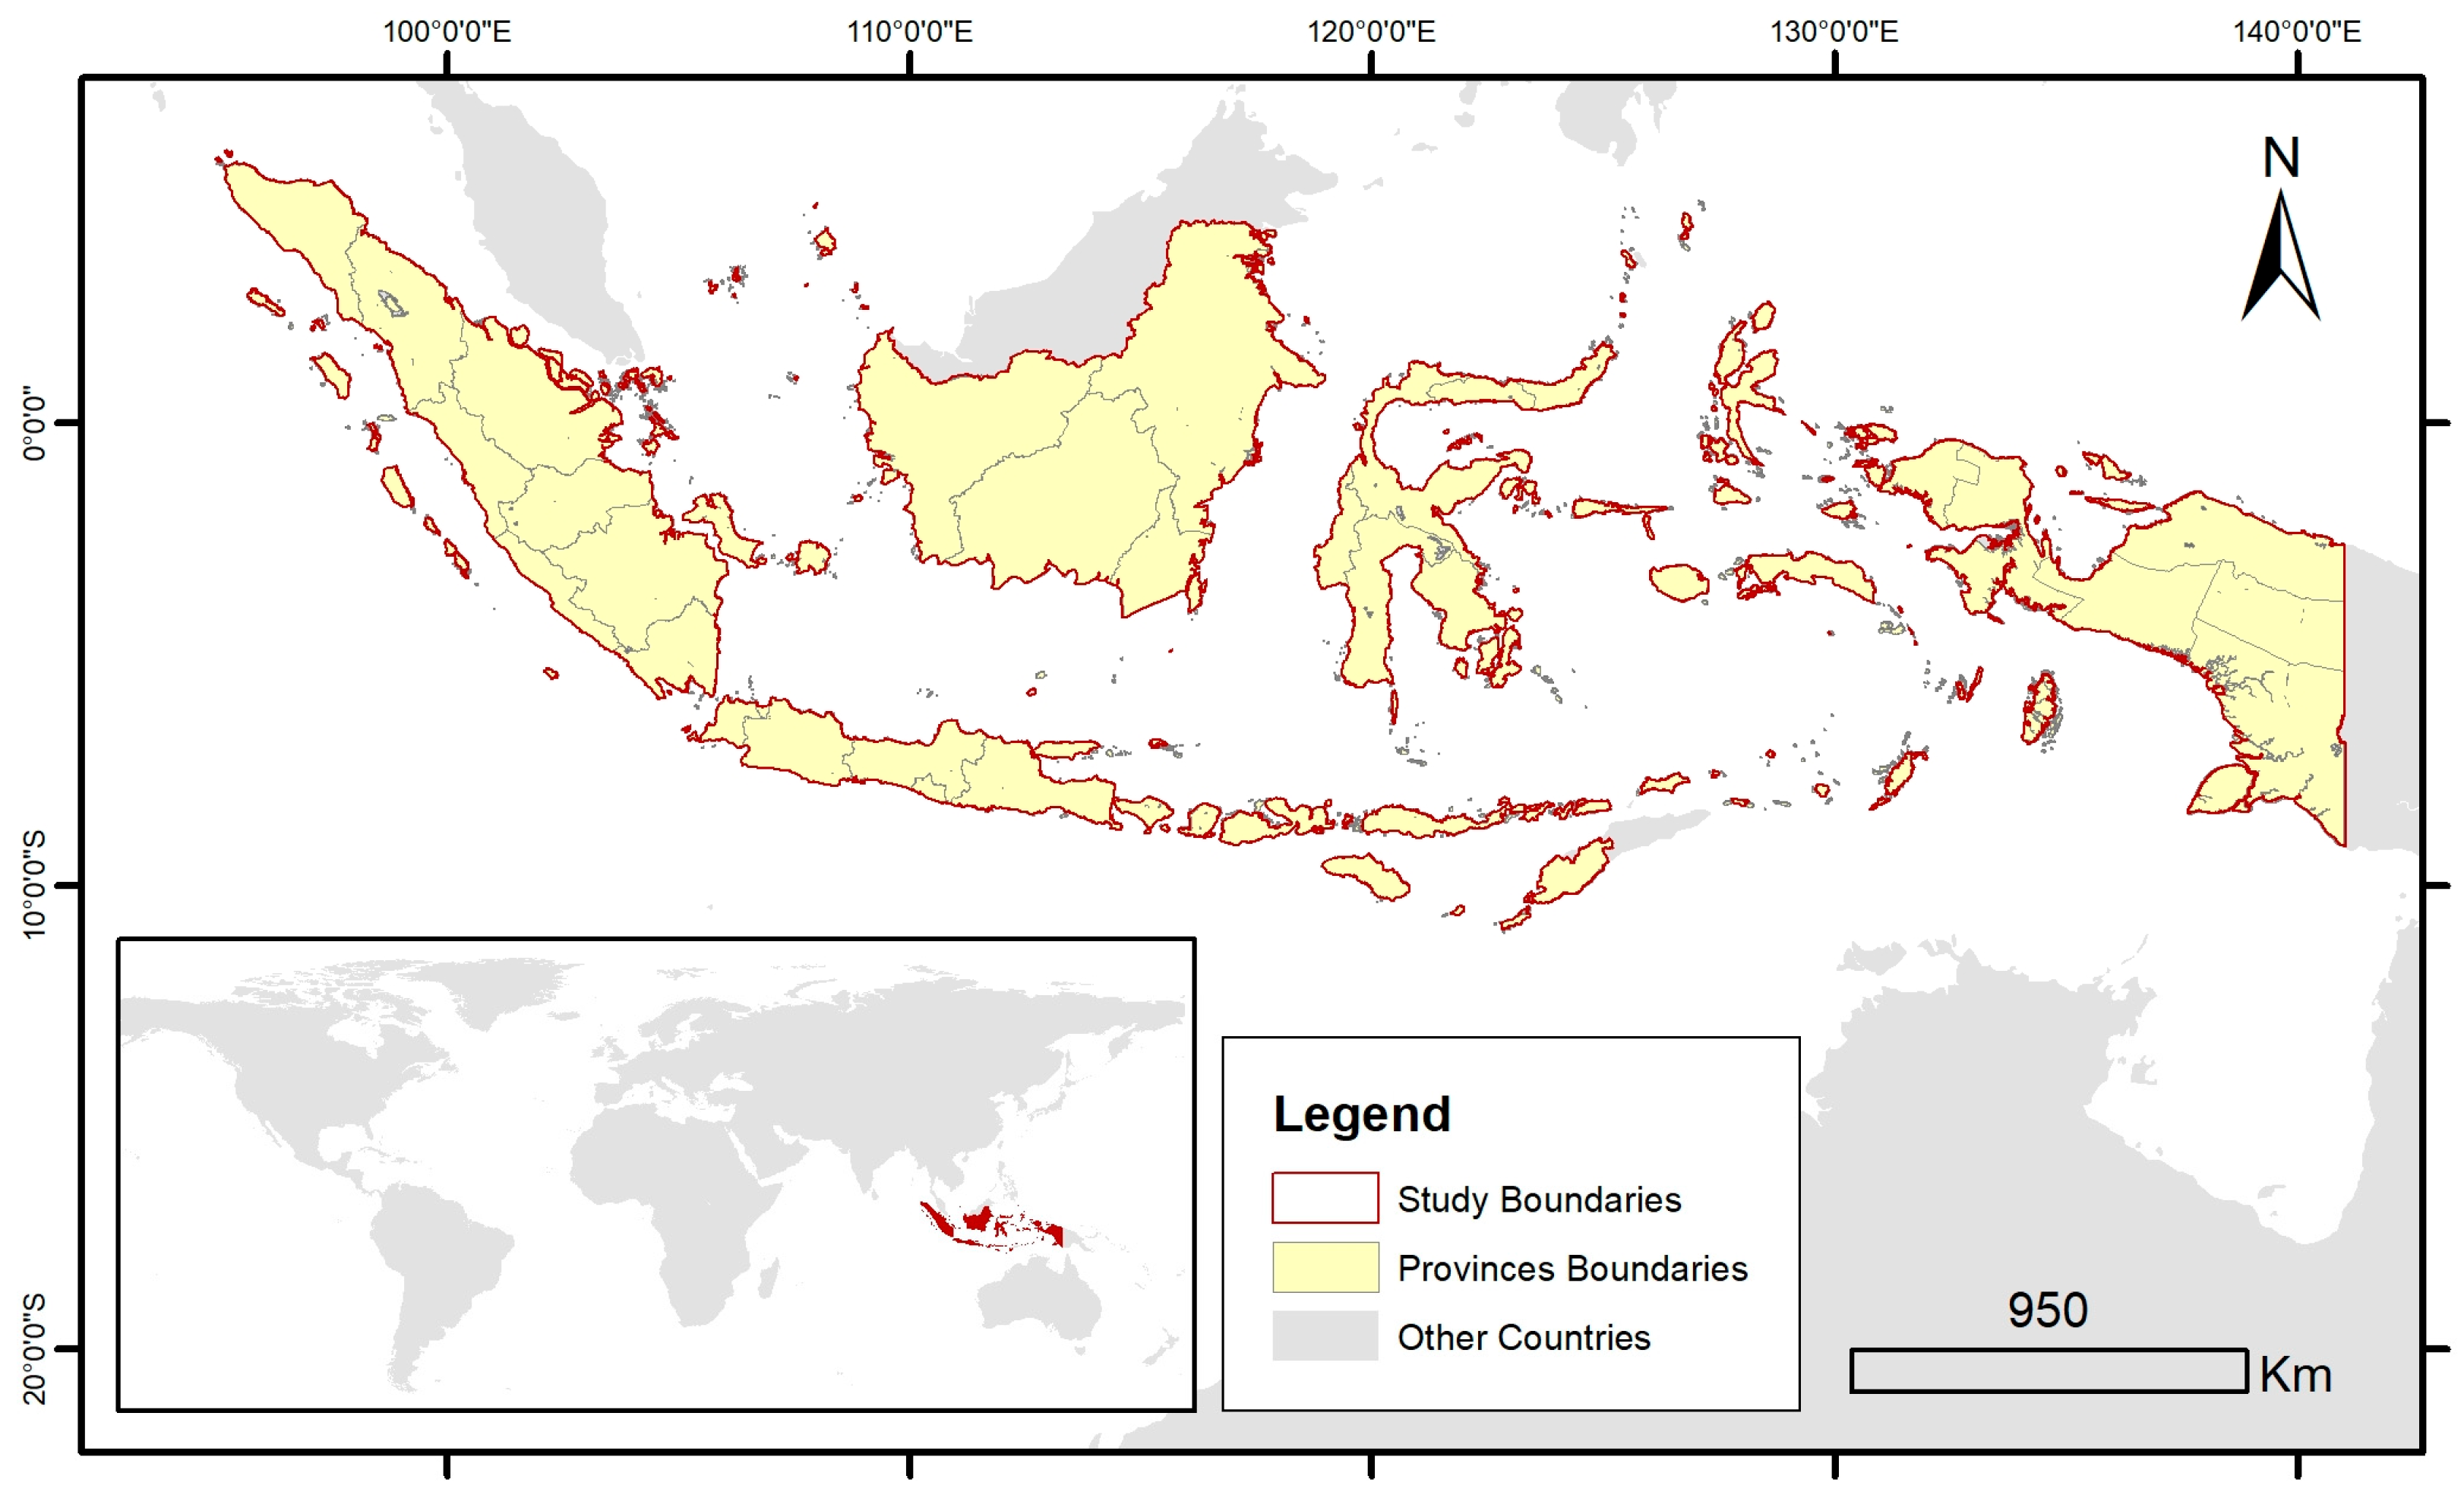
To investigate whether ecotourism contributes to forest conservation, we conducted a nationwide spatial analysis of forest cover change around ecotourism sites in Indonesia using GIS and remote sensing data. The analysis included calculating annual forest cover loss from 2014 to 2023 at multiple buffer distances around ecotourism locations, comparing trends to national averages and matched control sites in protected areas. This approach allowed us to assess ecotourism impact towards the environment in a consistent, scalable, and regionally comparable manner.

3.1. Study Area

This study adopted a nationwide approach, encompassing established ecotourism sites situated across the terrestrial area of Indonesia. Indonesia is geographically located in 95° E–141° E and 6° N to 11° S, across 17,504 islands [31]. The nation consists of 38 provinces, and this research groups those provinces into five main regions based on the main islands: (1) Jawa, Bali & Nusa Tenggara (2) Sumatera, (3) Kalimantan, (4) Sulawesi, and (5) Maluku & Papua. In this research we use the Level 1 (country) administrative boundaries as the study boundaries, as seen in Figure 1.

3.2. Forest Cover Calculation on Ecotourism Sites

Annual forest cover in this study was estimated based on the Hansen Global Forest Change data [32]. The Hansen Global Forest Change (GFC) is a publicly available dataset, providing results of time series analysis of Landsat images in characterizing global forest extent and changes from 2000 and updated annually with the latest for 2023. This dataset has been widely used to calculate regional forest loss, which fits the scale for this research with accuracy of more than 80%, especially for the nationwide-scale approach [33]. Annual forest cover from the period 2014–2023 was acquired from the Google Earth Engine (GEE) catalog based on each year of the GFC version, combining the bands of “treecover2000”, representing tree canopy cover for the year 2000, and “loss”, representing forest loss during the GFC’s version period. Tree canopy cover is defined as canopy closure for all vegetation taller than 5 m in height [34]. The overall research flow can be seen in Figure 2.
The GFC dataset was then clipped by the Indonesia boundaries. Forest cover was selected based on the forest threshold value in Indonesia as follows: a minimum tree height of 5 m; a canopy cover of at least 30%; and a contiguous block of forest land of 5 hectares or more [36].
The process of data acquisition for the selection of Indonesia forest cover based on the definitions was performed in GEE, and data were then exported to ESRI ArcMap.
The second dataset for this research is the Ecotourism Map of Indonesia derived from the author’s prior research [35], which was chosen considering it is the most recently updated and has complete distribution data of ecotourism sites in Indonesia. The Ecotourism Map of Indonesia dataset is also publicly accessible, providing geographical locations of ecotourism sites in Indonesia developed based on the Google Places API and consisting of 172 identified ecotourism sites. For the purpose of this analysis, 152 sites were selected and processed based on the availability of forest cover data. Sites without relevant forest cover—such as those located on beaches—were excluded. To assess the impact of ecotourism on forest cover, we calculated forest cover at each ecotourism location. The analysis included multiple buffer zones to capture the influence of ecotourism at varying distances from the sites. Specifically, buffer zones of 1 km, 3 km, 6 km, 9 km, 12 km, and 15 km were used. The forest cover of each buffer area was calculated using the tabulate area tools with the WGS 1984 World Mercator projection system in ESRI ArcMap. Annual forest cover of Indonesia from 2014 to 2023 was also calculated to compare the forest loss between the national level and ecotourism site level.

3.3. Counterfactual Analysis of Forest Loss

This study incorporated a counterfactual approach based on the quasi-experimental design to determine the impact of ecotourism on forest loss. The counterfactual approach assesses the effectiveness of the interventions by comparing its factual states, in the presence of the intervention, with its counterfactual states, in the absence of intervention [37]. The application of counterfactual analysis has been used in assessing impacts in conservation [38], ecosystem services [39], and ecotourism [30].
The goal of this analysis is to see if a similar trend of forest loss would appear if ecotourism existed or not. In this study, the control units (non-ecotourism sites in protected areas) and treatment units (ecotourism sites in protected areas) were matched to observe the forest sites if they were not subjected to ecotourism. Treatment units consisted of forest cover in the multiple buffer zones of the ecotourism sites in Indonesia. The central points of control units were randomly generated outside the ecotourism site zones, but within Indonesia’s protected area there were six control units in each region, as mentioned in the study area section. The forest cover surrounding the central point of each control unit was calculated within the same buffer zones as the treatment units: 1 km, 3 km, 6 km, 9 km, 12 km, and 15 km. The datasets consist of forest cover and ecotourism sites, along with additional control points, which can be seen on the map in Figure 3.

3.4. Trend Analysis of Forest Loss Change

Forest loss was calculated from the results of the Hansen GFC Forest cover calculations. The forest loss in the proximity areas of ecotourism sites, non-ecotourism sites, and nationwide was all calculated with the same formula as
F L Y 1 = F C Y n F C Y ( n 1 )
where FLYn is the forest loss at the year of n, FC is the forest cover at the year of n, and FCY(n−1) is the forest cover in the previous year (n−1). Since the data extracted from the Hansen GFC excluded the forest gain, the formula was straightforward and calculated the forest loss from the subtraction of forest cover of the current year and previous year. The calculation of forest loss was conducted in Microsoft Excel.
This research used the combination of the Mann–Kendall test and Sen’s slope estimator to analyze the trend of forest loss surrounding ecotourism sites, non-ecotourism sites (control units), and national forest loss for the period of 2015–2023. The combination of the Mann–Kendall test and Sen’s slope estimator has been widely applied in forest cover trend analysis [40,41] and other studies such as climate change [42]. The Mann–Kendall test is a non-parametric statistical test that was used to evaluate significant changes over time series data due to its low requirements for the sample and insensitivity to outliers, and because it does not assume a normal distribution. However, this test alone cannot be used since it only judges the significance and identifies the monotonic upward and downward trend. Sen’s slope estimator was used to provide additional information about the slope of the trends [43].
Both Mann–Kendall and Sen’s slope analysis was performed using the “trend” package in RStudio ver. 3.6 [44]. In total, 1.097 trend analyses of forest loss were performed, including 152 ecotourism sites and 30 non-ecotourism sites (in six different proximity areas), and forest loss in the five regions within Indonesia. The interpretation of trend analysis uses Kendall’s tau value and p-value, and Sen’s slope value was used to identify the forest loss trend (Table 1).

3.5. Statistical Analysis

All statistical analyses were conducted using R version 4.4.2 to explore relationships between forest loss trends and key factors, as well as to compare differences across ecotourism sites, non-ecotourism sites, and national forest loss rates. Pearson’s Chi-squared test and Fisher’s exact test were used to assess associations between forest loss trends and categorical variables, such as distance to ecotourism sites, conservation area status, and region. The Chi-squared test is as follows:
χ 2 = O i E i 2 E i
where O i is the observed frequency and E i is the expected frequency. Fisher’s exact test was applied for small sample sizes. The Wilcoxon rank sum test was used to compare forest loss trends between ecotourism and non-ecotourism sites, while the Mann–Whitney U test evaluated regional differences. Both are non-parametric tests suitable for non-normal distributions.
A paired t-test compared forest loss trends at ecotourism sites with the national forest loss rate. The Shapiro–Wilk test was performed beforehand to assess data normality:
W = i = 1 n a i x i 2 i = 1 n x i x ¯ 2
where x i is the ordered data and x ¯ is the mean. Non-parametric alternatives were considered if normality was violated. This approach combined robust parametric and non-parametric methods to accommodate varying data distributions, ensuring reliable insights into ecotourism’s impact on forest loss.

4. Results

The calculation from 2014 to 2023 shows that Indonesia has lost an estimated 13.04 million hectares (Mha) of forest cover, from the total of 139.53 Mha in 2014 to 126.49 Mha in 2023. This means the forest cover remained approximately 66.57% of the total Indonesia land area of 190.02 Mha. This overall estimation corresponds to other forest cover research that calculates Indonesia forest cover as having a similar tree cover threshold (>30%) in 2020 of around 138 Mha [45].
The impact of ecotourism on forest loss varies across different sites in Indonesia, as shown in Figure 4. Out of the 152 ecotourism sites analyzed, 47 sites (30.92%) exhibited significant trends of forest loss, while the majority, 105 sites (69.08%), showed no significant forest loss trends. Among the sites with significant trends, 36 sites (23.68% of the total) demonstrated a decreasing trend in forest loss, 10 sites (6.58%) showed an increasing trend, and 1 site (0.66%) exhibited both increasing and decreasing trends in different areas. The trends were distributed across various distances, with decreases most commonly observed at 9 km (24.19%) and 15 km (22.58%), while increases were concentrated at 3 km (27.78%) and 9 km (27.78%). The full breakdown of trends by distance is presented in Table 2.
Some sites are notable for their positive impacts, while others result in negative consequences. Tanjung Puting National Park demonstrates decreasing forest loss trends in four out of six observed proximity areas: 6 km, 9 km, 12 km, and 15 km. In contrast, Bat Cave in Bukit Lawang highlights a troubling increase in forest loss, showing a significant rise in forest loss trends in three proximity areas: 3 km, 6 km, and 9 km. Meanwhile, Kerinci Seblat National Park exhibits mixed trends, with both increases (at 3 km) and decreases (at 9 km) in forest loss observed across its surroundings. These three sites are among those with significant impacts on forest loss. A more detailed list of other locations including site names, coordinates, and conservation area types, is provided in Appendix A.
Additionally, 10.2% of sites were categorized as “NA” in the analysis. This classification does not indicate insufficient data but instead reflects cases where no change in forest cover was observed over the ten-year period, rendering trend analysis unnecessary for these sites. Therefore, in the following sections, “NA” sites will be excluded.

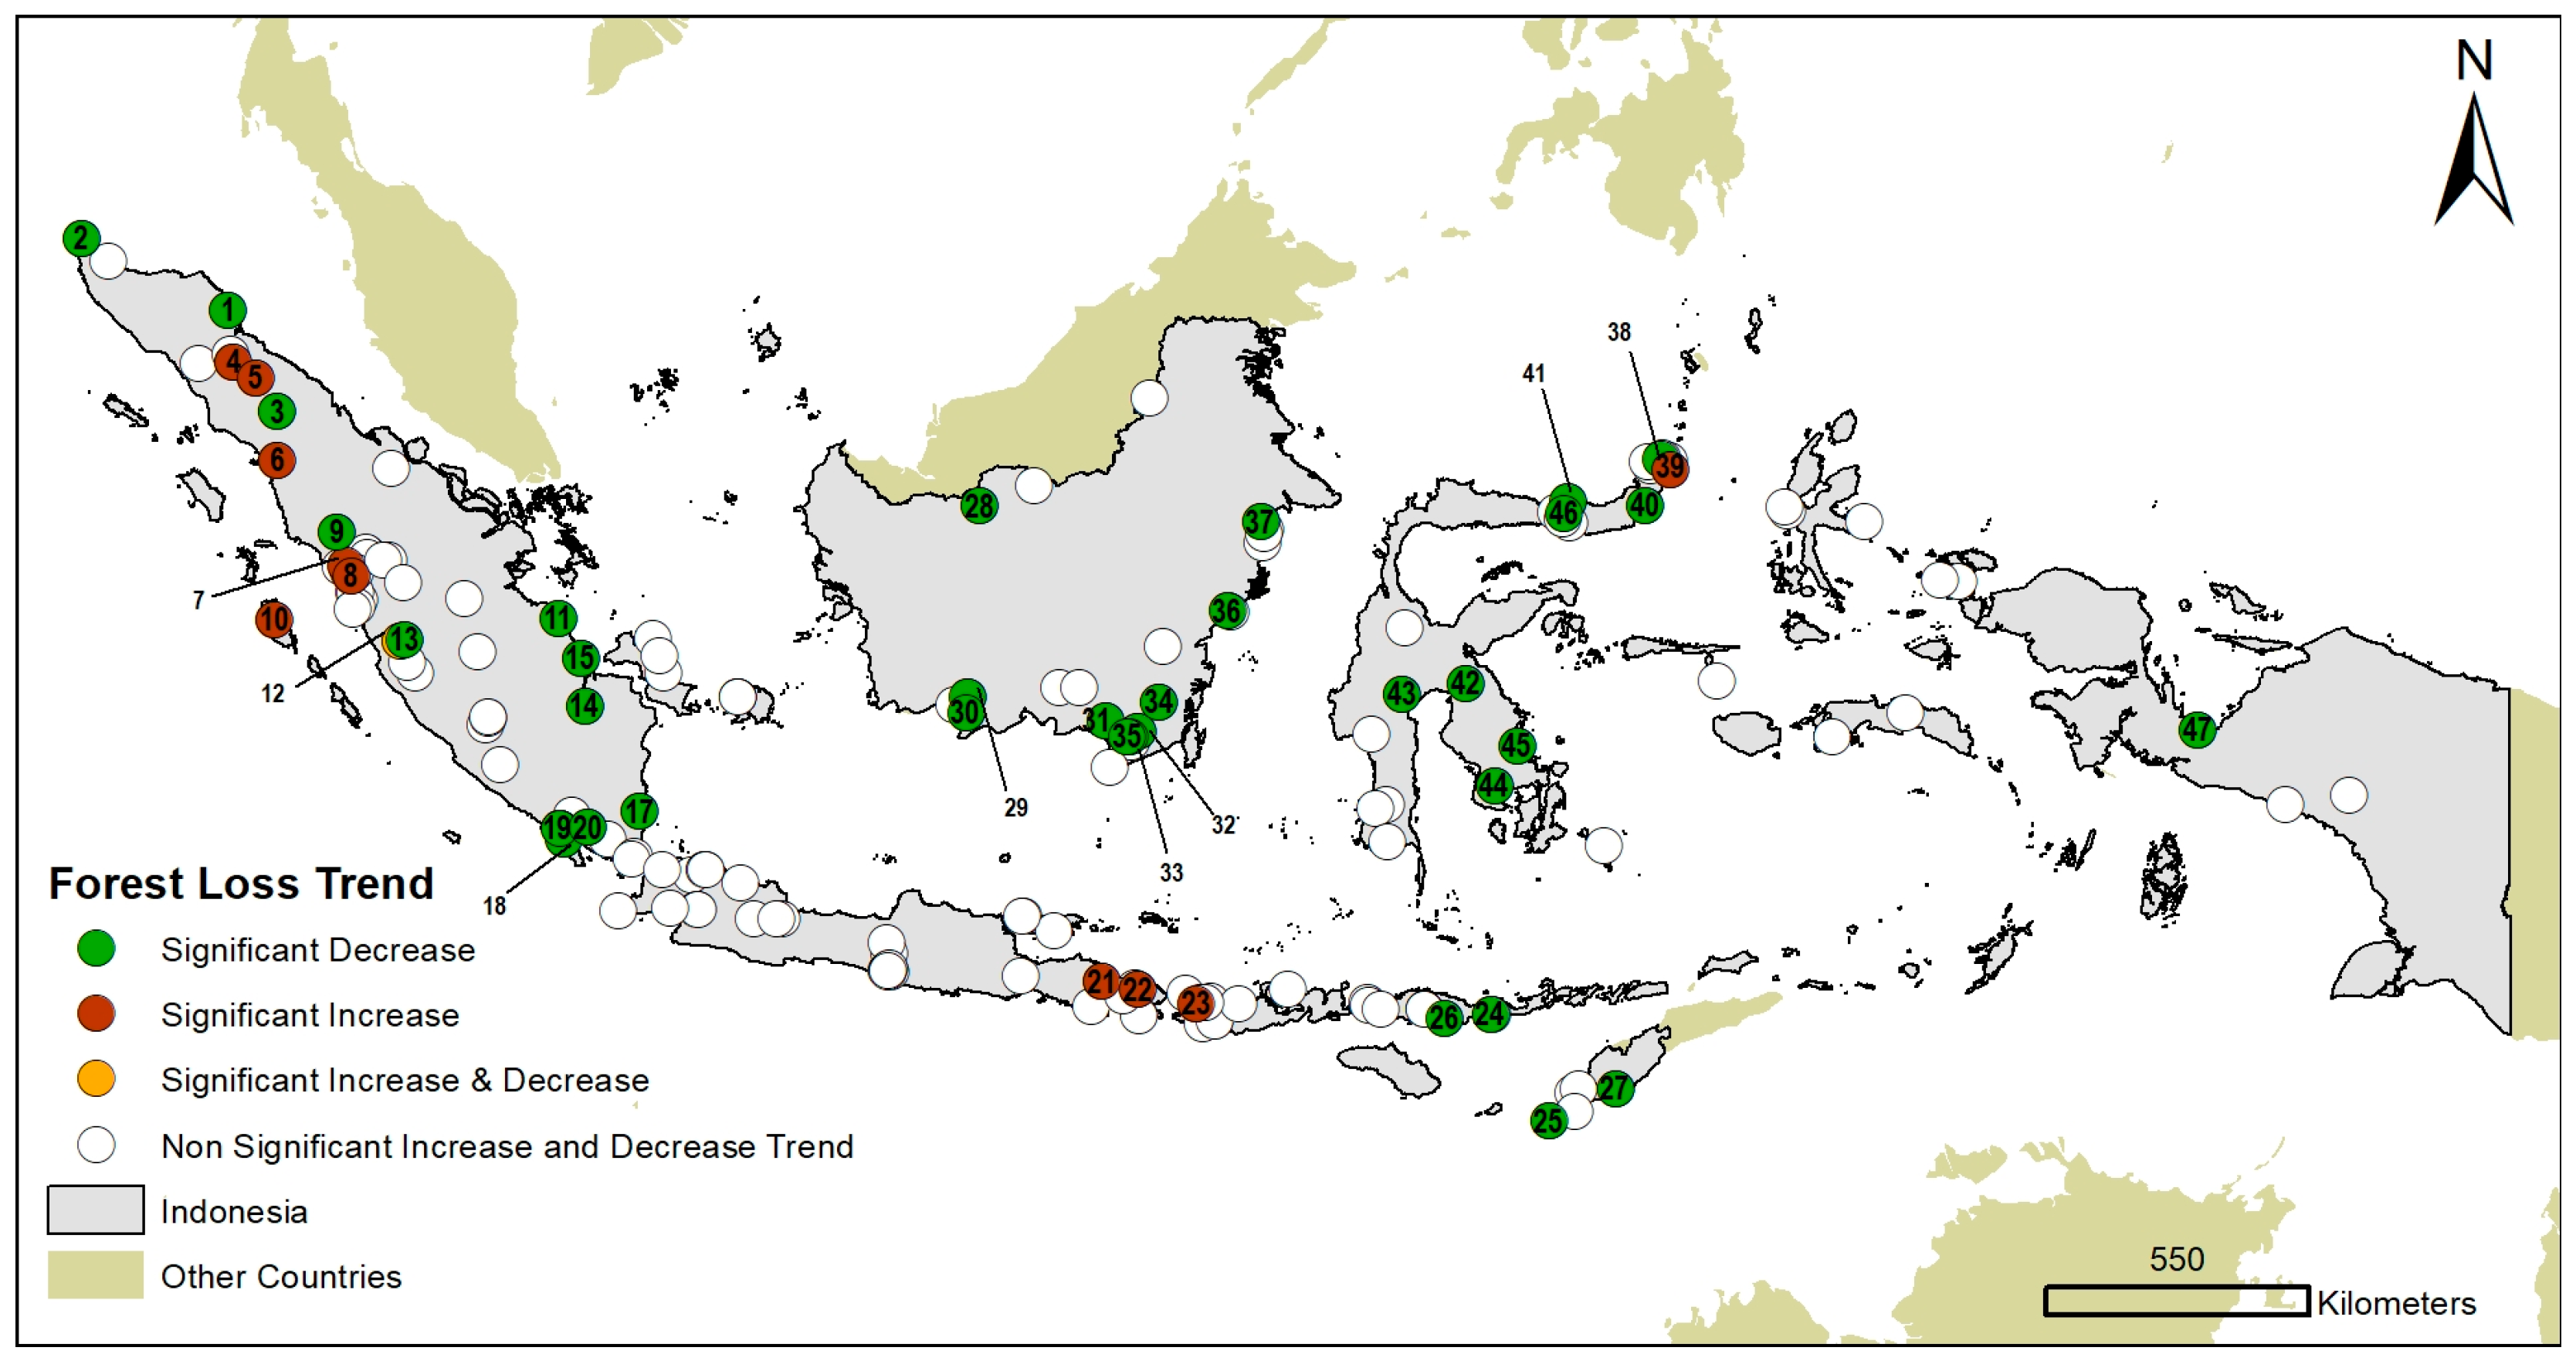
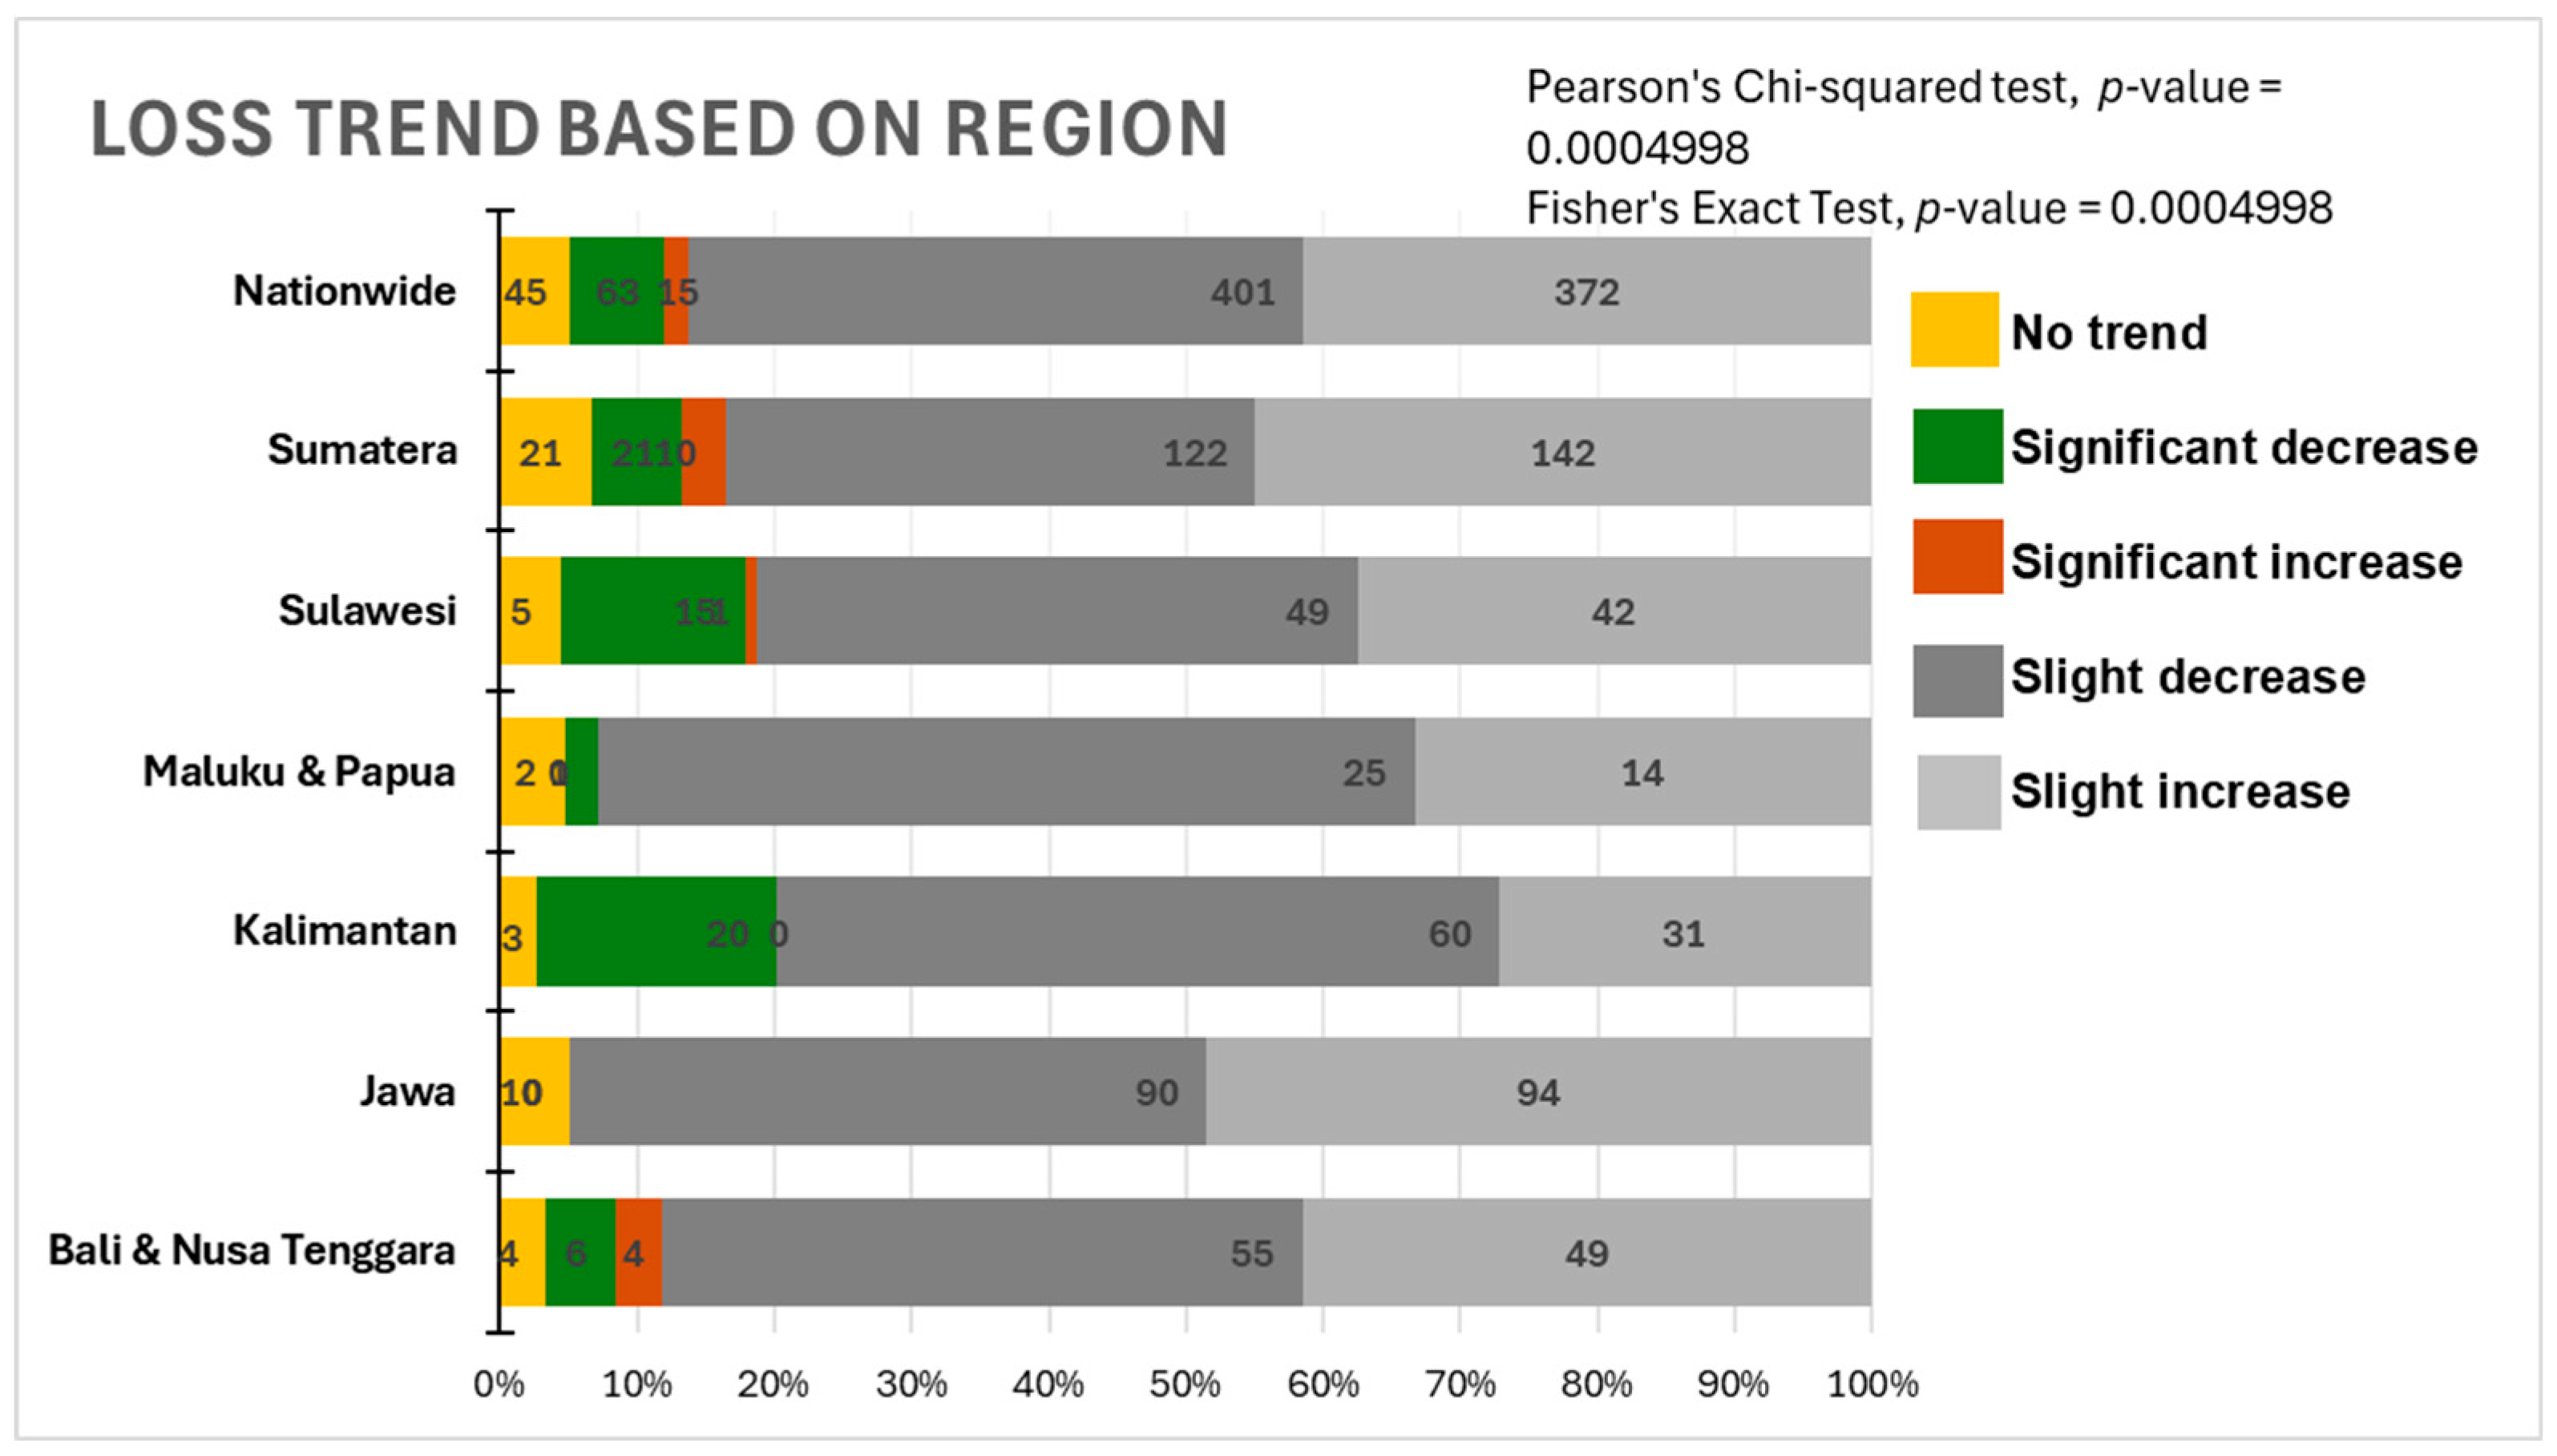
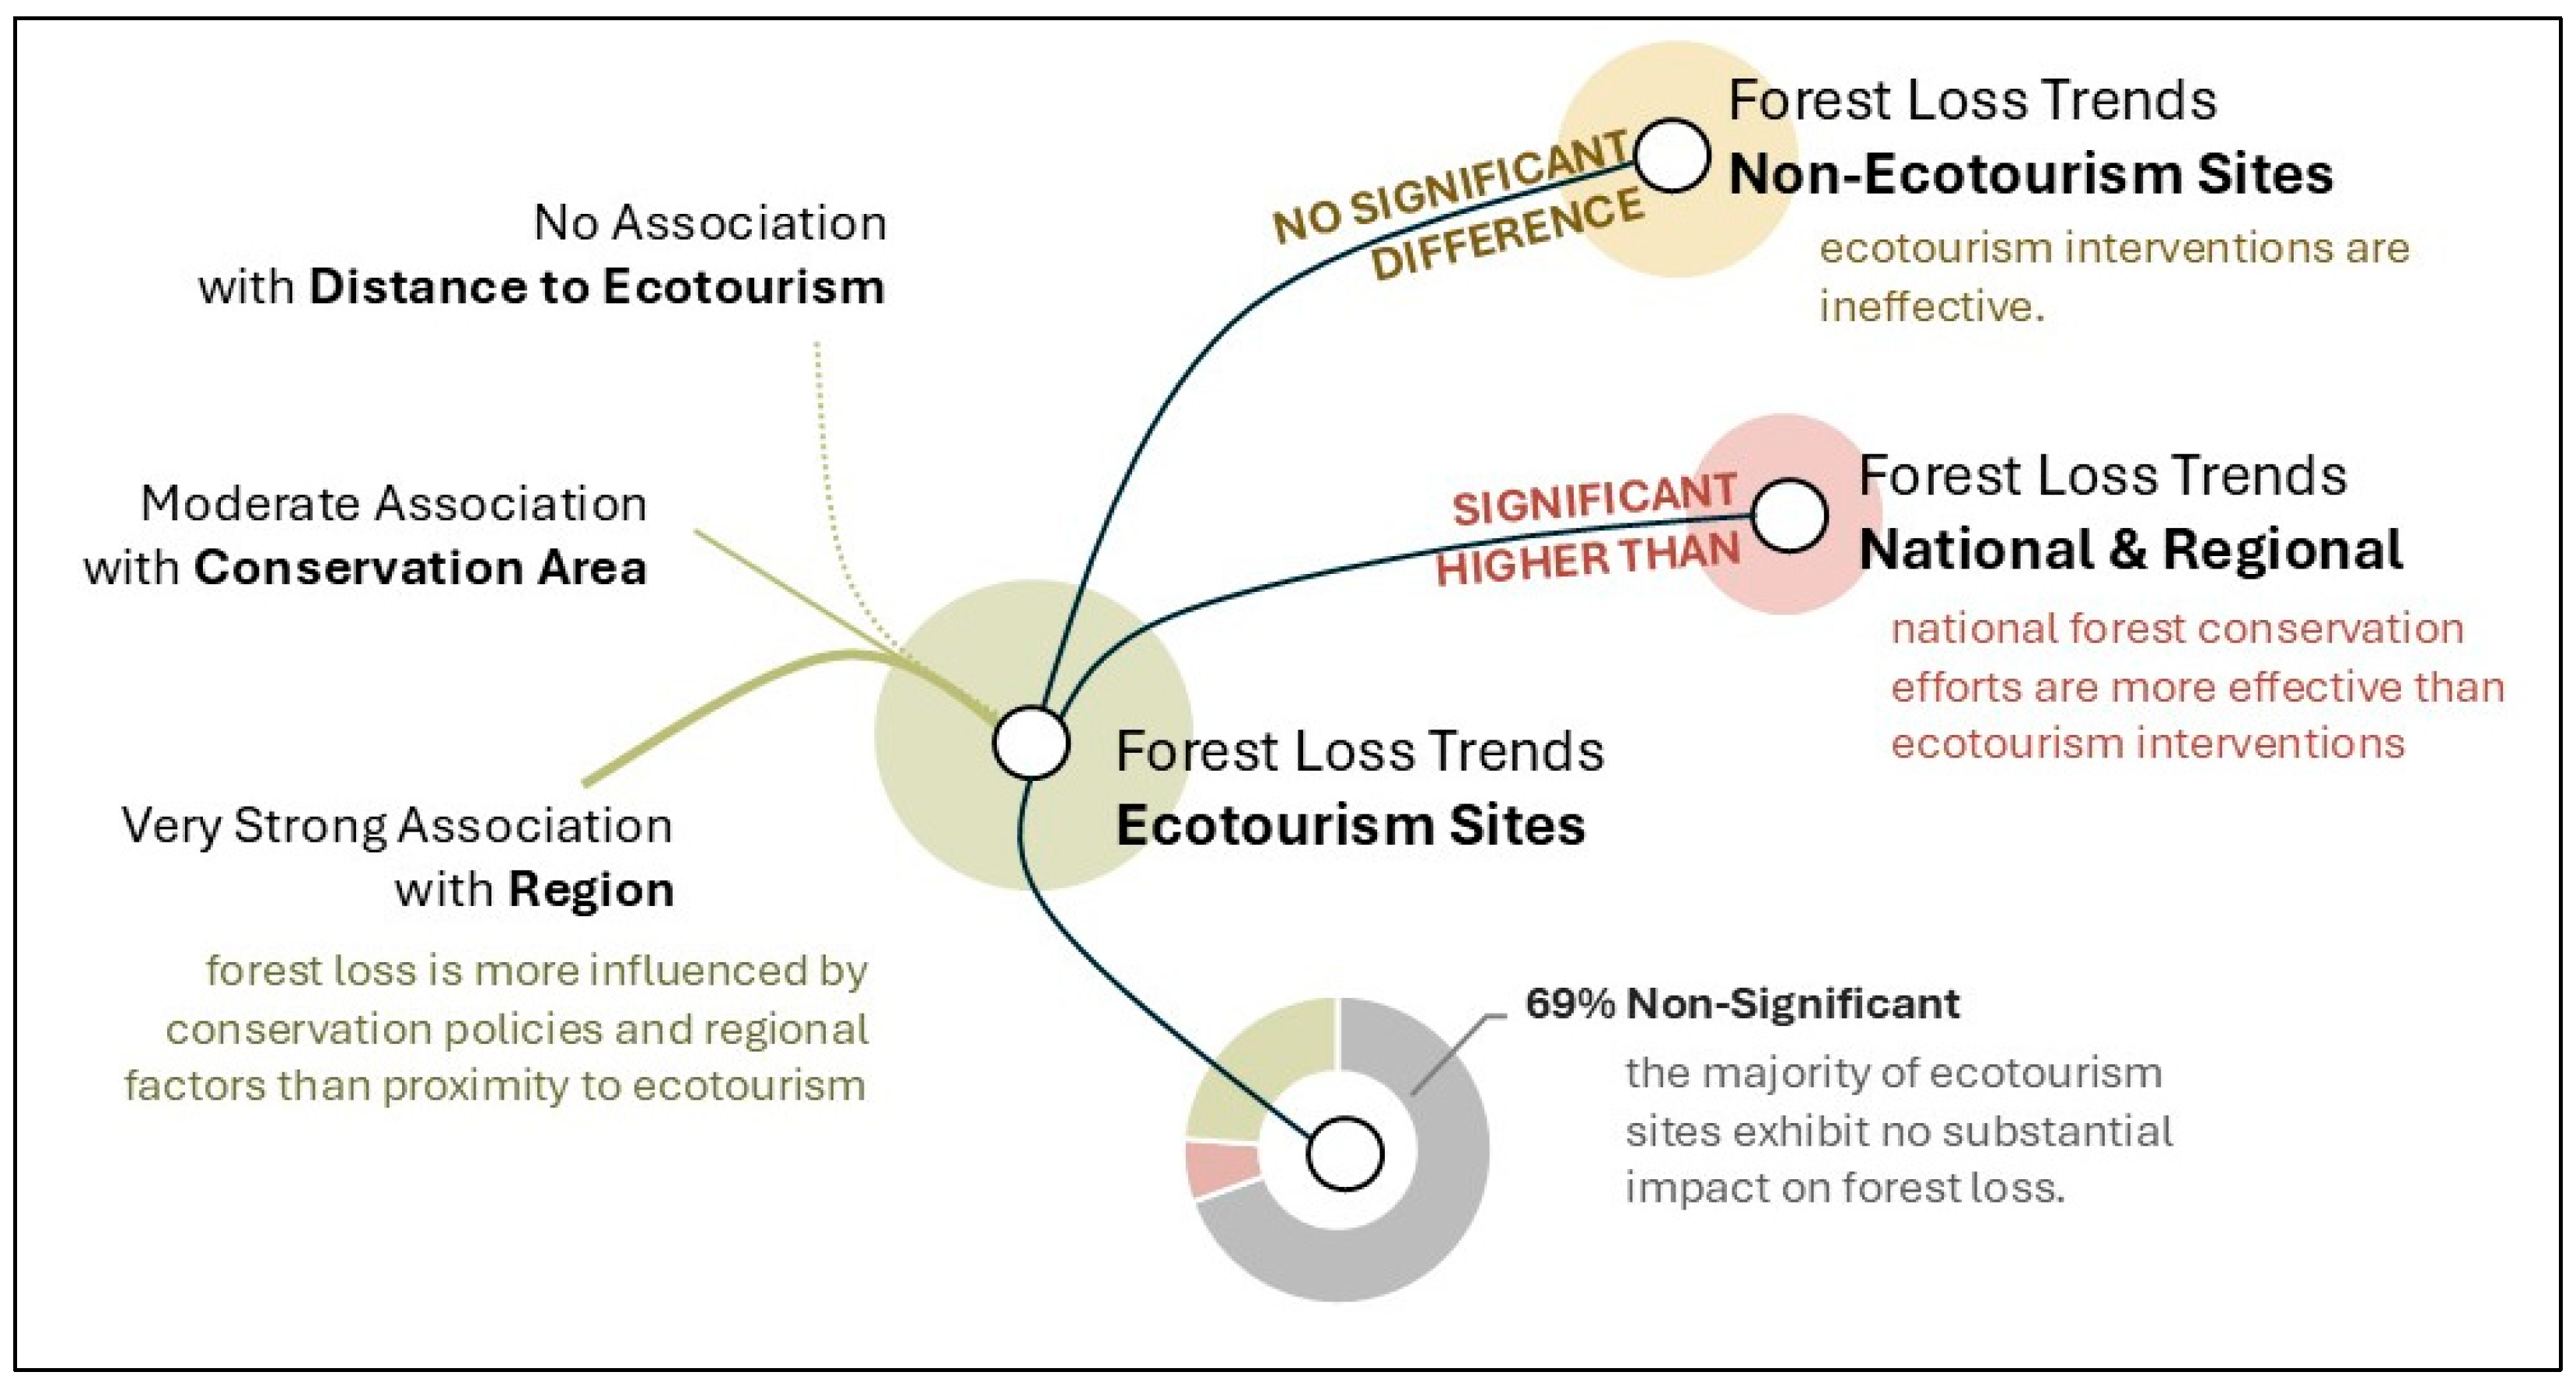
4.1. Forest Loss Trends by Distance, Conservation Area, and Region

The relationship between forest loss trends and various key variables, including distance to ecotourism sites, conservation area status, and region, was assessed using Pearson’s Chi-squared test and Fisher’s exact test. The results are summarized in Table 3.
The analysis revealed no significant association between forest loss trends and the distance to ecotourism sites. Pearson’s Chi-squared test returned a test statistic of X2 = 18.282 with a p-value of 0.5537, while Fisher’s exact test yielded a p-value of 0.4273. These results suggest that proximity to ecotourism does not have a noticeable impact on forest loss trends. Therefore, no further exploration of the impact of the distance to ecotourism was undertaken.
Meanwhile, the statistical tests demonstrated a highly significant association between forest loss trends and region (X2 = 72.611, p-value < 0.0005 for both Pearson’s Chi-squared and Fisher’s exact tests). These results suggest that regional differences significantly influence forest loss trends, reflecting the varying environmental, socio-economic, and policy contexts across regions.
As shown in Figure 5, significant decreases and increases in forest loss are distributed unevenly across regions, with Sumatera and Sulawesi exhibiting the most dynamic trends. The regions display varied patterns of significant forest loss. Sumatera exhibits the highest number of significant trends, with 21 areas (7%) showing significant decreases and 10 areas (3%) showing significant increases in forest loss. This highlights Sumatera as a hotspot for dynamic forest loss trends that require targeted interventions.
Sulawesi also displays notable significant trends, with 15 areas (8%) showing significant decreases and 1 area (<1%) showing significant increases. This suggests a slightly stronger emphasis on recovery in some parts of the region. In Kalimantan, 20 areas (10%) demonstrate significant decreases, while no significant increases are observed, indicating a clear trend toward forest recovery in parts of the region.
Regions such as Bali and Nusa Tenggara, Jawa, and Maluku and Papua exhibit negligible significant trends. Bali and Nusa Tenggara show only six areas (5%) with significant decreases, while Jawa and Maluku and Papua exhibit no significant increases or decreases, reflecting more stable forest conditions.
These results underscore the need for region-specific conservation strategies. Sumatera and Sulawesi, with both significant increases and decreases, present a complex dynamic that warrants closer monitoring and targeted interventions. In contrast, Kalimantan’s trend toward significant decreases highlights progress in forest recovery, which can serve as a model for other regions.
The relationship between conservation area types and forest loss trends is depicted in Figure 6. Fisher’s exact test (p = 0.011) and Pearson’s Chi-squared test (p = 0.042) reveal a statistically significant association between conservation area type and forest loss trends, particularly in the categories of “Significant increase” and “Significant decrease.”
Protected Forests exhibited notable performance, with only 6% of sites experiencing a “Significant increase” in forest loss, while 9% showed a “Significant decrease”. Similarly, National Parks demonstrated relatively strong results, with 8% of sites experiencing a “Significant decrease”, compared to 2% with a “Significant increase”. These areas appeared more successful in mitigating forest loss compared to other conservation types.
Conversely, Grand Forest Parks and Hunting Parks showed poor performance, with 11% and 17% of their areas, respectively, categorized under “Significant increase” in forest loss, and no areas recorded as having a “Significant decrease”. Wildlife Forest Reserves followed a similar trend, with 9% experiencing a “Significant increase” and no significant reductions observed.
In Nature Recreational Parks and Nature Reserves and Nature Preservation Forests, the presence of “Significant decrease” trends (8% and 14%, respectively) suggests moderate success in mitigating forest loss, although they still reported smaller proportions of “Significant increase” trends (6% and 8%, respectively). Overall, while some conservation areas, such as National Parks and Protected Forests, demonstrate relative success in reducing forest loss, others, such as Grand Forest Parks and Hunting Parks, appear less effective in achieving conservation goals.

4.2. Counterfactual Analysis of Ecotourism Sites and Non-Ecotourism Sites

A Wilcoxon rank sum test was conducted to evaluate differences in forest loss trends (Mann–Kendall’s tau) between sites with ecotourism intervention and those without (non-ecotourism). Negative values of Mann–Kendall’s tau indicate a positive environmental impact (reduced forest loss), whereas positive values indicate a negative environmental impact (increased forest loss). The results showed no significant difference in forest loss trends between the two site types across all regions (W = 278,034, p = 0.5812). This finding suggests that, overall, ecotourism intervention does not have a statistically significant effect on forest loss trends.
To explore potential regional differences, Mann–Whitney U tests were also conducted for each region. The results demonstrated that forest loss trends did not significantly differ between ecotourism and non-ecotourism sites in most regions (Table 4). In addition, the boxplot (Figure 7) provides a visual comparison of forest loss trends (Mann–Kendall Tau) between ecotourism and non-ecotourism sites across regions. Negative values indicate reduced forest loss (positive environmental impact), while positive values suggest increased forest loss (negative environmental impact).
For instance, in Jawa, Bali, and Nusa Tenggara, there was no significant difference (p = 0.933), indicating similar forest loss trends in sites with and without intervention. Similarly, in Maluku and Papua (p = 0.761), Sulawesi (p = 0.856), and Sumatera (p = 0.284), the forest loss trends were comparable regardless of the presence of ecotourism intervention.
However, a significant difference was observed in Kalimantan (p = 0.002), where forest loss trends differed between ecotourism and non-ecotourism sites. This result suggests that the presence of ecotourism intervention in Kalimantan is associated with distinct forest loss trends compared to sites without such intervention
The boxplot figure shows Kalimantan as the sole region with a statistically significant difference between ecotourism and non-ecotourism sites, evident from the visibly distinct boxplot medians and reduced spread of ecotourism sites. In Kalimantan, the median Mann–Kendall Tau for non-ecotourism sites is higher than that for ecotourism sites, suggesting greater forest loss trends in non-ecotourism areas. This may indicate the potential effectiveness of ecotourism in mitigating forest loss, though further analysis is needed to confirm causation.
In other regions, overlapping distributions support the statistical results having no significant differences. This consistency strengthens the conclusion that ecotourism interventions generally do not significantly alter forest loss trends nationwide.

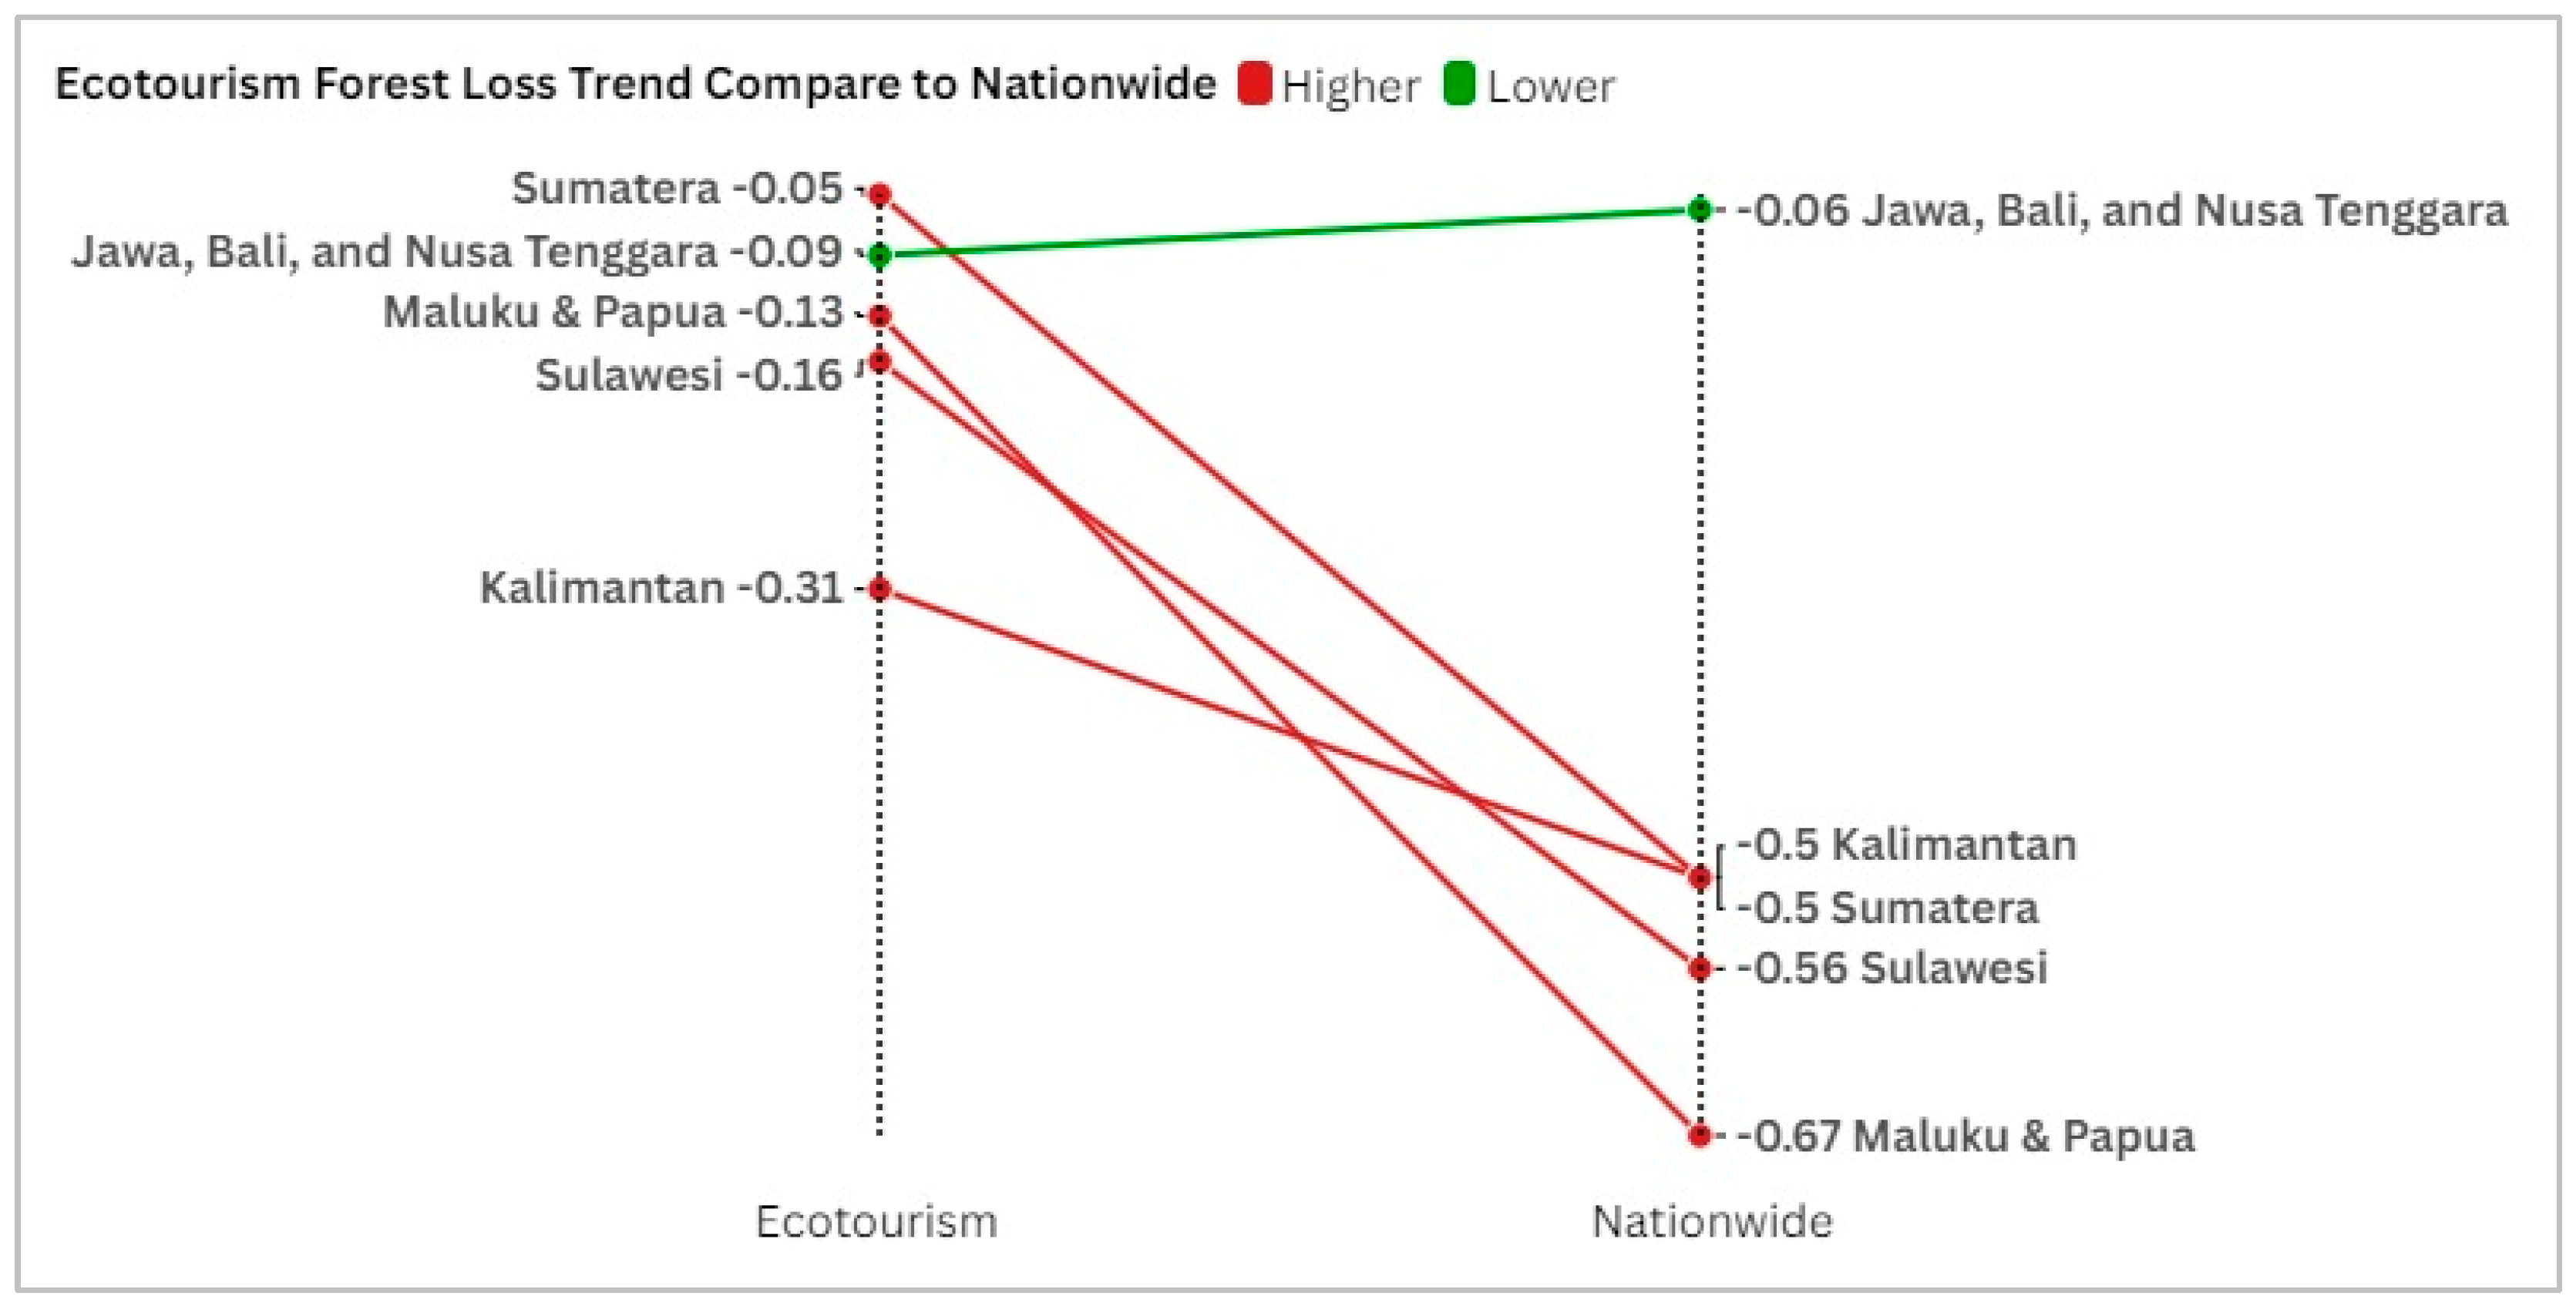
4.3. Comparison of Ecotourism Sites with National Forest Loss Trends

Forest loss trends were analyzed at both regional and national levels using the Mann–Kendall (τ) test and Sen’s slope estimation, as shown in Table 5. The nationwide trends over the last ten years have shown a significant decrease. At the regional level, significant decreases in forest cover were observed in Maluku and Papua, and Sulawesi. These regions demonstrated consistent and substantial declines in forest cover over time. In contrast, Kalimantan, Sumatera, Jawa, Bali, and Nusa Tenggara exhibited slight decreases in forest cover, but these trends were not statistically significant.
To evaluate the effectiveness of ecotourism interventions in mitigating forest loss, forest loss trends (Mann–Kendall’s tau mean value) surrounding the ecotourism sites were compared to the overall forest loss trends across five regions (Mann–Kendall’s tau value), as shown on Figure 8.
A paired t-test was performed to assess whether ecotourism sites exhibited significantly different trends. The paired t-test indicated a significant difference between the two groups (t = 2.96, df = 4, p = 0.042), with ecotourism sites exhibiting higher forest loss trends (mean difference = 0.307, 95%, confidence interval: 0.019 to 0.596). A Shapiro–Wilk test confirmed that the differences were normally distributed (W = 0.92, p = 0.533), validating the t-test assumptions.
These results suggest that the areas surrounding ecotourism sites experience much higher forest loss trends compared to national benchmarks (see red lines on Figure 8), warranting further investigation into site-specific factors that may influence this outcome.

5. Discussion

5.1. Ecotourism Impact on Forest Loss in Indonesia

The findings revealed that the majority of ecotourism sites (69.08%) showed no significant trends in forest loss, raising questions about the effectiveness of ecotourism as a conservation strategy. While 23.68% of sites demonstrated positive outcomes with decreasing forest loss trends, the presence of increasing forest loss trends at 6.58% of sites highlights the potential for negative environmental impacts. These results challenge the assumption that ecotourism inherently benefits forest conservation, especially given the lack of significant differences in forest loss trends between ecotourism and non-ecotourism sites across most regions. The exception of Kalimantan, where ecotourism sites perform better than non-ecotourism sites, underscores the importance of strong governance, community engagement, and site-specific management [46,47].
Additionally, comparisons of forest loss trends between ecotourism sites and non-ecotourism sites, as well as with national and regional averages, suggest that ecotourism has not been effective in reducing forest loss. The analysis shows no significant differences in forest loss rates between ecotourism and non-ecotourism areas, indicating that ecotourism interventions are not achieving their intended conservation outcomes. Furthermore, national forest loss trends demonstrate a significant overall decline, with forest loss rates at the national level being notably lower than those in areas surrounding ecotourism sites. This disparity implies that broader national forest conservation efforts, likely involving more comprehensive strategies and stronger governance, are more effective in curbing deforestation than localized ecotourism initiatives. The ecotourism effects on forest loss are visualized in Figure 9. Figure 9 summarizes the overarching trends emerging from our empirical analysis. While provincial and regional policies likely mediate some of the observed outcomes, this study emphasizes data-driven generalizations rather than case-specific policy comparisons, which will be better addressed in future policy-oriented research.
If ecotourism does not actively mitigate deforestation or enhance forest protection at most sites, its environmental claims must be critically reconsidered. The overuse of the term “eco” in tourism risks becoming a tool for marketing rather than a genuine commitment to sustainability, a problem increasingly recognized globally. For instance, in China, ecotourism ventures often prioritize profit over conservation, undermining the ecological goals they claim to support [48]. Similarly, in Kenya and Ghana, “eco” branding has been criticized for masking unsustainable practices, leading to calls for stricter oversight and accountability in the sector [49,50]. In Vietnam, rapid growth in ecotourism has outpaced conservation planning, resulting in significant ecological degradation despite claims of environmental stewardship [51].

5.2. Regional Variation in Ecotourism’s Effectiveness

The observed regional variances in forest loss trends underscore the critical need for tailored conservation strategies that consider environmental, socio-economic, and governance differences. Sumatera, identified as a hotspot for dynamic forest loss trends, exemplifies the dual challenges and opportunities in addressing deforestation. Previous studies suggest that Sumatera’s high deforestation rates are driven by agricultural expansion, infrastructure development, and weak enforcement of conservation policies [46]. While areas showing recovery indicate some success of localized interventions, these efforts must be scaled and strengthened through integrated land-use planning and stricter governance [52]. Sulawesi’s recovery trends, with limited increases in forest loss, align with findings that community-based conservation initiatives and ecotourism programs can foster forest regeneration when paired with effective local governance [53,54].
Kalimantan’s encouraging recovery trends, with no significant increases in forest loss, may reflect the success of conservation-focused policies and partnerships between national park authorities and local stakeholders. The region’s progress mirrors findings from other tropical regions where strategic governance and community engagement have led to forest recovery [55,56]. Counterfactual analysis further supports Kalimantan’s excellence in ecotourism-driven conservation. It is the only region where forest loss trends around ecotourism sites are significantly lower than those around non-ecotourism sites. This suggests that ecotourism in Kalimantan effectively mitigates deforestation, potentially through its alignment with community-based management and the enforcement of land-use regulations [57,58].
While Kalimantan’s success in mitigating deforestation through ecotourism is evident in quantitative trends, a closer qualitative lens reveals an important dimension: it is not the volume but the governance quality of ecotourism that appears to drive conservation outcomes. Kalimantan hosts relatively fewer ecotourism sites than Sumatra, yet these initiatives are often better integrated with local governance and conservation frameworks. This controlled scale may facilitate closer monitoring, stronger community ownership, and adherence to the principles of genuine ecotourism. In contrast, the rapid expansion of ecotourism in Sumatra presents greater challenges in ensuring ecological integrity and accountability. Without stringent oversight, the risk of “greenwashing”—where tourism is framed as eco-friendly but fails to deliver real conservation value—may undermine efforts. Thus, future conservation strategies should not only scale ecotourism but also prioritize quality, governance, and alignment with local ecological contexts.
Meanwhile, the stability observed in regions like Bali and Nusa Tenggara, Jawa, and Maluku and Papua suggests the absence of significant pressures but also highlights potential underutilization of ecotourism as a conservation tool. For Jawa and Bali specifically, this stability is likely influenced by their high population densities and the limited availability of remaining forests. Most of the forests in these regions are confined to protected landscapes, reducing the opportunity for further forest loss simply because so little forest area remains [9,59]. These findings align with previous research emphasizing how population pressures and urbanization leave small, fragmented forest patches that are less prone to new deforestation but require sustained management to prevent degradation [60,61]. Urbanization often limits deforestation directly but increases indirect pressures on biodiversity through habitat fragmentation and resource demand [62]. In such contexts, ecotourism’s role should focus on maintaining these protected areas while enhancing public awareness and support for broader conservation initiatives [63].
These regional differences highlight the necessity of adaptive and context-specific conservation approaches. Kalimantan’s success demonstrates the potential of ecotourism interventions to deliver measurable conservation benefits, emphasizing the importance of governance, community participation, and consistent monitoring. By understanding why these interventions succeed in Kalimantan, policymakers can adapt similar strategies as those of Sumatera and Sulawesi to counteract their dynamic forest loss trends and of stable regions to reinforce resilience against emerging threats. Integrating ecotourism with broader socio-economic and policy frameworks will be pivotal to ensuring Indonesia’s long-term forest preservation.

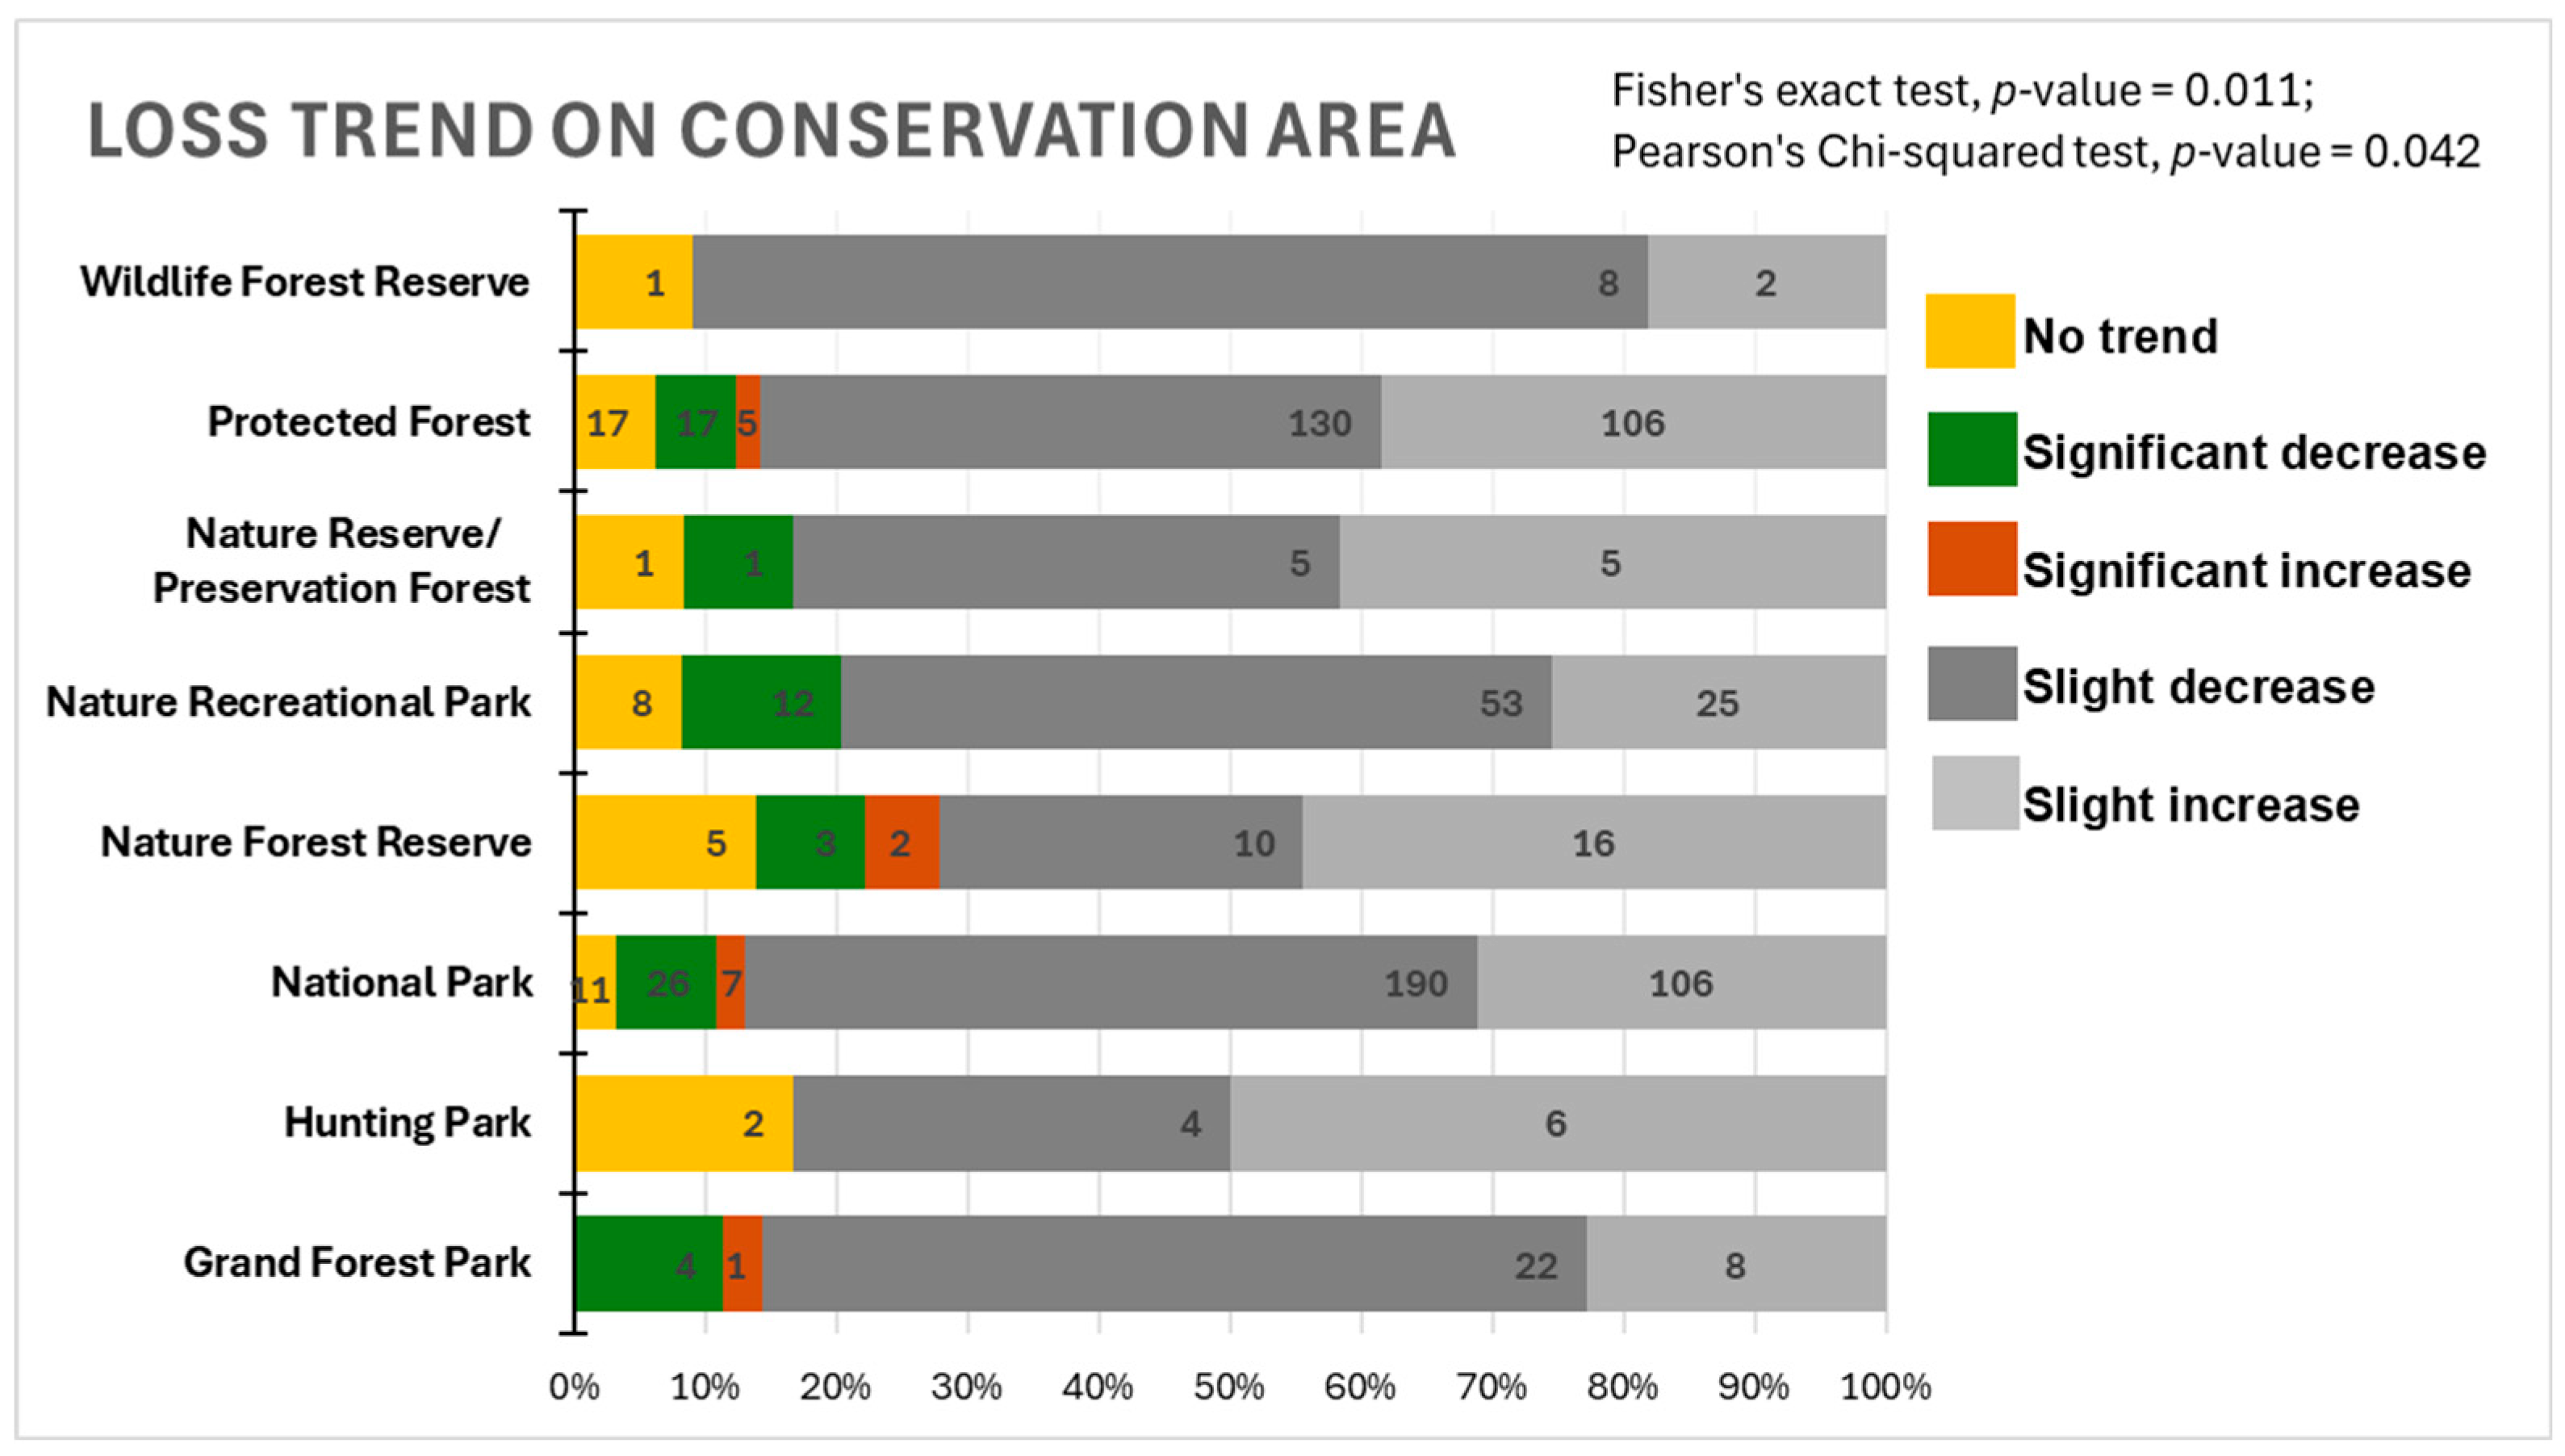
5.3. Conservation Area Types and Forest Loss Trends Around Ecotourism Areas

Protected Forests and National Parks emerge as relatively effective in mitigating forest loss near ecotourism sites. This effectiveness likely stems from stricter regulations and enforcement mechanisms, coupled with enhanced ecological protection policies designed to support biodiversity and landscape conservation [64,65]. National Parks, in particular, benefit from strong international and national frameworks such as UNESCO World Heritage designations and Indonesia’s Strategic Plan for National Parks that provide additional funding and monitoring resources. Despite positive trends in some areas, certain ecotourism sites within Protected Forests and National Parks exhibit significant increases in forest loss, raising serious concerns about localized management failures. These negative trends may be driven by factors such as inadequate enforcement of conservation policies, unregulated tourism infrastructure development, and illegal logging activities within or near ecotourism zones [66]. Furthermore, the issue extends beyond ecotourism-specific areas, as National Parks in Indonesia overall experienced a forest loss of 1.07% between 2012 and 2017, reflecting broader challenges in conservation management [67].
Conversely, conservation types like Grand Forest Parks, Hunting Parks, and Wildlife Forest Reserves show limited effectiveness. Unlike National Parks and Protected Forests, these areas often prioritize other objectives—such as recreation, hunting, or specific wildlife protection—over forest conservation [68]. Additionally, many of these areas face overlapping land-use pressures, limited resources, and weak governance, which exacerbate deforestation risks near ecotourism sites [69,70]. This lack of focus on forest protection limits their ability to leverage ecotourism as a tool for sustainable conservation.
While some areas benefit from enhanced ecotourism initiatives that foster community engagement and ecological monitoring, others remain vulnerable to pressures like illegal land use and tourism-driven deforestation [71]. Strengthening ecotourism policies in these areas, alongside improved resource allocation and governance, could reduce variability and amplify positive conservation impacts [72].

5.4. Site-Specific Ecotourism Strategies and Their Correlation to Forest Conservation

The varied impacts of ecotourism on forest conservation at Tanjung Puting National Park, Bat Cave in Bukit Lawang, and Kerinci Seblat National Park highlight the complex interplay between ecotourism strategies, conservation area types, and regional contexts. These cases offer critical insights into how site-specific approaches influence forest loss trends and underscore the necessity for tailored interventions.
Tanjung Puting National Park exemplifies a successful integration of ecotourism and conservation. Located within a National Park—a conservation type prioritized for strict biodiversity protection—Tanjung Puting benefits from policies that align ecotourism with conservation objectives. Activities like guided wildlife tours, particularly focused on orangutan habitats, and traditional boating engage visitors while emphasizing ecological stewardship [73]. The park’s decreasing forest loss trends in most proximity areas suggest that its model of leveraging ecotourism as a funding source for conservation, alongside community-based initiatives, is effective. Additionally, government support and public–private partnerships have strengthened enforcement and infrastructure planning, reducing deforestation risks.
Conversely, Bat Cave in Bukit Lawang, situated in Gunung Leuser National Park, highlights the challenges of poorly managed ecotourism. While categorized as a National Park, this site lacks structured ecotourism programs that prioritize forest conservation. Instead, tourism primarily revolves around recreational activities like cave exploration, which often lack conservation-oriented frameworks [74]. The observed increases in forest loss in multiple proximity areas suggest that unregulated infrastructure expansion and tourism activities may be exacerbating habitat degradation. Limited enforcement, coupled with the absence of sustainable tourism planning, underscores the urgent need for structured interventions that align tourism activities with conservation goals [75].
Kerinci Seblat National Park presents a nuanced case with both positive and negative impacts on forest loss. The park’s mixed trends—forest loss increases near some proximity areas and decreases near others—indicate that outcomes are heavily influenced by local governance and land-use pressures [76]. Ecotourism strategies here emphasize trekking and wildlife viewing, often in partnership with local communities. However, the park’s vulnerability to infrastructure projects, such as the Trans-Sumatra Highway, complicates its conservation outcomes [77]. Strengthening collaborative management frameworks between local stakeholders and national park authorities could mitigate these challenges.

5.5. Implication to Ecotourism Planning and Policy

To address the issue highlighted by this study, ecotourism planning must prioritize site suitability assessments, ensuring ecological sensitivity and conservation objectives guide development. Strengthening governance, as seen in Kalimantan, is essential for reducing forest loss and enforcing sustainable practices [47,53]. Where conservation goals cannot be achieved, alternative tourism models—such as cultural tourism, rural tourism, village tourism, agrotourism, and recreation—should be considered to avoid the overuse of the ecotourism concept [78,79,80].
Policymakers play a critical role in supporting this shift. They should integrate measurable conservation targets into ecotourism projects, including reforestation initiatives, community-based conservation, and biodiversity monitoring. These targets must be incorporated into national and regional tourism policies to ensure alignment with broader sustainability goals. Independent certification programs and regular impact assessments are critical for ensuring accountability and distinguishing genuine conservation efforts from superficial “eco” branding [48,63]. Moreover, governments should consider offering incentives for ecotourism operators that demonstrate measurable environmental benefits, while enforcing stricter regulations for those that fail to meet conservation standards. By diversifying tourism models and enhancing accountability, ecotourism can contribute more effectively to forest preservation while avoiding misuse as a mere marketing tool. Strengthening the policy framework will help ensure ecotourism serves as a genuine mechanism for conservation, not just economic development.

5.6. Limitation and Future Studies

While this study provides valuable insights into the relationship between ecotourism and forest loss in Indonesia, several limitations warrant attention. Firstly, the analysis relies heavily on remote sensing and GIS-based forest cover data, which, while robust for tracking land-use changes, do not account for qualitative nuances such as local governance structures, community participation, or specific management practices at individual ecotourism sites. These factors are critical in shaping conservation outcomes but remain beyond the scope of this study.
Secondly, this study focuses exclusively on environmental outcomes, particularly forest loss, without examining other dimensions of ecotourism, such as socio-economic and cultural impacts. While forest conservation is a vital goal, ecotourism’s success is also measured by its ability to provide economic benefits to local communities and preserve cultural heritage. Neglecting these dimensions limits the holistic understanding of its overall effectiveness. Lastly, the temporal scope of this study may not fully capture long-term ecological and policy shifts that influence forest loss trends. Future research should integrate longitudinal data with interviews and participatory approaches to enrich the findings.
Acknowledging these limitations underscores the need for multidisciplinary studies that incorporate both quantitative and qualitative methodologies, enabling a more comprehensive understanding of ecotourism’s role in achieving its core benefits, especially for the environment.

6. Conclusions

This study demonstrates that most ecotourism sites in Indonesia exhibit no significant differences in forest loss trends compared to non-ecotourism sites, showing no substantial impact on deforestation. Alarmingly, some sites even experience higher forest loss rates than national and regional averages. These findings underscore the ineffectiveness of ecotourism in reducing forest loss and highlight that forest loss is more strongly influenced by regional conservation policies and broader socio-environmental factors than proximity to ecotourism activities. While certain ecotourism hubs have shown positive outcomes, these cases remain exceptions rather than the rule, suggesting that ecotourism, as currently practiced, does not consistently deliver its intended environmental benefits.
Future research should extend beyond forest cover analysis to evaluate the economic and social dimensions of ecotourism. Investigations into how ecotourism influences local livelihoods, community empowerment, and cultural preservation could provide a more comprehensive assessment of its sustainability. Moreover, studies should explore the role of governance, policy frameworks, and financial incentives in driving successful conservation outcomes. Specific attention should be paid to the mechanisms by which conservation areas with robust regional policies have achieved reduced forest loss, offering potential models for replication. Finally, integrating advanced technologies such as remote sensing with participatory approaches like stakeholder interviews could bridge the gap between ecological data and community-based insights, ultimately enhancing ecotourism’s alignment with conservation and sustainability goals.
In addition, ecotourism holds untapped potential as a public environmental education tool. Future initiatives could leverage ecotourism experiences to raise awareness about conservation, promote pro-environmental behaviors, and foster public engagement in addressing broader challenges such as biodiversity loss and the climate crisis.
This research serves as a pivotal foundation for rethinking Indonesia’s ecotourism strategies. To maximize environmental and socio-economic benefits, future initiatives must prioritize adaptive management practices, align local and national policies, and foster collaborations between government, communities, and conservation organizations.

Author Contributions

Conceptualization, S.S. and K.F.; Formal analysis, S.S.; Methodology, S.S.; Supervision, K.F.; Writing—original draft, review and editing, S.S. All authors have read and agreed to the published version of the manuscript.

Funding

This research received no external funding.

Data Availability Statement

This study utilized publicly available datasets: the ecotourism spatial dataset from Sisriany and Furuya (2024) (https://doi.org/10.3390/land13030370) and the global forest cover change data from Hansen et al. (2013) (https://doi.org/10.1126/science.1244693). Summary results, including forest loss trend analyses, are provided in Appendix A. More detailed datasets and processed outputs supporting these findings are available from the corresponding author upon reasonable request.

Conflicts of Interest

The authors declare no conflicts of interest.

Appendix A

Table A1. List of detected significant forest loss trends at ecotourism sites.
NoProvinceNameLatitudeLongitudeConservation AreaDistance Significant DetectedSignificant Trend
Sumatera
1AcehWisata Hutan Mangrove Kota Langsa4.52163698.0162Protected Forest3 kmDecrease
2AcehTeupin Layeu5.87152695.25749Nature Recreational Park12 kmDecrease
3North SumateraToba Caldera Resort2.607584998.94648Protected Forest6 km, 15 kmDecrease
4North SumateraBat Cave Bukit Lawang3.53545498.11727National Park3 km, 6 km, 9 kmIncrease
5North SumateraAir Terjun Sikulikap3.245429298.53399National Park3 kmIncrease
6North SumateraAir Terjun Sipitu-Pitu1.68605298.94605Protected Forest1 kmIncrease
7West SumateraLawang Adventure Park−0.280778100.2416Protected Forest6 km, 9 kmIncrease
8West SumateraLembah Anai Waterfall−0.483611100.3384Nature Forest Reserve15 kmIncrease
9West SumateraObjek Wisata Taman Suaka Alam Rimbo Panti0.3463983100.06914Nature Recreational Park3 km, 9 km, 15 kmDecrease
10West SumateraSiberut Island National Park−1.31748998.88916National Park6 kmIncrease
11JambiBerbak National Park−1.286865104.2396National Park9 km, 15 kmDecrease
12West SumateraKerinci Seblat National Park−1.70422101.26899National Park3 km, 9 kmBoth
13JambiAir Terjun Telun Berasap−1.689885101.3397National Park15 kmDecrease
14South SumateraPuntikayu Amusement Palembang−2.943726104.7283Nature Recreational Park12 km, 15 km Decrease
15South SumateraTaman Nasional Sembilang−2.035627104.6593National Park15 kmDecrease
16LampungCamp Ground Danau Lebar Suoh−5.247633104.2706National Park6 kmDecrease
17LampungWay Kambas National Park−4.927576105.7769National Park12 kmDecrease
18LampungTaman Nasional Bukit Barisan Selatan−5.448473104.3516National Park6 km, 9 kmDecrease
19LampungNirwana Keramikan−5.237233104.2593National Park6 kmDecrease
20LampungWana Wisata Tanjung Harapan−5.224397104.7919Protected Forest3 km, 6 kmDecrease
Bali & Nusa Tenggara
21BaliWest Bali National Park−8.127611114.4753National Park15 kmIncrease
22BaliBali Botanical Garden−8.276122115.1542Protected Forest3 km, 9 kmIncrease
23West Nusa TenggaraAir Terjun Tibu Bunter−8.536218116.2599Grand Forest Park15 kmIncrease
24East Nusa TenggaraKelimutu National Park−8.741548121.7936National Park15 kmDecrease
25East Nusa TenggaraPantai Litianak−10.75517122.8999Protected Forest15 kmDecrease
26East Nusa TenggaraWolokoro Ecotourism−8.81706120.9341Nature Forest Reserve6 km, 9 km, 12 kmDecrease
27East Nusa TenggaraTaman Wisata Alam Menipo−10.14851124.1491Nature Recreational Park15 kmDecrease
Kalimantan
28West KalimantanSentarum Lake National Park0.8303082112.1769National Park9 km, 12 kmDecrease
29Central KalimantanCamp Leakey−2.760856111.9448National Park15 kmDecrease
30Central KalimantanTaman Nasional Tanjung Puting−3.055015111.9184National Park6 km, 9 km, 12 km, 15 kmDecrease
31South KalimantanTaman Wisata Alam Pulau Bakut−3.215241114.5576Nature Recreational Park6 km, 9 km, 12 kmDecrease
32South KalimantanJeram Alam Roh Tujuh Belas−3.419173115.1415Grand Forest Park3 km, 6 km, 9 kmDecrease
33South KalimantanBukit Matang Kaladan−3.525424115.0094Grand Forest Park9 kmDecrease
34South KalimantanMandin Mangapan−2.860428115.5502Protected Forest6 km, 9 km, 12 kmDecrease
35South KalimantanTaman Hutan Raya Sultan Adam−3.519414114.9501Nature Reserve and Nature Preservation Forest1 kmDecrease
36Central KalimantanHutan Lindung Sei Wain−1.145255116.8397Protected Forest1 kmDecrease
37East KalimantanWisata Alam Prevab Tnkutai0.5315004117.4653National Park3 kmDecrease
Sulawesi
38North SulawesiEkowisata Mangrove Desa Bahoi1.7180899125.02Protected Forest12 kmDecrease
39North SulawesiTangkoko Batuangus Nature Reserve1.5082463125.1882Nature Forest Reserve9 kmIncrease
40North SulawesiPantai Lakban Ratatotok0.8492183124.7087Protected Forest12 kmDecrease
41North SulawesiObyek Wisata Pantai Batu Pinagut0.9202904123.2694Protected Forest12 kmDecrease
42South SulawesiIde Beach−2.51529121.3423Nature Recreational Park9 km, 15 kmDecrease
43South SulawesiAir Terjun Sarambu Ala−2.704501120.1323Protected Forest3 km, 6 km, 9 kmDecrease
44Southeast SulawesiTaman Nasional Rawa Aopa Watumohai−4.438332121.8733National Park6 km, 9 km, 12 kmDecrease
45Southeast SulawesiAir Panas Wawolesea−3.696262122.3033Protected Forest12 kmDecrease
46GorontaloIlomata River Camp0.6988795123.1824National Park3 km, 6 km, 9 kmDecrease
Maluku & Papua
47PapuaPantai Wagi−3.380823135.1236National Park6 kmDecrease

References

  1. Schmitt, S.; Raevel, V.; Réjou-Méchain, M.; Ayyappan, N.; Balachandran, N.; Barathan, N.; Rajashekar, G.; Munoz, F. Canopy and Understorey Tree Guilds Respond Differently to the Environment in an Indian Rain Forest. J. Veg. Sci. 2021, 32, e13075. [Google Scholar] [CrossRef]
  2. Wade, C.M.; Austin, K.G.; Cajka, J.; Lapidus, D.; Everett, K.H.; Galperin, D.; Maynard, R.; Sobel, A. What Is Threatening Forests in Protected Areas? A Global Assessment of Deforestation in Protected Areas, 2001–2018. Forests 2020, 11, 539. [Google Scholar] [CrossRef]
  3. van Wees, D.; van der Werf, G.R.; Randerson, J.T.; Andela, N.; Chen, Y.; Morton, D.C. The Role of Fire in Global Forest Loss Dynamics. Glob. Chang. Biol. 2021, 27, 2377–2391. [Google Scholar] [CrossRef] [PubMed]
  4. Ramachandran, N.; Irvin, J.; Sheng, H.; Johnson-Yu, S.; Story, K.; Rustowicz, R.; Ng, A.Y.; Austin, K. Automatic Deforestation Driver Attribution Using Deep Learning on Satellite Imagery. Glob. Environ. Chang. 2024, 86, 102843. [Google Scholar] [CrossRef]
  5. Austin, K.G.; Baker, J.S.; Sohngen, B.L.; Wade, C.M.; Daigneault, A.; Ohrel, S.B.; Ragnauth, S.; Bean, A. The Economic Costs of Planting, Preserving, and Managing the World’s Forests to Mitigate Climate Change. Nat. Commun. 2020, 11, 5946. [Google Scholar] [CrossRef] [PubMed]
  6. Knoke, T.; Hanley, N.; Roman-Cuesta, R.M.; Groom, B.; Venmans, F.; Paul, C. Trends in Tropical Forest Loss and the Social Value of Emission Reductions. Nat. Sustain. 2023, 6, 1373–1384. [Google Scholar] [CrossRef]
  7. Honey, M. Community Conservation and Early Ecotourism: Experiments in Kenya. Environ. Sci. Policy Sustain. Dev. 2009, 51, 46–57. [Google Scholar] [CrossRef]
  8. Stronza, A.; Pêgas, F. Ecotourism and Conservation: Two Cases from Brazil and Peru. Hum. Dimens. Wildl. 2008, 13, 263–279. [Google Scholar] [CrossRef]
  9. Margono, B.A.; Potapov, P.V.; Turubanova, S.; Stolle, F.; Hansen, M.C. Primary Forest Cover Loss in Indonesia over 2000–2012. Nat. Clim. Chang. 2014, 4, 730–735. [Google Scholar] [CrossRef]
  10. Brandt, J.S.; Buckley, R.C. A Global Systematic Review of Empirical Evidence of Ecotourism Impacts on Forests in Biodiversity Hotspots. Curr. Opin. Environ. Sustain. 2018, 32, 112–118. [Google Scholar] [CrossRef]
  11. Okech, R.N. Ecotourism Development and Challenges: A Kenyan Experience. Tour. Anal. 2011, 16, 19–30. [Google Scholar] [CrossRef]
  12. Mondino, E.; Beery, T. Ecotourism as a Learning Tool for Sustainable Development. The Case of Monviso Transboundary Biosphere Reserve, Italy. J. Ecotourism 2019, 18, 107–121. [Google Scholar] [CrossRef]
  13. Zambrano, A.M.A.; Broadbent, E.N.; Durham, W.H. Social and Environmental Effects of Ecotourism in the Osa Peninsula of Costa Rica: The Lapa Rios Case. J. Ecotourism 2010, 9, 62–83. [Google Scholar] [CrossRef]
  14. Almeyda, A.M.; Broadbent, E.N.; Wyman, M.S.; Durham, W.H. Ecotourism Impacts in the Nicoya Peninsula, Costa Rica. J. Tour. Res. 2010, 12, 803–819. [Google Scholar] [CrossRef]
  15. Stem, C.J.; Lassoie, J.P.; Lee, D.R.; Deshler, D.J. How “Eco” Is Ecotourism? A Comparative Case Study of Ecotourism in Costa Rica. J. Sustain. Tour. 2003, 11, 322–347. [Google Scholar] [CrossRef]
  16. Kiss, A. Is Community-Based Ecotourism a Good Use of Biodiversity Conservation Funds? Trends Ecol. Evol. 2004, 19, 232–237. [Google Scholar] [CrossRef]
  17. Campbell-Hunt, D.M. Ecotourism and Sustainability in Community-Driven Ecological Restoration: Case Studies from New Zealand. WIT Trans. Ecol. Environ. 2008, 115, 231–240. [Google Scholar]
  18. Ali, A.; Isa, S.S.; Isa, S.S.; Isa, M.H. Ecotourism Promotes Conservation Activity at Tourism Destinations: Limestone Forest Langkawi. Environ.-Behav. Proc. J. 2021, 6, 107–113. [Google Scholar] [CrossRef]
  19. Svoronou, E.; Holden, A. Ecotourism as a Tool for Nature Conservation: The Role of WWF Greece in the Dadia-Lefkimi-Soufli Forest Reserve in Greece. J. Sustain. Tour. 2005, 13, 456–467. [Google Scholar] [CrossRef]
  20. Butarbutar, R.R.; Soemarno, S. Community Empowerment Efforts in Sustainable Ecotourism Management in North Sulawesi, Indonesia. Indones. J. Environ. Sustain. Dev. 2012, 3. [Google Scholar]
  21. Kinnaird, M.F.; O’Brien, T.G. Ecotourism in the Tangkoko DuaSudara Nature Reserve: Opening Pandora’ Box? Oryx 1996, 30, 65–73. [Google Scholar] [CrossRef]
  22. Satyatama, T.; Faida, L.R.W.; Purwanto, R.H.; Fandeli, C. Carving The Future of Nature Ecotourism in Indonesia: Case of Taman Wisata Alam Telogo Warno Telogo Pengilon. J. Manaj. Hutan Trop. 2020, 26, 80–89. [Google Scholar] [CrossRef]
  23. Surya, A.P. The Role of Ecotourism in Promoting Sustainable Economic Development in Indonesia. JWE 2024, 3, 43–48. [Google Scholar] [CrossRef]
  24. Antari, N.P.B.W.; Connell, D. Tukad Bindu in Bali, Indonesia: Ecotourism or Greenwashing? Int. J. Tour. Cities 2021, 7, 1049–1075. [Google Scholar] [CrossRef]
  25. Anggraini, R.I.; Gunawan, B. Ecotourism Development in National Parks: A New Paradigm of Forest Management in Indonesia. E3S Web Conf. 2021, 249, 03010. [Google Scholar] [CrossRef]
  26. Satrya, I.D.G.; Kaihatu, T.S.; Budidharmanto, L.P.; Karya, D.F.; Rusadi, N.W.P. The Role of Ecotourism in Preserving Environmental Awareness, Cultural and Natural Attractiveness for Promoting Local Communities in Bali, Indonesia. J. East. Eur. Cent. Asian Res. 2023, 10, 1063–1075. [Google Scholar] [CrossRef]
  27. Chaplin, J.; Brabyn, L. Using Remote Sensing and GIS to Investigate the Impacts of Tourism on Forest Cover in the Annapurna Conservation Area, Nepal. Appl. Geogr. 2013, 43, 159–168. [Google Scholar] [CrossRef]
  28. Setyowati, H.A.; Dwinugroho, M.P.; Murti, B.S.S.H.; Yulianto, A.; Ajiwihanto, N.E.; Hadinata, J.; Sanjiwana, A.K. ESDM One Map Indonesia Indonesia: Opportunities and Challenges to Support One Map Policy Based on Applied Web-GIS. IOP Conf. Ser. Earth Environ. Sci. 2018, 165, 012021. [Google Scholar] [CrossRef]
  29. Rahman, A. Agricultural Transformation in Indonesia: Evaluation of Policy Implementation and Challenges Faced. J. Ilm. Ilmu Adm. Publik 2022, 12, 691–700. [Google Scholar] [CrossRef]
  30. Brandt, J.S.; Radeloff, V.; Allendorf, T.; Butsic, V.; Roopsind, A. Effects of Ecotourism on Forest Loss in the Himalayan Biodiversity Hotspot Based on Counterfactual Analyses. Conserv. Biol. 2019, 33, 1318–1328. [Google Scholar] [CrossRef]
  31. Martha, S. The Analysis of Geospatial Information for Validating Some Numbers of Islands in Indonesia. Indones. J. Geogr. 2017, 49, 204–211. [Google Scholar] [CrossRef]
  32. Hansen, M.C.; Potapov, P.V.; Moore, R.; Hancher, M.; Turubanova, S.A.; Tyukavina, A.; Thau, D.; Stehman, S.V.; Goetz, S.J.; Loveland, T.R.; et al. High-Resolution Global Maps of 21st-Century Forest Cover Change. Science 2013, 342, 850–853. [Google Scholar] [CrossRef]
  33. Zhang, D.; Wang, H.; Wang, X.; Lü, Z. Accuracy Assessment of the Global Forest Watch Tree Cover 2000 in China. Int. J. Appl. Earth Obs. Geoinf. 2020, 87, 102033. [Google Scholar] [CrossRef]
  34. Souza, C.; Tenneson, K.; Dilger, J.; Wespestad, C.; Bullock, E. Forest Degradation and Deforestation. In Cloud-Based Remote Sensing with Google Earth Engine: Fundamentals and Applications; Cardille, J.A., Crowley, M.A., Saah, D., Clinton, N.E., Eds.; Springer International Publishing: Cham, Switzerland, 2024; pp. 1061–1091. ISBN 978-3-031-26588-4. [Google Scholar]
  35. Sisriany, S.; Furuya, K. Understanding the Spatial Distribution of Ecotourism in Indonesia and Its Relevance to the Protected Landscape. Land 2024, 13, 370. [Google Scholar] [CrossRef]
  36. MoF (Ministry of Forestry of Indonesia). Consolidation Report: Reducing Emissions from Deforestation and Forest Degradation in Indonesia; Forestry Research and Development Agency (FORDA): Jakarta, Indonesia, 2008. [Google Scholar]
  37. Ribas, L.G.S.; Pressey, R.L.; Bini, L.M. Estimating Counterfactuals for Evaluation of Ecological and Conservation Impact: An Introduction to Matching Methods. Biol. Rev. 2021, 96, 1186–1204. [Google Scholar] [CrossRef]
  38. Jones, K.W.; Lewis, D.J. Estimating the Counterfactual Impact of Conservation Programs on Land Cover Outcomes: The Role of Matching and Panel Regression Techniques. PLoS ONE 2015, 10, e0141380. [Google Scholar] [CrossRef]
  39. Fiorini, A.C.O.; Mullally, C.; Swisher, M.; Putz, F.E. Forest Cover Effects of Payments for Ecosystem Services: Evidence from an Impact Evaluation in Brazil. Ecol. Econ. 2020, 169, 106522. [Google Scholar] [CrossRef]
  40. Reygadas, Y.; Jensen, J.L.R.; Moisen, G.G. Forest Degradation Assessment Based on Trend Analysis of MODIS-Leaf Area Index: A Case Study in Mexico. Remote Sens. 2019, 11, 2503. [Google Scholar] [CrossRef]
  41. Santos, C.A.G.; Do Nascimento, T.V.M.; Da Silva, R.M. Analysis of Forest Cover Changes and Trends in the Brazilian Semiarid Region between 2000 and 2018. Environ. Earth Sci. 2020, 79, 418. [Google Scholar] [CrossRef]
  42. Frimpong, B.F.; Koranteng, A.; Molkenthin, F. Analysis of Temperature Variability Utilising Mann–Kendall and Sen’s Slope Estimator Tests in the Accra and Kumasi Metropolises in Ghana. Env. Syst. Res. 2022, 11, 24. [Google Scholar] [CrossRef]
  43. Lin, Y.; Zuo, X.; Weng, A.; Nizamani, M.M.; Jin, Y.; Wen, L.; Zhao, Q.; Li, B. Insight into the Imbalance of Forest Cover Change at County Level in Mainland China during 2000–2020: From the Perspective of Subdividing Forest Cover Change into Forest Gain and Loss. J. Clean. Prod. 2024, 453, 142238. [Google Scholar] [CrossRef]
  44. Pohlert, T. Trend: Non-Parametric Trend Tests and Change-Point Detection 2015, (Version 1.1.6) [R package]. Comprehensive R Archive Network (CRAN). Available online: https://CRAN.R-project.org/package=trend (accessed on 1 March 2025).
  45. Brandt, J.; Ertel, J.; Spore, J.; Stolle, F. Wall-to-Wall Mapping of Tree Extent in the Tropics with Sentinel-1 and Sentinel-2. Remote Sens. Environ. 2023, 292, 113574. [Google Scholar] [CrossRef]
  46. Gaveau, D.L.A.; Sheil, D.; Husnayaen; Salim, M.A.; Arjasakusuma, S.; Ancrenaz, M.; Pacheco, P.; Meijaard, E. Rapid Conversions and Avoided Deforestation: Examining Four Decades of Industrial Plantation Expansion in Borneo. Sci. Rep. 2016, 6, 32017. [Google Scholar] [CrossRef]
  47. Purnomo, M.; Maryudi, A.; Andriatmoko, N.D.; Jayadi, E.M.; Faust, H. The Cost of Leisure: The Political Ecology of the Commercialization of Indonesia’s Protected Areas. Environ. Sociol. 2022, 8, 121–133. [Google Scholar] [CrossRef]
  48. Li, Y.; Zhang, L.; Gao, Y.; Huang, Z.; Cui, L.; Liu, S.; Fang, Y.; Ren, G.; Fornacca, D.; Xiao, W. Ecotourism in China, Misuse or Genuine Development? An Analysis Based on Map Browser Results. Sustainability 2019, 11, 4997. [Google Scholar] [CrossRef]
  49. Atieno, L.; Njoroge, J.M. The Ecotourism Metaphor and Environmental Sustainability in Kenya. Tour. Hosp. Res. 2015, 18, 49–60. [Google Scholar] [CrossRef]
  50. Büscher, B.; van den Bremer, R.; Fletcher, R.; Koot, S. Authenticity and the Contradictions of the “Ecotourism Script”: Global Marketing and Local Politics in Ghana. Crit. Arts 2017, 31, 37–52. [Google Scholar] [CrossRef]
  51. Dang, T.K.P. Green Nature or Green Fantasies: Representations of Ecotourism in Vietnam. Sustainability 2023, 15, 4601. [Google Scholar] [CrossRef]
  52. Austin, K.G.; Schwantes, A.; Gu, Y.; Kasibhatla, P.S. What Causes Deforestation in Indonesia? Environ. Res. Lett. 2019, 14, 024007. [Google Scholar] [CrossRef]
  53. Meijaard, E.; Brooks, T.M.; Carlson, K.M.; Slade, E.M.; Garcia-Ulloa, J.; Gaveau, D.L.A.; Lee, J.S.H.; Santika, T.; Juffe-Bignoli, D.; Struebig, M.J.; et al. The Environmental Impacts of Palm Oil in Context. Nat. Plants 2020, 6, 1418–1426. [Google Scholar] [CrossRef]
  54. Santika, T.; Meijaard, E.; Budiharta, S.; Law, E.A.; Kusworo, A.; Hutabarat, J.A.; Indrawan, T.P.; Struebig, M.; Raharjo, S.; Huda, I.; et al. Community Forest Management in Indonesia: Avoided Deforestation in the Context of Anthropogenic and Climate Complexities. Glob. Environ. Chang. 2017, 46, 60–71. [Google Scholar] [CrossRef]
  55. Bruner, A.G.; Gullison, R.E.; Rice, R.E.; Da Fonseca, G.A.B. Effectiveness of Parks in Protecting Tropical Biodiversity. Science 2001, 291, 125–128. [Google Scholar] [CrossRef]
  56. Heilmayr, R.; Carlson, K.M.; Benedict, J.J. Deforestation Spillovers from Oil Palm Sustainability Certification. Environ. Res. Lett. 2020, 15, 075002. [Google Scholar] [CrossRef]
  57. Analysing REDD+: Challenges and Choices; Angelsen, A., Center for International Forestry Research, Eds.; Center for International Forestry Research: Bogor, Indonesia, 2012; ISBN 978-602-8693-80-6. [Google Scholar]
  58. Lambin, E.F.; Gibbs, H.K.; Heilmayr, R.; Carlson, K.M.; Fleck, L.C.; Garrett, R.D.; le Polain de Waroux, Y.; McDermott, C.L.; McLaughlin, D.; Newton, P.; et al. The Role of Supply-Chain Initiatives in Reducing Deforestation. Nat. Clim. Chang. 2018, 8, 109–116. [Google Scholar] [CrossRef]
  59. Barlow, J.; Lennox, G.D.; Ferreira, J.; Berenguer, E.; Lees, A.C.; Nally, R.M.; Thomson, J.R.; Ferraz, S.F.D.B.; Louzada, J.; Oliveira, V.H.F.; et al. Anthropogenic Disturbance in Tropical Forests Can Double Biodiversity Loss from Deforestation. Nature 2016, 535, 144–147. [Google Scholar] [CrossRef]
  60. Busch, J.; Amarjargal, O.; Taheripour, F.; Austin, K.G.; Siregar, R.N.; Koenig, K.; Hertel, T.W. Effects of Demand-Side Restrictions on High-Deforestation Palm Oil in Europe on Deforestation and Emissions in Indonesia. Environ. Res. Lett. 2022, 17, 014035. [Google Scholar] [CrossRef]
  61. Sloan, S.; Campbell, M.J.; Alamgir, M.; Collier-Baker, E.; Nowak, M.G.; Usher, G.; Laurance, W.F. Infrastructure Development and Contested Forest Governance Threaten the Leuser Ecosystem, Indonesia. Land. Use Policy 2018, 77, 298–309. [Google Scholar] [CrossRef]
  62. Seto, K.C.; Güneralp, B.; Hutyra, L.R. Global Forecasts of Urban Expansion to 2030 and Direct Impacts on Biodiversity and Carbon Pools. Proc. Natl. Acad. Sci. USA 2012, 109, 16083–16088. [Google Scholar] [CrossRef]
  63. Stronza, A.L.; Hunt, C.A.; Fitzgerald, L.A. Ecotourism for Conservation? Annu. Rev. Environ. Resour. 2019, 44, 229–253. [Google Scholar] [CrossRef]
  64. Gray, C.L.; Hill, S.L.L.; Newbold, T.; Hudson, L.N.; Börger, L.; Contu, S.; Hoskins, A.J.; Ferrier, S.; Purvis, A.; Scharlemann, J.P.W. Local Biodiversity Is Higher inside than Outside Terrestrial Protected Areas Worldwide. Nat. Commun. 2016, 7, 12306. [Google Scholar] [CrossRef]
  65. Watson, J.E.M.; Dudley, N.; Segan, D.B.; Hockings, M. The Performance and Potential of Protected Areas. Nature 2014, 515, 67–73. [Google Scholar] [CrossRef] [PubMed]
  66. Symes, W.S.; Edwards, D.P.; Miettinen, J.; Rheindt, F.E.; Carrasco, L.R. Combined Impacts of Deforestation and Wildlife Trade on Tropical Biodiversity Are Severely Underestimated. Nat. Commun. 2018, 9, 4052. [Google Scholar] [CrossRef] [PubMed]
  67. Dwiyahreni, A.A.; Fuad, H.A.H.; Muhtar, S.; Soesilo, T.E.B.; Margules, C.; Supriatna, J. Changes in the Human Footprint in and around Indonesia’s Terrestrial National Parks between 2012 and 2017. Sci. Rep. 2021, 11, 4510. [Google Scholar] [CrossRef]
  68. Lindsey, P.A.; Petracca, L.S.; Funston, P.J.; Bauer, H.; Dickman, A.; Everatt, K.; Flyman, M.; Henschel, P.; Hinks, A.E.; Kasiki, S.; et al. The Performance of African Protected Areas for Lions and Their Prey. Biol. Conserv. 2017, 209, 137–149. [Google Scholar] [CrossRef]
  69. Fischer, R.; Giessen, L.; Günter, S. Governance Effects on Deforestation in the Tropics: A Review of the Evidence. Environ. Sci. Policy 2020, 105, 84–101. [Google Scholar] [CrossRef]
  70. Ward, M.; Saura, S.; Williams, B.; Ramírez-Delgado, J.P.; Arafeh-Dalmau, N.; Allan, J.R.; Venter, O.; Dubois, G.; Watson, J.E.M. Just Ten Percent of the Global Terrestrial Protected Area Network Is Structurally Connected via Intact Land. Nat. Commun. 2020, 11, 4563. [Google Scholar] [CrossRef]
  71. Dinerstein, E.; Olson, D.; Joshi, A.; Vynne, C.; Burgess, N.D.; Wikramanayake, E.; Hahn, N.; Palminteri, S.; Hedao, P.; Noss, R.; et al. An Ecoregion-Based Approach to Protecting Half the Terrestrial Realm. BioScience 2017, 67, 534–545. [Google Scholar] [CrossRef]
  72. Wilson, M.L.; Lonsdorf, E.V.; Mjungu, D.C.; Kamenya, S.; Kimaro, E.W.; Collins, D.A.; Gillespie, T.R.; Travis, D.A.; Lipende, I.; Mwacha, D.; et al. Research and Conservation in the Greater Gombe Ecosystem: Challenges and Opportunities. Biol. Conserv. 2020, 252, 108853. [Google Scholar] [CrossRef] [PubMed]
  73. Meilida, Y.; Kaarieni., N.; Tuah, S. Analysis of Ecotourism Development Strategy in Tanjung Puting Province National Park, Central Kalimantan. KnE Soc. Sci. 2020, 966–978. [Google Scholar] [CrossRef]
  74. Purwoko, A.; Kuswanda, W.; Situmorang, R.O.P.; Hutapea, F.J.; Saputra, M.H.; Pasaribu, P.H.P. Orangutan Ecotourism on Sumatra Island: Current Conditions and a Call for Further Development. Sustainability 2022, 14, 11328. [Google Scholar] [CrossRef]
  75. Yuliani, S.; Humsona, R.; Pranawa, S. Stakeholder Analysis in Community-Based Ecotourism Development in Gedong Pass. In Proceedings of the Third International Conference on Social Transformation, Community and Sustainable Development (ICSTCSD 2019), Purwokerto, Indonesia, 6–8 August 2019; Atlantis Press: Purwokerto, Indonesia, 2020. [Google Scholar]
  76. Wood, P.; Sheil, D.; Syaf, R.; Warta, Z. The Implementation and Sustainability of Village Conservation Agreements Around Kerinci Seblat National Park, Indonesia. Soc. Nat. Resour. 2014, 27, 602–620. [Google Scholar] [CrossRef]
  77. Bettinger, K.A. Political Contestation, Resource Control and Conservation in an Era of Decentralisation at Indonesia’s Kerinci Seblat National Park. Asia Pac. Viewp. 2015, 56, 252–266. [Google Scholar] [CrossRef]
  78. Fennell, D.; Weaver, D. The Ecotourium Concept and Tourism-Conservation Symbiosis. J. Sustain. Tour. 2005, 13, 373–390. [Google Scholar] [CrossRef]
  79. Klak, T. Sustainable Ecotourism Development in Central America and the Caribbean: Review of Debates and Conceptual Reformulation. Geogr. Compass 2007, 1, 1037–1057. [Google Scholar] [CrossRef]
  80. Sisriany, S.; Furuya, K. Ecotourism Policy Research Trends in Indonesia, Japan, and Australia. J. Manaj. Hutan Trop. 2020, 26, 178–188. [Google Scholar] [CrossRef]
Figure 1. Map of Indonesia as the study area.
Land 14 01237 g001
Figure 2. Flow of research methods and Datasets [32,35].
Land 14 01237 g002
Figure 3. Forest cover and forest loss in Indonesia [32] and ecotourism in Indonesia [35].
Land 14 01237 g003
Figure 4. Map of detected significant forest loss trends on ecotourism sites. Each number in this map represents an ecotourism site; see Appendix A for the detailed list.
Land 14 01237 g004
Figure 5. Proportions of forest loss trends surrounding the ecotourism sites across regions.
Land 14 01237 g005
Figure 6. Proportions of forest loss trends surrounding the ecotourism sites in conservation areas.
Land 14 01237 g006
Figure 7. Comparison of forest loss trends surrounding ecotourism and non-ecotourism.
Land 14 01237 g007
Figure 8. Comparison of forest loss trends in ecotourism and nationwide based on Mann–Kendall’s tau value.
Land 14 01237 g008
Figure 9. Ecotourism effects on forest loss in Indonesia.
Land 14 01237 g009
Table 1. Forest loss trend Interpretation.
Kendall’s Tau (τ)p-ValueSen’s Slope (b)Loss Trend
τ > 0≤0.05b > 0Significant increase
τ > 0>0.05b > 0Slight increase
τ < 0≤0.05b < 0Significant decrease
τ < 0>0.05b < 0Slight decrease
τ = 0-b = 0No trend
Table 2. Frequency of forest loss trends based on distance to ecotourism sites.
Loss Trend1 km3 km6 km9 km12 km15 kmRatio
Significant increase1434031.6%
Slight increase34454840545330.0%
Significant decrease27141513126.9%
Slight decrease60716974757346.3%
No trend76910674.9%
NA4819994410.2%
Table 3. Statistical associations between forest loss trends and key variables.
NoVariablesPearson’s Chi-Squared TestFisher’s Exact TestInterpretation
x-Squaredp-Valuep-Value
1Distance to Ecotourism18.2820.5530.427No association
2Conservation Area43.7950.042 *0.011 *Moderate association
3Region72.6110.0004998 ***0.0004998 ***Very strong association
* p < 0.05; *** p < 0.001.
Table 4. Wilcoxon rank sum test results for ecotourism and non-ecotourism.
Regionp-ValueInterpretation
Kalimantan0.0021 *Significant difference
Jawa, Bali and Nusa Tenggara0.933No significant difference
Maluku and Papua0.7612No significant difference
Sulawesi0.8564No significant difference
Sumatera0.2843No significant difference
All (Nationwide)0.5812No significant difference
* p < 0.05.
Table 5. Regional and nationwide forest loss trends in Indonesia.
RegionMann–KendallSen SlopeForest Loss Trend 1
Tau (τ)p-Value
Kalimantan−0.50.0763−10,361.7Slight decrease
Maluku and Papua−0.670.0164 *−14,649.7Significant decrease
Sulawesi−0.560.0476 *−33,173.5Significant decrease
Sumatera−0.50.0763−381.211Slight decrease
Jawa, Bali and Nusa Tenggara−0.0560.9169−117,824Slight decrease
Nationwide−0.560.0476 *−117,824Significant decrease
* p < 0.05; 1 Forest Loss Trend category is refer to Table 1
Disclaimer/Publisher’s Note: The statements, opinions and data contained in all publications are solely those of the individual author(s) and contributor(s) and not of MDPI and/or the editor(s). MDPI and/or the editor(s) disclaim responsibility for any injury to people or property resulting from any ideas, methods, instructions or products referred to in the content.

