
Multi-Scenario Simulation of the Dynamic Relationship Between Land Use and Carbon Storage in the Urbanization Process: A Case Study of Zhengzhou, China

 ,
,
Abstract
1. Introduction
2. Study Area and Data Sources
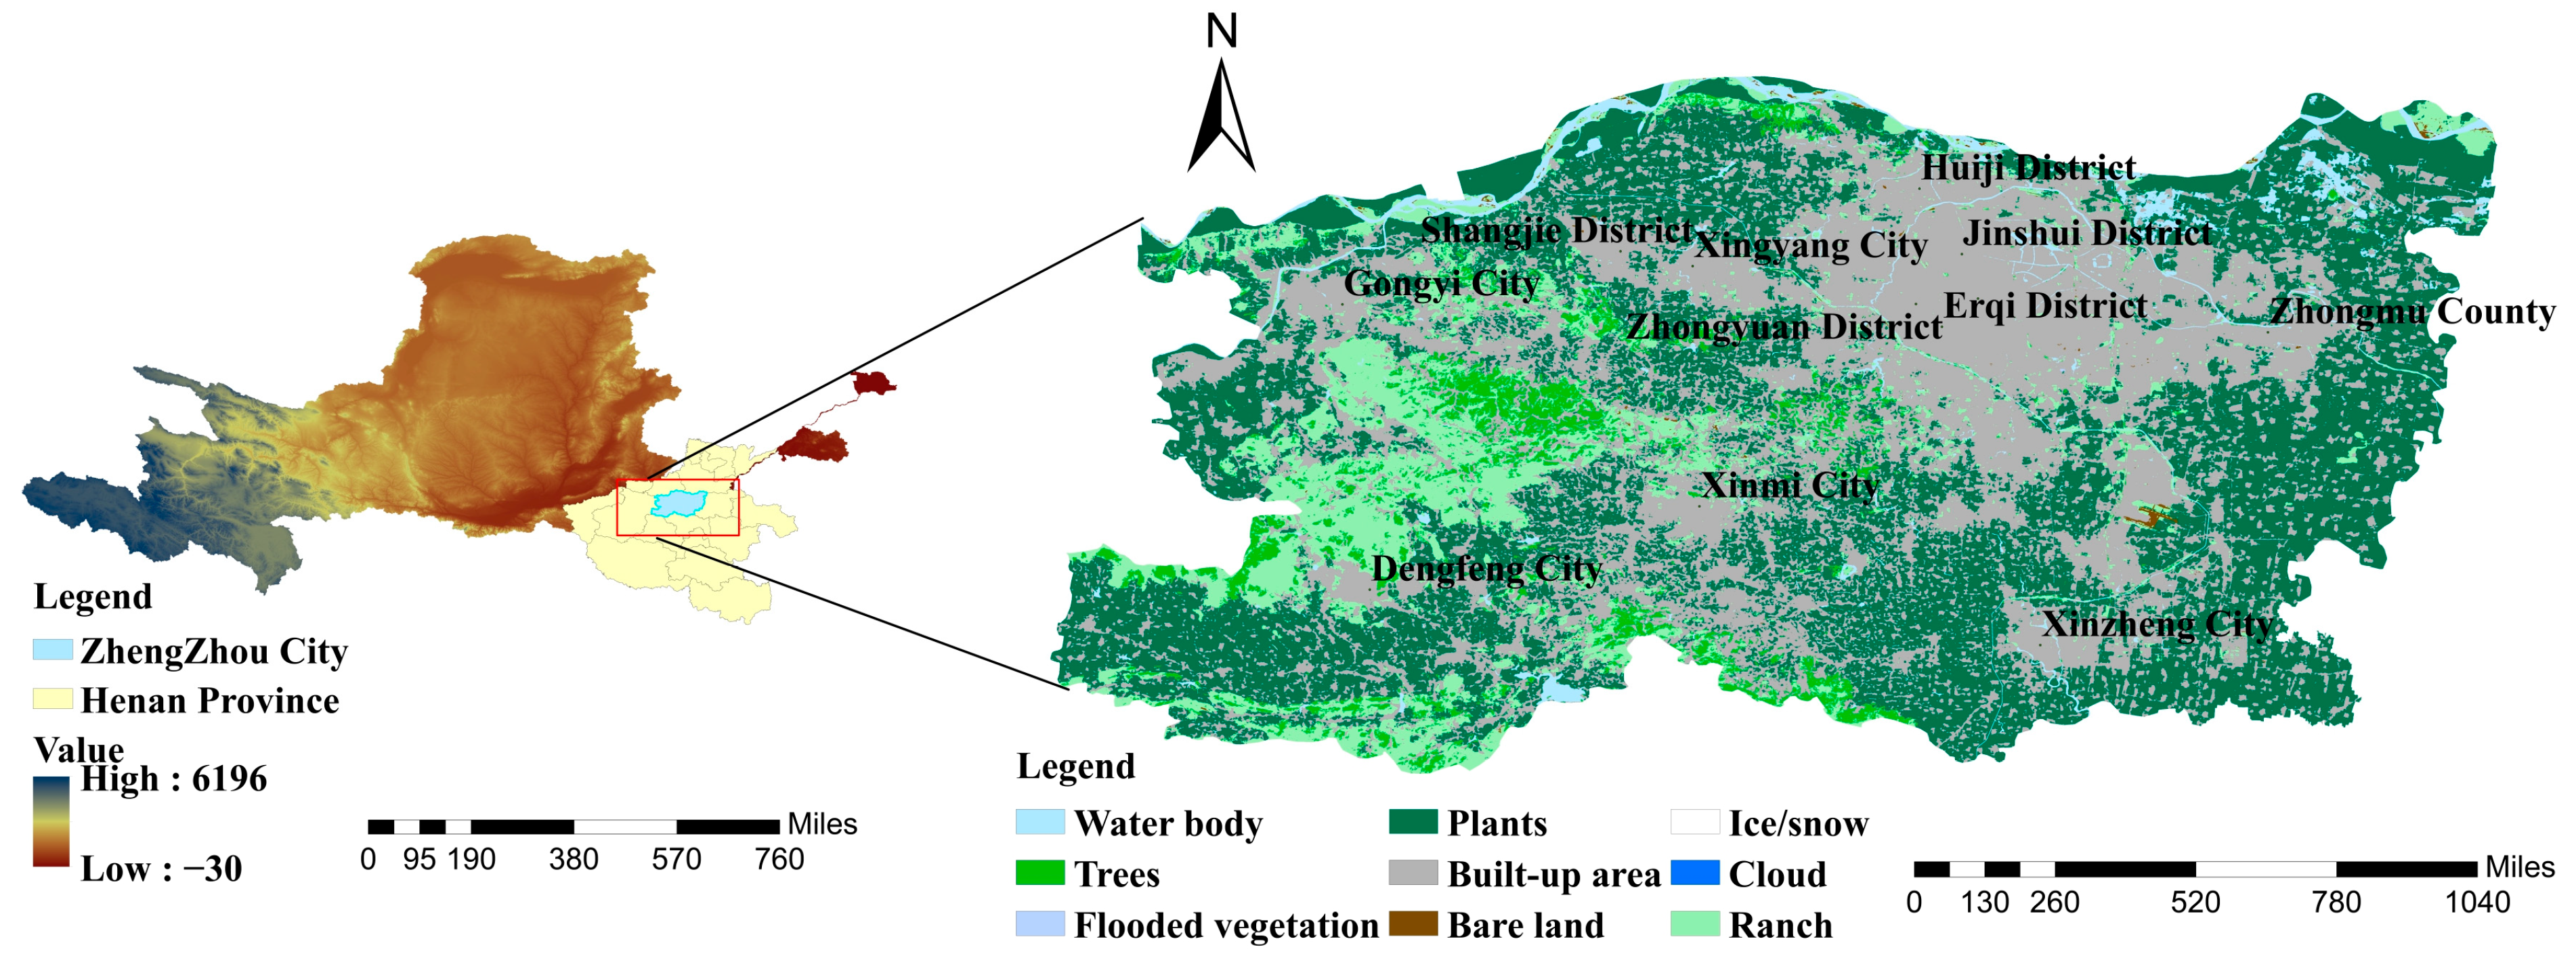
2.1. Study Area
2.2. Data Sources
- Land use data
- 2.
- Carbon density data
- 3.
- Urbanization and Socioeconomic Data
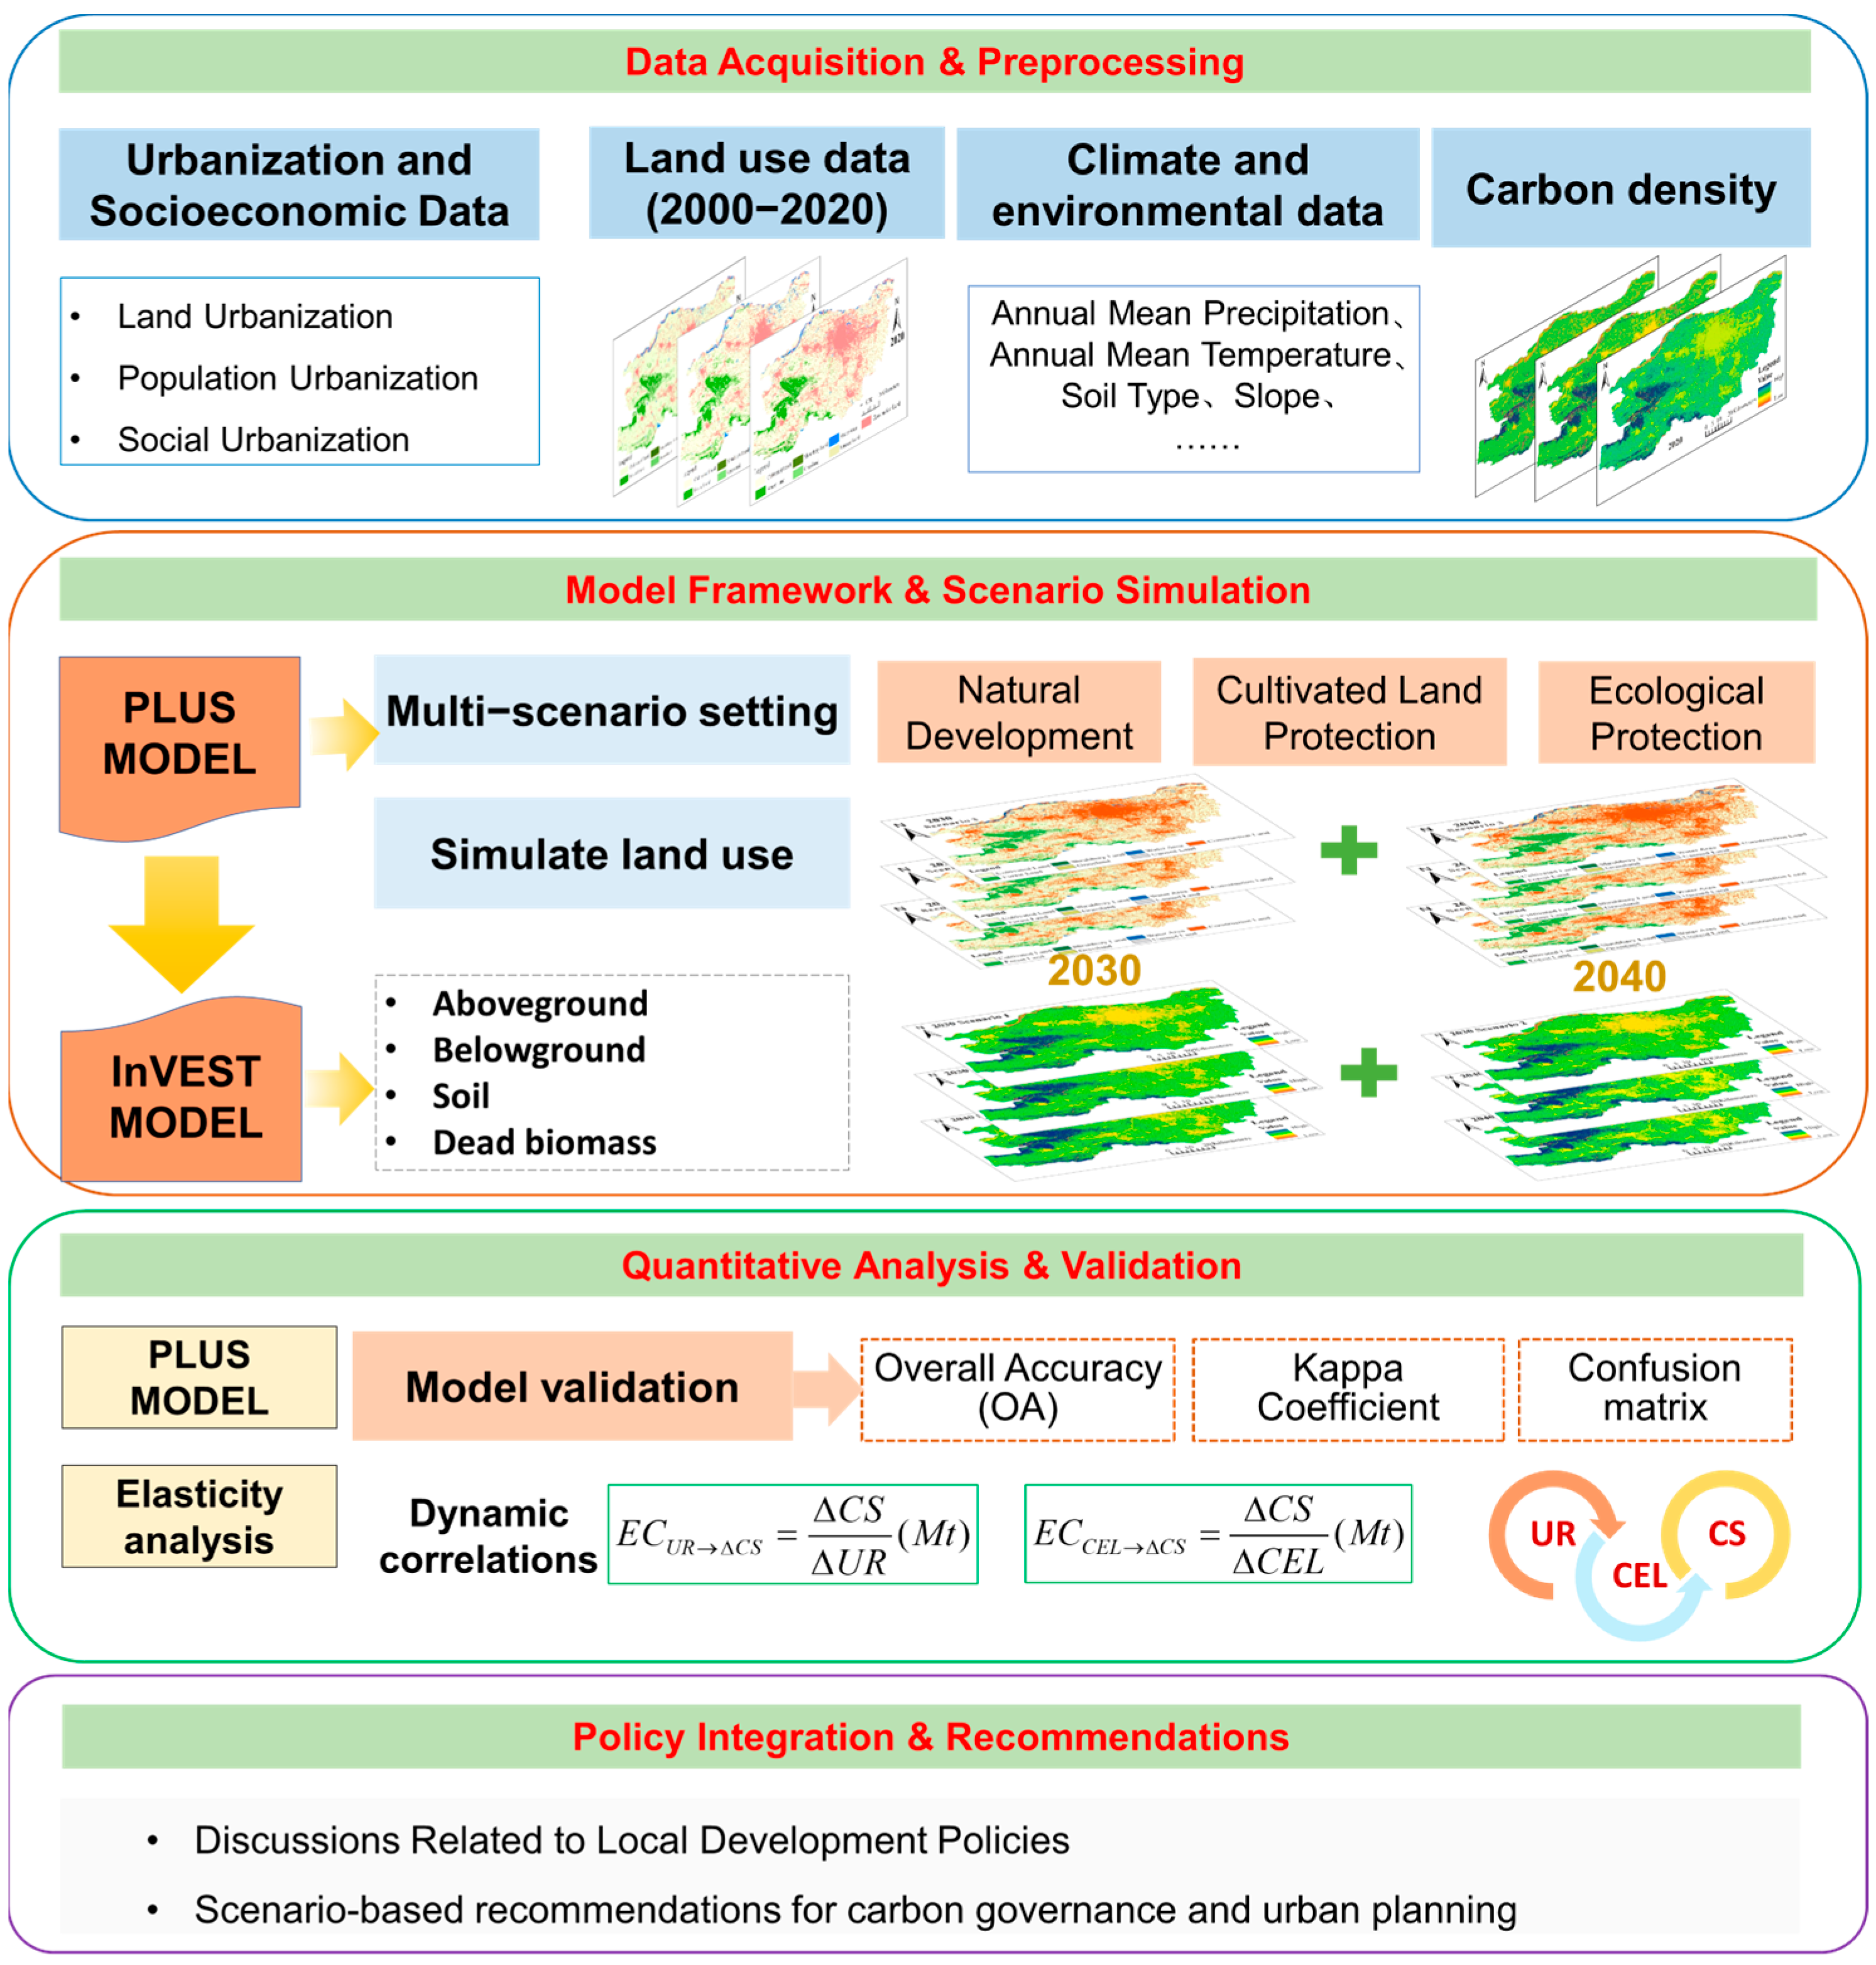
2.3. Technical Route
3. Methods
3.1. Urbanization Evaluation
- Land Urbanization
- 2.
- Population Urbanization
- 3.
- Social Urbanization
3.2. PLUS Model
3.3. InVEST Model
3.4. Scenario Setting
3.5. Elasticity Analysis
4. Results and Analysis
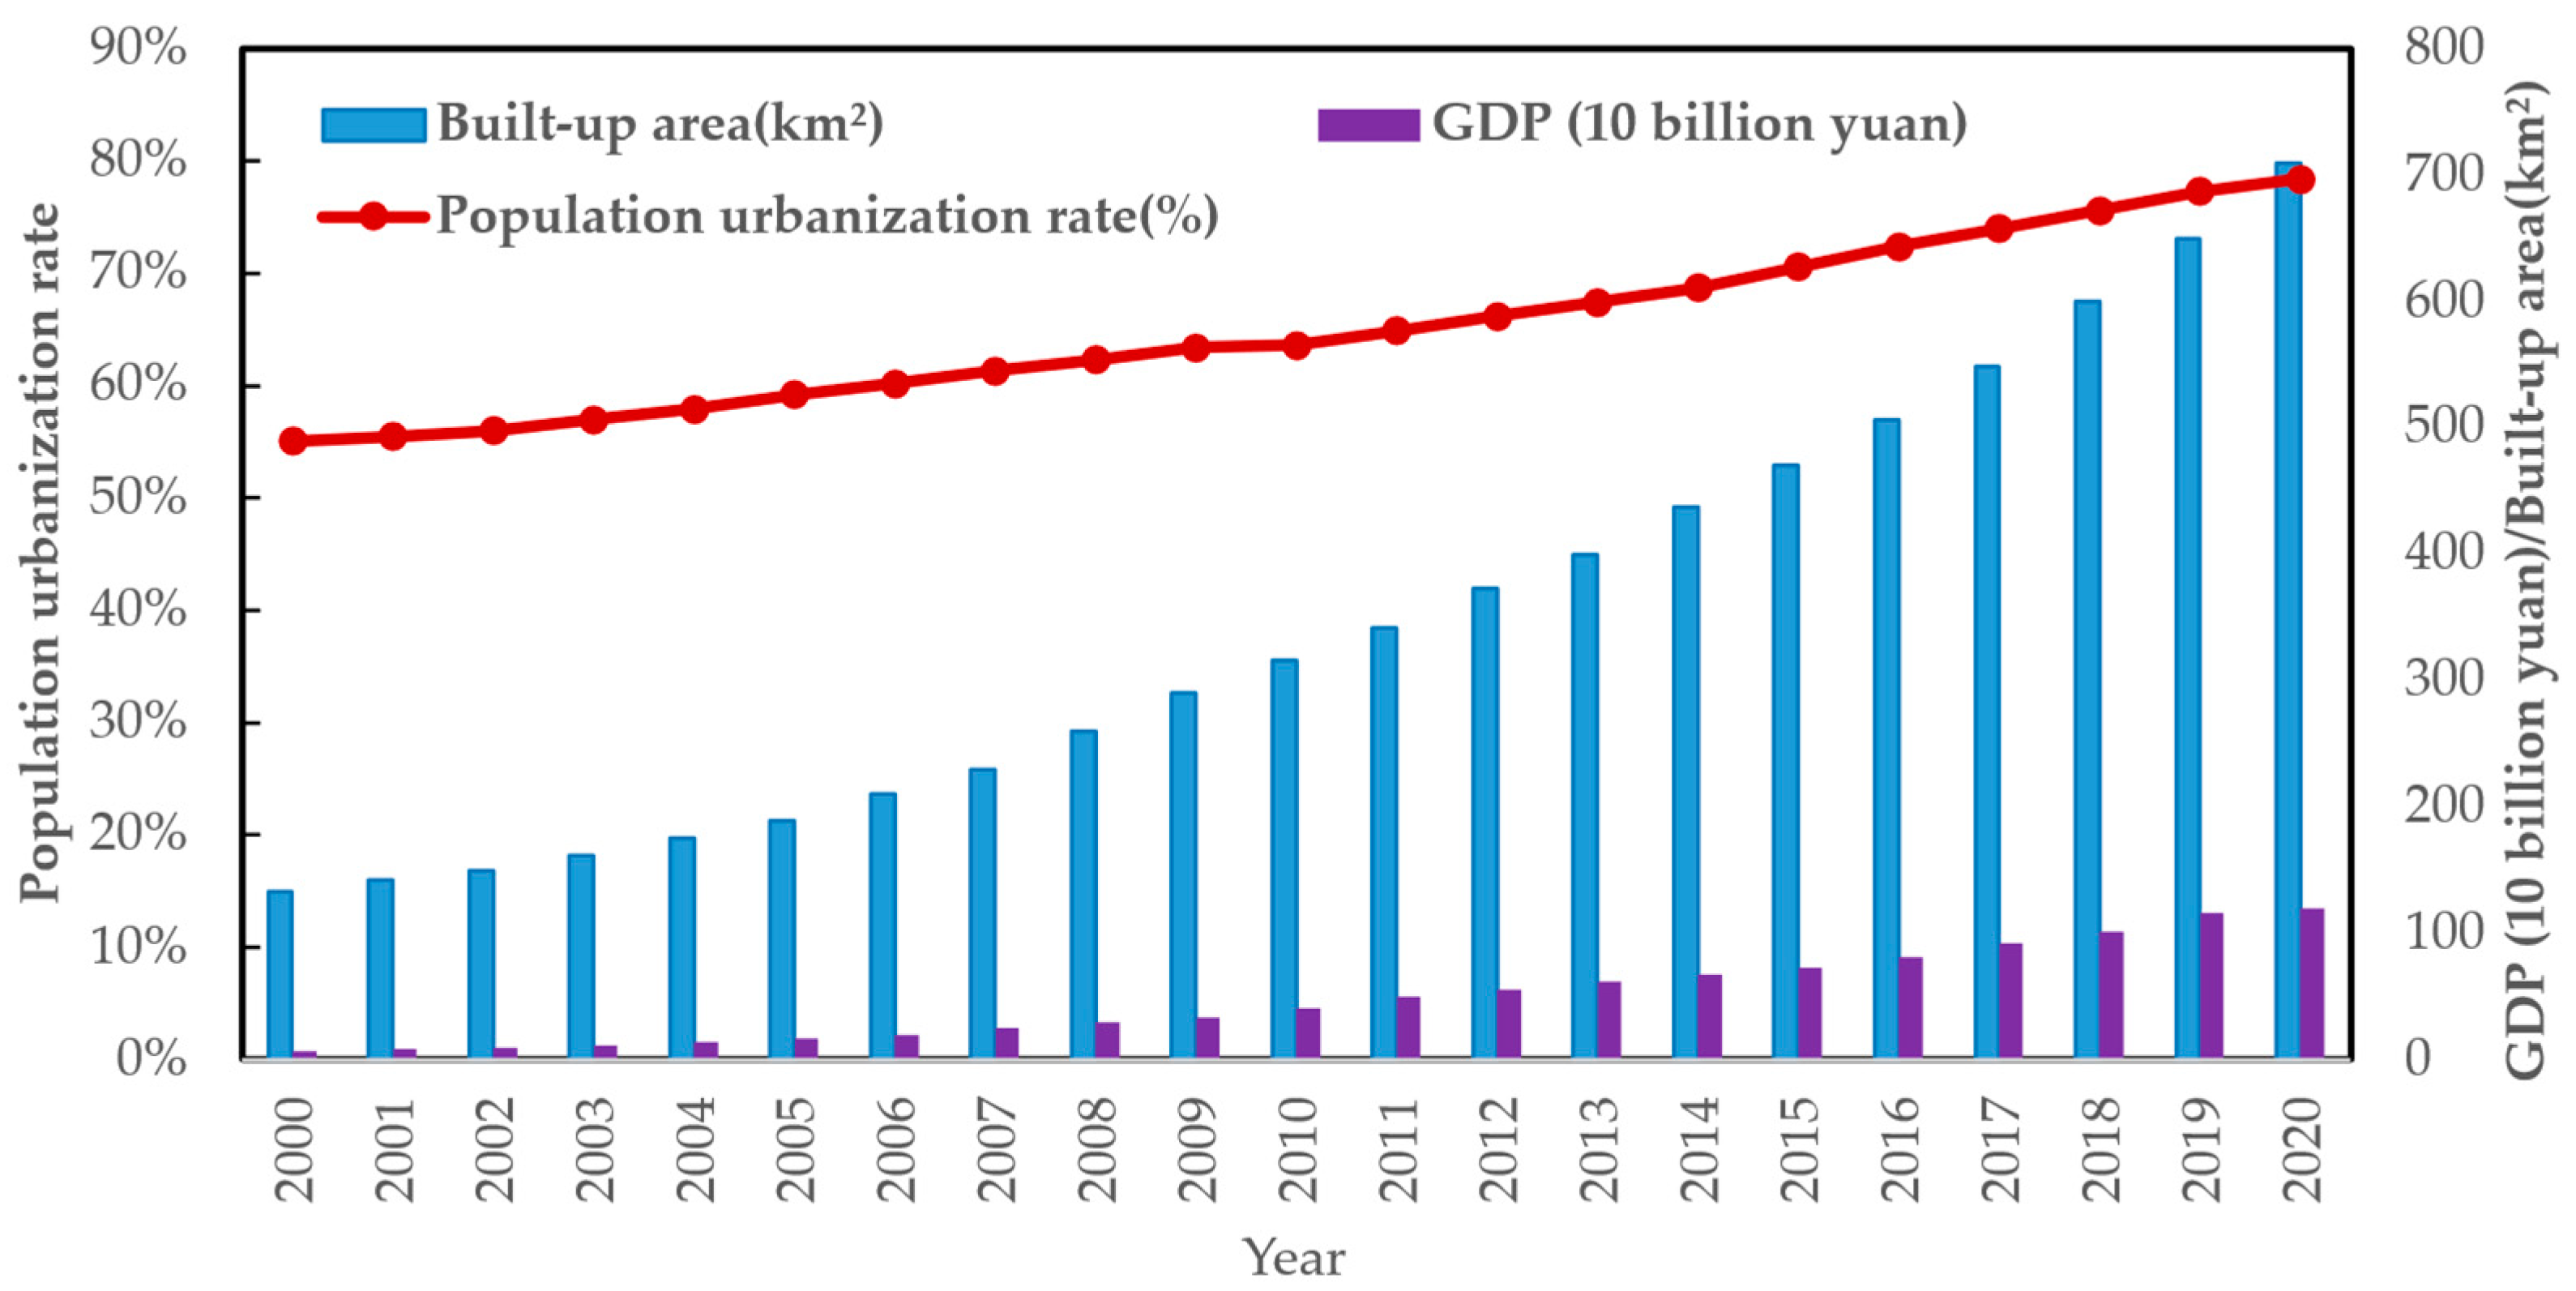
4.1. Analysis of the Urbanization Evolutionary Characteristics of Zhengzhou
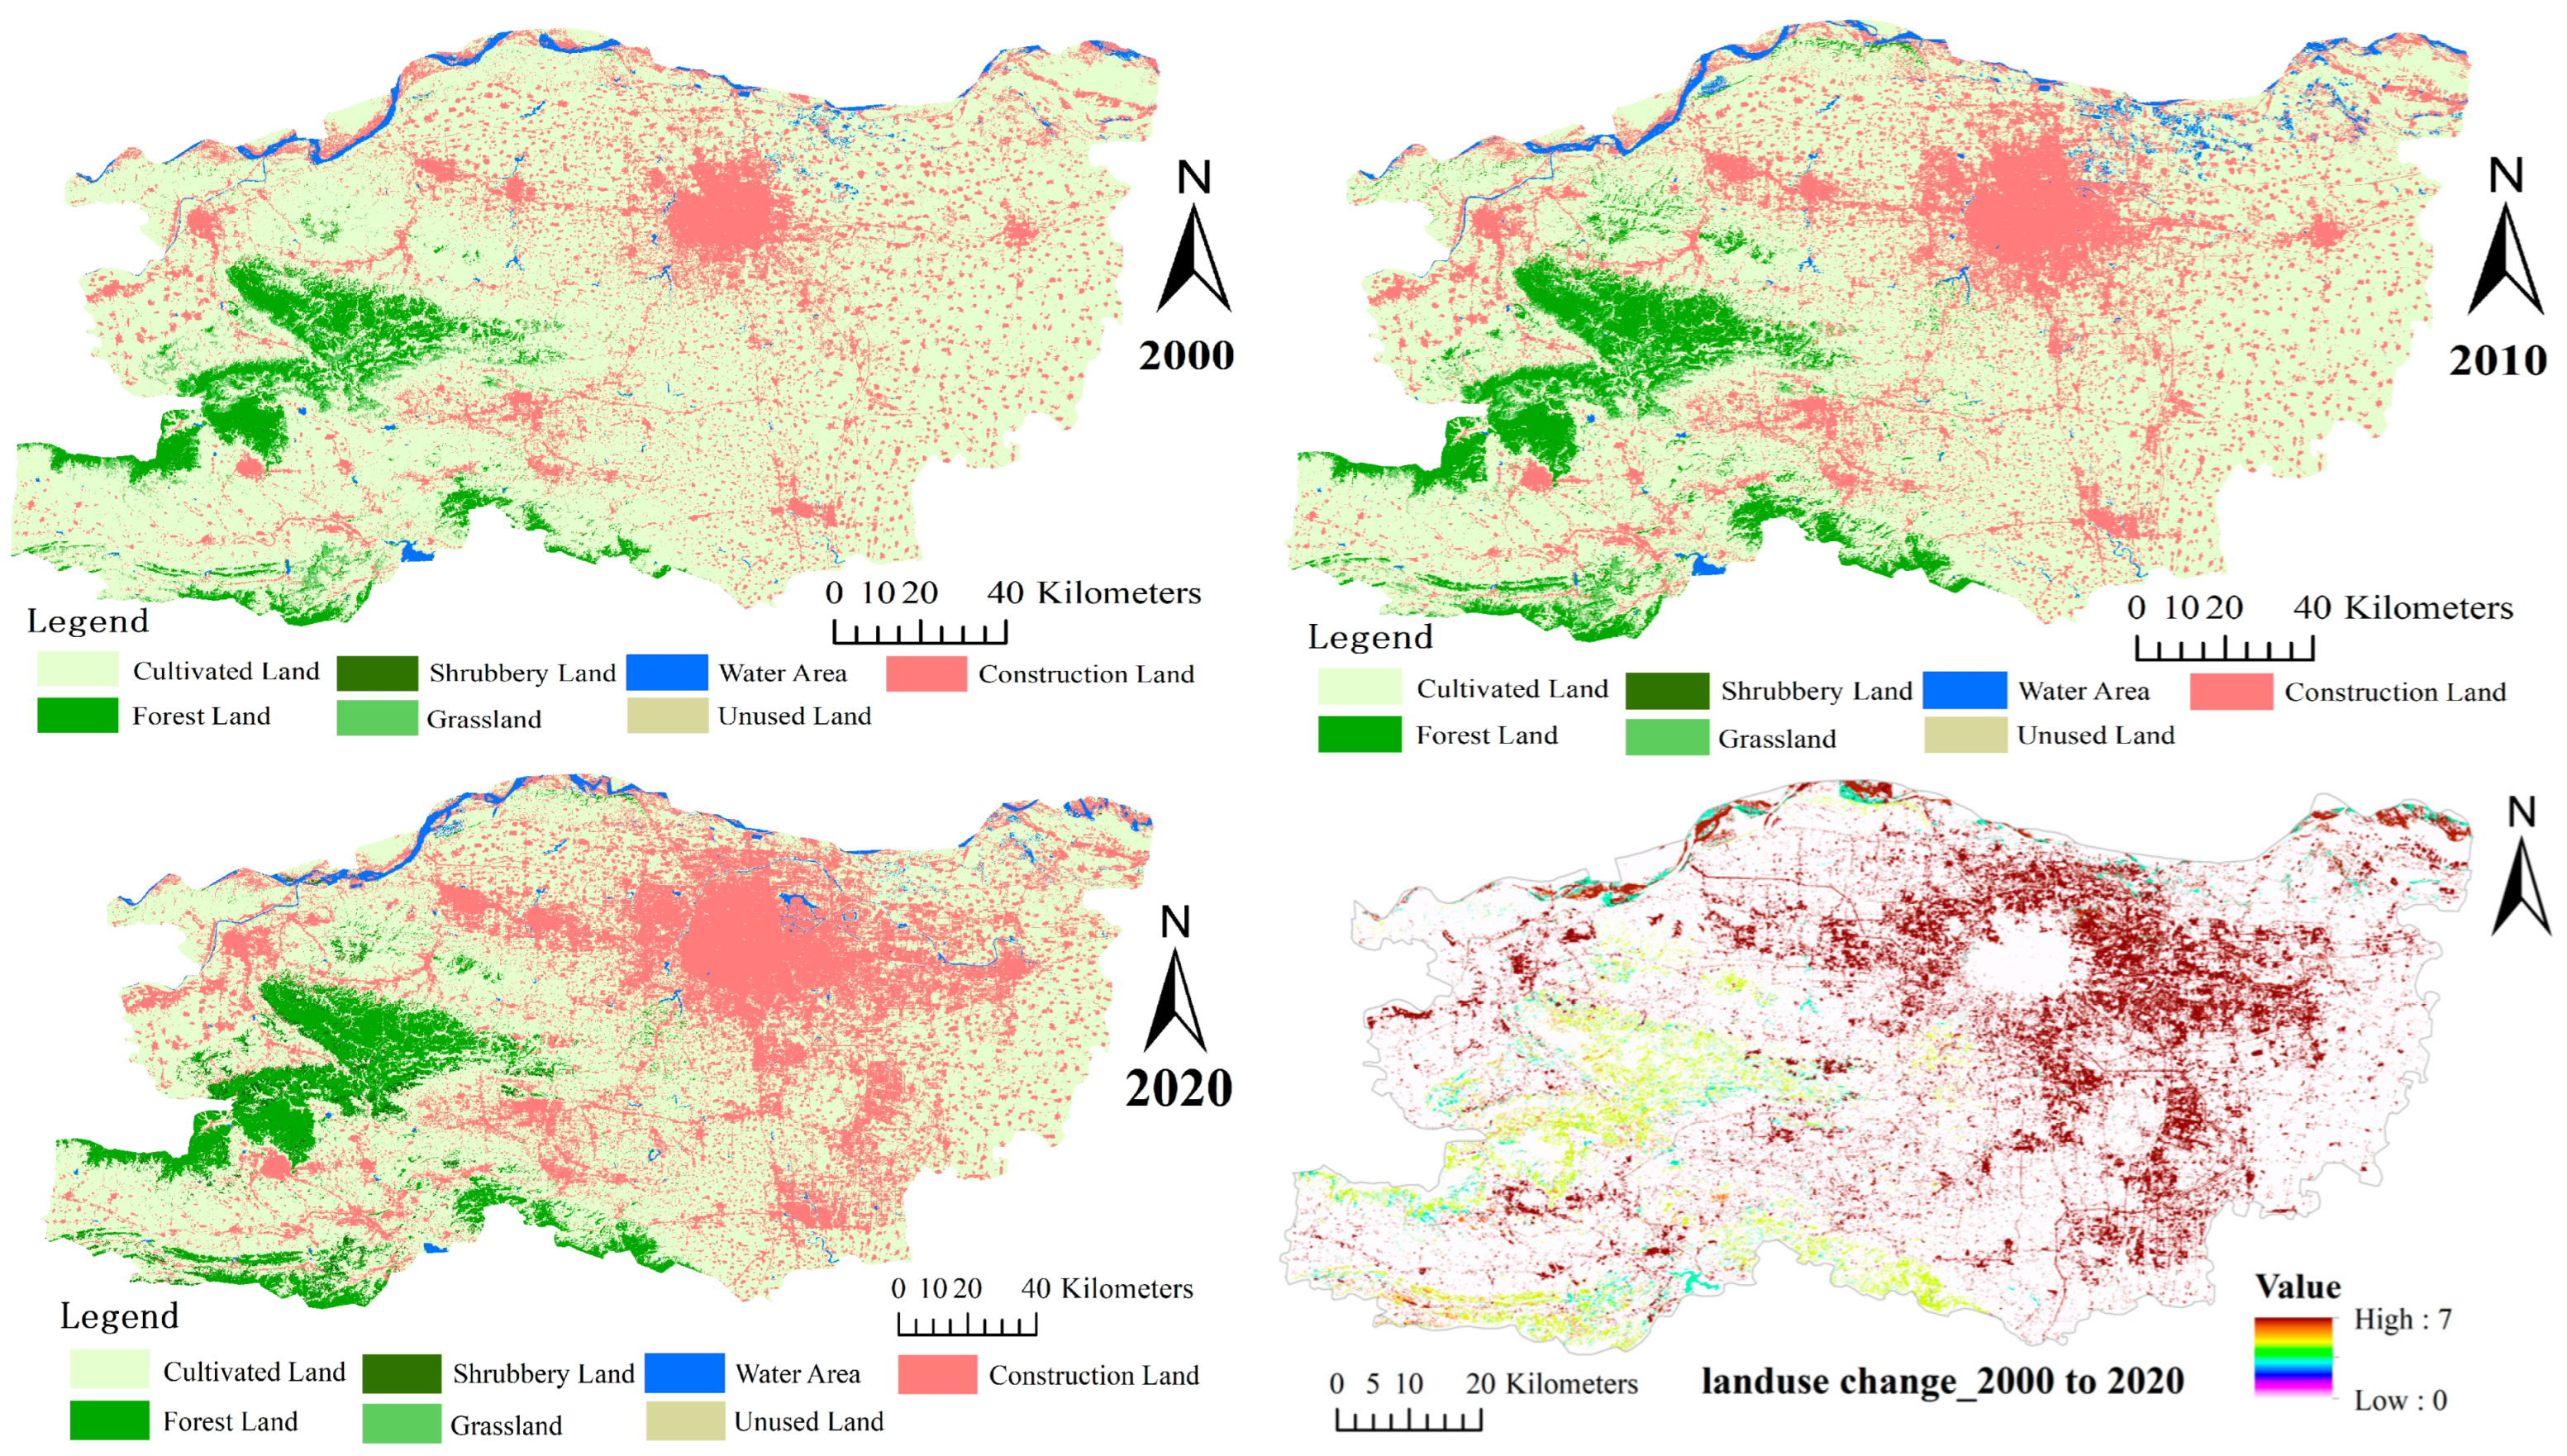
4.2. Spatiotemporal Evolution of Land Use in Zhengzhou (2000–2020)
4.3. Land Use Changes in Zhengzhou Under Different Development Scenarios
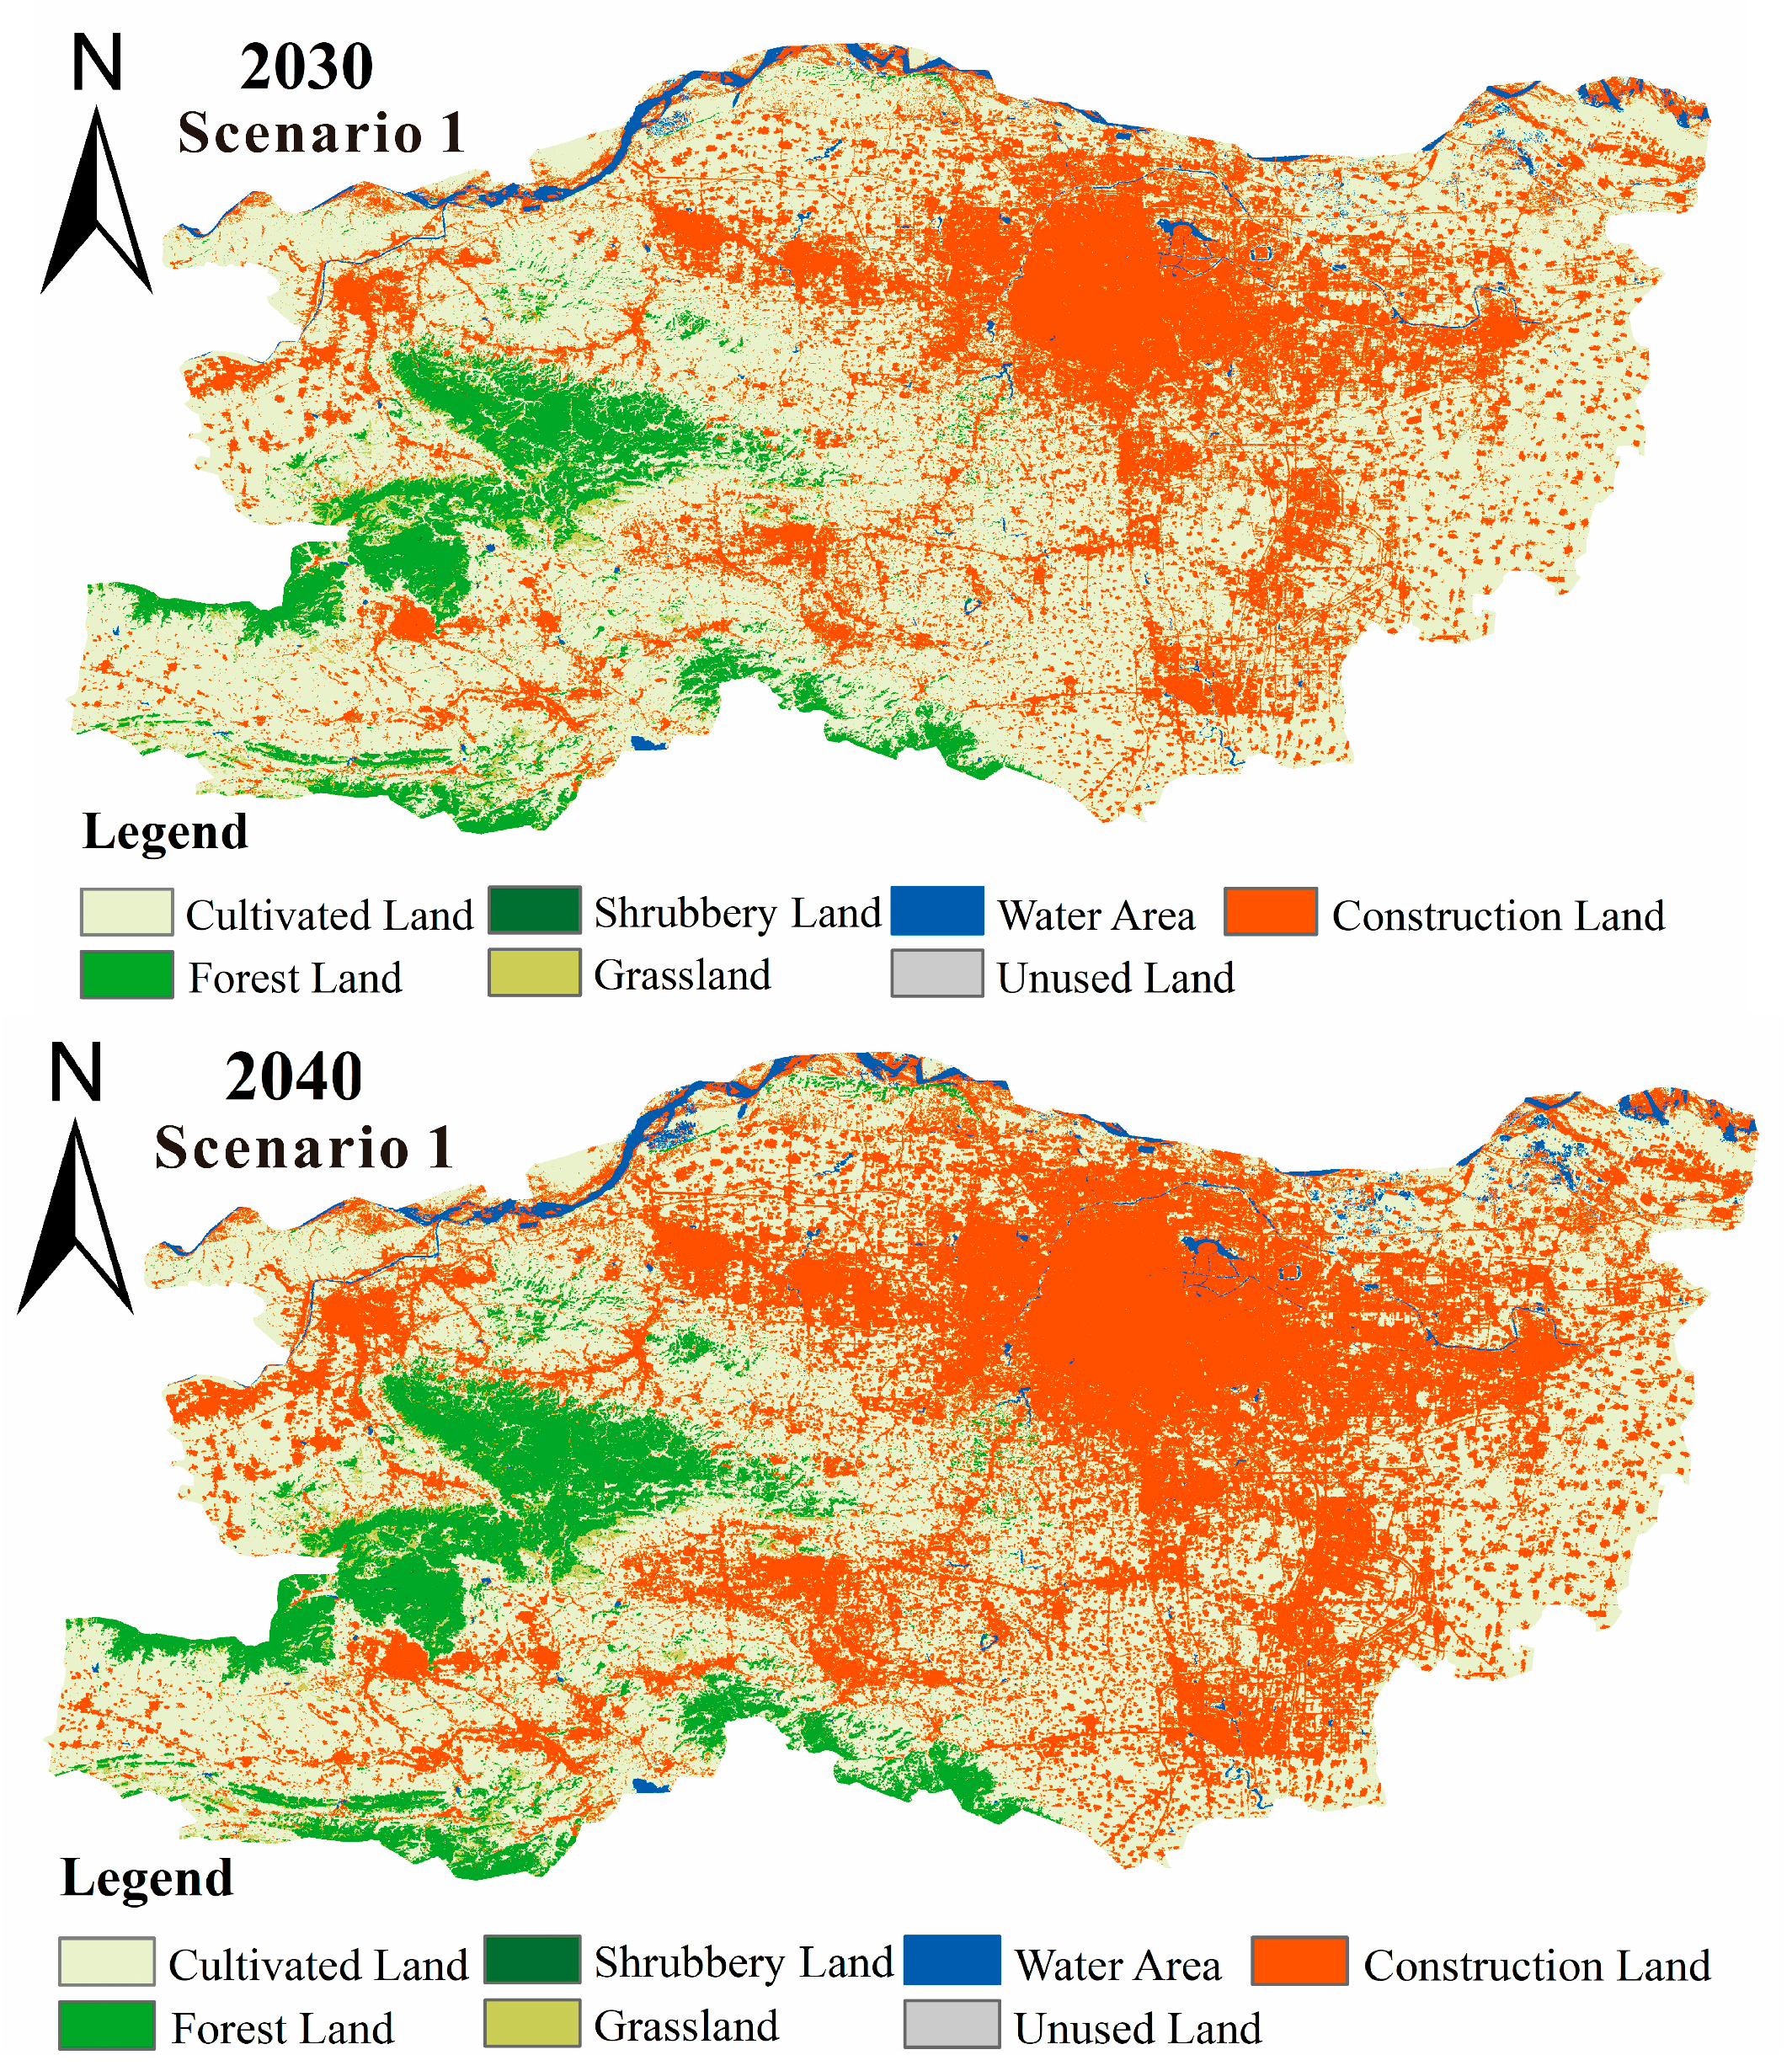
- Scenario 1: Natural Development Scenario
- 2030 Projections
- 2.
- 2040 Projections
- Scenario 2: Cultivated Land Protection Scenario
- 3.
- 2030 Projections
- 4.
- 2040 Projections
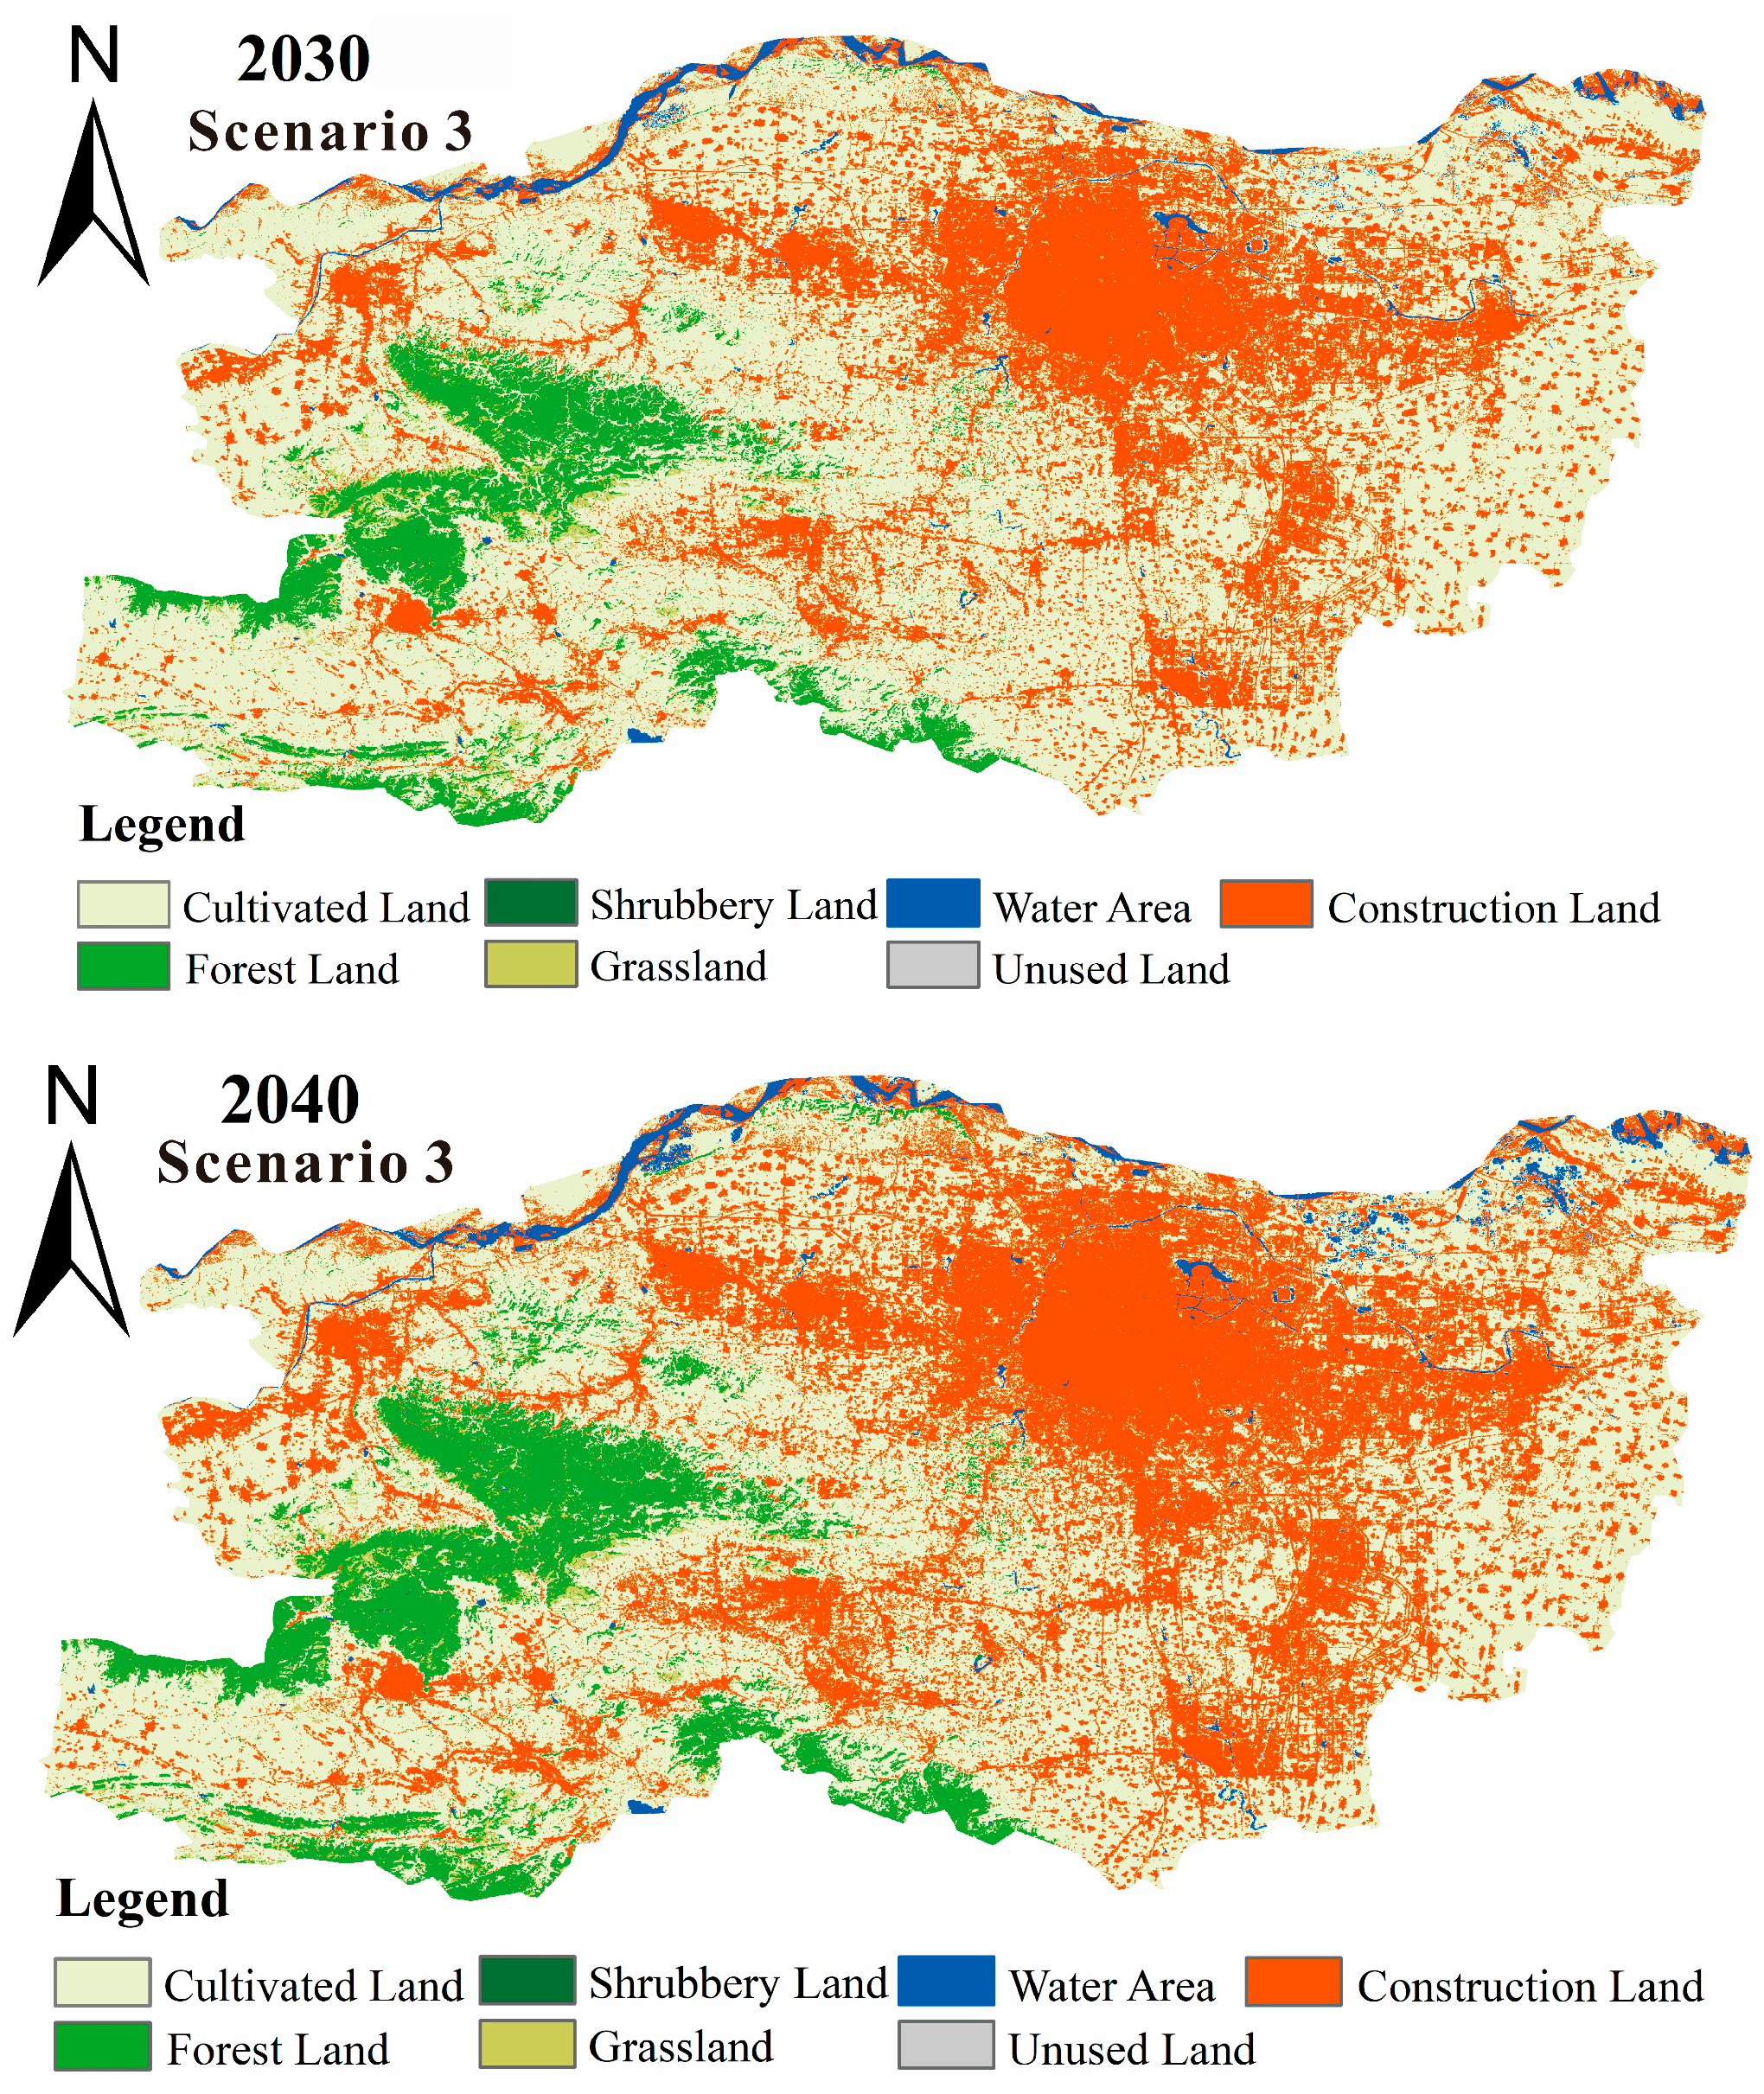
- Scenario 3: Ecological Protection Scenario
- 2030 Projections
- 2.
- 2040 Projections
4.4. Analysis of Carbon Storage Changes in Zhengzhou (2000–2020)
4.5. Changes in Carbon Storage Under Different Development Scenarios
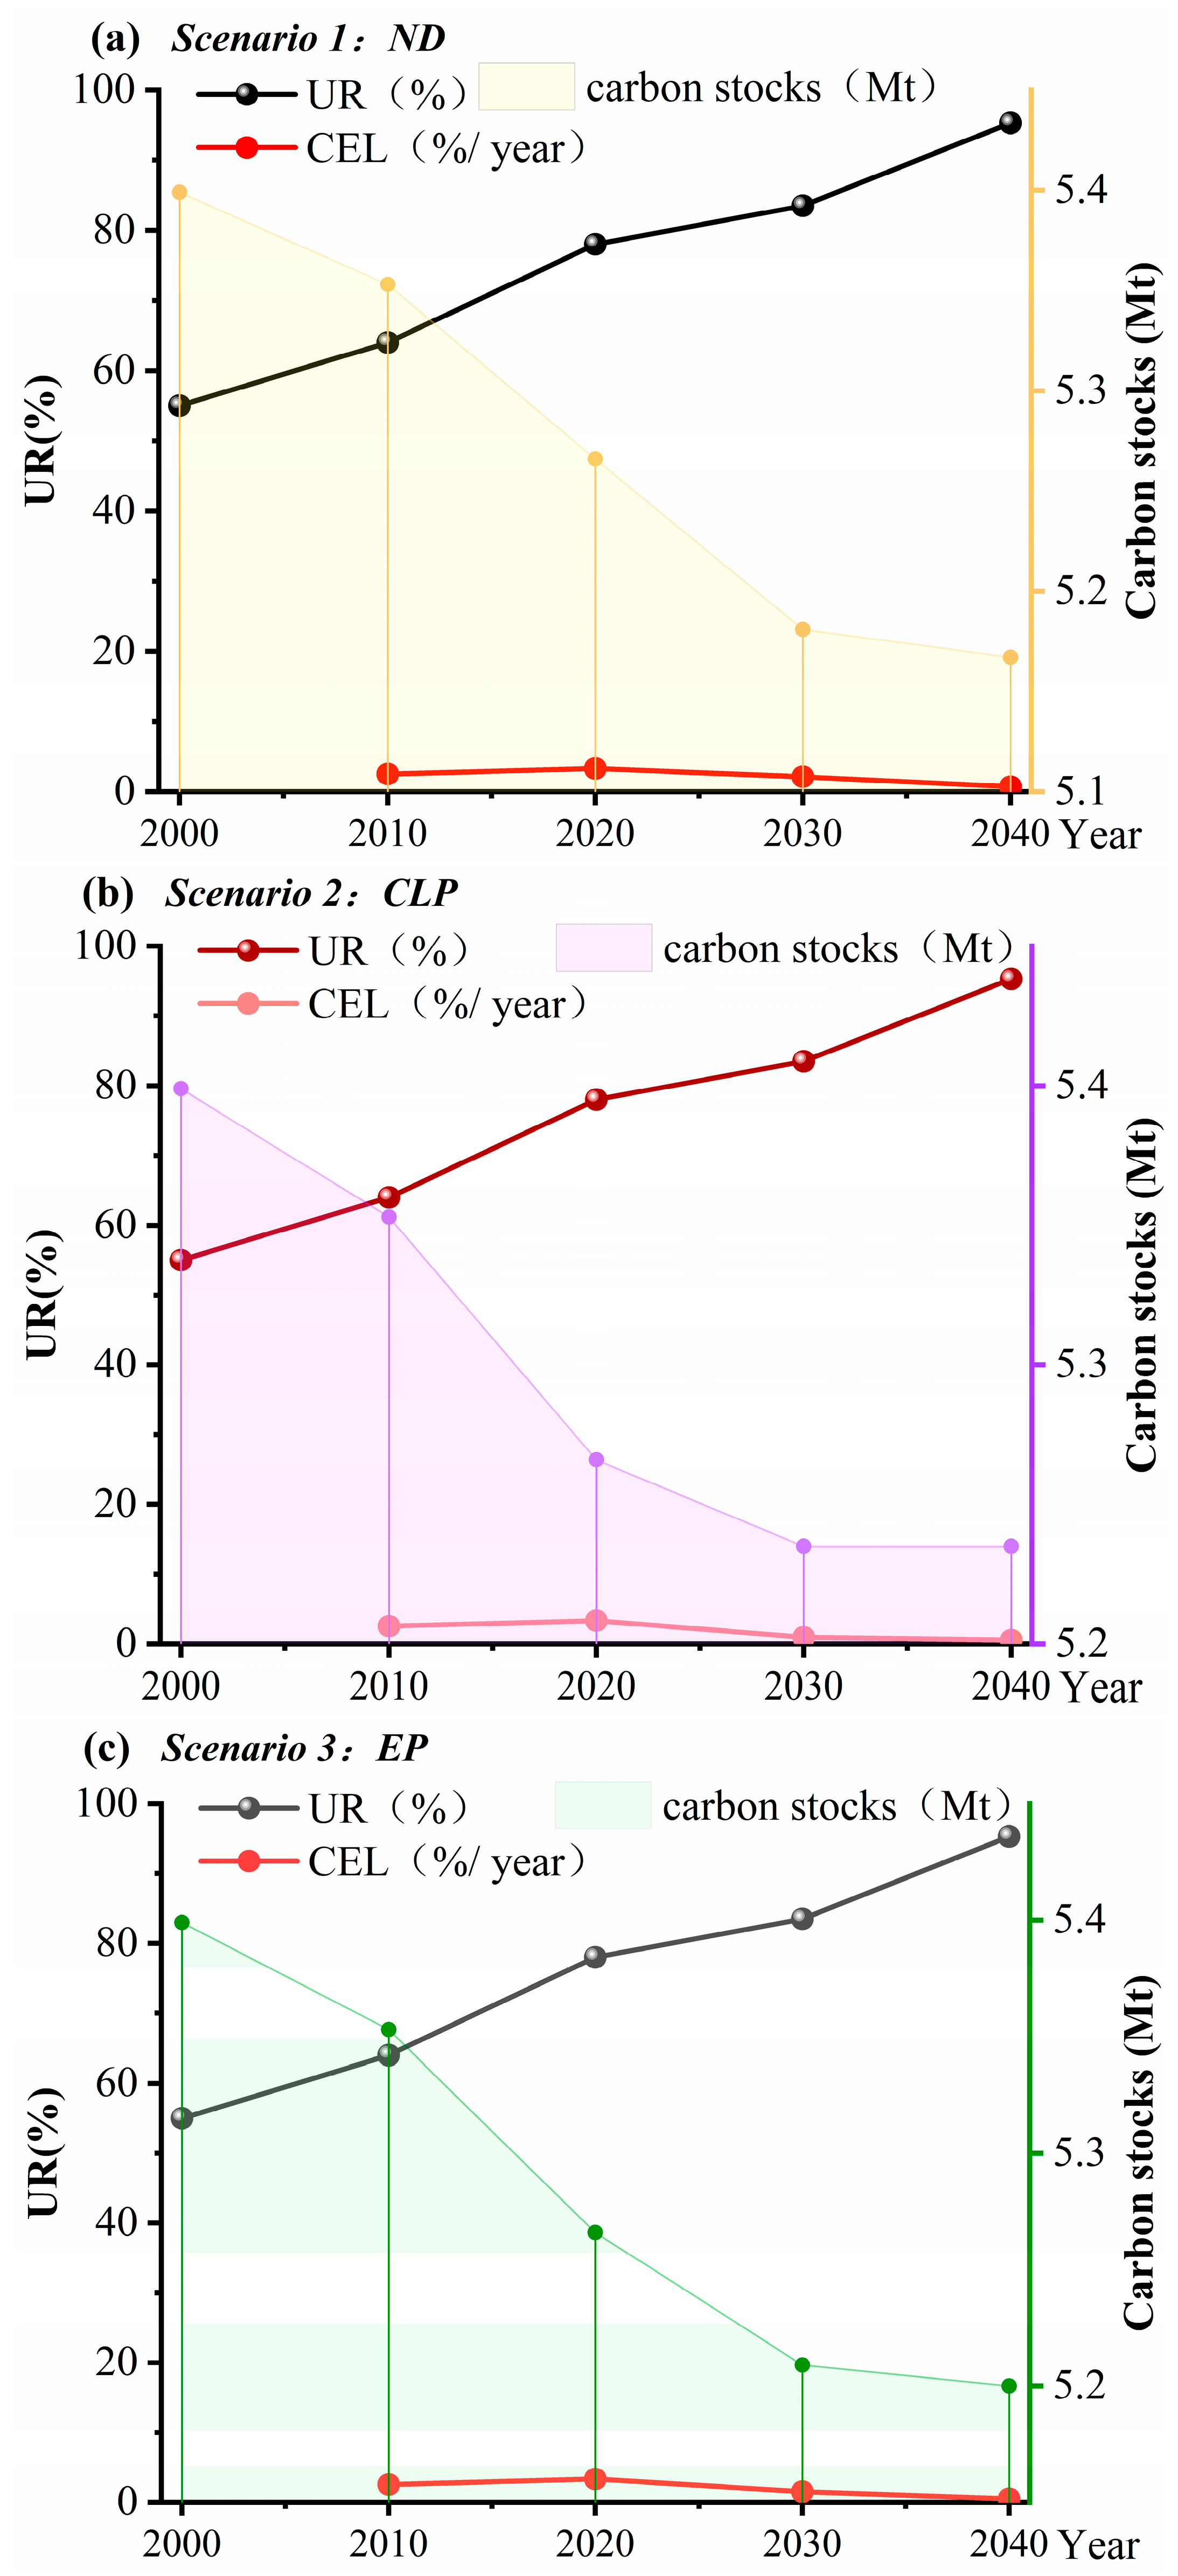
4.5.1. Quantitative Differences in Carbon Storage Across Scenarios
4.5.2. Spatial Distribution of Carbon Storage Under Different Scenarios
4.6. Dynamic Correlations of Urbanization, Construction Area Expansion, and Carbon Stock Dynamics
5. Discussion
5.1. Mechanisms Underlying Land Use–Carbon Storage Dynamics
5.2. Policy-Driven Scenario Comparisons and Elasticity Insights
5.3. Policy Implications for Sustainable Urbanization
5.4. Methodological Limitations and Future Research
6. Conclusions
- Urbanization dimensional analysis reveals dominant land urbanization (built-up area annual growth of 8.1% from 2000 to 2020), imbalanced “land–population” development, and economic vulnerability (GDP increased 16.5 times).
- The analysis of land use change demonstrates that cultivated land decreased by 15.33%, and construction land expanded by 13.31% in 2000–2020. Based on the PLUS model, the future land use structure in 2030 and 2040 was predicted. Under the 2030 scenarios, construction land expanded by 7.34% (natural), 2.87% (cultivated protection), and 4.96% (ecological protection), with effective control in protection scenarios. Cultivated land decreased by 6.96%, 2.36%, and 4.78%, respectively. By 2040, all scenarios showed construction land expansion and cultivated land reduction, but unlike 2030, forests were better protected (showing gradual growth versus 2020), and water bodies increased under ecological protection.
- The InVEST model was used to analyze the changes in Zhengzhou’s carbon storage from 2000 to 2040. In 2030, carbon storage measured 5.181 × 10⁷ t (natural), 5.235 × 10⁷ t (cultivated protection), and 5.209 × 10⁷ t (ecological protection), all lower than the 2020 levels. By 2040, values remained nearly unchanged from 2030, with forest/grassland expansion partially offsetting declines. The southwest–high/central-low spatial pattern persisted, with cultivated protection most effectively slowing carbon storage reduction. Future urban planning should integrate ecological measures while safeguarding farmland, control construction land growth, and contribute to climate goals like carbon peaking and neutrality.
- The dynamic relationship between urbanization rate, construction land expansion rate, and carbon storage was quantified using elasticity analysis. In natural development scenarios, the increase in urbanization rate and construction land expansion rate significantly exacerbates carbon losses (for every 1% increase in urbanization rate, carbon storage decreases by 0.51–1.55 Mt; for every 1% increase in construction land expansion rate per annum, carbon storage losses increase by 0.109 Mt), confirming the encroachment effect of unconstrained urban expansion on high-carbon-density land. The policy intervention scenario (farmland protection, ecological priority) effectively mitigates carbon losses by restricting land expansion and enhancing carbon sequestration capacity, highlighting the feasibility of policy regulation on carbon neutrality pathways.
Author Contributions
Funding
Data Availability Statement
Conflicts of Interest
References
- Intergovernmental Panel on Climate Change (IPCC). Climate Change and Land: IPCC Special Report on Climate Change, Desertification, Land Degradation, Sustainable Land Management, Food Security, and Greenhouse Gas Fluxes in Terrestrial Ecosystems; Cambridge University Press: Cambridge, UK, 2022. [Google Scholar]
- Seto, K.C.; Güneralp, B.; Hutyra, L.R. Global Forecasts of Urban Expansion to 2030 and Direct Impacts on Biodiversity and Carbon Pools. Proc. Natl. Acad. Sci. USA 2012, 109, 16083–16088. [Google Scholar] [CrossRef] [PubMed]
- Waddell, P. UrbanSim: Modeling Urban Development for Land Use, Transportation, and Environmental Planning. J. Am. Plan. Assoc. 2002, 68, 297–314. [Google Scholar] [CrossRef]
- Zhengzhou Municipal Bureau of Statistics Official Website. Zhengzhou Municipal Bureau of Statistics. Available online: https://tjj.zhengzhou.gov.cn/ (accessed on 10 April 2025).
- Grimm, N.B.; Faeth, S.H.; Golubiewski, N.E.; Redman, C.L.; Wu, J.; Bai, X.; Briggs, J.M. Global Change and the Ecology of Cities. Science 2008, 319, 756–760. [Google Scholar] [CrossRef]
- Piao, S.; Huang, M.; Liu, Z.; Wang, X.; Ciais, P.; Canadell, J.G.; Wang, K.; Bastos, A.; Friedlingstein, P.; Houghton, R.A.; et al. Lower land-use emissions responsible for increased net land carbon sink during the slow warming period. Nat. Geosci. 2018, 11, 739–743. [Google Scholar] [CrossRef]
- Parker, D.C.; Manson, S.M.; Janssen, M.A.; Hoffmann, M.J.; Deadman, P. Multi-Agent Systems for the Simulation of Land-Use and Land-Cover Change: A Review. Ann. Assoc. Am. Geogr. 2003, 93, 314–337. [Google Scholar] [CrossRef]
- Cheng, F.Y.; Ou, G.L.; Wang, M.; Liu, C. Remote Sensing Estimation of Forest Carbon Stock Based on Machine Learning Algorithms. Forests 2024, 15, 681. [Google Scholar] [CrossRef]
- Lafortezza, R.; Giannico, V. Combining high-resolution images and LiDAR data to model ecosystem services perception in compact urban systems. Ecol. Indic. 2019, 96, 87–98. [Google Scholar] [CrossRef]
- National Bureau of Statistics Official Website. National Bureau of Statistics. Available online: https://www.stats.gov.cn/index.html (accessed on 10 April 2025).
- Liu, X.; Wang, S.; Wu, P.; Feng, K.; Hubacek, K.; Li, X.; Sun, L. Impacts of Urban Expansion on Terrestrial Carbon Storage in China. Environ. Sci. Technol. 2019, 53, 6834–6844. [Google Scholar] [CrossRef]
- Wang, W.-Z.; Liu, L.-C.; Liao, H.; Wei, Y.-M. Impacts of urbanization on carbon emissions: An empirical analysis from OECD countries. Energy Policy 2021, 151, 112171. [Google Scholar] [CrossRef]
- Liu, J.Y.; Kuang, W.H.; Zhang, Z.X.; Xu, X.; Qin, Y.; Ning, J.; Zhou, W.; Zhang, S.; Li, R.; Yan, C.; et al. Spatiotemporal characteristics, patterns, and causes of land-use changes in China since the late 1980s. J. Geogr. Sci. 2014, 24, 195–210. [Google Scholar] [CrossRef]
- He, C.Y.; Liu, Z.F.; Gou, S.Y.; Zhang, Q.; Zhang, J.; Xu, L. Detecting global urban expansion over the last three decades using a fully convolutional network. Environ. Res. Lett. 2019, 14, 034008. [Google Scholar] [CrossRef]
- Xing, W.R.; Qian, Y.H.; Guan, X.F.; Yang, T.; Wu, H. A novel cellular automata model integrated with deep learning for dynamic spatio-temporal land use change simulation. Comput. Geosci. 2020, 137, 104430. [Google Scholar] [CrossRef]
- Zhao, M.; He, Z.; Du, J.; Chen, L.; Lin, P.; Fang, S. Assessing the effects of ecological engineering on carbon storage by linking the CA-Markov and InVEST models. Ecol. Indic. 2019, 98, 29–38. [Google Scholar] [CrossRef]
- Ministry of Natural Resources Official Website. Ministry of Natural Resources. Available online: https://www.mnr.gov.cn/ (accessed on 7 April 2025).
- Li, X.; Zhou, Y.; Zhao, M.; Zhao, X. A harmonized global nighttime light dataset 1992–2018. Sci. Data 2020, 7, 168. [Google Scholar] [CrossRef]
- Zhao, X.Y.; Miao, C.H. Spatial-Temporal Changes and Simulation of Land Use in Metropolitan Areas: A Case of the Zhengzhou Metropolitan Area, China. Int. J. Environ. Res. Public Health 2022, 19, 14089. [Google Scholar] [CrossRef]
- Xia, C.Q.; Zheng, H.R.; Meng, J.; Li, S.; Du, P.; Shan, Y. The evolution of carbon footprint in the yangtze river delta city cluster during eco-nomic transition 2012-2015. Resour. Conserv. Recycl. 2022, 181, 106266. [Google Scholar] [CrossRef]
- Zhang, Z.; Liu, J.; Sato, Y.; Daigger, G.; Chen, G. Achieving Carbon Mitigation with Economic Benefits through High-Resolution Analysis of Renewable Resource Integration in Global Coastal Cities. Environ. Sci. Technol. 2024, 58, 6158–6169. [Google Scholar] [CrossRef]
- He, C.; Zhang, H.; Li, Y.; Wang, Y. Land-use change and carbon storage dynamics in Xi’an: A scenario-based assessment under rapid urbanization. J. Clean. Prod. 2022, 338, 130568. [Google Scholar]
- Zhao, L.; Liu, Y.; Chen, X.; Wu, J. Ecological zoning and urban land expansion resilience in Wuhan: Integrating CA-Markov model with ecosystem service trade-offs. Cities 2023, 138, 104218. [Google Scholar]
- Shi, J.; Shi, P.-J.; Wang, Z.-Y.; Cheng, F.-Y. Spatial-Temporal Evolution and Prediction of Carbon Storage in Jiuquan City Ecosystem Based on PLUS-InVEST Model. Huan Jing Ke Xue 2024, 45, 300–313. [Google Scholar]
- Tang, X.; Zhao, X.; Bai, Y.; Tang, Z.; Wang, W.; Zhao, Y.; Wan, H.; Xie, Z.; Shi, X.; Wu, B.; et al. Carbon pools in China’s terrestrial ecosystems: New estimates based on an intensive field survey. Proc. Natl. Acad. Sci. USA 2018, 115, 4021–4026. [Google Scholar] [CrossRef] [PubMed]
- Piao, S.; Fang, J.; Ciais, P.; Peylin, P.; Huang, Y.; Sitch, S.; Wang, T. The carbon balance of terrestrial ecosystems in China. Nature 2009, 458, 1009–1013. [Google Scholar] [CrossRef] [PubMed]
- Fang, J.; Chen, A.; Peng, C.; Zhao, S.; Ci, L. Changes in Forest Biomass Carbon Storage in China Between 1949 and 1998. Science 2001, 292, 2320–2322. [Google Scholar] [CrossRef] [PubMed]
- Xiang, S.; Wang, Y.; Deng, H.; Yang, C.; Wang, Z.; Gao, M. Response and multi-scenario prediction of carbon storage to land use/cover change in the main urban area of Chongqing, China. Ecol. Indic. 2022, 142, 109205. [Google Scholar] [CrossRef]
- Zhou, Y.; Wei, G.; Wang, Y.; Wang, B.; Quan, Y.; Wu, Z.; Liu, J.; Bian, S.; Li, M.; Fan, W.; et al. Estimating Regional Forest Carbon Density Using Remote Sensing and Geographically Weighted Random Forest Models: A Case Study of Mid- to High-Latitude Forests in China. Forests 2025, 16, 96. [Google Scholar] [CrossRef]
- Mokany, K.; Raison, R.J.; Prokushkin, A.S. Critical analysis of root: Shoot ratios in terrestrial biomes. Glob. Change Biol. 2006, 12, 84–96. [Google Scholar] [CrossRef]
- Zhengzhou Municipal Bureau of Statistics Official Website. Zhengzhou Municipal Bureau of Statistics. Available online: https://tjj.zhengzhou.gov.cn/tjsj/index.jhtml (accessed on 11 April 2025).
- Henan Provincial Bureau of Statistics Official Website. Henan Provincial Bureau of Statistics. Available online: https://tjj.henan.gov.cn/ (accessed on 13 April 2025).
- Seto, K.C.; Fragkias, M.; Güneralp, B.; Reilly, M.K. A Meta-Analysis of Global Urban Land Expansion. PLoS ONE 2011, 6, e23777. [Google Scholar] [CrossRef]
- Angel, S.; Parent, J.; Civco, D.L.; Blei, A.; Potere, D. The dimensions of global urban expansion: Estimates and projections for all countries, 2000–2050. Prog. Plan. 2011, 75, 53–107. [Google Scholar] [CrossRef]
- Chen, M.; Liu, W.; Lu, D. Challenges and the way forward in China’s new-type urbanization. Land Use Policy 2016, 55, 334–339. [Google Scholar] [CrossRef]
- Economic, U.N.D.O.; Affairs, S. World Urbanization Prospects: The 2018 Revision; United Nations: New York, NY, USA, 2019.
- Scott, A. Triumph of the City: How Our Greatest Invention Makes Us Richer, Smarter, Greener, Healthier, and Happier—By Edward Glaeser. Econ. Geogr. 2012, 88, 97–100. [Google Scholar] [CrossRef]
- Vergara-Perucich, F. Richard Florida: The new urban crisis: How our cities are increasing inequality, deepening segregation, and failing the middle class—And what we can do about it. J. Hous. Built Environ. 2019, 34, 647–649. [Google Scholar] [CrossRef]
- Liang, X.; Guan, Q.; Clarke, K.C.; Liu, S.; Wang, B.; Yao, Y. Understanding the drivers of sustainable land expansion using a patch-generating land use simulation (PLUS) model: A case study in Wuhan, China. Comput. Environ. Urban Syst. 2021, 85, 101569. [Google Scholar] [CrossRef]
- Liu, X.; Liang, X.; Li, X.; Xu, X.; Ou, J.; Chen, Y.; Li, S.; Wang, S.; Pei, F. A future land use simulation model (FLUS) for simulating multiple land use scenarios by coupling human and natural effects. Landsc. Urban Plan. 2017, 168, 94–116. [Google Scholar] [CrossRef]
- Li, Y.; Xu, B.; Li, Y.; Wan, Y. Impact of LULC in Coastal Cities on Terrestrial Carbon Storage and Ecosystem Service Value: A Case Study of Liaoning Province. Sustainability 2025, 17, 2889. [Google Scholar] [CrossRef]
- Sharp, R.; Chaplin-Kramer, R.; Wood, S.; Guerry, A.; Tallis, H.; Ricketts, T.; Nelson, E.J.; Ennaanay, D.; Wolny, S.; Olwero, N.; et al. InVEST User’s Guide; Stanford University: Stanford, CA, USA; University of Minnesota: Minneapolis, MN, USA; The Nature Conservancy: Arlington County, VA, USA; World Wildlife Fund: Morges, Switzerland, 2018. [Google Scholar]
- Deng, C.; Zhu, D.; Li, Z.; Liu, C.; Nie, X. Estimation of elasticity relationship between agricultural ecosystem service values and urbanization. Chin. J. Eco-Agric. 2021, 29, 1453–1466. [Google Scholar]


| Data Name | Resolution | Source | URL |
|---|---|---|---|
| Land Use Data | 30 m × 30 m | Wuhan University Land Use Data | https://doi.org/10.5194/essd-2021-7 (accessed on 10 June 2024). |
| DEM Data | 30 m × 30 m | Geospatial Data Cloud | http://www.gscloud.cn/ (accessed on 10 June 2024). |
| Slope | 30 m × 30 m | Derived from DEM Data | http://www.gscloud.cn/ (accessed on 12 June 2024). |
| Population Data | 1 hm × 1 hm | Resource and Environment Data Center, CAS | http://www.resdc.cn/ (accessed on 11 June 2024). |
| Annual Mean Precipitation | 1 hm × 1 hm | National Tibetan Plateau Data Center | https://data.tpdc.ac.cn/ (accessed on 12 June 2024). |
| Annual Mean Temperature | 1 hm × 1 hm | National Tibetan Plateau Data Center | https://data.tpdc.ac.cn/ (accessed on 12 June 2024). |
| Soil Type | 1 hm × 1 hm | Resource and Environment Data Center, CAS | http://www.resdc.cn/ (accessed on 11 June 2024). |
| GDP Data | 1 hm × 1 hm | Resource and Environment Data Center, CAS | http://www.resdc.cn/ (accessed on 11 June 2024). |
| Type | Aboveground Carbon Density | Belowground Carbon Density | Soil Carbon Density |
|---|---|---|---|
| Cultivated Land | 4.53 | 0.906 | 71.02 |
| Forest | 19.44 | 3.888 | 69.85 |
| Shrubland | 19.44 | 3.888 | 69.85 |
| Grassland | 2.74 | 0.548 | 43 |
| Water Body | 0 | 0 | 32.48 |
| Unused Land | 0 | 0 | 53.3 |
| Construction Land | 0 | 0 | 60 |
| Indicator | Data Source | URL |
|---|---|---|
| Built-up area (km2) | Zhengzhou Statistical Yearbook | https://tjj.zhengzhou.gov.cn/ (accessed on 10 April 2025). |
| GDP (10 billion yuan) | Henan Statistical Yearbook | https://tjj.henan.gov.cn/ (accessed on 13 April 2025). |
| Population urbanization rate (%) | Zhengzhou Statistical Yearbook | https://tjj.zhengzhou.gov.cn/ (accessed on 10 April 2025). |
| Land Use Type | Cultivated Land | Forest | Shrubland | Grassland | Water Bodies | Construction Land | Unused Land |
|---|---|---|---|---|---|---|---|
| Neighborhood Weight | 0.2 | 0.1 | 0.8 | 0.4 | 0.4 | 1 | 1 |
| Actual Land Use | Predicted Land Use | - | ||||||
|---|---|---|---|---|---|---|---|---|
| Cultivated Land | Forest | Grassland | Water Bodies | Construction Land | Unused Land | Errors | - | Total |
| Cultivated Land | 412,000 | 8500 | 2140 | 560 | 10,000 | 30 | 21,230 | 433,930 |
| Forest | 3200 | 48,500 | 1200 | 800 | 500 | 10 | 5710 | 54,210 |
| Grassland | 1500 | 1800 | 8200 | 300 | 1200 | 5 | 5005 | 12,005 |
| Water Bodies | 450 | 600 | 200 | 9200 | 150 | 0 | 1400 | 10,000 |
| Construction Land | 9800 | 1200 | 850 | 200 | 200,000 | 20 | 12,070 | 212,140 |
| Unused Land | 20 | 10 | 5 | 0 | 60 | 50 | 95 | 145 |
| Total | 426,970 | 52,610 | 12,595 | 10,060 | 211,910 | 115 | 45,510 | 714,260 |
| Scenario No. | Direction | Scheme Description |
|---|---|---|
| Scenario 1 | Natural Development (ND) | It is based on land use trends from 2000 to 2020, using change rates derived from the Markov model as land use quantities under the natural development scenario. |
| Scenario 2 | Cultivated Land Protection (CLP) | It aligns with China’s “1.8 billion mu cultivated land red line” and Henan Province Cultivated Land Protection Measures, reducing cultivated land conversion to construction land by 60% based on the city’s 2020 land use annual report. In addition, a 20% increase in the conversion of forest and grassland to cultivated land is applied. |
| Scenario 3 | Ecological Protection (EP) | In accordance with the Yellow River Basin Ecological Protection Plan, the conversion of forest/grassland/water bodies to construction land is restricted by 30% to comply with ecological conservation targets, and a 10% increase in the conversion of cultivated land to grassland/forest is implemented. |
| Year | 2000 Year | 2010 Year | 2020 Year | |||
|---|---|---|---|---|---|---|
| Land Use Type | Area (hm2) | % | Area (hm2) | % | Area (hm2) | % |
| Cultivated Land | 532,187.46 | 75.17 | 480,095.91 | 67.81 | 423,643.05 | 59.84 |
| Forest | 36,292.41 | 5.13 | 51,561.36 | 7.28 | 51,742.44 | 7.31 |
| Shrubland | 125.01 | 0.02 | 109.26 | 0.02 | 142.02 | 0.02 |
| Grassland | 12,465.54 | 1.76 | 11,938.14 | 1.69 | 9893.79 | 1.40 |
| Water Bodies | 8371.62 | 1.18 | 11,566.26 | 1.63 | 9769.32 | 1.38 |
| Construction Land | 118,557.18 | 16.75 | 152,673.12 | 21.56 | 212,749.47 | 30.05 |
| Unused Land | 0.81 | 0.00 | 55.98 | 0.01 | 59.94 | 0.01 |
| Year | 2030 | 2040 | ||
|---|---|---|---|---|
| Land Use Type | Area (hm2) | % | Area (hm2) | % |
| Cultivated Land | 374,364.09 | 52.88 | 340,604.91 | 48.11 |
| Forest | 50,993.28 | 7.20 | 62,519.4 | 8.83 |
| Shrubland | 148.5 | 0.02 | 154.17 | 0.02 |
| Grassland | 8382.51 | 1.18 | 8415.36 | 1.19 |
| Water Bodies | 9323.46 | 1.32 | 11,117.07 | 1.57 |
| Construction Land | 264,725.73 | 37.39 | 285,164.55 | 40.28 |
| Unused Land | 62.46 | 0.01 | 24.57 | 0.00 |
| Year | 2030 | 2040 | ||
|---|---|---|---|---|
| Land Use Type | Area (hm2) | % | Area (hm2) | % |
| Cultivated Land | 406,881.367 | 57.47 | 384,771.24 | 54.35 |
| Forest | 49,976.81838 | 7.06 | 60,037.56 | 8.48 |
| Shrubland | 146.4694154 | 0.02 | 142.11 | 0.02 |
| Grassland | 8273.587382 | 1.17 | 8035.47 | 1.13 |
| Water Bodies | 9535.587658 | 1.35 | 8469.18 | 1.20 |
| Construction Land | 233,122.4511 | 32.93 | 246,524.76 | 34.82 |
| Unused Land | 63.36 | 0.01 | 19.71 | 0.00 |
| Year | 2030 | 2040 | ||
|---|---|---|---|---|
| Land Use Type | Area (hm2) | % | Area (hm2) | % |
| Cultivated Land | 389,754.1003 | 55.05 | 362,147.13 | 51.15 |
| Forest | 51,560.39408 | 7.28 | 64,030.41 | 9.04 |
| Shrubland | 150.3150482 | 0.02 | 168.75 | 0.02 |
| Grassland | 8748.466919 | 1.24 | 8441.01 | 1.19 |
| Water Bodies | 9801.936528 | 1.38 | 12,126.42 | 1.71 |
| Construction Land | 247,934.6741 | 35.02 | 261,044.37 | 36.87 |
| Unused Land | 49.68 | 0.01 | 41.94 | 0.01 |
| Land Use Transition | Natural Scenario | Cultivated Protection Scenario | Ecological Protection Scenario | |||
|---|---|---|---|---|---|---|
| Year | 2030 | 2040 | 2030 | 2040 | 2030 | 2040 |
| Cultivated land → Construction | −4.2 Mt (62% of total loss) | −7.8 Mt (68% of total loss, 86% increase from 2030) | −2.5 Mt (39% loss) | −4.5 Mt (41% loss, 80% increase from 2030) | −2.5 Mt (39% loss) | −4.5 Mt (41% loss, 80% increase from 2030) |
| Forest → Construction | −0.8 Mt (12% of total loss) | −1.5 Mt (15% of total loss, 88% increase) | −0.3 Mt (56% reduction) | −0.5 Mt (42% reduction, 67% increase) | −0.3 Mt (56% reduction) | −0.5 Mt (42% reduction, 67% increase) |
| Grassland → Construction | −0.6 Mt (9% of total loss) | −1.2 Mt (11% of total loss, 100% increase) | −0.2 Mt (67% reduction) | −0.3 Mt (58% reduction, 50% increase) | −0.2 Mt (67% reduction) | −0.3 Mt (58% reduction, 50% increase) |
| Grassland → Cultivated land | +0.1 Mt (low—carbon density conversion) | +0.3 Mt (stable trend) | +0.9 Mt (20% increase in conversion) | +0.6 Mt (10% decrease from 2030, balanced policy effect) | +0.9 Mt (20% increase in conversion) | +0.6 Mt (10% decrease from 2030, balanced policy effect) |
| Cultivated land → Forest/Grassland | +0.3 Mt (spontaneous ecological restoration) | −0.2 Mt (cropland prioritization intensifies) | +1.2 Mt (25% increase in ecological conversion) | +1.8 Mt (50% increase from 2030, strong reforestation effect) | +1.2 Mt (25% increase in ecological conversion) | +1.8 Mt (50% increase from 2030, strong reforestation effect) |
| Water bodies → Construction | −0.2 Mt (3% of total loss) | −0.5 Mt (5% of total loss, 150% increase) | −0.1 Mt (50% reduction) | 0 Mt (strict protection sustained, no loss) | −0.1 Mt (50% reduction) | 0 Mt (strict protection sustained, no loss) |
| Water bodies → Cultivated land | 0 Mt (no net change) | +0.8 Mt (reclamation intensifies in long term) | 0 Mt (protection maintained) | +0.2 Mt (minor reclamation, 83% reduction from natural scenario) | 0 Mt (protection maintained) | +0.2 Mt (minor reclamation, 83% reduction from natural scenario) |
| Index | 2000→2010 | 2010→2020 | 2020→2030 | 2030→2040 | ||
|---|---|---|---|---|---|---|
| UREC | −0.511 | −0.621 | −1.545 | −0.119 | −0.699 | - |
| - | - | −0.564 | 0 | −0.282 (Policy buffer) | - | |
| - | - | −1.036 | −0.076 | −0.556 (Partially offset) | - | |
| CELEC | −0.018 | −0.109 | 0.072 (Slowing expansion) | 0.010 (Stable period) | - | −0.039 (Net loss) |
| - | - | 0.013 | 0 | - | −0.006 (Strong inhibition) | |
| - | - | 0.032 | 0.009 | - | −0.011 (Moderate inhibition) |
Disclaimer/Publisher’s Note: The statements, opinions and data contained in all publications are solely those of the individual author(s) and contributor(s) and not of MDPI and/or the editor(s). MDPI and/or the editor(s) disclaim responsibility for any injury to people or property resulting from any ideas, methods, instructions or products referred to in the content. |
© 2025 by the authors. Licensee MDPI, Basel, Switzerland. This article is an open access article distributed under the terms and conditions of the Creative Commons Attribution (CC BY) license (https://creativecommons.org/licenses/by/4.0/).
Share and Cite
Zhang, Q.; Liu, S.; Niu, Y.; Hu, Y.; Li, L.; Cai, E.; Zhang, Y.; Zhao, M. Multi-Scenario Simulation of the Dynamic Relationship Between Land Use and Carbon Storage in the Urbanization Process: A Case Study of Zhengzhou, China. Land 2025, 14, 1227. https://doi.org/10.3390/land14061227
Zhang Q, Liu S, Niu Y, Hu Y, Li L, Cai E, Zhang Y, Zhao M. Multi-Scenario Simulation of the Dynamic Relationship Between Land Use and Carbon Storage in the Urbanization Process: A Case Study of Zhengzhou, China. Land. 2025; 14(6):1227. https://doi.org/10.3390/land14061227
Chicago/Turabian StyleZhang, Qianqian, Siyuan Liu, Yilin Niu, Yajin Hu, Ling Li, Enxiang Cai, Yali Zhang, and Menglong Zhao. 2025. "Multi-Scenario Simulation of the Dynamic Relationship Between Land Use and Carbon Storage in the Urbanization Process: A Case Study of Zhengzhou, China" Land 14, no. 6: 1227. https://doi.org/10.3390/land14061227
APA StyleZhang, Q., Liu, S., Niu, Y., Hu, Y., Li, L., Cai, E., Zhang, Y., & Zhao, M. (2025). Multi-Scenario Simulation of the Dynamic Relationship Between Land Use and Carbon Storage in the Urbanization Process: A Case Study of Zhengzhou, China. Land, 14(6), 1227. https://doi.org/10.3390/land14061227