Article

Dynamic Wetland Evolution in the Upper Yellow River Basin: A 30-Year Spatiotemporal Analysis and Future Projections Under Multiple Protection Scenarios

by
Zheng Liu
1,
Chunlin Huang
2,*,
Ting Zhou
2,3,
Tianwen Feng
1 and
Qiang Bie
1
1
Faculty of Geomatics, Lanzhou Jiaotong University, Lanzhou 730070, China
2
Key Laboratory of Remote Sensing of Gansu Province, Heihe Remote Sensing Experimental Research Station, State Key Laboratory of Cryospheric Science and Frozen Soil Engineering, Northwest Institute of Eco-Environment and Resources, Chinese Academy of Sciences, Lanzhou 730000, China
3
University of Chinese Academy of Sciences, Beijing 100094, China
*
Author to whom correspondence should be addressed.
Land 2025, 14(6), 1219; https://doi.org/10.3390/land14061219
Submission received: 4 April 2025 / Revised: 28 May 2025 / Accepted: 30 May 2025 / Published: 5 June 2025

Abstract

:
Wetland monitoring is a key means of protecting wetland ecosystems. In order to achieve continuous monitoring of wetlands and predict future patterns, this paper analyzes the spatiotemporal evolution characteristics of wetlands in the upper reaches of the Yellow River from 1990 to 2020, and uses the Patch Generation Land Use Simulation (PLUS) model to simulate the spatial distribution of wetlands from 2040 to 2060 under four scenarios: farmland protection (FPS), wetland protection (WPS), comprehensive protection (CPS) and natural development (NDS). The results show that the total area of wetlands in the upper reaches of the Yellow River is on the rise, increasing by 7.12% in 2020 compared with 1990. The changes in various types of wetlands are different: the areas of river and canals increased by 26.39% and 57.97%, respectively, paddy fields increased by 7.95%, lakes remained basically stable, and tidal flats decreased by 5.67%. The simulation results of the future spatial pattern of wetlands show that: under the FPS scenario, farmland and related land use will expand significantly, mainly through the development of beaches, dry land and unused land, while under the WPS scenario, wetlands will be strictly protected, the area of water resource features such as rivers, lakes and reservoirs will increase significantly, and land use changes will be more ecologically oriented. Compared with the CPS and NDS scenarios, the wetland protection and urbanization process in the upper reaches of the Yellow River can be balanced under the FPS and WPS scenarios. This study has important reference value for the protection and sustainable development of wetland ecosystems in the upper reaches of the Yellow River.

1. Introduction

Wetlands, as important ecosystems globally, are not only the main providers of freshwater resources but also play significant roles in water quality purification, flood regulation, and groundwater replenishment. Their unique “sponge effect” has earned them the nickname “the kidneys of the Earth”. Wetlands regulate the hydrological cycle and are rich in biodiversity, offering crucial habitats for endangered species and migratory birds [1,2]. However, wetland ecosystems are experiencing significant functional degradation and area reduction under the influence of intensified human activities and climate change, posing serious challenges to ecological balance and sustainability of water resources [3]. Therefore, studying wetland spatiotemporal changes, their driving mechanisms, and simulating future trends under multiple scenarios is essential for adaptive management, ecosystem protection, resource utilization, regional development, and ecological service maintenance [1].
With the development of remote sensing technology, the observation range has been continuously expanded, and surface cover information can be obtained efficiently, which also provides strong technical support for wetland research and improves the efficiency and accuracy of analysis [4,5,6]. At present, large-scale continuous land use data of different resolutions provide a rich data source for wetland monitoring and research at the national and global scales. Due to different spatial resolutions and classification systems, different LULC products vary greatly [7]. More commonly used are the 1 km resolution USGS IGBP-DIS (International Geosphere-Biosphere Program Data and Information System) coverage dataset and UMD Geo Cover dataset (from the University of Maryland), 500 m resolution Moderate Resolution Imaging Spectroradiometer (MODIS) data (MOD 12 Q1, MCD 12 Q1) and 300 m resolution ESA Glob Cover data, 100 m resolution Copernicus Global Land Service (CGLS) data, 30 m resolution GlobeLand 30 and China Land Cover Dataset (CLCD) data. The first four LULC datasets have low spatial resolution and low classification accuracy, and are not suitable for detailed wetland research [8,9,10]. The land use data used in this study is the China Multi-period Land Use Remote Sensing Monitoring Dataset (CNLUCC), produced by Xu Xinliang’s team. It covers land use change information from 1980 to 2020, with a spatial resolution of 30 m, and the data spans the entire mainland of China [11]. This dataset has achieved good results in the study of Yu et al. [12]. This dataset is based on Landsat remote sensing images, produced through visual interpretation and computer mapping methods, with a unified classification system and high consistency, and is widely used in land use/cover change (LUCC) research, ecological environmental assessment, and land resource management. Its multi-period spatiotemporal data provide important support for the dynamic analysis of land change and is one of the basic data for large-scale land use simulation and policy analysis.
Simulating the evolution of future wetland patterns, based on projections of future land use, can offer strong support on the simulation of the land use [13]. In recent years, many scholars have conducted extensive simulation studies on land use and developed a series of models [14,15]. The currently mainstream simulation models mainly include quantitative simulation models (such as logistic regression and Markov chains), spatial simulation models (such as cellular automata and CLUE-S), and coupled simulation models (such as FLUS and PLUS) [8]. Initially, early land use models were primarily based on statistical methods and empirical formulas, making it difficult to effectively capture the complexity of land use changes [14]. In 2007, researchers established a preliminary framework for the PLUS model using detailed ecological and economic data to address limitations in the FLUS model, incorporating cellular automata (CA) and system dynamics (SD) to improve the accuracy and reliability of the simulations [16]. As the 2010s progressed, with the development of remote sensing technology, the PLUS model gradually achieved automated data processing and updating, beginning to be applied in the simulation of land use changes across different regions such as urban expansion, agricultural development, and ecological conservation [17]. During this phase, the LEAS (Land Expansion Analysis Strategy) module was introduced to analyze the contribution of various influencing factors to land expansion [12]. Compared with traditional land use change simulation models (such as CLUE-S, CA-Markov, etc.), the PLUS model has more obvious advantages. It adopts a plot generation mechanism, which can simulate more natural and continuous land change patches, overcoming the problem of fragmented patches in traditional models [14]; at the same time, it introduces machine learning methods such as random forests to improve the ability to identify complex driving factors; it is more flexible in setting policy scenarios, supporting the expression of multiple spatial constraints such as farmland protection and ecological red lines; in addition, the PLUS model is easy to operate, highly applicable, and has good uncertainty control capabilities, which is suitable for high-precision land use change simulation under multi-scale and multi-scenario conditions [14]. Therefore, considering the simulation accuracy, spatial authenticity and policy intervention expression capabilities, this paper selects the PLUS model as the main simulation tool.
The upstream wetlands of the Yellow River, as an important water supply area in China, mainly consist of alpine marsh wetlands. These wetlands play a crucial role in regulating runoff, improving water quality, and protecting biodiversity, thus being vital for the ecological balance and water resource security of the Yellow River basin [18]. At present, most studies using the PLUS model for land use simulation lack attempts to simulate land use changes over large regions. This study explores this gap by applying the PLUS model to simulate large-scale future land use changes, providing new research perspectives and technical support for large-scale wetland monitoring and management. It fully considers different types of wetlands and selects three representative regions with distinct wetland characteristics for separate analysis. Furthermore, four future development scenarios were designed based on national development needs to examine potential changes in wetlands under different trajectories. In summary, this study conducts a statistical analysis of wetland area changes in the upper reaches of the Yellow River over the past 30 years, explores the driving forces behind wetland changes, and simulates future wetland patterns from 2040 to 2060, with the aim of providing targeted planning recommendations for specific wetland types.

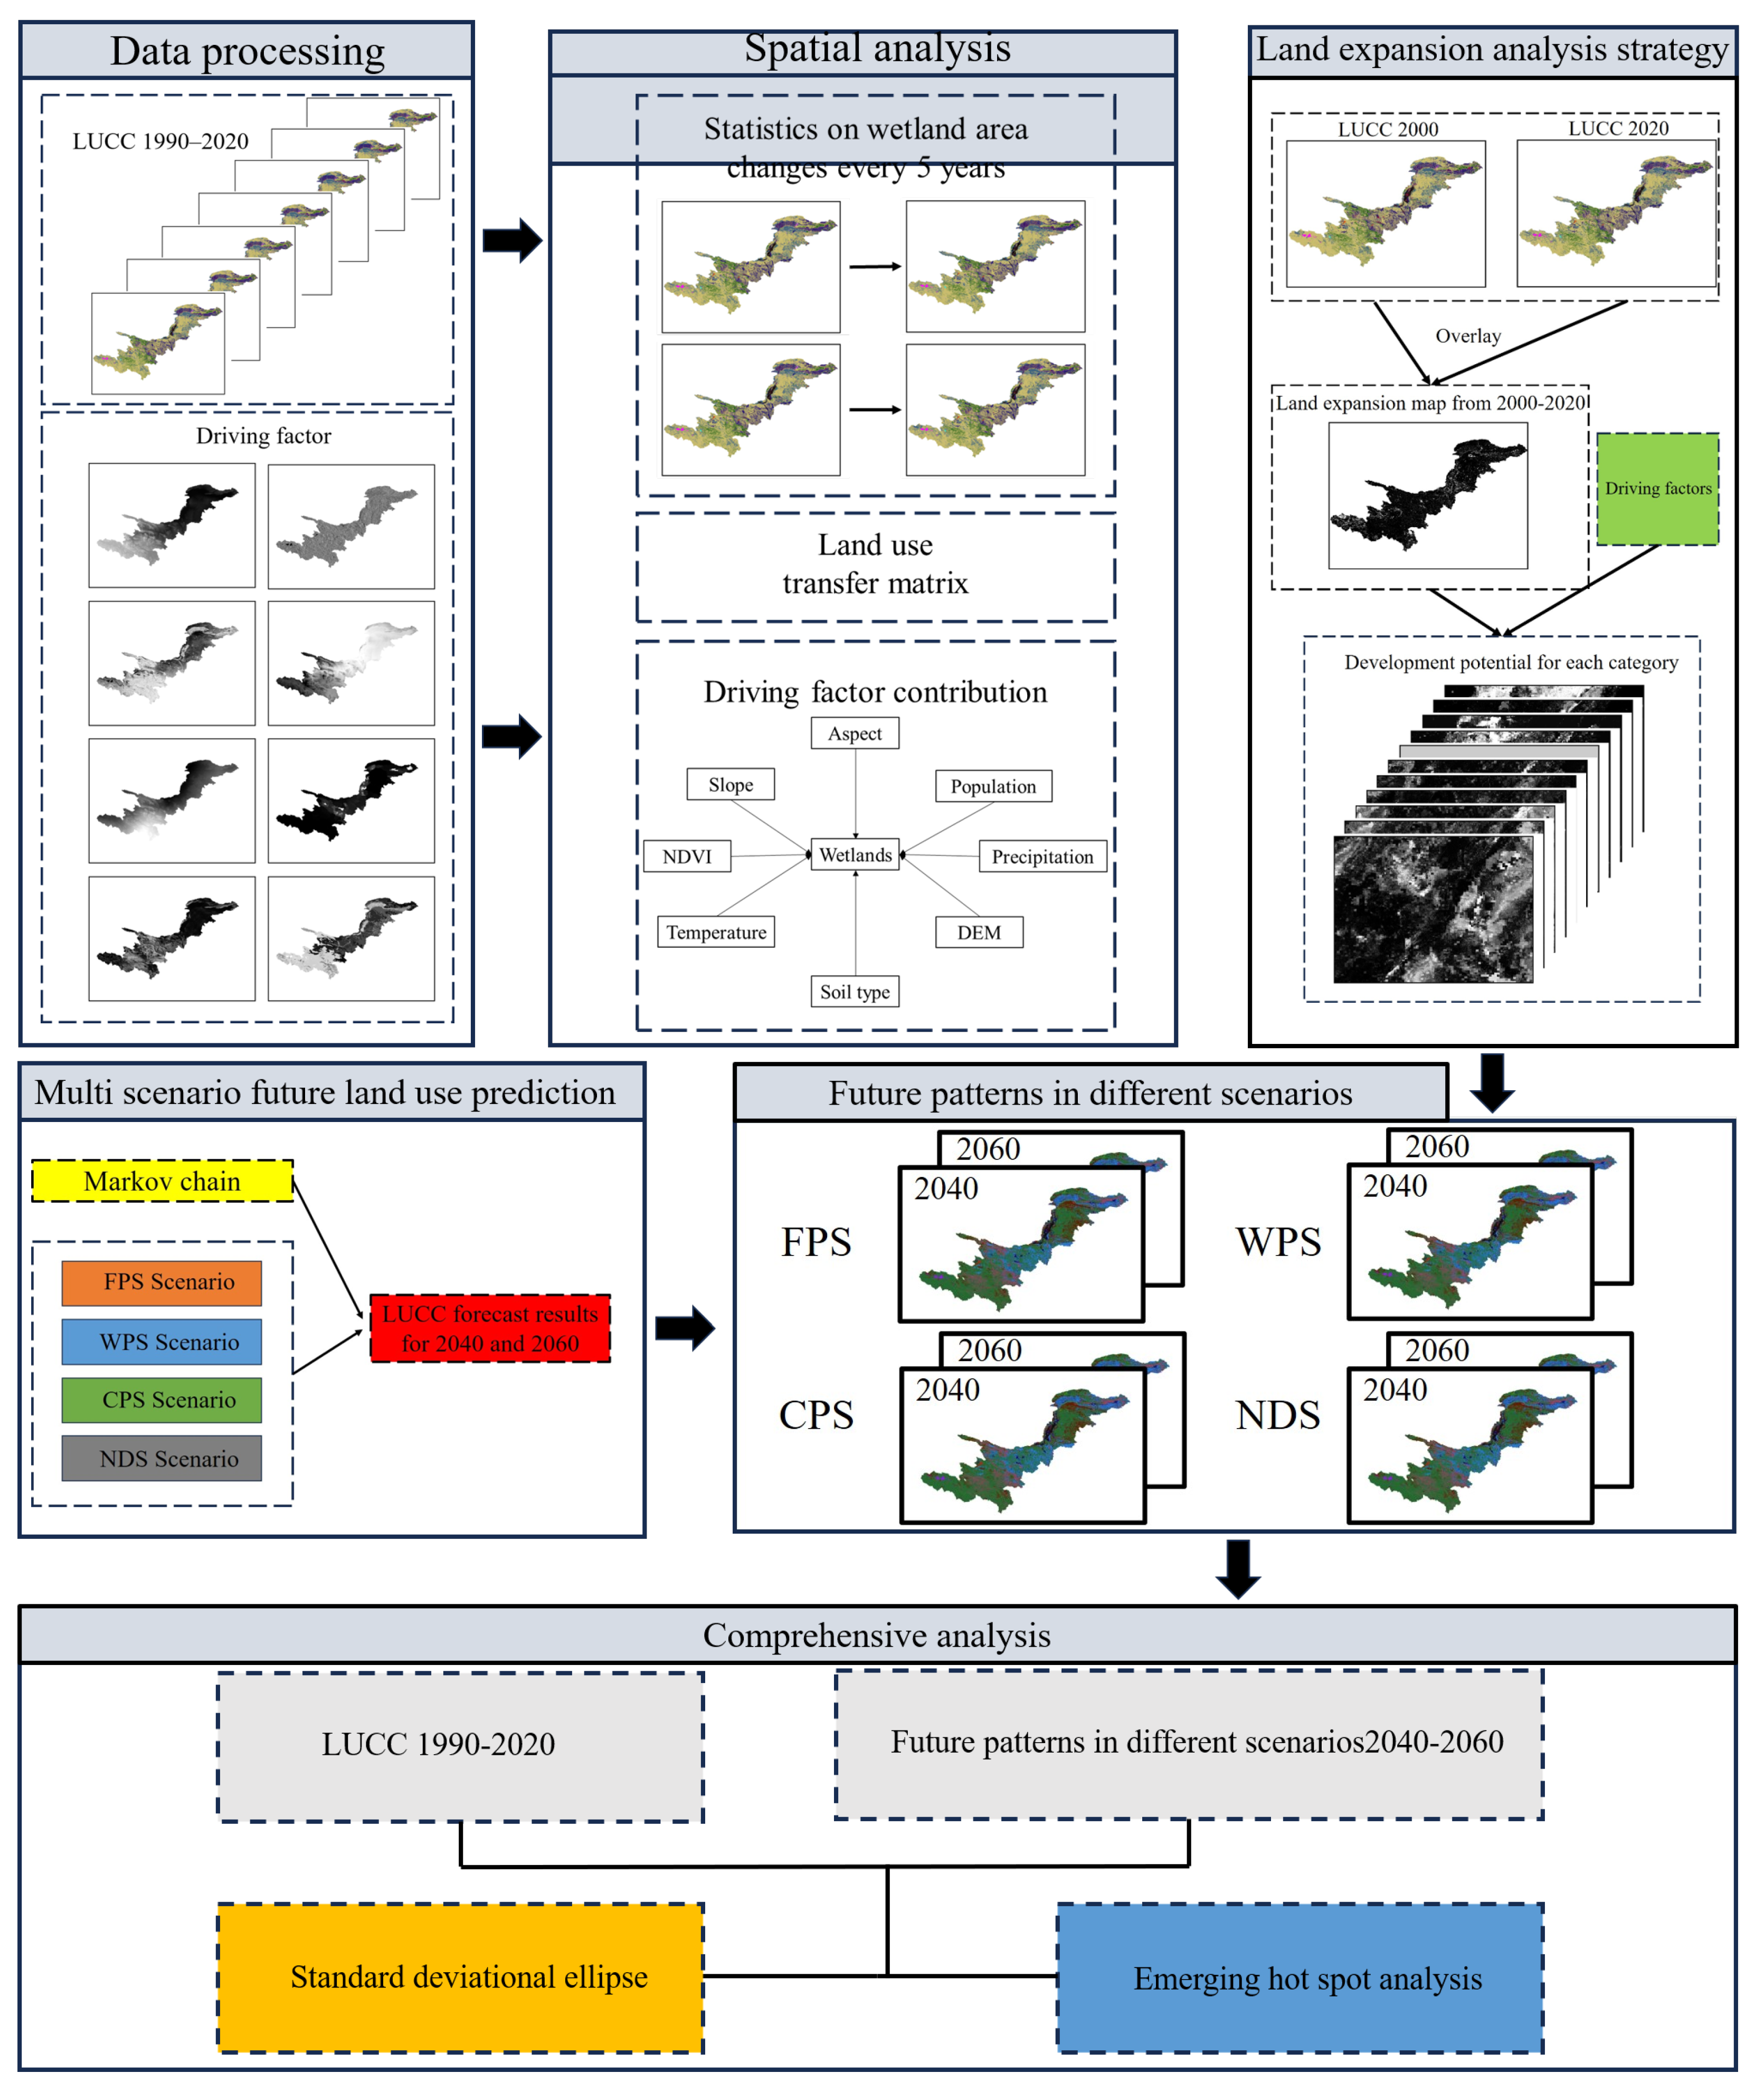
2. Data and Methodology

2.1. Study Area

The upper reaches of the Yellow River (Figure 1) are located in the Qinghai–Tibet Plateau and parts of Gansu, Ningxia, and Inner Mongolia, with coordinates between 967°12′ E to 112°34′ E and 32°24′ N to 41°42′ N. This region stretches over 3472 km, making up 55% of the river’s total length [19]. The terrain is rugged, with an average altitude over 3000 m, numerous canyons, and rapid water flows. The climate is plateau continental, with annual precipitation of 300–600 mm and temperatures ranging from −4 °C to 9 °C. Soils include alpine meadow and permafrost, while vegetation is mostly alpine meadows, supporting diverse biodiversity [20]. Water sources primarily come from melting ice and snow, making this area a key water supply and ecological function zone in the Yellow River basin. The wetlands here include alpine marshes, lake wetlands, river wetlands, and peat swamp wetlands [18].
Based on a comprehensive analysis of the upper reaches of the Yellow River, in view of the heterogeneity of natural characteristics in the upper reaches of the Yellow River, three typical representative areas were selected. The first area (Figure 1a) is located at the junction of Yushu and Golog Tibetan Autonomous Prefectures in Qinghai Province, featuring Zhaling Lake and Eling Lake, both part of the Yellow River system, with Eling Lake downstream. The eastern region is covered with glaciers, creating a unique ecological environment. The second area (Figure 1b) is in Ningxia Hui Autonomous Region, including Shizuishan, Yinchuan, Wuzhong, and Zhongwei cities. Known for its significant grain production, the Ningxia Plain benefits from Yellow River irrigation, with rice cultivation dominating the “paddy field” category in Land Use/Cover Change (LUCC). The third area (Figure 1c) is located at the junction of Bayannur and Ordos cities in Inner Mongolia, where the Yellow River has increased flow, creating wide rivers, canals, and many tributaries and tidal flats. LUCCs in this area are particularly prominent. These areas will be referred to as Area A, Area B, and Area C, respectively.

2.2. Data and Preprocessing

Multiple datasets were utilized for the assessment of wetland changes and future simulations in the upper reaches of the Yellow River. The LUCC dataset was obtained from the Resource and Environment Science and Data Center (RESDC) (http://www.resdc.cn/ (accessed 18 June 2024) with a spatial resolution of 30 m for the period from 1990 to 2020. This dataset is based on Landsat imagery for visual interpretation, achieving an overall accuracy exceeding 90% [21]. The existing land use classification system in the study area includes seven types of wetlands and twelve types of non-wetlands. In order to facilitate the exploration of significant wetland changes, the classification system provided in the “China Multi-period Land Use Remote Sensing Monitoring Dataset (CNLUCC)” produced by Xu Xinliang’s team was referred to. As mentioned above, this dataset has been well validated in the research of Yu et al. [12]. The three-level classified wetland types were merged and retained to the second-level classification, and the non-wetland types were merged and retained to the first-level classification [21]. The new classification system ultimately comprises five wetland types (paddy fields, rivers and canals, nature water, reservoirs and ponds, and tidal flats) and six non-wetland types (woodland, grasslands, drylands, glaciers, residential areas, and unused lands). Based on the study by [12] and considering the geographical and cultural context of the upper reaches of the Yellow River, this paper selects eight key factors that influence wetland changes, including: Digital Elevation Model (DEM), slope, aspect, precipitation, temperature, population density, Normalized Difference Vegetation Index (NDVI), and soil types. Some datasets cover a time span from 1990 to 2020, totaling 30 years. To ensure the successful operation of the PLUS model, data with different spatial resolutions were resampled to a 30 m resolution. The data sources are detailed in Table 1.

2.3. Methods

This study focuses on the historical changes in wetlands from 1990 to 2020. Spatial statistical methods were employed to analyze the area changes in various types of wetlands, calculating the area transfer matrices for different wetland types and conducting an analysis of the driving forces behind changes in wetland spatial distribution. Subsequently, four future development scenarios were established using the PLUS model, simulating the spatial patterns of wetlands under different future development scenarios in the upper reaches of the Yellow River. The research process is referenced in Figure 2.

2.3.1. Statistical Analysis of Wetland Area Changes from 1990 to 2020

The structural characteristics and directional changes in land use conversion can be intuitively described by the conversion matrix [22]. This study used the raster calculator in ArcGIS 10.7 to generate a conversion matrix to represent the conversion between two land use raster datasets. The matrix expression of the conversion matrix is as follows [23]:
p i j = p 11 p 1 n p n 1 p n n
where P represents the area of various types of Land Use and Land Cover (LULC); i and j denote the areas of LULC types at the beginning and end of the study period, respectively; n indicates the total number of LULC types. Each row and column represent the outflow and inflow areas, respectively.

2.3.2. Patch-Generating Land Use Simulation Model (PLUS)

The PLUS is a tool for simulating land use changes designed to comprehensively consider the driving effects of various influencing factors on land use change. The PLUS model mainly consists of two modules. The LEAS module samples the cells with changing statuses from LULC data at two different dates and utilizes a random forest algorithm to explore the relationship between the expansion of each LULC type and multiple driving factors, resulting in the development potential of each LULC type [14]. The CARS module includes a roulette wheel competition mechanism for the generation threshold rules of random seeds, allowing the development of new patches under the constraints of growth probability [14]. Furthermore, the CARS module requires the establishment of a transformation matrix that defines whether LULC types can be converted to one another. If conversion from one LULC type to another is allowed, the value in the matrix is 1, otherwise it is 0. The expansion ability of each LULC type is represented by the neighborhood weight parameter, which ranges from 0 to 1. In this study, the neighborhood weights of different LULC types in the PLUS model were set based on the extracted land expansion map.

2.3.3. The Contribution Analysis of Influencing Factors

The LEAS module in the PLUS model can calculate the contribution of driving factors to wetland change. The LEAS module conducts quantitative analysis of the driving factors of land use change through spatial statistics and data mining methods. First, it screens and categorizes the influencing factors (such as natural environment, socioeconomic, and policy factors), then assesses the driving strength and spatial distribution characteristics of each factor using geographic detectors to extract the main driving patterns and the importance ranking of factors [14]. Among these, the geographic detector is used to quantitatively determine the explanatory power of each driving factor on land use change (q value) [24,25]. The formula is as follows:
q = 1 h = 1 L N h σ h 2 N σ 2
where q represents the explanatory power of the factor, with a value range between 0 and 1; N h and σ h 2 denote the sample size and variance of the h-th subregion, respectively; N and σ 2 represent the overall sample size and variance. A higher q value indicates a greater contribution of the factor to land change.
Regression analysis includes logistic regression and random forest, through which regression models of land use change (e.g., wetland → farmland) are established to quantify the weights of factors. Machine learning algorithms such as random forest can capture the nonlinear relationships among factors. The logistic regression model is formulated as follows [26]:
P ( y = 1 ) = 1 1 + e ( β 0 + β 1 x 1 + + β n β n )
where P ( y = 1 ) is the probability of a land parcel undergoing change.
For certain specific factors, such as the distance to roads and water bodies, spatial distance analysis is employed to calculate the spatial distribution relationship between land change areas and these factors, resulting in a driving force distribution map. The formula for Euclidean distance is as follows [27]:
d = x 2 x 1 2 y 2 y 1 2
the term x 2 x 1 2 represents the plot coordinates, while y 2 y 1 2 represents the geographical feature coordinates.
These results can be utilized to generate scenario rules, optimize model parameters, and provide scientific basis for ecological protection and land planning, such as identifying key driving factors behind degradation or expansion in wetland studies, thereby supporting the formulation of precise conservation strategies. The integrated application of these methods enables the LEAS module to comprehensively and accurately assess the contributions of influencing factors to land expansion.

2.3.4. Analysis of Different Future Development Scenarios

Based on region-specific policies, we proposed four land use development scenarios for 2020–2060: Farmland Protection Scenario (FPS), Wetland Protection Scenario (WPS), Comprehensive Protection Scenario (CPS), and Nature Development Scenario (NDS).
Farmland Protection Scenario (FPS): The area of farmland strictly protected to ensure that it does not decrease, with certain limitations on the conversion of other land types to farmland. Wetlands in areas with suitable water conditions may be transformed into farmland, and dry land and residential areas may also be converted into farmland to increase arable land [28]. Although forestlands and grasslands have ecological value, some areas may be cultivated as farmland due to the demand for agricultural expansion [29].
Wetland Protection Scenario (WPS): Wetlands (such as rivers and canals, reservoirs and ponds, nature water, and tidal flats) strictly protected to ensure the integrity of their ecological functions, prohibiting the conversion of wetlands into farmland, dry land, or residential areas [30]. Some drylands, forestlands, grasslands, and even farmlands may be converted into wetlands in the context of ecological restoration to enhance the sustainability of water resources and biodiversity [31]. Residential areas and unused lands may also be transformed into wetlands under specific conditions; for example, returning farmland to wetlands and building wetland parks may also cause long-term waterlogging of land due to natural disasters such as floods and land subsidence or water conservancy projects, prompting it to gradually become a wetland. Unused land is more likely to be converted into wetlands, which is common in artificial wetland construction, ecological restoration projects, or the formation of new wetland areas due to natural factors such as changes in hydrological conditions and rising groundwater levels.
Comprehensive Protection Scenario (CPS): Wetlands, grasslands, and forestlands will be strictly protected to maintain ecological balance and biodiversity [12]. Farmland will also receive a certain degree of protection to ensure the stability of agricultural production. Relative to this, there will be greater flexibility in the conversion of drylands, residential areas, and unused lands, which may be transformed into farmland or other uses based on development needs.
Nature Development Scenario (NDS): It is assumed that future changes in land use costs will not consider the impacts of unexpected policies, and all land types can be interconverted while maintaining fundamental ecological red line areas, specifically existing natural water bodies [12].

2.3.5. Model Validation

This study compares the actual 2020 LULC data with the simulation results for validation. The overall accuracy (OA) is used to assess the simulation accuracy [14]. OA is defined as:
O A = k = 1 n O A k N
where OA represents the agreement probability between the actual and simulated LULC for the random sample; O A k is the proportion of samples where the k-th land use type is correctly classified; n and N represent the number of land use types and the total number of samples, respectively. In land use simulation studies, OA above 80% is generally considered ideal, especially when the simulation target is macro land use change. If OA is lower than 75%, it means that the model may have large uncertainties and it may be necessary to adjust the driving factors, improve data quality, or optimize parameters [32].

3. Results

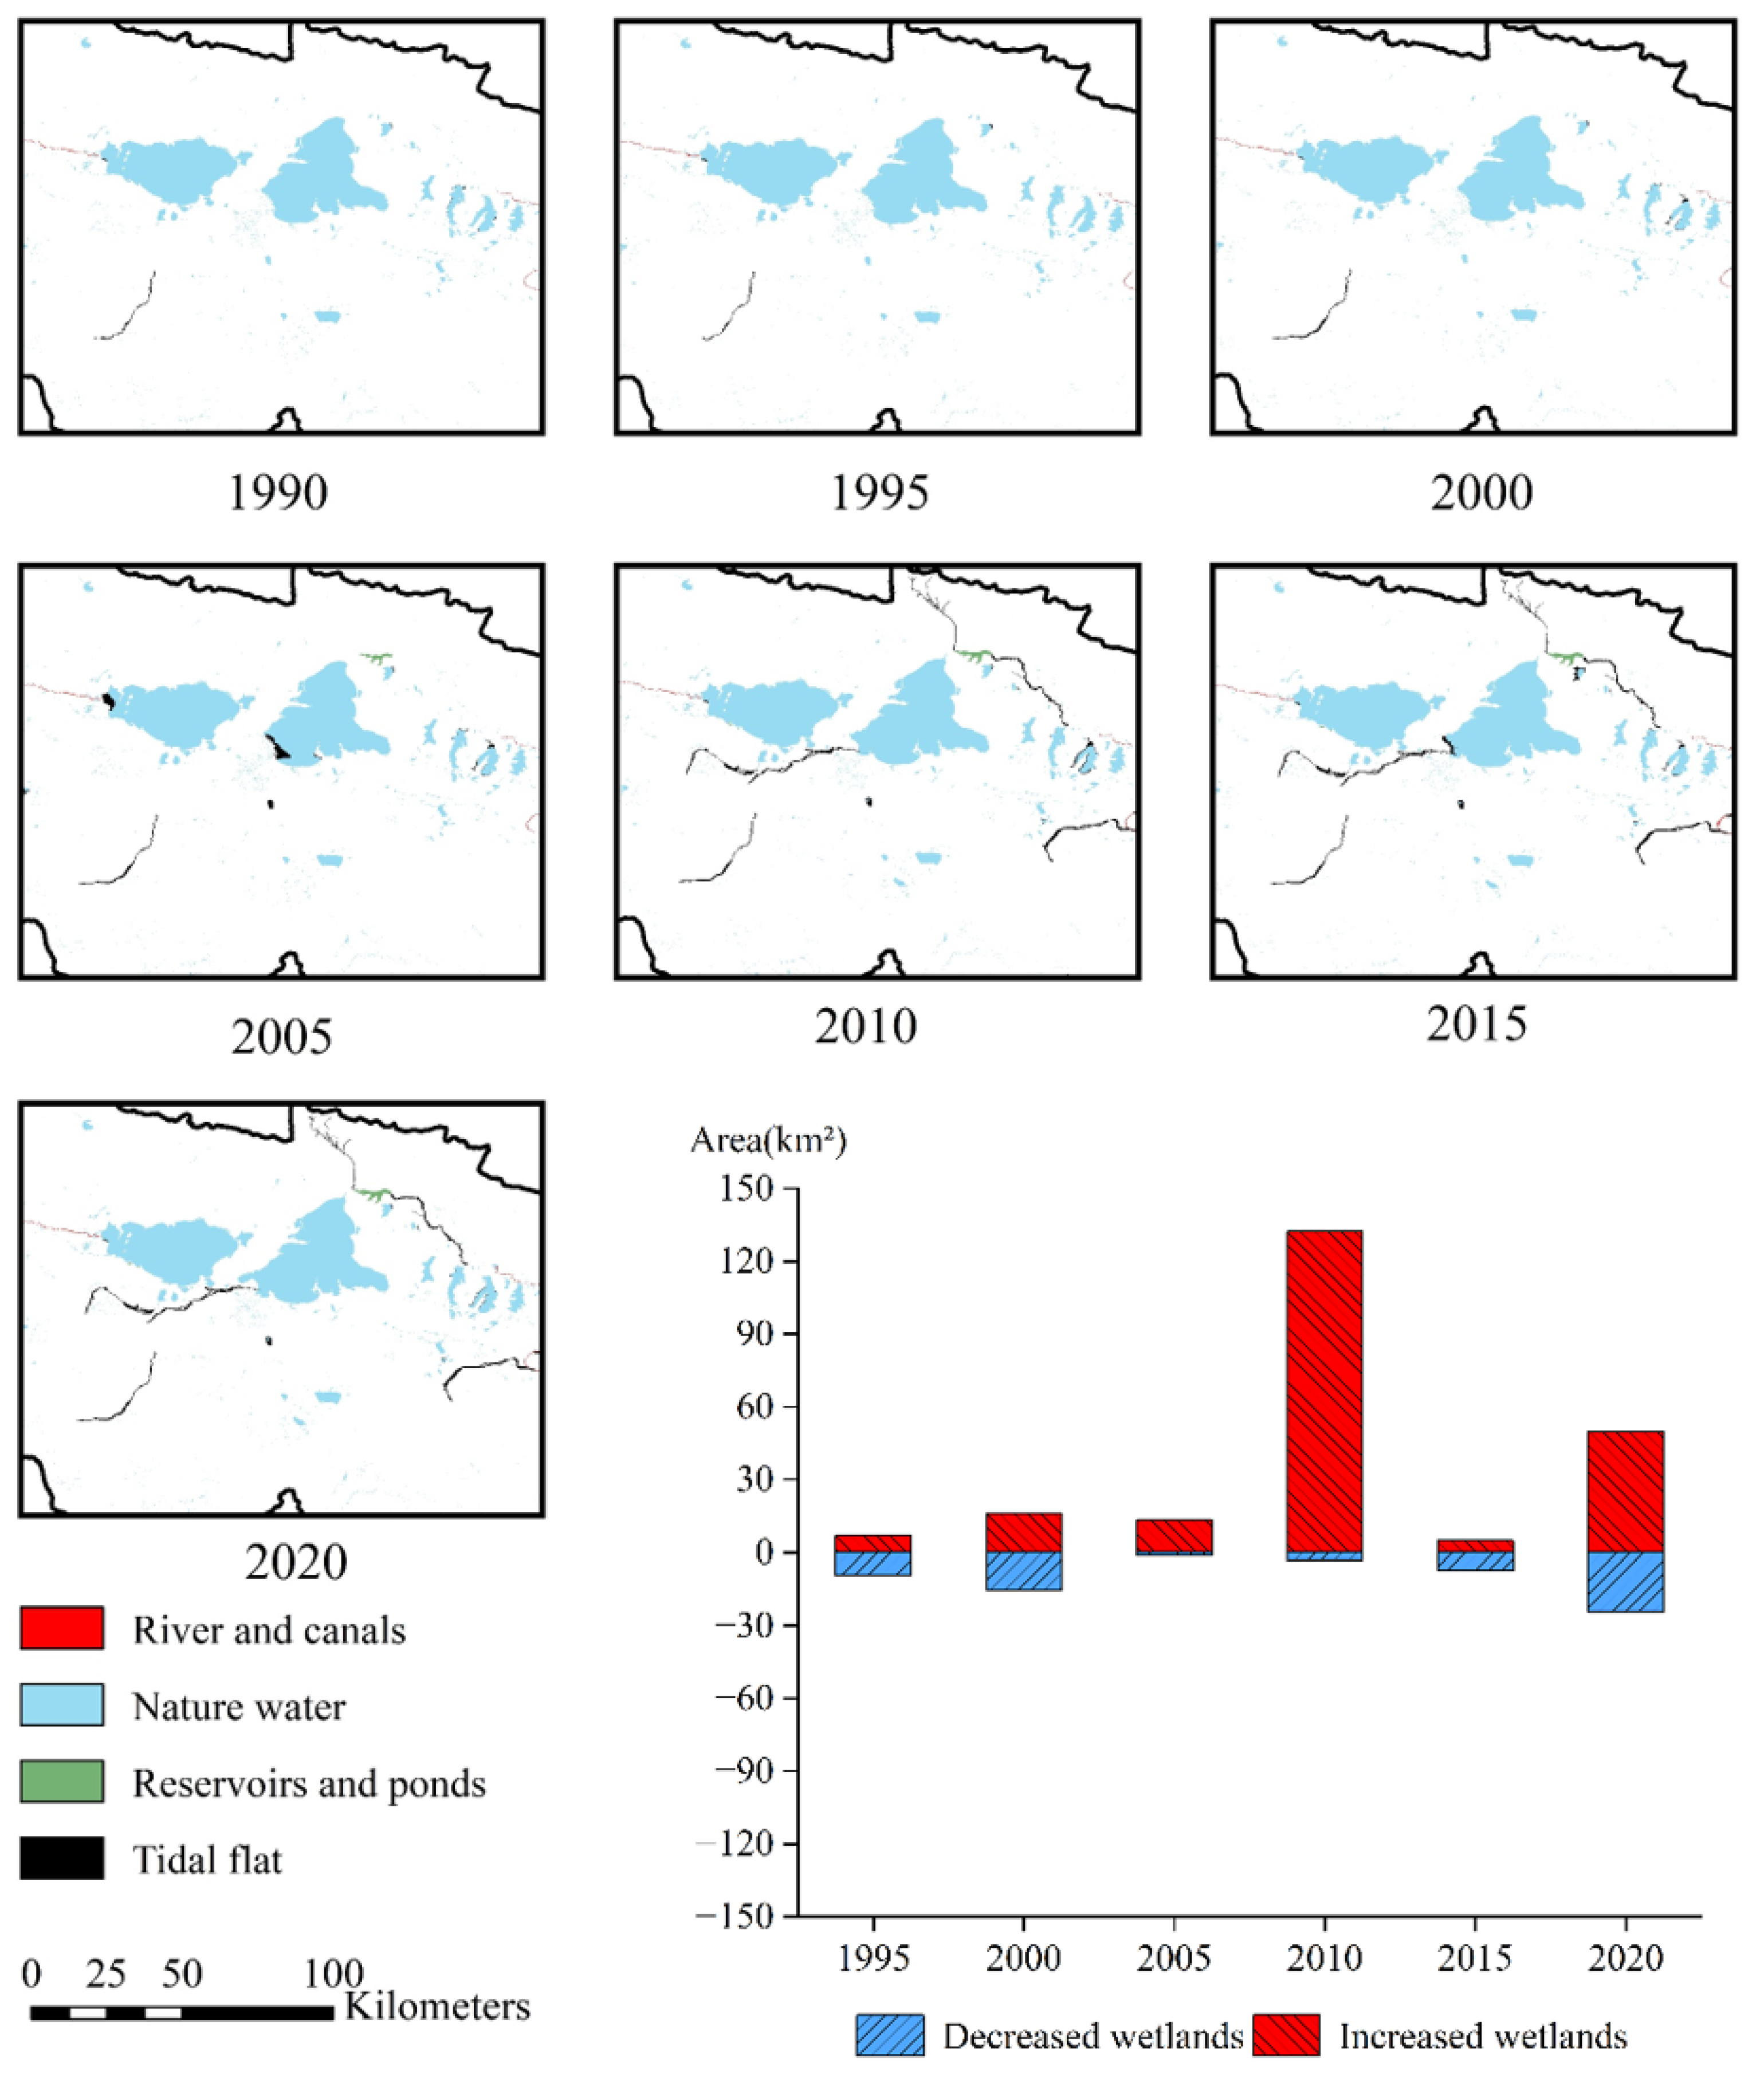
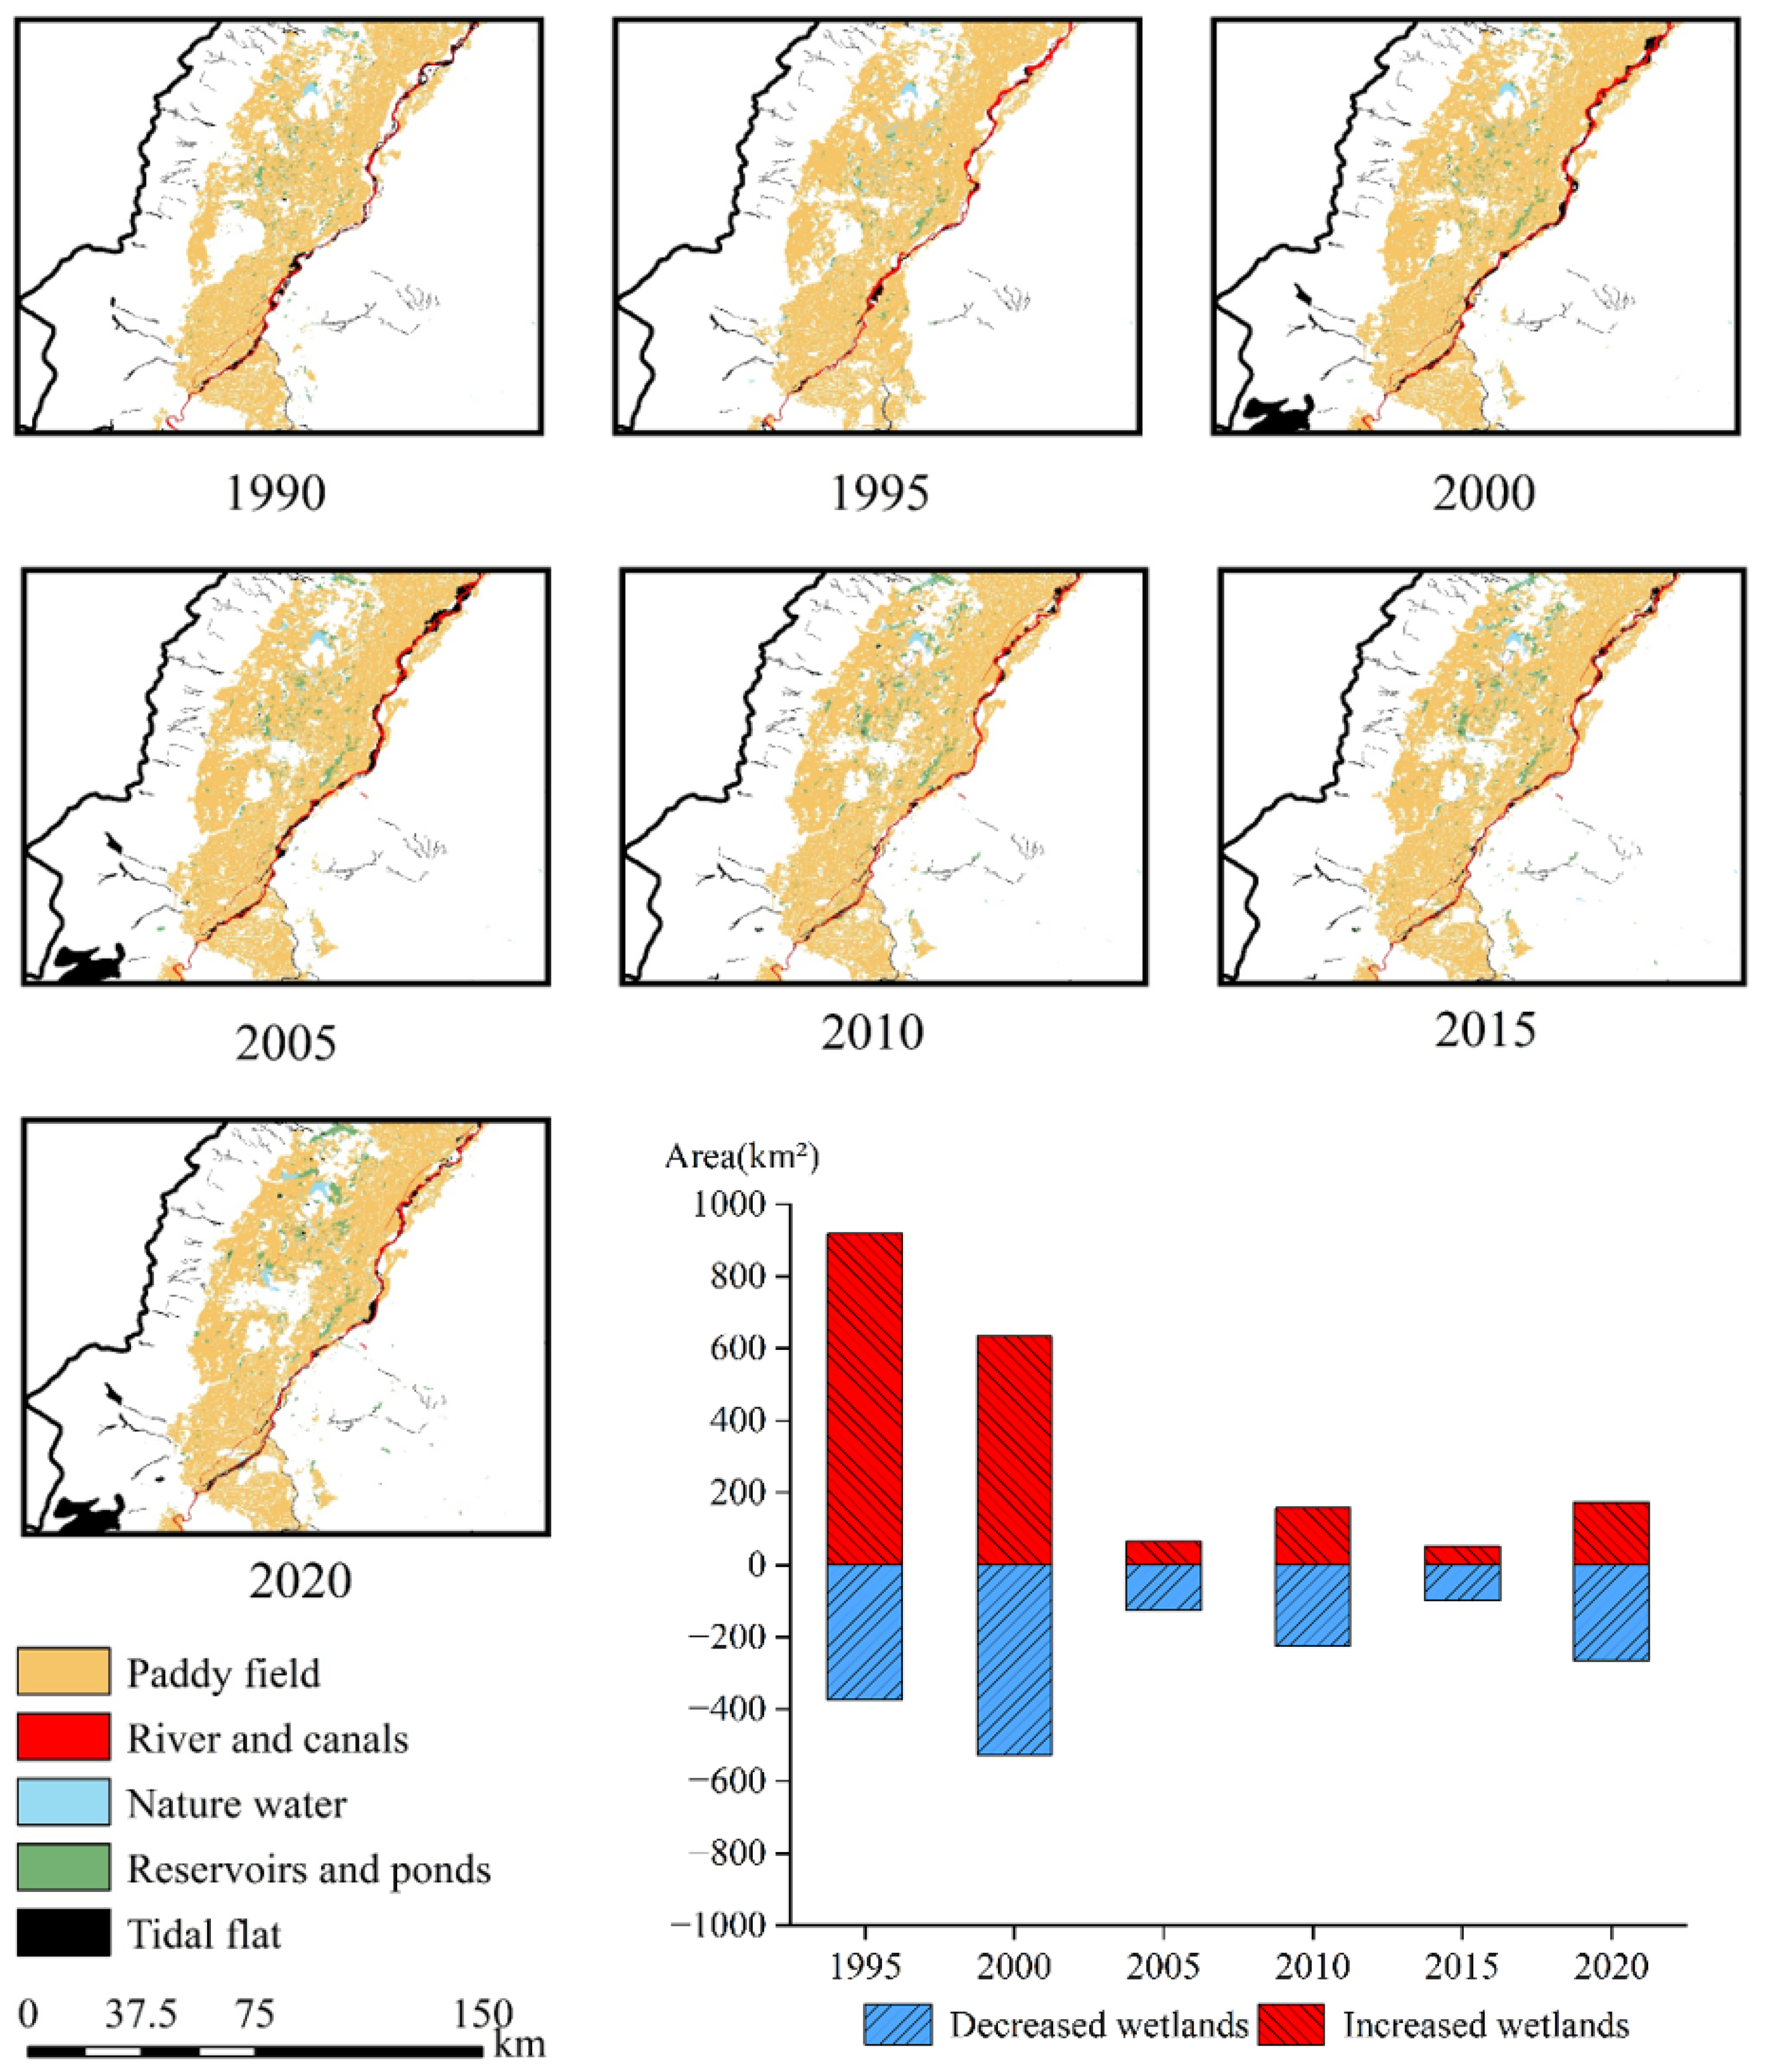
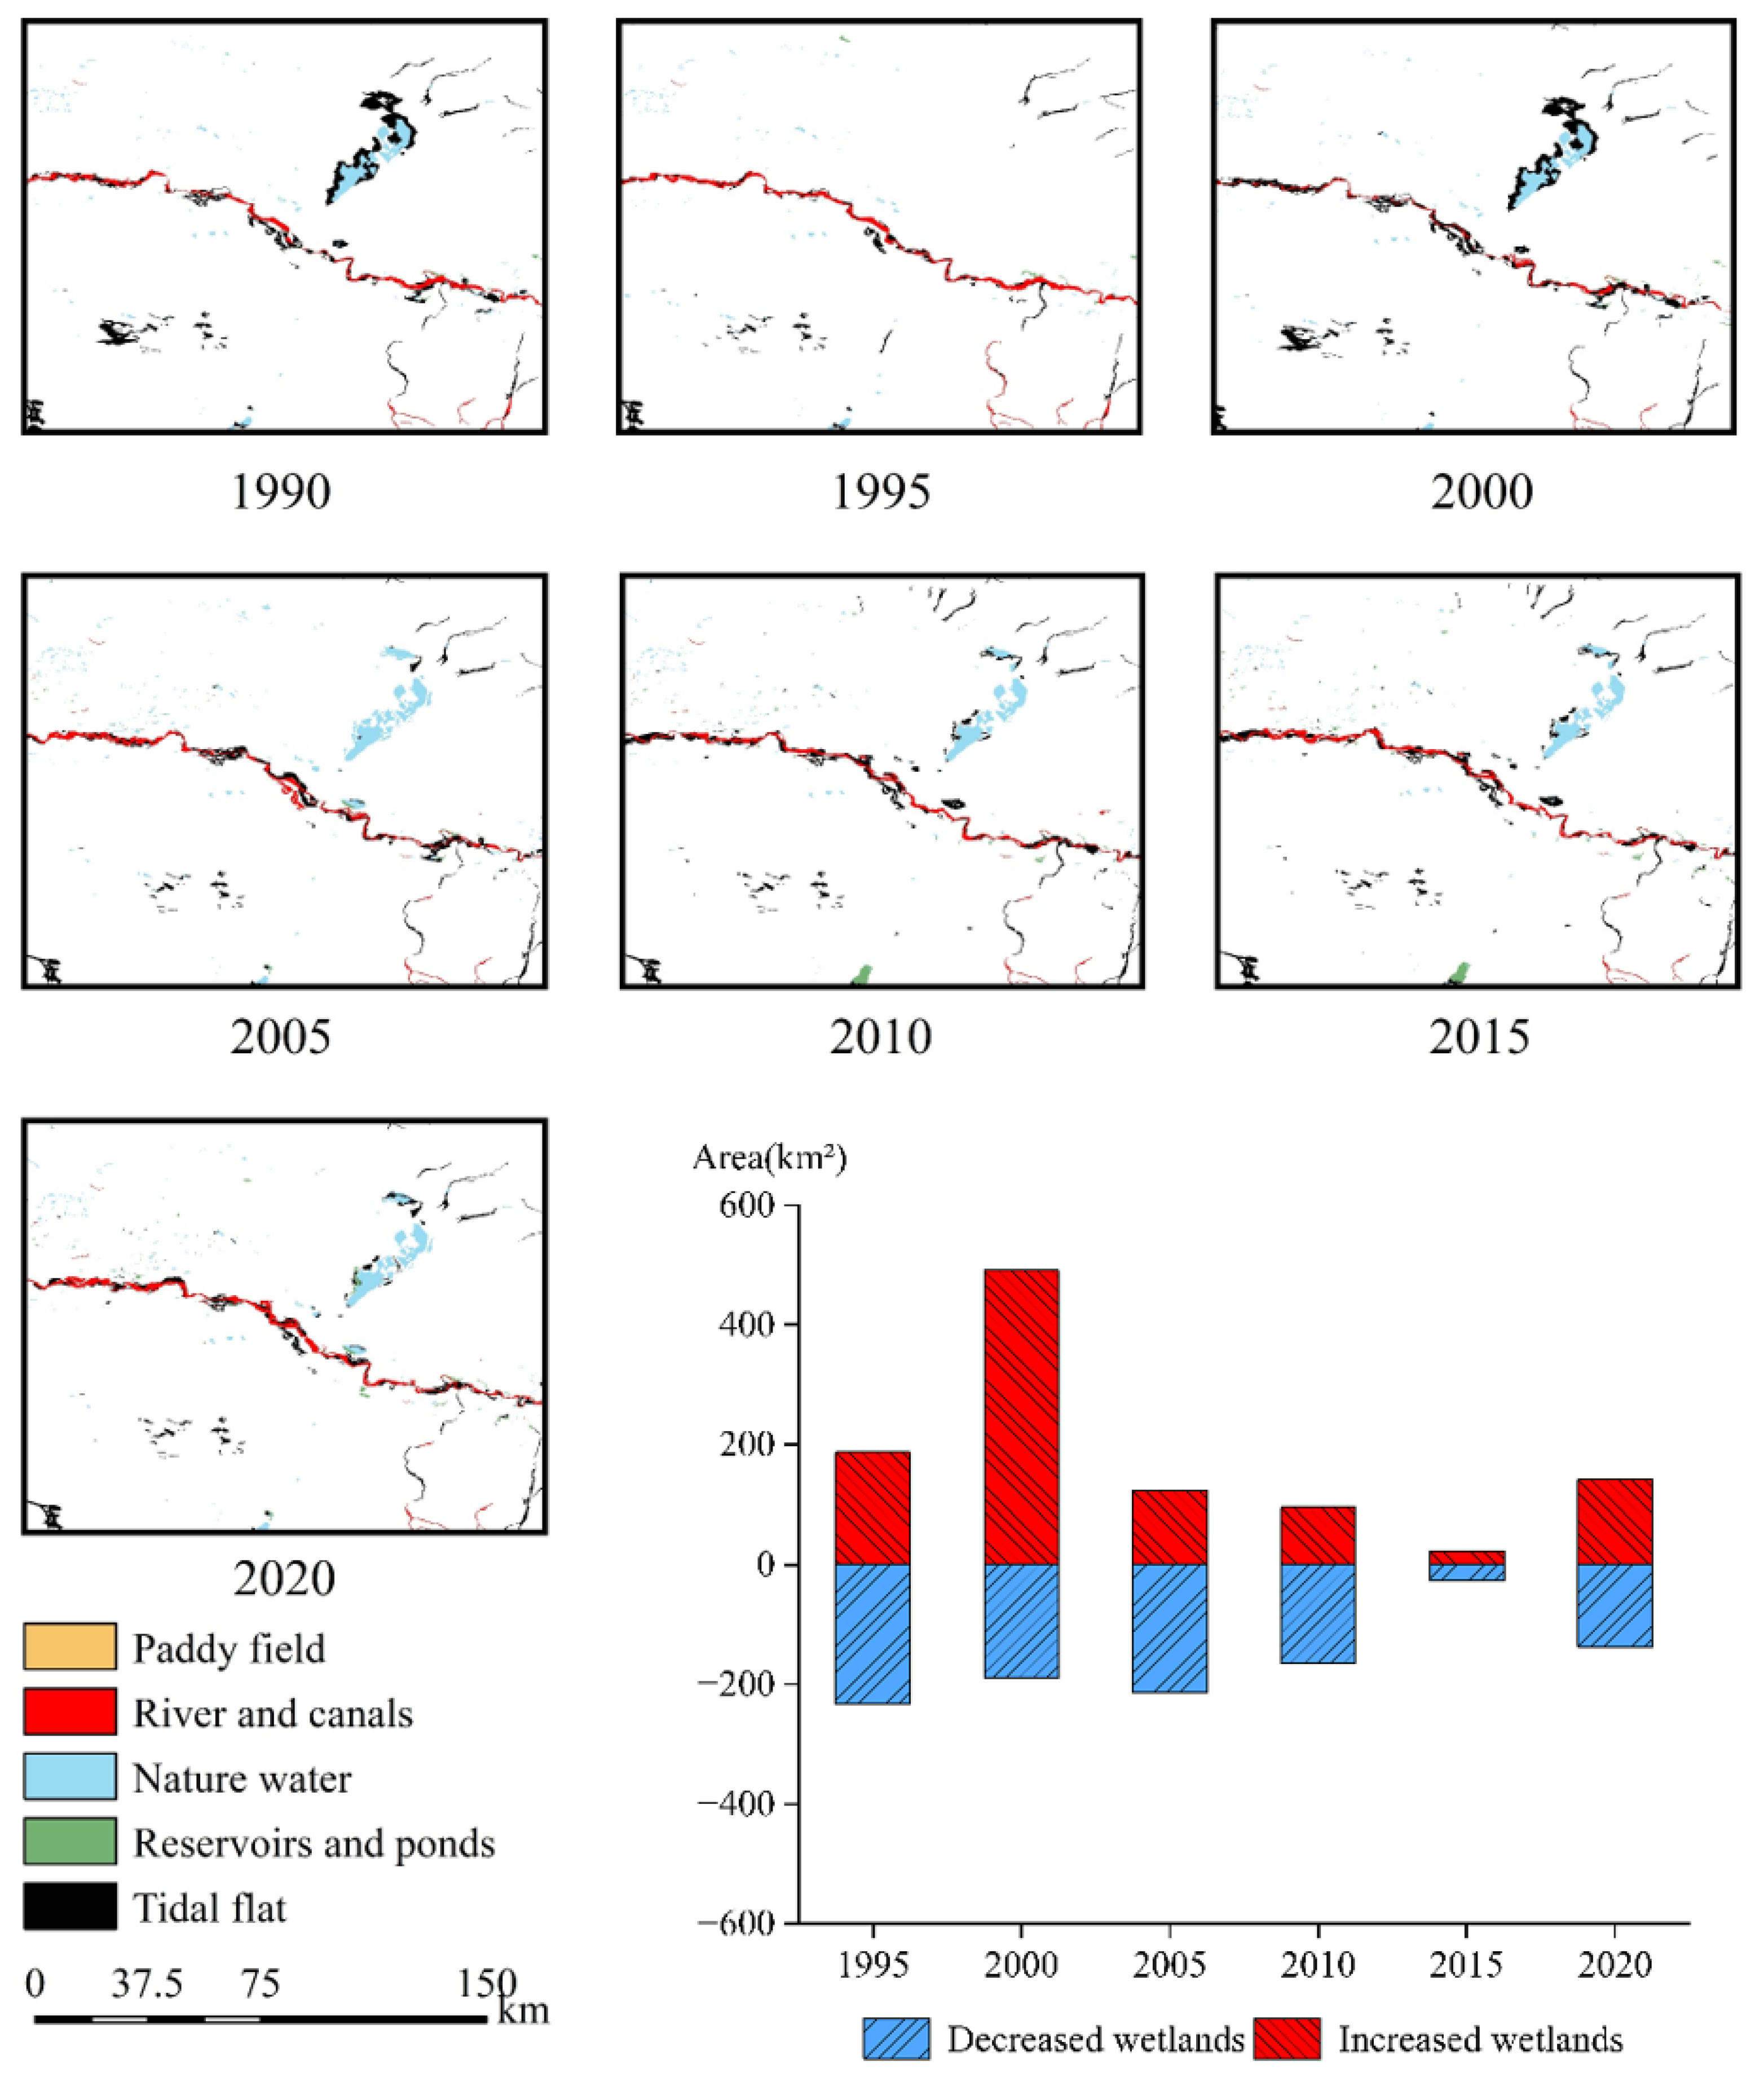
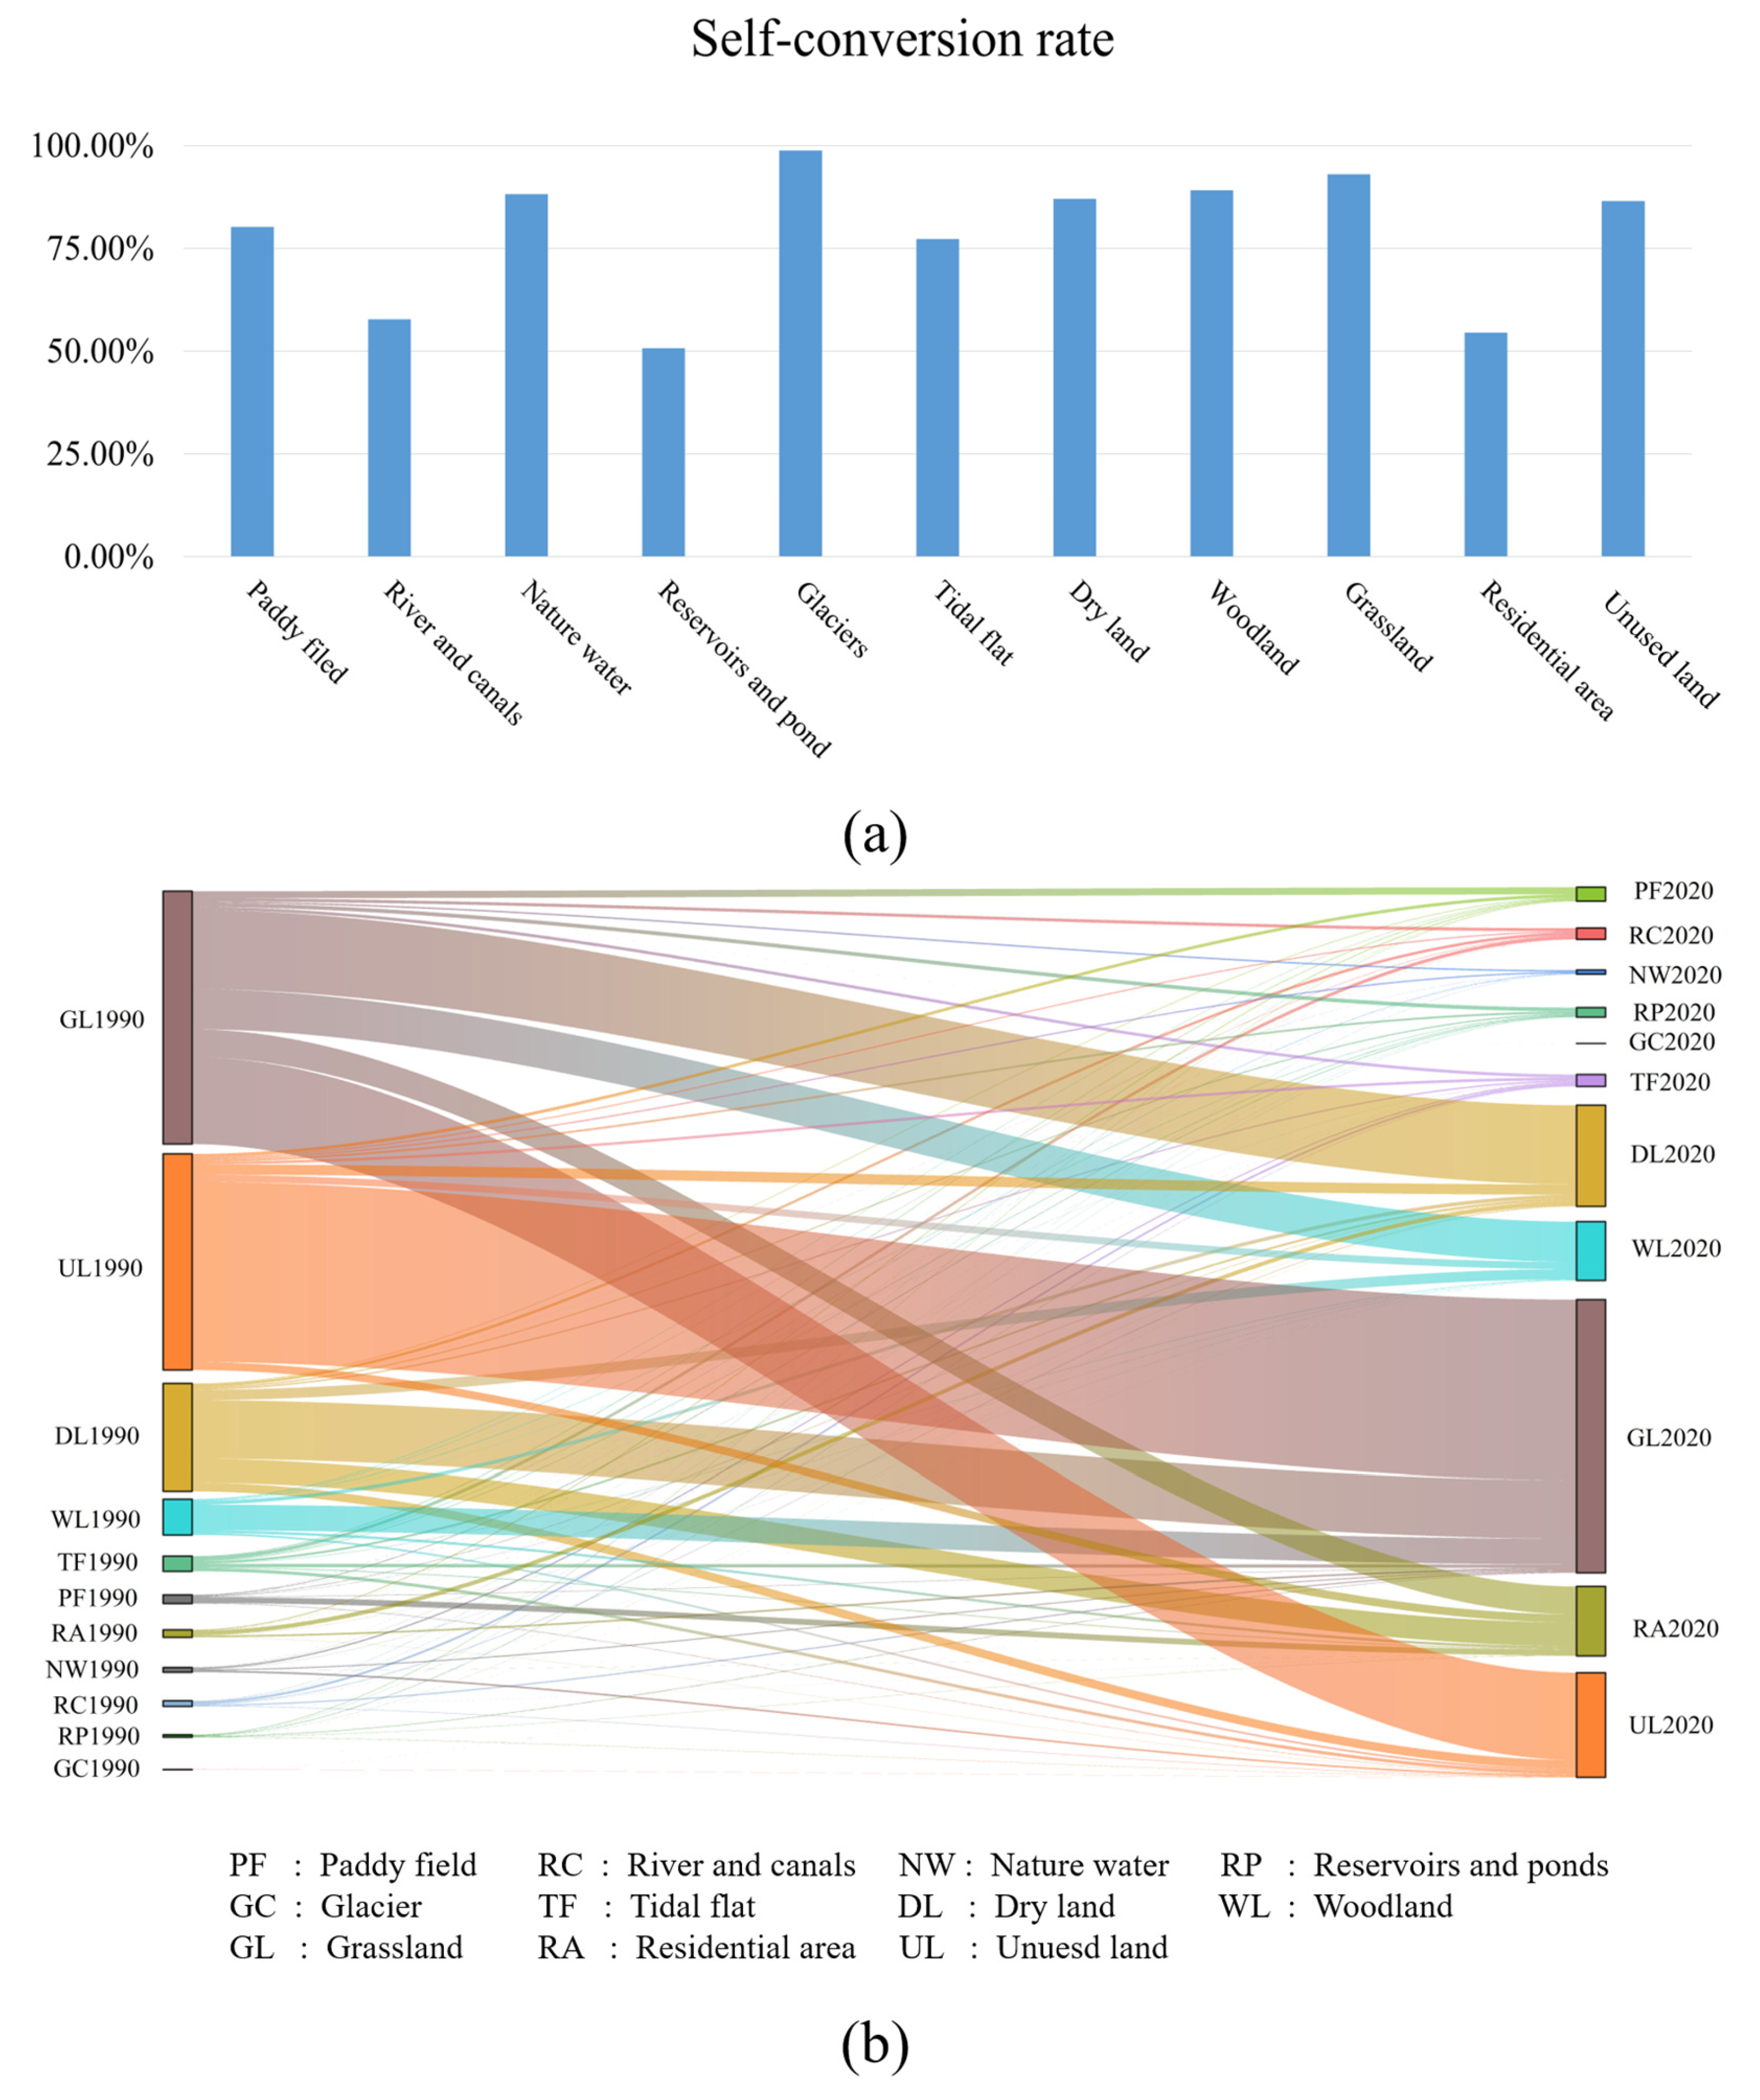
3.1. Changes in Wetland Area from 1990 to 2020

Based on LUCC data, this study conducted a statistical analysis of the changes in the total area of wetlands in the upper reaches of the Yellow River from 1990 to 2020. The results indicate that over the past 30 years, the total area of wetlands in the upper reaches of the Yellow River exhibited fluctuations, overall showing a gradual increasing trend. In detail, the total wetland area decreased from 12,151.1 km2 to 11,806.8 km2 between 1990 and 1995, representing a decrease of approximately 2.83% (Figure 3). From 1995 to 2000, the wetland area increased significantly, reaching 12,780.2 km2, an increase of 8.24% over 1995. From 2000 to 2020, the wetland area remained relatively stable with slight fluctuations. In 2020, the wetland area in the upper reaches of the Yellow River reached a historical high of 13,023.5 km2.
From 1990 to 2020, the wetland pattern in the upper reaches of the Yellow River has changed significantly, showing an overall evolutionary feature driven by both human activities and natural processes (Figure 3). Driven by improved irrigation conditions and agricultural technological advances, the paddy field area has increased by about 7.95% overall, with a large increase from 1990 to 2000, and then stabilized and slightly decreased (Figure 3). The rivers and canals area increased by about 26.39%. Although it declined between 1990 and 2000, it has increased significantly since 2005, reflecting the continuous construction and improvement of agricultural water conservancy facilities. As important artificial wetlands, reservoirs and ponds have expanded rapidly since 2000, with a cumulative increase of 57.97%. This change is closely related to the increase in water resource allocation needs in the process of urbanization (Figure 3). The natural water area has decreased slightly in the past 30 years, down by about 2.32%. The area of tidal flat has generally shown a decreasing trend, especially between 1990 and 1995, when the decline was more obvious (Figure 3). This may have benefited from the initial results of soil and water conservation work in the Loess Plateau at that time. By 2020, it had decreased by about 5.67% compared with 1990. The statistical results of the area of non-wetland features from 1990 to 2020 are shown in Table 2.

3.2. Typical Regional Wetland Changes

Due to the spatial differences in natural geographical environment and socio-economic conditions, wetland changes in various regions of the upper reaches of the Yellow River showed significant regional characteristics from 1990 to 2020.
The wetland area in region a showed an overall fluctuating upward trend, increasing from 1527.9 km2 in 1990 to 1575.5 km2 in 2020 (Figure 4). The largest natural water bodies in the region, Zhaling Lake and Eling Lake, have remained relatively stable in area over the past three decades, forming the core of the regional ecology. It is worth noting that since 2005, large areas of tidal flats have gradually formed on the west, south and southeast sides of the two lakes, reflecting the gradual recovery of the tidal flat ecosystem after the reduction around 1995. At the same time, artificial reservoirs and ponds have appeared on the northeast side of the lake since 2005, indicating that artificial wetlands in the region have expanded on the basis of natural water systems, which may be related to water resources management and regulation and storage project construction. This change in the wetland structure in region A reflects the dual impact of natural processes and human intervention.
Region b is the area with the most concentrated agricultural development in the upper reaches of the Yellow River, covering almost all paddy fields. Between 1990 and 2000, the area of paddy fields expanded rapidly, reaching a peak of 4730.6 km2 in 2000 (Figure 5). However, since 2005, the area of paddy fields has continued to decline, falling to 4445.7 km2 in 2020. To ensure agricultural irrigation needs, the areas of rivers and canals and some natural water bodies in Area B have increased, indicating that the water conservancy infrastructure in the region has been strengthened. However, this expansion was also accompanied by a significant compression of dryland and grassland areas, reflecting that agricultural activities have brought certain squeezing and substitution effects on regional ecosystems.
Area C shows the characteristics of wetland evolution dominated by water system changes and dynamic adjustments of tidal flats (Figure 6). Over the past three decades, the area of rivers and canals has increased from 762.5 km2 to 975.6 km2, showing an overall upward trend. The region once had an abnormal phenomenon in which a lake disappeared briefly in 1995 and reappeared in 2000, which may be affected by the accuracy limitations of land use/cover change (LUCC) data, but it may also reflect the seasonal fluctuations in lake water levels or the result of human regulation. In terms of tidal flats, they were mainly distributed around lakes in 1990, but since 2005, the area of tidal flat around lakes has gradually decreased, while the area of tidal flat on both sides of the Yellow River has increased significantly. This shift indicates that the hydrological process in the region has been adjusted, which may be affected by factors such as upstream water source regulation, embankment construction or climate change.

3.3. Wetland Type Changes from 1990 to 2020

The results of the land use transition matrix (Figure 7b) show that, according to the statistical data (Figure 7a), the five types of wetlands in 2020 were mainly converted from their own land types in 1990, with self-transition ratios all exceeding 50%, reaching up to 88%. Therefore, in Figure 7, land types that did not undergo transformation were excluded, and only the transition proportions between different land use types were calculated. From the results in Figure 7, the land types that experienced the most significant conversions were grassland, unused land, and dryland. In addition to converting among themselves, these land types were largely transformed into residential areas and unused land.
Figure 7b further shows that the sources of wetlands in 2020 were very diverse, with almost all land types contributing to the formation of wetlands. However, the conversion ratios were extremely low. The numerical data in Figure 7a further confirms this phenomenon. Only about 43% of rivers and canals and 50% of reservoirs and ponds in 2020 were converted from other land use types.

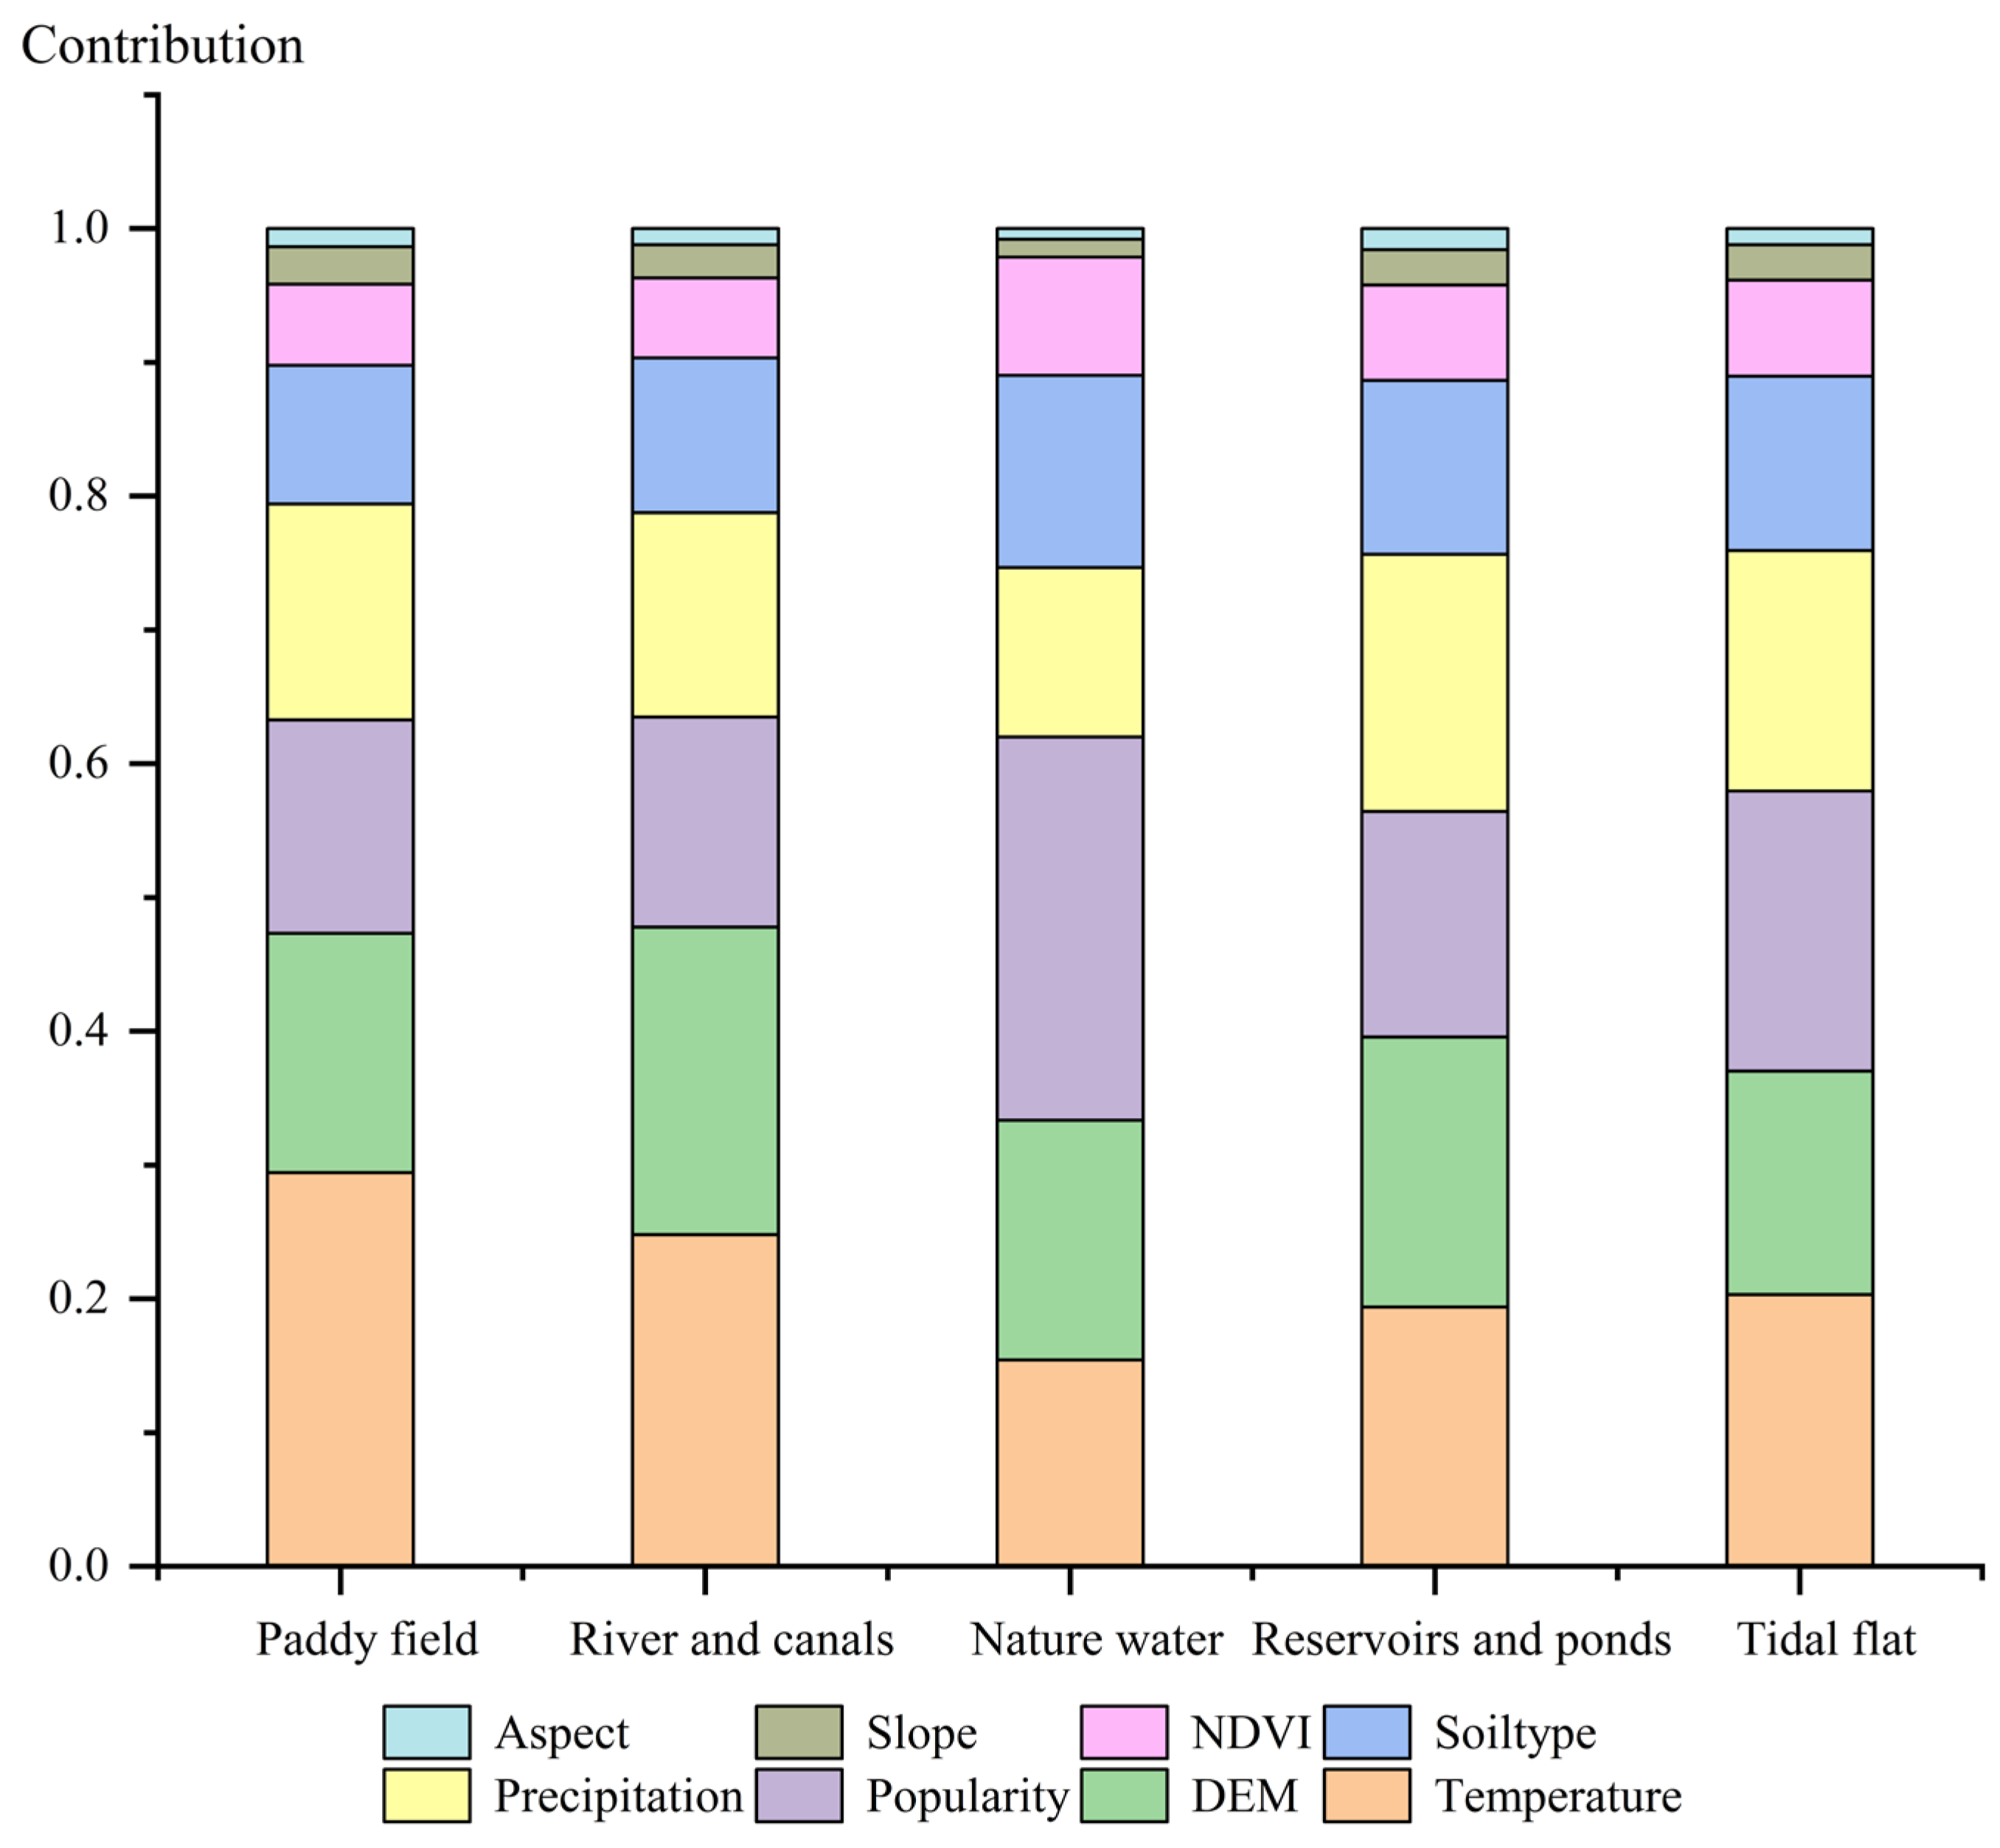
3.4. Major Factors Affecting Wetland Changes

This study analyzed the changes in five types of wetlands in the upper reaches of the Yellow River and the contribution of their influencing factors (Figure 8). First, the factor with the highest average contribution to wetland changes is temperature, with an average contribution of 0.21, followed by population and DEM at 0.19. Slope and aspect have the smallest average contributions, at 0.01 and 0.02, respectively.
The main factors affecting the tidal flat are temperature, population and precipitation. Temperature has a significant impact on the evaporation rate and biological activity of the tidal flat, which in turn affects the water and salinity balance of the wetland. Human activities brought about by population growth have caused most of the tidal flats to be converted into paddy fields, which has an impact on the ecology and physical structure of the tidal flat. Precipitation will also directly affect the water level of the tidal flat.
The dynamics of reservoirs and ponds are chiefly governed by precipitation, temperature, and the digital elevation model (DEM). Precipitation functions as a direct water source, exerting a substantial influence on the overall water volume. Temperature modulates evaporation rates, thereby indirectly impacting water retention. Moreover, the topographic characteristics, as delineated by the DEM, regulate hydrological pathways and drainage patterns, ultimately determining the water-holding capacity of these water bodies.
In contrast, the distribution and sustainability of natural water are predominantly affected by population, DEM, and soil type. Anthropogenic activities—including agricultural expansion, industrial processes, and urbanization—exert considerable pressure on natural water systems, influencing both their spatial extent and ecological integrity. The DEM plays a critical role in directing surface runoff and drainage, while the underlying soil type further mediates hydrological responses and water availability.
Rivers and canals are primarily shaped by the interplay of temperature, DEM, and soil type. Variations in water temperature directly influence ecological processes such as organismal metabolism and biological productivity. Topography, captured through DEM data, defines flow regimes and drainage configurations. Additionally, soil type affects the extent of erosion and sediment transport, which in turn alters riverbed morphology and long-term channel stability.
Paddy fields are significantly influenced by temperature, DEM, and precipitation. Temperature serves as a pivotal variable in agricultural management, affecting the phenological stages and yield potential of rice crops. The DEM informs irrigation and drainage systems, which are essential for optimizing growing conditions. Precipitation further contributes to water input, influencing irrigation scheduling and overall crop performance.
Further details regarding the contribution of other influencing factors to land cover changes in non-wetland areas are provided in Table 3.

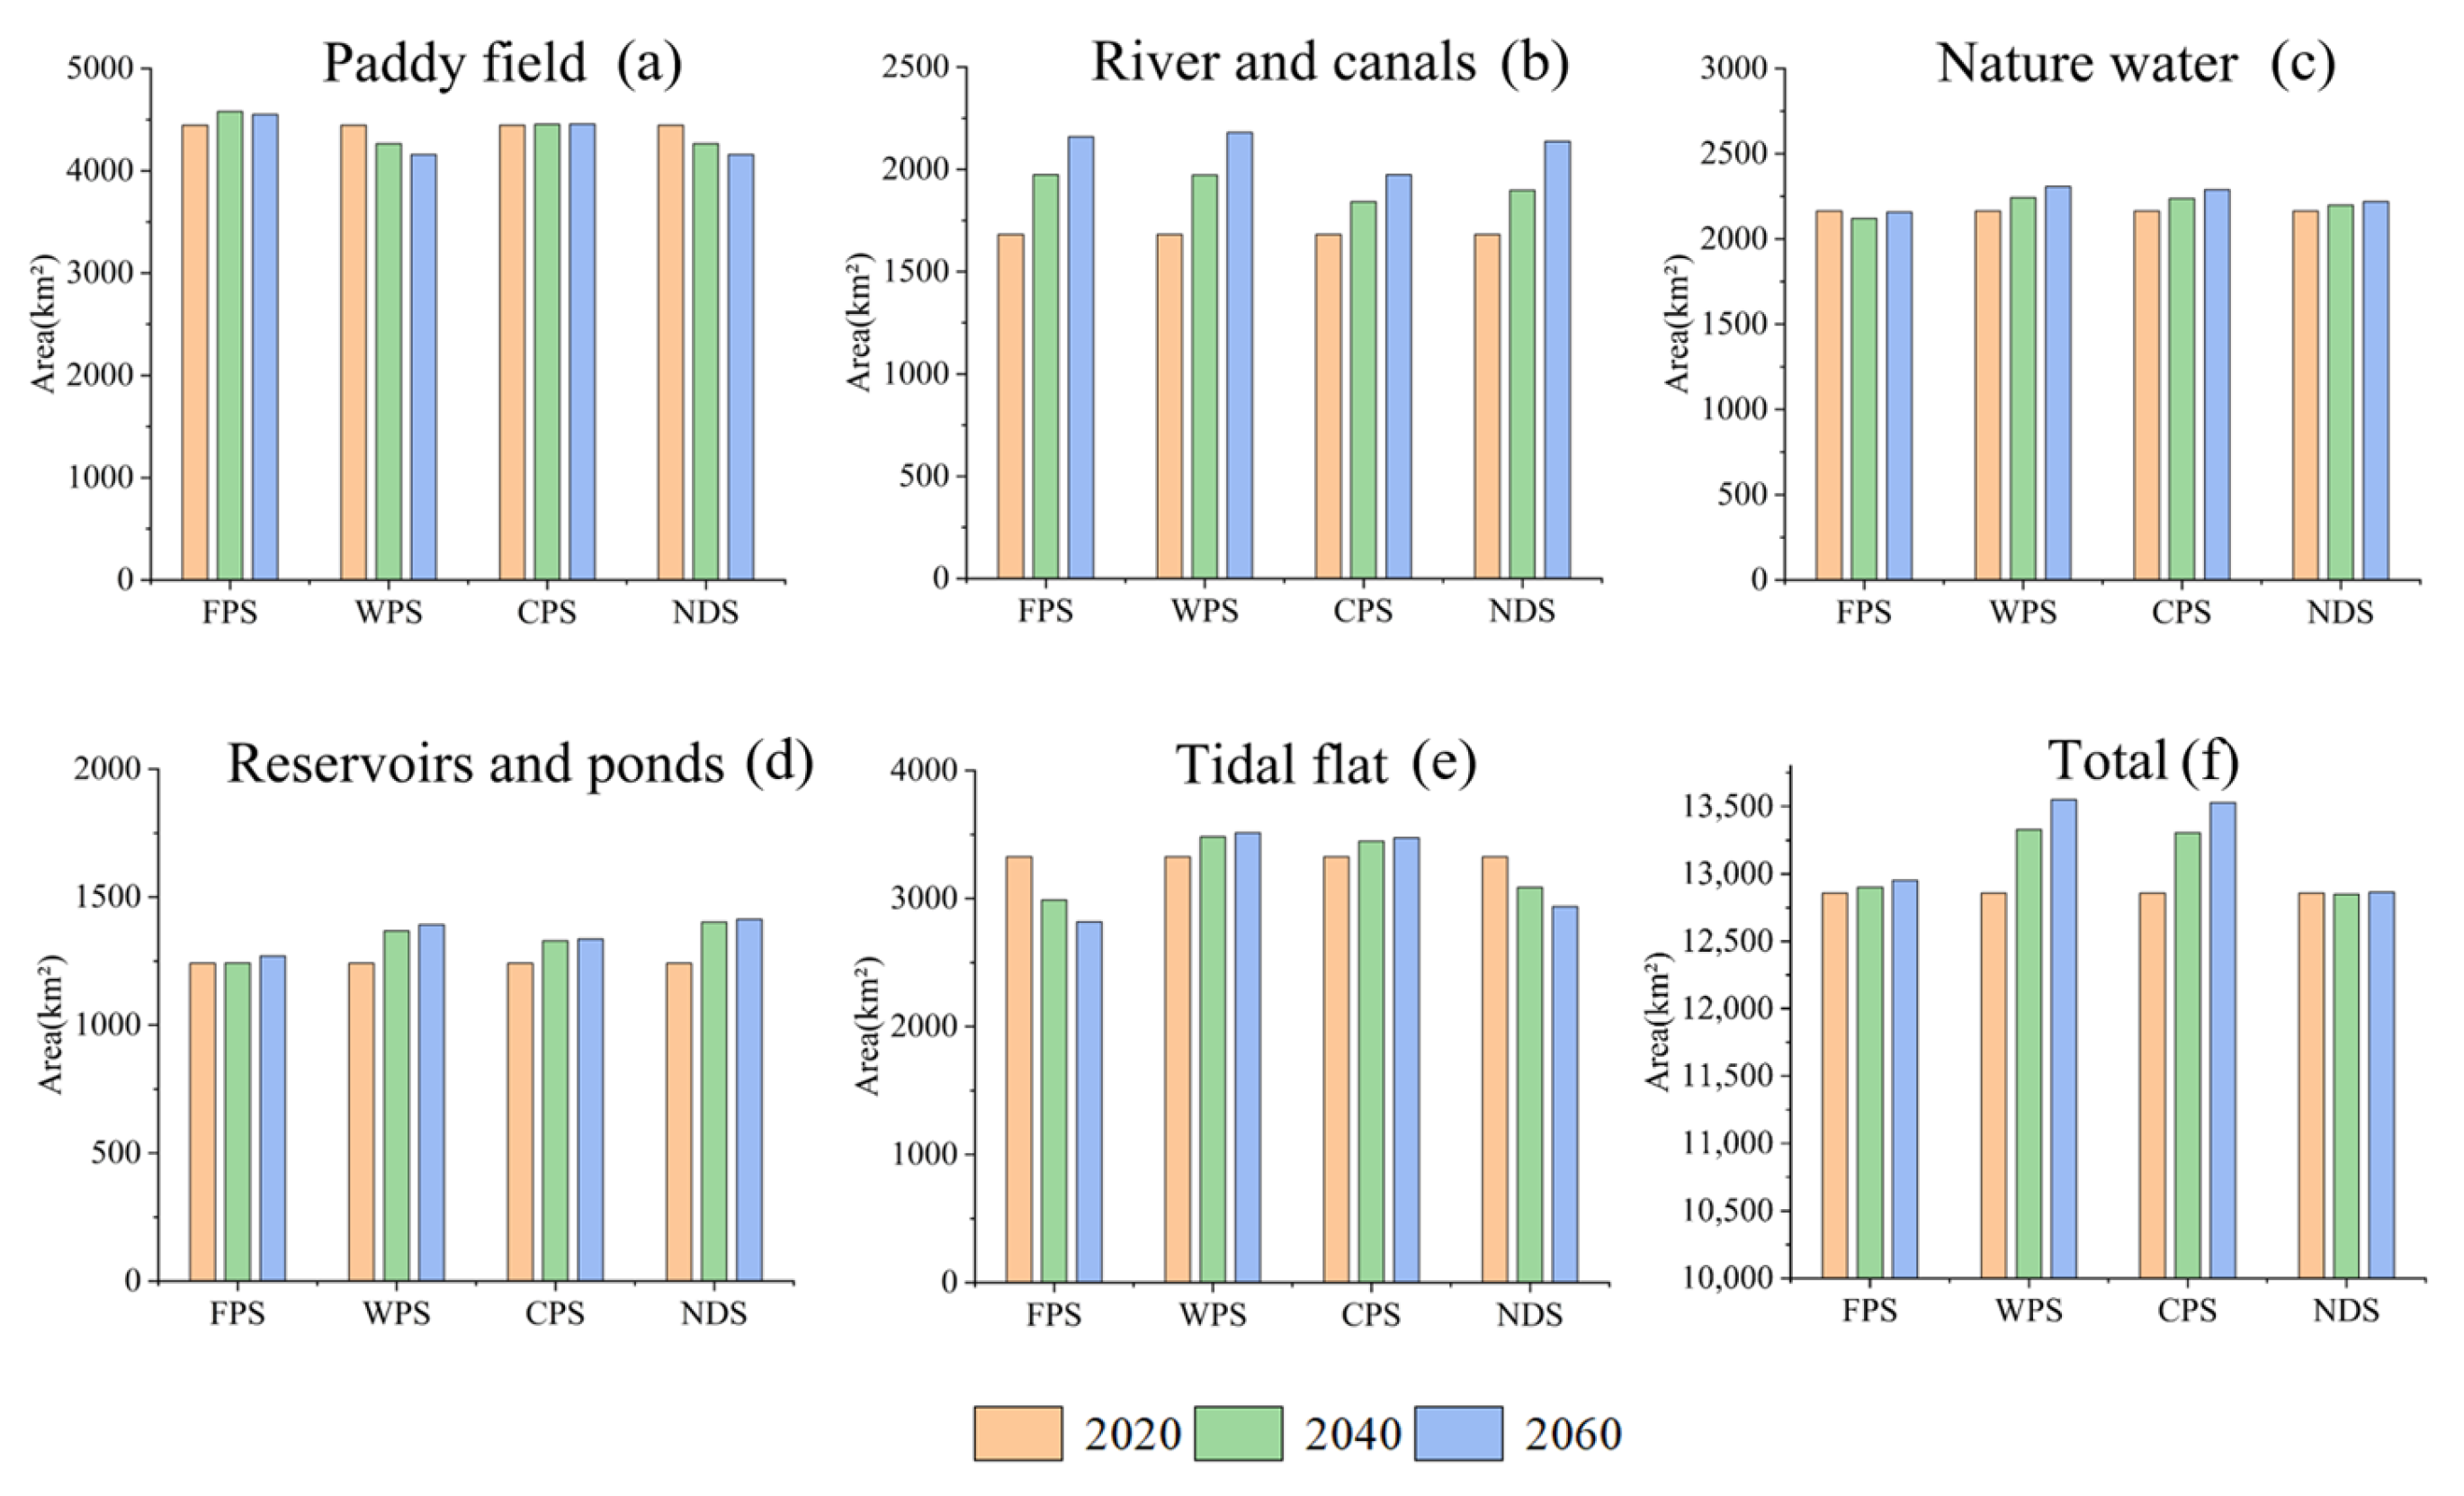
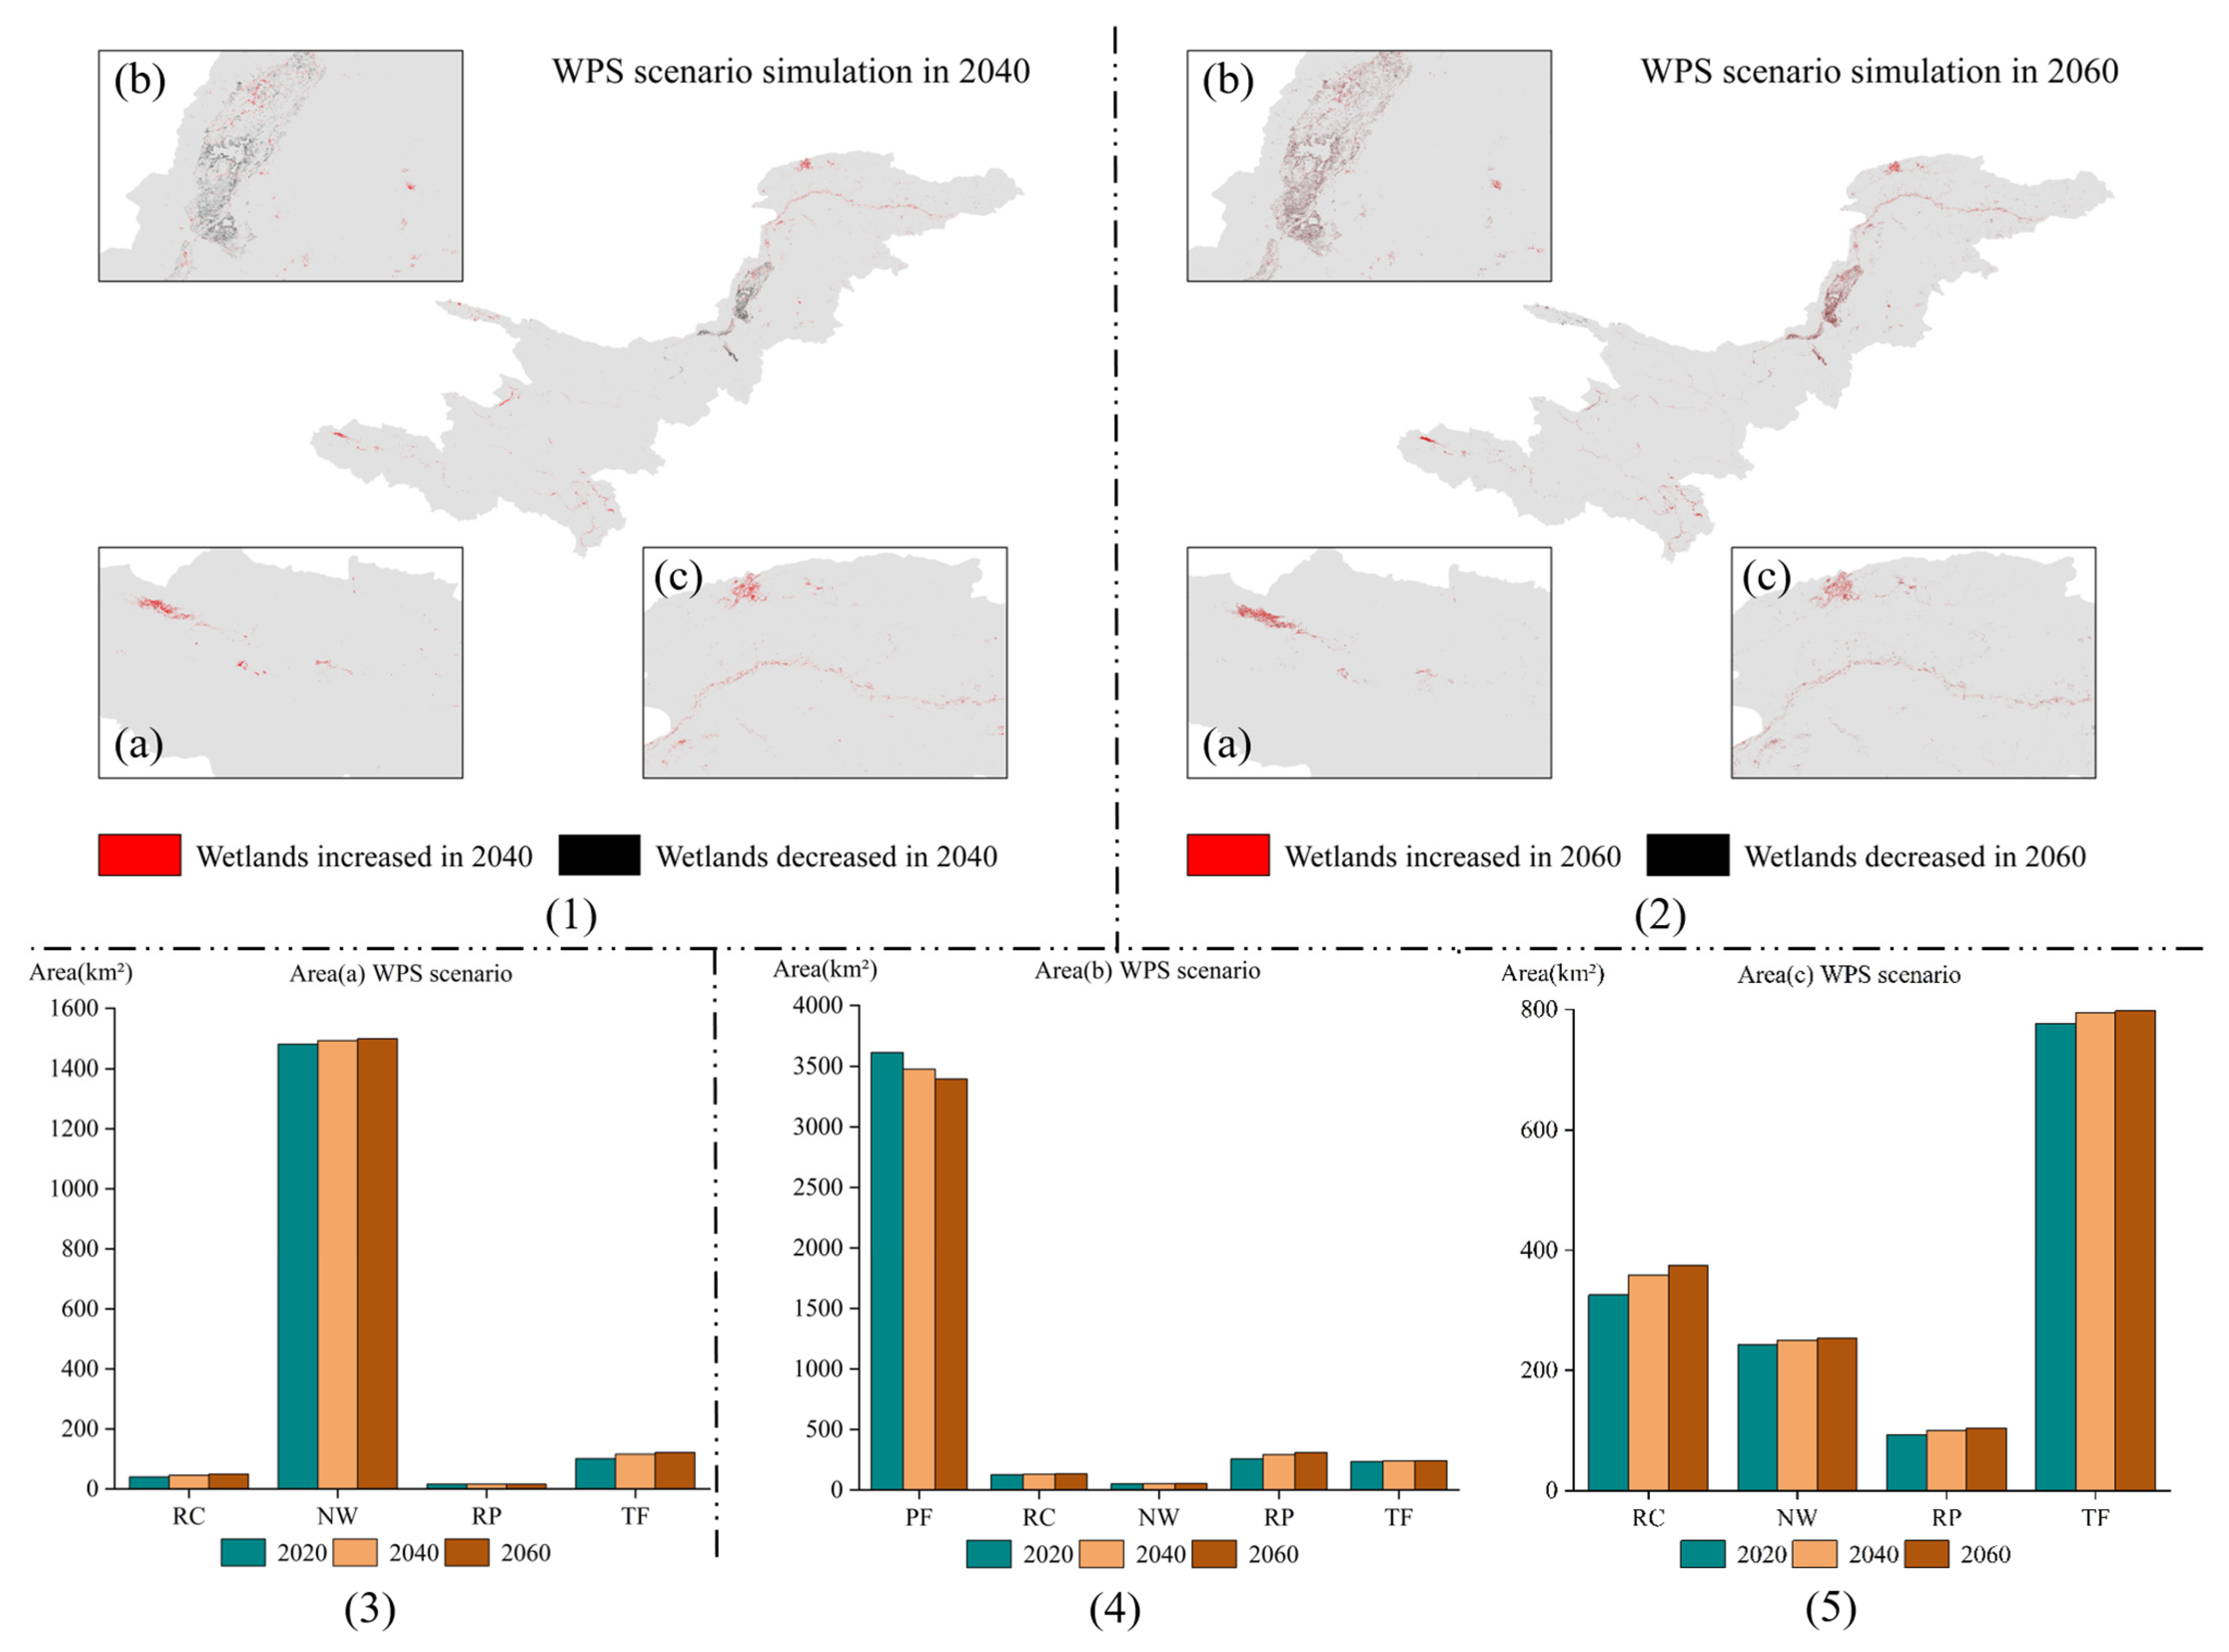
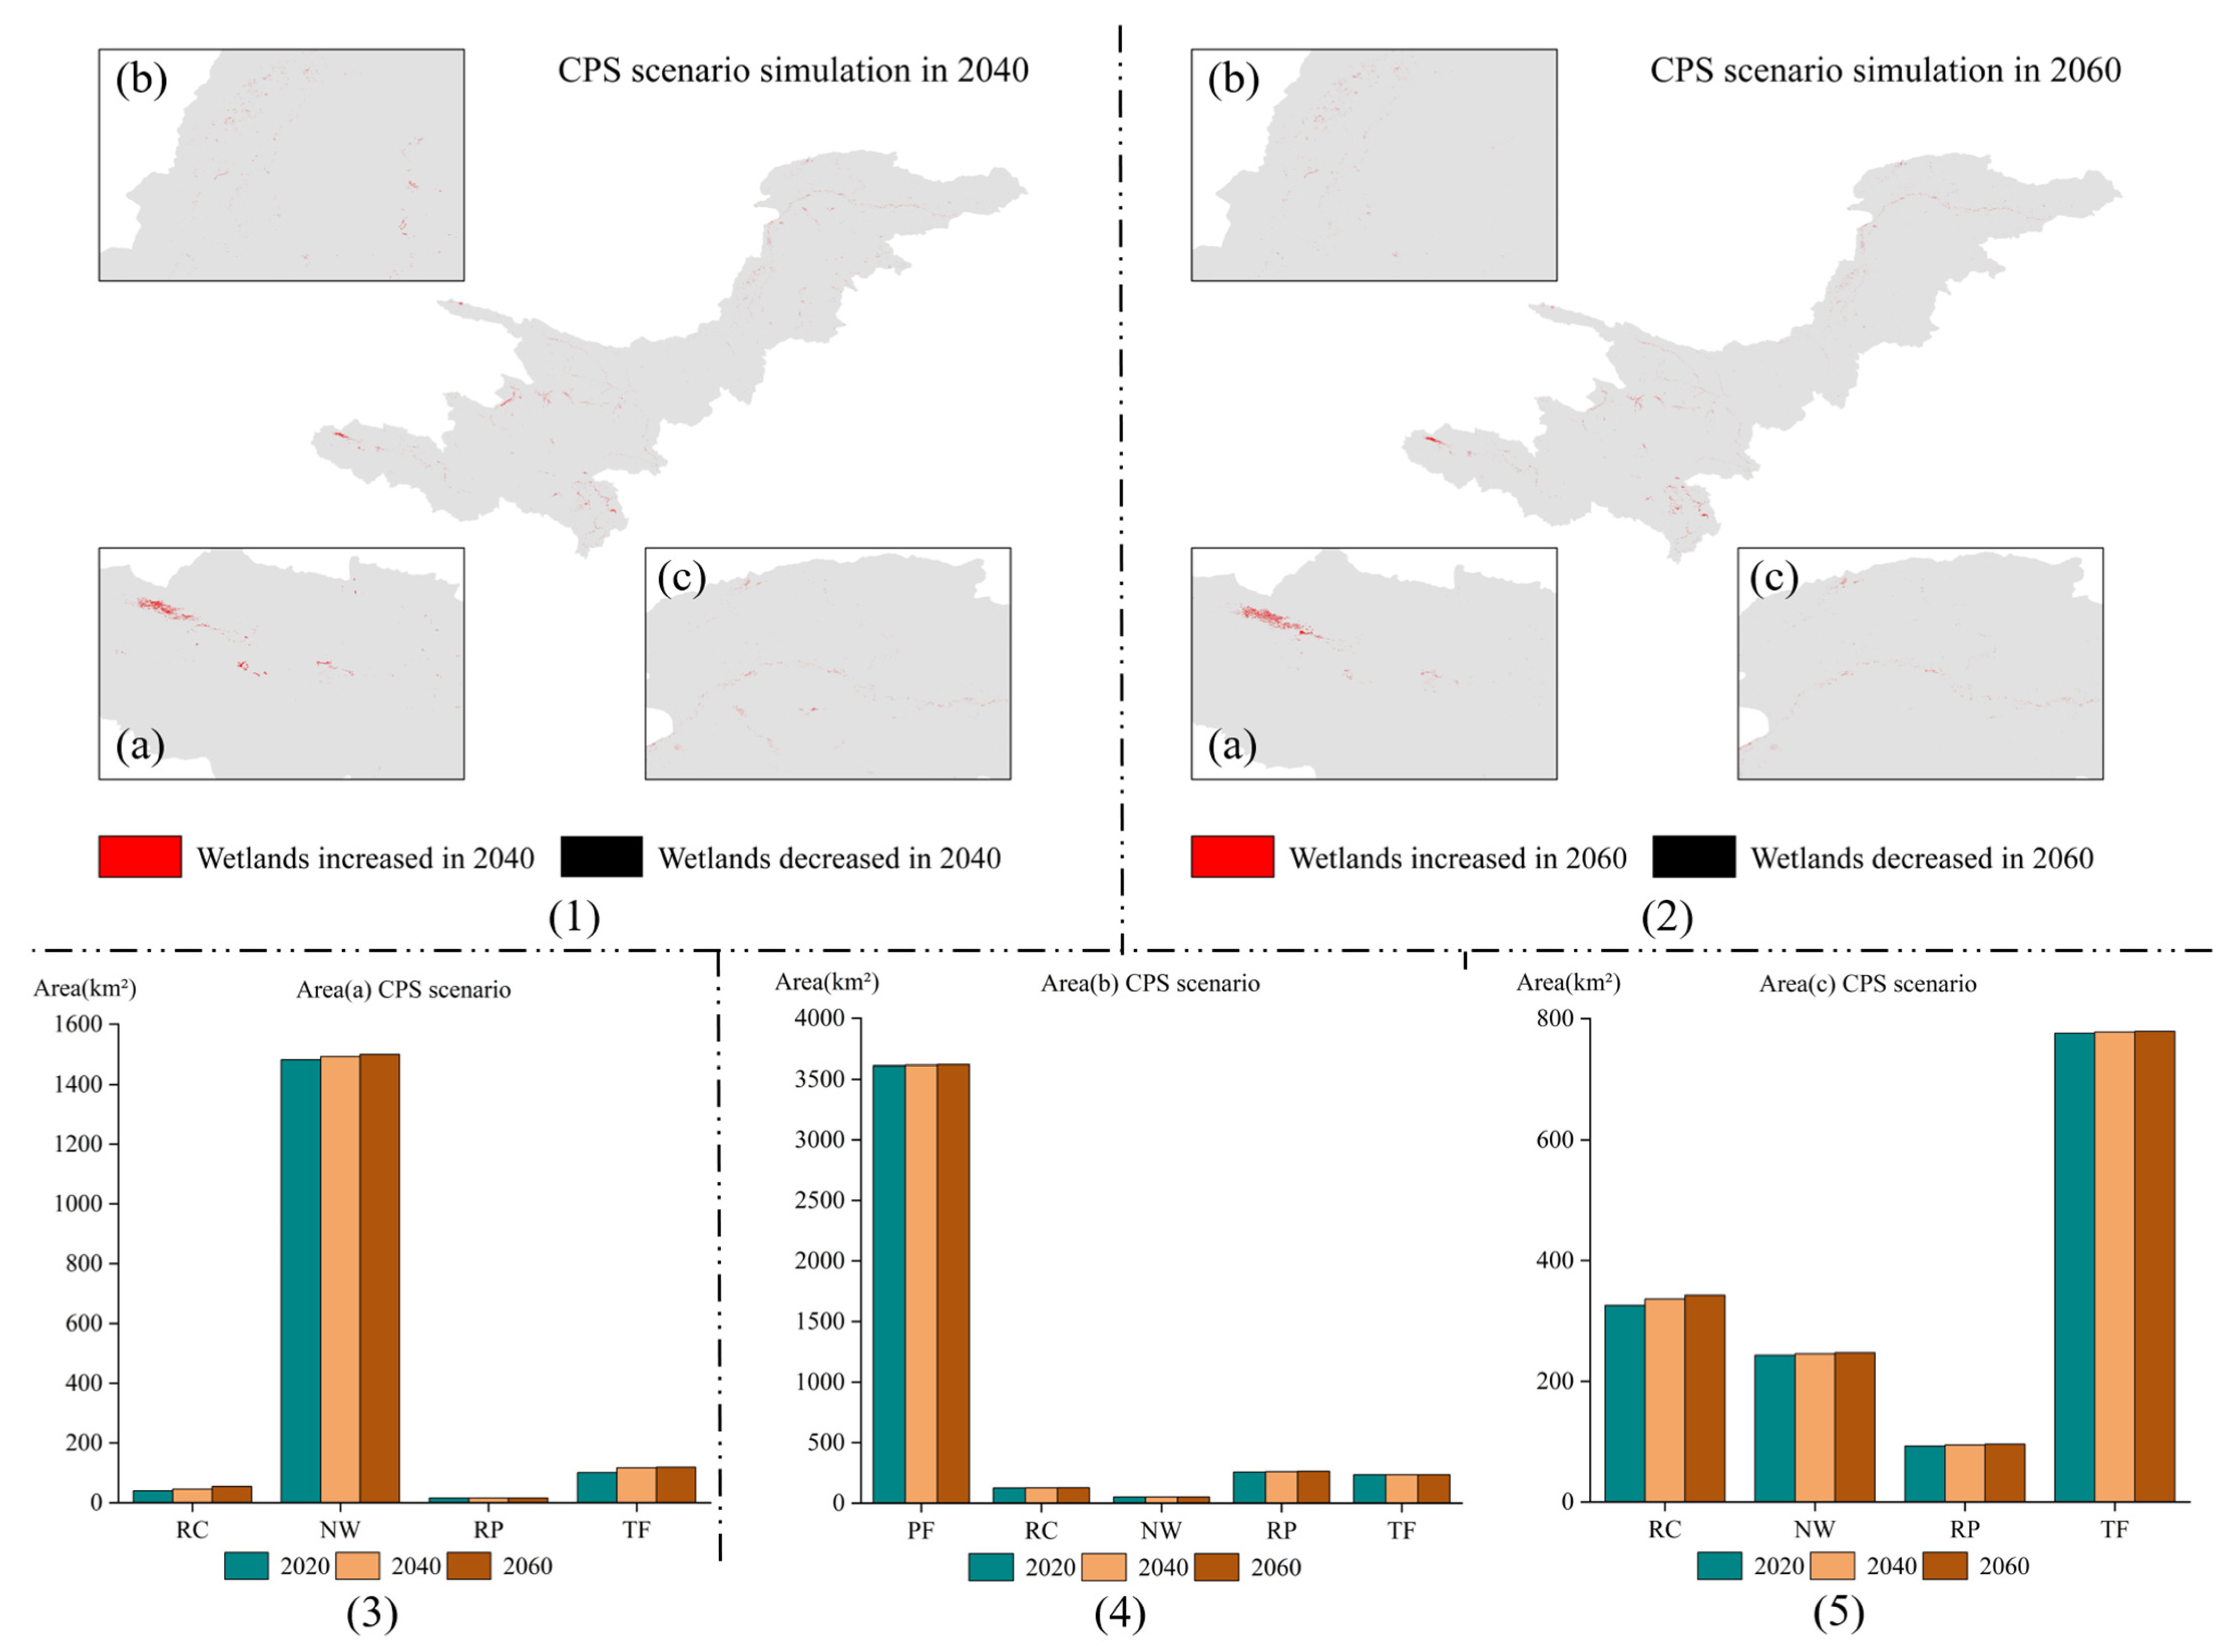
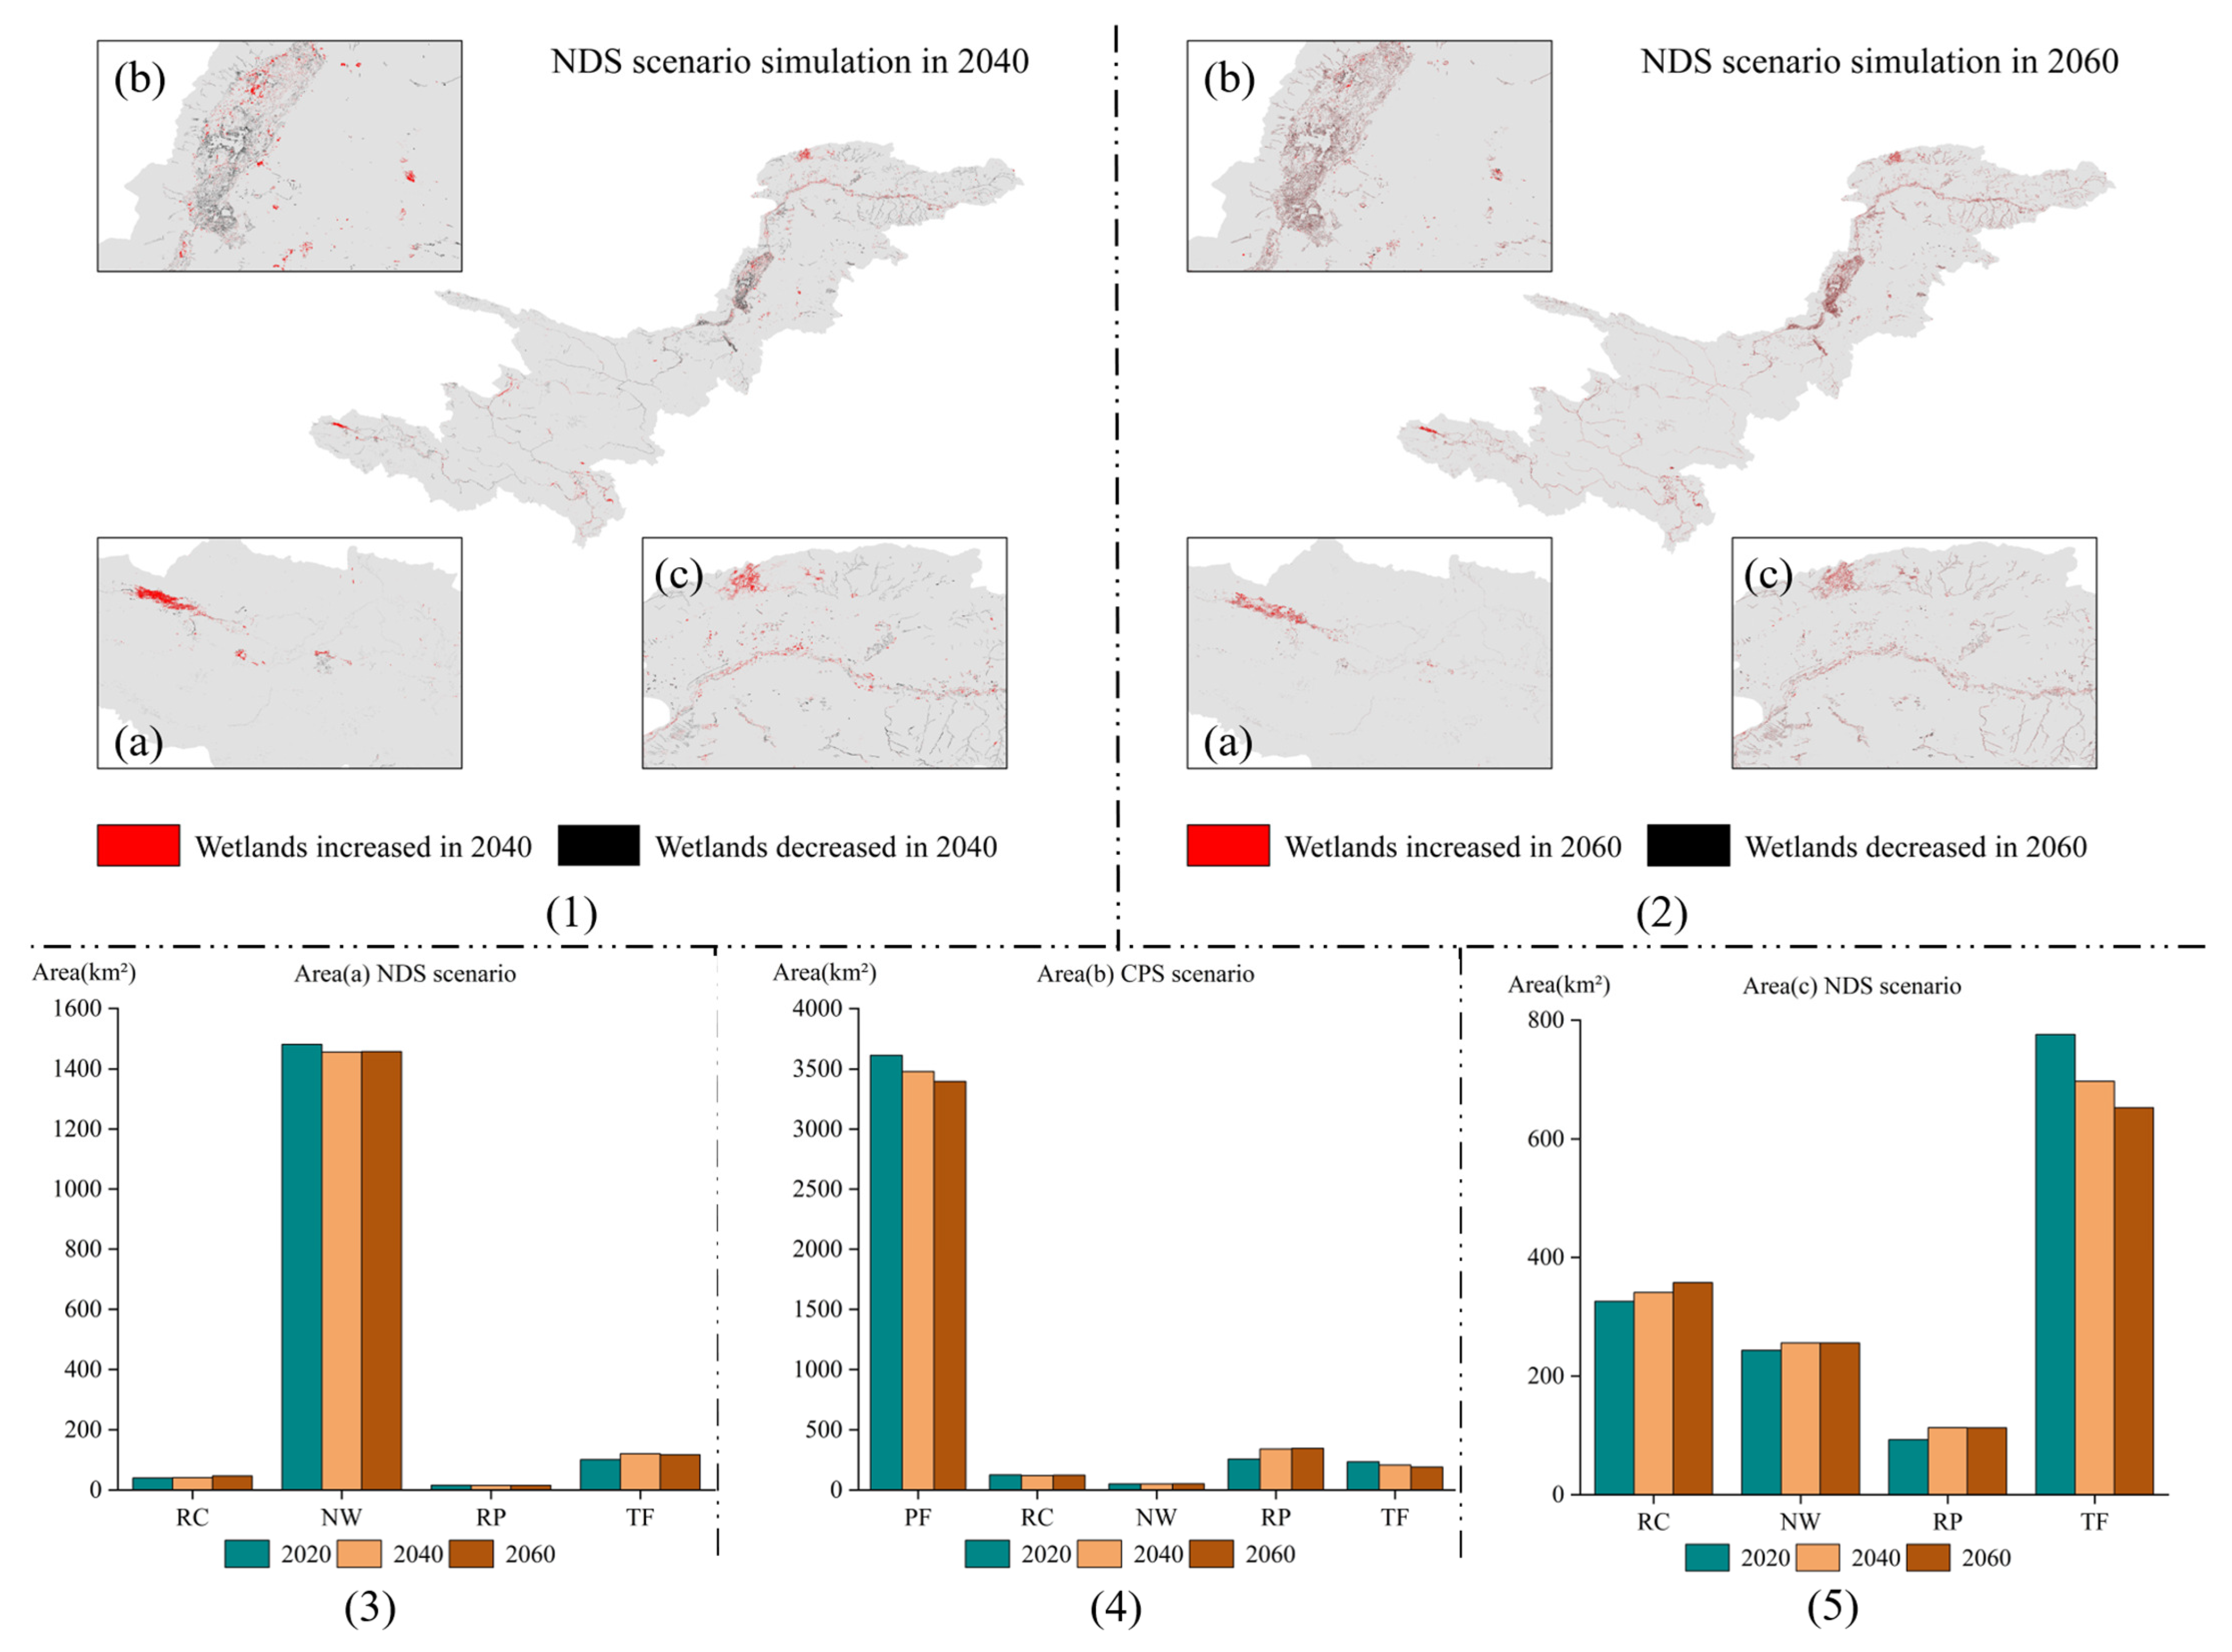
3.5. Simulation of Future Wetland Changes Under Multiple Scenarios

Based on land use in 1990 and 2000, and eight influencing factors, the PLUS model was used to simulate land use for the year 2020. The study area is large, in order to improve the simulation efficiency, the study area is divided into four parts for simulation. The four areas are “the part above Longyangxia”, “the part from Longyangxia to Lanzhou”, “the part from Lanzhou to Hekou Town”, and “the part of the inland flow area”. The OA values of the simulation results of the four parts are 0.85, 0.71, 0.90, and 0.85, respectively. It can be considered that the distribution of simulation results is relatively consistent, and the model simulation accuracy is high. The above evaluation suggests that the PLUS model has a high degree of credibility and can effectively reflect the LULC in the study area [12]. Therefore, the PLUS model was utilized to predict the wetland patterns under FPS, WPS, CPS and NDS for four scenarios for the years 2040 to 2060. For specific simulation results of wetlands in 2040 and 2060, please refer to Figure 9.
Under the FPS scenario, from 2020 to 2060, the area of paddy fields increased to a peak of 4578.6 km2 in 2040 and then gradually decreased to 4550.4 km2 by 2060 (Figure 9a), showing a trend of first rising and then falling. The area of rivers and canals continued to increase, with a growth of approximately 28.39%. Nature water declined in 2040 and then rebounded by 2060. The area of reservoirs and ponds showed a slow upward trend. In contrast, tidal flats experienced a significant reduction of about 15.28%.
Under the WPS scenario, wetlands are strictly protected and cannot be easily developed or converted to other land types. From 2020 to 2060, most wetlands under this scenario showed a continuous increasing trend (Figure 9b–f). Among them, rivers and canals exhibited the largest increase, expanding by about 29.69%, followed by reservoirs and ponds with an increase of approximately 12.20%. The increase in lake area was relatively small, at only about 6.62%, while tidal flats increased by around 5.65%. Unlike in the FPS scenario where paddy fields were protected, the area of paddy fields under the WPS scenario continuously declined, with a total decrease of about 6.47% by 2060.
Under the CPS scenario, wetlands (including rivers and canals, reservoirs and ponds, nature water, and tidal flats), along with grassland and forest, are strictly protected, focusing on maintaining ecological balance and preserving biodiversity. All wetlands under this scenario showed a slight increasing trend. According to the statistical results, rivers and canals increased by approximately 17.40%. Reservoirs and ponds increased by about 7.66% in 2040 and then remained stable. The area of lakes increased slowly by approximately 5.80%, and tidal flats showed the smallest increase, at only around 4.46%. Finally, paddy fields remained stable in this scenario, which can be regarded as no significant change (Figure 9a).
Under the NDS development scenario, the conversion of all land types is no longer restricted, and only existing natural water bodies are retained as basic ecological red lines. Wetlands under this scenario showed different trends. Rivers and canals experienced rapid growth, increasing by approximately 27.14% (Figure 9b), and continued to grow between 2040 and 2060. Reservoirs and ponds increased by about 14.06% in 2040 but did not show significant growth by 2060. Lake areas remained relatively stable, with only a 2.56% increase. In contrast, tidal flats and paddy fields showed declining trends, decreasing by about 12.02% and 6.47%, respectively.

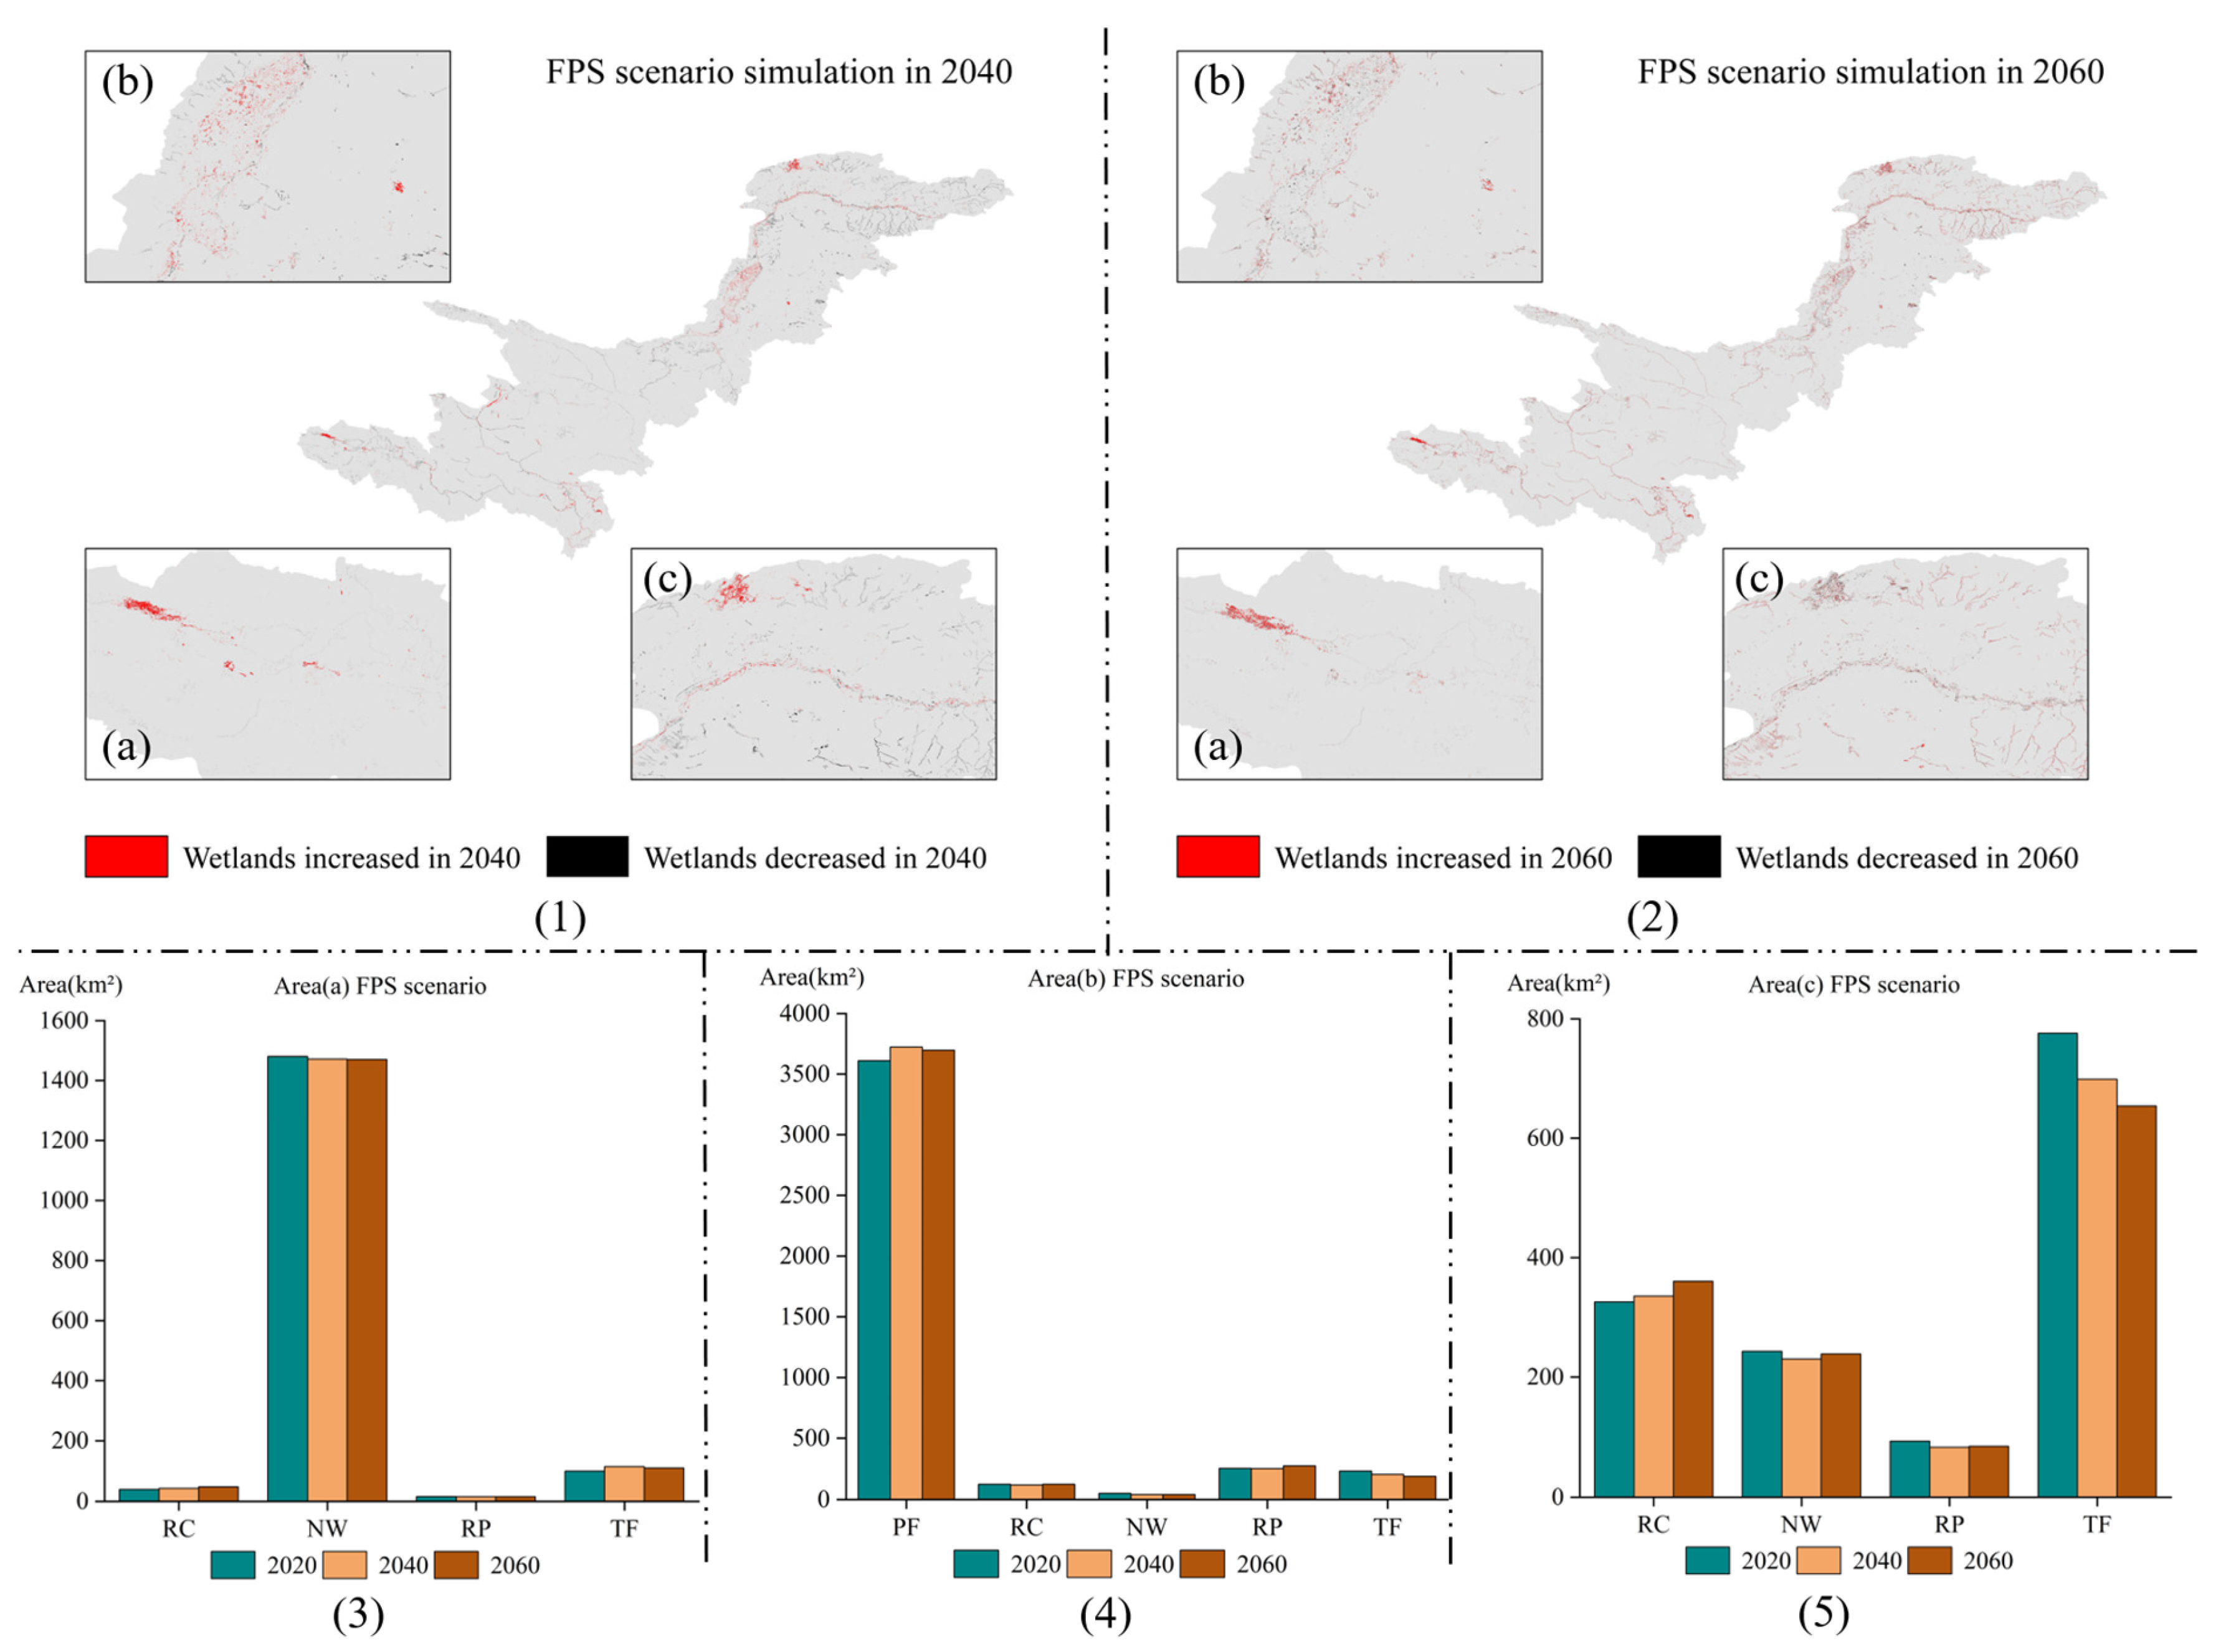
3.6. Simulation of Future Wetland Changes Under Multiple Scenarios in Typical Regional

As discussed above, regional differences in natural and socioeconomic conditions result in varying simulation outcomes. Under the FPS scenario, wetland change is generally limited, except in Area A, where a new natural waterbody begins forming upstream of Zhaling and Eling Lakes around 2040 (Figure 10(1,2,3)). By 2060, this becomes a stable river channel connecting the two lakes. This phenomenon is also seen in other scenarios. However, the waterbodies under FPS and NDS are larger and more continuous (Figure 10(1,2)), whereas under WPS and CPS, they remain fragmented. In Area B, paddy field areas first increase then decrease (Figure 10(4)), reflecting the emphasis on maintaining paddy land, which leads to wetland reduction in downstream Area C, particularly tidal flats (Figure 10(5)).
Under the WPS scenario, wetland changes are more pronounced, especially in Area B. Wetland loss exceeds gain by 2040, but this trend reverses by 2060 due to the prioritization of natural wetland protection (Figure 11(1,2)). Since paddy fields are not considered natural wetlands, they decrease significantly (Figure 11(4)). Conversely, wetland area increases in natural wetland-dominated Areas A and C (Figure 11(3,5)).
CPS imposes the strictest protections, covering wetlands, grasslands, and forests. As a result, wetland change is minimal, with only slight increases and virtually no losses beyond common changes in Area A (Figure 12(1,2)). The data in Figure 12(3–5) confirm that CPS maintains wetland stability but restricts development, making it less suitable for future land use planning.
In contrast, the NDS scenario, which lacks policy constraints, leads to more dynamic changes. By 2040, wetland loss exceeds gain (Figure 13(1)), This trend continues into 2060 (Figure 13(2)). In Area A, natural waterbodies decline for the first time (Figure 13(3)). Although some new waterbodies emerge, they are insufficient for downstream demands. Paddy fields in Area B continue to shrink while reservoirs and ponds increase slightly (Figure 13(4)). In Area C, tidal flats sharply decline, while artificial wetlands like rivers, canals, and reservoirs expand (Figure 13(5)). The NDS scenario reflects a development-driven model, characterized by declining natural wetlands and growing artificial ones.

4. Discussion

4.1. Analysis of Wetland Changes from 1990 to 2020

The upper reaches of the Yellow River are one of China’s important ecological regions, characterized by a unique geographical location and ecological functions [33]. According to the statistics shown in Figure 3 and Table 2, the proportion of wetland area in the upper Yellow River is relatively low, and Figure 1 and Figure 4, Figure 5 and Figure 6 illustrate that wetlands in this region are fragmented. This fragmentation results from the combined effects of natural factors and human disturbances. Climate warming and reduced precipitation have decreased wetland water sources [34], while permafrost degradation has disrupted surface hydrological processes [35]. Additionally, the complex topography and geomorphology of the plateau inherently limit the contiguous distribution of wetlands [36]. Furthermore, human activities such as overgrazing, land reclamation, construction of water conservancy projects, and infrastructure development have further broken the connectivity between wetlands, leading to reductions in wetland area, severe patch fragmentation, and significant weakening of ecological functions.
The results from Table 2 and Figure 7 indicate that over the past 30 years, there has been little transition between wetlands and non-wetlands in the upper reaches of the Yellow River; the primary form of wetland change has been internal conversion among different wetland types. In contrast, changes among non-wetland types have been more pronounced, particularly the frequent transitions between grasslands and unused land. This frequent conversion is mainly due to the fragile ecological environment of the upper Yellow River region, which is influenced by both climatic fluctuations and human activities. Rising temperatures, changes in precipitation, and natural disasters can cause grasslands to degrade into unused land [37]; conversely, improvements in climate or the implementation of ecological policies such as grazing exclusion and grassland restoration can lead to recovery back to grassland. Additionally, intensified human disturbances like overgrazing have exacerbated these dynamics [38]. The blurred boundary between grassland and bare land in remote sensing identification has also contributed to the apparent frequency of these transitions [39].
The research results indicate that the wetland area in the upper Yellow River increased by 7.1% in 2020 compared to 1990, showing an overall upward trend (Figure 3). However, between 1990 and 1995, there was a significant decline in wetland area, mainly due to a decrease of about 22% in tidal flats (Figure 3). Conversely, the area of paddy fields increased in 1995. Combined with the factor contribution ranking in Figure 8, population has consistently been an important factor influencing wetland area changes [40]. Meanwhile, Table 2 shows that residential areas have rapidly expanded over the past 30 years. It can be inferred that one reason for the decline in tidal flats around 1995 was the population growth driving the expansion of paddy fields [2], with much of the tidal flats being converted into paddy fields. This inference is also supported by the land use transition matrix in Figure 7. Another reason is that from 1990 to 1995, soil and water conservation projects on the Loess Plateau in the upper Yellow River achieved significant results, reducing soil erosion and sediment inflow into the Yellow River, which led to a decrease in upstream tidal flat areas [41]. In 1994, China formulated its sustainable development strategy [42], after which the wetlands in the upper Yellow River began to recover from 1995 and reached a peak around 2000, reflecting the positive impact of the sustainable development strategy on wetland area. Subsequently, from 2000 to 2020, wetland area exhibited a fluctuating upward trend, finally reaching a historical high in 2020.

4.2. Future Changes in Wetlands in Typical Regions Under Multiple Scenarios

Based on historical wetland changes and the PLUS model, this study simulated and analyzed the future spatial patterns of wetlands in the upper reaches of the Yellow River under four development scenarios from 2020 to 2060. Land use simulation models such as CLUE-S, FLUS, and PLUS have been widely applied to predict future land use patterns [14,43,44]. The CLUE-S and FLUS models extract training samples from a single LULC snapshot, lacking the capacity to capture the underlying mechanisms driving land use change. In contrast, the PLUS model retains the competitive mechanism of the roulette approach while also providing insights into the driving forces behind each LULC transition [14]. According to accuracy assessments, the PLUS model demonstrates robust simulation performance, particularly considering the fragmented wetland distribution and the region’s vulnerability to anthropogenic disturbances and climate change [45].
Since 2002, China has launched the National Wetland Conservation Plan (NWCP) to systematically promote wetland protection and restoration efforts [46]. The Sanjiangyuan region in the upper reaches of the Yellow River, known as one of China’s most ecologically fragile areas and characterized by typical marsh wetlands, was designated as one of the first key areas for wetland protection and restoration. Despite some degree of wetland protection under national policy support, the implementation of policies in Northwest China still faces many challenges. For example, the “returning farmland to wetlands” projects are limited by relatively low ecological compensation standards, making it difficult to motivate farmers’ participation [46,47]. Currently, the industrial structure in the upper Yellow River is simple, and farmers have limited income sources, which exacerbates policy enforcement difficulties. Zhang et al. (2011) [48] noted that a significant proportion of farmers are still unwilling to return farmland to wetlands, mainly because farmland is their primary economic foundation.
Based on the results from the four development scenarios, the CPS scenario is considered overly strict for wetland protection, while the NDS scenario is too lenient, leading to wetland reduction; thus, neither scenario is suitable for future development. Under the FPS scenario, paddy field area is maintained, but at the cost of reductions in other wetland areas. Conversely, the WPS scenario shows the opposite trend, sacrificing some paddy field area in exchange for increases in other wetland areas. In summary, although both FPS and WPS scenarios can achieve coordinated development of ecology and agriculture, it is undeniable that marsh wetlands may continue to decline in the future, raising significant ecological concerns. Therefore, future development strategies should place greater emphasis on the protection of natural wetlands and strengthen policy support to ensure the stability and sustainability of regional ecosystems [49].

4.3. Limitations and Future Research

Due to the difficulty in obtaining data for large-scale study areas, this study selected eight quantifiable land use change driving factors, including climate, topography, socio-economic, and soil factors. These factors are key driver of land use change and effectively capture the dynamics of wetland changes. However, the results show that slope and aspect contributed very little. Therefore, future studies should consider field surveys. Initially, multiple driving factors can be used, and through experimentation, factors with low contribution can be excluded, followed by a reassessment of the contribution levels among the remaining high-contribution factors.
Similarly to other land use/land cover (LULC) models, the PLUS model mainly relies on existing strategies and static driving data [14,50]. While the PLUS model can theoretically accept data with different row numbers and spatial resolutions, large-scale study areas like the upper Yellow River require unifying the data’s row numbers and spatial resolutions. This increases the data volume, reducing the model’s efficiency. Due to the large scale of the study area, it was necessary to divide the upper Yellow River region to improve model efficiency, though this division potentially lowered the overall simulation accuracy. While each partition’s simulation results showed good accuracy, the combined simulation results were less accurate during validation. Moreover, these driving factors are dynamic, especially with rapid socio-economic development and frequent extreme climate events, which further complicate model operations. To address these challenges, future studies could improve the iterative process or select data with lower spatial resolution for simulations, based on the original data.

5. Conclusions

This study comprehensively analyzes the spatiotemporal changes in wetlands in the upper Yellow River from 1990 to 2020, calculates the impact of multiple driving factors on wetland changes over the past three decades, and simulates wetland changes for 2040 to 2060 using the PLUS model, providing a comprehensive understanding of wetland evolution. The following conclusions are drawn:
(1)
Over the past three decades, the wetland area in the upper Yellow River has shown a fluctuating growth trend, with the wetland area in 2020 increasing by 7.12% compared to 1990. However, there are significant differences in the area changes in different wetland types. The areas of rivers and canals and reservoirs increased substantially, by 26.39% and 57.97%, respectively; the area of paddy fields increased by 7.95%; and the area of nature water remained relatively stable, while the area of tidal flat decreased by 5.67%.
(2)
This study analyzed the contribution of eight types of influencing factors to the changes in five wetland types in the upper reaches of the Yellow River, revealing the dominant role of factors such as temperature, population density and DEM on wetland changes, especially the impact of temperature on paddy fields and canals, and the impact of population growth on changes in natural water and tidal flats.
(3)
The multi-scenario simulation results for future wetlands reveal the potential changes in wetlands under different land use policies and environmental conditions. Among them, the FPS and WPS scenarios achieve a relatively balanced approach between urbanization development and wetland protection, considering both the protection of wetland ecosystems and the needs of socioeconomic development.
In conclusion, through the analysis of past spatiotemporal changes in wetlands and the simulation of future wetland spatial distribution, this study provides direction for the protection of wetland ecosystems in the upper Yellow River, explores the relationship between urbanization and wetland protection, and offers important reference value for sustainable development.

Author Contributions

Conceptualization, Z.L.; methodology, Z.L.; software, Z.L.; validation, Z.L.; formal analysis, T.Z.; investigation, T.Z.; resources, T.F.; data curation, Z.L.; writing—original draft preparation, T.Z.; writing—review and editing, Z.L.; visualization, C.H.; supervision, Q.B.; project administration, Q.B.; funding acquisition, C.H. All authors have read and agreed to the published version of the manuscript.

Funding

This research was funded by National Natural Science Foundation of China grant number 42130113 And the APC was funded by 1213625123.

Data Availability Statement

According to the introduction of the data and its sources provided in Table 1 of the article, the data of this article can be obtained from the third-party website in the Table 1.

Conflicts of Interest

The authors declare no conflict of interest.

References

  1. Mehvar, S.; Filatova, T.; Dastgheib, A.; De Ruyter van Steveninck, E.; Ranasinghe, R. Quantifying Economic Value of Coastal Ecosystem Services: A Review. J. Mar. Sci. Eng. 2018, 6, 5. [Google Scholar] [CrossRef]
  2. Cousens, R.; Mortimer, M. Dynamics of Weed Populations; Cambridge University Press: Cambridge, UK, 1995. [Google Scholar]
  3. Mao, D.; Wang, Z.; Wu, J.; Wu, B.; Zeng, Y.; Song, K.; Yi, K.; Luo, L. China’s wetlands loss to urban expansion. Land Degrad. Dev. 2018, 29, 2644–2657. [Google Scholar] [CrossRef]
  4. Gong, N.; Niu, Z.; Qi, W.; Zhang, H. Driving forces of wetland change in China. J. Remote Sens. 2016, 20, 172–183. [Google Scholar]
  5. Na, X.; Li, X.; Li, W.; Wu, C. Wetland mapping using HJ-1A/B hyperspectral images and an adaptive sparse constrained least squares linear spectral mixture model. Remote Sens. 2021, 13, 751. [Google Scholar] [CrossRef]
  6. Wang, X.; Xiao, X.; Xu, X.; Zou, Z.; Chen, B.; Qin, Y.; Zhang, X.; Dong, J.; Liu, D.; Pan, L.; et al. Rebound in China’s coastal wetlands following conservation and restoration. Nat. Sustain. 2021, 4, 1076–1083. [Google Scholar] [CrossRef]
  7. Hou, M.; Ge, J.; Gao, J.; Meng, B.; Li, Y.; Yin, J.; Liu, J.; Feng, Q.; Liang, T. Ecological risk assessment and impact factor analysis of alpine wetland ecosystem based on LUCC and boosted regression tree on the Zoige Plateau, China. Remote Sens. 2020, 12, 368. [Google Scholar] [CrossRef]
  8. Gao, L.; Tao, F.; Liu, R.; Wang, Z.; Leng, H.; Zhou, T. Multi-scenario simulation and ecological risk analysis of land use based on the PLUS model: A case study of Nanjing. Sustain. Cities 2022, 85, 104055. [Google Scholar] [CrossRef]
  9. Lee, J.; Cardille, J.A.; Coe, M.T. BULC-U: Sharpening resolution and improving accuracy of land-use/land-cover classifications in Google Earth Engine. Remote Sens. 2018, 10, 1455. [Google Scholar] [CrossRef]
  10. Mishra, V.N.; Rai, P.K.; Kumar, P.; Prasad, R. Evaluation of land use/land cover classification accuracy using multi-resolution remote sensing images. In Forum Geografic; Universitaria Publishing House: Craiova, Romania, 2016. [Google Scholar]
  11. Xu, X.; Liu, J.; Zhang, S.; Li, R.; Yan, C.; Wu, S. China Multi-Period Land Use Remote Sensing Monitoring Data Set (CNLUCC). Resource and Environmental Science Data Registration and Publishing System. 2020. Available online: https://www.resdc.cn/DOI/DOI.aspx?DOIID=54 (accessed on 11 January 2024).
  12. Yu, B.; Zang, Y.; Wu, C.; Zhao, Z. Spatiotemporal dynamics of wetlands and their future multi-scenario simulation in the Yellow River Delta, China. J. Environ. Manag. 2024, 353, 120193. [Google Scholar] [CrossRef]
  13. Farda, N. Multi-temporal land use mapping of coastal wetlands area using machine learning in Google earth engine. In IOP Conference Series: Earth and Environmental Science; IOP Publishing: Bristol, UK, 2017. [Google Scholar]
  14. Liang, X.; Guan, Q.; Clarke, K.C.; Liu, S.; Wang, B.; Yao, Y. Understanding the drivers of sustainable land expansion using a patch-generating land use simulation (PLUS) model: A case study in Wuhan, China. Comput. Environ. Urban Syst. 2021, 85, 101569. [Google Scholar] [CrossRef]
  15. Zheng, Z.; Wang, J.; Ni, J.; Cui, Y.; Zhu, Q. Lacustrine Wetlands Landscape Simulation and Multi-Scenario Prediction Based on the Patch-Generating Land-Use Simulation Model: A case study on shengjin lake reserve, China. Remote Sens. 2024, 16, 4169. [Google Scholar] [CrossRef]
  16. Sang, L.; Zhang, C.; Yang, J.; Zhu, D.; Yun, W. Simulation of land use spatial pattern of towns and villages based on CA–Markov model. Math. Comput. Model. 2011, 54, 938–943. [Google Scholar] [CrossRef]
  17. Fahad, K.H.; Hussein, S.; Dibs, H. Spatial-temporal analysis of land use and land cover change detection using remote sensing and GIS techniques. In IOP Conference Series: Materials Science and Engineering; IOP Publishing: Bristol, UK, 2020. [Google Scholar]
  18. Qi, D.; Li, G. Status, causes and protection countermeasures of wetland degradation in Maqu county in the Upper Yellow River. Wetl. Sci. 2007, 5, 341–347. [Google Scholar]
  19. Chen, Y.; Syvitski, J.P.M.; Gao, S.; Overeem, I.; Kettner, A. Socio-economic impacts on flooding: A 4000-year history of the Yellow River, China. Ambio 2012, 41, 682–698. [Google Scholar] [CrossRef]
  20. Qiao, Y.; Duan, Z. Understanding alpine meadow ecosystems. In Landscape and Ecosystem Diversity, Dynamics and Management in the Yellow River Source Zone; Springer: Cham, Switzerland, 2016; pp. 117–135. [Google Scholar] [CrossRef]
  21. Liu, J.; Kuang, W.; Zhang, Z.; Xu, X.; Qin, Y.; Ning, J.; Zhou, W.; Zhang, S.; Li, R.; Yan, C. Spatiotemporal characteristics, patterns, and causes of land-use changes in China since the late 1980s. J. Geogr. Sci. 2014, 24, 195–210. [Google Scholar] [CrossRef]
  22. Khiavi, H.T.; Mostafazadeh, R. Land use change dynamics assessment in the Khiavchai region, the hillside of Sabalan mountainous area. Arab. J. Geosci. 2021, 14, 2257. [Google Scholar] [CrossRef]
  23. Agarwal, C. A Review and Assessment of Land-Use Change Models: Dynamics of Space, Time, and Human Choice; USDA Forest Service: Washington, DC, USA, 2002. [Google Scholar]
  24. Cui, J.; Zhu, M.; Liang, Y.; Qin, G.; Li, J.; Liu, Y. Land use/land cover change and their driving factors in the Yellow River Basin of Shandong Province based on google earth Engine from 2000 to 2020. ISPRS Int. J. Geo-Inf. 2022, 11, 163. [Google Scholar] [CrossRef]
  25. Zhou, X.; Wu, D.; Li, J.; Liang, J.; Zhang, D.; Chen, W. Cultivated land use efficiency and its driving factors in the Yellow River Basin, China. Ecol. Indic. 2022, 144, 109411. [Google Scholar] [CrossRef]
  26. Hosmer, D.W., Jr.; Lemeshow, S.; Sturdivant, R.X. Applied Logistic Regression; John Wiley & Sons: Hoboken, NJ, USA, 2013. [Google Scholar]
  27. Liberti, L.; Lavor, C.; Maculan, N.; Mucherino, A. Euclidean distance geometry and applications. SIAM Rev. 2014, 56, 3–69. [Google Scholar] [CrossRef]
  28. Mao, D.; Luo, L.; Wang, Z.; Wilson, M.C.; Zeng, Y.; Wu, B.; Wu, J. Conversions between natural wetlands and farmland in China: A multiscale geospatial analysis. Sci. Total Environ. 2018, 634, 550–560. [Google Scholar] [CrossRef] [PubMed]
  29. Rounsevell, M.; Ewert, F.; Reginster, I.; Leemans, R.; Carter, T. Future scenarios of European agricultural land use: II. Projecting changes in cropland and grassland. Agric. Ecosyst. Environ. 2005, 107, 117–135. [Google Scholar] [CrossRef]
  30. Zedler, J.B. Progress in wetland restoration ecology. Trends Ecol. Evol. 2000, 15, 402–407. [Google Scholar] [CrossRef] [PubMed]
  31. Zhang, Y.; Jin, R.; Zhu, W.; Zhang, D.; Zhang, X. Impacts of land use changes on wetland ecosystem services in the Tumen River Basin. Sustainability 2020, 12, 9821. [Google Scholar] [CrossRef]
  32. Congalton, R.G. A review of assessing the accuracy of classifications of remotely sensed data. Remote Sens. Environ. 1991, 37, 35–46. [Google Scholar] [CrossRef]
  33. Mostern, R. The Yellow River: A Natural and Unnatural History; Yale University Press: London, UK, 2021. [Google Scholar]
  34. Burkett, V.; Kusler, J. Climate change: Potential impacts and interactions IN wetlands OF the untted states 1. JAWRA J. Am. Water Resour. Assoc. 2000, 36, 313–320. [Google Scholar] [CrossRef]
  35. Lafrenière, M.J.; Lamoureux, S.F. Effects of changing permafrost conditions on hydrological processes and fluvial fluxes. Earth-Sci. Rev. 2019, 191, 212–223. [Google Scholar] [CrossRef]
  36. Grant, K.; Finlayson, A.A. The assessment and evaluation of geotechnical resources in urban or regional environments. Eng. Geol. 1978, 12, 219–293. [Google Scholar] [CrossRef]
  37. Glicksman, R.L. Ecosystem resilience to disruptions linked to global climate change: An adaptive approach to federal land management. Neb. Law Rev. 2008, 87, 833. [Google Scholar]
  38. Boles, O.J.C.; Shoemaker, A.; Mustaphi, C.J.C.; Petek, N.; Ekblom, A.; Lane, P.J. Historical ecologies of pastoralist overgrazing in Kenya: Long-term perspectives on cause and effect. Hum. Ecol. 2019, 47, 419–434. [Google Scholar] [CrossRef]
  39. Ali, I.; Cawkwell, F.; Dwyer, E.; Barrett, B.; Green, S. Satellite remote sensing of grasslands: From observation to management. J. Plant Ecol. 2016, 9, 649–671. [Google Scholar] [CrossRef]
  40. Ballut-Dajud, G.A.; Herazo, L.C.S.; Fernández-Lambert, G.; Marín-Muñiz, J.L.; Méndez, M.C.L.; Betanzo-Torres, E.A. Factors affecting wetland loss: A review. Land 2022, 11, 434. [Google Scholar] [CrossRef]
  41. Wang, H.; Wu, X.; Bi, N.; Li, S.; Yuan, P.; Wang, A.; Syvitski, J.P.; Saito, Y.; Yang, Z.; Liu, S.; et al. Impacts of the dam-orientated water-sediment regulation scheme on the lower reaches and delta of the Yellow River (Huanghe): A review. Glob. Planet. Change 2017, 157, 93–113. [Google Scholar] [CrossRef]
  42. Zhang, K.-M.; Wen, Z.-G. Review and challenges of policies of environmental protection and sustainable development in China. J. Environ. Manag. 2008, 88, 1249–1261. [Google Scholar] [CrossRef]
  43. Verburg, P.H.; Eickhout, B.; Van Meijl, H. A multi-scale, multi-model approach for analyzing the future dynamics of European land use. Ann. Reg. Sci. 2008, 42, 57–77. [Google Scholar] [CrossRef]
  44. Liu, X.; Liang, X.; Li, X.; Xu, X.; Ou, J.; Chen, Y.; Li, S.; Wang, S.; Pei, F. A future land use simulation model (FLUS) for simulating multiple land use scenarios by coupling human and natural effects. Landsc. Urban Plan. 2017, 168, 94–116. [Google Scholar] [CrossRef]
  45. Guo, H.; Cai, Y.; Yang, Z.; Zhu, Z.; Ouyang, Y. Dynamic simulation of coastal wetlands for Guangdong-Hong Kong-Macao Greater Bay area based on multi-temporal Landsat images and FLUS model. Ecol. Indic. 2021, 125, 107559. [Google Scholar] [CrossRef]
  46. Xiang, H.; Wang, Z.; Mao, D.; Zhang, J.; Xi, Y.; Du, B.; Zhang, B. What did China’s National Wetland Conservation Program Achieve? Observations of changes in land cover and ecosystem services in the Sanjiang Plain. J. Environ. Manag. 2020, 267, 110623. [Google Scholar] [CrossRef]
  47. Pu, L.; Zhang, S.; Yang, J.; Yan, F.; Chang, L. Assessment of high-standard farmland construction effectiveness in liaoning province during 2011–2015. Chin. Geogr. Sci. 2019, 29, 667–678. [Google Scholar] [CrossRef]
  48. Zhang, C.; Robinson, D.; Wang, J.; Liu, J.; Liu, X.; Tong, L. Factors influencing farmers’ willingness to participate in the conversion of cultivated land to wetland program in Sanjiang National Nature Reserve, China. Environ. Manag. 2011, 47, 107–120. [Google Scholar] [CrossRef]
  49. Shi, J.; Zhang, P.; Liu, Y.; Tian, L.; Cao, Y.; Guo, Y.; Li, J.; Wang, Y.; Huang, J.; Jin, R.; et al. Study on spatiotemporal changes of wetlands based on PLS-SEM and PLUS model: The case of the Sanjiang Plain. Ecol. Indic. 2024, 169, 112812. [Google Scholar] [CrossRef]
  50. Liu, Z.; Guan, D.; Wei, W.; Davis, S.J.; Ciais, P.; Bai, J.; Peng, S.; Zhang, Q.; Hubacek, K.; Marland, G. Reduced carbon emission estimates from fossil fuel combustion and cement production in China. Nature 2015, 524, 335–338. [Google Scholar] [CrossRef]
Figure 1. Overview of the study area. (a) Area A; (b) Area B; (c) Area C.
Land 14 01219 g001
Figure 2. Schematic Diagram of the Research Process.
Land 14 01219 g002
Figure 3. Statistical Analysis of Total Wetland Area changes and Area changes in Various Types of Wetlands.
Land 14 01219 g003
Figure 4. Wetland Changes in Area A from 1990 to 2020.
Land 14 01219 g004
Figure 5. Wetland Changes in Area B from 1990 to 2020.
Land 14 01219 g005
Figure 6. Wetland Changes in Area C from 1990 to 2020.
Land 14 01219 g006
Figure 7. Transition Matrix of the Five Types of Wetlands from 1990 to 2020. (a) The ratio of each type of feature transforming into itself; (b) Transfer matrix without its own transformation part.
Land 14 01219 g007
Figure 8. Contribution of Eight Impact Factors to Different Wetland Types.
Land 14 01219 g008
Figure 9. Statistics on Future Wetland Change Projections.
Land 14 01219 g009
Figure 10. Simulation Results of Wetlands in Special Areas under the FPS Scenario. (PF: Paddy field; RC: Rivers and canals; NW: Nature water; RP: Reservoirs and ponds; TF: Tidal flat). (a) Area A; (b) Area B; (c) Area C; (1) Results of FPS scenario simulation in 2040; (2) Results of FPS scenario simulation in 2060; (3) Results of FPS scenario simulation in Area A; (4) Results of FPS scenario simulation in Area B; (5) Results of FPS scenario simulation in Area C.
Land 14 01219 g010
Figure 11. Simulation Results of Wetlands in Special Areas under the WPS Scenario. (PF: Paddy field; RC: Rivers and canals; NW: Nature water; RP: Reservoirs and ponds; TF: Tidal flat). (a) Area A; (b) Area B; (c) Area C; (1) Results of WPS scenario simulation in 2040; (2) Results of WPS scenario simulation in 2060; (3) Results of WPS scenario simulation in Area A; (4) Results of WPS scenario simulation in Area B; (5) Results of WPS scenario simulation in Area C.
Land 14 01219 g011
Figure 12. Simulation Results of Wetlands in Special Areas under the CPS Scenario. (PF: Paddy field; RC: Rivers and canals; NW: Nature water; RP: Reservoirs and ponds; TF: Tidal flat). (a) Area A; (b) Area B; (c) Area C; (1) Results of CPS scenario simulation in 2040; (2) Results of CPS scenario simulation in 2060; (3) Results of CPS scenario simulation in Area A; (4) Results of CPS scenario simulation in Area B; (5) Results of CPS scenario simulation in Area C.
Land 14 01219 g012
Figure 13. Simulation Results of Wetlands in Special Areas under the NDS Scenario. (PF: Paddy field; RC: Rivers and canals; NW: Nature water; RP: Reservoirs and ponds; TF: Tidal flat). (a) Area A; (b) Area B; (c) Area C; (1) Results of NDS scenario simulation in 2040; (2) Results of NDS scenario simulation in 2060; (3) Results of NDS scenario simulation in Area A; (4) Results of NDS scenario simulation in Area B; (5) Results of NDS scenario simulation in Area C.
Land 14 01219 g013
Table 1. Data Sources.
DataResolutionTimeSource
LUCC30 m1990–2020http://www.geodata.cn/main/#/ (accessed on 19 June 2024)
DEM30 m https://www.resdc.cn/User/UserEdit.aspx (accessed on 19 June 2024)
Slope1 km https://www.resdc.cn/User/UserEdit.aspx (accessed on 6 July 2024)
Aspect1 km https://www.resdc.cn/User/UserEdit.aspx(accessed on 6 July 2024)
Population1 km1990–2020https://www.resdc.cn/User/UserEdit.aspx (accessed on 7 July 2024)
Temperature1 km1990–2020http://www.geodata.cn/main/#/ (accessed on 9 July 2024)
NDVI30 m1990–2020http://www.geodata.cn/main/#/ (accessed on 9 July 2024)
Soil type1 km https://www.resdc.cn/User/UserEdit.aspx (accessed on 9 July 2024)
Precipitation1 km1990–2020http://www.geodata.cn/main/#/ (accessed on 9 July 2024)
Table 2. Statistics of non-water features area from 1990 to 2020.
Area(km2)/Year1990199520002005201020152020
Dry land50,024.150,526.250,822.249,796.752,802.452,618.549,634.1
Woodland32,890.332,596.132,893.333,604.933,621.833,611.134,337.2
Grassland246,643.4247,379.7244,728.2243,141.5246,177.6245,976.6247,866.3
Residential area5718.16011.66011.36483.17165.97888.99599.6
Unused land55,990.555,096.656,182.357,704.850,851.250,540.648,926.3
Table 3. The Contribution of Influencing Factors to the Changes in All Land Features.
ContributionAspectDEMNDVIPopularityPrecipitationSlopeSoiltypeTemperature
Paddy field0.0140.1790.0610.1590.1610.0280.1040.294
Rivers and canals0.0120.2300.0600.1570.1520.0250.1150.248
Nature water0.0080.1790.0880.2860.1260.0130.1430.154
Reservoirs and ponds0.0160.2020.0710.1680.1920.0260.1290.193
Tidal flat0.0120.1670.0720.2090.1800.0270.1300.203
Dry land0.0120.1670.0720.2090.1800.0270.1300.203
Woodland0.0130.1890.0490.1830.1890.0330.1340.208
Grassland0.0150.1540.0540.1700.1690.0860.1350.215
Residential area0.0130.2130.0470.1810.1830.0310.1190.210
Unused land0.0120.2020.0340.2380.1470.0420.0930.230
Disclaimer/Publisher’s Note: The statements, opinions and data contained in all publications are solely those of the individual author(s) and contributor(s) and not of MDPI and/or the editor(s). MDPI and/or the editor(s) disclaim responsibility for any injury to people or property resulting from any ideas, methods, instructions or products referred to in the content.

