Article

Drivers of Public Welfare Land Ratios for Regional Development in China: A Central–Local Interaction Perspective

by
Jin Dai
1,2,
Qingbin Wang
2,
Xiongwei Zhou
1 and
Xinxian Qi
1,*
1
School of Geography and Ocean Science, Nanjing University, Nanjing 210023, China
2
Cultivated Land Protection Research Centre, China Land Survey and Planning Institute, Beijing 100035, China
*
Author to whom correspondence should be addressed.
Land 2025, 14(6), 1208; https://doi.org/10.3390/land14061208
Submission received: 18 April 2025 / Revised: 25 May 2025 / Accepted: 27 May 2025 / Published: 5 June 2025

Abstract

Public welfare land allocation in China’s land expropriation process plays a crucial role in balancing economic development with social equity, but limited research has examined the driving factors influencing public welfare land ratio determination from a central–local relationship perspective. This study investigates how central–local government interactions shape public welfare land ratios in China’s land development process. Based on a comprehensive analysis of land expropriation data across different regions and administrative levels, we examine the spatial heterogeneity and underlying mechanisms of public welfare land allocation. The results reveal the following: (1) Significant regional variations exist for regional public welfare land ratios, with the national average public welfare land ratio reaching 41.21% in 2019 (for plots ≥4 hectares), varying from 39.60% in eastern regions to 44.93% in western regions. (2) Administrative hierarchy influences allocation patterns, with county-level cities (43.73%) showing higher proportions than provincial capitals (36.42%). (3) Local governments strategically use public welfare land development as an instrument to expand land-based fiscal resources by attracting investments and population. (4) Provincial governments serve as crucial intermediaries in central–local policy implementation, balancing central mandates with local conditions. This study contributes to the land governance literature by providing empirical evidence on how institutional arrangements affect land resource allocation. The findings suggest that establishing unified national standards while allowing provincial-level adaptations would improve the effectiveness of public welfare land policy in the post-land finance era, enhancing both governance efficiency and public welfare outcomes.

1. Introduction

Land expropriation and allocation serves as a critical policy instrument for balancing economic development with public welfare in urbanizing countries [1,2]. Public welfare land—defined as land allocated for local or regional public interests according to the national standard “Classification and Planning of Urban Construction Land Use” (GB50137-2011)—is a crucial component within the land expropriation and allocation process [3]. This specifically includes five categories: public management and public service facility land (A), green space and square land (G), road and transportation facility land (S), public facility land (U), and public service project land in residential areas (Ra). Public welfare land plays a pivotal role in providing public services, promoting social equity, and improving people’s livelihoods [4,5]. Public welfare land types share common characteristics of being primarily non-profit-oriented, serving collective social needs, and typically requiring government investment and management. The provision of these lands creates positive externalities for urban residents and businesses, contributing to quality of life, environmental sustainability, and enhanced economic activity [6]. In fact, the proportion of public welfare land within expropriated land fundamentally shapes urban development patterns and citizens’ quality of life [7], but the mechanisms driving public welfare land allocation remain understudied, particularly from the perspective of central–local government relations [8].
China presents an illuminating case for examining public welfare land allocation dynamics due to its unique land ownership system and rapid urbanization process [9,10]. Since the 1994 tax-sharing reform, China’s local governments have increasingly relied on land finance—revenue generated from land transfers—to fund urban development and public services [11,12,13]. This dependence has created a complex tension between revenue generation and public welfare provision in land use decisions [14]. Following the 2019 land expropriation reform, China has entered the “post-land finance era”, characterized by stricter regulations on land expropriation and heightened emphasis on public welfare [15,16]. These institutional changes have reshaped incentives for both central and local governments regarding public welfare land allocation.
The existing literature on China’s land development has primarily focused on three aspects: land finance mechanisms [11,17], urban land expansion [18,19,20], and social impacts of land expropriation [4,21,22]. Several studies have examined public facilities provision in urbanization [23,24], but few have specifically analyzed the determinants of public welfare land ratios—the proportion of land allocated for public services and facilities within the total urban construction land—from an institutional perspective. The provision of public service land plays a crucial role in China’s regional development. Cai highlights how land allocated for welfare purposes serves as a mechanism for distributing public resources [4], while Tang documents the institutional shift from purely economic to more socially oriented land expropriation policies [24]. However, these studies have not fully explored how public welfare land allocation shapes regional economic outcomes. Evidence suggests that public welfare land supply significantly affects regional development patterns, and different economic development phases correspond to distinct urban development patterns and strategic policy choices. In economically advanced eastern regions, where urbanization occurred earlier, public welfare land ratios tend to be lower due to historical development patterns prioritizing industrial land and economic growth. Conversely, western regions show higher public welfare land ratios, partly due to more recent urban expansion under revised national guidelines [15]. Wang investigated land use efficiency but overlooked how central–local dynamics shape public welfare land allocation decisions [25]. The administrative hierarchy also significantly influences allocation patterns, but the underlying governance mechanism has not been addressed [26].
The urban governance approach has created problematic regional inequalities. In high-growth regions, the undersupply of public welfare land has led to urban congestion, insufficient public services, and reduced quality of life [16]. Local governments in these areas often prioritize revenue-generating land uses over public welfare functions. Meanwhile, in slower-growing regions, the oversupply of certain types of public welfare land (particularly transportation infrastructure) represents inefficient resource allocation driven by political rather than economic considerations [27]. As Tan argues, this imbalance stems from misaligned incentives between central policy goals of balanced development and local governments’ pursuit of land-based fiscal resources [28]. These institutional deficiencies in public welfare land governance have contributed to uneven development patterns across China. The central government’s ability to establish and enforce standards for public welfare land allocation directly impacts regional equity and sustainable urbanization [29,30]. However, the land financialization process has often prioritized short-term economic gains over long-term public welfare considerations. This significant research gap limits our understanding of how institutional arrangements affect public resource allocation in China’s urbanization process.
The theoretical framework of central–local relations provides a valuable lens for analyzing public welfare land allocation [14]. Central governments typically prioritize macroeconomic stability, social equity, and environmental protection, while local governments often emphasize economic growth, fiscal revenue, and visible infrastructure development [25,31]. These divergent priorities create a principal–agent problem in policy implementation [16,27]. In China’s context, provincial governments play a crucial intermediary role, balancing central mandates with local conditions [30]. This multi-level governance structure creates a dynamic institutional environment where public welfare land allocation decisions are negotiated and implemented [29]. Within this framework, several research gaps emerge. First, how do regional economic development levels influence public welfare land ratios through the mechanisms of varying fiscal capacities and public service demands? Second, in what ways does administrative hierarchy shape allocation patterns through different policy implementation mechanisms?
To address these issues, this study employs a mixed-methods approach to analyze public welfare land allocation across China. This research contributes to the literature by examining how multi-level governance structures affect public resource allocation in transitional economies, providing empirical evidence on institutional determinants of welfare land allocation, and recommending unified national standards with provincial-level adaptations to enhance both governance efficiency and public welfare outcomes. This will help policy makers better understand the heterogeneity in public welfare land policy implementation and provide support for the formulation of differentiated public welfare land policy.

2. Central–Local Relations in Land Expropriation

In China’s governmental system, central–local government relations extend beyond simple binary opposition. Policy implementation involves dynamic interaction between decentralization and centralization, where both levels pursue their respective goals rather than engaging in zero-sum competition [24,32,33]. Following the tax-sharing reform, the general framework of the central–local relationship has been characterized by “centralized financial power and decentralized administrative power” [34,35,36]. The role of land finance in shaping public fiscal revenue offers a new perspective for research on land use [37].

2.1. The Game Between Central and Grassroots Governments in Policy Implementation

Local governments represent the interests of both the central government and non-governmental entities (residents, enterprises, and other groups) [38]. This dual mandate creates a divergence of goals between local and central governments, which often results in variations in the effectiveness of policy implementation at the local level. To maximize local economic and governmental interests while executing central policies, local governments and their departments are required to implement directives from higher levels of government, though adjustments may occur during execution [29]. These modifications sometimes benefit local development and achieve central government goals, but unfavorable decisions can also arise [28,29,39]. To better align the interests of both levels of government, China uses the effectiveness of economic development as a performance evaluation criterion, incentivizing local governments to actively pursue economic growth. In this ongoing policy implementation game, the central government is well aware of the potential for collusion at the grassroots level. Tirole’s game model describes supervisor–agent collusion within a principal–supervisor–agent triad, manifested in the flexible application of central policies adapted to local conditions [40]. When provincial and lower-level governments implement policies without specific, detailed management measures, differentiated implementation strategies tend to emerge, which may be more conducive to achieving local economic development goals.
Consequently, the central government strives to make goals as consistent as possible through systems and incentives, while allowing provincial governments the flexibility to refine rules within established parameters, leveraging the enthusiasm of provincial and grassroots governments.

2.2. Local Government Choices and Goal Achievement in Land Expropriation

After the 1994 tax-sharing reform, local governments’ freely allocable fiscal revenue was significantly reduced. Land finance—a financial system controlled entirely by local governments and operating outside the general budget—emerged as a crucial tool for regional competition and political performance achievement [41,42,43]. Although land resources are state-owned, local governments exercise the right to expropriate land on behalf of the state, effectively monopolizing land resources [37]. During rapid industrialization and urbanization, a fragmented dual land market developed between urban and rural areas, resulting in issues such as farmland loss, difficulties in protecting farmers’ rights, inefficient land use, ecological degradation, and food security concerns [44,45,46,47].
To curb the negative consequences of the extensive land use model, the central government has adopted a system resembling “economic decentralization and political centralization” within the “political tournament” of land expropriation [48]. Local governments retain autonomy over land-related economic benefits, while the central government enforces centralized administrative controls through land use regulations and approval processes [49,50]. As land expropriation costs rise and the incremental benefits of land transfers diminish, the low-cost advantage of land resources has evaporated, rendering the previous “land financing model” unsustainable. To secure continuous tax revenue, local governments increasingly lower land prices or invest more in public services to attract businesses that generate high tax revenues and promote economic agglomeration [51,52]. Local governments’ primary goal is to maximize economic (fiscal) income [53]. Restricting the proportion of public welfare land limits local governments’ ability. Many provincial governments have reduced public welfare land share in comprehensive development projects, adjusting according to local conditions. When both authority and willingness lie with provincial government, public welfare land proportion in comprehensive development is more likely to be maintained.

2.3. Policy Experiment Improvement Mechanism Under Central–Local Interaction

In China’s current central–local relations, regional differences in policy implementation primarily arise from two factors: the varying importance and urgency of goals within provinces, and different negotiating capabilities with the central government. Local governments’ policy implementation demonstrates flexibility—tailoring policies to fit local conditions [54,55]. While this flexibility may sometimes conflict with central government objectives, it also fosters innovation in policy formulation. The outcomes of public policy implementation differ across regions due to variations in demographics, socio-economic conditions, and resource endowments.
Reconciling differences between central and local governments and formulating differentiated policies to achieve unified goals requires establishing central–local interaction mechanisms through pilot programs and policy experiments. This combines “top–down design” with “local exploration”, leading to national-level policy frameworks [56,57]. China sets up pilot projects to conduct case studies. The central government leverages pilot experiences to refine policy systems. Regarding the proportion of land designated for public purposes, a national baseline has been set, with provinces learning through inter-provincial exchanges and issuing detailed implementation guidelines, forming a relatively unified framework for differentiated land use proportions.
In the nationwide land acquisition and development standards issued by 31 provinces (municipalities, autonomous regions), 15 provinces (municipalities, autonomous regions) have relaxed the requirements for the proportion of land allocated for public purposes. Research on implementation in several provinces reveals that, in areas where the proportion is set at “generally not less than 40%”, the calculation methods and scope may be adjusted during execution to reduce this proportion. This observation aligns with the earlier analysis of central–local relations and policy implementation. This process has culminated in the issuance of the newly revised “Standards”, as illustrated in Figure 1.

3. Materials and Methods
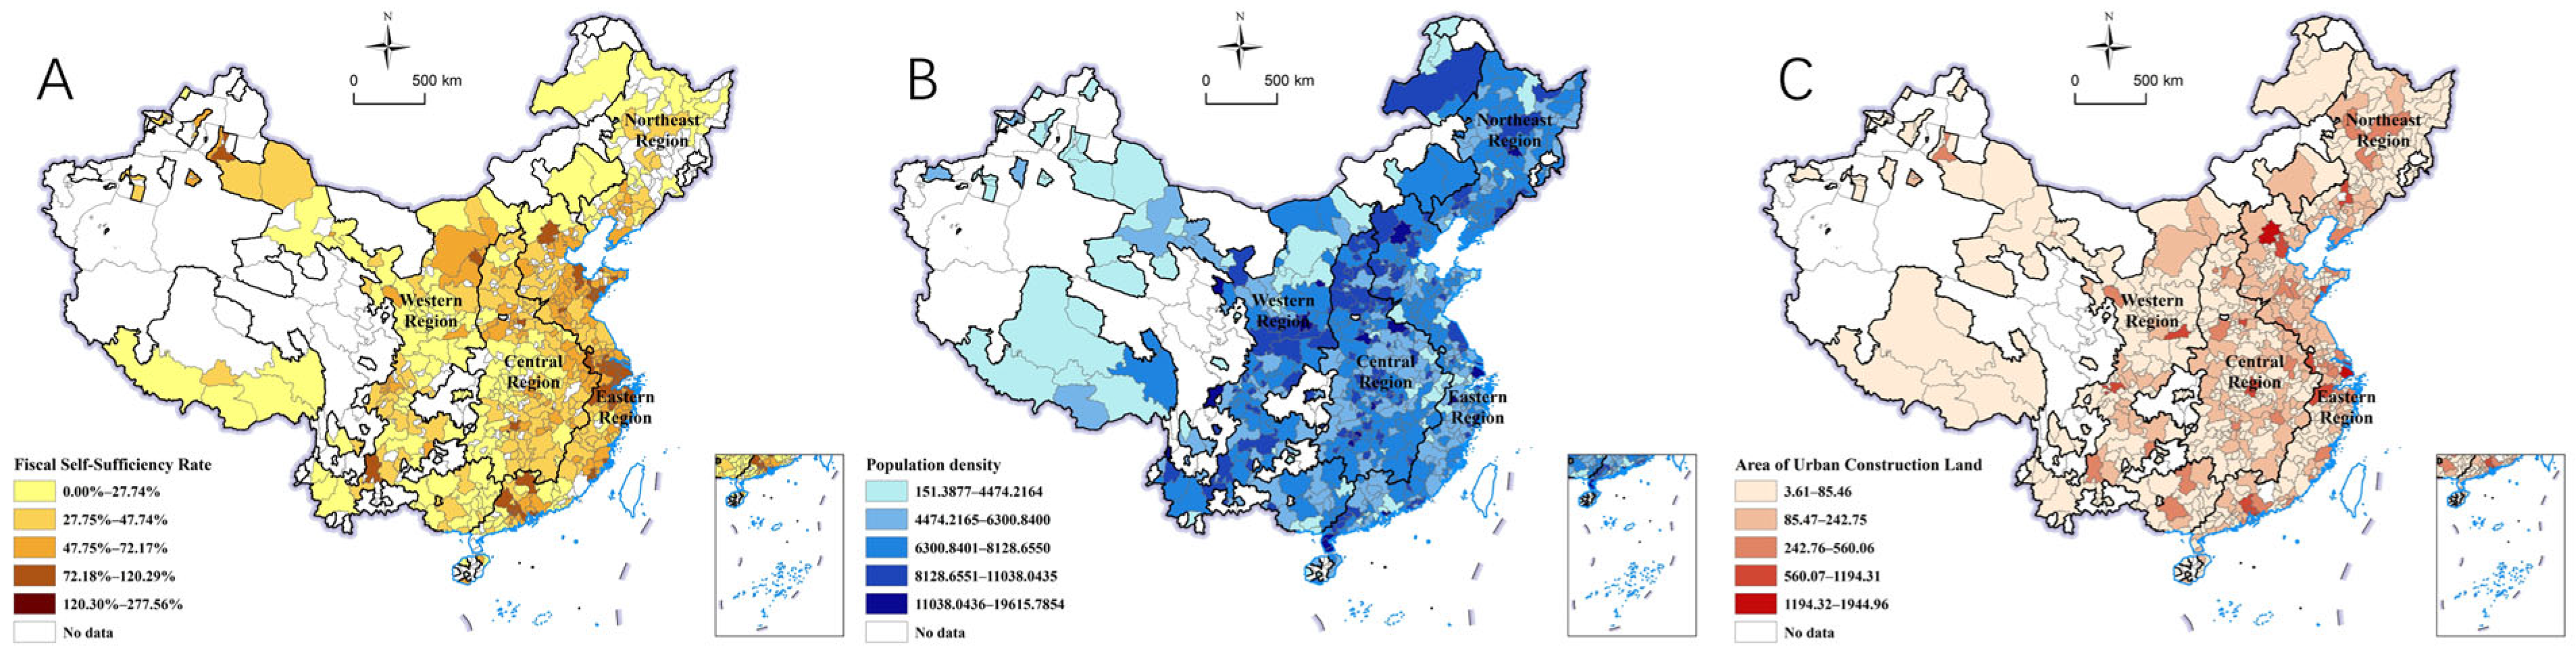
3.1. Data Sources

(1) Land data: Based on the “China Urban Statistical Yearbook 2020” and “China Urban and Rural Construction Statistical Yearbook 2020” released by the Ministry of Housing and Urban-Rural Development on 31 December 2021, this study analyzes key factors such as urban population density, the current proportion of public-purpose land within built-up areas, and the yearly land acquisition rate, as illustrated in Figure 2A. Additionally, the average proportion of public-purpose land in counties across provinces in 2020 is examined. Due to data limitations, the analysis focuses solely on cities, excluding districts, counties, prefectures, and leagues. In light of the implementation of the “Urban Land Classification and Planning Standards” on 1 January 2012, comparative analysis is also conducted using data from the “China Urban Statistical Yearbook 2012” and “China Urban and Rural Construction Statistical Yearbook 2012” to assess changes over time.
(2) Population data: The urban scale is determined based on county-level data from the Seventh National Population Census, published by the National Bureau of Statistics. According to the State Council’s 2014 notice, “Adjusting the Criteria for Dividing Urban Scale”, cities are classified into five grades and seven categories based on the population residing in urban areas, as illustrated in Figure 2B.
(3) Financial data: Local finance bureaus and statistical bureaus, as illustrated in Figure 2C.

3.2. Variable Selection

(1)
Dependent variables
Built-up area proportion of public welfare land (P): According to the national standard “Classification and Planning of Urban Construction Land Use” (GB50137-2011) [3], public management and public service facility land (A), green space and square land (G), road and transportation facility land (S), public facility land (U), and public service project land in residential areas (Ra) are classified as current public welfare land in built-up areas. Due to the lack of publicly available data on public service project land in residential areas, this study calculates its proportion based on the “Urban Residential Area Planning and Design Standard” (GB50180-2018) [58], which defines a per capita facility indicator. Based on the standard of 100 m2 of urban construction land per capita, the proportion of public service project land in residential areas is estimated to be between 1.7% and 2.4% of the total urban construction land. Assuming local governments prioritize economic benefits, the lower estimate of 1.7% is used for the calculation as follows:
R a = 1.7 % × A r e a   o f   u r b a n   c o n s t r u c t i o n   l a n
Urban transportation infrastructure serves not only intra-city traffic, but also inter-city, inter-provincial, and regional transportation corridors. Due to the difficulty in fully excluding such transportation land, this study categorizes the proportion of public welfare land into two types: one that includes transportation land and one that excludes it, with each discussed separately. According to the “Opinions of the Central Committee of the Communist Party of China and the State Council on Further Strengthening Urban Planning and Construction Management”, by 2020, the average road network density in urban built-up areas had increased to 8 km per square kilometer. Based on this requirement, the theoretical standard planning size is 200 m × 200 m. When the land area exceeds 4 hectares, it is necessary to allocate space for urban roads, which also fulfill some public service functions, as illustrated in Figure 3A. However, if the land area is less than 4 hectares, the inclusion of public service functions in road construction may not be required, as illustrated in Figure 3B.
Therefore, the calculation of the proportion of public welfare land in built-up areas is divided into two categories based on whether transportation land is included, with 4 hectares serving as the dividing threshold.
When the land plot area is greater than 4 hectares:
p r o p o r t i o n   o f   p u b l i c   w e l f a r e   l a n d   ( P 1 )   = ( A + G + S + U + R a ) / u r b a n   c o n s t r u c t i o n   l a n d   a r e a
When the land parcel area is less than 4 hectares:
p r o p o r t i o n   o f   p u b l i c   w e l f a r e   l a n d   ( P 2 )   = ( A + G + U + R a ) / u r b a n   c o n s t r u c t i o n   l a n d   a r e a
(2)
Explanatory variables
Urban fiscal self-sufficiency ratio: The fiscal self-sufficiency ratio is an effective measure of a local government’s reliance on central transfer payments, reflecting the strength of local economic activities. It also indicates the economic incentives driving local governments to align with central government policy preferences [59,60].
Urban scale: Different urban scales receive varying levels of attention from both the central government and society. This study classifies cities into seven types—super cities, mega cities, type I large cities, type II large cities, medium-sized cities, type I small cities, and type II small cities—according to the “Notice on Adjusting Urban Scale Classification Standards”.
Proportion of recent five-year expansion in built-up areas: Development strategies for population concentration and urban expansion differ over time. During periods of extensive development, the proportion of public welfare land may be relatively low. In recent years, urban development and planning have become more scientifically driven, with local land demands varying based on the central government’s policy to limit land acquisition. However, due to data limitations and changes in administrative divisions, this paper uses the proportion of built-up area expanded in the past five years as an indicator of cities’ expansion demands.
Proportion of land expropriated for the current year: During the revision of the Land Administration Law and the drafting of the “Notice”, provinces were informed about the requirement to reduce the scope of land acquisition. Some regions may conduct rushed land acquisitions before the policy is fully implemented. To distinguish these from actual expansion needs, this study uses the ratio of land area acquired this year to the urban built-up area to determine instances of extensive land acquisition.
Region: Given the central government’s varying policies for regions at different stages of economic development, the country is divided into four regions: northeast, east, central, and west. Due to significant differences in population density, industrial development foundation, and population migration trends between the northeast and east/central regions (based on data from the Seventh and Sixth National Population Censuses), Heilongjiang, Jilin, and Liaoning are classified separately as the northeast region. Other provinces are categorized according to the east, central, and west divisions defined in the national Western Development Strategy of 2000 [61].
Administrative rank: Nationwide, cities are classified into five categories according to administrative levels: municipalities directly under the central government, centrally administered municipalities, provincial capitals, prefecture-level cities, and county-level cities. This illustrates the differences in urban management by different levels of government and the impact of central–local relations on personnel incentives [62].
Urban density: Assuming the proportion of urban public welfare land aligns with current development trends and actual needs, population density is used to assess the demand for urban public welfare land. This study employs urban population data from the “2020 China Urban Statistical Yearbook” and urban construction land area data to calculate population density.

3.3. Research Model

This study constructed a simple linear regression equation between the explanatory variable and the dependent variable, and solved it using the method of least squares. The equation is as follows:
y = α 0 + α 1 d e n s i t y + α 2 n e w 1 + α 3 n e w 5 + α 4 s i z e + α 5 r e g i o n + α 6 l e v e l + α 7 s e l f + ε
Here, y represents the dependent variable, namely the proportion of public welfare land use. α n denotes the regression coefficient, and ε stands for the residual. d e n s i t y represents population density, n e w 1 refers to land area acquired in the past year, and n e w 5 indicates the proportion of recent five-year expansion in built-up areas. s e l f denotes fiscal self-sufficiency rate. These four explanatory variables are continuous variables. s i z e represents city size category, r e g i o n indicates the geographical region of the city (not considered in regional regression), and l e v e l denotes the administrative level of the city. These three explanatory variables are categorical variables, represented using dummy variables to characterize different categories.

4. Results

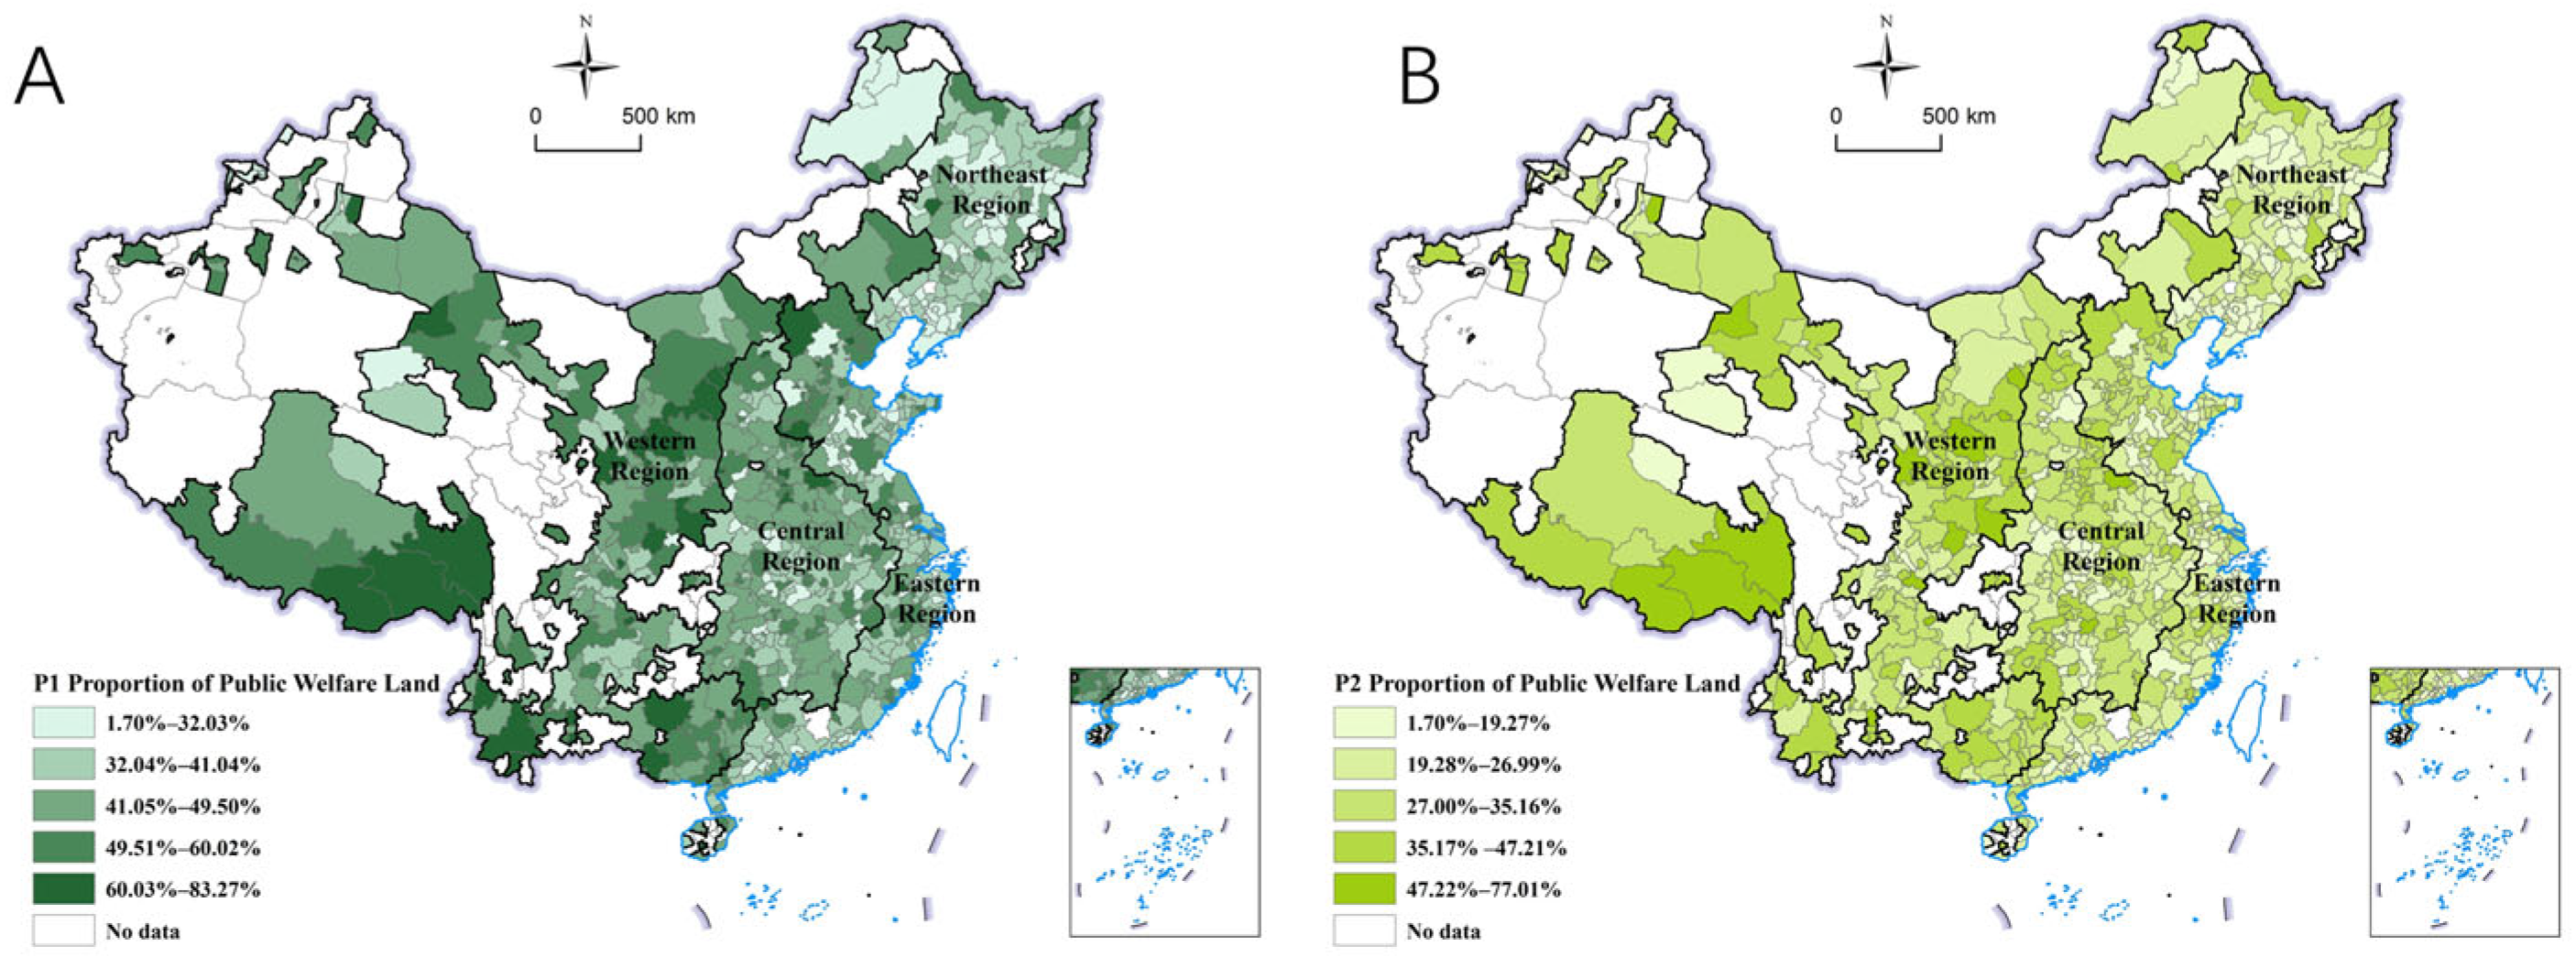
4.1. Spatial and Temporal Variations in the Proportion of Public Welfare Land

Comparing built-up area land use across China from 2012 to 2019 reveals regional disparities in the proportion of public service land. Overall (Table 1), before the regulation mandating that public service land should generally not be less than 40%, 61% of the built-up areas nationwide had a public service land proportion (including transportation facilities) exceeding 40%. The three northeastern provinces and eastern regions had relatively lower proportions compared to other areas, especially the Pearl River Delta region in the east (34.99%). As discussed earlier, these disparities stem from factors such as population concentration timing, economic development stages, and varying levels of development. From 2012 to 2019, the proportion of public service land in urban built-up areas increased across most regions, with the fastest growth observed in the western region. Notably, regions with later development stages tend to have a higher proportion of public service land than areas with earlier urban development and population concentration. When calculating land area, it is evident that the area devoted to roads and transportation facilities has significantly increased nationwide, particularly in the eastern and northeastern regions. In the new development stage, calculating the proportion of public service land should incorporate land used for roads and transportation facilities.
In 2020, the “Trial Measures for Comprehensive Development Standards of Land Acquisition” were introduced, requiring that the proportion of land allocated for infrastructure, public service facilities, and other public welfare purposes in areas designated for comprehensive development should generally not fall below 40%. This study uses urban land use data to evaluate the current proportion of public welfare land in urban built-up areas across China, while exploring the influence of central–local government dynamics on this proportion from multiple perspectives.

4.2. Factors Affecting the Proportion of Public Welfare Land at Different Scales

The results (Table 2) indicate that population density, the proportion of built-up area expansion in the past 5 years, city size, region, and administrative level all influence the proportion of public welfare land in built-up areas with plot sizes above 4 hectares. Specifically, the impact of the proportion of newly added construction land in the past 5 years on the proportion of public welfare land in built-up areas with plot sizes below 4 hectares is not significant.
At the national level, factors such as the city’s location, size, and administrative level significantly affect the proportion of public service land. Specifically, the western region, small cities, and prefecture-level cities have a more pronounced impact. From a demand perspective, areas with higher population density exhibit a greater need for public service land. Although population density has a statistically significant effect, its impact is relatively small. Disparities in recent years’ data on urban built-up area expansion, particularly the substantial portion of land allocated for transportation, highlight the increasing share of land dedicated to transportation in new developments. During urban expansion, designated areas for transportation are required, especially in development and industrial parks, where public service land is primarily allocated for transportation. Therefore, transportation land should be included when considering the total area of public service land in all cases.
China’s regional classification is based on economic development stages, which reflect different levels of development. Model calculations show significant influences of urban regions on the proportion of public service land, with both large and small cities in the western and eastern regions showing pronounced effects, while the northeastern region has a lesser impact. The regression results for calculating public service land vary in the eastern region, while other regions show relative consistency, underscoring significant regional disparities in the influence of explanatory variables on the proportion of public service land in urban built-up areas.
For cities categorized by scale (using data from the seventh national census), both large and small cities show statistically significant results for areas above and below 4 hectares. Among these, only small type I and type II cities exhibit significant regression results. In particular, type II small cities have higher regression coefficients, reflecting the current trend of local governments in these cities investing more in public service facilities. This is driven by the dual goals of improving political performance and providing comprehensive support to attract industrial projects, population growth, and commercial activities.
Regarding administrative levels, both prefecture-level cities and provincial capitals show significant regression results when compared to county-level cities, across both areas above and below 4 hectares. Municipalities directly under central government administration and planned municipalities, however, yield non-significant regression results. These city types, either directly managed by the central government or with economic management authority similar to provincial levels, have lower average proportions of public service land in their urban built-up areas compared to the other three city types. Notably, planned municipalities show the lowest average (Table 3).
The observed results cannot be solely attributed to the administrative level of cities. Planned municipalities, facing significant economic development pressures, often exhibit higher levels of development in their early stages. These cities tend to concentrate industries and require larger industrial land areas, which leads to a lower proportion of public service land compared to the figures calculated in this study.
Overall, the proportion of public service land in land requisition is significantly influenced by regional disparities and developmental stages. This further confirms that the construction of public service facilities in land requisition does not necessarily align with market demand but serves as a means for local governments to expand cities and increase direct and indirect revenue from land [63]. This reflects the fiscal needs of local governments concerning land use.
Moreover, there are significant differences in land dependency across cities of different scales. We define land dependency as the ratio of municipal land transfer revenue to the general public budget revenue. The results indicate that higher-scale cities have greater disposable income but lower dependence on land-based finance, whereas for typical large cities like Wenzhou, the dependency on land-based finance reaches 179% (Table 4). This also demonstrates that higher-scale cities show less pronounced effects in improving resident welfare through the allocation of public welfare land. Therefore, it is essential to emphasize the significance of reallocating public welfare land in improving urban residents’ well-being in large cities and less developed regions.

4.3. Factors Influencing the Proportion of Public Welfare Land in Different Regions

This study examined the influence of different factors across different economic regions, revealing distinct regression results. In the northeast region, none of the variables had significant effects, and overall, the proportion of public welfare land was lower compared to other regions. This can be largely attributed to the northeast’s unique economic development stage, which differs from that of other regions. In the early years of the People’s Republic of China, the focus was on economic recovery, with substantial investments in industrial production zones in the northeast. Initially, development centered on industrial land, leading to a lower proportion of public welfare land. As industries attracted populations, the region saw early population growth. However, with the decline in old industrial areas, the northeast has experienced significant population outflow and industrial relocation, which slowed urban expansion. As a result, it has been difficult to address the low proportion of public welfare land in a short timeframe.
In the less developed western regions, the proportion of public welfare land in urban built-up areas has seen the most significant increase. Among all regions nationwide, only the western region shows a significant regression result in relation to the expansion ratio of urban built-up areas over the past five years (Table 5). This reflects a shift in development strategies, where land finance no longer relies solely on land sales but also involves local governments investing in quality-enhancing projects, like infrastructure, to expand urban areas.
This development approach is influenced by the western region’s geographical position and relatively slower development. In less active market areas, benefits are limited, prompting stronger interventions from central and provincial governments. Local governments at the grassroots level benefit indirectly from adhering to higher-level government policies. This is reflected in the regression results for cities at various administrative levels in the western region, where cities directly managed by provincial governments show significant positive correlations.
In contrast, the regression results for 2019′s land acquisition area as a percentage of total land show significant negative correlations in the eastern and central regions, while this variable is not significant when calculated nationwide. Although there may have been a normal surge in land acquisition demand in 2020, the insignificance of the urban built-up area expansion ratio in recent years in these regions suggests otherwise. This indicates that local governments in the eastern and central regions continue to heavily rely on land finance.
At the national level, the regression results for fiscal self-sufficiency rate are not significant, and multicollinearity exists with the regional variables. However, when analyzed by region, fiscal self-sufficiency becomes significant in the western region, showing a negative correlation. This suggests that economic support and incentives from the central government are not the primary drivers of the increase in the proportion of public welfare land. In the western region, this result can be attributed to the insufficient fiscal capacity of local governments to generate revenue independently. Furthermore, the demand for industrial and residential land remains weak due to geographical disadvantages and the low market value of land.
In the eastern region, regression results are significant for tier 2 large cities, tier 1 small cities, and tier 2 small cities, with the coefficients decreasing as city size increases. Unlike other regions, the eastern region continues to attract population inflows without significant outflows that would reduce urban population size. This outcome in the eastern region reaffirms the earlier analysis that cities with earlier population aggregation and urban expansion tend to have lower overall proportions of public welfare land.
Regional differences in development levels and stages significantly influence the trends in public welfare land proportions within urban built-up areas. From a national perspective, merely setting differential regulations based on current conditions has its limitations. Therefore, it is essential to develop detailed rules for regional differentiation, taking into account regional development plans, characteristics, and stages of development.

4.4. Testing for Multicollinearity Among Explanatory Variables

It is generally believed that cities with higher population densities tend to have larger urban scales and higher administrative levels. This study explores potential correlations and multicollinearity issues among the explanatory variables. The results show that, among the categorical dummy variables arranged in ascending order, there is a correlation between fiscal self-sufficiency rate and regional location, while the correlations among other variables are relatively weak, suggesting no multicollinearity issues (Table 6).

5. Discussion

5.1. Regional Economic Development and Public Welfare Land Allocation

Our findings reveal significant regional variations in public welfare land allocation across China, with the national average ratio reaching 41.21% in 2019 (for plots ≥4 hectares), ranging from 39.60% in eastern regions to 44.93% in western regions. These disparities can largely be attributed to varying levels of economic development across regions and the historical path dependency that has shaped urbanization processes. In the eastern regions, earlier industrialization prioritized economic land uses over public welfare facilities, leading to lower proportions of public welfare land. As Wu (2022) notes, the rapid urban growth in eastern cities during the initial stages of China’s economic reforms occurred under a policy environment that emphasized industrial development and GDP growth, often at the expense of public service provision [11].
In contrast, western regions, which urbanized later under revised national guidelines, exhibit higher public welfare land ratios. This temporal difference is significant, as western cities developed during a period when central policies increasingly emphasized balanced development and public welfare [28]. As Liu et al. (2023) argue, these newer urban areas had the advantage of learning from the eastern regions’ experiences, allowing them to incorporate more public service land in their development plans [15]. This dynamic demonstrates how economic development stages significantly influence the implementation of central policies at the local level. Wang (2021) further supports this finding, noting that the implementation of national land policies varies considerably based on regional development contexts [25]. These regional variations reflect the broader theoretical framework of central–local relations, where the local implementation of national policies is mediated by contextual factors such as economic development level, historical urbanization patterns, and timing of development. Our findings extend Cai’s (2016) work on land for welfare in China by providing empirical evidence that the allocation of public welfare land is deeply embedded in regional development trajectories, with regions at different development stages exhibiting distinct patterns of public land provision [4].

5.2. Administrative Hierarchy and Governance Mechanisms

Our analysis reveals that administrative hierarchy significantly influences public welfare land allocation patterns, with county-level cities (43.73%) showing higher proportions than provincial capitals (36.42%). This hierarchical differentiation reflects how different administrative levels interpret and implement central land policies based on their distinct political and fiscal incentives. Provincial capitals, with their stronger economic bases and higher land values, tend to prioritize revenue-generating land uses over public welfare functions. In contrast, county-level cities, facing more significant development challenges, strategically use public service provision as a development strategy to attract investment and population. The political tournament theory in China provides a useful explanatory framework for these differences. As Wang (2021) suggests, local officials at different administrative levels face varying performance evaluation metrics, with provincial capital leaders often evaluated primarily on economic indicators, while county-level officials increasingly must demonstrate balanced development achievements, including public service provision [25].
The strategic behavior of smaller cities investing heavily in public service facilities reflects their position within China’s administrative hierarchy. With more limited economic resources, these cities leverage public welfare land allocation as a competitive strategy to attract industrial projects, population, and commercial activities. This finding extends previous research on the role of fiscal decentralization and urban development by demonstrating how administrative level creates different principal–agent dynamics in land policy implementation [14]. Lower-level governments, particularly county-level cities, appear more responsive to recent central government mandates emphasizing balanced development and public welfare. This administrative differentiation also manifests in the implementation of the 2020 “Trial Measures for Comprehensive Development Standards of Land Acquisition”, which requires public welfare land proportions to generally not fall below 40%. Our findings suggest that county-level cities have more actively complied with this threshold, while provincial capitals have shown more variability in implementation, highlighting the complex dynamics of vertical intergovernmental relations in China’s land governance system.
Our analysis also shows that some progressive cities have indeed begun integrating public welfare spaces within industrial zones, particularly in newer industrial parks. These include shared recreational areas, public green spaces, transportation hubs, and community service facilities that serve both industrial workers and surrounding communities. This integration represents an emerging trend in China’s land use planning that attempts to overcome the limitations imposed by rapid urbanization.

5.3. Fiscal Capacity and Strategic Behavior of Local Governments

Our research demonstrates that local governments’ fiscal self-sufficiency significantly correlates with their public welfare land allocation strategies, though this relationship varies by region. In western regions with lower fiscal capacity, we found a negative correlation between fiscal self-sufficiency and public welfare land ratios. This finding challenges the conventional assumption that higher fiscal capacity leads to greater public service provision. Instead, it suggests that economically disadvantaged local governments in western regions strategically use public welfare land development as an instrument to attract investments and population, thereby expanding their land-based fiscal resources indirectly. This strategic use of public welfare land as a development tool aligns with Huang and Chan’s (2018) analysis of land finance in urban China, though it reveals a more nuanced mechanism than previously documented [11]. Rather than directly generating revenue through land sales, these local governments invest in quality-enhancing public facilities to increase land values and attract economic activities over the long term. As our regression results show, this is particularly evident in type II small cities, where local governments invest significantly in public service facilities to achieve the dual goals of improving political performance and providing comprehensive support for economic development.
The contrasting patterns in eastern and central regions, where we found significant negative correlations between this year’s land acquisition area as a percentage of total land and public welfare land allocation, indicate continuing reliance on traditional land finance mechanisms in these more developed areas. As Ding et al. (2014) argue, local officials respond to fiscal incentives in order to make land development decisions, and thus our research adds an important dimension by showing how public welfare land allocation serves as a strategic tool within this fiscal framework [17]. The strategic behavior we observed aligns with Su et al.’s (2024) recent work on the transition from land finance to inclusive growth, suggesting that some local governments, particularly in less developed regions, are pioneering new approaches to land development that balance fiscal needs with public service provision [16]. However, economic development and population wellbeing can significantly promote investment in public welfare by increasing land values and stimulating economic activities. Future research will incorporate cases with different economic development and population wellbeing backgrounds to elucidate how public welfare land allocation can increase local budget inflow.

5.4. The Role of Provincial Governments as Policy Intermediaries

Our analysis highlights the crucial role of provincial governments as intermediaries in central–local policy implementation, particularly in adapting central policies to local conditions. Provincial-level discretion creates significant regional variations in public welfare land implementation, as evidenced by the differing patterns we observed across provinces. In the western region, cities directly managed by provincial governments show significant positive correlations with public welfare land ratios, indicating strong provincial guidance in policy implementation. This finding supports Wong’s (1991) early observations on central–local relations in China, while providing new empirical evidence on how provincial governments shape land resource allocation specifically [25]. Provincial governments effectively balance central mandates with local economic and social conditions, creating an adaptive implementation framework that accommodates regional diversity. This pattern aligns with the recent literature on policy experimentation and vertical intergovernmental relations in China. As Rosenberg (2018) suggests, provincial authorities serve as “policy translators”, interpreting central directives in ways that are feasible within local contexts [64]. Our research extends this understanding by demonstrating how this translation process operates specifically in public welfare land allocation.
The intermediary role of provincial governments is particularly evident in the implementation of the 40% threshold for public welfare land. Our findings show that provincial authorities have considerable influence over how this national standard is interpreted and applied in different regions, creating meaningful spatial heterogeneity in implementation. This dynamic supports Wang’s (2021) analysis of legal and political practices in China’s central–local dynamics, while adding nuanced evidence on land governance specifically [25]. These findings have significant implications for multi-level governance theory. As our research demonstrates, effective policy implementation in China’s land system depends not on rigid top–down mandates, but on flexible adaptation across administrative levels. Provincial governments emerge as crucial actors in this multi-level system, mediating between national policy goals and local implementation realities. This mediating role helps explain why we see regional variations in public welfare land allocation that cannot be explained by economic factors alone. The provincial level of government provides an institutional mechanism for policy adaptation that allows for regional differentiation while maintaining overall policy coherence.

5.5. Limitations

This study acknowledges limitations that should be considered when interpreting the results. First, variable selection constraints may have led to the omission of potentially important explanatory factors. Regarding the independent variables, although we controlled for the proportion of industrial land area, there may still be other important variables that remain uncontrolled in our analysis. Additionally, we overlooked factors reflecting the quality of public welfare land, such as environmental quality indicators, which are crucial for assessing the effectiveness of public welfare land allocation. These limitations will be addressed in future research through more detailed case-based data that can provide deeper insights into the qualitative dimensions of public welfare land provision. Second, spatial heterogeneity treatment represents a significant constraint, as our model, while controlling for geographical regions, does not adequately capture spatial interactions and spillover effects between cities, nor the strategic interactions among local governments that may influence land allocation decisions. These limitations suggest that future research should explore non-linear modeling approaches, incorporate additional explanatory variables, and employ spatial econometric methods to better capture the complex dynamics of public welfare land allocation in China’s diverse urban contexts.

6. Conclusions and Suggestions

The regulation of the proportion of public welfare land and its implementation across various regions in China vividly reflects the policy implementation dynamics and the interaction between central and local governments. This is particularly evident amid the mismatch between local fiscal powers and responsibilities, alongside the emphasis on economic goals as the primary assessment criteria for local governance. In this context, local governments’ discretionary control over land finance revenues drives them to pursue development through land leasing. Consequently, ensuring that the proportion of public welfare land does not conflict with local governments’ strategies of “seeking development through land use” becomes crucial. In fact, during the shift from a “high land price model” to a “high yield model” in land acquisition, the proportion of public welfare land has become a tool for local governments to expand urban areas, attract industrial projects, stimulate population growth, and increase tax revenue through investments in public facilities.
However, the precise definition of “public welfare”, the classification standards for public welfare land, and the methods used to calculate its proportion remain unclear. As a result, using the proportion of public welfare land as a constraint on urban land expansion has limited effectiveness. Empirical analysis results confirm from multiple perspectives that the factors influencing land acquisition and development standards are closely intertwined with land finance in the context of central–local relations. An examination of land acquisition and development standards through this lens reveals that local governments’ reliance on land finance is a key factor affecting the proportion of public welfare land. As we transition into the post-land finance era, the focus will shift towards high-quality infrastructure and public welfare land development. The emphasis will be on the quality, feasibility, and projected benefits of land acquisition and development projects, rather than merely their quantity. In this context, improving industrial efficiency and increasing fiscal revenue remain the primary goals for both central and local governments in land acquisition and development.
The research also reinforces the need for region-specific rules, as regional disparities are evident in both local government goals and the policy implementation process. Provincial governments have played a pivotal role in facilitating central–local interactions concerning land acquisition and development policies, ensuring consistency in policy formulation while maintaining flexibility in implementation. Within the current framework of central–local relations in China, this interaction fosters the adjustment and refinement of new policies. At present, the comprehensive integration of the collective operation of the construction land market has not been fully realized. The social and economic landscape, along with development needs, has evolved since the introduction of land acquisition system reforms, making it crucial to consider the security of production factors in future planning. Restrictions on the proportion of public welfare land have limited impact on the public welfare attributes of land acquisition and development. While setting a minimum threshold may restrict high-efficiency industrial land projects, local governments may still adjust calculations of the public welfare land proportion to comply with central government requirements. At this stage, it is vital to align the goals and interests of central and local governments in land acquisition, improve land utilization efficiency, and ensure the security of land resources.

Author Contributions

Conceptualization, X.Q. and J.D.; methodology, J.D.; software, J.D. and X.Z.; validation, X.Z., Q.W. and J.D.; formal analysis, J.D.; investigation, X.Q.; resources, Q.W.; data curation, J.D.; writing—original draft preparation, J.D.; writing—review and editing, Q.W. and X.Z. visualization, X.Z.; supervision, X.Q.; project administration, X.Q.; funding acquisition, X.Q. All authors have read and agreed to the published version of the manuscript.

Funding

This work was funded by the National Natural Science Foundation of China 42201301, the project of the China Land Surveying and Planning Institute 20241411067, and the “GeoX” Interdisciplinary Research Funds for the Frontiers Science Center for Critical Earth Material Cycling, Nanjing University 0209/14380116.

Data Availability Statement

All data used in this study were obtained from publicly available sources. The processed dataset is available from the authors upon reasonable request.

Conflicts of Interest

The authors declare no conflicts of interest.

References

  1. De Schutter, O. How not to think of land-grabbing: Three critiques of large-scale investments in farmland. J. Peasant. Stud. 2011, 38, 249–279. [Google Scholar] [CrossRef]
  2. Deininger, K.; Feder, G. Land registration, governance, and development: Evidence and implications for policy. World Bank. Res. Obs. 2009, 24, 233–266. [Google Scholar] [CrossRef]
  3. GB 50137-2011; Code for Classification of Urban Land Use and Planning Standards of Development Land. Standards Press of China: Beijing, China, 2011.
  4. Cai, M. Land for welfare in China. Land Use Policy 2016, 55, 1–12. [Google Scholar] [CrossRef]
  5. Lin, G.C.; Yi, F. Urbanization of capital or capitalization on urban land? Land development and local public finance in urbanizing China. Urban Geogr. 2011, 32, 50–79. [Google Scholar] [CrossRef]
  6. Tang, B.; Wong, S.; Liu, S. Institutions, property taxation and local government finance in China. Urban Stud. 2011, 48, 847–875. [Google Scholar] [CrossRef]
  7. Wu, F.; Zhang, F.; Webster, C. Informality and the development and demolition of urban villages in the Chinese peri-urban area. Urban Stud. 2013, 50, 1919–1934. [Google Scholar] [CrossRef]
  8. Cao, G.; Feng, C.; Tao, R. Local “land finance” in China’s urban expansion: Challenges and solutions. China World Econ. 2008, 16, 19–30. [Google Scholar] [CrossRef]
  9. Ho, P. Who owns China’s land? Policies, property rights and deliberate institutional ambiguity. China Q. 2001, 166, 394–421. [Google Scholar] [CrossRef]
  10. Lu, D.; Yao, S. A scientific thought about urbanization progress in China. Human. Geogr. 2007, 22, 1–5. [Google Scholar]
  11. Huang, D.; Chan, R.C. On ‘Land Finance’ in urban China: Theory and practice. Habitat. Int. 2018, 75, 96–104. [Google Scholar] [CrossRef]
  12. Tao, R.; Su, F.; Liu, M.; Cao, G. Land leasing and local public finance in China’s regional development: Evidence from prefecture-level cities. Urban Stud. 2010, 47, 2217–2236. [Google Scholar]
  13. Tang, P.; Shi, X.; Gao, J.; Feng, S.; Qu, F. Demystifying the key for intoxicating land finance in China: An empirical study through the lens of government expenditure. Land Use Policy 2019, 85, 302–309. [Google Scholar] [CrossRef]
  14. Wang, F.; He, J.; Niu, Y. Role of foreign direct investment and fiscal decentralization on urban haze pollution in China. J. Environ. Manag. 2022, 305, 114287. [Google Scholar] [CrossRef]
  15. Liu, Z.; Jiang, C.; Huang, J.; Zhang, W.; Li, X. Fiscal incentive, political incentive, and strategic interaction of illegal land use by local governments. Land Use Policy 2023, 129, 106647. [Google Scholar] [CrossRef]
  16. Su, Y.; Wu, Y.; Choguill, C.L.; Luo, J.; Yu, X. Reflections on TOD in China: From land finance to inclusive growth. J. Urban Manag. 2024, 13, 294–307. [Google Scholar] [CrossRef]
  17. Ding, C.; Niu, Y.; Lichtenberg, E. Spending preferences of local officials with off-budget land revenues of Chinese cities. China Econ. Rev. 2014, 31, 265–276. [Google Scholar] [CrossRef]
  18. Pan, J.-N.; Huang, J.-T.; Chiang, T.-F. Empirical study of the local government deficit, land finance and real estate markets in China. China Econ. Rev. 2015, 32, 57–67. [Google Scholar] [CrossRef]
  19. Zhang, W.; Xu, H. Effects of land urbanization and land finance on carbon emissions: A panel data analysis for Chinese provinces. Land Use Policy 2017, 63, 493–500. [Google Scholar] [CrossRef]
  20. Wang, J.T.; Zhang, J.T. Study on the Urban Land Expansion in the Urbanization of China. Mod. Urban. Res. 2011, 26, 12–15. [Google Scholar]
  21. Liu, H.; Liu, L.; Wang, F. Housing wealth and fertility: Evidence from China. J. Popul. Econ. 2023, 36, 359–395. [Google Scholar] [CrossRef]
  22. Wu, Y.; Heerink, N.; Yu, L. Real estate boom and resource misallocation in manufacturing industries: Evidence from China. China Econ. Rev. 2020, 60, 101400. [Google Scholar] [CrossRef]
  23. Zhang, C.; Huang, Y.; Ji, A.; Liu, H.; Li, J.; Ni, A.; Lu, W. Policy implications of the transit metropolis project: A quasi-natural experiment from China. Transp. Policy 2025, 162, 155–170. [Google Scholar] [CrossRef]
  24. Tang, J. From Economic Policy to Social Policy: Explanation of the Institutional Changes in Land Acquisition. China Land. Sci. 2021, 35, 1–7. [Google Scholar]
  25. Wang, C. Legal and political practices in China’s central–local dynamics. Fudan J. Humanit. Soc. Sci. 2021, 14, 523–547. [Google Scholar] [CrossRef]
  26. Shieh, L.; Friedmann, J. Restructuring urban governance: Community construction in contemporary China. City 2008, 12, 183–195. [Google Scholar] [CrossRef]
  27. Jiang, X.; Lu, X.; Liu, Q.; Chang, C.; Qu, L. The effects of land transfer marketization on the urban land use efficiency: An empirical study based on 285 cities in China. Ecol. Indic. 2021, 132, 108296. [Google Scholar] [CrossRef]
  28. Tan, R. On the reform and construction of the property right system of natural resources assets. China Land. Sci. 2021, 35, 1–9. [Google Scholar]
  29. Rosenberg, L. Centrifugal Empire: Central-Local Relations in China; Columbia University Press: New York, NY, USA, 2018. [Google Scholar]
  30. Wong, C.P. Central–Local relations in an era of fiscal decline: The paradox of fiscal decentralization in post-Mao China. China Q. 1991, 128, 691–715. [Google Scholar] [CrossRef]
  31. Dorner, Z.; Tucker, S.; Hassan, G.M. Heterogeneous productivity stabilizes public good contributions under certainty, uncertainty and ambiguity. J. Behav. Exp. Econ. 2024, 110, 102208. [Google Scholar] [CrossRef]
  32. Khan, Z.; Ali, S.; Dong, K.; Li, R.Y.M. How does fiscal decentralization affect CO2 emissions? The roles of institutions and human capital. Energy Econ. 2021, 94, 105060. [Google Scholar] [CrossRef]
  33. Bryson, P.J.; Cornia, G.C. Slovakia’s surge: The new system’s impact on fiscal decentralisation. Post-Communist Econ. 2006, 18, 437–457. [Google Scholar] [CrossRef]
  34. Cai, H.B.; Treisman, D. Did government decentralization cause China’s economic miracle? World Polit. 2006, 58, 505–535. [Google Scholar] [CrossRef]
  35. Rosenblatt, F.; Bidegain, G.; Monestier, F.; Rodríguez, R.P. A Natural Experiment in Political Decentralization: Local Institutions and Citizens’ Political Engagement in Uruguay. Lat. Am. Polit. Soc. 2015, 57, 91–110. [Google Scholar] [CrossRef]
  36. Heilmann, S. From Local Experiments to National Policy: The Origins of China’s Distinctive Policy Process. In Red Swan: How Unorthodox Policy-Making Facilitated China’s Rise; The Chinese University Press: Hong Kong, China, 2018; Volume 59. [Google Scholar]
  37. Zhang, H.; Feng, S.Y.; Qu, F.T. Reform of rural collective property rights system: Theoretical explanation and case evidence. Manag. World 2021, 37, 81–94. [Google Scholar]
  38. Zhang, Q.M. Bureaucratic Politics and Chinese Foreign Policy-making. Chin. J. Int. Polit. 2016, 9, 435–458. [Google Scholar] [CrossRef]
  39. Besley, T.; Coate, S. Centralized versus decentralized provision of local public goods: A political economy approach. J. Public Econ. 2003, 87, 2611–2637. [Google Scholar] [CrossRef]
  40. Tirole, J. Hierarchies and Bureaucracies: On the Role of Collusion in Organizations. J. Law Econ. Organ. 1986, 2, 181. [Google Scholar]
  41. Tang, J.; Wang, Q.R.; Tan, R. Rural Land Policy Reform Pilot under the New Urbanization Strategy; China Social Sciences Press: Beijing, China, 2014. [Google Scholar]
  42. Chen, Z.; Wang, Q.; Huang, X. Can land market development suppress illegal land use in China? Habitat Int. 2015, 49, 403–412. [Google Scholar] [CrossRef]
  43. Wu, F.L. Land financialisation and the financing of urban development in China. Land. Use Policy 2022, 112, 104412. [Google Scholar] [CrossRef]
  44. Xu, C. The Fundamental Institutions of China’s Reforms and Development. J. Econ. Lit. 2011, 49, 1076–1151. [Google Scholar] [CrossRef]
  45. Ma, J.J.; Qi, H. The Effect of Local Government’s Monopoly of Primary Land Market on the Formation and Dynamic Change of Land Finance: Empirical Evidence from the Establishment of Land Reserve System. China Land. Sci. 2019, 33, 43–52. [Google Scholar]
  46. Hu, R.M.; Hu, H.W.; Zhou, T.X. Priority Tasks Driven, Fiscal Revenue Growth and China’s Rural Construction Land Marketization. China Land. Sci. 2023, 37, 40–48. [Google Scholar]
  47. Liu, S.Y.; Wang, Z.F.; Zhang, W.F. The exhaustion of China’s “land-driven development” mode: An analysis based on threshold regression. J. Manag. World 2020, 36, 80–92. [Google Scholar] [CrossRef]
  48. Liu, Y.; Nath, N.; Murayama, A.; Manabe, R. Transit-oriented development with urban sprawl? Four phases of urban growth and policy intervention in Tokyo. Land Use Policy 2022, 112, 105854. [Google Scholar] [CrossRef]
  49. Tian, L.; Ma, W. Government intervention in city development of China: A tool of land supply. Land. Use Policy 2009, 26, 599–609. [Google Scholar] [CrossRef]
  50. Jia, S.; Wang, C.; Li, Y.; Zhang, F.; Liu, W. The urbanization efficiency in Chengdu City: An estimation based on a three-stage DEA model. Phys. Chem. Earth Parts A/B/C 2017, 101, 59–69. [Google Scholar] [CrossRef]
  51. Tan, R. China’s Land Security Review; Gold Wall Press/Social Sciences Academic Press: Beijing, China, 2014. [Google Scholar]
  52. Hong, Z.; Yi, Z.; Tiantian, C. Land remise income and remise price during China’s transitional period from the perspective of fiscal decentralization and economic assessment. Land Use Policy 2016, 50, 293–300. [Google Scholar] [CrossRef]
  53. Bai, J.D.; Yan, Y.F.; Cao, Y.M.; Cui, Y.; Chang, I.S.; Wu, J. Marine ecological security shelter in China: Concept, policy framework, mechanism and implementation obstacles. J. Environ. Manag. 2024, 351, 119662. [Google Scholar] [CrossRef]
  54. Coughlin, S.S.; Yigiter, A.; Xu, H.Y.; Berman, A.E.; Chen, J. Early detection of change patterns in COVID-19 incidence and the implementation of public health policies: A multi-national study. Public Health Pract. 2021, 2, 100064. [Google Scholar] [CrossRef]
  55. Chen, Z.M. Policy Sciences; China Renmin University Press: Beijing, China, 1998. [Google Scholar]
  56. Lampton, D.M. Chinese-Politics-the Bargaining Treadmill. Issues Stud. 1987, 23, 11–41. [Google Scholar]
  57. Yang, H.S.; Zhou, X.Y. Issue Attribute and Knowledge Production of Policy Experimentation: The Case Study Based on the Reform of Urban Land-use Rights. Manag. World 2022, 38, 82–95. [Google Scholar] [CrossRef]
  58. GB50180-2018; Standard for Urban Residential Area Planning and Design. Standards Press of China: Beijing, China, 2011.
  59. Huang, Y.S. Central-local relations in China during the reform era: The economic and institutional dimensions. World Dev. 1996, 24, 655–672. [Google Scholar] [CrossRef]
  60. Li, H.; Wei, Y.D.; Liao, F.H.; Huang, Z.J. Administrative hierarchy and urban land expansion in transitional China. Appl. Geogr. 2015, 56, 177–186. [Google Scholar] [CrossRef]
  61. Liao, F.H.F.; Wei, Y.D. Dynamics, space, and regional inequality in provincial China: A case study of Guangdong province. Appl. Geogr. 2012, 35, 71–83. [Google Scholar] [CrossRef]
  62. Zhong, Y.; Wei, Y.D. Economic Transition, Urban Hierarchy, and Service Industry Growth in China. Tijdschr. Econ. Soc. Ge 2018, 109, 189–209. [Google Scholar] [CrossRef]
  63. He, C.F.; Zhou, Y.; Huang, Z.J. Fiscal decentralization, political centralization, and land urbanization in China. Urban Geogr. 2016, 37, 436–457. [Google Scholar] [CrossRef]
  64. Rosenberg, L. Why do local officials bet on the strong? Drawing lessons from China’s village redevelopment program. China J. 2015, 74, 18–42. [Google Scholar] [CrossRef]
Figure 1. Policy trials under centralized interaction to improve mechanisms.
Land 14 01208 g001
Figure 2. Data description for urban construction land (A), population density (B), and fiscal self-sufficiency rate (C).
Land 14 01208 g002
Figure 3. Data description for proportion of public welfare land P1 (A) and proportion of public welfare land P2 (B).
Land 14 01208 g003
Table 1. Proportion of and changes in public welfare land in urban built-up areas in China from 2012 to 2019.
RegionProportion of Public Welfare Land in Urban Built-Up Areas in 2012Proportion of Public Welfare Land in Urban Built-Up Areas in 2019Change Situation
≥4 hm2<4 hm2≥4 hm2<4 hm2≥4 hm2<4 hm2
National Average38.5%26.5%41.21%25.21%2.69%1.37%
Eastern Region35.6%23.9%39.60%23.66%3.99%0.29%
Western Region43.3%31.0%44.93%28.23%1.54%2.84%
Central Region42.1%30.4%43.52%27.54%1.38%2.92%
Northeast Region35.8%24.1%35.59%21.12%−0.26%3.01%
Table 2. Regression results of variables in different area zones.
Variable NameCoef. (≥4 hm2)p > |t| (≥4 hm2)Coef. (<4 hm2)p > |t| (<4 hm2)
Population density0.0000.0030.000<0.001
Land expropriation for the current year−0.0730.1920.0030.654
Expansion in the past five years0.0370.0430.0190.254
City regionEastern region0.080<0.0010.060<0.001
Western region0.079<0.0010.066<0.001
Central region0.124<0.0010.103<0.001
City sizeType II small city0.1190.0020.1080.003
Type I small city0.0810.0310.0810.02
Medium-sized city0.0590.1110.0460.18
Type II large city0.0470.1970.0350.297
Super city−0.0150.673−0.0170.607
Mega city−0.0470.452−0.0620.28
City administrative levelPrefecture-level city0.0360.0010.0310.003
Provincial capital0.0760.0250.0640.043
Separately listed city0.0520.3510.0260.612
Municipality0.0590.4960.0720.369
Note: The calculation results are based on the northeastern region, type I large cities, and county-level cities.
Table 3. Average proportion of land for public benefit by administrative level in different cities.
Parcel Area
City Level
County-Level CityPrefecture-Level CityProvincial CapitalSeparately Listed CityMunicipality
≥4 ha43.73%48.83%42.95%36.42%39.54%
<4 ha28.25%32.27%26.35%18.78%24.67%
Table 4. The dependence on land finance in cities of different scales.
CityCity TypePer Capita Disposable Income/CNYLand Finance Dependency
GuangzhouSuper city68,30468,304107%107%
HangzhouMega city61,87952,531140%117%
WuhanMega city50,362113%
Xi’anMega city35,783107%
NanjingMega city60,606107%
WenzhouLarge city54,02543,922.4179%147%
KunmingLarge city48,018163%
FuzhouLarge city40,477153%
TaiyuanLarge city35,473126%
HefeiLarge city41,619116%
Data source: City Yearbook and China Real Estate Information Circle.
Table 5. Regression results of each variable in different regions in relation to the public welfare land ratio in built-up areas (area of 4 hm2 or more).
Influencing Factors
Region
NortheasternEastern RegionCentral RegionWestern Region
Coef.p > |t|Coef.p > |t|Coef.p > |t|Coef.p > |t|
Population density0.0000.1710.000 0.0140.000 <0.0010.000 0.707
Land expropriation ratio for the year 20190.505 0.199−0.232 0.047−0.135 0.0680.005 0.517
Expansion ratio of built-up areas in the past five years0.085 0.190−0.050 0.2180.039 0.1860.090 0.007
Fiscal self-sufficiency rate0.0520.6530.0150.6960.0210.492−0.1630.043
Urban scaleSuper city--−0.059 0.460 -−0.047 0.686
Mega city0.014 0.8970.006 0.918−0.055 0.509−0.089 0.336
Type II large city0.018 0.9080.082 0.089−0.054 0.4550.024 0.741
Medium-sized city0.036 0.8060.079 0.110−0.041 0.5520.058 0.461
Type I small city0.045 0.7570.101 0.050−0.067 0.2940.105 0.184
Type II small city0.081 0.5690.155 0.005−0.044 0.4950.160 0.050
Administrative levelMunicipality -0.040 0.724 -0.143 0.350
Provincial capital0.089 0.4200.078 0.166 -0.116 0.036
Separately listed city -0.064 0.352 - -
Prefecture-level city0.040 0.2350.017 0.4420.0090.7390.068 <0.001
Note: The calculation results are based on the northeastern region, type I large cities, and county-level cities.
Table 6. Variable covariance test.
VariablesDensitySizeRegionLevel
Density1.000
Size−0.0371.000
Region−0.112−0.0491.000
Level0.0520.0240.0511.000
Self−0.0700.051−0.286 ***0.049
Note: Significance levels are indicated by asterisks: *** p < 0.01.
Disclaimer/Publisher’s Note: The statements, opinions and data contained in all publications are solely those of the individual author(s) and contributor(s) and not of MDPI and/or the editor(s). MDPI and/or the editor(s) disclaim responsibility for any injury to people or property resulting from any ideas, methods, instructions or products referred to in the content.

