Article

A BiLSTM-Based Hybrid Ensemble Approach for Forecasting Suspended Sediment Concentrations: Application to the Upper Yellow River

1
School of Computer Science and Technology, Zhoukou Normal University, Zhoukou 466001, China
2
National Institute of Natural Hazards, Ministry of Emergency Management of the People’s Republic of China, Beijing 100085, China
3
Flood Emergency Rescue Technology and Equipment Co-Innovation Lab of the Ministry of Emergency Management, No. 28, Xiangjun Beili, Chaoyang District, Beijing 100020, China
4
Tidal Flat Research Center of Jiangsu Province, Nanjing 210036, China
*
Author to whom correspondence should be addressed.
Land 2025, 14(6), 1199; https://doi.org/10.3390/land14061199
Submission received: 28 February 2025 / Revised: 31 May 2025 / Accepted: 2 June 2025 / Published: 3 June 2025
(This article belongs to the Special Issue Artificial Intelligence for Soil Erosion Prediction and Modeling)

Abstract

Accurately predicting suspended sediment concentrations (SSC) is vital for effective reservoir planning, water resource optimization, and ecological restoration. This study proposes a hybrid ensemble model—VMD-MGGP-NGO-BiLSTM-NGO—which integrates Variational Mode Decomposition (VMD) for signal decomposition, Multi-Gene Genetic Programming (MGGP) for feature filtering, and a double-optimized NGO-BiLSTM-NGO (Northern Goshawk Optimization) structure for enhanced predictive learning. The model was trained and validated using daily discharge and SSC data from the Tangnaihai Hydrological Station on the upper Yellow River. The main findings are as follows: (1) The proposed model achieved an NSC improvement of 19.93% over the Extreme Gradient Boosting (XGBoost) and 15.26% over the Convolutional Neural Network—Long Short-Term Memory network (CNN-LSTM). (2) Compared to GWO- and PSO-based BiLSTM ensembles, the NGO-optimized VMD-MGGP-NGO- BiLSTM-NGO model achieved superior accuracy and robustness, with an average testing-phase NSC of 0.964, outperforming the Grey Wolf Optimization (GWO) and Particle Swarm Optimization (PSO) counterparts. (3) On testing data, the model attained an NSC of 0.9708, indicating strong generalization across time. Overall, the VMD-MGGP-NGO-BiLSTM-NGO model demonstrates outstanding predictive capacity and structural synergy, serving as a reliable reference for future research on SSC forecasting and environmental modeling.

1. Introduction

Artificial Intelligence (AI) has gained widespread recognition across various fields due to its capacity to model complex systems and deliver accurate predictions [1,2,3]. Recent advancements in AI—particularly in deep learning—have enabled its application in a wide range of domains, including groundwater storage change modeling, climate change forecasting using CDLSTM [4], environmental factor analysis through AI and ML methods [5], satellite image classification [6], and forest area classification via deep learning-based supervised image classification [7,8]. These applications illustrate the broad utility and growing acceptance of AI, underscoring its potential to address complex scientific challenges and thereby supporting its adoption in the present study.
Building upon AI’s demonstrated versatility in other disciplines, hydrologists have increasingly embraced advanced deep-learning architectures. These include long short-term memory (LSTM) networks trained on large multi-basin datasets, physics-guided graph neural networks that capture river-reach connectivity, and more recently, Bidirectional Long Short-Term Memory (BiLSTM) networks, which have shown promise in multi-variable hydrological forecasting for enhancing both streamflow and SSC predictions.
There is a critical need to predict SSC in rivers with sufficient accuracy to support reservoir planning and ecological restoration [9,10]. Currently, three main categories of models are employed to estimate SSC: empirical models (e.g., sediment rating curves) [11,12], process-based models [10,13,14], and data-driven models [15,16]. However, empirical models struggle to handle uncertainties in nonlinear data sequences [8], while process-based models often lack generalizability across diverse hydrological conditions [14].
In contrast, data-driven models have shown considerable promise, particularly in situations where a universal model is lacking [17,18,19]. Their rise in popularity over empirical and process-based models can be attributed to advancements in computing power, ease of use, and reduced reliance on complex assumptions or extensive domain expertise [20]. The proliferation of large-scale data, fueled by big data initiatives, has further enhanced their appeal. Modern data-driven techniques—such as neural networks and decision trees—benefit from powerful learning capabilities, enabling fast and accurate modeling. Automated feature engineering further simplifies modeling workflows, improving versatility, adaptability, and real-time decision-making capabilities. These models also offer high prediction accuracy and increasing interpretability, making them valuable for complex system modeling [21].
Nevertheless, traditional machine learning techniques may have limitations in uncovering deeply embedded patterns in natural hydrological datasets. Deep learning approaches such as Long Short-Term Memory (LSTM) [22,23], Gated Recurrent Unit (GRU) [20,24], and Bidirectional Long Short-Term Memory (BiLSTM) are better suited to capture these underlying patterns. Among them, BiLSTM provides enhanced modeling capability by incorporating bidirectional information flow, allowing the model to access both past and future contexts and effectively mitigate the long-term dependency issue [25,26,27]. For example, Li et al. (2022) demonstrated that BiGRU, a BiLSTM variant, outperformed standard LSTM in time–series production forecasting by leveraging both historical and future sequences [25]. Siami-Namini et al. (2019) also showed that BiLSTM outperformed both LSTM and ARIMA models in predictive accuracy [26]. The superior performance of BiLSTM can be attributed to two main reasons: (1) its ability to perform bidirectional context modeling by integrating both forward and backward LSTM units, and (2) its improved capacity to capture long-range dependencies and complex temporal patterns in sequential data [28,29]. Based on these advantages, this study employs BiLSTM as the core predictive model for SSC forecasting.
To further improve prediction accuracy, ensemble modeling has emerged as a promising strategy [30]. Three main approaches are typically used: optimization algorithm embedding, data preprocessing, and ensemble learning integration [31]. The first approach focuses on tuning model parameters to improve performance and robustness. Numerous optimization algorithms [32,33,34,35,36,37,38,39,40] have been applied in hydrology for this purpose, capitalizing on their strong global search capabilities. One such method is the Northern Goshawk Optimizer (NGO), a bio-inspired algorithm modeled on the hunting behavior of the northern goshawk bird. It balances exploration and exploitation using randomized operators (e.g., spiral flight, random movement) and refinement techniques (e.g., local search, hill climbing) to enhance convergence efficiency and solution quality [41,42,43]. Because of these strengths, the NGO algorithm is employed in this study to optimize BiLSTM hyperparameters and enhance the predictive robustness of the hybrid model.
In addition, decomposition techniques play a crucial role in simplifying time–series patterns and highlighting nonlinear characteristics in hydrological data, thereby improving model interpretability and predictive efficiency [44]. Several decomposition techniques have been explored in hydrology [20,24,25,45,46,47]. For example, Nourani et al. (2021) applied a wavelet transform (WT)-LSTM hybrid model to simulate runoff-sediment processes at multiple U.S. gauging stations, demonstrating that the hybrid model significantly outperformed standard LSTM and ANN [24]. Similarly, Li et al. (2022) applied a WT-based preprocessing strategy in combination with an INARX model to predict SSC at the Cuntan Station in the upper Yangtze River, achieving notable improvements in prediction accuracy [25]. These studies underscore the importance of suitable signal decomposition methods for hydrological modeling.
Among various decomposition methods, VMD has emerged as a powerful technique. VMD adaptively decomposes complex, nonstationary, and nonlinear signals into a finite number of band-limited intrinsic mode functions (IMFs) with distinct frequency components [48,49]. Unlike traditional Fourier and wavelet methods, VMD dynamically adjusts its decomposition process based on the signal’s characteristics. It allows clear mode separation, facilitating the identification of meaningful oscillatory components and transients [50,51]. Moreover, its sparse decomposition framework enhances interpretability and suppresses noise, making it well suited for feature extraction tasks in hydrology [52,53]. Given these advantages, VMD is selected in this study as the data decomposition method to preprocess SSC inputs prior to modeling [54,55].
Finally, in highly nonlinear and variable hydrological environments, standalone models often fall short in delivering robust SSC forecasts. Ensemble learning has thus become an attractive solution. As a machine learning paradigm, ensemble learning combines predictions from multiple base models to generate more accurate and stable results than any individual model alone [10,56,57,58,59,60]. Recent studies have applied hybrid ensemble frameworks in hydrology. For instance, Khosravi et al. (2022) constructed eight hybrid and non-hybrid models for flow discharge prediction in Iran’s Talar Watershed, finding that hybrid models yielded better performance, particularly in extreme cases [10]. Huang et al. (2021) integrated multiple machine learning methods for SSC prediction and achieved higher accuracy than single-model counterparts [60]. Fan et al. (2023) improved SSC prediction in the upper Yellow River by combining CNN and LSTM, effectively capturing spatiotemporal dynamics [56].
Although these studies highlight the strength of hybrid models, most still face challenges in handling multiscale patterns and optimal feature extraction. Therefore, there remains a need for a unified and advanced ensemble framework that integrates signal decomposition, intelligent feature selection, and deep learning in a cohesive structure. This study is motivated by that need and proposes a comprehensive model that incorporates VMD, MGGP-based filtering, NGO-based optimization, and BiLSTM forecasting to improve SSC prediction performance and robustness. Differing from the ensemble methods employed by Fan et al. (2023), Huang et al. (2021), and Khosravi et al. (2022), which primarily involve averaging predictions from various models [10,56,60], this current study takes a page from ensemble learning theory, specifically the stacking technique. It introduces a novel approach by integrating a deep learning network with the NGO algorithm to conduct secondary ensemble predictions based on the forecasted outcomes of the model. The NGO optimization algorithm, known for its effectiveness in handling non-convex optimization problems, is applied. The NGO algorithm iteratively adjusts the prediction outcomes, maximizing accuracy by fine-tuning the results based on the model’s performance. This innovative ensemble technique not only refines the initial predictions but also capitalizes on the complementary strengths of deep learning and optimization, aiming for an elevated predictive performance. By integrating the stacking approach into the ensemble process, this study sets a new trajectory in ensemble methodology, showcasing the potential for advanced optimization techniques to bolster prediction accuracy in complex modeling scenarios.
This study presents a cutting-edge integrated predictive model, VMD-MGGP- NGO-BiLSTM-NGO, designed to accurately forecast SSC in the Yellow River Basin. The distinguishing feature of this model lies in its innovative fusion of multiple advanced techniques: a deep learning architecture (BiLSTM), a metaheuristic optimization algorithm (NGO), and two key data preprocessing methods—VMD and MGGP. This hybrid integration distinguishes the proposed framework from previous research efforts. The model workflow is structured as follows: first, the raw hydrological data is preprocessed using VMD and MGGP, which play a crucial role in decomposing and filtering the input signals to extract meaningful components. Next, the BiLSTM network, a powerful sequence modeling tool, is employed for predictive learning, while the NGO algorithm is used to optimize both BiLSTM hyperparameters and the ensemble weights for multiple sub-models, ultimately enhancing the model’s generalization ability. The integrated model is applied to forecast SSC at the Tangnaihai Hydrological Station, a key national control point in the upper reaches of the Yellow River. This location offers an ideal setting for SSC research due to its relatively undisturbed hydrological conditions—unlike the middle and lower reaches, it is less affected by anthropogenic factors such as reservoir regulation and water-sediment engineering. As a result, the natural dynamics of sediment transport can be captured more reliably. Moreover, Tangnaihai serves as the first mainstream control station, providing essential observations of natural water and sediment inflow into the Yellow River system. Accurate prediction at this station is of critical importance for understanding upstream sediment dynamics, guiding downstream water-sediment regulation strategies, and improving early warning capabilities. By focusing on this strategically significant site, the study ensures data representativeness while contributing valuable insights for basin-scale hydrological modeling and river management.
Therefore, the overarching aim of this study is threefold: (i) to achieve high-precision forecasting of SSC by leveraging an integrated deep learning framework tailored for hydrological time series; (ii) to demonstrate the effectiveness of combining signal decomposition (VMD), feature selection (MGGP), metaheuristic optimization (NGO), and deep learning (BiLSTM) into a unified and adaptive modeling architecture capable of capturing complex nonlinear sediment transport dynamics; (iii) to validate the model at the Tangnaihai Hydrological Station—an upstream benchmark site in the Yellow River Basin characterized by minimal anthropogenic interference—in order to ensure the robustness, generalizability, and practical relevance of the proposed approach for real-world sediment management and basin-scale forecasting applications.
The remainder of this paper is organized into five sections: an overview of the methods employed, a description of the study area and dataset, a comparative analysis of predictive results and model performance, extended discussions, and final conclusions.

2. Methods

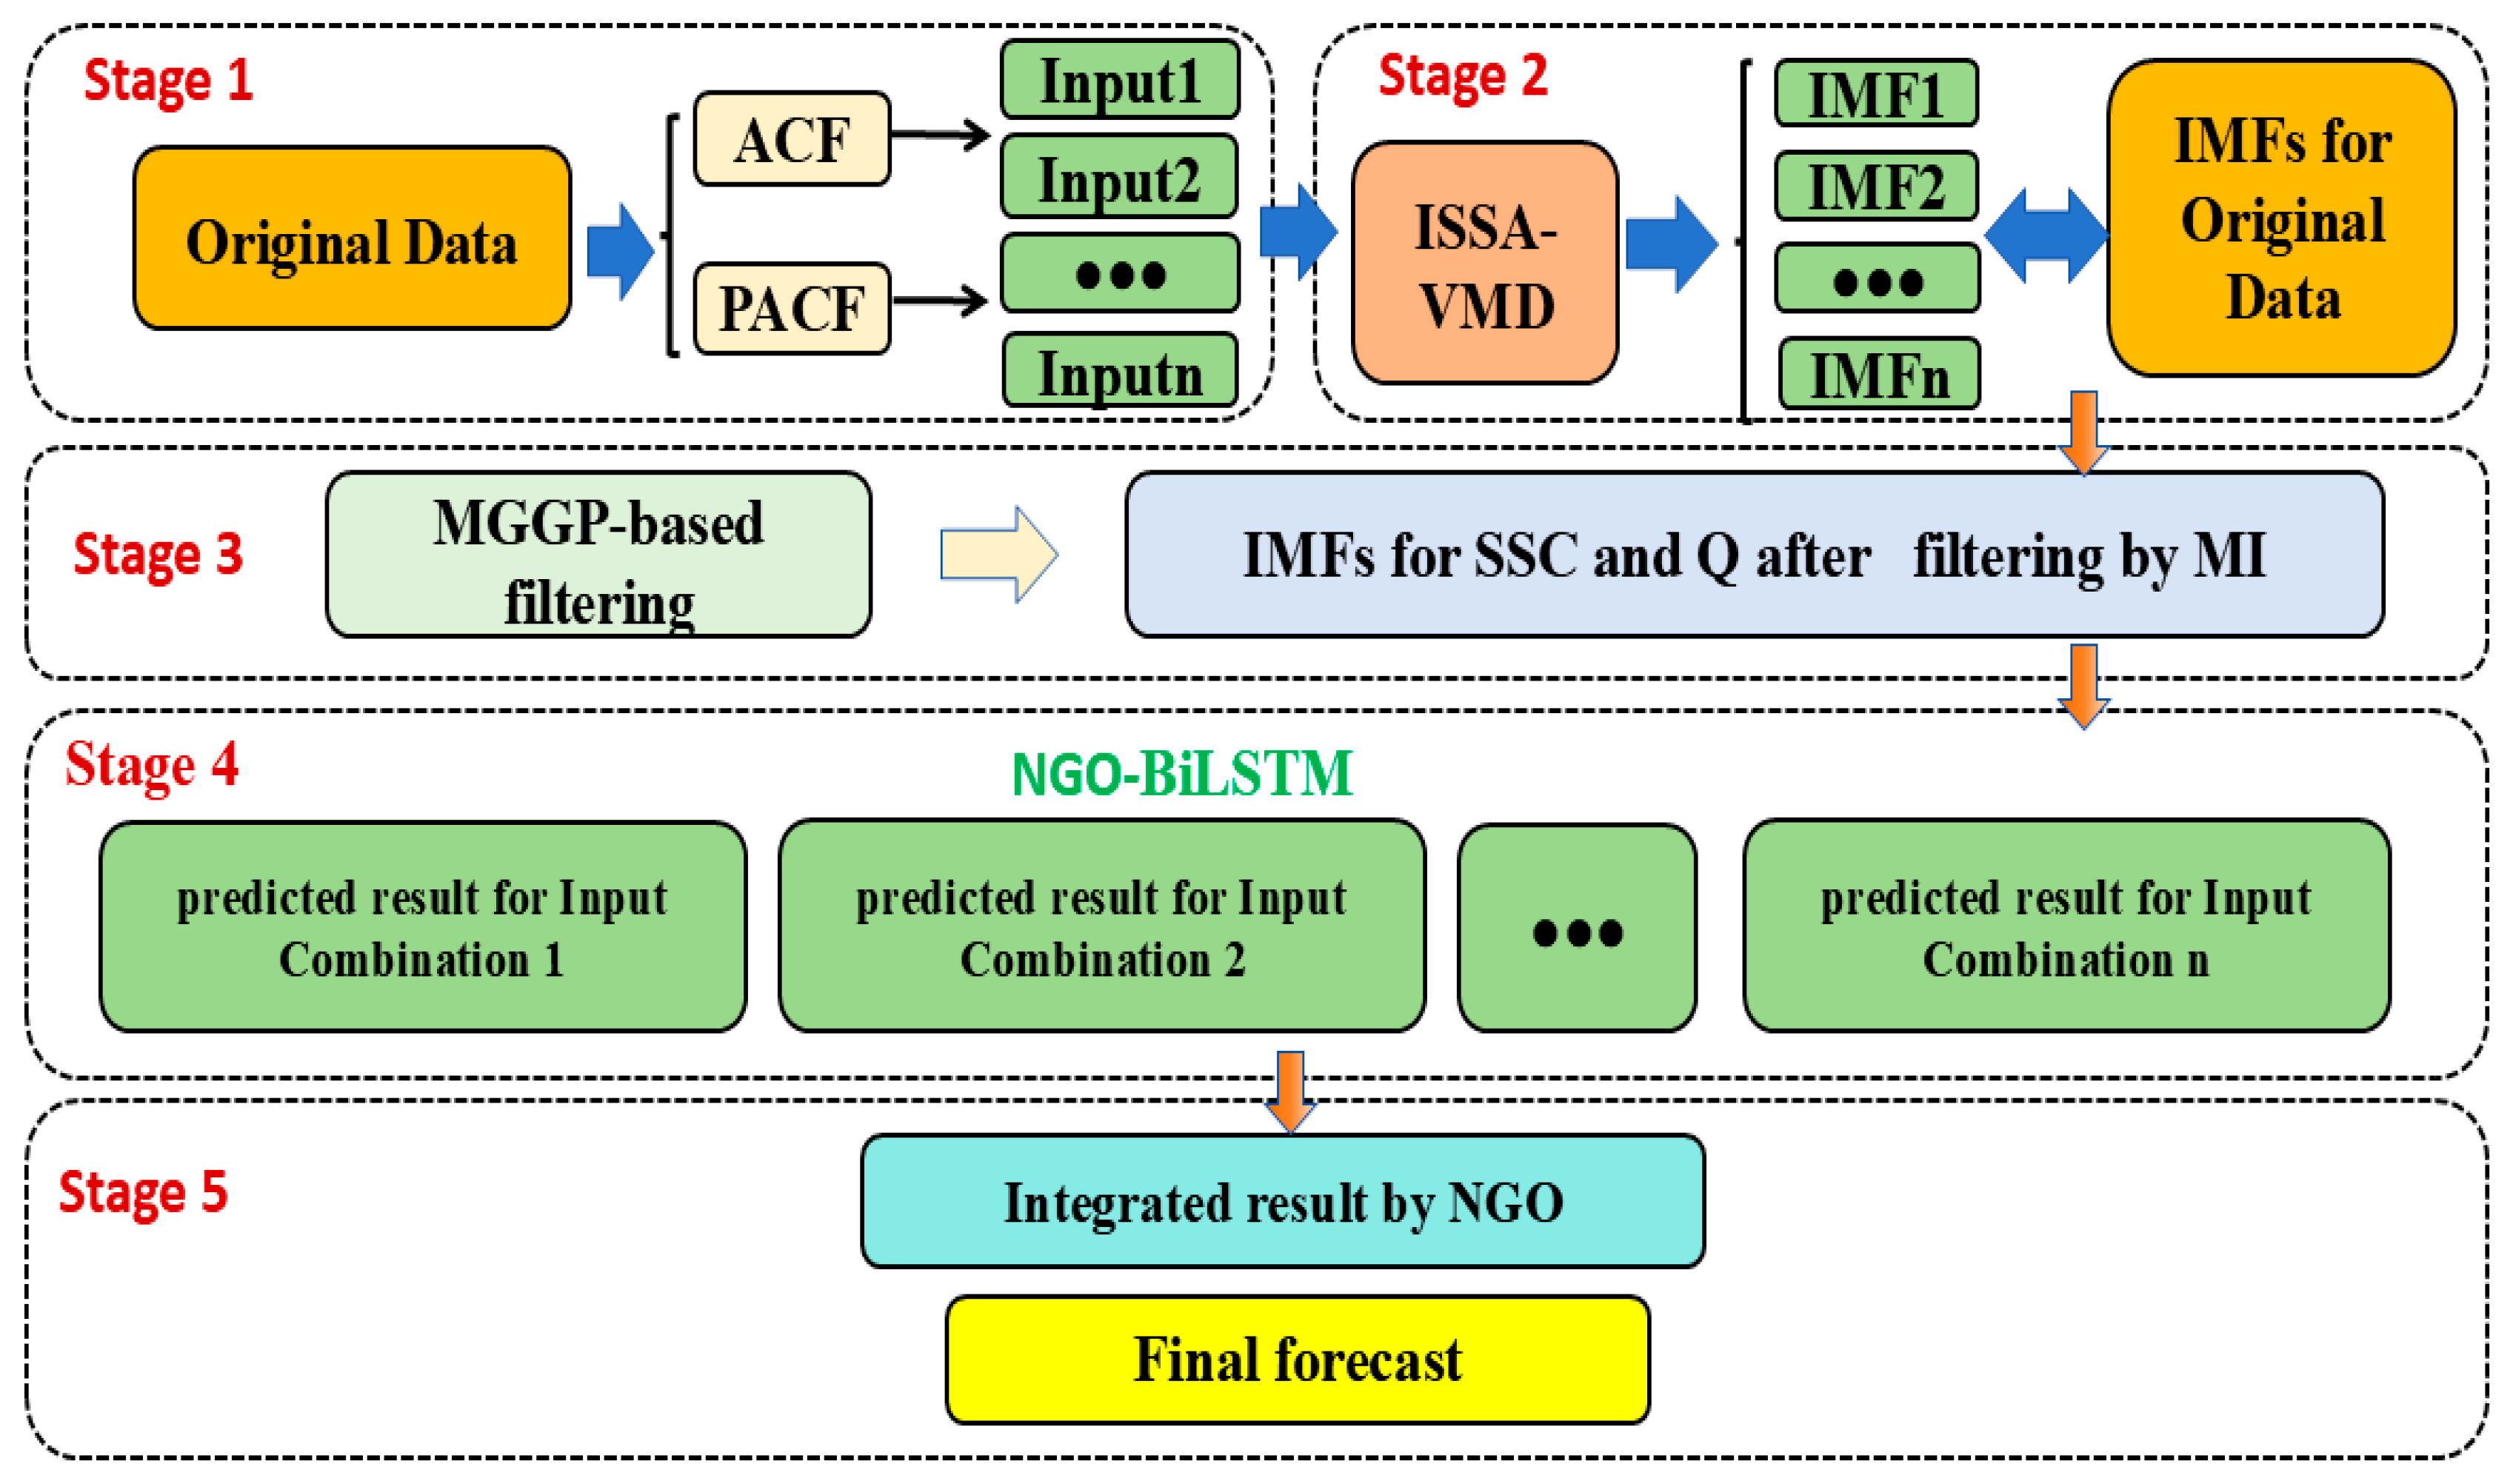
2.1. The Proposed Ensemble Model

This study proposes an integrated model that combines deep learning, ensemble learning, data preprocessing mechanisms, and optimization algorithms. The marching process of this model is illustrated in Figure 1, and it can be summarized into five stages.
Stage One: As a complementary method to the sliding window approach, the ACF and PACF analysis techniques are employed to select appropriate input vectors based on their correlation and partial correlation. This step facilitates the subsequent decomposition process.
Stage Two: Using VMD, the input signal is broken down into several intrinsic mode functions (IMFs), which are numbered IMF1 through IMFn. After VMD, complicated time–series signals can be reduced to a set of physically interpretable intrinsic modal components. In addition, the effectiveness of VMD is greatly influenced by important parameters, such as the penalty factor and the number of modes, which are crucial in deciding the decomposition quality and optimized by the NGO in this study.
Stage Three: After the previous decomposition step, each input vector is decomposed into a different number of sub-vectors. However, not all sub-vectors contribute positively to the prediction results. Therefore, the multi-gene genetic programming (MGGP) technique is employed to filter out redundant sub-vectors in this stage.
Stage Four: Different input vectors are decomposed by VMD and filtered by MGGP to obtain sub-signals, which are then separately fed into a deep learning model, BiLSTM (Bidirectional Long Short-Term Memory), for training. The hyper-parameters of BiLSTM are optimized and determined through the NGO algorithm to achieve the best performance, ultimately yielding the predicted results for each input vector. The mathematical theories of the BiLSTM network and NGO algorithm are defined in Section 2.4 and Section 2.5, respectively.
Stage Five: The predicted results for each vector obtained after the above step are used as new input components whose weights are optimized by the NGO for final integration. This process results in the final outcome after the ensemble.

2.2. Variational Mode Decomposition(VMD)

VMD is a non-recursive and adaptive signal decomposition technique proposed by Dragomiretskiy and Zosso (2013) [48]. Unlike traditional empirical mode decomposition (EMD), VMD formulates the decomposition process as a constrained variational problem, aiming to extract a fixed number of intrinsic mode functions (IMFs) with specific center frequencies. This method is particularly effective for handling nonlinear and non-stationary signals, making it well suited for hydrological time series analysis. In this study, VMD is employed as a preprocessing step to decompose the original SSC signal into several well-separated sub-signals with distinct frequency bands.
VMD decomposes f(t) into K intrinsic mode functions (IMFs) as follows:
min μ k , ω k k t δ ( t ) + j π t μ k ( t ) e j ω k t 2 2 s . t . k μ k = f
In the equation, t , δ t , μ k , and ω k represent the partial derivative of t, the impulse function, the k-th mode function, and central frequency, respectively.
Following, quadratic penalty factor α and Lagrange multiplier λ ( t ) are introduced to Equation (1). The transformed Lagrange expression is given by Equation (2):
L μ k , ω k , λ = α k t δ ( t ) + j π t μ k ( t ) e j ω k t 2 2 + f ( t ) k μ k ( t ) 2 2 + λ ( t ) , f ( t ) k μ k ( t )
In Equation (2), the update processes for μ k and ω k are given by Equations (3) and (4), respectively:
μ ^ k n + 1 ( ω ) = f ( ω ) i k μ i ( ω ) + λ ( ω ) / 2 1 + 2 α ( ω ω k ) 2
ω k n + 1 = 0 ω μ ^ k ( ω ) 2 d ω 0 μ ^ k ( ω ) 2 d ω

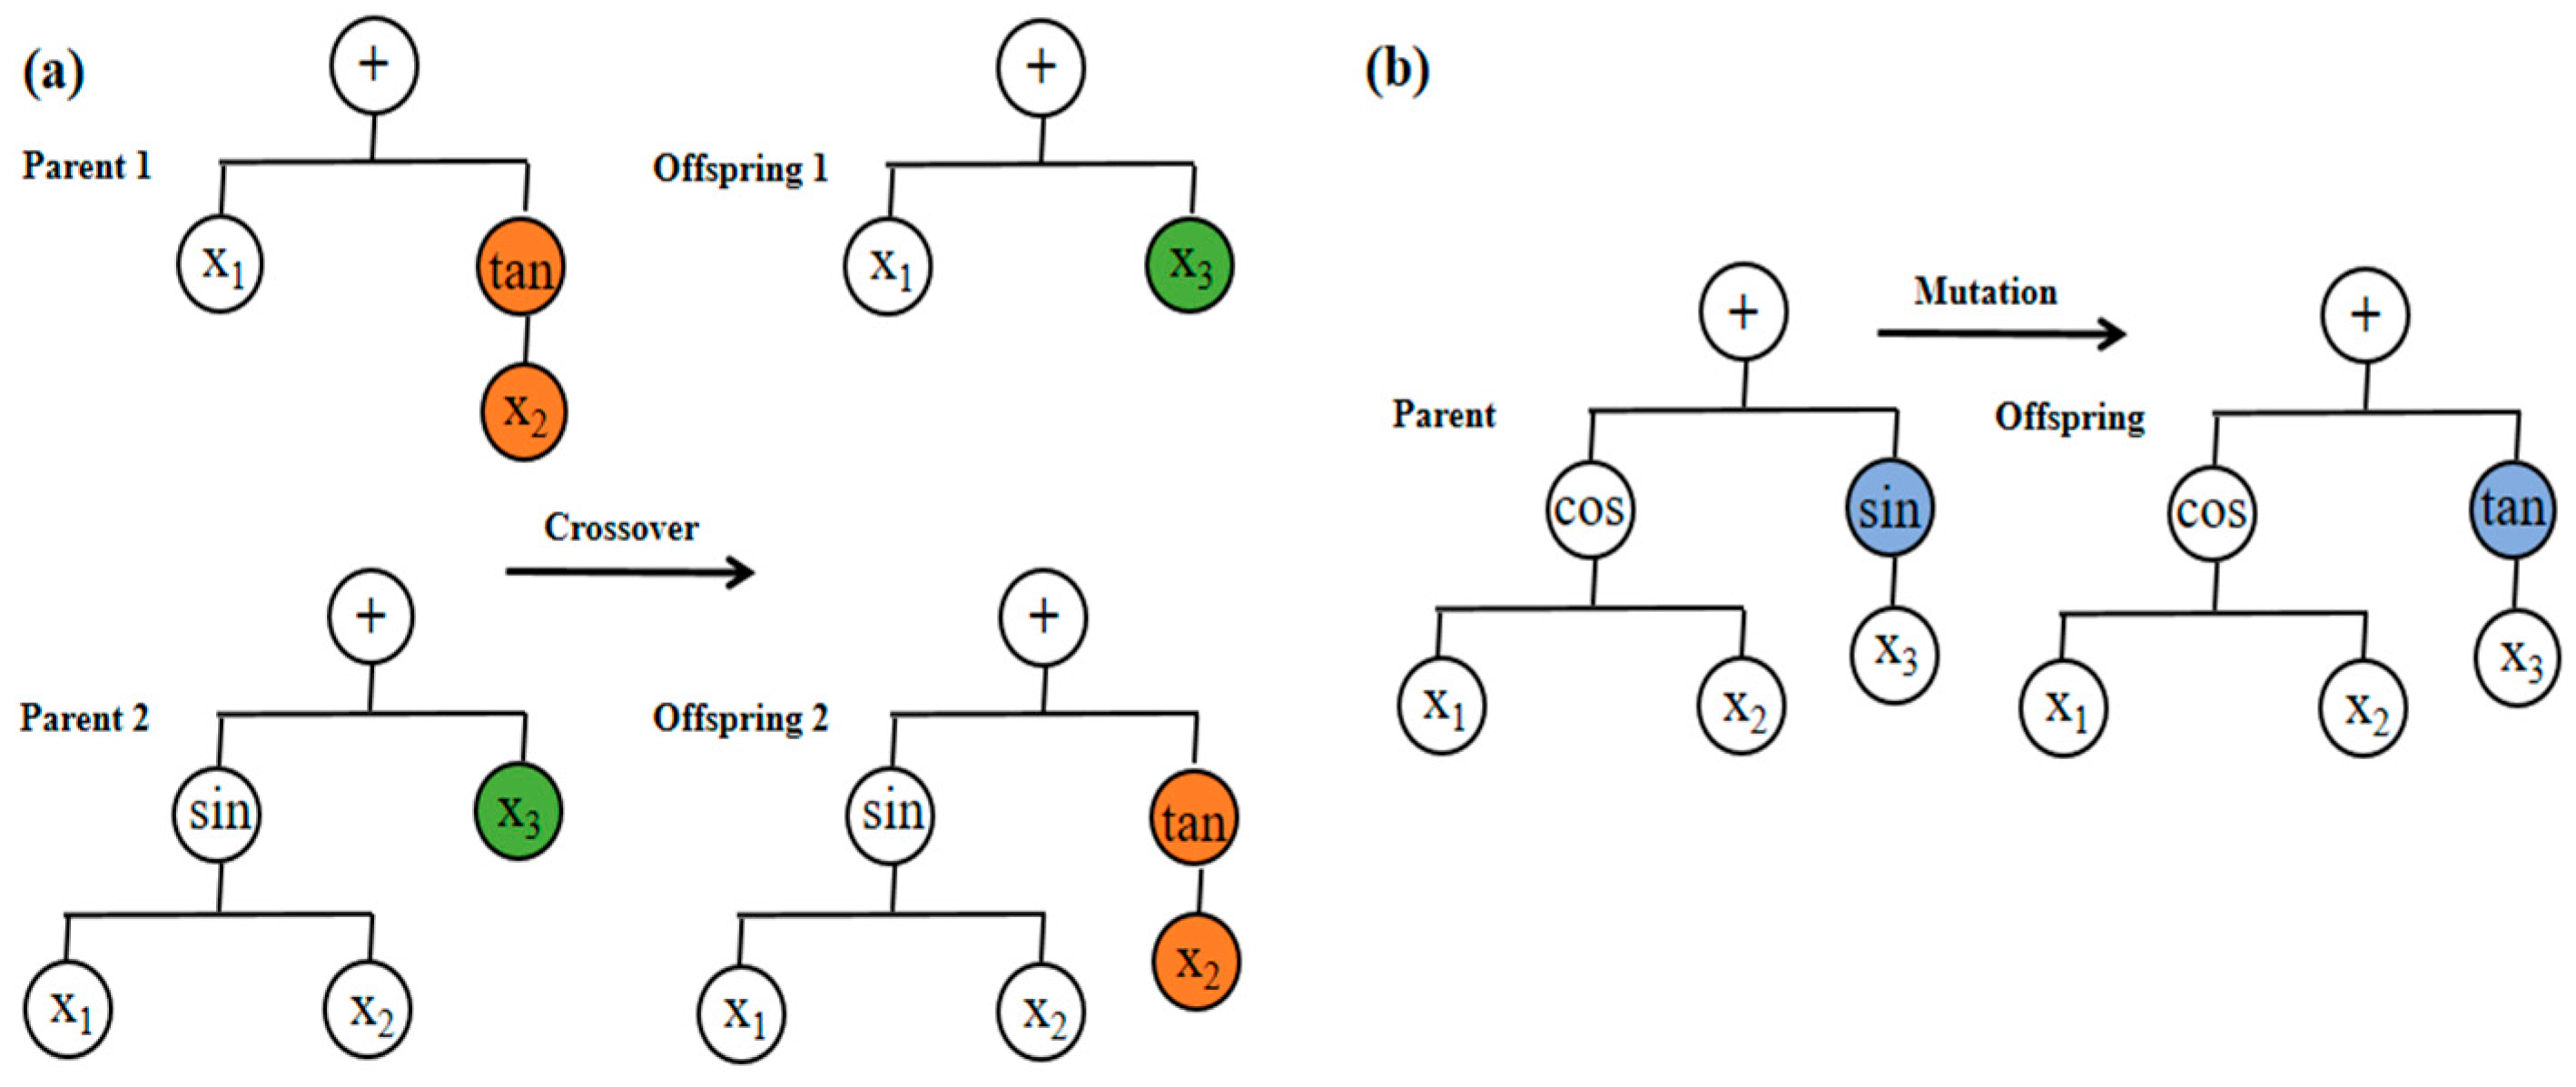
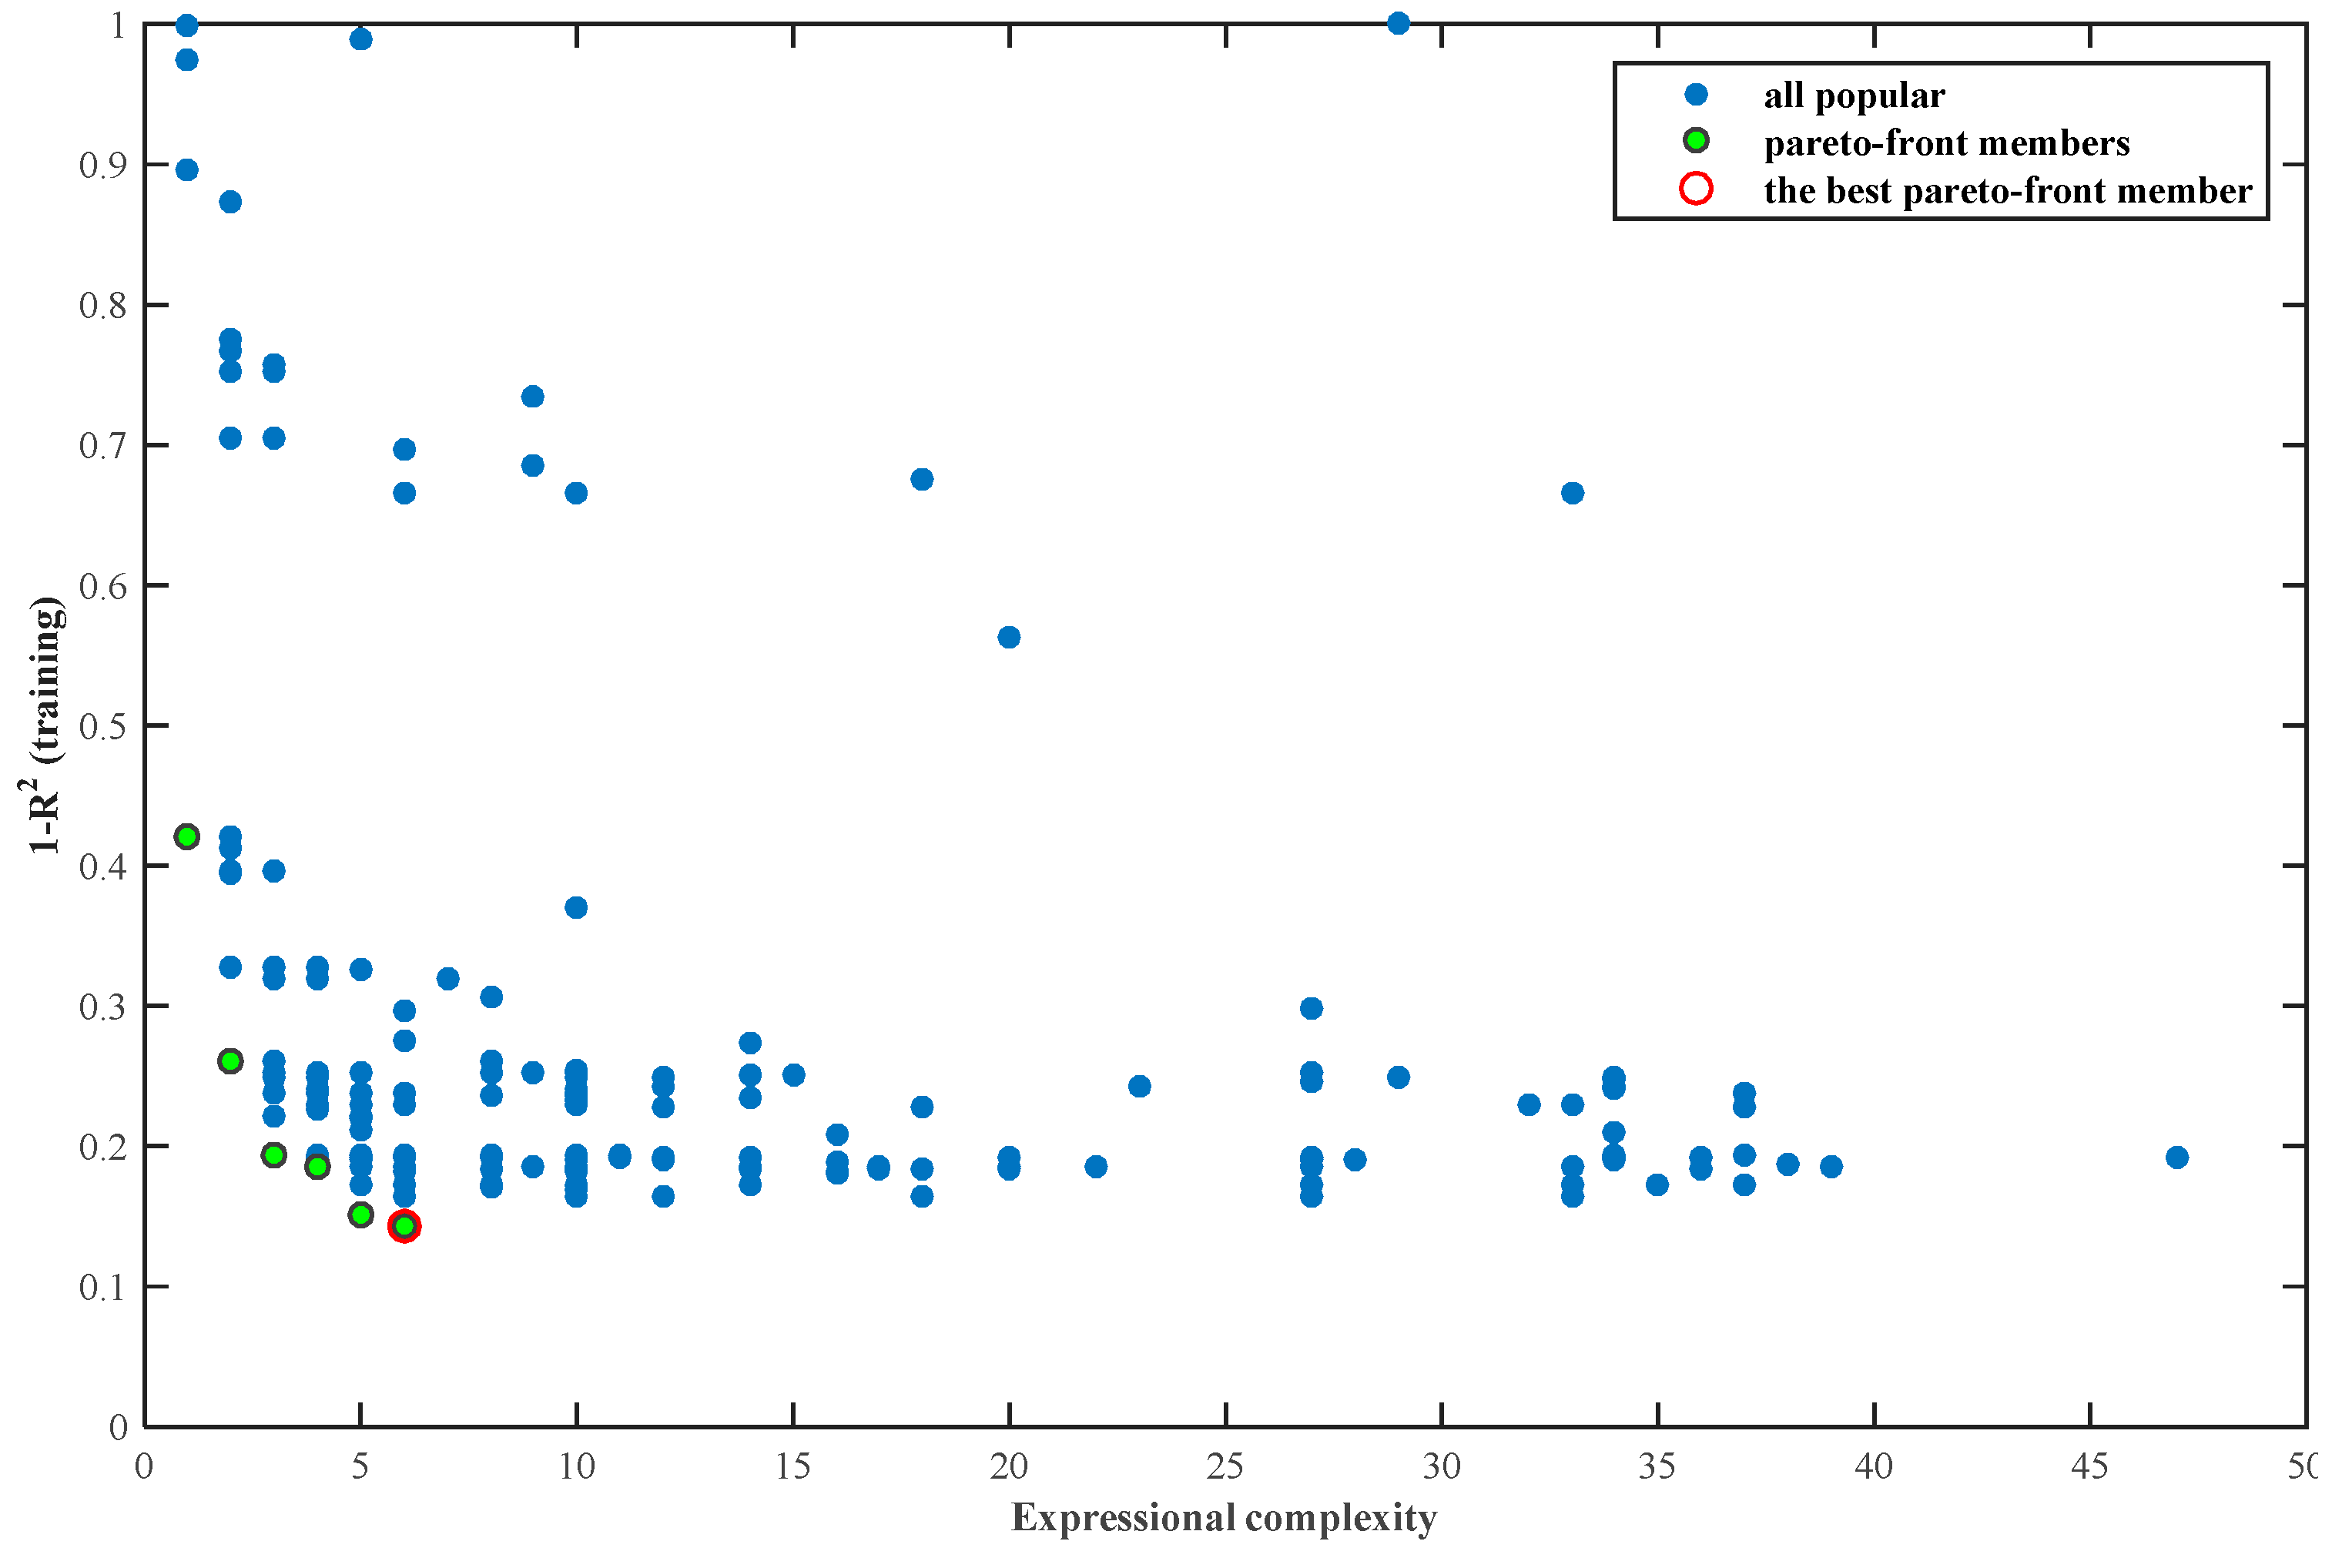
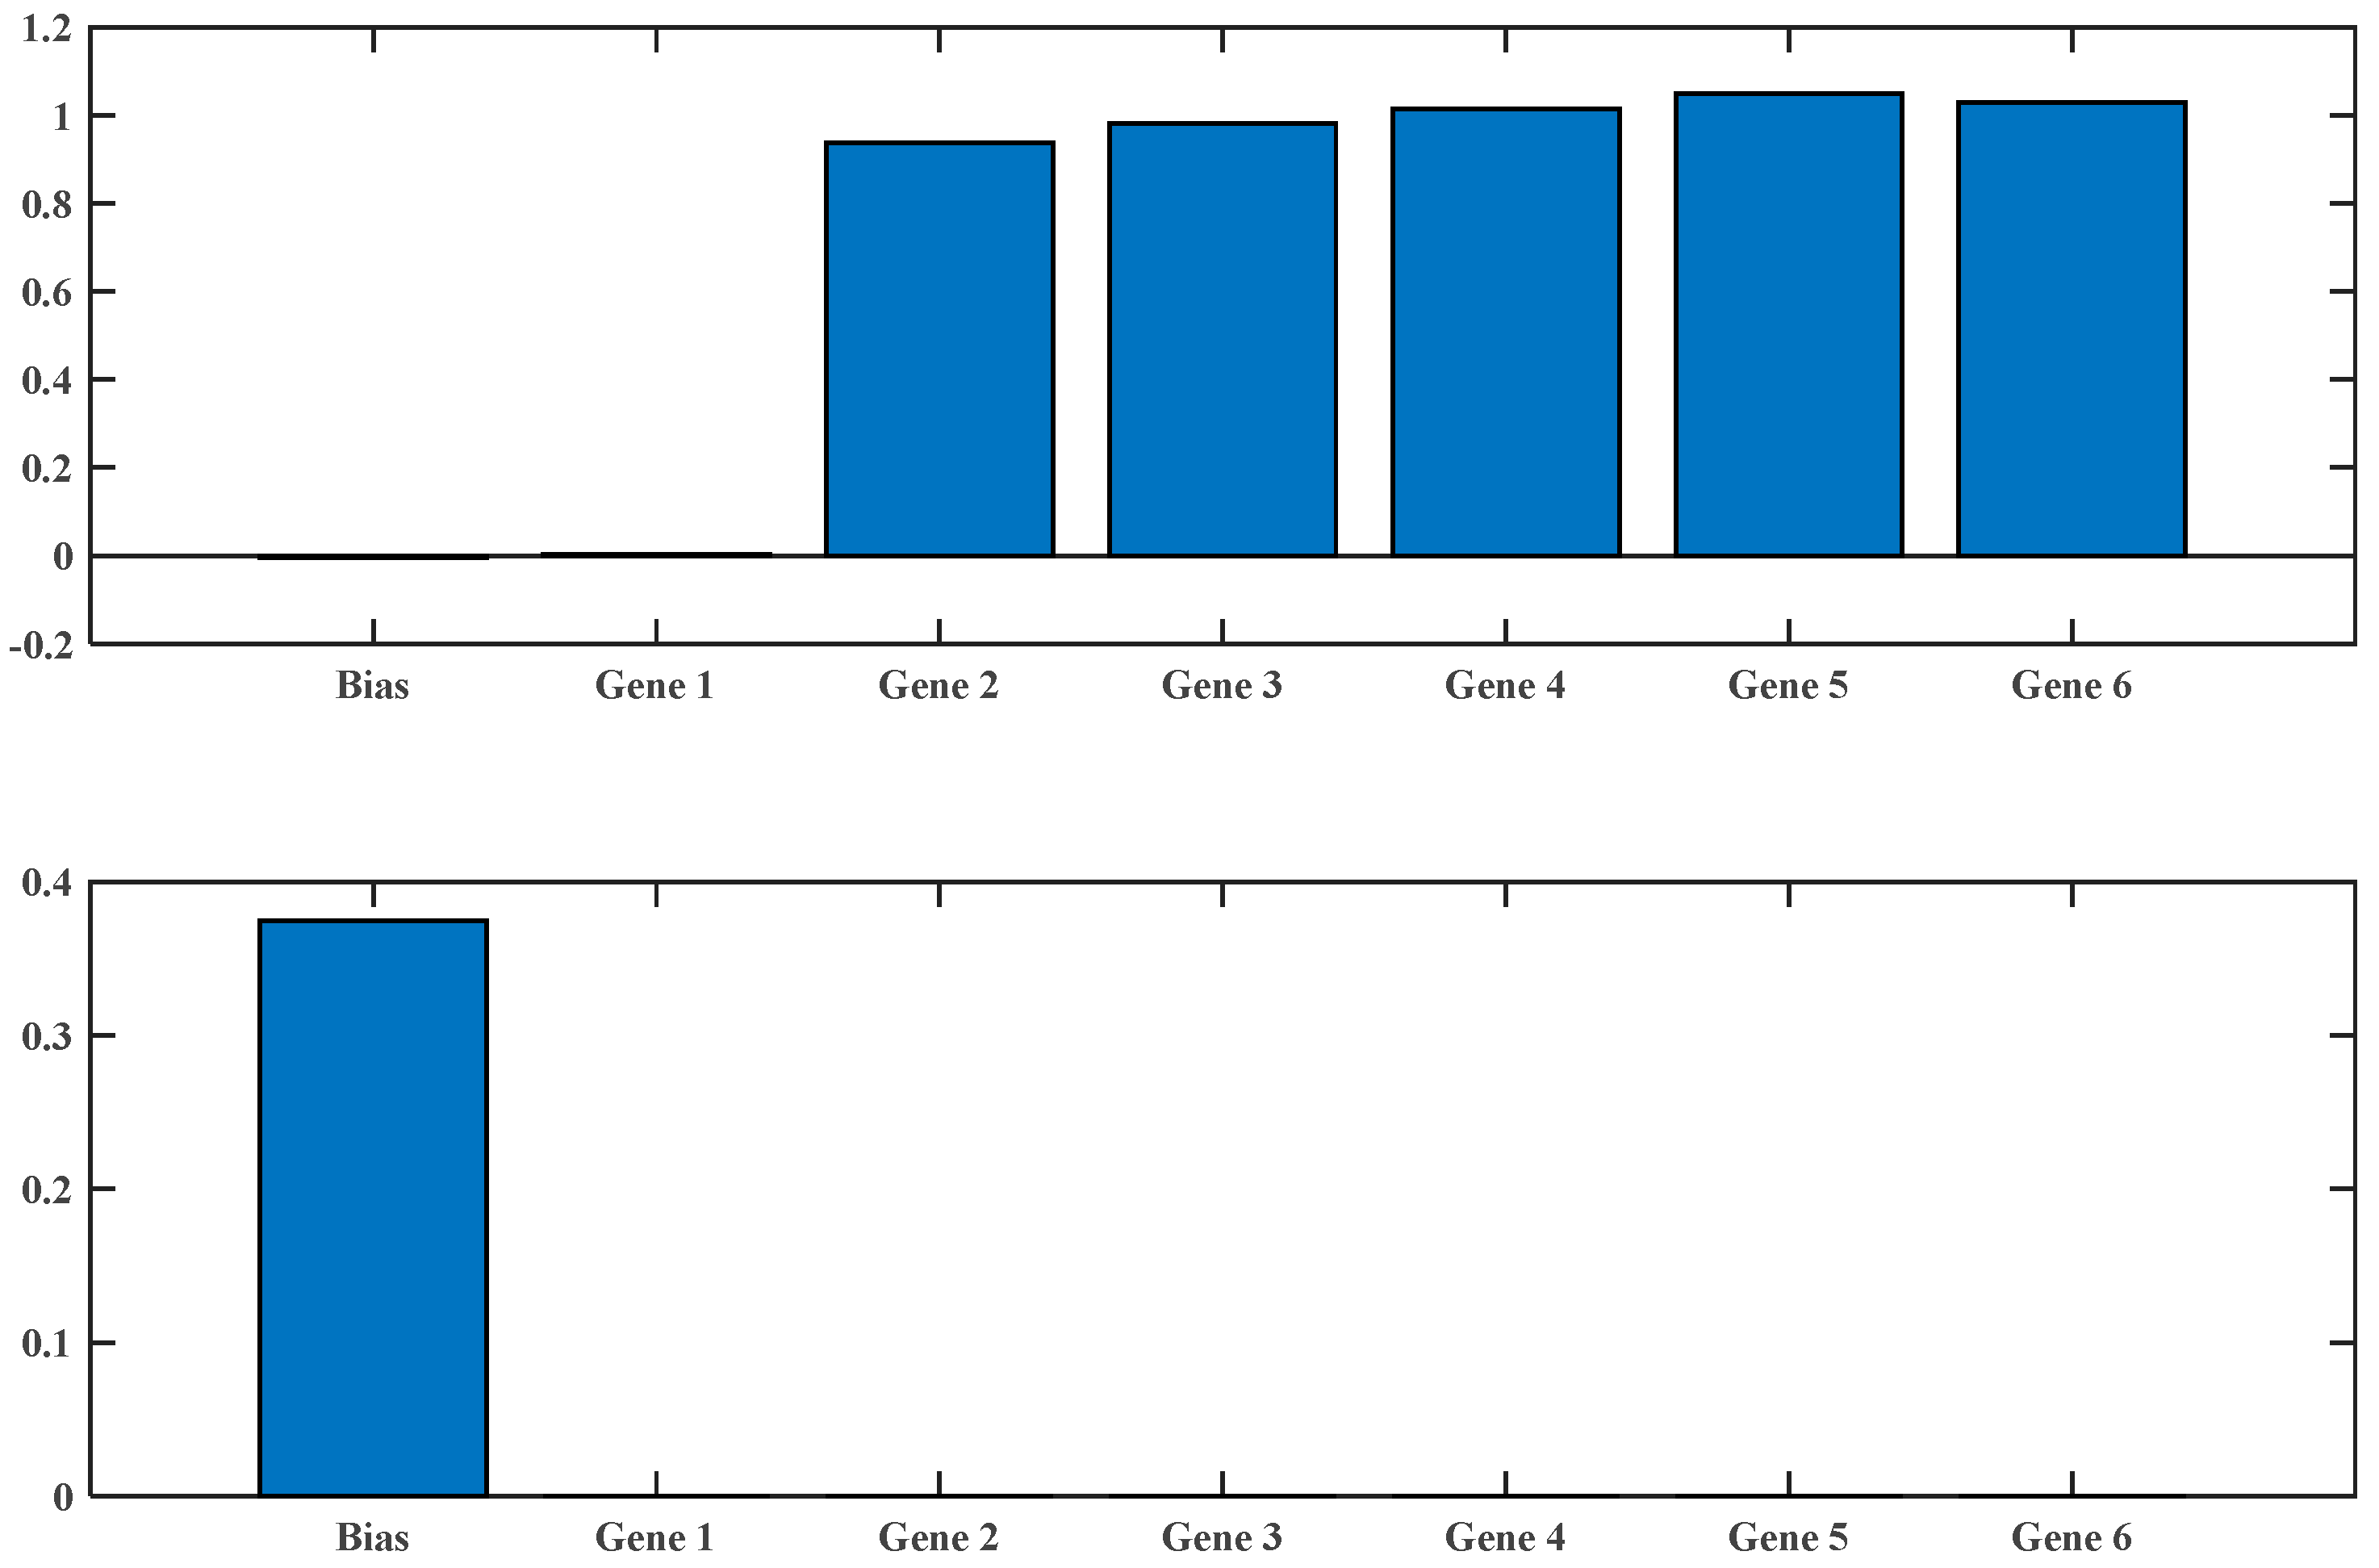
2.3. Multi-Gene Genetic Programming (MGGP)

MGGP was first formally introduced by Searson, Willis, and Montague (2010) through the open-source symbolic regression platform GPTIPS [61]. MGGP is a multi-objective genetic programming technique designed to address optimization problems involving multiple, often conflicting, objectives. In contrast to single-objective approaches, MGGP simultaneously seeks to enhance predictive performance and minimize model complexity, thereby identifying an optimal trade-off between accuracy and interpretability.
The algorithm operates by evolving a population of candidate solutions using genetic algorithms, where each solution consists of multiple genes represented as a linear combination of basis functions. These candidate solutions are evaluated based on their performance across multiple objectives and ranked using non-dominated sorting to determine their location on the Pareto front—a set of optimal solutions for which no other solutions perform better across all objectives. Within this framework, no single solution dominates the others entirely, and each offers a unique balance of trade-offs.
MGGP employs this Pareto-based strategy to guide the search process, prioritizing solutions that achieve high predictive accuracy with minimal structural complexity. By adjusting the weights and structure of individual genes, MGGP is capable of exploring a diverse solution space and generating interpretable models that generalize well. In summary, MGGP is a robust and flexible multi-objective optimization framework that combines evolutionary computation with symbolic regression to derive optimal predictive models under competing objectives.
The MGGP algorithm represents individual genes using a tree-based structure (Figure 2) [25]. During the evolutionary process, reproduction in MGGP is achieved through genetic operations such as crossover and mutation. In the crossover operation, subtrees (branches) from two parent genes can be exchanged to create new offspring, as illustrated in Figure 2a. In the mutation process, internal nodes or sub-branches within a gene tree are randomly replaced by alternative structures or values, as shown in Figure 2b. These mechanisms ensure population diversity and facilitate the exploration of the solution space during the optimization process.

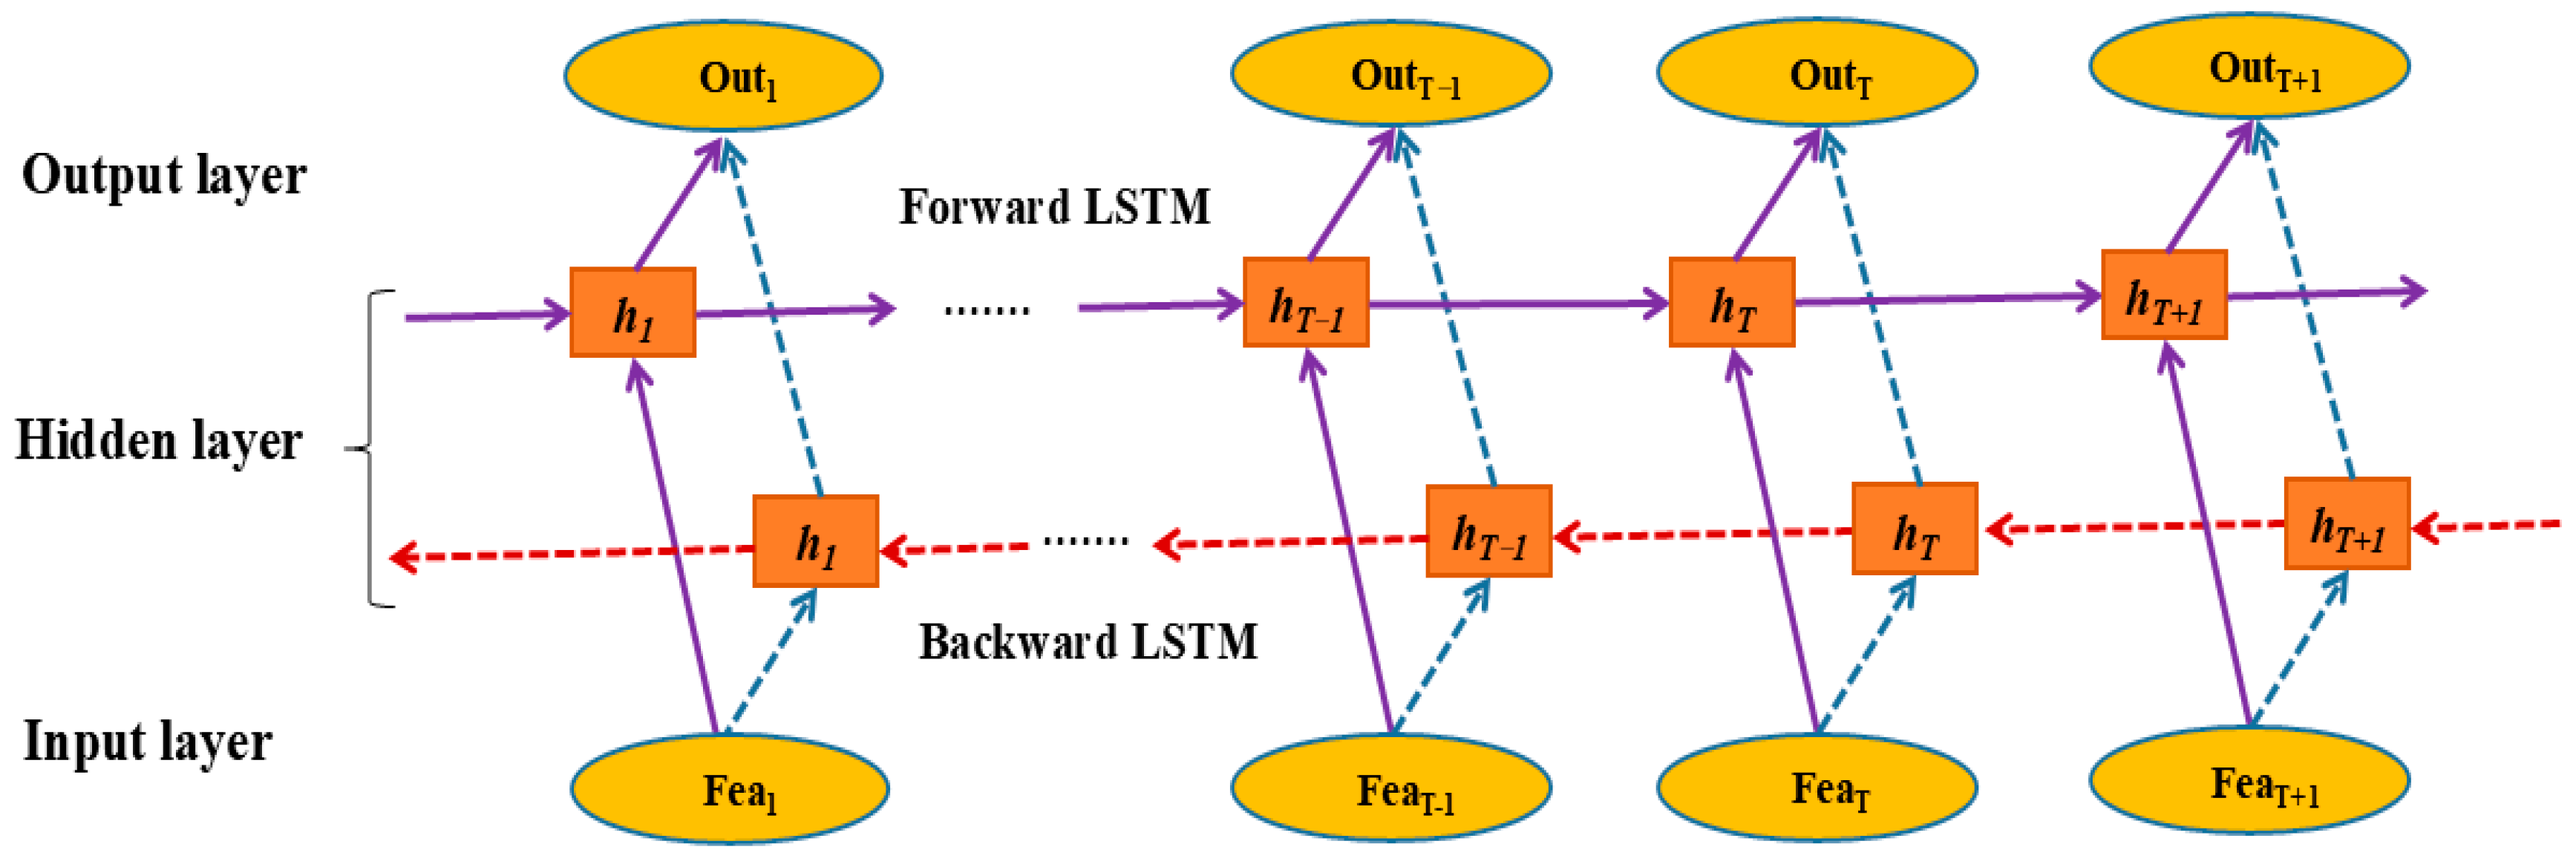
2.4. Bidirectional Long Short-Term Memory (BILSTM)

Traditional recurrent neural networks (RNNs) struggle to capture long-term dependencies due to vanishing or exploding gradients when processing sequential data [62]. To overcome this, Long Short-Term Memory (LSTM) networks were introduced, featuring a gating mechanism that controls information flow. Each LSTM unit includes an input gate, forget gate, and output gate [63], enabling the model to selectively retain or discard information. These gates allow LSTM to model both short- and long-term dependencies effectively, making it suitable for time series prediction and other sequential tasks.
However, traditional LSTM networks only consider past contextual information while neglecting future context, which limits their effectiveness in capturing full sequence dependencies. To overcome this limitation, Bidirectional Long Short-Term Memory (BiLSTM) networks were introduced. As illustrated in Figure 3 [28,29], a BiLSTM consists of two LSTM layers: a forward LSTM and a backward LSTM. The forward LSTM processes the input sequence in chronological order (from time step 1 to t), whereas the backward LSTM processes the same sequence in reverse order (from t to N, where N is the total length of the sequence). Each LSTM layer updates its hidden state at every time step based on the respective direction of processing. Although the forward and backward LSTMs share the same architecture, they operate independently and do not share parameters. At each time step t, the final output of the BiLSTM is obtained by concatenating the hidden states from both LSTMs, thereby integrating information from both the past and the future. This dual-context mechanism enables BiLSTM to construct richer and more informative representations of sequential data. By jointly considering the preceding and succeeding contexts, BiLSTM enhances the network’s ability to model long-range dependencies. Consequently, BiLSTM has been successfully applied to various sequence modeling tasks such as sequence labeling, speech recognition, and machine translation, demonstrating superior performance over unidirectional LSTM models.
In summary, BiLSTM tackles the challenge of capturing long-term dependencies in traditional RNNs by combining the hidden states from both the forward and backward LSTMs, effectively utilizing past and future context information in sequential data and enhancing the modeling capability of sequence tasks.

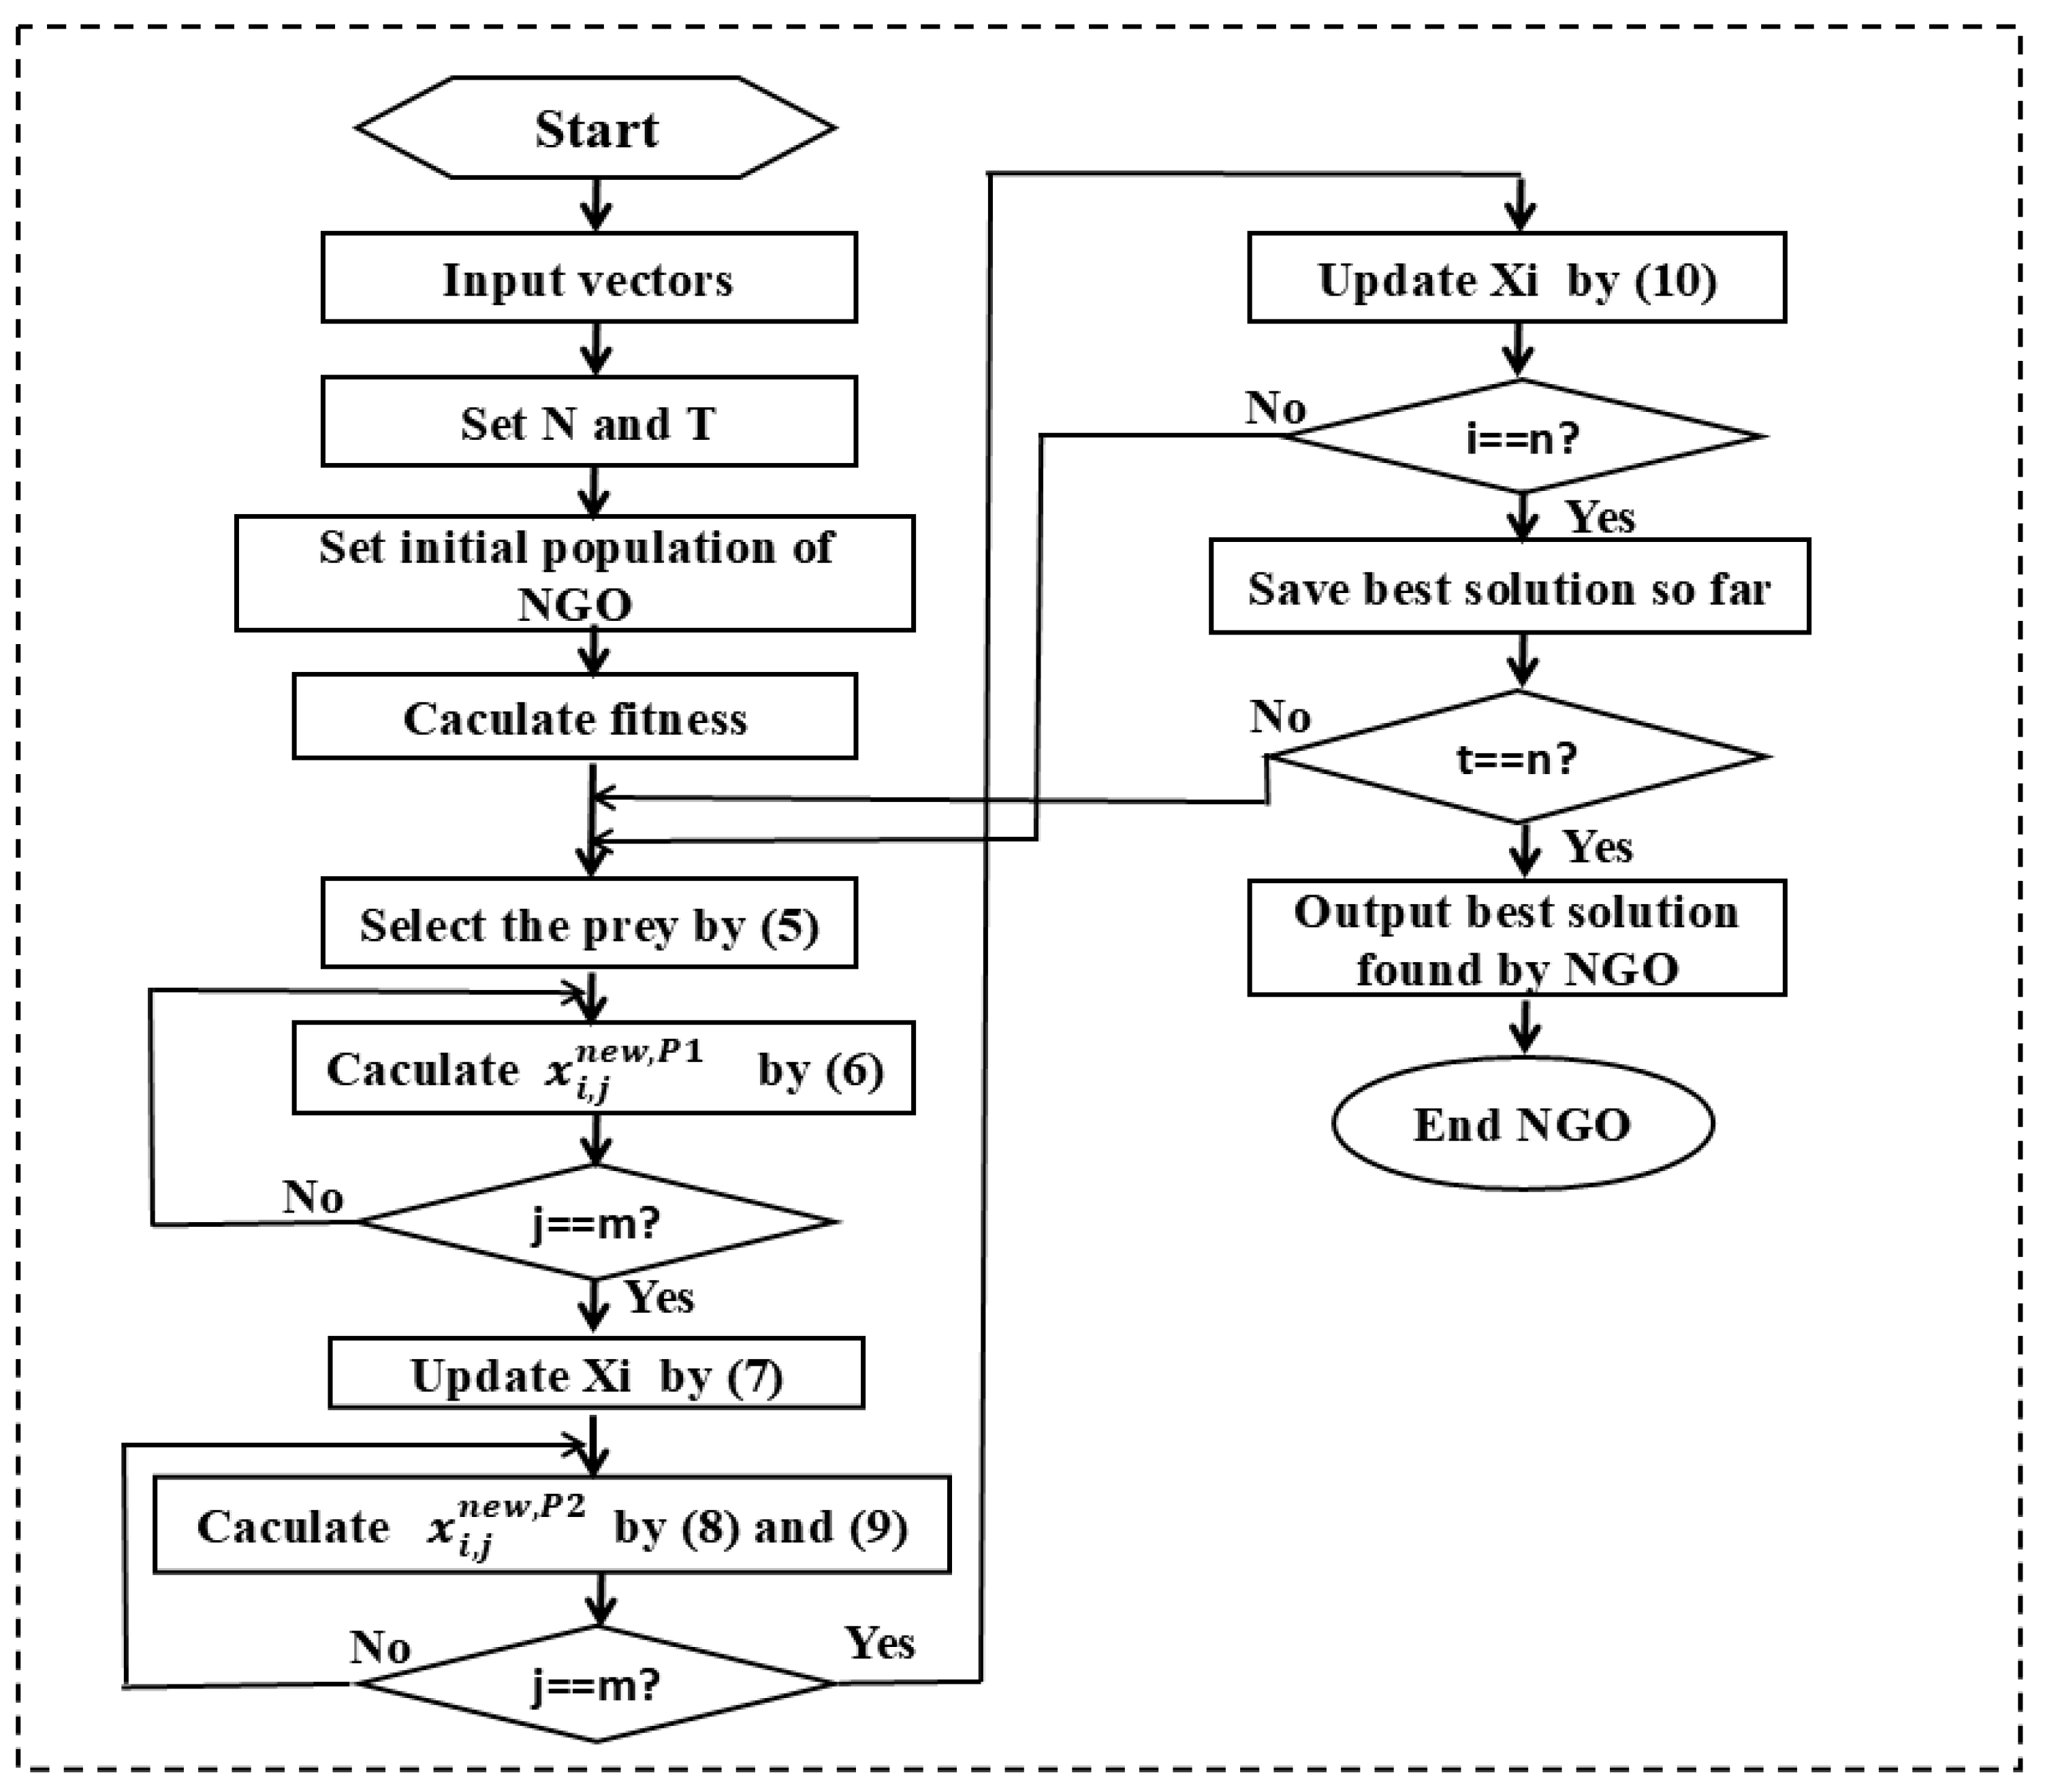
2.5. Northern Goshawk Optimization(NGO)

The NGO algorithm, proposed by Mohammad Dehghani (2021) [64], simulates the recognition and pursuit of prey by the Northern Goshawk. The algorithm consists of two phases during iteration: the prey recognition and pursuit phases. The mathematical model is as follows:
Phase 1: Prey Recognition Phase (Exploration Phase). In this phase, the Northern Goshawk exhibits random prey selection behavior to enhance exploration capability within the search space, aiming to identify the optimal region. The mathematical expression for this phase is as follows:
P i = X k , i = 1 , 2 , N , k = 1 , 2 , , i 1 , N
x i , j n e w , p 1 = x i , j + r ( p i , j I x i , j ) , F p i < F i x i , j + r ( x i , j p i , j ) , F p i F i
X i = X i n e w , p 1 , F i n e w , p 1 < F i X i , F i n e w , p 1 F i
where P i represents the position of the prey selected by the i-th Northern Goshawk. F P i is the objective function value, which means the fitness value, N is the length of the sample, and k is a random natural number belonging to the range [1, N]. x i n e w , p 1 represents the new state of the i-th Northern Goshawk, while x represents its new state in the j-th dimension. x i , j n e w , p 1 corresponds to the fitness value associated with it. r is a random number belonging to the range [0, 1]. The value of I can be either 1 or 2, and both are used to introduce random NGO behavior in the search and update process.
Phase 2: Pursuit Phase (Exploitation Phase). In the pursuit phase, after the Northern Goshawk attacks the prey, the prey attempts to escape. Assuming the hunting takes place at an attacking position with a radius of R, the mathematical expression for this phase is as follows:
x i , j n e w , p 2 = x i , j + R ( 2 r 1 ) x i , j
R = 0.02 1 t / T
X i = X i n e w , p 2 , F i n e w , p 2 F i X i 2 , F i n e w , p 2 F i
where t represents the current iteration count, T denotes the maximum number of iterations. x i n e w , p 2 represents the new state of the i-th Northern Goshawk in the second hunting phase. x i , j n e w , p 2 represents the new state of the i-th Northern Goshawk in the j-th dimension during the second hunting phase. F i n e w , p 2 corresponds to the fitness value in the new state. Based on the two optimization steps described above, the NGO algorithm iteratively searches for the optimal solution to the problem, as illustrated in Figure 4.

2.6. Performance Evaluation Criteria
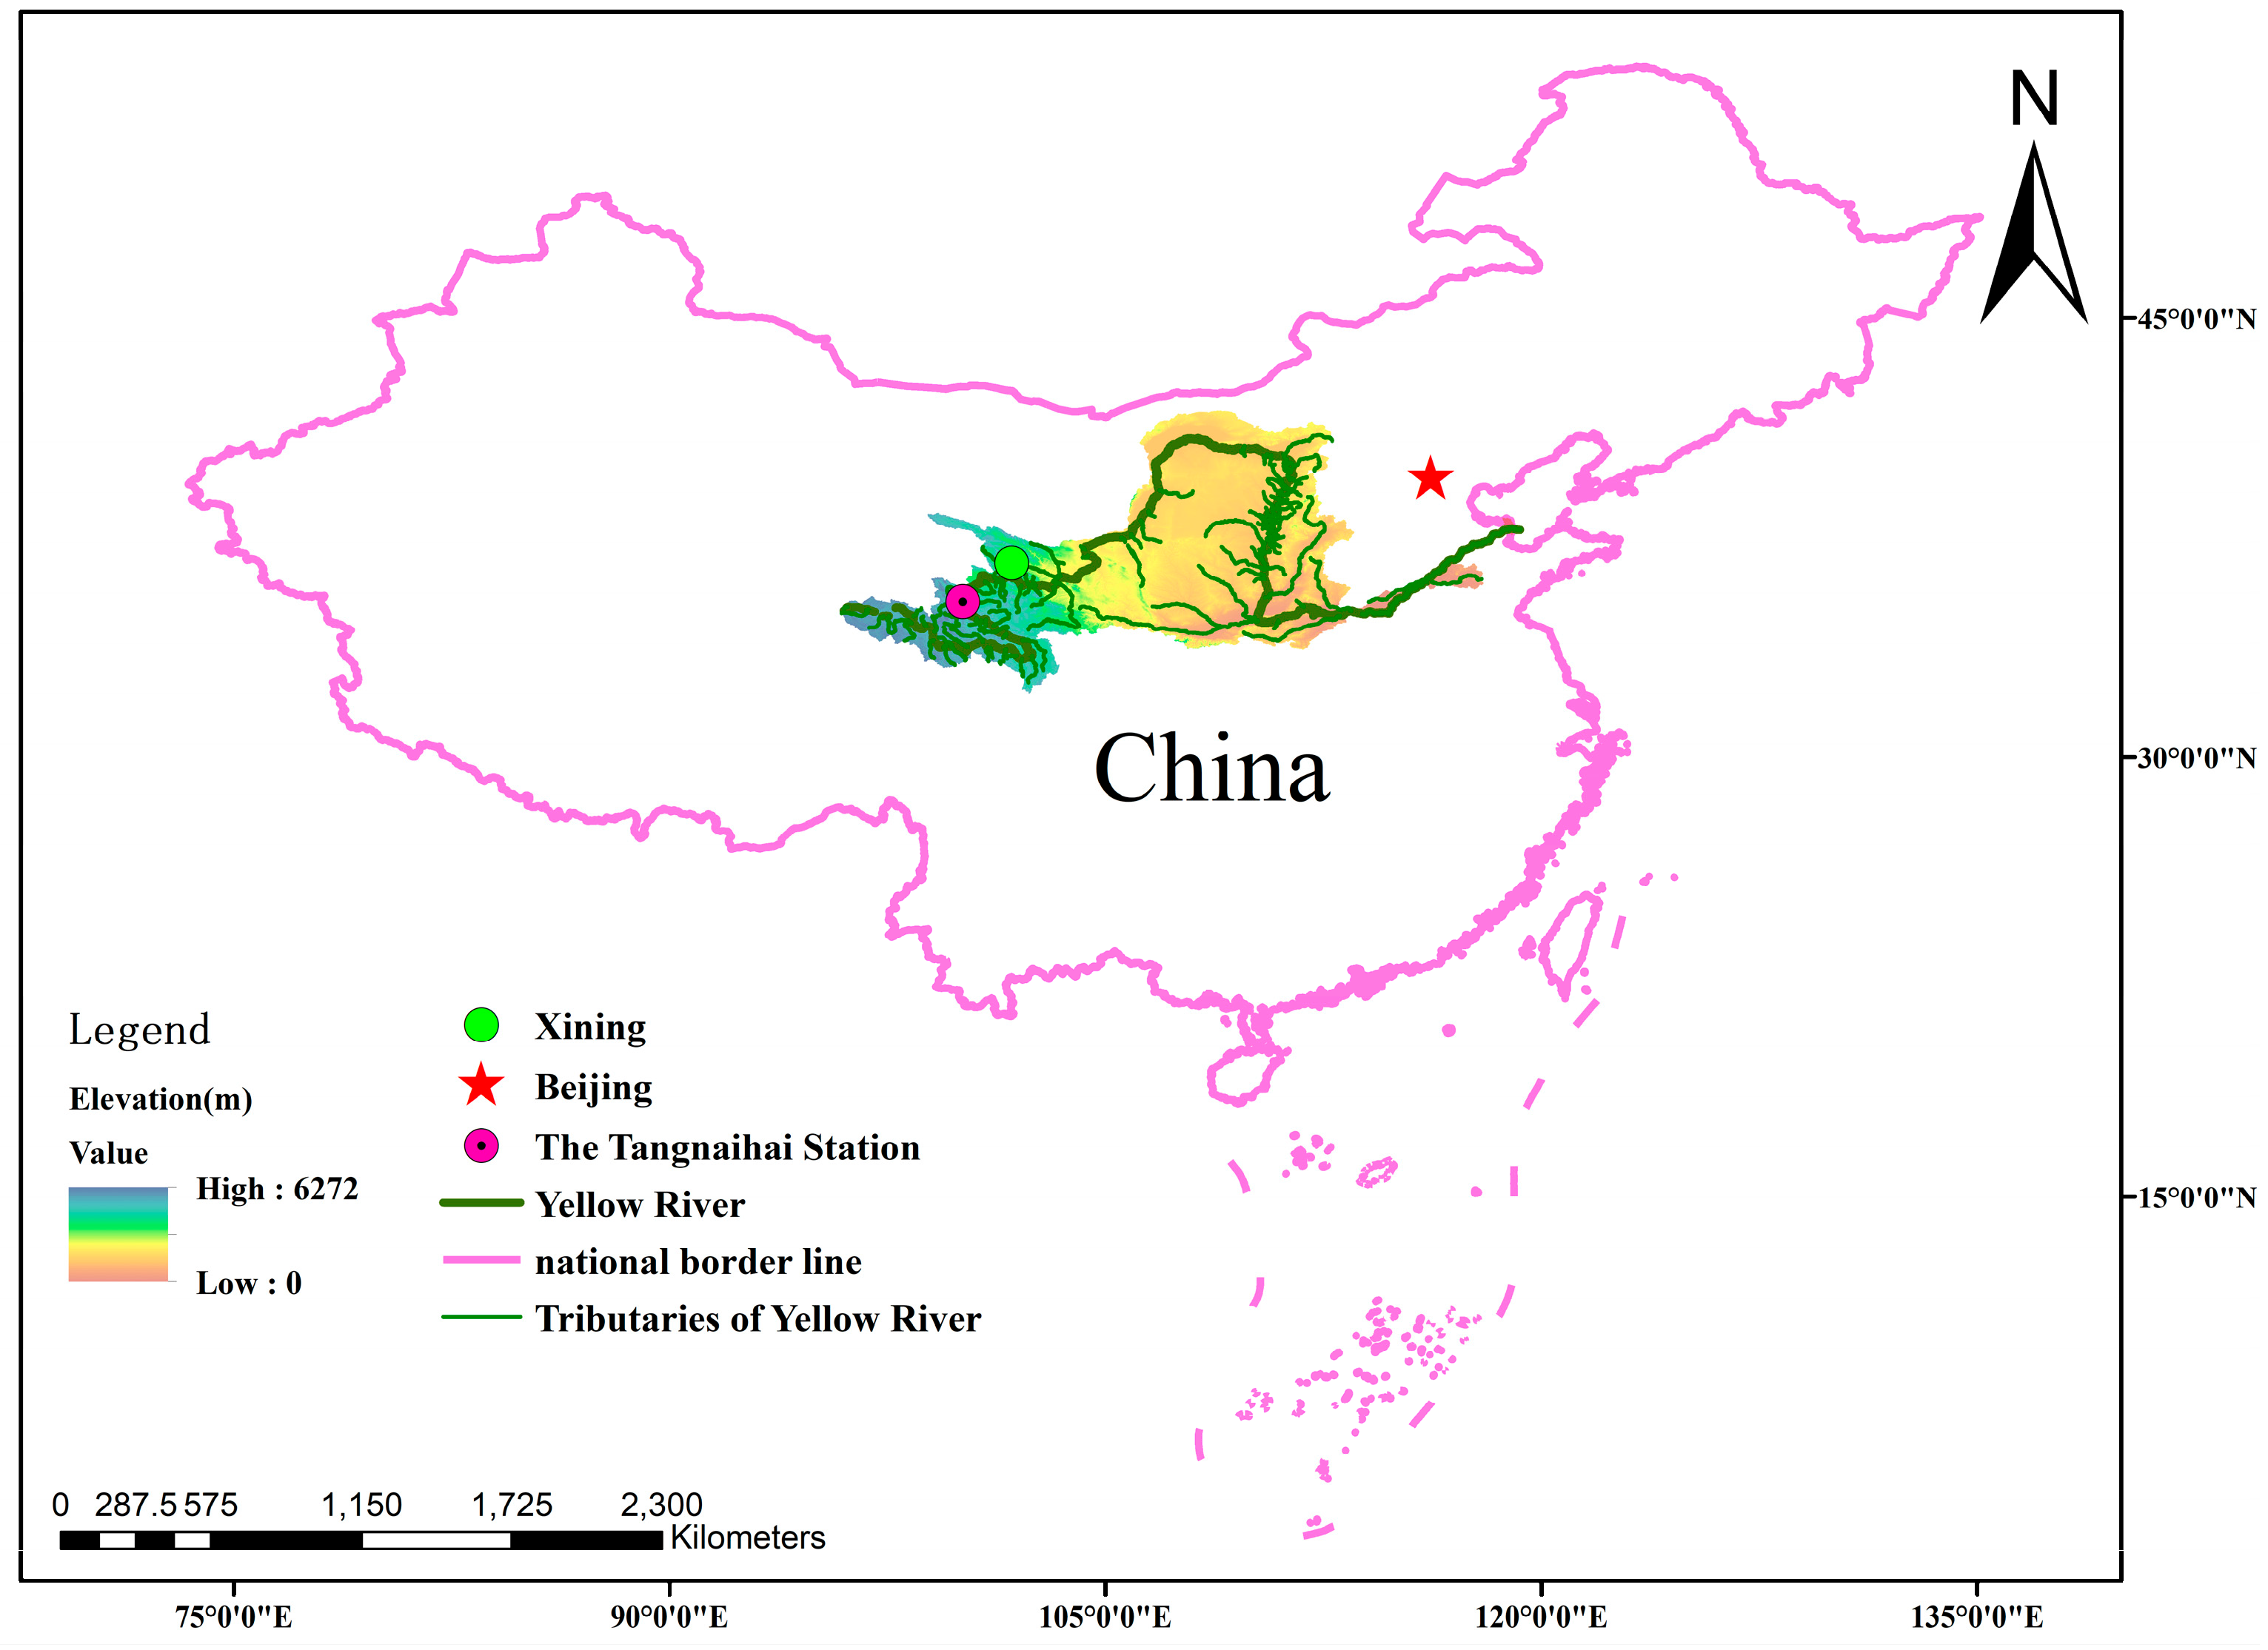
All evaluation metrics of the prediction models include the coefficient of determination (R2), Nash-Sutcliffe coefficient (NSC), root mean square error (RMSE) and mean absolute error (MAE). The R2, NSC, RMSE, and MAE value is defined by the following equation:
R 2 = i = 1 N ( O i O ¯ ) ( P i P ¯ ) i = 1 N ( O i O ¯ ) 2 i = 1 N ( P i P ¯ ) 2 2
N S C = 1 i = 1 N ( O i P i ) 2 i = 1 N ( O i O ¯ ) 2
R M S E = i = 1 N ( O i P i ) 2 N
M A E = 1 N I = 1 N ( O i P i )
where O i and P i are the i-th observed and predicted values, O ¯ and P ¯ are the average observed and predicted values of all samples, respectively. In general, if NSC and R2 are greater than 0.75, the result is reasonable [65].

3. Research Area

The Tangnaihai Hydrological Station (35°30′50″ N, 100°09′38″ E) is a critical national-level monitoring site located in the upper reaches of the Yellow River, China (Figure 5). Positioned strategically along the river’s mainstream, it serves as a key control point for observing the natural inflow into the main stream of the Yellow River. Since its establishment in 1955, the station has continuously recorded daily hydrological parameters, including streamflow and SSC, making it one of the most historically complete and scientifically valuable data sources in the basin.
The station is equipped with high-precision instruments, which are routinely calibrated and maintained to ensure data accuracy and reliability. It monitors a range of variables such as precipitation, water level, discharge, and sediment load. These data play an essential role in multiple domains, including water resource management, flood forecasting, sediment control, ecological restoration, and hydrological modeling.
Notably, the Tangnaihai Station is relatively less affected by human interventions such as large-scale reservoir operations and water-sediment regulation projects, which makes it an ideal site for studying the natural dynamics of flow and sediment transport. The stable hydrological environment and long-term monitoring records provide an excellent foundation for developing and validating data-driven predictive models of SSC. As such, the station was selected as the focal point for this study’s modeling experiments.
Daily observations from 1977 to 1983 at the Tangnaihai Hydrological Station were used for model training, with data from 1983 specifically allocated for validation. The remaining dataset, spanning from 1984 to 1986, was reserved for testing purposes. The statistical characteristics of the employed dataset are summarized in Table 1, including the coefficient of variation (Cv), standard deviation (SD), and skewness coefficient (Csx), which collectively describe the variability and distributional properties of the data series.

4. Results

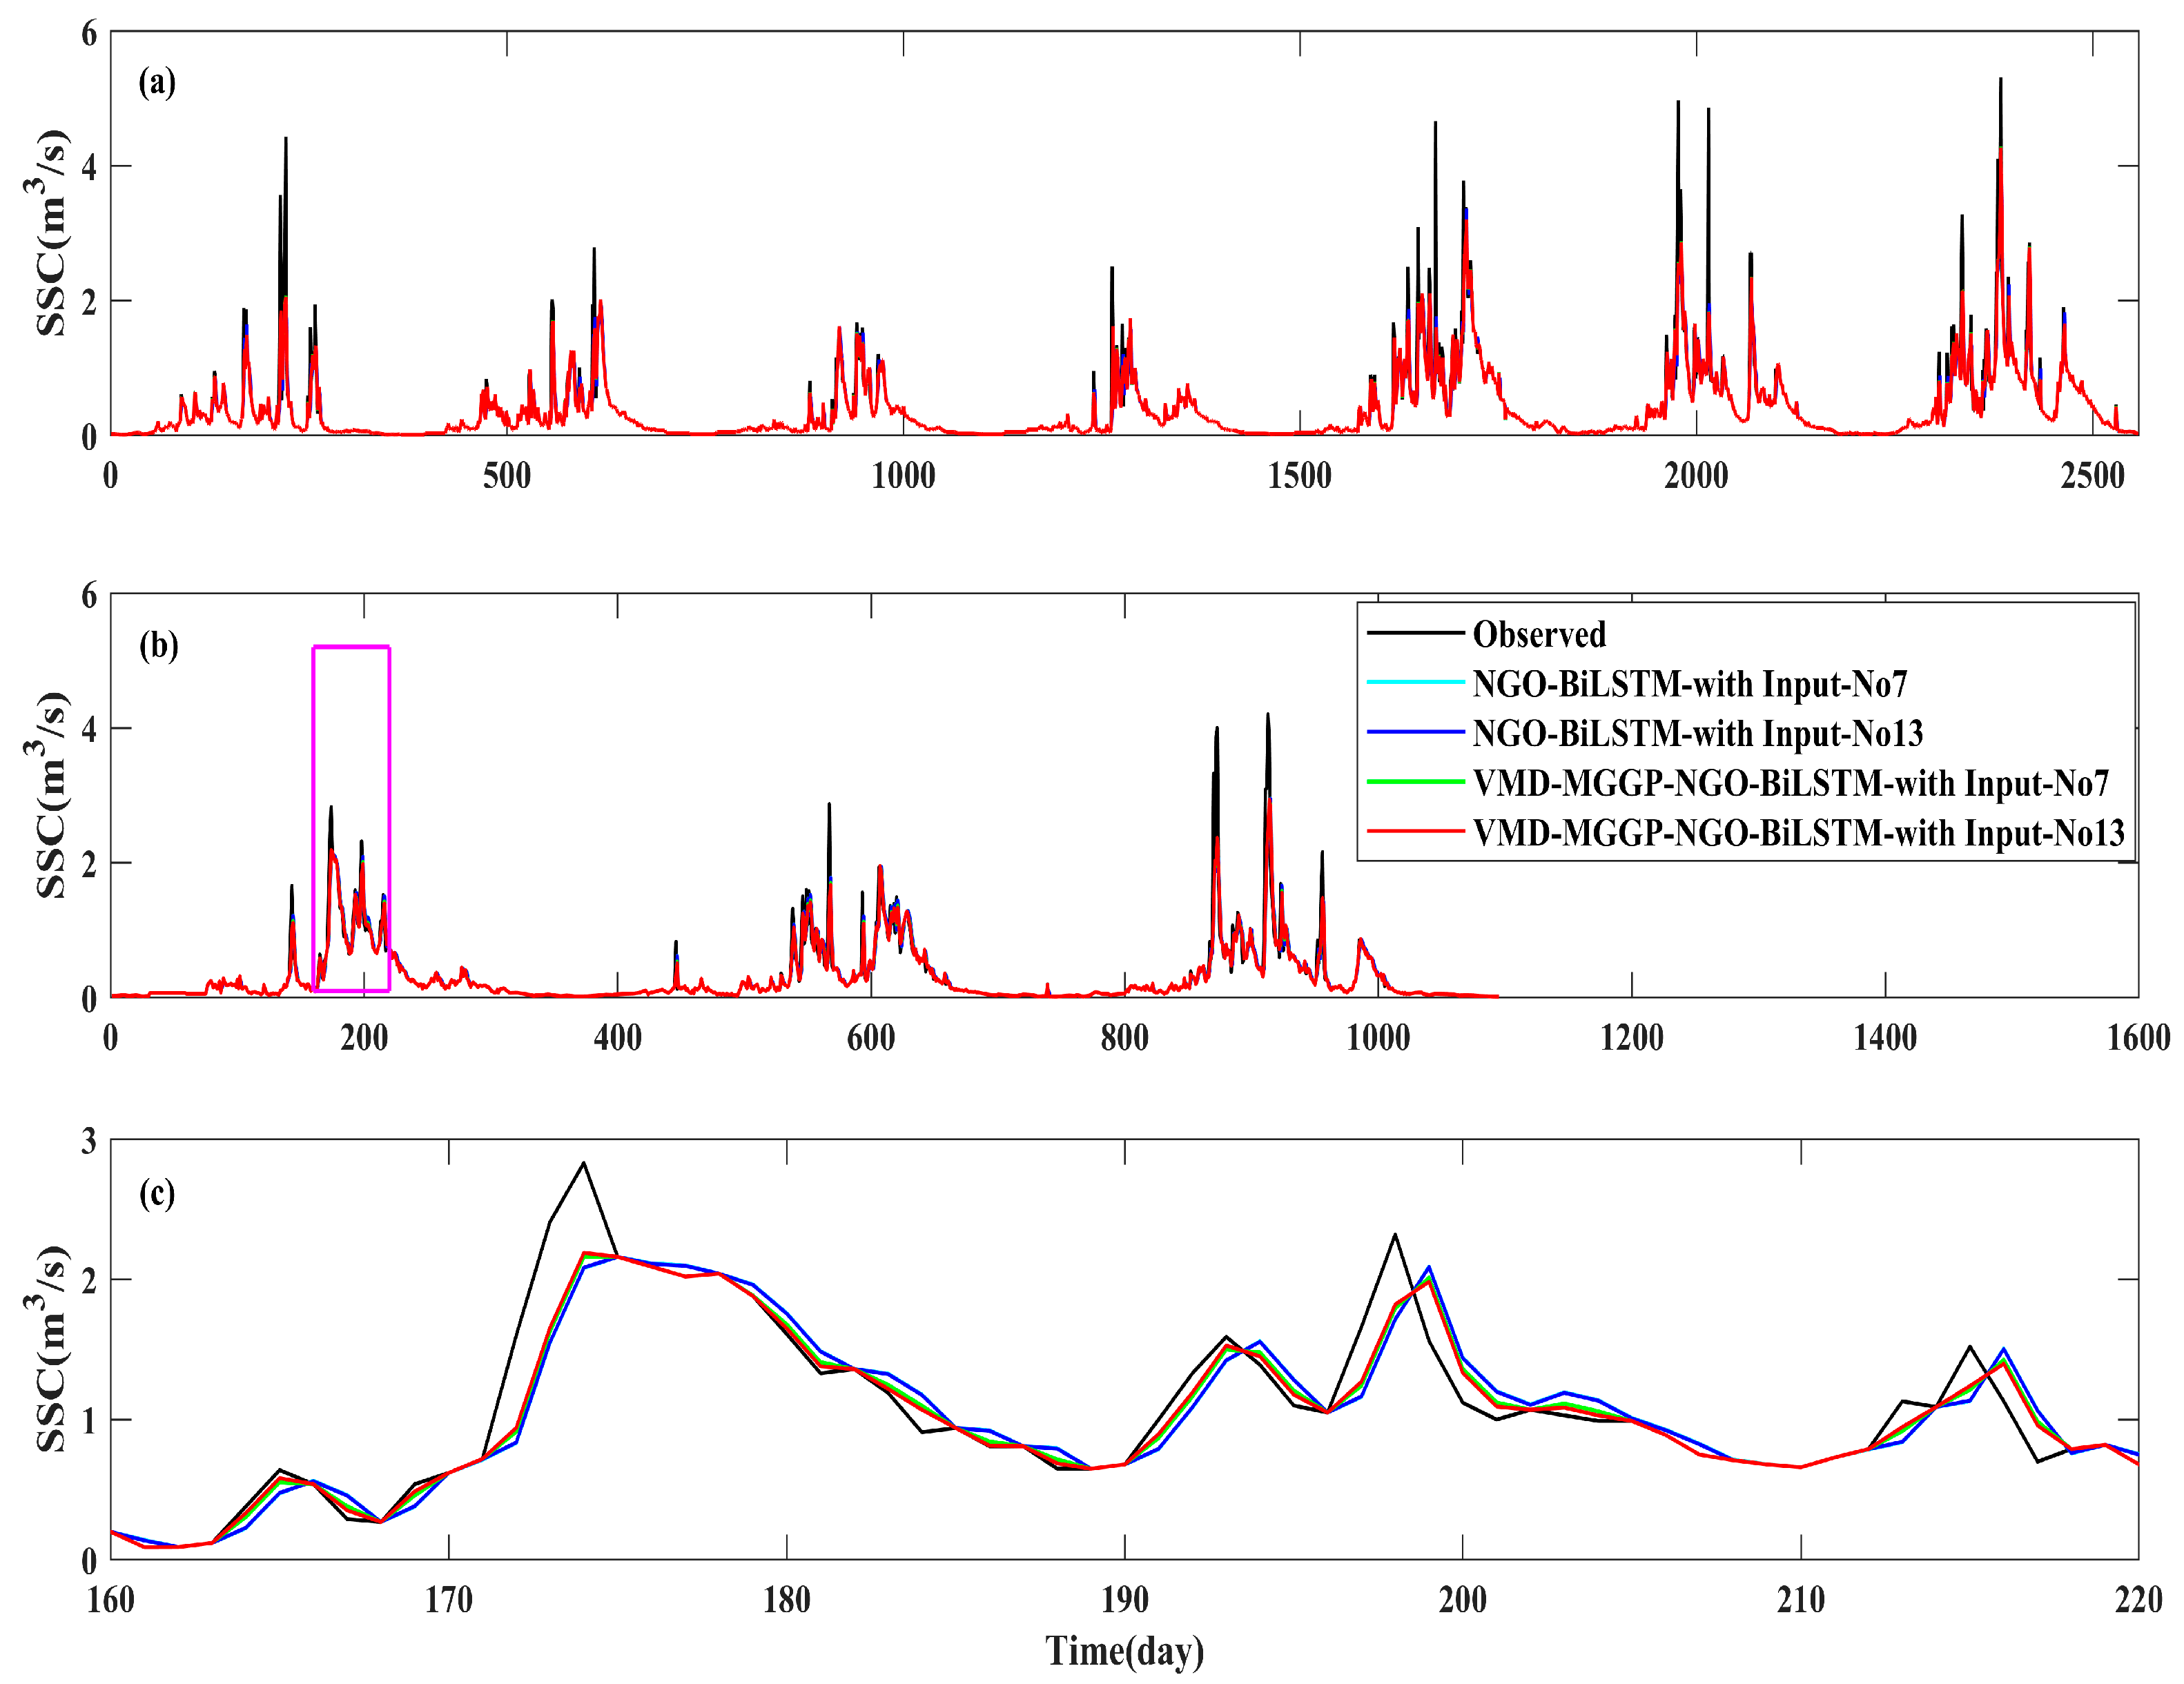
4.1. Selection of Input Vector

Preprocessing data prior to model training significantly affects predictive performance, particularly in time series forecasting, where the selection and structuring of input vectors play a pivotal role in capturing temporal dependencies and dynamic patterns. Inaccurate or arbitrary input selection can lead to suboptimal learning and diminished forecast accuracy. To address this, the present study adopts a data-driven approach to determine optimal input configurations by leveraging auto-correlation function (ACF), partial auto-correlation function (PACF), and the sliding window method. These techniques allow for a systematic assessment of the temporal relevance of lagged variables.
As shown in Figure 6a, the SSC time series exhibits a strong auto-correlation at lag-1, with a correlation coefficient exceeding 0.8, indicating strong temporal persistence. Figure 6b further reveals meaningful partial auto-correlation up to lag-4, suggesting the presence of short-term dependencies that cannot be ignored in model construction. Based on these findings, a total of 26 distinct input vector combinations were constructed using varying lag structures to reflect both direct and partial temporal influences. These combinations are systematically enumerated in Table 2. This quantitative correlation analysis not only justifies the inclusion of short-term memory in model inputs but also ensures that the design of input vectors is grounded in statistical relevance rather than empirical guesswork. Such preprocessing provides a robust foundation for subsequent modeling and enhances the capacity of the model to learn from meaningful temporal features.

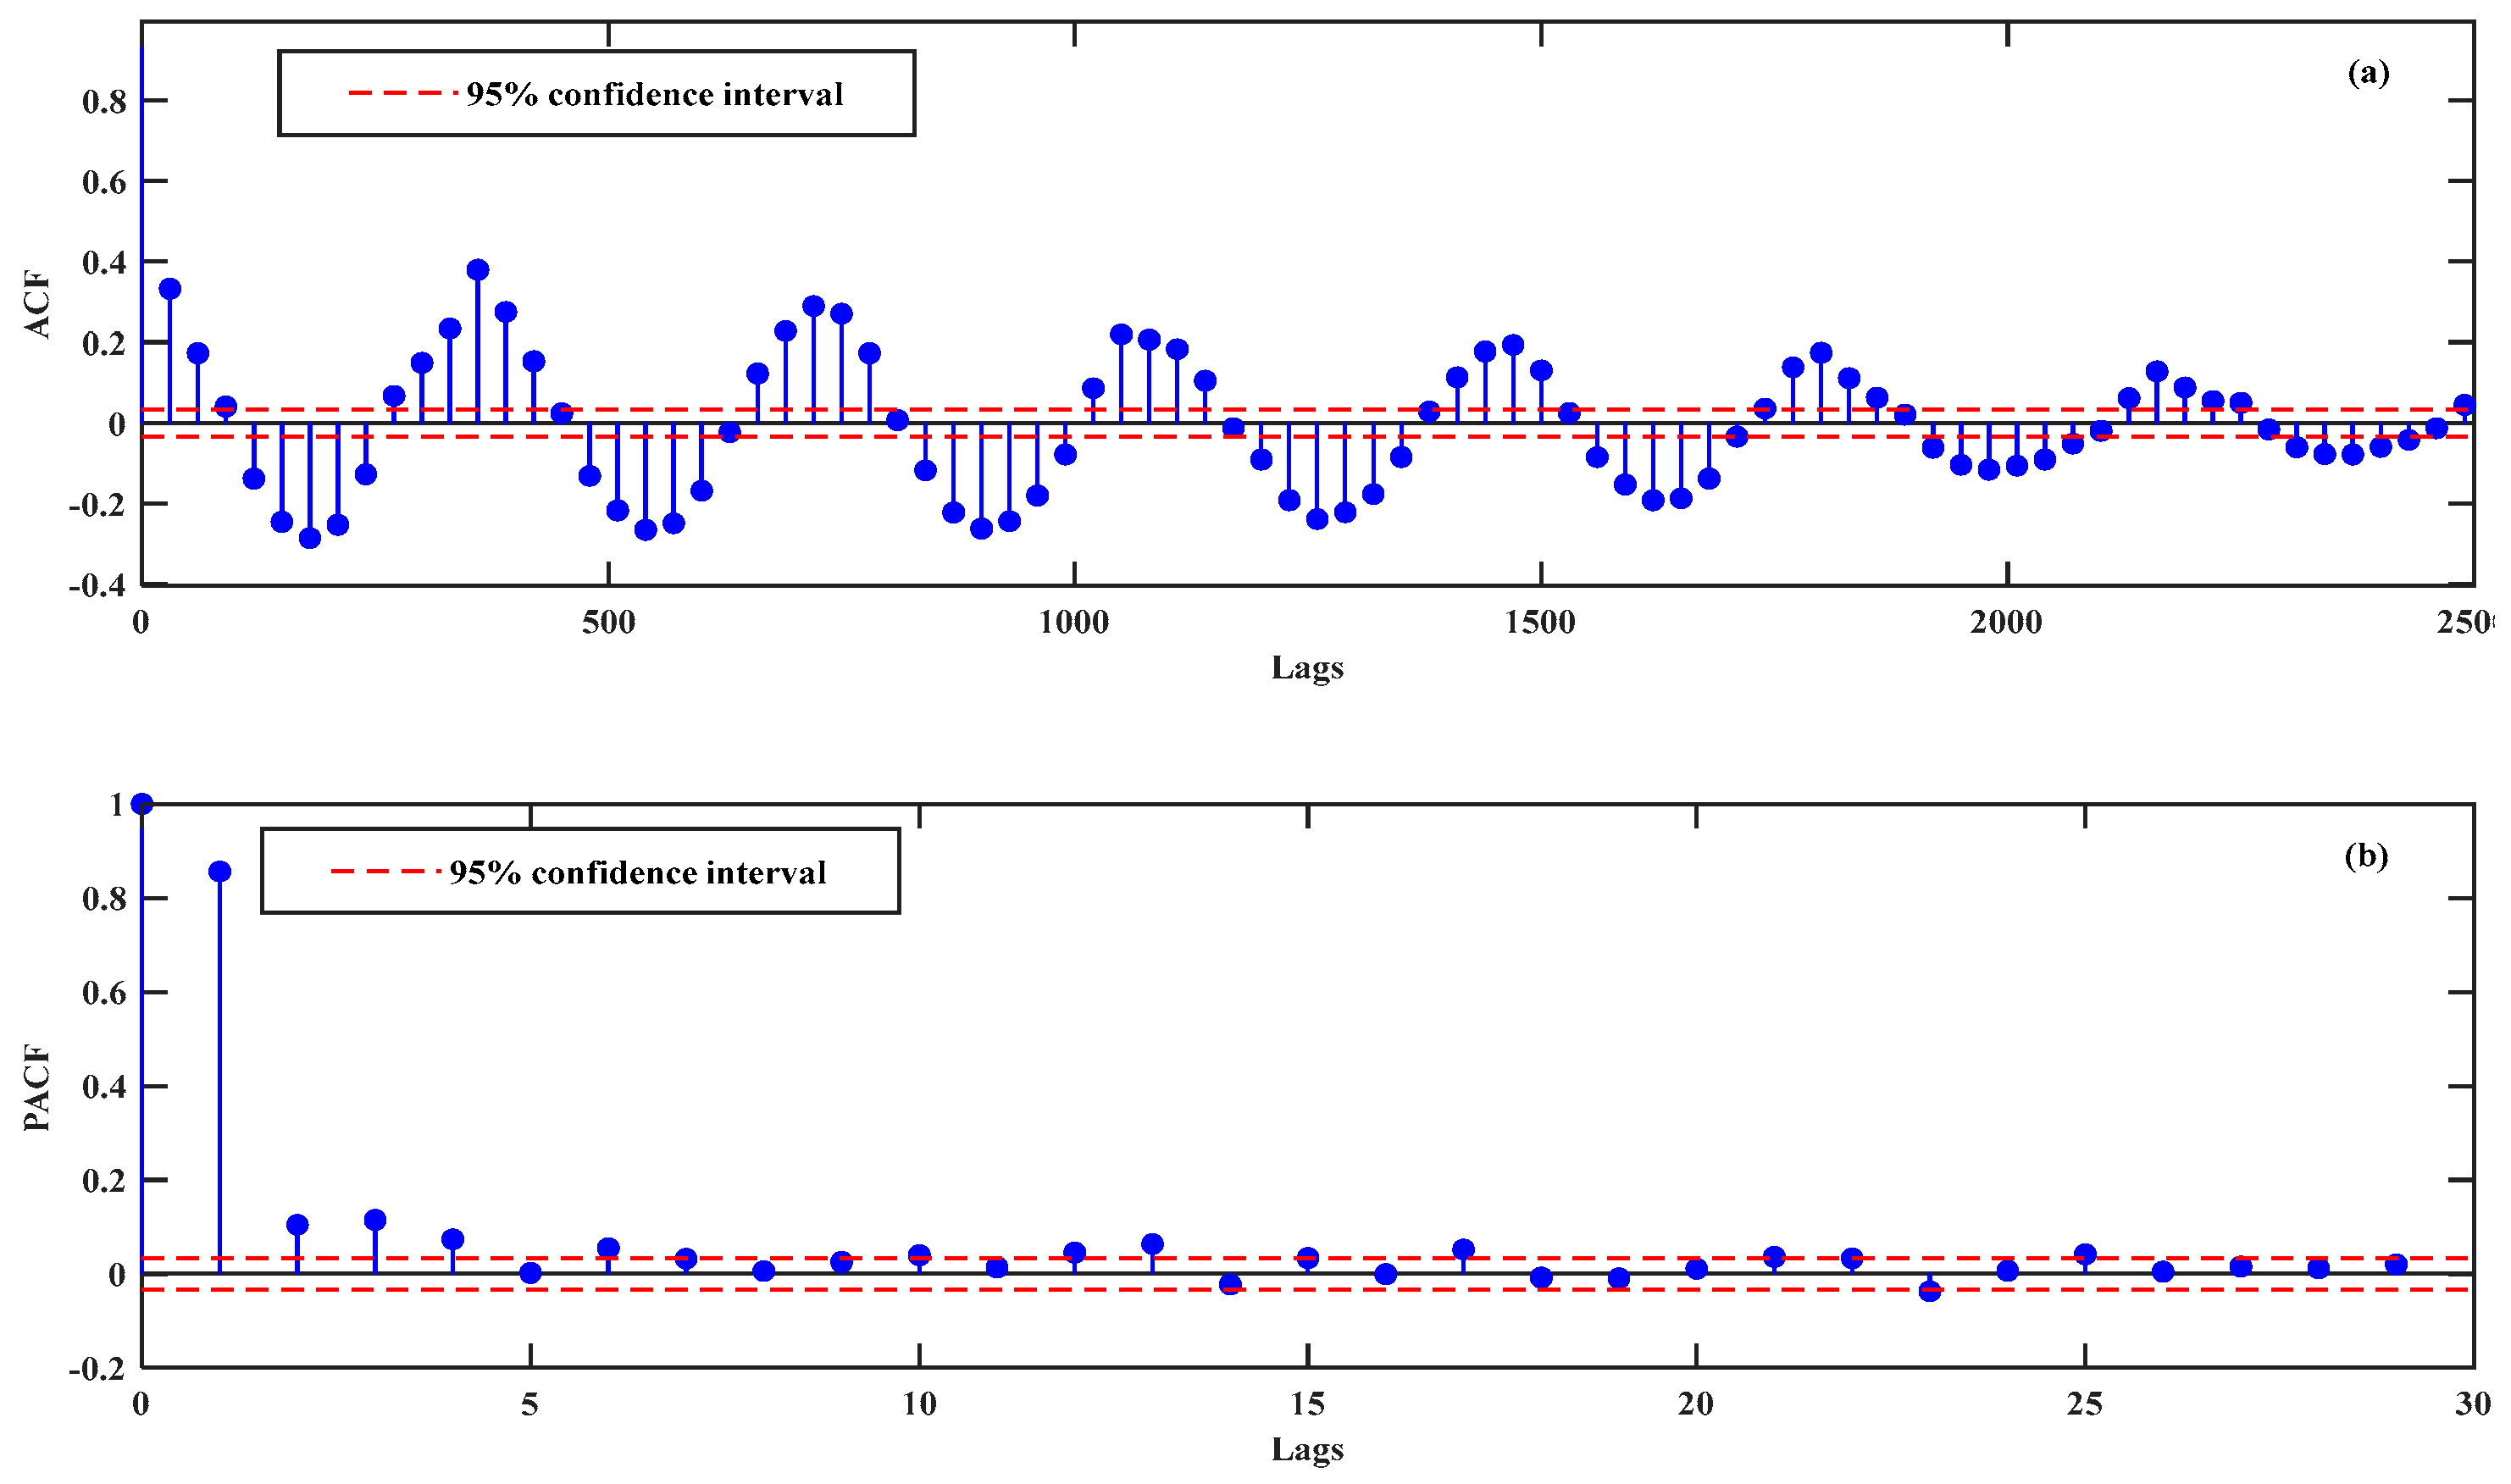
4.2. Data Decomposition and Filtering

It is essential to perform VMD on each input vector prior to model training. This decomposition step enhances the quality and applicability of the data by isolating intrinsic patterns and hidden structures, thereby facilitating more accurate and robust modeling. The effectiveness of VMD largely depends on the appropriate selection of two key parameters: the number of modes (K) and the penalty factor (α). The parameter K is critical, as an inappropriate value may degrade decomposition quality. Specifically, setting K too low can prevent the capture of latent features essential for understanding the temporal dynamics of the series, whereas an excessively high K may result in over-decomposition, introducing redundant modes that primarily represent noise rather than meaningful patterns. Similarly, the penalty factor α significantly influences the bandwidth of the modal components. A small α increases the risk of mode mixing and leads to substantial overlap among components, while a large α may suppress mode mixing but risks omitting important localized information. To address this trade-off, this study employs the Northern Goshawk Optimizer (NGO) to identify the optimal values of K and α for both the discharge and SSC input series. As a result of this optimization process, the optimal number of modes was determined to be 12 for discharge and 13 for SSC, respectively.
To perform VMD, each input variable—either SSC or discharge (Q)—is decomposed into a series of intrinsic mode functions (IMFs), typically ranging from IMF1 to IMF13 or IMF1 to IMF12 depending on the variable. To ensure accurate prediction performance, it is essential to identify and eliminate redundant information contained within these decomposed signals. Each IMF derived from the decomposition of the input variables is subsequently fed into the Multi-Gene Genetic Programming (MGGP) algorithm for redundancy reduction. Upon completion of the MGGP process, a Pareto front is generated, as shown in Figure 7, where the green dots represent clusters of optimal solutions identified by MGGP [25,56,66]. For each optimal solution on the Pareto front, a corresponding symbolic expression is generated. As illustrated in Figure 7, one such selected expression consists of six genes, with each gene contributing a certain weight to the final output (see Figure 8). Genes that demonstrate minimal contribution can be considered redundant and subject to removal. For instance, in Figure 8, Gene 1 exhibits a substantially lower contribution weight compared to the other five genes, indicating its limited importance and potential for exclusion from the final model.

4.3. Model Optimization and Performance Evaluation

4.3.1. Hyperparameter Optimization of BiLSTM Using NGO

Deep learning models typically employ advanced optimization algorithms—such as Adam and Stochastic Gradient Descent (SGD)—which diverge from the conventional gradient descent methods used in traditional neural networks. Among these, Adam has been widely recognized for its superior performance in enhancing the convergence and stability of training processes, a conclusion corroborated by Adaryani et al. (2022) [67]. In this study, the BiLSTM model serves as the core predictive architecture, and its performance is significantly influenced by three key hyperparameters: the number of hidden layer units, the initial learning rate, and the dropout probability. To identify the optimal configuration of these hyperparameters, the Northern Goshawk Optimizer (NGO) is employed. During the model training and prediction process, a solution vector comprising the aforementioned parameters is constructed and input into the NGO. The algorithm then minimizes the root mean square error (RMSE) between predicted and actual values as the optimization objective. To ensure an effective and stable optimization process, the search space is constrained within well-defined parameter bounds: [5, 300] for the number of hidden units, [0.001, 0.01] for the initial learning rate, and [0.05, 0.95] for the dropout probability. Additionally, the NGO’s own configuration is specified with a population size of 3 and a maximum of 5 iterations, providing a balance between computational efficiency and search performance. Collectively, this parameter tuning framework plays a critical role in enhancing the BiLSTM model’s generalization ability and prediction accuracy. All parameter settings for the BiLSTM are summarized in Table 3.

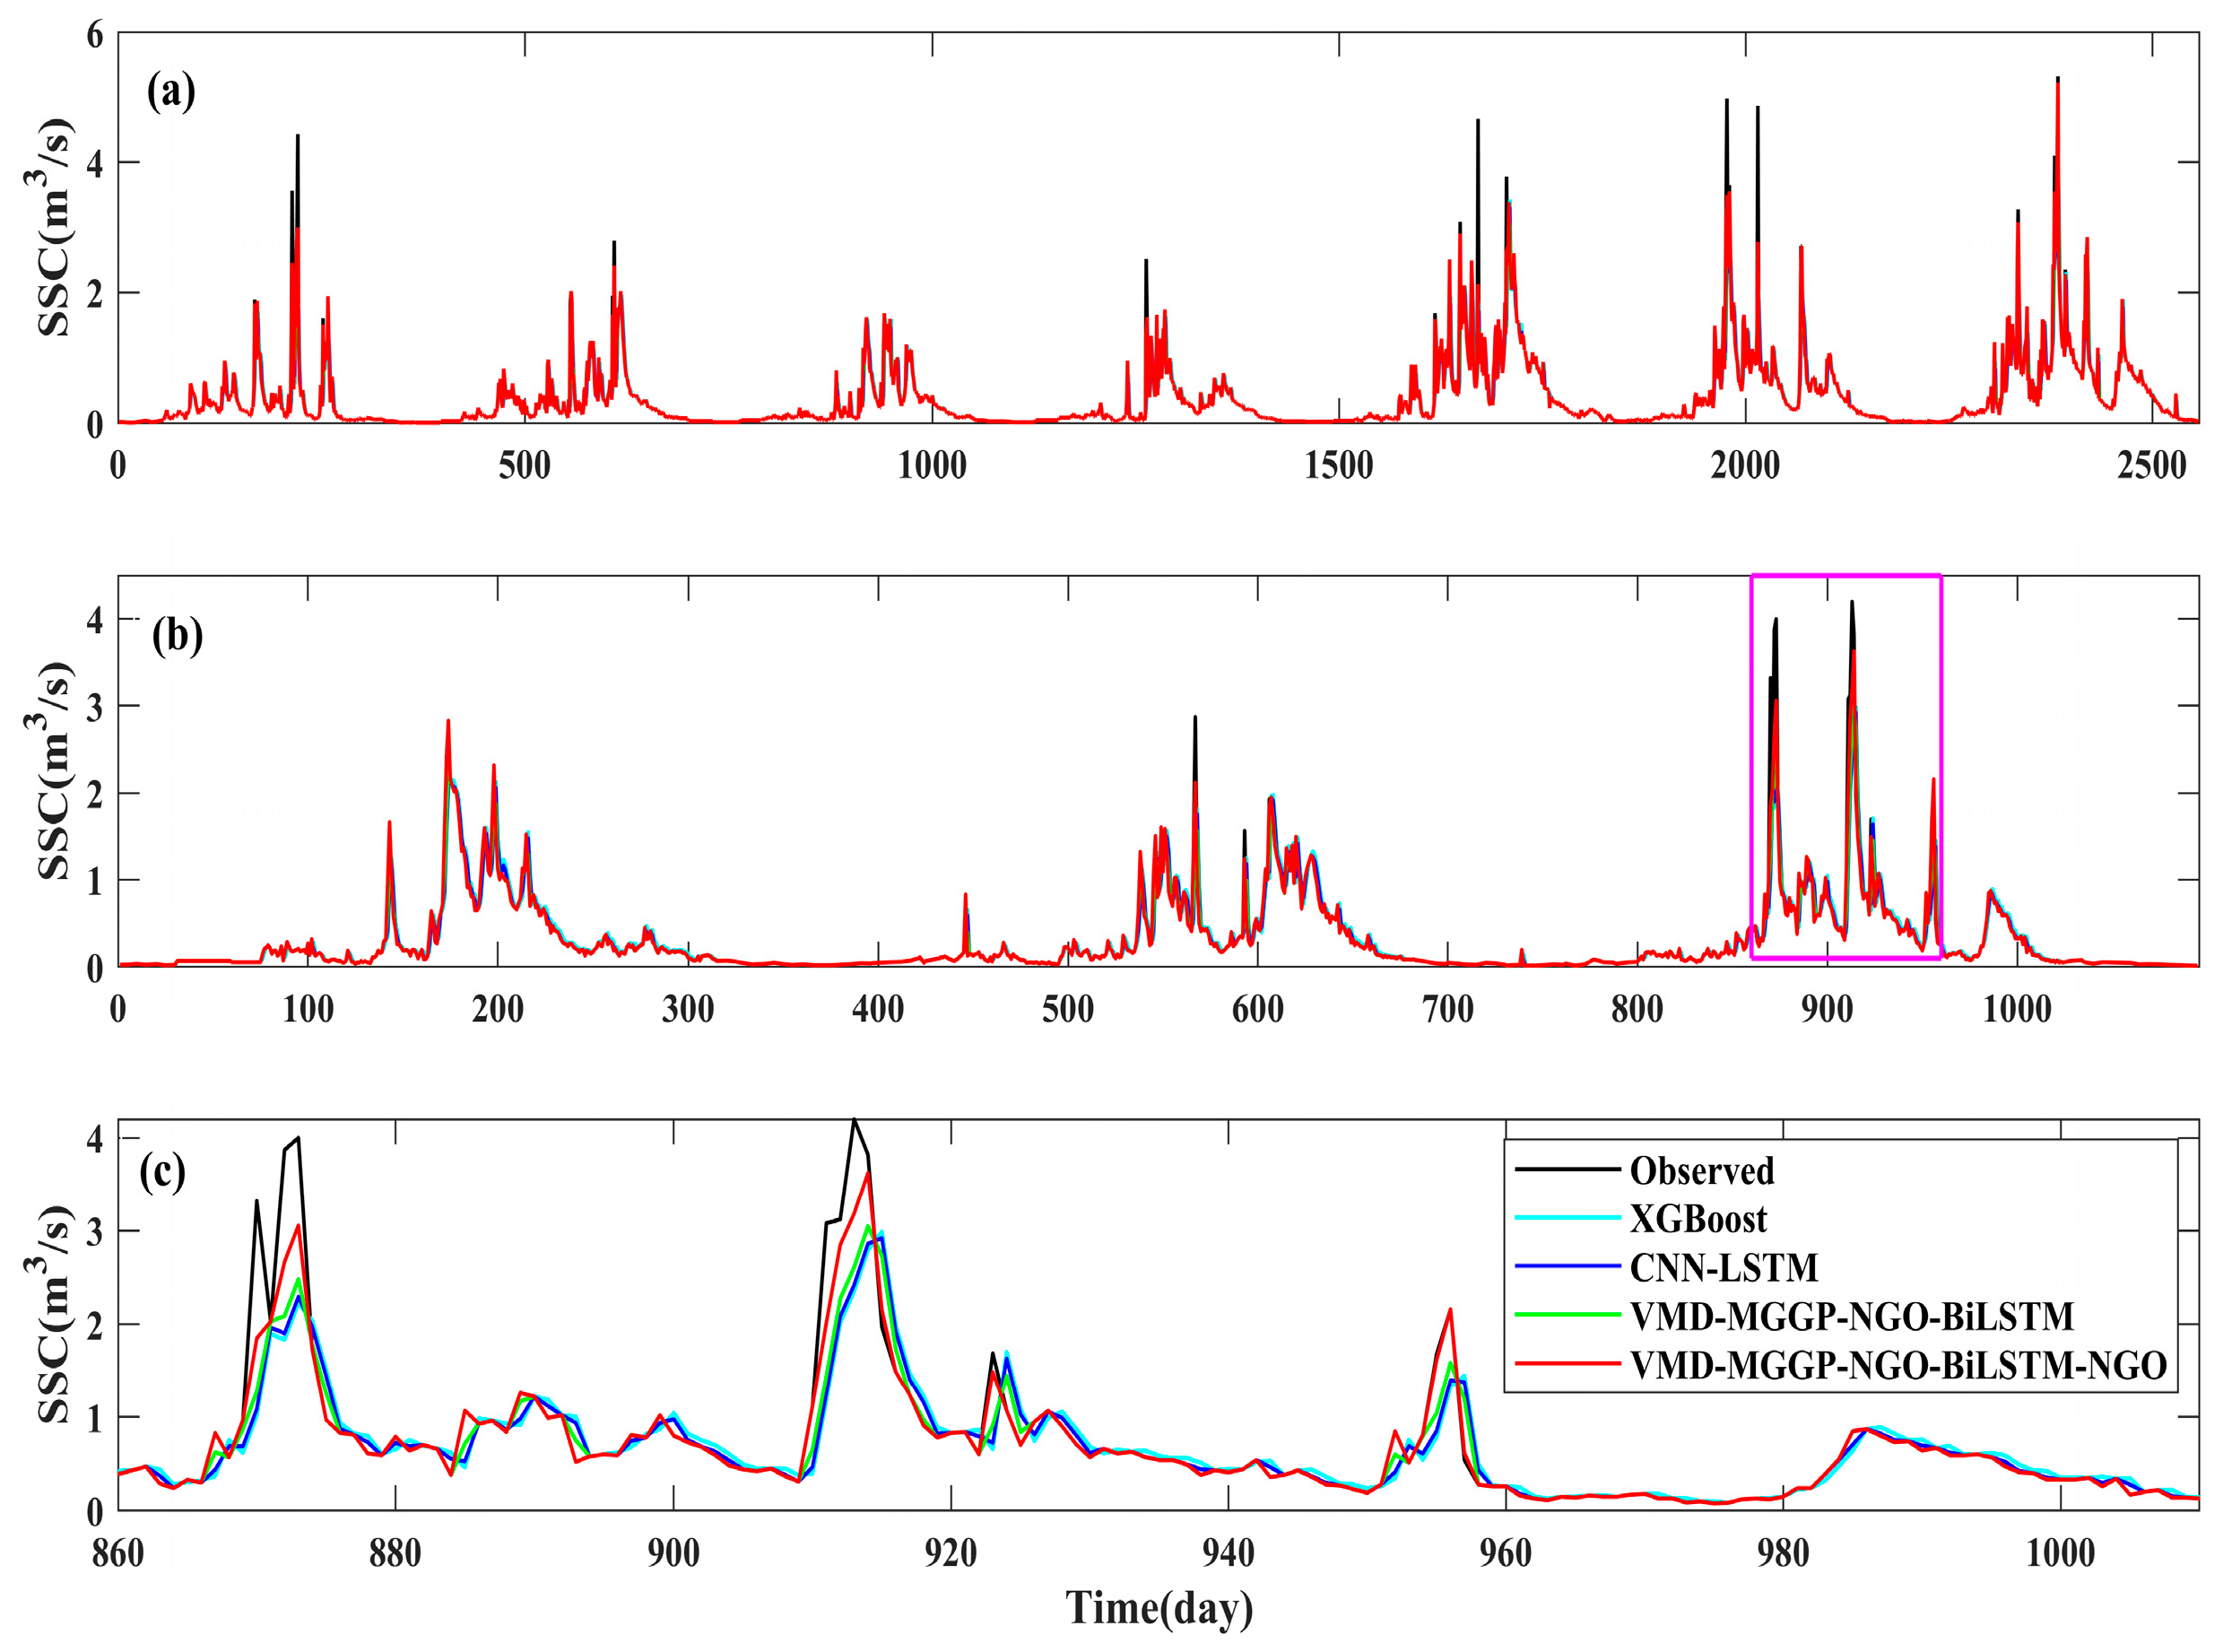
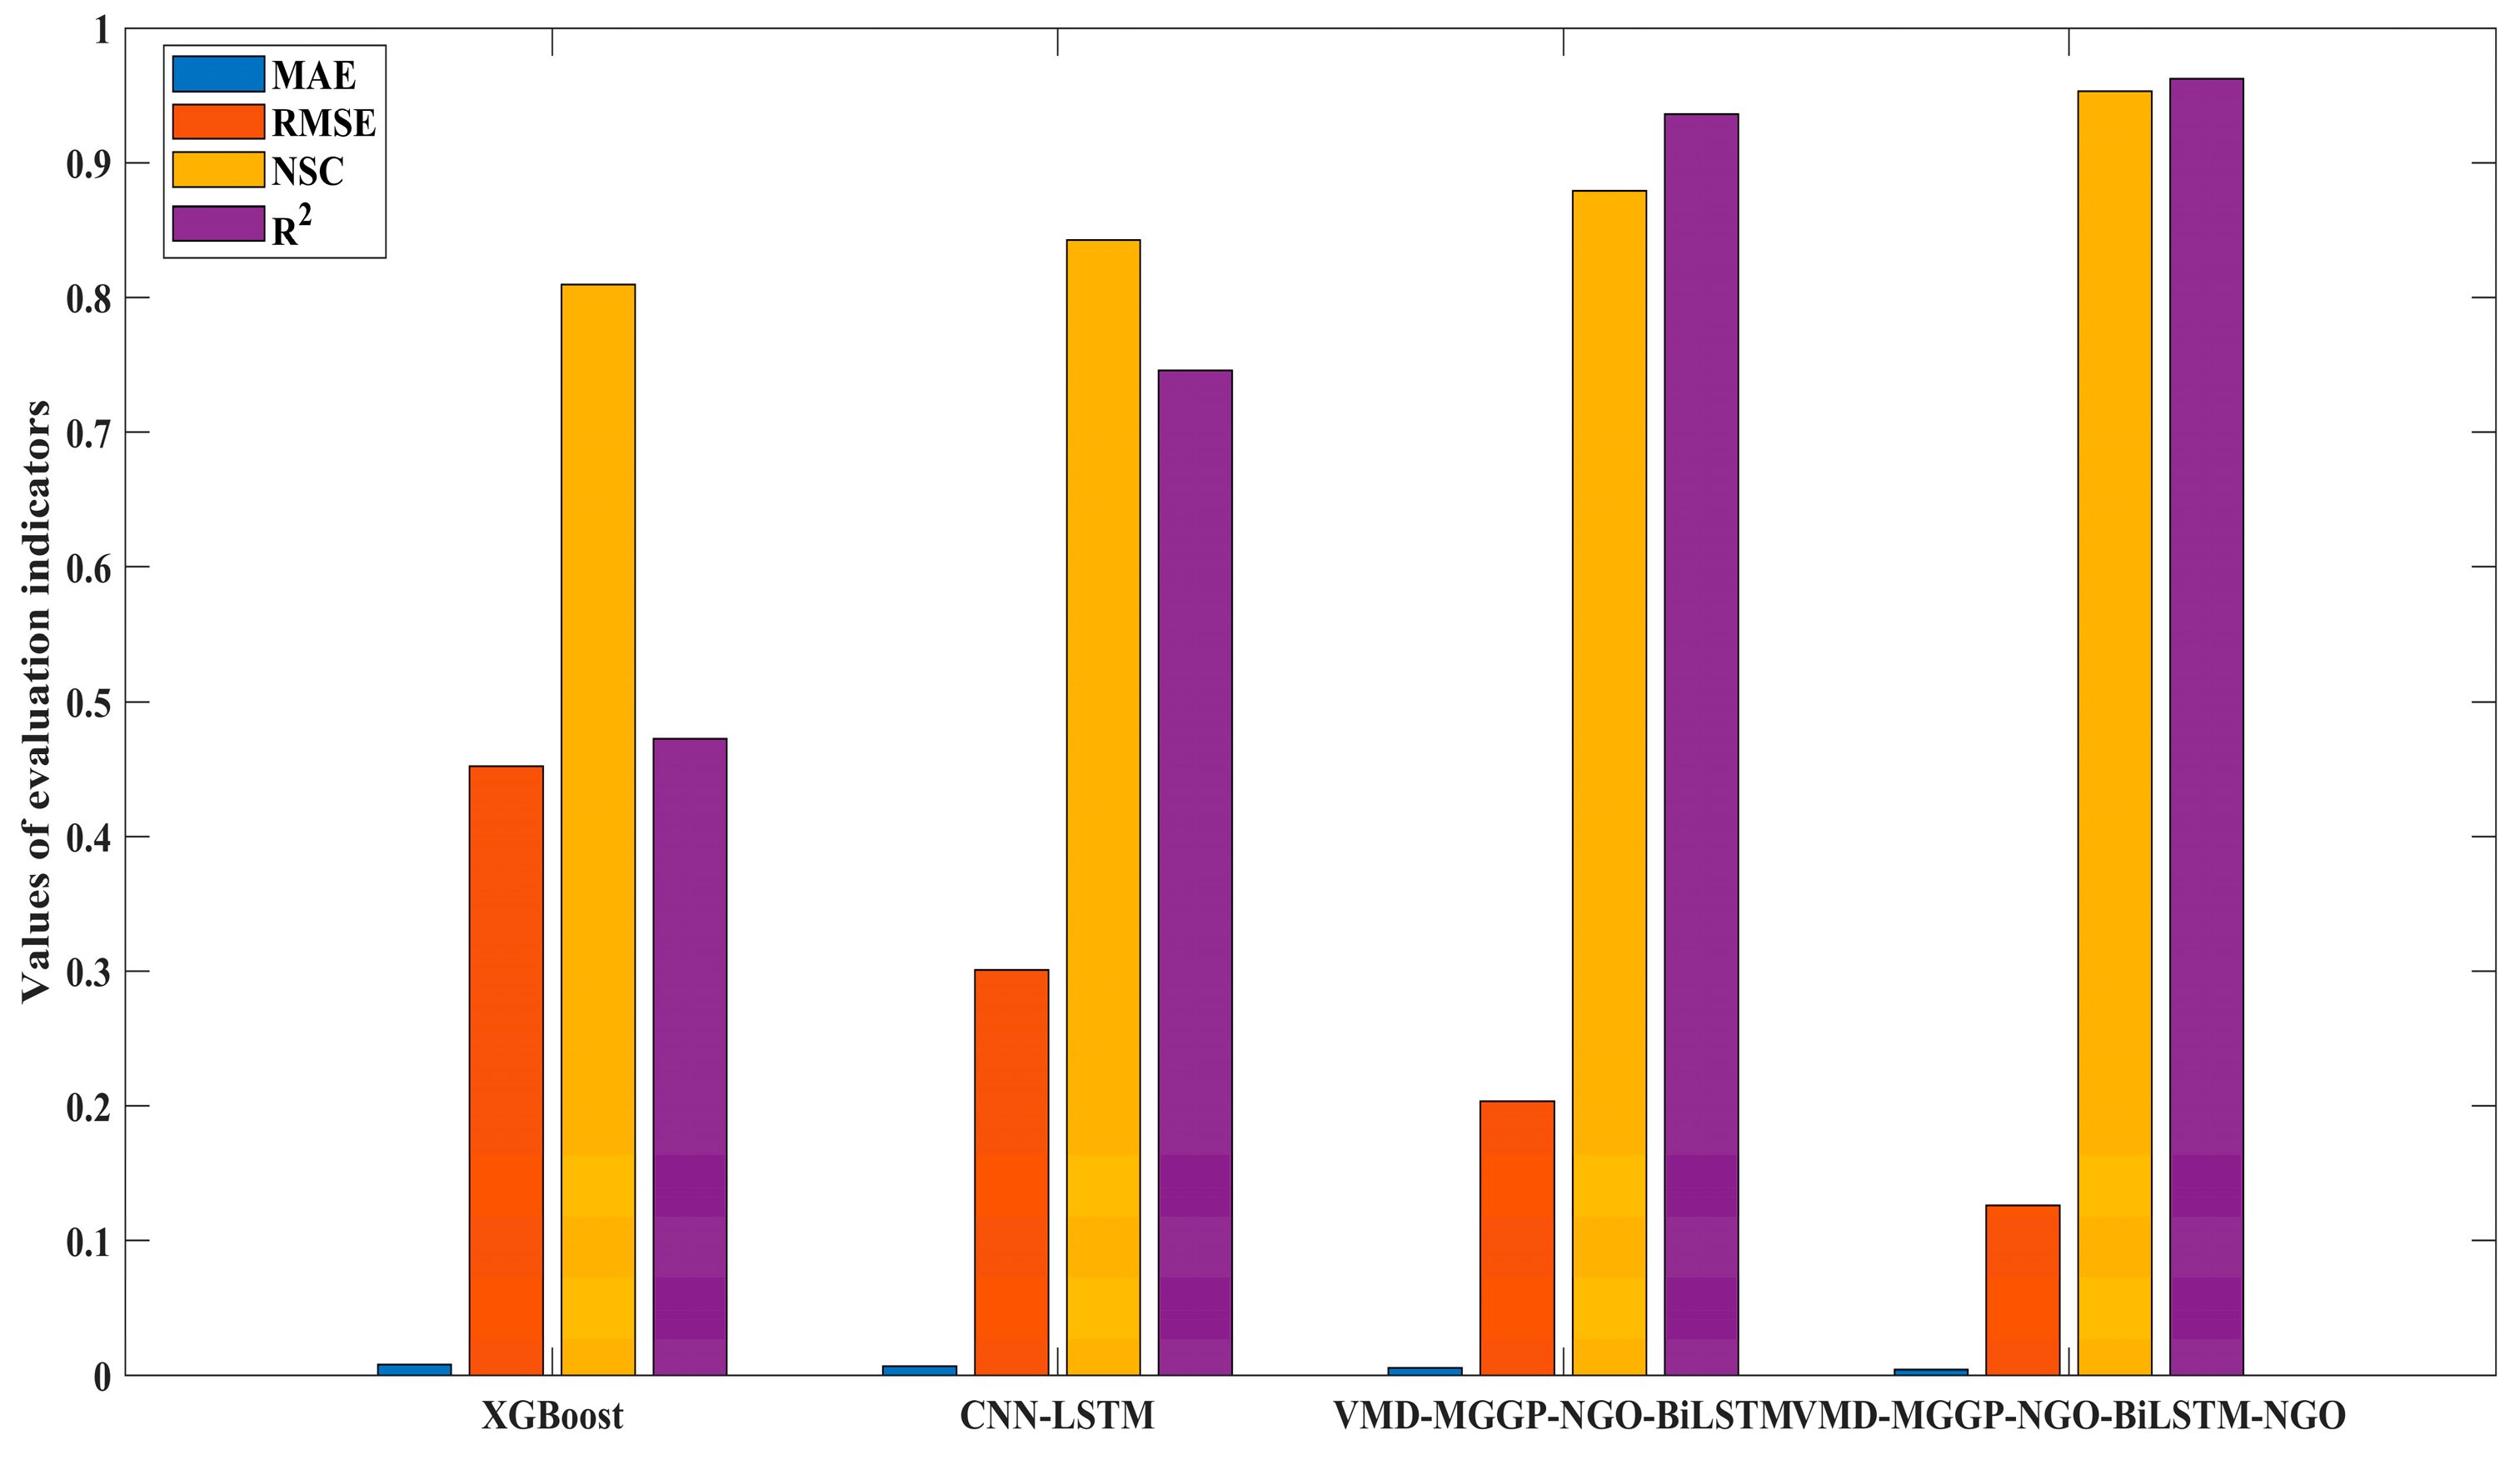
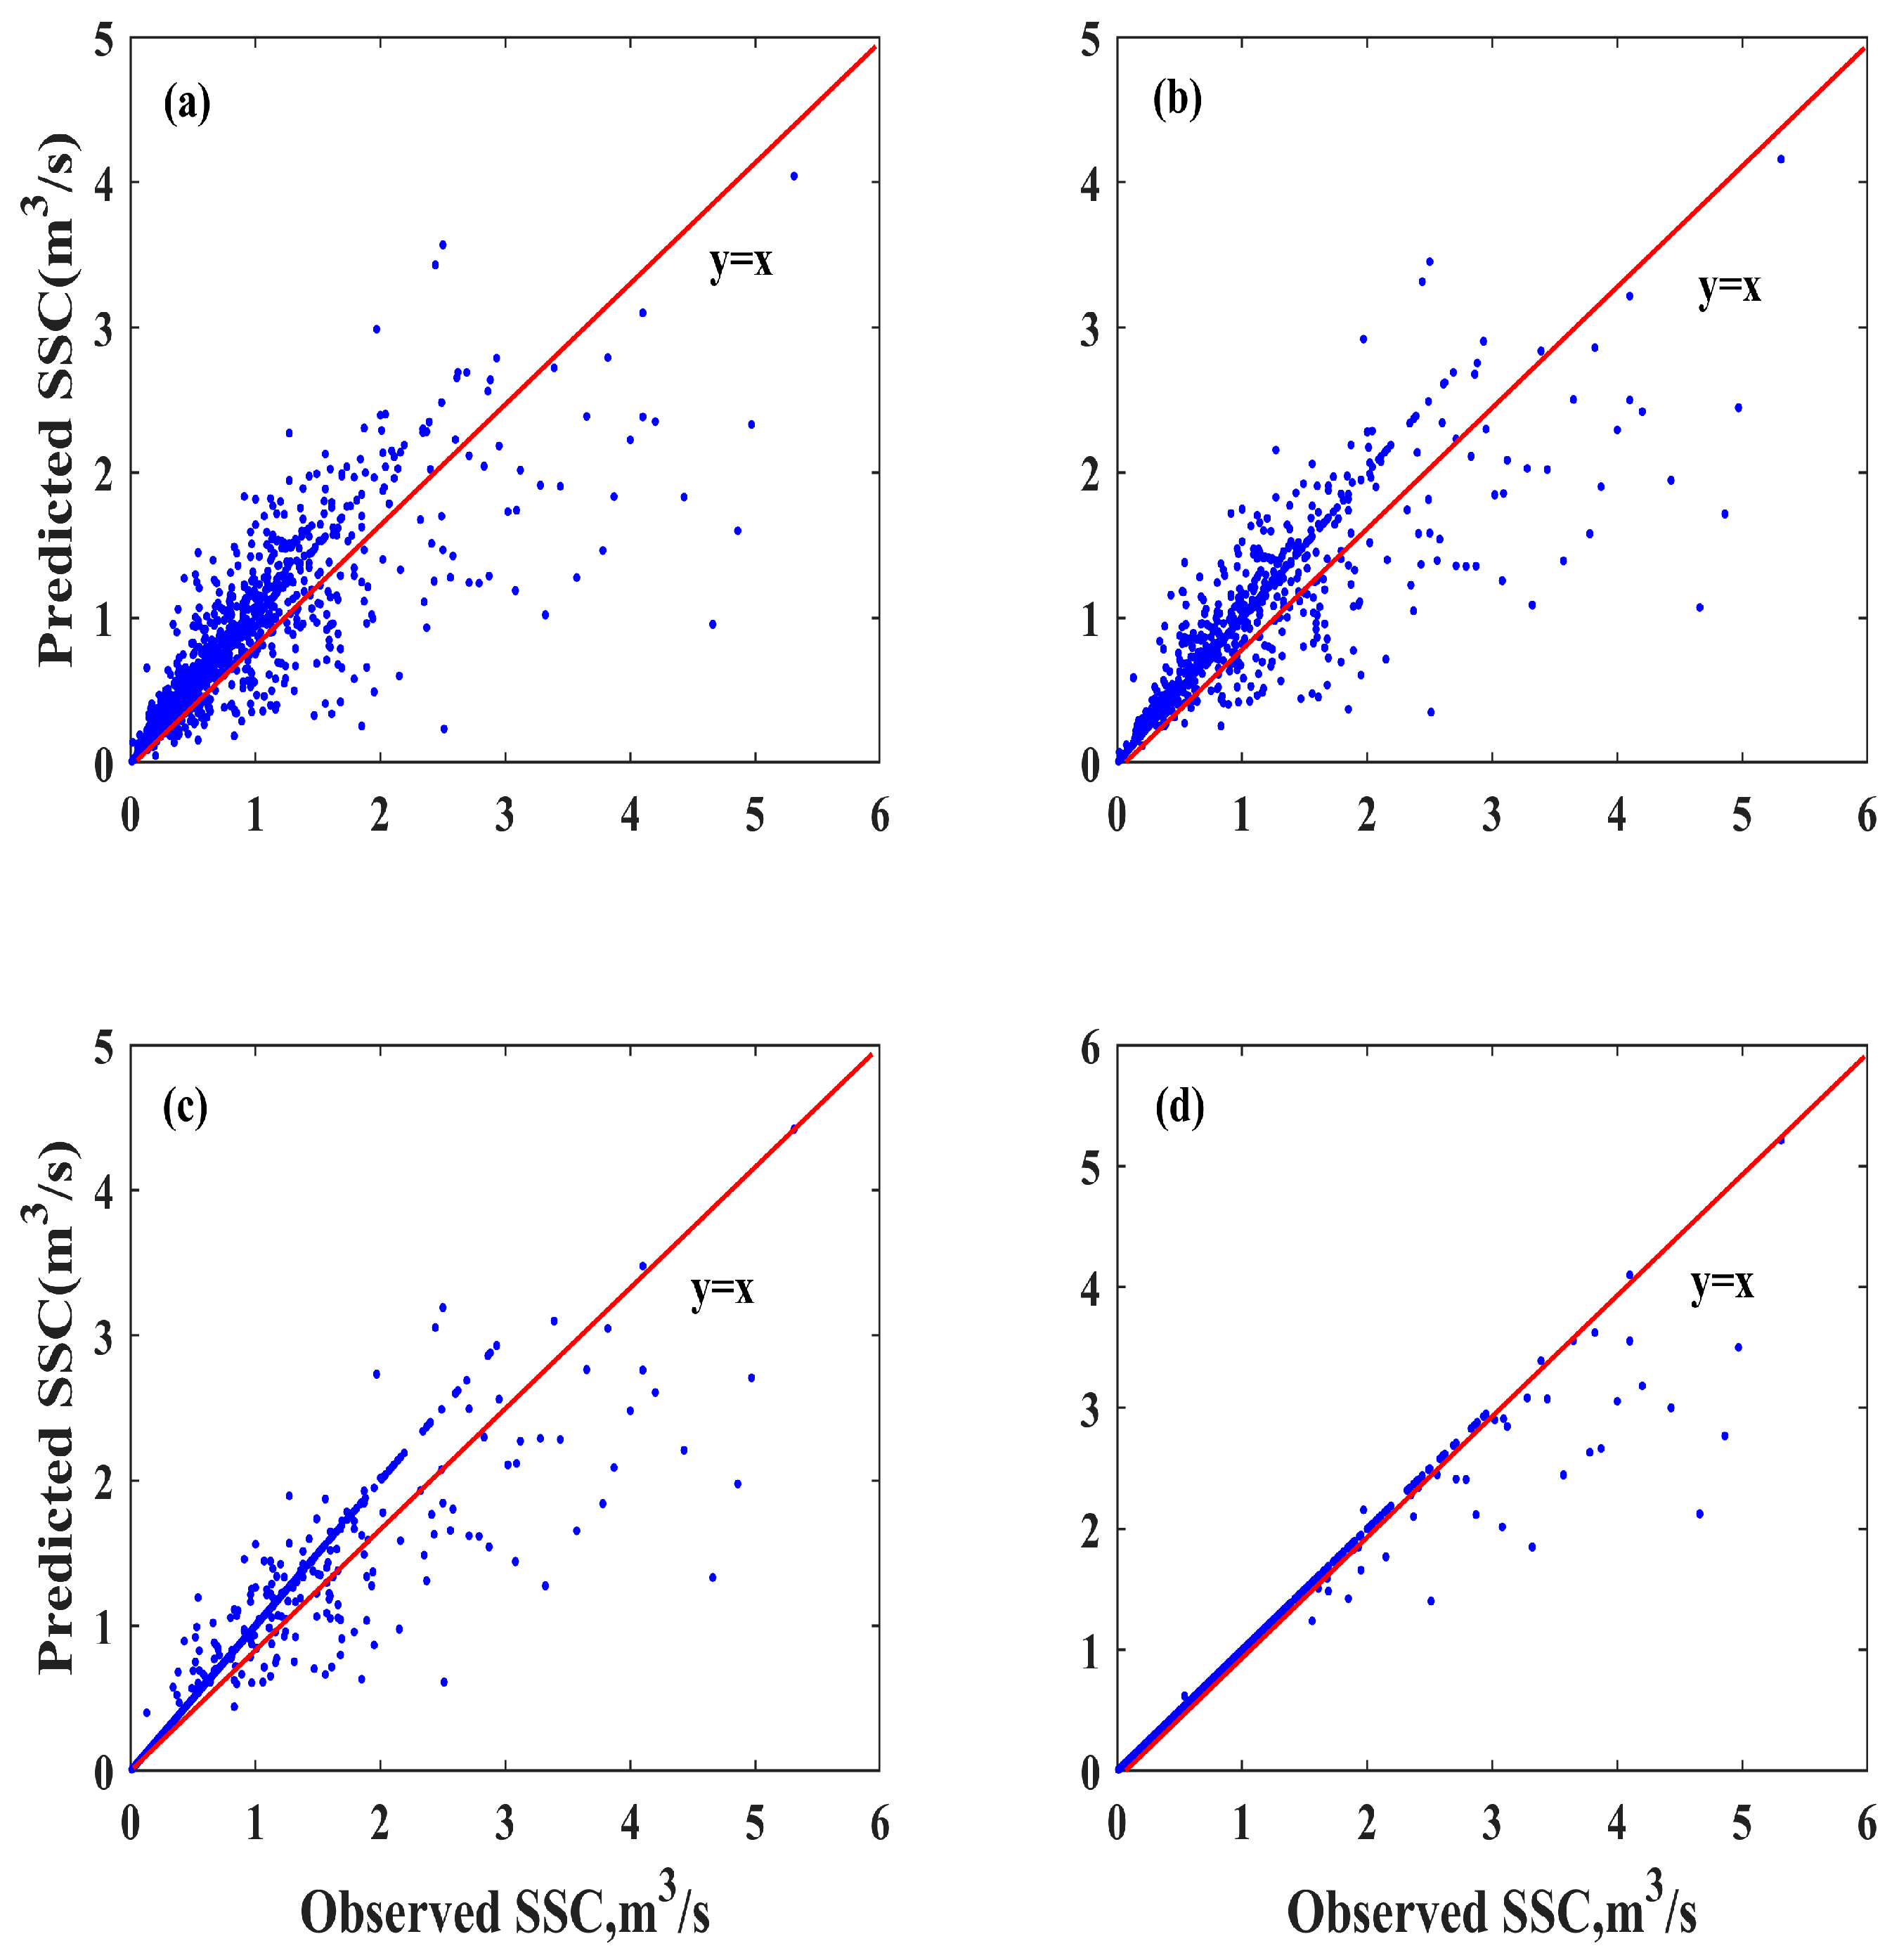
4.3.2. Performance Comparison and Ensemble Weighting Strategy

The prediction performance indicators of the VMD-MGGP-NGO-BiLSTM model are summarized in Table 4. As shown in Table 4, all input configurations yielded satisfactory prediction performance with NSC values greater than 0.75, underscoring the effectiveness of the VMD-MGGP decomposition and the NGO-based hyperparameter optimization in enhancing model accuracy.
To further refine the final ensemble, the 12 input vectors with the highest NSC values in the testing phase were selected. These vectors were, in descending order of performance: Input-No11, Input-No3, Input-No2, Input-No9, Input-No19, Input-No23, Input-No10, Input-No6, Input-No16, Input-No20, Input-No25, and Input-No22. These top-performing sequences were then recombined into 10 merged input vectors—designated as ComNo1 through ComNo10—based on cumulative inclusion. Specifically, ComNo1 includes the top 3 sequences, ComNo2 includes the top 4, and so on, up to ComNo10, which integrates all 12.
Each of these 10 composite input vectors was subjected to further optimization using the NGO algorithm, which determined the optimal contribution weights for each sub-vector in the ensemble. The resulting weight coefficients are detailed in Table 5. For instance, the three sub-vectors in ComNo1 were assigned weights of 0.301, 0.376, and 0.331, respectively, reflecting their relative influence on the final prediction.
The predictive outcomes of the 10 merged input vectors are reported in Table 6, where it is evident that all combinations produced excellent predictive performance, with NSC values exceeding 0.9 across the board. These results affirm the utility of selective ensemble strategies combined with optimization-based weight assignment in significantly improving the model’s accuracy and robustness in SSC forecasting.
In addition, to further demonstrate the superiority of the proposed integrated model, two widely used benchmark models—Extreme Gradient Boosting (XGBoost) and the CNN-LSTM—were employed to train and predict using the same dataset. As shown in Table 7, both models yielded substantially lower NSC values compared to the integrated ensemble model proposed in this study, highlighting the enhanced predictive accuracy and robustness of the VMD-MGGP-NGO-BiLSTM-NGO framework.
For the optimal input vector, Figure 9a,b illustrates the comparison between predicted and observed SSC values produced by XGBoost, CNN-LSTM, VMD-MGGP-NGO-BiLSTM, and VMD-MGGP-NGO-BiLSTM-NGO models during the training and testing phases, respectively. As highlighted in Figure 9c, which zooms in on the peak SSC period during the testing phase, the integrated model (VMD-MGGP-NGO-BiLSTM-NGO) demonstrates a superior capability in accurately capturing peak values compared to the other models. The corresponding quantitative evaluation metrics for all four models are presented in Figure 10, where the VMD-MGGP-NGO-BiLSTM-NGO model consistently outperforms its counterparts across all indicators, reaffirming its predictive advantage. Furthermore, Figure 11 provides scatter plots comparing predicted versus observed SSC values. Both VMD-MGGP-NGO-BiLSTM-NGO and VMD-MGGP-NGO-BiLSTM show strong alignment along the 1:1 reference line, with the integrated NGO-based model exhibiting the closest fit. In contrast, XGBoost and CNN-LSTM display greater deviations, indicating inferior prediction accuracy. These results collectively confirm the enhanced performance and robustness of the proposed integrated framework in SSC prediction tasks.
The superior performance of ensemble models over individual models can be demonstrated from both theoretical and practical perspectives. On a theoretical level, ensemble learning can often achieve higher prediction accuracy compared to individual models. In the first place, by combining the predictions of multiple models, the ensemble can reduce errors and make more reliable predictions. Furthermore, ensemble learning allows for the integration of different types of models or algorithms, enhancing the model’s ability to capture different aspects of the data. By combining models with different strengths and weaknesses, the ensemble can comprehensively understand the problem. From a practical perspective, ensemble modeling has demonstrated clear advantages over individual models [56,68,69].

4.4. Comparative Evaluation of Model Variants and Optimization Strategies

4.4.1. Impact of VMD-MGGP Integration on SSC Prediction Performance

The prediction performance indicators of the NGO-BiLSTM model are presented in Table 8. A comparative analysis between Table 8 and Table 4 clearly demonstrates that the VMD-MGGP-NGO-BiLSTM model outperforms the NGO-BiLSTM in terms of predictive accuracy. To further quantify this improvement, the performance metrics of both models in the testing phase are summarized in Table 9.
Across all input vectors, the integration of VMD-MGGP preprocessing consistently enhances the predictive performance of NGO-BiLSTM. With regard to the NSC metric, the minimum improvement is observed for Input-No21, with an increase of 3.41%, whereas the maximum gain is achieved for Input-No11, with a notable 9.66% increase. On average, the NSC across all input vectors improves by 5.88%, underscoring the effectiveness of the VMD-MGGP module in enhancing model generalization.
Figure 12a,b illustrates the predicted versus actual SSC values for both models using Input-No7 and Input-No13 during the training and testing phases. As shown in Figure 12c, which zooms in on the peak SSC period during testing, the VMD-MGGP-NGO-BiLSTM model demonstrates superior performance in capturing peak values—an area where the NGO-BiLSTM model struggles.
This performance disparity can be attributed to the input structure. When Input-No7 and Input-No13 are used in their original, undecomposed form, BiLSTM fails to accurately capture the temporal dynamics around extreme events. However, after decomposition via VMD, the transformed sub-signals enable the BiLSTM model to more effectively learn multi-scale features, resulting in improved peak prediction. Overall, these results affirm the added value of VMD and MGGP in improving the predictive capability of deep learning models in sediment forecasting tasks.
The advantages of incorporating VMD preprocessing data technology for more accurate predictions can be explained comprehensively. Initially, VMD is a versatile method suitable for various types of signals, including nonstationary, nonlinear, and multicomponent signals. It does not impose assumptions on the signal structure and can handle signals with time-varying frequencies, irregular transients, and complex dynamics. Additionally, VMD allows for easy parameter tuning, making it adaptable to different signal characteristics and analysis requirements. It also exhibits robustness to noise and interference, effectively isolating desired modes even in the presence of noise. This robustness contributes to accurate and reliable signal analysis and feature extraction. Finally, numerous previous studies have reported that data preprocessing methods significantly improve model prediction performance [26,56,70,71].

4.4.2. The Influence of Adding NGO-ELM to SSC Prediction

To demonstrate the superiority of the proposed VMD-MGGP-NGO-BiLSTM-NGO ensemble model over the conventional averaging-based ensemble model—referred to as VMD-MGGP-NGO-BiLSTM-AVE in this study—the latter was employed to predict SSC using the same ten combined input vectors as those used in the NGO-based model. The results are presented in Table 10. A comparison of Table 6 and Table 10 reveals that the prediction performance achieved using the NGO optimization strategy significantly surpasses that of the simple averaging approach. For example, in the cases of input combinations ComNo1 and ComNo2, the NSC values of the NGO-based ensemble increased by 7.91% and 7.92%, respectively, compared to the averaging-based model.
Figure 13a,b illustrates the training and testing results of both ensemble models for input vectors ComNo4 and ComNo5 at the Tangnaihai Hydrological Station, highlighting the consistency between predicted and observed values. Figure 13c zooms in on the SSC predictions during peak periods in the testing phase, clearly showing that the VMD-MGGP-NGO-BiLSTM-NGO model captures peak sediment values more accurately than the averaging-based counterpart.
The primary reason for this performance gap lies in the ensemble integration strategy. In VMD-MGGP-NGO-BiLSTM-AVE, each sub-vector is assigned an equal weight of 1/n, assuming uniform predictive value across all inputs. In contrast, the VMD-MGGP-NGO-BiLSTM-NGO model employs an optimization-based weighting scheme, where the contribution of each sub-vector is dynamically adjusted by the NGO algorithm. The optimization process aims to minimize RMSE between the predicted and actual SSC values, thereby enhancing the ensemble’s ability to generalize and reduce prediction errors.
In the averaging-based ensemble model, each forecasting model is assigned an equal weight of 1, implying that all component models are assumed to have identical importance and predictive performance. However, in practice, the accuracy of individual models can vary significantly, meaning their contributions to the final prediction are not uniform. Assigning appropriate weight coefficients to each model based on its predictive capability can enhance the overall forecasting performance. To address this, the present study employs the Northern Goshawk Optimizer (NGO) to optimize the weight coefficients of the individual forecasting models, using Root Mean Square Error (RMSE) as the objective function. The NGO algorithm is specifically designed to handle objective functions influenced by noise and uncertainty, making it well suited for complex optimization landscapes. By incorporating random exploratory movements and diversity-preserving mechanisms, NGO effectively mitigates the effects of noise and reliably identifies robust solutions.
Moreover, NGO is a versatile and scalable optimization technique, capable of handling high-dimensional problems and complex constraints frequently encountered in real-world forecasting applications. During the optimization process, the weight coefficients are initially assigned random values. The algorithm then iteratively updates them through fitness evaluations until the optimal solution is achieved, thereby improving the ensemble model’s predictive accuracy.
In practical engineering applications, the presence of numerous unknown or fluctuating variables often leads to instability in model performance. Therefore, the integration of optimization algorithms, such as NGO, to fine-tune these variables has become a widely adopted strategy to improve system reliability and predictive outcomes.

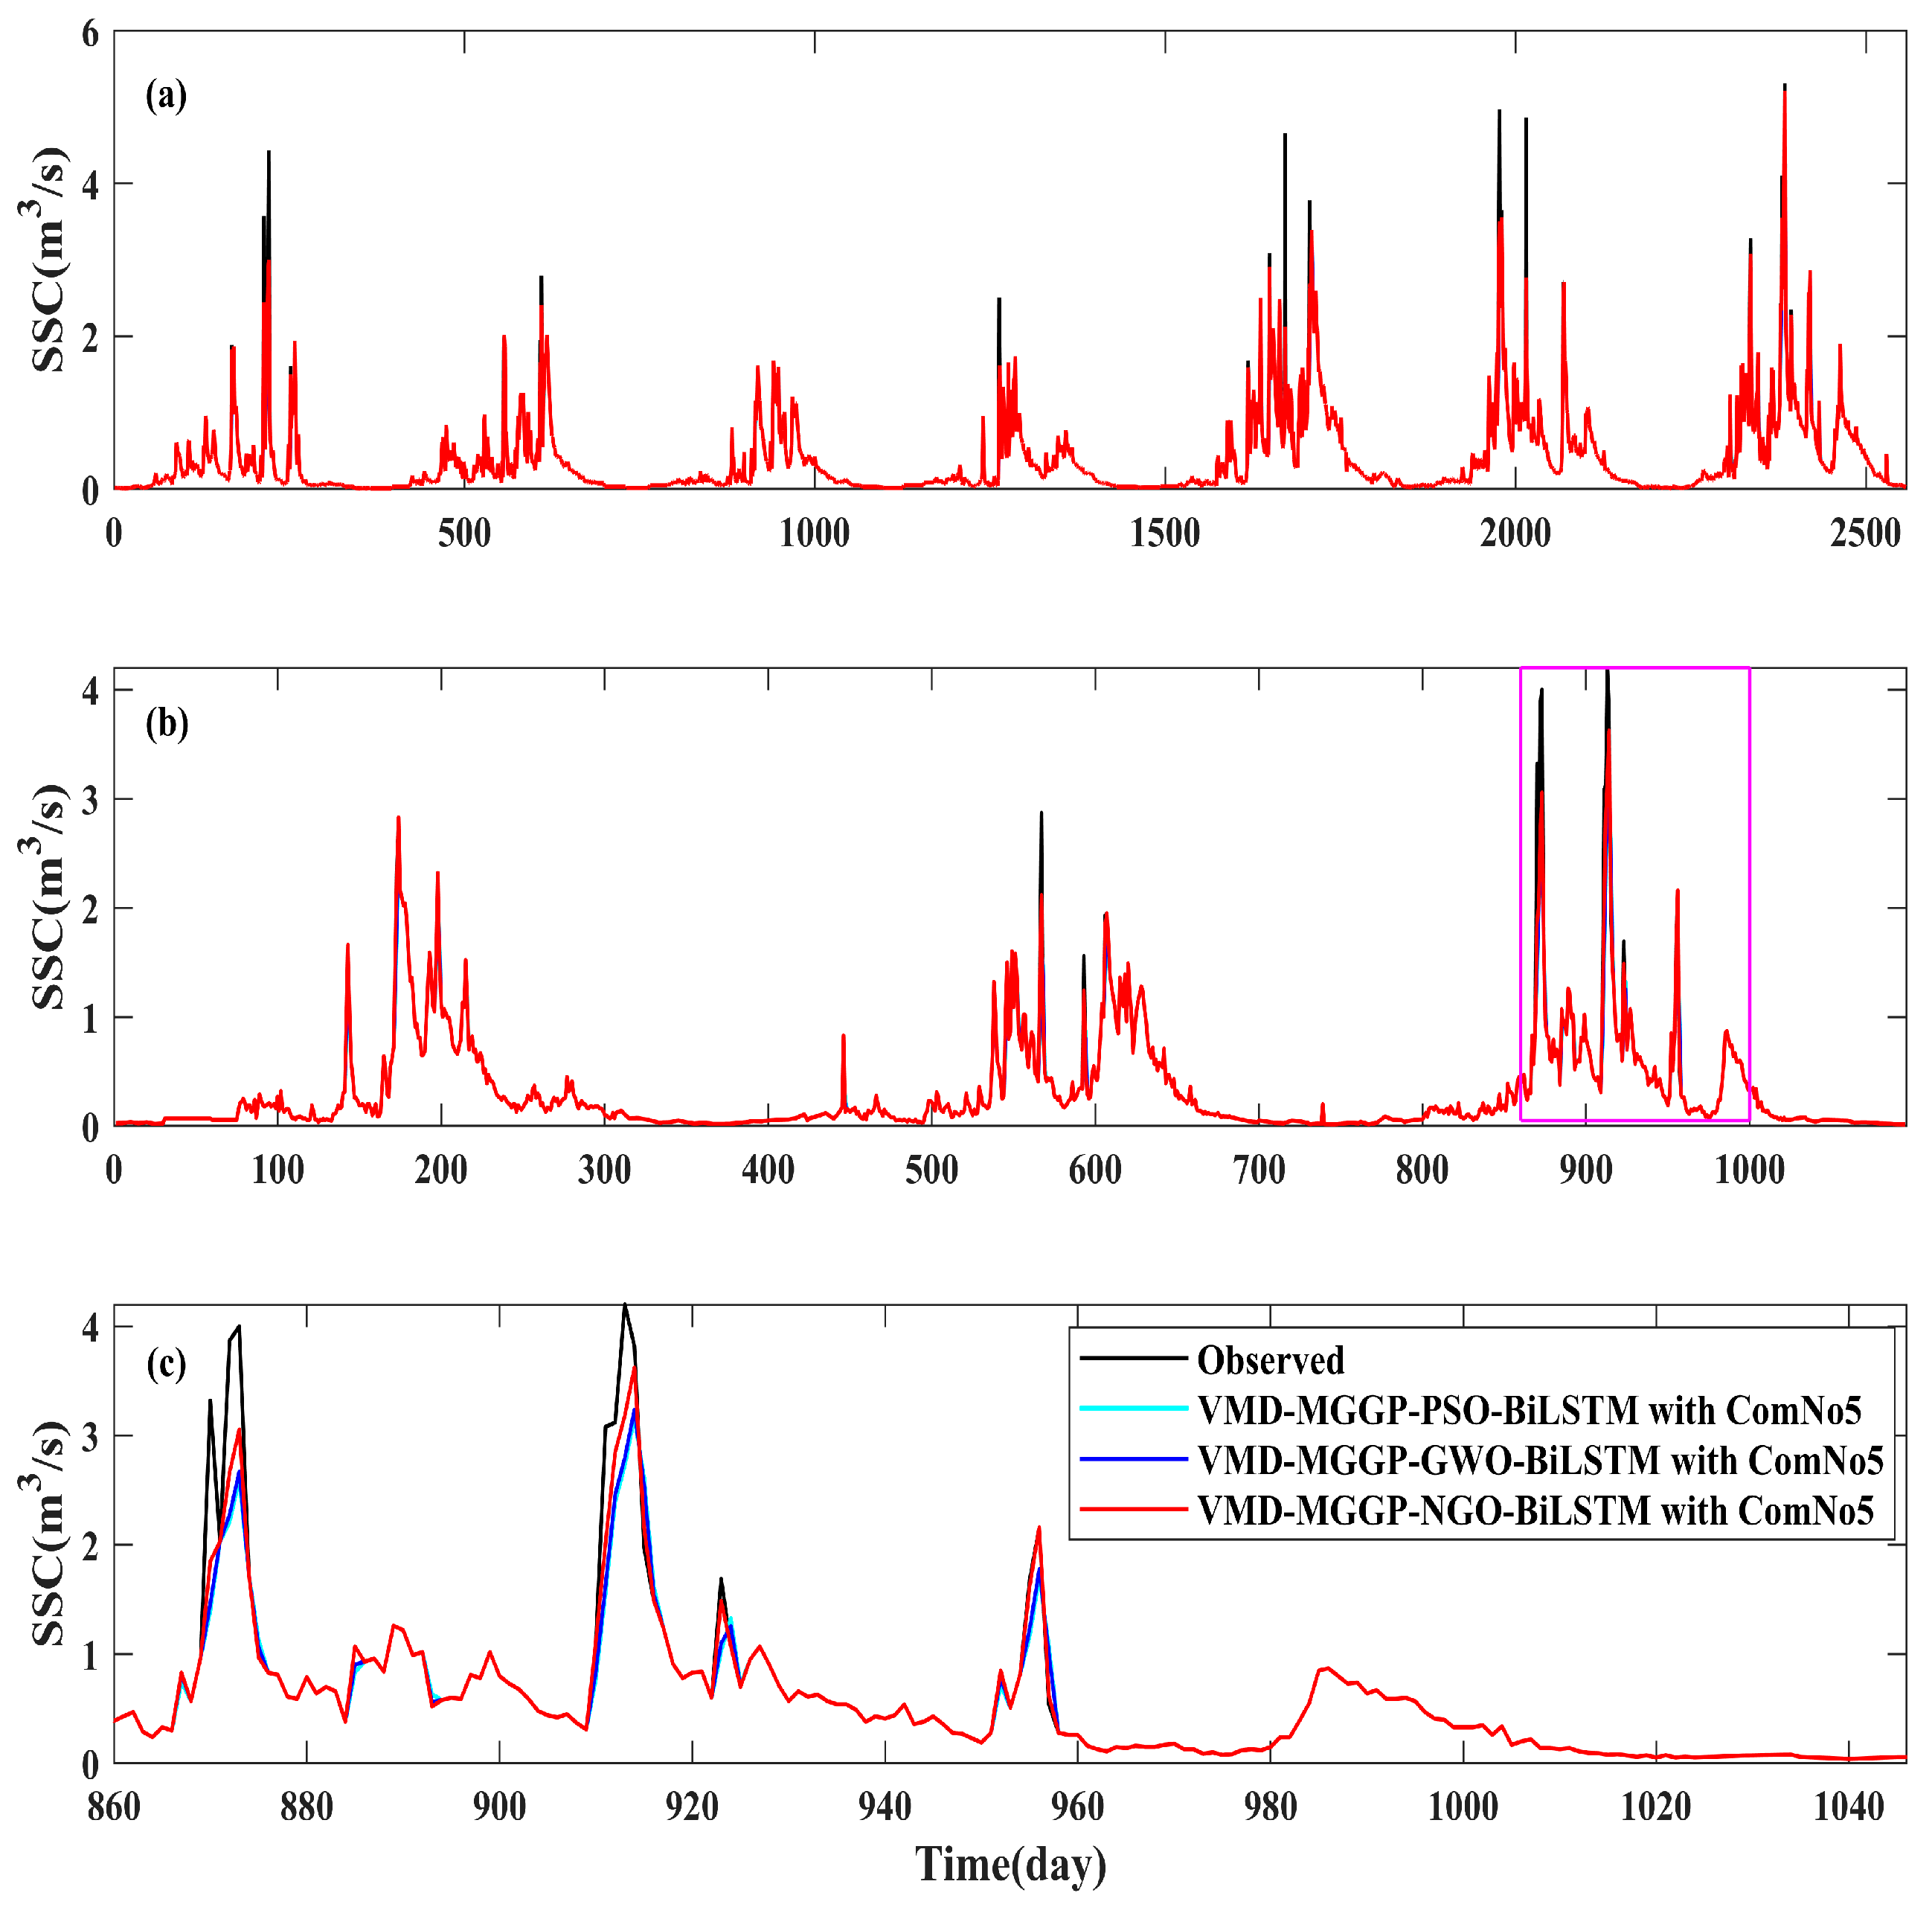
4.4.3. Evaluation of Different Optimization Algorithms: NGO vs. PSO and GWO

This section presents a comparative analysis of three optimization algorithms—NGO, PSO, and GWO—by substituting PSO and GWO for NGO in the final model integration stage. Their performance is subsequently compared with that of the NGO-based integration to validate the effectiveness of the proposed optimization strategy.
Specifically, two alternative ensemble models—VMD-MGGP-NGO-BiLSTM-PSO and VMD-MGGP-NGO-BiLSTM-GWO—are constructed by substituting PSO and GWO into the integration phase of the original framework. For a fair comparison, the same ten combined input vectors (ComNo1 to ComNo10) are used for all three models. These combination inputs, composed of sub-sequences with strong linear correlations to the target series, enable the models to leverage their respective linear contributions for effective prediction.
The prediction results for the PSO- and GWO-based models are reported in Table 11 and Table 12. Comparing these outcomes with the NGO-based ensemble (Table 6) clearly shows that the VMD-MGGP-NGO-BiLSTM-NGO model achieves superior predictive accuracy. For example, in the case of input combination ComNo5, the testing-phase NSC value for the NGO-integrated model is 0.9708, while the GWO- and PSO-based models achieve NSC values of 0.9334 and 0.9223, respectively. On average, across all ten combinations, the NGO-based model attains an NSC of 0.964, outperforming both GWO (0.927) and PSO (0.909). Figure 14a,b displays the training and testing results for ComNo5 using each of the three models, while Figure 14c focuses on their peak-capturing performance during the testing phase—further highlighting the advantage of the NGO-based integration.
The superior performance of the NGO algorithm over PSO and GWO arises from several key aspects. To begin with, NGO demonstrates enhanced local search capabilities owing to its adaptive balance between exploration and exploitation. This design enables it to efficiently explore local regions while mitigating the risk of premature convergence—a common limitation observed in PSO and GWO. Moreover, NGO possesses strong global search abilities, facilitated by features such as adaptive mutation and the downhill simplex search strategy. These mechanisms allow it to effectively navigate complex and multimodal optimization landscapes, improving its capacity to locate global optimum. A further strength of NGO lies in its robustness to parameter tuning. In contrast to PSO and GWO, which often require meticulous adjustment of algorithmic parameters, NGO consistently delivers reliable results across a broad spectrum of settings, thereby reducing the burden of manual calibration and enhancing practical usability. Equally important, NGO is adept at handling non-differentiable or discontinuous objective functions, as it employs a direct search strategy rather than relying on gradient information. This makes it well suited for a wider range of real-world optimization problems that are not easily addressed by derivative-based algorithms. Lastly, the simplicity and clarity of NGO’s algorithmic structure contribute to its accessibility. Its intuitive design streamlines implementation and interpretation, making it easier to adopt compared to the more intricate configurations of PSO and GWO. These combined advantages render NGO both a powerful and practical optimization tool, particularly for complex forecasting tasks such as SSC prediction.

5. Discussion

Accurately predicting SSC is of paramount importance. Traditional methods such as the Sediment Rating Curve (SRC) and shallow Artificial Neural Networks (ANN) are often inadequate, particularly under complex climatic conditions, as they fail to effectively capture the nonlinear relationships among key variables [56]. In a study by Fan et al. (2023), SRC, ANN, CNN, and LSTM models were applied to sediment prediction at the Tangnaihai Hydrological Station on the Yellow River [56]. Due to the strong nonlinearity between streamflow and sediment load, the NSC values in the testing phase for SRC and ANN were only 0.4036 and 0.6321, respectively—both falling below the commonly accepted threshold of 0.75.
Deep learning approaches, due to their ability to capture sequential dependencies through multiple hidden layers, offer the potential to learn intrinsic data patterns. However, in highly nonlinear and complex scenarios, standalone models often struggle to achieve satisfactory performance for tasks such as SSC prediction [24,26,56]. This has led to the growing use of ensemble learning, which offers a promising alternative for improving prediction robustness and accuracy.
Three main strategies have been adopted in ensemble modeling. First, the integration of data preprocessing techniques with prediction models: these techniques decompose time series into sub-signals of varying frequencies and remove redundancy, significantly improving model performance. Second, the integration of prediction models with optimization algorithms, which enables efficient and accurate tuning of model parameters without relying on manual trial-and-error procedures. Third, the combination of multiple prediction models: by aggregating outputs from different models, ensemble frameworks can offset the limitations of individual models while leveraging their respective strengths, thereby enhancing stability and overall predictive capability.
Based on the above rationale, this study proposes an integrated hybrid model, VMD-MGGP-NGO-BiLSTM-NGO, which combines the VMD and MGGP techniques for data preprocessing, the BiLSTM deep learning model for sequence prediction, and the NGO optimization algorithm for parameter tuning and ensemble integration. Unlike conventional ensemble models that apply simple averaging, this framework employs NGO to optimize the contribution weights of individual sub-models, thereby enhancing ensemble performance.
The results clearly demonstrate that the proposed VMD-MGGP-NGO -BiLSTM-NGO model outperforms both the VMD-MGGP-NGO-BiLSTM and the VMD-MGGP-NGO-BiLSTM-AVE models. This highlights the benefit of integrating individual models to mitigate their limitations and achieve superior outcomes, as supported by prior research [1,46,50]. Moreover, the effectiveness of the VMD method and the performance of optimization algorithms in time series forecasting are consistent with the findings of previous studies [24,32,34,35,36,40,72,73,74,75,76,77,78].
In natural river systems, sediment transport dynamics are influenced by a wide range of factors, including vegetation cover, grain size distribution, soil conservation practices, and terrain characteristics [23]. Although this study primarily focuses on the role of flow discharge as a dominant controlling factor, future work should consider incorporating these additional environmental and anthropogenic influences to enhance model robustness and interpretability. A more comprehensive framework would facilitate deeper insights into the mechanisms driving sediment dynamics across varied hydrological contexts.
Furthermore, this study utilizes VMD as the signal decomposition method and MGGP for feature selection. For future studies, alternative decomposition approaches such as Wavelet Transform (WT), Maximal Overlap Discrete Wavelet Transform (MODWT), and Multi-Level or Multi-Scale Principal Trend Denoising should be explored to further improve model generalization.
Lastly, although the Tangnaihai Station in the upper Yellow River is not characterized by exceptionally high sediment loads, it was selected due to its minimal anthropogenic interference and its role as a national-level hydrological control station. In future research, we plan to extend this analysis to the middle reaches of the Yellow River, where sediment transport is more variable and subject to stronger human interventions. This will help assess the adaptability and transferability of the proposed model in more complex sediment-laden environments.

6. Conclusions

In conclusion, this study proposes a novel and structurally integrated ensemble model—VMD-MGGP-NGO-BiLSTM-NGO—that innovatively combines signal decomposition, feature screening, and dual-stage optimization for accurate SSC prediction. Through comprehensive evaluation using data from the Tangnaihai Hydrological Station, the following key findings were obtained:
(1)
The proposed model significantly outperformed classical machine learning baselines, achieving a 19.93% improvement in NSC over XGBoost and 15.26% over CNN-LSTM during the testing phase.
(2)
Compared to the averaging-based ensemble (VMD-MGGP-NGO- BiLSTM-AVE), the proposed NGO-optimized model achieved further performance gains—for instance, NSC increased by 7.91% for ComNo1 and 7.92% for ComNo2.
(3)
When replacing NGO with GWO and PSO in the ensemble optimization phase, the proposed model still maintained superior generalization, achieving an average NSC of 0.964, compared to 0.927 (GWO) and 0.909 (PSO), highlighting its robustness and adaptability in complex prediction tasks.
In a river ecosystem, sediment transport dynamics are affected by vegetation, grain size, soil conservation, and terrain. Although this study emphasizes flow discharge, incorporating other factors in future analyses is vital to improve predictive precision. Integration of these factors is advised for a holistic comprehension of river sediment dynamics. Moreover, in forthcoming research, exploring other decomposition approaches, including Wavelet Transform (WT), Maximal Overlap Discrete Wavelet Transform (MODWT), and Multi-Level Principal Trend Denoising is advisable.

Author Contributions

Conceptualization, J.F. and R.L.; methodology, J.F.; software, J.F.; validation, R.L., M.Z. and X.P.; formal analysis, M.Z.; investigation, X.P.; resources, J.F.; data curation, M.Z.; writing—original draft preparation, J.F. and R.L.; writing—review and editing, R.L.; visualization, J.F. and X.P.; supervision, J.F and M.Z. All authors have read and agreed to the published version of the manuscript.

Funding

Natural Resources Science and Technology Project of Jiangsu Province (JSZRKJ202403) and Self-established Postdoctoral Fund BSHZL202103 of the Yellow River Engineering Consulting Co., Ltd. support this research.

Data Availability Statement

The original contributions presented in this study are included in the article. Further inquiries can be directed to the corresponding author.

Acknowledgments

The authors are deeply grateful to the National Science & Technology Infrastructure and the National Earth System Science Data Center for providing the datasets utilized in this research. Special recognition is also given to the staff involved in data acquisition, processing, and server management for their commitment and support.

Conflicts of Interest

The authors declare no conflicts of interest.

References

  1. Abramson, J.; Adler, J.; Dunger, J.; Evans, R.; Green, T.; Pritzel, A.; Ronneberger, O.; Willmore, L.; Ballard, A.J.; Bambrick, J.; et al. Accurate structure prediction of biomolecular interactions with AlphaFold 3. Nature 2024, 630, 493–500. [Google Scholar] [CrossRef] [PubMed]
  2. Agarwal, V.; Singh, B.V.R.; Marsh, S.; Qin, Z.; Sen, A.; Kulhari, K. Integrated remote sensing for enhanced drought assessment: A multi-index approach in Rajasthan, India. Earth Space Sci. 2025, 12, e2024EA003639. [Google Scholar] [CrossRef]
  3. Song, H.; Chen, Q.; Jiang, T.; Li, Y.; Li, X.; Xi, W.; Huang, S. Applying ensemble models based on graph neural network and reinforcement learning for wind power forecasting. arXiv 2025, arXiv:2501.16591. [Google Scholar]
  4. Haq, M.A. CDLSTM: A novel model for climate change forecasting. Comput. Mater. Contin. 2022, 71, 2363–2381. [Google Scholar]
  5. Alhuqayl, S.O.; Alenazi, A.T.; Alabduljabbar, H.A.; Haq, M.A. Improving Predictive Maintenance in Industrial Environments via IIoT and Machine Learning. Int. J. Adv. Comput. Sci. Appl. 2024, 15, 627–636. [Google Scholar] [CrossRef]
  6. Alabdulwahab, A.; Haq, M.A.; Alshehri, M. Cyberbullying detection using machine learning and deep learning. Int. J. Adv. Comput. Sci. Appl. 2023, 14, 424–432. [Google Scholar] [CrossRef]
  7. Haq, M.A.; Khan, M.Y.A. Crop water requirements with changing climate in an arid region of Saudi Arabia. Sustainability 2022, 14, 13554. [Google Scholar] [CrossRef]
  8. Haq, M.A. SMOTEDNN: A novel model for air pollution forecasting and AQI classification. Comput. Mater. Contin. 2022, 71, 1404–1425. [Google Scholar]
  9. Nguyen, B.Q.; Van Binh, D.; Tran, T.N.D.; Kantoush, S.A.; Sumi, T. Response of streamflow and sediment variability to cascade dam development and climate change in the Sai Gon Dong Nai River basin. Clim. Dyn. 2004, 62, 7997–8017. [Google Scholar] [CrossRef]
  10. Khosravi, K.; Golkarian, A.; Melesse, A.M.; Deo, R.C. Suspended sediment load modeling using advanced hybrid rotation forest based elastic network approach. J. Hydrol. 2022, 610, 127963. [Google Scholar] [CrossRef]
  11. Harrington, S.T.; Harrington, J.R. An assessment of the suspended sediment rating curve approach for load estimation on the Rivers Bandon and Owenabue, Ireland. Geomorphology 2013, 185, 27–38. [Google Scholar] [CrossRef]
  12. Zhang, W.; Wei, X.; Jinhai, Z.; Yuliang, Z.; Zhang, Y. Estimating suspended sediment loads in the Pearl River Delta region using sediment rating curves. Cont. Shelf Res. 2012, 38, 35–46. [Google Scholar] [CrossRef]
  13. Guillén, J.; Jiménez, J.A.; Palanques, A.; Gràcia, V.; Puig, P.; Sánchez-Arcilla, A. Sediment resuspension across a microtidal, low-energy inner shelf. Cont. Shelf Res. 2002, 22, 305–325. [Google Scholar] [CrossRef]
  14. Tseng, C.Y.; Tinoco, R.O. A two-layer turbulence-based model to predict suspended sediment concentration in flows with aquatic vegetation. Geophys. Res. Lett. 2021, 48, e2020GL091255. [Google Scholar] [CrossRef]
  15. Adnan, R.M.; Liang, Z.; Heddam, S.; Zounemat-Kermani, M.; Kisi, O.; Li, B. Least square support vector machine and multivariate adaptive regression splines for streamflow prediction in mountainous basin using hydro-meteorological data as inputs. J. Hydrol. 2020, 586, 124371. [Google Scholar] [CrossRef]
  16. Liu, G.; Guo, J.B. Bidirectional LSTM with attention mechanism and convolutional layer for text classification. Neurocomputing 2019, 337, 325–338. [Google Scholar] [CrossRef]
  17. Wu, B.; van Maren, D.S.; Li, L. Predictability of sediment transport in the Yellow River using selected transport formulas. Int. J. Sediment Res. 2008, 23, 283–298. [Google Scholar] [CrossRef]
  18. Kisi, O.; Zounemat-Kermani, M. Suspended Sediment Modeling Using Neuro-Fuzzy Embedded Fuzzy c-Means Clustering Technique. Water Resour. Manag. 2016, 30, 3979–3994. [Google Scholar] [CrossRef]
  19. Kaveh, K.; Kaveh, H.; Bui, M.D.; Rutschmann, P. Long short-term memory for predicting daily suspended sediment concentration. Eng. Comput. 2021, 37, 2013–2027. [Google Scholar] [CrossRef]
  20. Liu, Z.; Zhou, P.; Chen, X.; Guan, Y. A multivariate conditional model for streamflow prediction and spatial precipitation refinement. J. Geophys. Res. Atmos. 2015, 120, 10,116–10,129. [Google Scholar] [CrossRef]
  21. Marshall, S.R.; Tran, T.N.D.; Tapas, M.R.; Nguyen, B.Q. Integrating artificial intelligence and machine learning in hydrological modeling for sustainable resource management. Int. J. River Basin Manag. 2025, 1–17. [Google Scholar] [CrossRef]
  22. Gao, S.; Huang, Y.; Zhang, S.; Han, J.; Wang, G.; Zhang, M.; Lin, Q. Short-term runoff prediction with GRU and LSTM networks without requiring time step optimization during sample generation. J. Hydrol. 2020, 589, 125188. [Google Scholar] [CrossRef]
  23. Fang, L.Z.; Shao, D.G. Application of Long Short-Term Memory (LSTM) on the Prediction of Rainfall-Runoff in Karst Area. Front. Phys. 2022, 9, 790687. [Google Scholar] [CrossRef]
  24. Nourani, V.; Behfar, N. Multi-station runoff-sediment modeling using seasonal LSTM models. J. Hydrol. 2021, 601, 126672. [Google Scholar] [CrossRef]
  25. Li, S.C.; Xie, Q.C.; Yang, J. Daily suspended sediment forecast by an integrated dynamic neural network. J. Hydrol. 2022, 604, 127258. [Google Scholar] [CrossRef]
  26. Siami-Namini, S.; Tavakoli, N.; Namin, A.S. The Performance of LSTM and BiLSTM in Forecasting Time Series. In Proceedings of the 2019 IEEE International Conference on Big Data (Big Data), Los Angeles, CA, USA, 9–12 December 2019; pp. 3285–3292. [Google Scholar]
  27. Wang, J.; Wang, X.; Thiam Khu, S. A Decomposition-based Multi-model and Multiparameter Ensemble Forecast Framework for Monthly Streamflow Forecasting. J. Hydrol. 2023, 618, 129083. [Google Scholar] [CrossRef]
  28. Dhaka, P.; Nagpal, B. WoM-based deep BiLSTM: Smart disease prediction model using WoM-based deep BiLSTM classifier. Multimed. Tools Appl. 2023, 82, 25061–25082. [Google Scholar] [CrossRef]
  29. Xia, D.W.; Yang, N.; Jian, S.Y.; Hu, Y.; Li, H.Q. SW-BiLSTM: A Spark-based weighted BiLSTM model for traffic flow forecasting. Multimed. Tools Appl. 2022, 81, 23589–23614. [Google Scholar] [CrossRef]
  30. Ni, L.; Wang, D.; Wu, J.; Wang, Y.; Tao, Y.; Zhang, J.; Liu, J. Streamflow forecasting using extreme gradient boosting model coupled with Gaussian mixture model. J. Hydrol. 2020, 586, 124901. [Google Scholar] [CrossRef]
  31. Sun, N.; Zhou, J.; Chen, L.; Jia, B.; Tayyab, M.; Peng, T. An adaptive dynamic short-term wind speed forecasting model using secondary decomposition and an improved regularized extreme learning machine. Energy 2018, 165, 939–957. [Google Scholar] [CrossRef]
  32. Banaie-Dezfouli, M.; Nadimi-Shahraki, M.H.; Beheshti, Z. R-GWO: Representative-based grey wolf optimizer for solving engineering problems. Appl. Soft. Comput. 2021, 106, 107328. [Google Scholar] [CrossRef]
  33. Ch, S.; Anand, N.; Panigrahi, B.K.; Mathur, S. Streamflow forecasting by SVM with quantum behaved particle swarm optimization. Neurocomputing 2013, 101, 18–23. [Google Scholar] [CrossRef]
  34. Cui, J.K.; Liu, T.Y.; Zhu, M.C.; Xu, Z.B. Improved team learning-based grey wolf optimizer for optimization tasks and engineering problems. J. Supercomput. 2023, 79, 10864–10914. [Google Scholar] [CrossRef]
  35. Faris, H.; Aljarah, I.; Al-Betar, M.A.; Mirjalili, S. Grey wolf optimizer: A review of recent variants and applications. Neural Comput. Appl. 2018, 30, 413–435. [Google Scholar] [CrossRef]
  36. Hong, M.; Wang, D.; Wang, Y.; Zeng, X.; Ge, S.; Yan, H.; Singh, V.P. Mid- and long- term runoff predictions by an improved phase-space reconstruction model. Environ. Res. 2016, 148, 560–573. [Google Scholar] [CrossRef]
  37. Lalbakhsh, A.; Afzal, M.U.; Esselle, K.P. Multiobjective Particle Swarm Optimization to Design a Time-Delay Equalizer Metasurface for an Electromagnetic Band-Gap Resonator Antenna. IEEE Antennas Wirel. Propag. Lett. 2017, 16, 912–915. [Google Scholar] [CrossRef]
  38. Nadimi-Shahraki, M.H.; Taghian, S.; Mirjalili, S. An improved grey wolf optimizer for solving engineering problems. Expert Syst. Appl. 2021, 166, 113917. [Google Scholar] [CrossRef]
  39. Sedki, A.; Ouazar, D.; El Mazoudi, E. Evolving neural network using real coded genetic algorithm for daily rainfall–runoff forecasting. Expert Syst. Appl. 2009, 36, 4523–4527. [Google Scholar] [CrossRef]
  40. Tikhamarine, Y.; Souag-Gamane, D.; Najah Ahmed, A.; Kisi, O.; El-Shafie, A. Improving artificial intelligence models accuracy for monthly streamflow forecasting using grey Wolf optimization (GWO) algorithm. J. Hydrol. 2020, 582, 124435. [Google Scholar] [CrossRef]
  41. Dehghani, M.; Hubalovsky, S.; Trojovsky, P. Northern Goshawk Optimization: A New Swarm-Based Algorithm for Solving Optimization Problems. IEEE Access 2021, 9, 162059–162080. [Google Scholar] [CrossRef]
  42. El-Dabah, M.A.; El-Sehiemy, R.A.; Hasanien, H.M.; Saad, B. Photovoltaic model parameters identification using Northern Goshawk Optimization algorithm. Energy 2023, 262, 125522. [Google Scholar] [CrossRef]
  43. Jasim, M.J.M.; Hussan, B.K.; Zeebaree, S.R.M.; Ageed, Z.S. Automated Colonic Polyp Detection and Classification Enabled Northern Goshawk Optimization with Deep Learning. CMC-Comput. Mater. Contin. 2023, 75, 3677–3693. [Google Scholar] [CrossRef]
  44. Wen, X.; Feng, Q.; Deo, R.C.; Wu, M.; Yin, Z.; Yang, L.; Singh, V.P. Two-phase extreme learning machines integrated with the complete ensemble empirical mode decomposition with adaptive noise algorithm for multi-scale runoff prediction problems. J. Hydrol. 2019, 570, 167–184. [Google Scholar] [CrossRef]
  45. Mi, X.; Zhao, S. Wind speed prediction based on singular spectrum analysis and neural network structural learning. Energ. Convers. Manag. 2020, 216, 112956. [Google Scholar] [CrossRef]
  46. Zhao, X.; Chen, X.; Huang, Q. Trend and long-range correlation characteristics analysis of runoff in upper Fenhe River basin. Water Resour. 2017, 44, 31–42. [Google Scholar] [CrossRef]
  47. Ali, M.; Prasad, R. Significant wave height forecasting via an extreme learningmachine model integrated with improved complete ensemble empirical mode decomposition. Renew. Sustain. Energy Rev. 2019, 104, 281–295. [Google Scholar] [CrossRef]
  48. Dragomiretskiy, K.; Zosso, D. Variational Mode Decomposition. IEEE Trans. Signal Process. 2014, 62, 531–544. [Google Scholar] [CrossRef]
  49. Karaaslan, O.F.; Bilgin, G. Comparison of Variational Mode Decomposition and Empirical Mode Decomposition Features for Cell Segmentation in Histopathological Images. In Proceedings of the 2020 Medical Technologies Congress (TIPTEKNO), Online, 19–20 November 2020. [Google Scholar]
  50. Lian, J.J.; Liu, Z.; Wang, H.J.; Dong, X.F. Adaptive variational mode decomposition method for signal processing based on mode characteristic. Mech. Syst. Signal Process. 2018, 107, 53–77. [Google Scholar] [CrossRef]
  51. Malhotra, V.; Sandhu, M.K. Electrocardiogram signals denoising using improved variational mode decomposition. J. Med. Signals Sens. 2021, 11, 100–107. [Google Scholar] [CrossRef]
  52. Palanisamy, T. Smoothing the difference-based estimates of variance using variational mode decomposition. Commun. Stat.-Simul. Comput. 2017, 46, 4991–5001. [Google Scholar] [CrossRef]
  53. Rahul, S.; Sunitha, R. Dominant Electromechanical Oscillation Mode Identification using Modified Variational Mode Decomposition. Arab. J. Sci. Eng. 2021, 46, 10007–10021. [Google Scholar] [CrossRef]
  54. Wang, J.Y.; Li, J.G.; Wang, H.T.; Guo, L.X. Composite fault diagnosis of gearbox based on empirical mode decomposition and improved variational mode decomposition. J. Low Freq. Noise Vib. Act. Control. 2021, 40, 332–346. [Google Scholar] [CrossRef]
  55. Yue, Y.; Sun, G.; Cai, Y.; Chen, R.; Wang, X.; Zhang, S. Comparison of performances of variational mode decomposition and empirical mode decomposition. In Proceedings of the 3rd International Conference on Energy Science and Applied Technology (ESAT 2016), Wuhan, China, 25–26 June 2016; pp. 469–476. [Google Scholar]
  56. Fan, J.; Liu, X.; Li, W. Daily suspended sediment concentration forecast in the upper reach of Yellow River using a comprehensive integrated deep learning model. J. Hydrol. 2023, 623, 129732. [Google Scholar] [CrossRef]
  57. Wang, H.S.; Zhang, Y.P.; Liang, J.; Liu, L.L. DAFA-BiLSTM: Deep Autoregression Feature Augmented Bidirectional LSTM network for time series prediction. Neural Netw. 2023, 157, 240–256. [Google Scholar] [CrossRef]
  58. Liu, X.; Li, W. MGC-LSTM: A deep learning model based on graph convolution of multiple graphs for PM2.5 prediction. Int. J. Environ. Sci. Technol. 2023, 20, 10297–10312. [Google Scholar] [CrossRef]
  59. Zhang, X.Q.; Wang, X.; Li, H.Y.; Sun, S.F.; Liu, F. Monthly runoff prediction based on a coupled VMD-SSA-BiLSTM model. Sci. Rep. 2023, 13, 13149. [Google Scholar] [CrossRef]
  60. Huang, C.C.; Chang, M.J.; Lin, G.F.; Wu, M.C.; Wang, P.H. Real-time forecasting of suspended sediment concentrations reservoirs by the optimal integration of multiple machine learning techniques. J. Hydrol.-Reg. Stud. 2021, 34, 100804. [Google Scholar] [CrossRef]
  61. Searson, D.P.; Willis, M.J.; Montague, G.A. GPTIPS: An open-source genetic programming toolbox for multigene symbolic regression. Proc. Int. Multi-Conf. Eng. Comput. Sci. 2010, 1, 77–80. [Google Scholar]
  62. Bengio, Y.; Simard, P.; Frasconi, P. Learning long-term dependencies with gradient descent is difficult. IEEE Trans. Neural Netw. 1994, 5, 157–166. [Google Scholar] [CrossRef]
  63. Gers, F.A.; Schmidhuber, J.; Cummins, F. Learning to forget: Continual prediction with LSTM. In Proceedings of the 1999 Ninth International Conference on Artificial Neural Networks ICANN 99. (Conf. Publ. No. 470), Edinburgh, UK, 7–10 September 1999; Volume 2, pp. 850–855. [Google Scholar] [CrossRef]
  64. Dehghani, M. Northern Goshawk Optimization: A New Swarm-Based Algorithm MATLAB Central File Exchang. 2023. Available online: https://www.mathworks.com/matlabcentral/fileexchange/106665-northern-goshawk-optimization-a-new-swarm-based-algorithm (accessed on 12 February 2022).
  65. Moriasi, D.N.; Arnold, J.G.; van Liew, M.W.; Bingner, R.L.; Harmel, R.D.; Veith, T.L. Model Evaluation Guidelines for Systematic Quantification of Accuracy in Watershed Simulations. Trans. ASABE 2007, 50, 885–900. [Google Scholar] [CrossRef]
  66. Khan, M.M.H.; Muhammad, N.S.; El-Shafie, A. Wavelet based hybrid ANN-ARIMA models for meteorological drought forecasting. J. Hydrol. 2020, 590, 125380. [Google Scholar] [CrossRef]
  67. Adaryani, F.R.; Mousavi, S.J.; Jafari, F. Short-term rainfall forecasting using machine learning-based approaches of PSO-SVR, LSTM and CNN. J. Hydrol. 2022, 614, 128463. [Google Scholar] [CrossRef]
  68. Xu, J.; Anctil, F.; Boucher, M.A. Exploring hydrologic post-processing of ensemble stream flow forecasts based on Affine kernel dressing and Nondominated sorting genetic algorithm II. Hydrol. Earth Syst. Sci. Discuss. 2020, 2020, 1–34. [Google Scholar] [CrossRef]
  69. Troin, M.; Arsenault, R.; Wood, A.W.; Brissette, F.; Martel, J.L. Generating Ensemble Streamflow Forecasts: A Review of Methods and Approaches Over the Past 40 Years. Water Resour. Res. 2021, 57, e2020WR028392. [Google Scholar] [CrossRef]
  70. Zhang, S.; Wu, J.; Wang, Y.G.; Jeng, D.S.; Li, G. A physics-informed statistical learning framework for forecasting local suspended sediment concentrations in marine environment. Water Res. 2022, 218, 118518. [Google Scholar] [CrossRef]
  71. Zuo, G.; Luo, J.; Wang, N.; Lian, Y.; He, X. Decomposition ensemble model based on variational mode decomposition and long short-term memory for streamflow forecasting. J. Hydrol. 2020, 585, 124776. [Google Scholar] [CrossRef]
  72. Tian, Z.D. Modes decomposition forecasting approach for ultra-short-term wind speed. Appl. Soft. Comput. 2021, 105, 107303. [Google Scholar] [CrossRef]
  73. Sun, Z.X.; Zhao, M.Y.; Zhao, G.H. Hybrid model based on VMD decomposition, clustering analysis, long short memory network, ensemble learning and error complementation for short-term wind speed forecasting assisted by Flink platform. Energy 2022, 261, 125248. [Google Scholar] [CrossRef]
  74. Samantaray, S.; Sahoo, A.; Ghose, D.K. Assessment of Sediment Load Concentration Using SVM, SVM-FFA and PSR-SVM-FFA in Arid Watershed, India: A Case Study. KSCE J. Civ. Eng. 2020, 24, 1944–1957. [Google Scholar] [CrossRef]
  75. Serra, T.; Soler, M.; Barcelona, A.; Colomer, J. Suspended sediment transport and deposition in sediment-replenished artificial floods in Mediterranean rivers. J. Hydrol. 2022, 609, 127756. [Google Scholar] [CrossRef]
  76. Sudheer, K.P.; Gosain, A.K.; Ramasastri, K.S. A data-driven algorithm for constructing artificial neural network rainfall-runoff models. Hydrol. Process. 2002, 16, 1325–1330. [Google Scholar] [CrossRef]
  77. Yu, M.; Niu, D.; Gao, T.; Wang, K.; Sun, L.; Li, M.; Xu, X. A novel framework for ultra-short-term interval wind power prediction based on RF-WOA-VMD and BiGRU optimized by the attention mechanism. Energy 2023, 269, 126738. [Google Scholar] [CrossRef]
  78. Zang, H.; Liu, L.; Sun, L.; Cheng, L.; Wei, Z.; Sun, G. Short-term global horizontal irradiance forecasting based on a hybrid CNN-LSTM model with spatiotemporal correlations. Renew. Energy 2020, 160, 26–41. [Google Scholar] [CrossRef]
Figure 1. Framework of the proposed ensemble model.
Land 14 01199 g001
Figure 2. Gene crossover (a) and mutation (b) in MGGP.
Land 14 01199 g002
Figure 3. Schematic diagram of the BiLSTM cell.
Land 14 01199 g003
Figure 4. The working of NGO.
Land 14 01199 g004
Figure 5. Geographical location of the Tangnaihai Hydrological Station in the upper reaches of the Yellow River Basin, China.
Land 14 01199 g005
Figure 6. Correlation graph of the SSC data. (a) auto-correlation function graph, (b) partial auto-correlation function graph.
Land 14 01199 g006
Figure 7. Pareto front plot for the MGGP.
Land 14 01199 g007
Figure 8. A Pareto front showing contribution weights for each gene.
Land 14 01199 g008
Figure 9. Comparison of the XGBoost, CNN-LSTM, VMD-MGGP-NGO-BiLSTM, and VMD-MGGP-NGO-BiLSTM-NGO models for Tangnaihai Station. (a) Training period, (b) testing period, (c) Enlarged view of the highlighted rectangular region in (b). The pink rectangle in (b) marks the segment that is magnified in (c) for detailed comparison.
Land 14 01199 g009
Figure 10. Histogram of predicted performance indicators of XGBoost, CNN-LSTM, VMD-MGGP-NGO-BiLSTM, and VMD-MGGP-NGO-BiLSTM-NGO models in the test phase for Tangnaihai Station.
Land 14 01199 g010
Figure 11. Scatter plot of four models for Tangnaihai Station. (a) XGBoost, (b) CNN-LSTM, (c) VMD-MGGP-NGO-BiLSTM, and (d) VMD-MGGP-NGO-BiLSTM-NGO.
Land 14 01199 g011
Figure 12. Comparison of NGO-BiLSTM and VMD-MGGP-NGO-BiLSTM for Input-No7 and Input-No13. (a) Training period, (b) testing period, (c) Enlarged view of the highlighted rectangular region in (b). The pink rectangle in (b) marks the segment that is magnified in (c) for detailed comparison.
Land 14 01199 g012
Figure 13. Comparison of VMD-MGGP-NGO-BiLSTM-AVE, and VMD-MGGP-NGO-BiLSTM-NGO models for ComNo4 and ComNo5. (a) Training samples, (b) testing samples, (c) Enlarged view of the highlighted rectangular region in (b). The pink rectangle in (b) marks the segment that is magnified in (c) for detailed comparison.
Land 14 01199 g013
Figure 14. Comparison of VMD-MGGP-NGO-BiLSTM-PSO, VMD-MGGP-NGO-BiLSTM-GWO and VMD-MGGP-NGO-BiLSTM-NGO models for ComNo5. (a) Training samples, (b) testing samples, (c) the expanded pictures of the rectangular boxes.
Land 14 01199 g014
Table 1. Statistical parameters of used data.
PeriodVariablesMeanStandard DeviationCoefficient of VariationSkewnessMaximumMinimum
TrainingFlow (m3s−1)741.566820.931.9935390108
SSC (kgl−1)0.37230.51931.442.2225.310.011
TestingFlow (m3s−1)630.4507.020.821.3542620147
SSC (kgl−1)0.34620.59391.712.9424.200.013
Table 2. 26 Input vectors for BiLSTM.
No.VectorNo.Vector
Input-No1Q(t)Input-No14SSC(t−1), SSC(t−2), SSC(t−3), Q(t−1), Q(t−2),
Q(t−3)
Input-No2SSC(t−1)Input-No15SSC(t−1), SSC(t−2), SSC(t−4), Q(t−1), Q(t−2),
Q(t−4)
Input-No3SSC(t−1), Q(t)Input-No16SSC(t−1), SSC(t−3), SSC(t−4), Q(t−1), Q(t−3),
Q(t−4)
Input-No4SSC(t−1), Q(t−1)Input-No17SSC(t−2), SSC(t−3), SSC(t−4), Q(t−2), Q(t−3),
Q(t−4)
Input-No5SSC(t−2), Q(t−2)Input-No18SSC(t−1), SSC(t−2), SSC(t−3), SSC(t−4), Q(t−1),
Q(t−2), Q(t−3), Q(t−4)
Input-No6SSC(t−3), Q(t−3)Input-No19SSC(t−1), Q(t), Q(t−1)
Input-No7SSC(t−4), Q(t−4)Input-No20SSC(t−1), SSC(t−2), Q(t), Q(t−1), Q(t−2)
Input-No8SSC(t−1), SSC(t−2), Q(t−1), Q(t-2Input-No21SSC(t−1), SSC(t−3), Q(t), Q(t−1), Q(t−3)
Input-No9SSC(t−1), SSC(t−3), Q(t−1), Q(t−3)Input-No22SSC(t−1), SSC(t−4), Q(t), Q(t−1), Q(t−4)
Input-No10SSC(t−1), SSC(t−4), Q(t−1), Q(t−4)Input-No23SSC(t−1), SSC(t−2),
SSC(t−3), Q(t), Q(t−1), Q(t−2), Q(t−3)
Input-No11SSC(t−2), SSC(t−3), Q(t−2), Q(t−3)Input-No24SSC(t−1), SSC(t−2), SSC(t−4), Q(t), Q(t−1), Q(t−2),
Q(t−4)
Input-No12SSC(t−2), SSC(t−4), Q(t−4), Q(t−2)Input-No25SSC(t−1), SSC(t−3),
SSC(t−4), Q(t), Q(t−1), Q(t−3), Q(t−4)
Input-No13SSC(t−3), SSC(t−4), Q(t−3), Q(t−4)Input-No26SSC(t−1), SSC(t−2), SSC(t−3), SSC(t−4), Q(t),
Q(t−1), Q(t−2), Q(t−3), Q(t−4)
Table 3. Parameter settings for the BiLSTM model (The asterisk * indicates that the parameter requires optimization).
ParameterValueParameterValue
MaxEpochs300Epsilon1.0 × 10−8
InterationsPerEpoch1GradientThresholdMethodl2norm
MaxInterations300GradientThreshold1
OptimizeradamLearnRateSchedule piecewise
InitialLearnRate*LearnRateDropFactor 0.8
DropoutLayerProbability*Number of hidden_units*
Table 4. Performance statistics of the VMD-MGGP-NGO-BiLSTM model.
Model
Inputs
TrainingTesting
MAERMSENSCR2MAERMSENSCR2
Input-No10.03510.19430.87120.87120.03960.18060.86190.8619
Input-No20.02960.18240.88650.88650.03140.16550.88410.8841
Input-No30.02840.17950.89010.89010.03060.16360.88670.8867
Input-No40.03330.19050.87620.87620.03940.18030.86240.8624
Input-No50.03310.19000.87680.87680.03700.17610.86870.8687
Input-No60.03110.18590.88210.88210.03420.17100.87620.8762
Input-No70.03110.18590.88210.88210.04030.18180.86010.8601
Input-No80.02770.17780.89210.89210.03560.17370.87230.8723
Input-No90.02770.17780.89210.89210.03170.16610.88320.8832
Input-No100.03070.18500.88320.88320.03400.17070.87670.8767
Input-No110.02290.16490.90720.90720.02700.15470.89870.8987
Input-No120.03480.19360.87210.87210.03600.17450.87110.8711
Input-No130.03200.18770.87980.87980.03660.17550.86970.8697
Input-No140.03070.18490.88340.88340.03610.17460.87100.8710
Input-No150.03410.19220.87400.87400.04000.18120.86100.8610
Input-No160.02640.17440.89620.89620.03430.17120.87590.8759
Input-No170.03420.19250.87360.87360.04410.18740.85130.8513
Input-No180.03740.19860.86540.86540.04250.18500.85510.8551
Input-No190.03060.18460.88370.88370.03360.17000.87760.8776
Input-No200.03190.18750.88010.88010.03430.17130.87580.8758
Input-No210.03330.19060.87610.87610.04070.18240.85920.8592
Input-No220.03470.19350.87230.87230.03550.17350.87260.8726
Input-No230.02940.18190.88710.88710.03340.16960.87820.8782
Input-No240.02670.17530.89520.89520.03600.17450.87110.8711
Input-No250.03090.18530.88290.88290.03500.17270.87380.8738
Input-No260.03320.19030.87640.87640.03910.17980.86320.8632
Table 5. Optimal weights of each sub-vectors for the VMD-MGGP-NGO-BiLSTM model.
Model
Inputs
Weight of Input Vectors by NGO
123456789101112
ComNo10.301 0.3760.331
ComNo20.258 0.1040.3210.123
ComNo30.210 0.233 0.156 0.178 0.156
ComNo40.139 0.128 0.1610.141 0.1080.128
ComNo50.1370.1210.143 0.101 0.1230.1380.134
ComNo60.152 0.1090.192 0.132 0.1460.1280.1450.099
ComNo70.1420.123 0.101 0.1050.135 0.1230.1080.1320.107
ComNo80.123 0.125 0.135 0.1410.1260.1010.0990.128 0.092 0.093
ComNo90.114 0.135 0.1020.1030.0840.091 0.1060.102 0.115 0.118 0.101
ComNo100.121 0.1040.1430.112 0.123 0.1110.1150.127 0.107 0.1320.1200.098
Table 6. Performance statistics of the VMD-MGGP-NGO-BiLSTM-NGO model.
Model
Inputs
TrainingTesting
MAERMSENSCR2MAERMSENSCR2
ComNo10.0067 0.0935 0.9702 0.9702 0.0090 0.0918 0.9643 0.9643
ComNo20.0068 0.0941 0.9698 0.9698 0.0094 0.0939 0.9627 0.9627
ComNo30.0078 0.1004 0.9656 0.9656 0.0092 0.0929 0.9635 0.9635
ComNo40.0075 0.0986 0.9668 0.9668 0.0095 0.0944 0.9623 0.9623
ComNo50.0059 0.0886 0.9732 0.9732 0.0073 0.0831 0.9708 0.9708
ComNo60.0069 0.0947 0.9694 0.9694 0.0099 0.0962 0.9608 0.9608
ComNo70.0071 0.0962 0.9684 0.9684 0.0087 0.0904 0.9654 0.9654
ComNo80.0071 0.0959 0.9686 0.9686 0.0089 0.0916 0.9645 0.9645
ComNo90.0080 0.1017 0.9647 0.9647 0.0092 0.0930 0.9634 0.9634
ComNo100.0079 0.1011 0.9651 0.9651 0.0095 0.0944 0.9623 0.9623
Table 7. Performance statistics of SRC, ANN, VMD-MGGP-NGO-BiLSTM, and VMD-MGGP-NGO-BiLSTM-NGO models.
Prediction ModelTrainingTesting
MAERMSENSCR2MAERMSENSCR2
XGBoost0.0641 0.2359 0.8102 0.8102 0.0681 0.2121 0.8095 0.8095
CNN-LSTM0.0431 0.2088 0.8513 0.8513 0.0484 0.1930 0.8423 0.8423
VMD-MGGP-NGO-BiLSTM0.0229 0.1649 0.9072 0.9072 0.0270 0.1547 0.8987 0.8987
VMD-MGGP-NGO-BiLSTM-NGO0.0059 0.0886 0.9732 0.9732 0.0073 0.0831 0.9708 0.9708
Table 8. Performance statistics of the NGO-BiLSTM model.
Model
Inputs
TrainingTesting
MAERMSENSCR2MAERMSENSCR2
Input-No10.0568 0.2282 0.8223 0.8223 0.0607 0.2061 0.8201 0.8201
Input-No20.0519 0.2222 0.8315 0.8315 0.0616 0.2069 0.8187 0.8187
Input-No30.0551 0.2262 0.8254 0.8254 0.0601 0.2056 0.8211 0.8211
Input-No40.0516 0.2218 0.8321 0.8321 0.0560 0.2016 0.8279 0.8279
Input-No50.0527 0.2233 0.8299 0.8299 0.0608 0.2062 0.8200 0.8200
Input-No60.0516 0.2218 0.8321 0.8321 0.0568 0.2024 0.8265 0.8265
Input-No70.0496 0.2191 0.8362 0.8362 0.0556 0.2012 0.8286 0.8286
Input-No80.0528 0.2234 0.8297 0.8297 0.0581 0.2037 0.8243 0.8243
Input-No90.0557 0.2269 0.8243 0.8243 0.0606 0.2060 0.8203 0.8203
Input-No100.0516 0.2218 0.8321 0.8321 0.0553 0.2009 0.8291 0.8291
Input-No110.0192 0.1530 0.9201 0.9201 0.0611 0.2064 0.8195 0.8195
Input-No120.0568 0.2282 0.8223 0.8223 0.0617 0.2070 0.8186 0.8186
Input-No130.0502 0.2198 0.8351 0.8351 0.0548 0.2003 0.8301 0.8301
Input-No140.0557 0.2269 0.8244 0.8244 0.0595 0.2050 0.8220 0.8220
Input-No150.0516 0.2218 0.8322 0.8322 0.0545 0.2001 0.8305 0.8305
Input-No160.0624 0.2342 0.8128 0.8128 0.0687 0.2126 0.8087 0.8087
Input-No170.0628 0.2346 0.8123 0.8123 0.0695 0.2132 0.8075 0.8075
Input-No180.0580 0.2296 0.8202 0.8202 0.0661 0.2106 0.8122 0.8122
Input-No190.0555 0.2267 0.8246 0.8246 0.0606 0.2060 0.8203 0.8203
Input-No200.0504 0.2202 0.8346 0.8346 0.0556 0.2012 0.8287 0.8287
Input-No210.0505 0.2203 0.8345 0.8345 0.0543 0.1999 0.8309 0.8309
Input-No220.0540 0.2249 0.8275 0.8275 0.0589 0.2044 0.8231 0.8231
Input-No230.0497 0.2192 0.8361 0.8361 0.0544 0.2000 0.8307 0.8307
Input-No240.0479 0.2165 0.8401 0.8401 0.0537 0.1991 0.8321 0.8321
Input-No250.0524 0.2228 0.8306 0.8306 0.0569 0.2025 0.8263 0.8263
Input-No260.0526 0.2232 0.8301 0.8301 0.0589 0.2044 0.8231 0.8231
Table 9. Percentage improvement in prediction performance indicators for different input vectors under the influence of VMD-MGGP.
Model
Inputs
Testing
MAERMSENSCR2
Input-No1−34.76%−12.37%5.10%5.10%
Input-No2−49.03%−20.01%7.99%7.99%
Input-No3−49.08%−20.43%7.99%7.99%
Input-No4−29.64%−10.57%4.17%4.17%
Input-No5−39.14%−14.60%5.94%5.94%
Input-No6−39.79%−15.51%6.01%6.01%
Input-No7−27.52%−9.64%3.80%3.80%
Input-No8−38.73%−14.73%5.82%5.82%
Input-No9−47.69%−19.37%7.67%7.67%
Input-No10−38.52%−15.03%5.74%5.74%
Input-No11−55.81%−25.05%9.66%9.66%
Input-No12−41.65%−15.70%6.41%6.41%
Input-No13−33.21%−12.38%4.77%4.77%
Input-No14−39.33%−14.83%5.96%5.96%
Input-No15−26.61%−9.45%3.67%3.67%
Input-No16−50.07%−19.47%8.31%8.31%
Input-No17−36.55%−12.10%5.42%5.42%
Input-No18−35.70%−12.16%5.28%5.28%
Input-No19−44.55%−17.48%6.99%6.99%
Input-No20−38.31%−14.86%5.68%5.68%
Input-No21−25.05%−8.75%3.41%3.41%
Input-No22−39.73%−15.12%6.01%6.01%
Input-No23−38.60%−15.20%5.72%5.72%
Input-No24−32.96%−12.36%4.69%4.69%
Input-No25−38.49%−14.72%5.75%5.75%
Input-No26−33.62%−12.04%4.87%4.87%
Average−38.62%−14.77%5.88%5.88%
Table 10. Performance statistics of VMD-MGGP-NGO-BiLSTM-AVE model.
Model
Inputs
TrainingTesting
MAERMSENSCR2MAERMSENSCR2
ComNo10.0270 0.1760 0.8943 0.8943 0.0295 0.1610 0.8902 0.8902
ComNo20.0261 0.1737 0.8971 0.8971 0.0289 0.1596 0.8921 0.8921
ComNo30.0260 0.1735 0.8973 0.8973 0.0295 0.1610 0.8903 0.8903
ComNo40.0282 0.1790 0.8907 0.8907 0.0292 0.1604 0.8911 0.8911
ComNo50.0249 0.1704 0.9009 0.9009 0.0260 0.1519 0.9023 0.9023
ComNo60.0274 0.1770 0.8931 0.8931 0.0295 0.1611 0.8901 0.8901
ComNo70.0278 0.1780 0.8919 0.8919 0.0291 0.1601 0.8915 0.8915
ComNo80.0272 0.1765 0.8937 0.8937 0.0348 0.1722 0.8745 0.8745
ComNo90.0269 0.1758 0.8945 0.8945 0.0283 0.1582 0.8941 0.8941
ComNo100.0265 0.1747 0.8959 0.8959 0.0289 0.1596 0.8921 0.8921
Table 11. Performance statistics of the VMD-MGGP-NGO-BiLSTM-PSO model.
Model
Inputs
TrainingTesting
MAERMSENSCR2MAERMSENSCR2
ComNo10.0206 0.1578 0.9151 0.9151 0.0231 0.1439 0.9123 0.9123
ComNo20.0211 0.1593 0.9134 0.9134 0.0229 0.1434 0.9129 0.9129
ComNo30.0210 0.1591 0.9136 0.9136 0.0230 0.1436 0.9127 0.9127
ComNo40.0205 0.1573 0.9156 0.9156 0.0230 0.1437 0.9126 0.9126
ComNo50.0180 0.1490 0.9243 0.9243 0.0203 0.1355 0.9223 0.9223
ComNo60.0228 0.1646 0.9076 0.9076 0.0253 0.1502 0.9045 0.9045
ComNo70.0227 0.1643 0.9079 0.9079 0.0257 0.1513 0.9031 0.9031
ComNo80.0223 0.1632 0.9091 0.9091 0.0255 0.1507 0.9039 0.9039
ComNo90.0231 0.1655 0.9065 0.9065 0.0256 0.1510 0.9035 0.9035
ComNo100.0224 0.1636 0.9087 0.9087 0.0253 0.1502 0.9045 0.9045
Table 12. Performance statistics of the VMD-MGGP-NGO-BiLSTM-GWO model.
Model
Inputs
TrainingTesting
MAERMSENSCR2MAERMSENSCR2
ComNo10.01860.15090.92230.92230.02060.13630.92130.9213
ComNo20.01830.14980.92340.92340.02050.13590.92180.9218
ComNo30.01820.14960.92360.92360.02070.13690.92070.9207
ComNo40.01760.14770.92560.92560.02010.13480.92310.9231
ComNo50.01530.13880.93430.93430.01720.12540.93340.9334
ComNo60.01630.14280.93040.93040.01810.12850.93010.9301
ComNo70.01610.14200.93120.93120.01850.12980.92870.9287
ComNo80.01580.14090.93230.93230.01800.12800.93060.9306
ComNo90.01550.13970.93340.93340.01780.12750.93120.9312
ComNo100.01580.14080.93240.93240.01820.12860.93000.9300
Disclaimer/Publisher’s Note: The statements, opinions and data contained in all publications are solely those of the individual author(s) and contributor(s) and not of MDPI and/or the editor(s). MDPI and/or the editor(s) disclaim responsibility for any injury to people or property resulting from any ideas, methods, instructions or products referred to in the content.

