
TOD Zoning Planning: Floor Area Ratio Attenuation Rate and Center Migration Trajectory

Abstract
1. Introduction
2. Literature Review
3. Materials and Methodology
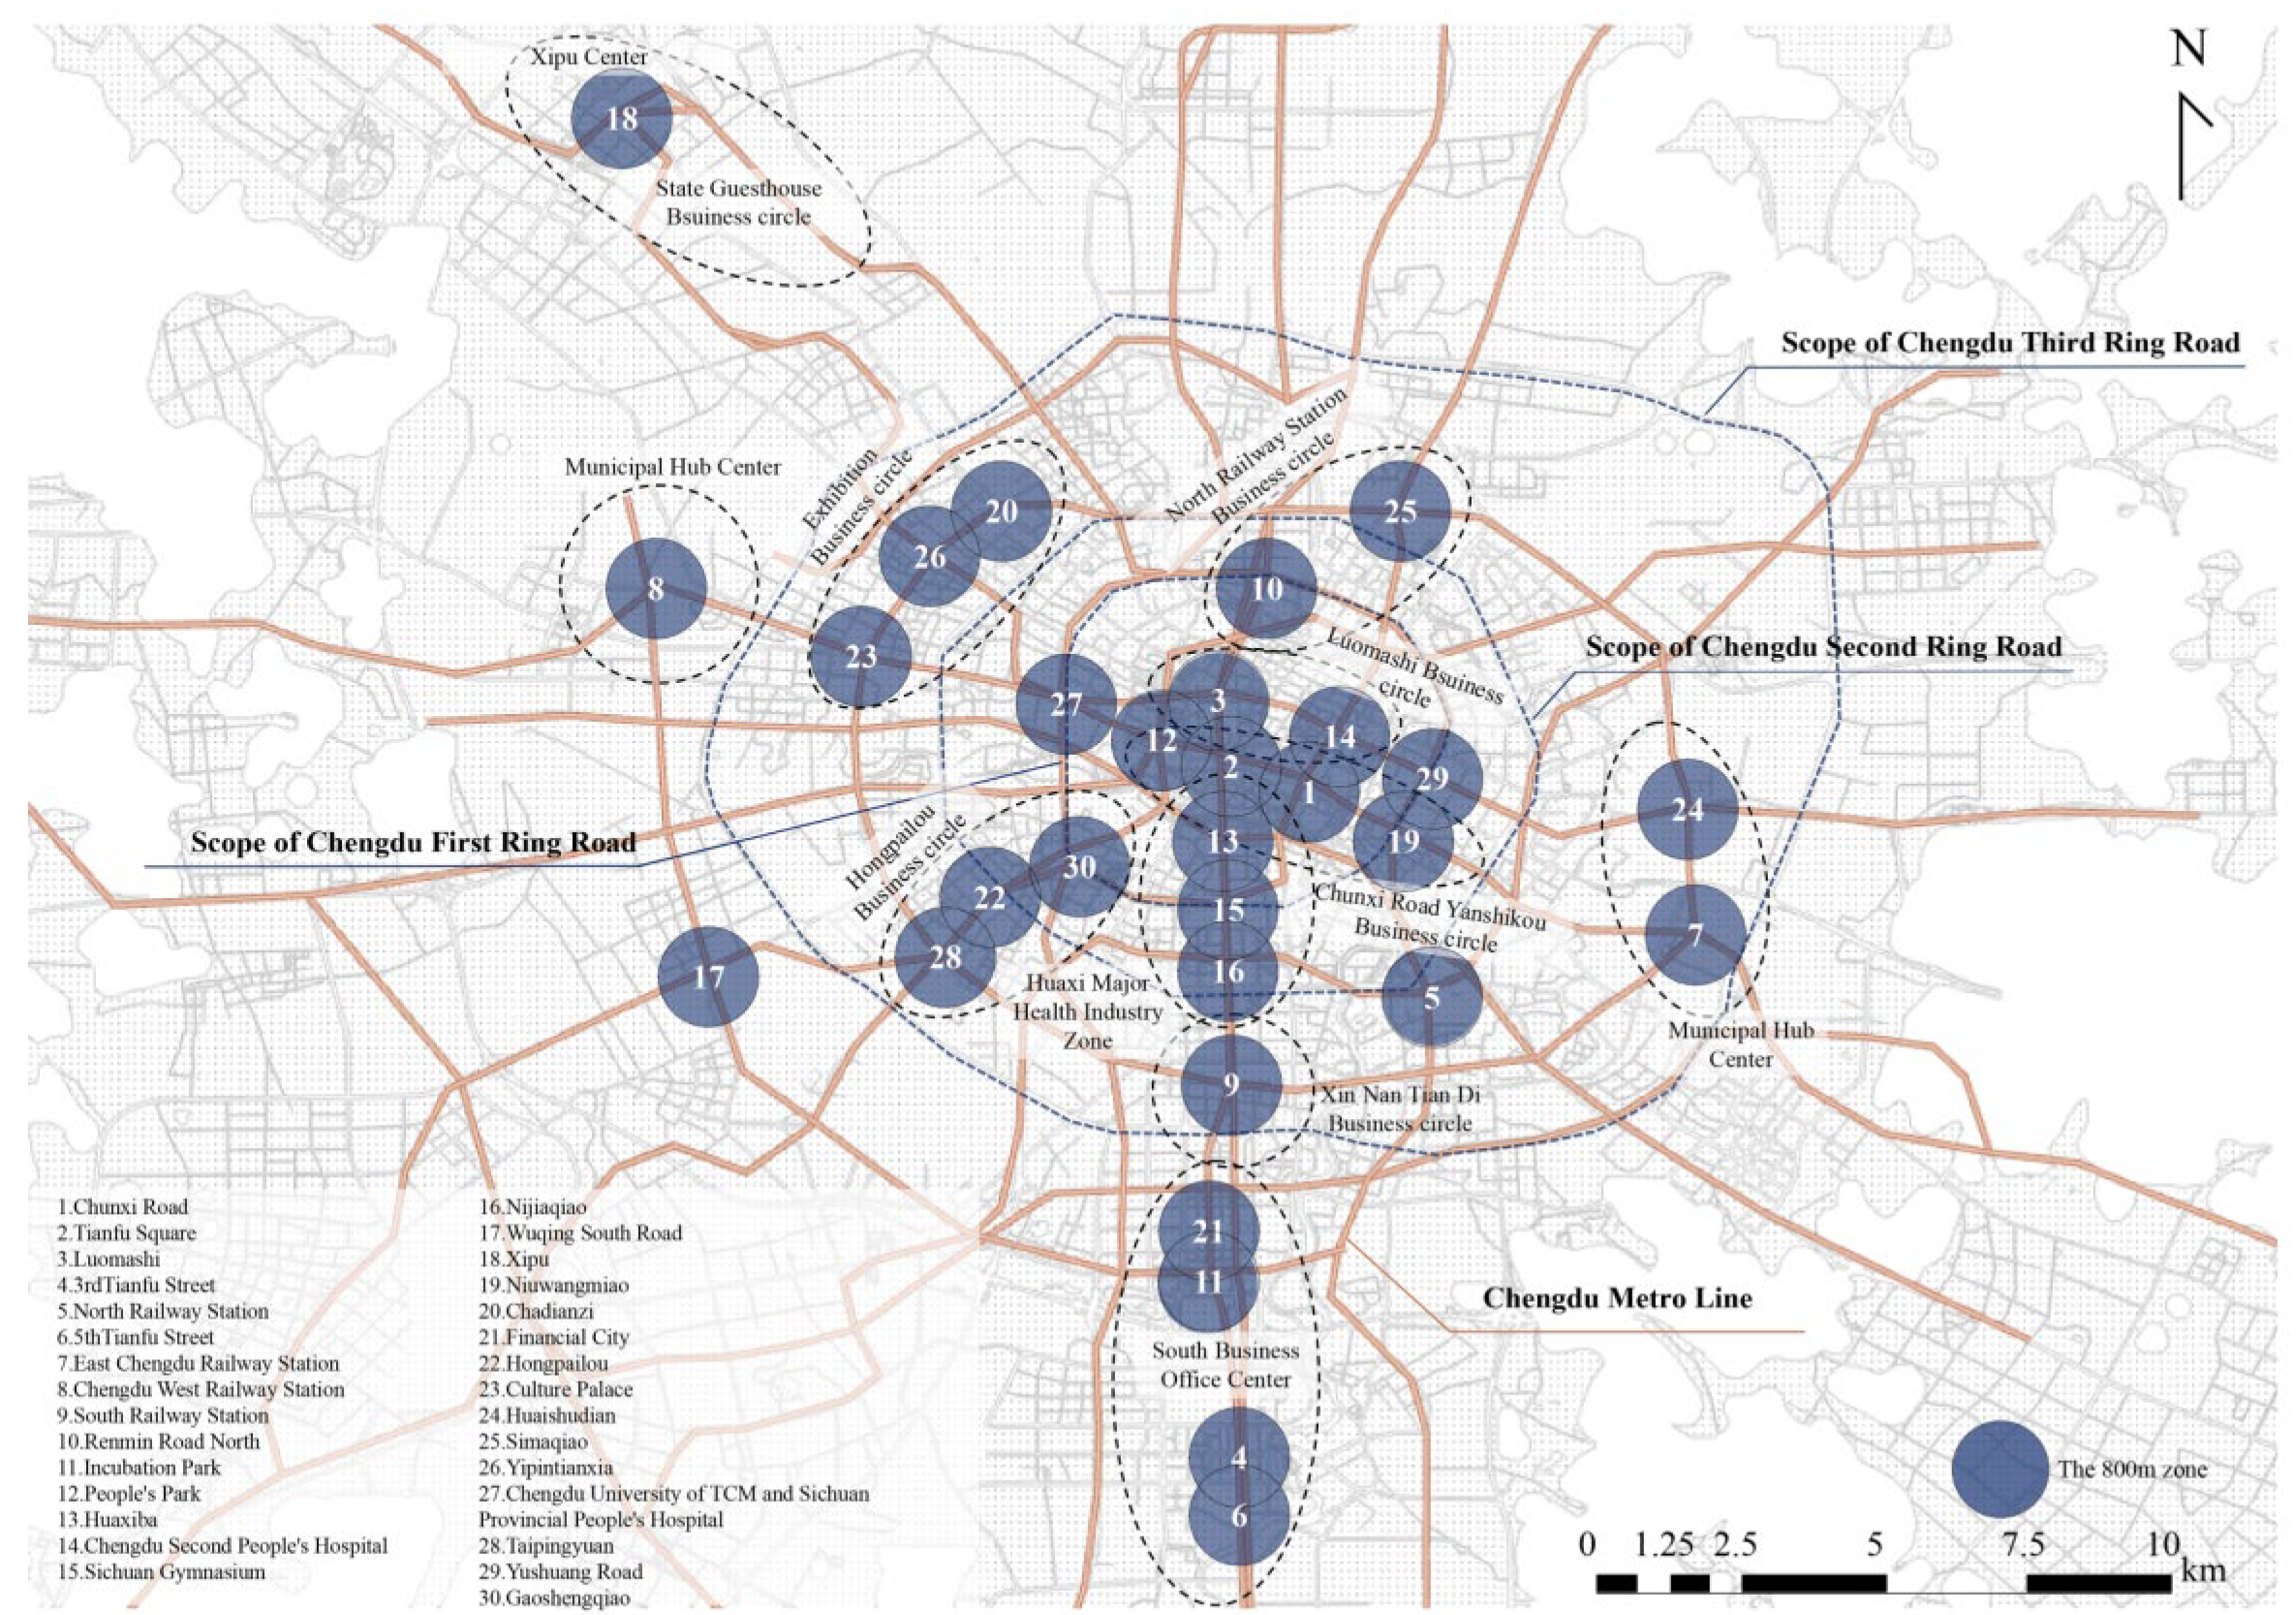
3.1. Study Area
3.2. Data Source
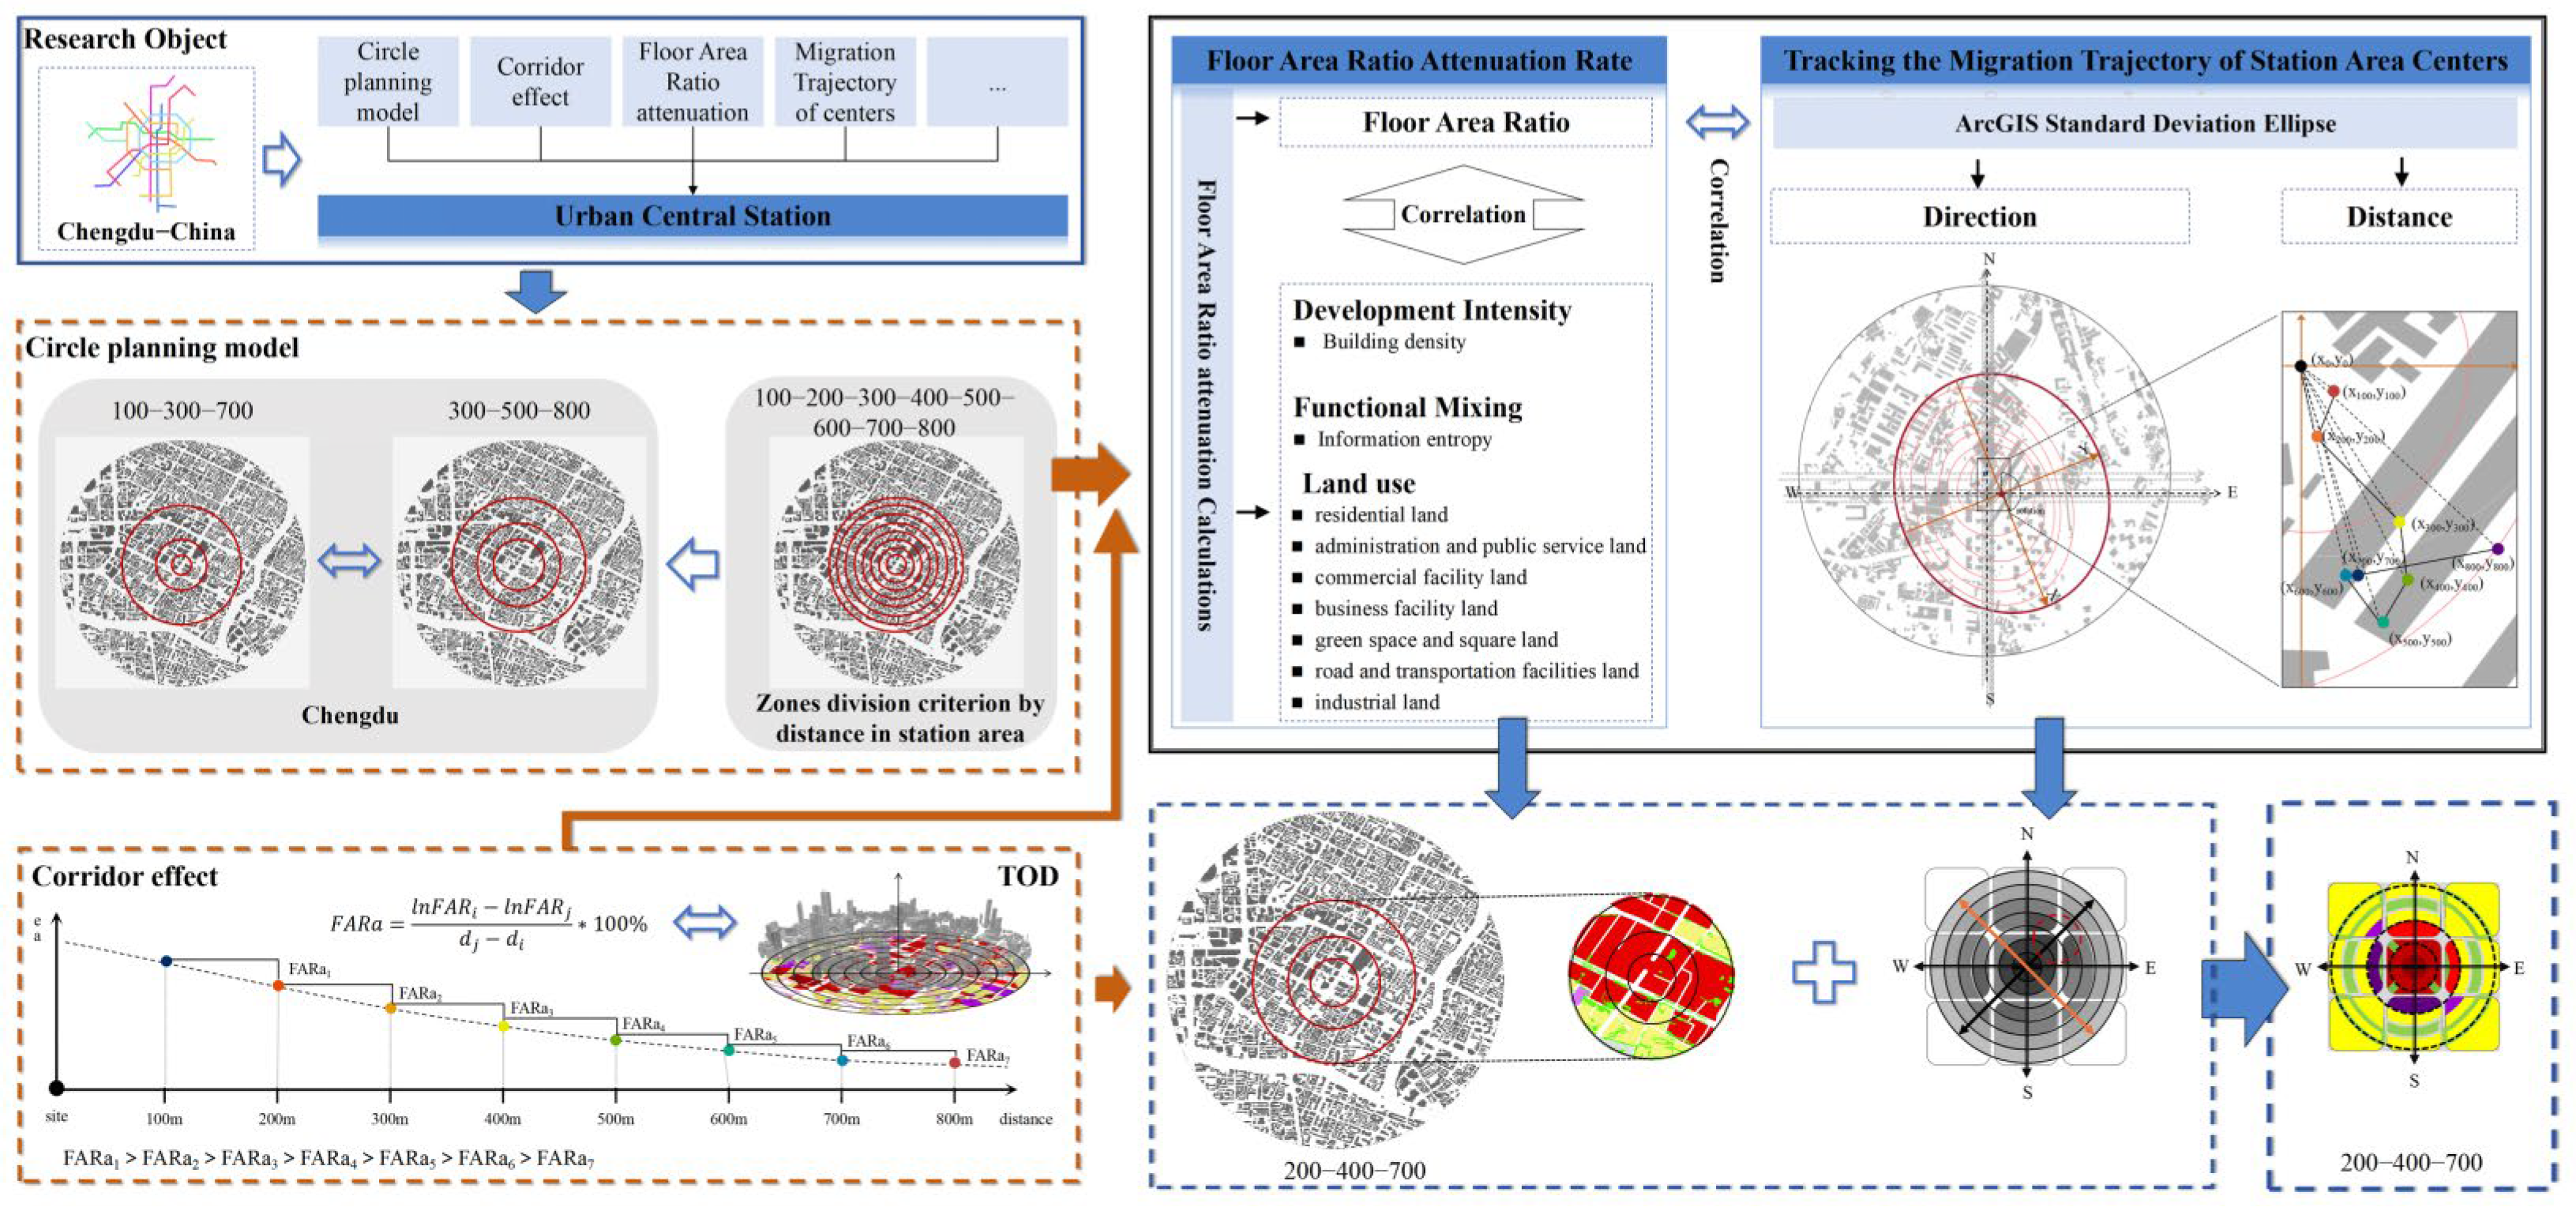
3.3. Research Method
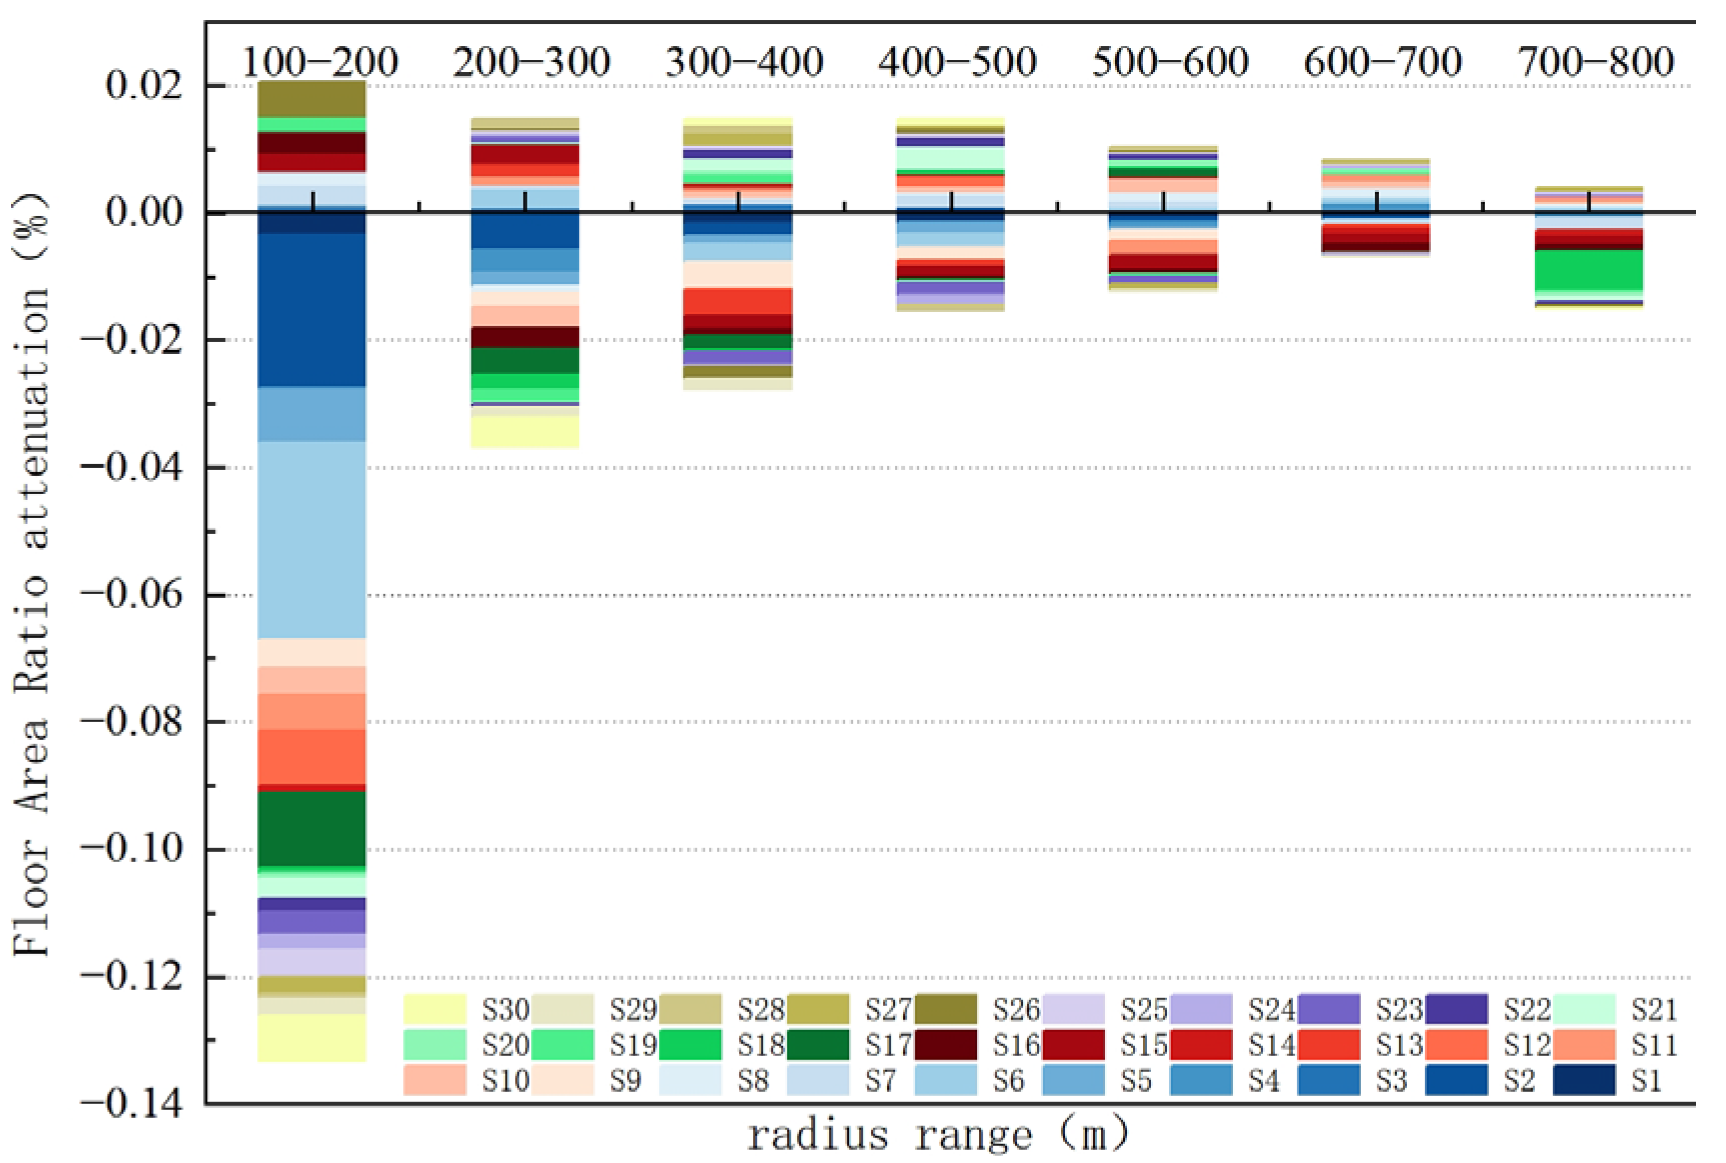
3.3.1. Corridor Effect Calculation of Floor Area Ratio and Attenuation Rate
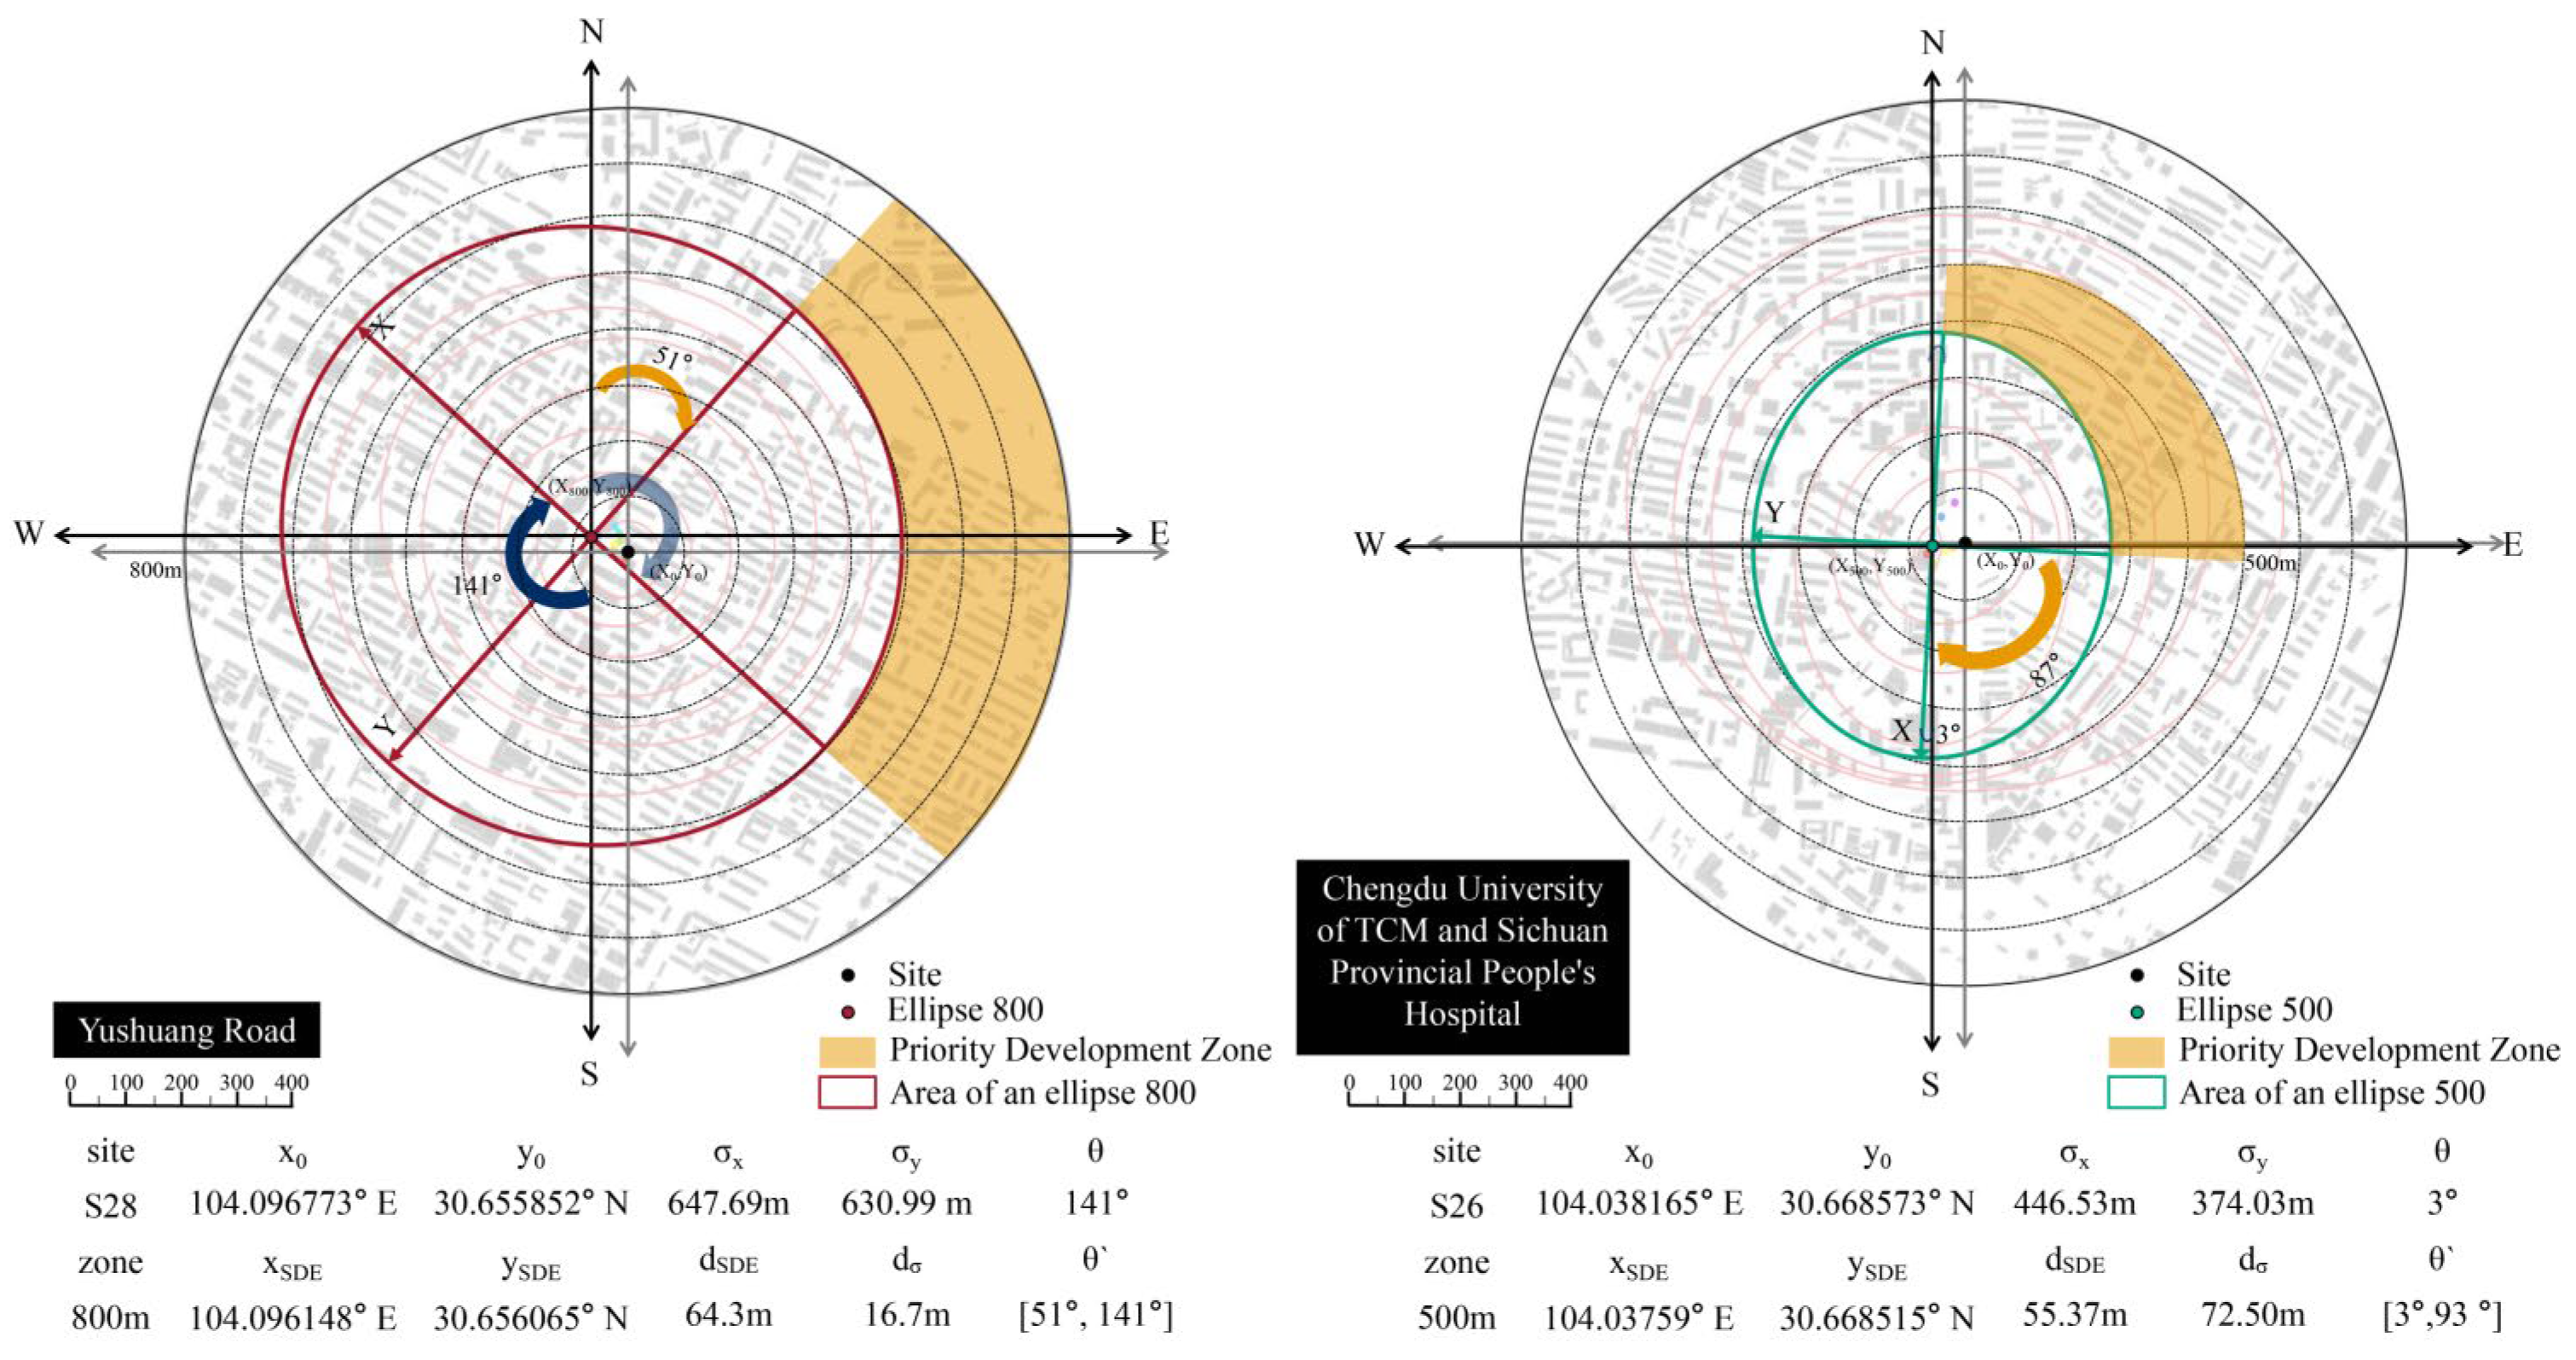
3.3.2. Exploration of the Zone Development Center Migration Trajectory
3.3.3. An Analysis of the Corridor Effect in the Land Use Structure Index System
3.3.4. Correlation Analysis
4. Results
4.1. Analysis of Corridor Effect of Central Stations
4.1.1. Correlation Between Corridor Effect and Floor Area Ratio of Central Stations
4.1.2. Different Results of Land Structure Indicators on Floor Area Ratio Attenuation Under Different Zone Conditions
4.2. The Impact of Floor Area Ratio Changes on the Offset of the Development Center Under Zoning Variations
4.2.1. The Offset of the Development Center and Its Directionality Leading to a Decrease in Floor Area Ratio
4.2.2. The Floor Area Ratio Attenuation Rate and Development Center Offset Rate Influenced by Multiple Zoning Layers
5. Discussions
5.1. Differentiation of Floor Area Ratios on the Boundaries of TOD Stations
5.2. Changing Development Centers Guide Differentiated TOD Zones
6. Conclusions and Suggestions
6.1. Research Conclusions
6.2. The Suggestions of Improving Circle Planning
- (1)
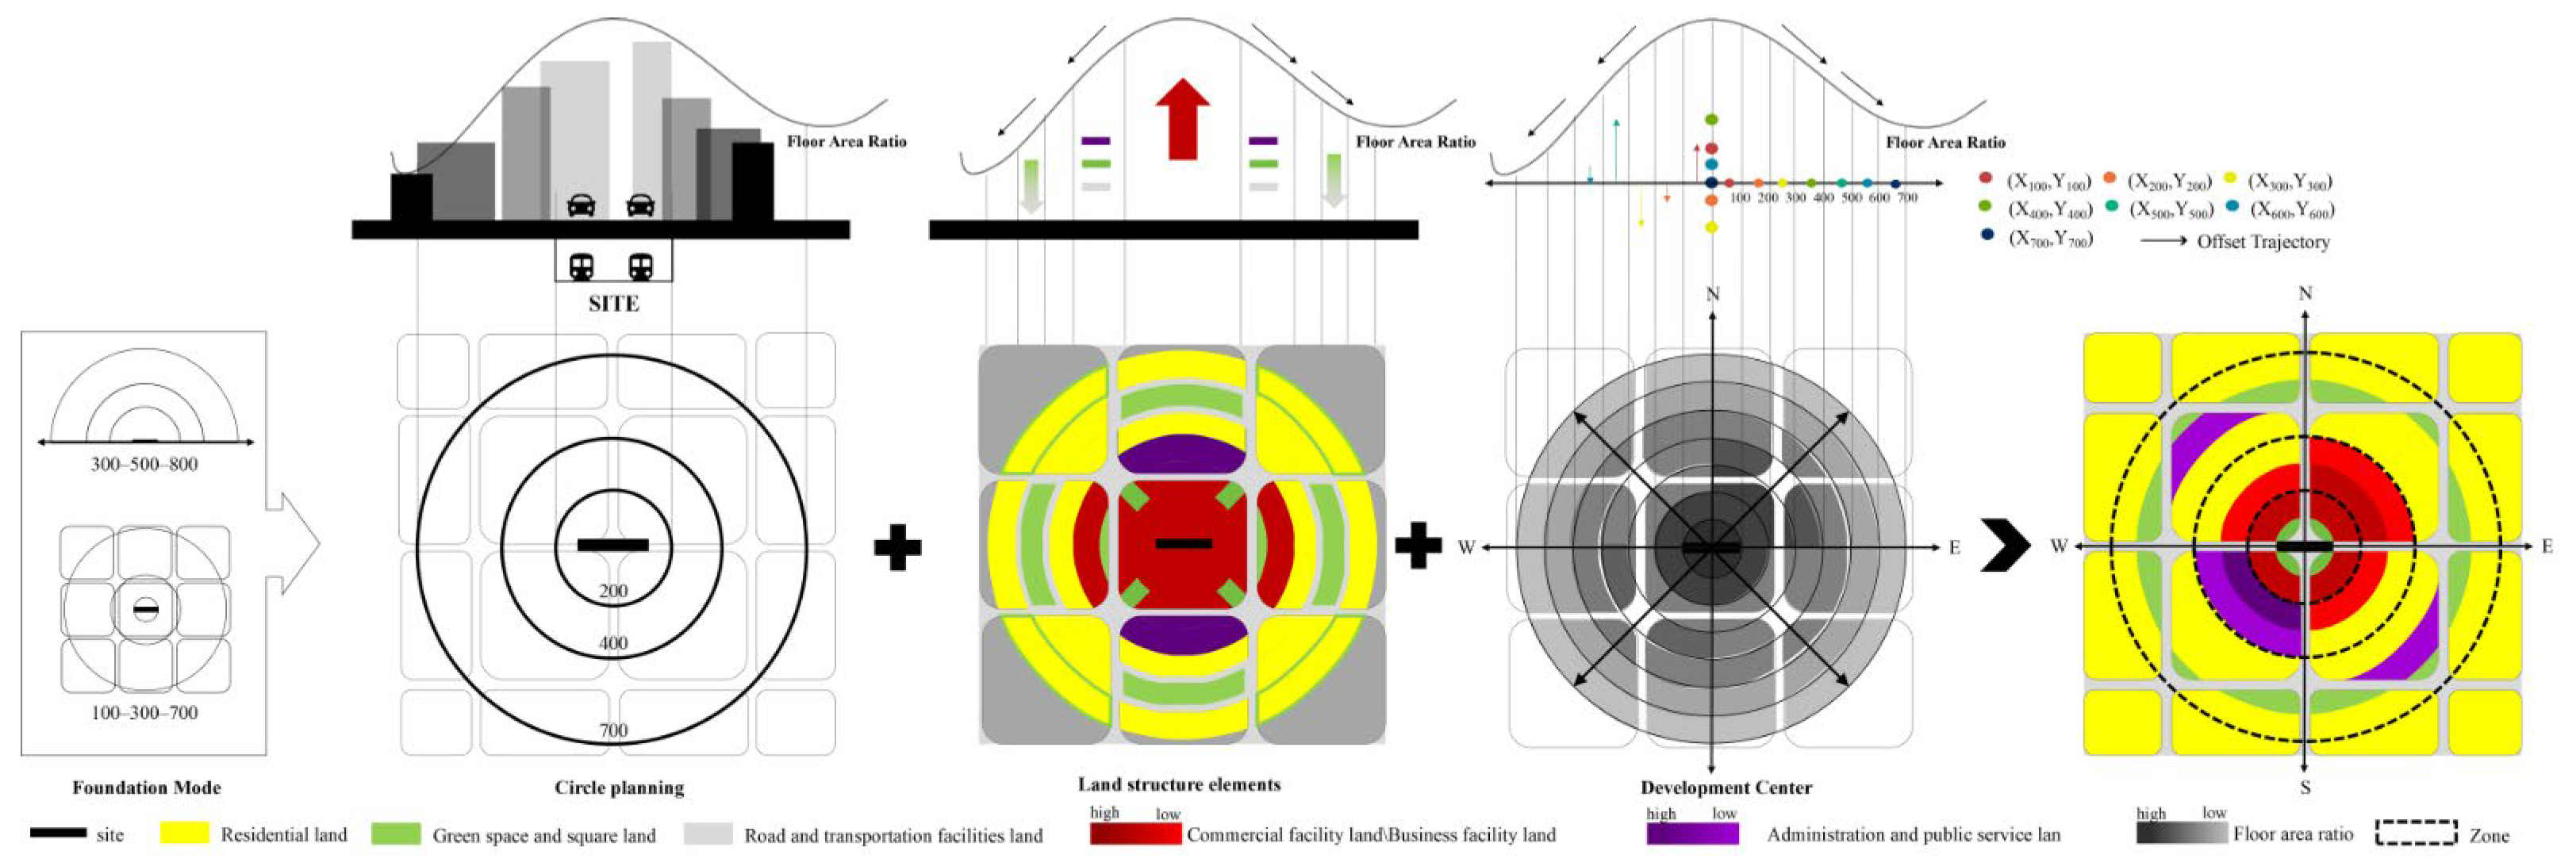
- According to the optimization of land structure elements, high-density commercial service facilities will be concentrated within a radius of 0–200 m; medium-density development will occupy a radius of 200–400 m, and an appropriate amount of public management and public service land, green space and squares, roads, and transportation facilities will be developed. Within this range, improvements in accessibility, functional mix, and ecological construction of station space are essential optimization methods. In general, 400–700 m should be developed in a low-density mode, primarily for residential use, in accordance with current TOD zoning planning principles, as well as reducing the attenuation rate of the floor area ratio in a direct manner. In addition, green space and road land should be added to the station area within 500–700 m to mitigate the negative impact of changes in spatial density inside and outside the station.
- (2)
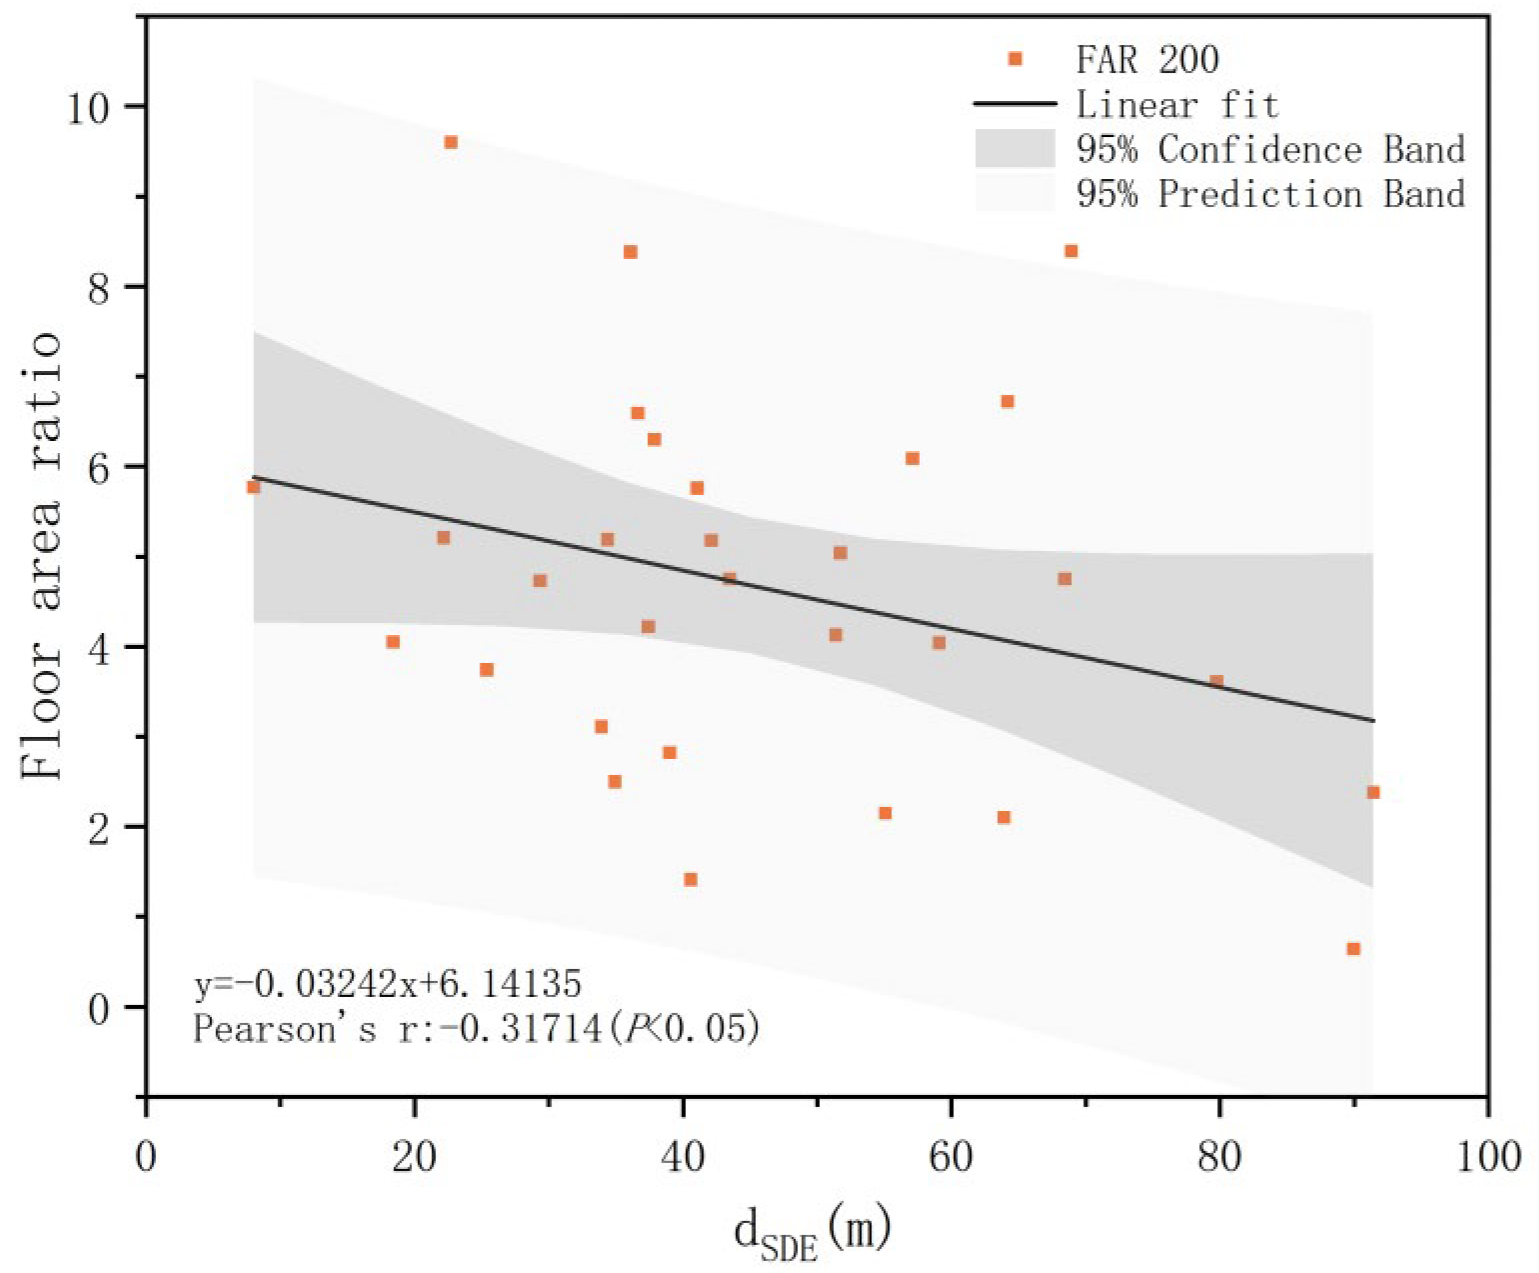
- In terms of the Development Center: To achieve TOD centered on the station, it is imperative that the offset distance and direction of the development centers be controlled across different zones. To begin with, the offset distances of development centers are influenced by the cumulative FAR of multiple zones, as described in Section 4.2. Therefore, a gradual decrease in the FAR is crucial. Continually adjusting the offset of development centers between zones will result in the overall development center remaining centered around the station. With an initial goal of achieving a high FAR within the 200 m zone, when FAR = 200 m and dSDE = 200, the correlation r = −0.317* indicates that the offset distance of the development center within this zone should be minimized, which can be achieved through symmetrical distribution of FAR. The offset rate of the development center from 100 to 200 m will decrease as the distance to the center within the 200 m zone decreases. Consequently, when FARa = 100–200 dSDEr = 100–200, the correlation r = −0.337* suggests that the Floor Area Ratio attenuation rate within the 100–200 m range will increase. Also, in the 200–300 m range, the offset rate of the development center will increase (as shown in Table 6, when dSDEr = 200–300 and FARa = 100–200, r = −0.337*). In the end, the development center will be moved within a radius of 200–300 m. The FARa rate and the offset rate of the development center in the adjacent 300–400 m zone show a negative correlation (−0.409°), allowing the development center to return by lowering the FAR. In order to maintain a continuous reduction in FAR and form a central agglomeration, the FARa in the 500–600 m zone must continue to decrease. However, this attenuation rate shows a negative correlation with the offset rate of the development center (−0.386**), leading to an increase in the offset rate of the 500–600 m development center. To achieve the goal of returning the development center, the FARa rate in the 600–700 m zone should be reduced to decrease the offset rate of the 400–500 m center (as shown in Table 6, when dSDEr = 400–500 and FARa = 600–700, r = 0.421**). Secondly, regarding the overall control of development directionality, the zoning layers should increase the regional FAR within 100 m to mitigate drastic changes in central agglomeration in the 200 m zone (as shown in Table 5, when dσ = 200 and FAR = 100, r = −0.556**). Moreover, as mentioned in Section 5.2, it is essential to alleviate issues related to the directionality of FAR development by discontinuing development in adjacent zones and intensifying development in reverse zones.
Author Contributions
Funding
Data Availability Statement
Conflicts of Interest
| 1. | In urban planning, locational disparities relative to the station center have resulted in a development intensity pattern that manifests as a concentric gradient decrease from the core toward the periphery. |
| 2. | The corridor effect is constituted by the synergistic integration of circulation effects (physical conduction mechanisms of transit nodes and roadways) and field effects (radiation influence scope on adjacent areas), forming a spatial gradient system. Radiation intensity exhibits concentric attenuation from the corridor core, generating a gradient efficacy field. This core-intensive, periphery-attenuated distribution pattern demonstrates spatial and functional congruence with TOD planning principles, particularly in morphological compactness and intensity allocation dynamics. |
| 3. | A 137-circle planning features a high-density layout of commercial service facilities within a 100 m radius. During the 300 m radius, higher-density development is intended to create diverse urban settings, while at 700 m, low-density development is primarily concentrated around residential areas, parks, and other ecological living environments. |
| 4. | Typically, the area defined as the transit radiating zone is established within a radius of 500–800 m from the station center, corresponding to a 15 min walking distance from the station entrances, and is related to the functions of the station. |
References
- Xu, C.; Bin, Q.; Shaoqin, S. Polycentric Spatial Structure and Energy Efficiency: Evidence from China’s Provincial Panel Data. Energy Policy 2021, 149, 112012. [Google Scholar] [CrossRef]
- Liu, X.; Derudder, B.; Wu, K. Measuring Polycentric Urban Development in China: An Intercity Transportation Network Perspective. Reg. Stud. 2016, 50, 1302–1315. [Google Scholar] [CrossRef]
- Jamshidi, M.J. Polycentricity and TOD-Ness Synergy: A Novel Composite Index for Integrated Development of Employment Centers and Residential Cores in Transit-Oriented Neighborhoods. J. Transp. Geogr. 2024, 120, 103994. [Google Scholar] [CrossRef]
- Dan, Z.; Hongchang, L. Research on the Mechanism of Government Incentive Measures to Rail Transit Station Renewal Based on TOD Mode—An Evolutionary Game Analysis. Econ. Comput. Econ. Cybern. Stud. Res. 2023, 57, 23–42. [Google Scholar] [CrossRef]
- Wang, J.; Tan, W.; Huang, J. Extending TOD through the Interrelationship between Transport and Land Use: A Case Study of Beijing. Land Use Policy 2024, 144, 107257. [Google Scholar] [CrossRef]
- Zhang, S.; Li, Z.; Liu, Z. Examining Built Environment Effects on Metro Ridership at Station-to-Station Level Considering Circle Heterogeneity: A Case Study from Xi’an, China. J. Adv. Transp. 2023, 2023, 4597386. [Google Scholar] [CrossRef]
- Wan, B.; Zhao, X.; Sun, Y.; Yang, T. Unraveling the Impact of Spatial Configuration on TOD Function Mix Use and Spatial Intensity: An Analysis of 47 Morning Top-Flow Stations in Beijing (2018–2020). Sustainability 2023, 15, 7944. [Google Scholar] [CrossRef]
- Huang, X.; Liang, Q.; Feng, Z.; Chai, S. A TOD Planning Model Integrating Transport and Land Use in Urban Rail Transit Station Areas. IEEE Access 2021, 9, 1103–1115. [Google Scholar] [CrossRef]
- Zhuang, X.; Zhang, L.; Lu, J. Past—Present—Future: Urban Spatial Succession and Transition of Rail Transit Station Zones in Japan. Int. J. Environ. Res. Public Health 2022, 19, 13633. [Google Scholar] [CrossRef]
- Deng, X.; Zhang, J.; Liao, S.; Zhong, C.; Gao, F.; Teng, L. Interactive Impacts of Built Environment Factors on Metro Ridership Using GeoDetector: From the Perspective of TOD. ISPRS Int. J. Geoinf. 2022, 11, 623. [Google Scholar] [CrossRef]
- Pan, H.; Huang, Y. TOD Typology and Station Area Vibrancy: An Interpretable Machine Learning Approach. Transp. Res. Part A Policy Pract. 2024, 186, 104150. [Google Scholar] [CrossRef]
- Feng, J.; Li, C.; Sun, Y.; Lv, S.; Li, Y. Spatial Matching Between Supply and Demand of Public Service facilities: A Case of Huilongguan-Tiantongyuan Area in Beijing. City Plan. Rev. 2023, 47, 75–85. [Google Scholar]
- Su, S.; Zhang, J.; He, S.; Zhang, H.; Hu, L.; Kang, M. Unraveling the Impact of TOD on Housing Rental Prices and Implications on Spatial Planning: A Comparative Analysis of Five Chinese Megacities. Habitat Int. 2021, 107, 102309. [Google Scholar] [CrossRef]
- Luo, G.; Shao, C.; Dong, C.; Zhen, L. A Land Use Optimization Model of the Multimodal Passenger Transportation Hub on TOD Mode Based on Strategy Analyses. J. Phys. Conf. Ser. 2021, 1972, 012089. [Google Scholar] [CrossRef]
- Higgins, C.D.; Kanaroglou, P.S. A Latent Class Method for Classifying and Evaluating the Performance of Station Area Transit-Oriented Development in the Toronto Region. J. Transp. Geogr. 2016, 52, 61–72. [Google Scholar] [CrossRef]
- Rabiei, N.; Nasiri, F.; Eicker, U. Multistage Transit-Oriented Development Assessment: A Case Study of the Montréal Metro System. J. Urban Plan. Dev. 2022, 148, 05022024. [Google Scholar] [CrossRef]
- Zhuo, Y.; Liu, T. Polycentric City and Region: A Review and Appraisal. Progress. Geogr. 2020, 39, 1385–1396. [Google Scholar] [CrossRef]
- Gu, Y.; Li, M.; Zheng, L.; Huang, H. Backwash-Spread Effects of Transportation Corridors on the Development of City Groups. J. Urban Plan. Dev. 2018, 144, 04018028. [Google Scholar] [CrossRef]
- Zhang, Y.; Zeng, Z. Corridor Effect on Urban Land Use in Panyu District, Guangzhou City. Remote Sens. Land Resour. 2014, 26, 157–162. [Google Scholar]
- Lee, R.; Sener, I.N. The Effect of Light Rail Transit on Land-Use Development in a City without Zoning. J. Transp. Land Use 2017, 10, 541–556. [Google Scholar] [CrossRef]
- Wu, T.; Li, C. Spatial Evolution Characteristics and Driving Mechanisms of Rural Settlements in Coastal Areas of Jiangsu Province: A Case Study of Yancheng City. J. Ecol. Rural Environ. 2024, 40, 888–896. [Google Scholar]
- Huang, R.; Grigolon, A.; Madureira, M.; Brussel, M. Measuring Transit-Oriented Development (TOD) Network Complementarity Based on TOD Node Typology. J. Transp. Land Use 2018, 11, 305–324. [Google Scholar] [CrossRef]
- Choi, Y.; Guhathakurta, S. Unraveling the Diversity in Transit-Oriented Development. Transp. Res. Part A Policy Pract. 2024, 182, 104020. [Google Scholar] [CrossRef]
- Uddin, M.A.; Tamanna, T.; Adiba, S.; Bin Kabir, S. Revolutionizing TOD Planning in a Developing Country: An Objective-Weighted Framework for Measuring Nodal TOD Index. J. Adv. Transp. 2023, 2023, 9911133. [Google Scholar] [CrossRef]
- Calthorpe, P. The Next American Metropolis: Ecology, Community, and the American Dream; Princeton Architectural Press: New York, NY, USA, 1997. [Google Scholar]
- Jiang, Y.; Gu, P.; Cao, Z.; Chen, Y. Impact of Transit-Oriented Development on Residential Property Values around Urban Rail Stations. Transp. Res. Rec. J. Transp. Res. Board 2020, 2674, 362–372. [Google Scholar] [CrossRef]
- Ministry of Housing and Urban-Rural Development People’s Republic of China. Guideline for the Planning and Design of Areas along Urban Rail Alignment; Ministry of Housing and Urban-Rural Development People’s Republic of China: Beijing, China, 2015.
- Guangdong Provincial Department of Housing and Urban-Rural Development. Technical Guidelines for the Comprehensive Development Planning of TOD (Transit-Oriented Development) at Intercity Rail Stations in the Pearl River Delta (Trial); Guangdong Provincial Department of Housing and Urban-Rural Development: Guangzhou, China, 2011. [Google Scholar]
- Pan, H.; Shen, Q.; Liu, C. Transit-Oriented Development at the Urban Periphery. Transp. Res. Rec. J. Transp. Res. Board 2011, 2245, 95–102. [Google Scholar] [CrossRef]
- Huang, Y.; Parker, D.; Minaker, L. Identifying Latent Demand for Transit-Oriented Development Neighbourhoods: Evidence from a Mid-Sized Urban Area in Canada. J. Transp. Geogr. 2021, 90, 102940. [Google Scholar] [CrossRef]
- Taki, H.M.; Hassan Maatouk, M.M.; Lubis, M.Z. Spatial Model of TOD in JMR’s Master Plan. In Proceedings of the 2018 International Conference on Applied Engineering (ICAE), Batam, Indonesia, 3–4 October 2018; IEEE: Piscataway, NJ, USA, 2018; pp. 1–6. [Google Scholar]
- Sun, Y.; Han, B.; Lu, F. An Overview of TOD Level Assessment Around Rail Transit Stations. Urban Rail Transit 2024, 10, 1–12. [Google Scholar] [CrossRef]
- Peng, Y.-T.; Li, Z.-C.; Choi, K. Transit-Oriented Development in an Urban Rail Transportation Corridor. Transp. Res. Part B Methodol. 2017, 103, 269–290. [Google Scholar] [CrossRef]
- Zhong, J.; Li, X.; Hui, E.C.M. Diffusion or Polarization in Intercity Property Markets after the Completion of Intercity Metro Line. J. Urban Plan. Dev. 2023, 149, 04023042. [Google Scholar] [CrossRef]
- Gu, X.; Lin, S.; Wang, C. Integrated Impact of Urban Mixed Land Use on TOD Ridership: A Multi-Radius Comparative Analysis. J. Transp. Land Use 2024, 17, 457–481. [Google Scholar] [CrossRef]
- Li, J.; Ji, Q.; Feven, T.B. Challenges of Adapting the TOD Model in Developing Countries: An Analysis of Light Rail Construction in Addis Ababa. Urban Rapid Rail Transit 2025, 38, 171–177. [Google Scholar]
- Xiao, L.; Xu, W. Urban Spatial Cluster Structure in Metro Travel Networks: An Explorative Study of Wuhan Using Big and Open Data. Front. Eng. Manag. 2024, 11, 231–246. [Google Scholar] [CrossRef]
- You, S.; Kim, K.; Jeong, E.; Lee, J. Methodology for Assessing an Integrated Mobility of the Passenger Passing through Intermodal Transit Center. J. Korea Inst. Intell. Transp. Syst. 2017, 16, 12–28. [Google Scholar] [CrossRef]
- Liu, Q. Walking Scale of Tod Area Along Rail Transit Line. City Plan. Rev. 2019, 43, 88–95. [Google Scholar]
- Dittmar, H.; Ohland, G. The New Transit Town: Best Practices in Transit-Oriented Development; Island Press: Washington, DC, USA, 2003. [Google Scholar]
- Rong, C.; Zhu, D.; Liu, L.; Wang, D. Promoting Rail Transit TOD Development in Urban Regeneration with Floor Area Ratio (FAR) Bonus and Transfer. Urban Stud. 2023, 30, 25–30. [Google Scholar]
- Chengdu Municipal Bureau of Planning and Natural Resources. Available online: https://mpnr.chengdu.gov.cn/ghhzrzyj/zmhdzjdcnr/zjdc_nr.shtml?method=appDataDetail&groupId=19097&dataId=3537751&appId=21356 (accessed on 15 May 2025).
- Toan, T.D. Transit-Oriented Development for Hanoi Sustainable Urban Development. In Proceedings of the CIGOS 2021, Emerging Technologies and Applications for Green Infrastructure, Ha Long, Vietnam, 28–29 October 2021; Springer Nature Link: Singapore, 2022; pp. 145–1465. [Google Scholar]
- Wang, Z.; Ye, X.; Ming, R. Reasonable Scale of Land Development Along Urban Rail Transit. J. Tongji Univ. Nat. Sci. 2011, 39, 376–380. [Google Scholar]
- Liu, K.; Qiu, P.; Gao, S.; Lu, F.; Jiang, J.; Yin, L. Investigating Urban Metro Stations as Cognitive Places in Cities Using Points of Interest. Cities 2020, 97, 102561. [Google Scholar] [CrossRef]
- Tan, P.S.; Mai, K.; Zhang, Y.T.; Tu, W. Identifying the Catchment Area of Metro Stations Using Multi-Source Urban Data. J. Geo Inf. Sci. 2021, 23, 593–603. [Google Scholar]
- Qi, L.; Jia, L.; Luo, Y.; Chen, Y.; Peng, M. The External Characteristics and Mechanism of Urban Road Corridors to Agglomeration: Case Study for Guangzhou, China. Land 2022, 11, 1087. [Google Scholar] [CrossRef]
- Dovey, K.; Pike, L.; Woodcock, I. Incremental Urban Intensification: Transit-Oriented Re-Development of Small-Lot Corridors. Urban Policy Res. 2017, 35, 261–274. [Google Scholar] [CrossRef]
- Feudo, F.L. How to Build an Alternative to Sprawl and Auto-Centric Development Model through a TOD Scenario for the North-Pas-de-Calais Region? Lessons from an Integrated Transportation-Land Use Modelling. Transp. Res. Procedia 2014, 4, 154–177. [Google Scholar] [CrossRef]
- Dröes, M.I.; Rietveld, P. Rail-Based Public Transport and Urban Spatial Structure: The Interplay between Network Design, Congestion and Urban Form. Transp. Res. Part B Methodol. 2015, 81, 421–439. [Google Scholar] [CrossRef]
- Luo, Z.; Chen, Z.; Wu, X.; Pan, H.; Wang, F.; Tu, R.; Yao, Z.; Wang, Y.; Chen, S. Sustainability Assessment of Station-City Integration Based on DPSIR-SDGs Framework: A Case Study of Chengdu in China. Environ. Dev. Sustain. 2025, 1–86. [Google Scholar] [CrossRef]
- The People’s Government of Chengdu Municipality. Notice of the General Office of Chengdu Municipal People’s Government on Distributing the Administrative Measures of Chengdu Municipality on the Land Use for Comprehensive Development of Rail Transit Yards/Stations. In Gazette of the People’s Government of Chengdu Municipality; The People’s Government of Chengdu Municipality: Chengdu, China, 2021. [Google Scholar]
- Wang, Q.; Wei, Q.; Xie, Y.; Luo, Y. Coupling Analysis of the Spatial Pattern Evolution of Green Space and Road Network in the Central City of Chengdu. Chin. Landsc. Archit. 2022, 38, 90–95. [Google Scholar]
- Greco, A.; Pluchino, A.; Barbarossa, L.; Barreca, G.; Caliò, I.; Martinico, F.; Rapisarda, A. A New Agent-Based Methodology for the Seismic Vulnerability Assessment of Urban Areas. ISPRS Int. J. Geoinf. 2019, 8, 274. [Google Scholar] [CrossRef]
- Congalton, R.G.; Green, K. Assessing the Accuracy of Remotely Sensed Data; CRC Press: Boca Raton, FL, USA, 2019; ISBN 9780429052729. [Google Scholar]
- Bakillah, M.; Liang, S.; Mobasheri, A.; Jokar Arsanjani, J.; Zipf, A. Fine-Resolution Population Mapping Using OpenStreetMap Points-of-Interest. Int. J. Geogr. Inf. Sci. 2014, 28, 1940–1963. [Google Scholar] [CrossRef]
- Birant, D.; Kut, A. ST-DBSCAN: An Algorithm for Clustering Spatial–Temporal Data. Data Knowl. Eng. 2007, 60, 208–221. [Google Scholar] [CrossRef]
- Sobrero, F.S.; Bevis, M.; Gómez, D.D.; Wang, F. Logarithmic and Exponential Transients in GNSS Trajectory Models as Indicators of Dominant Processes in Postseismic Deformation. J. Geod. 2020, 94, 84. [Google Scholar] [CrossRef]
- Dong, S.; Xue, Y.; Ren, G.; Liu, K. Urban Green Innovation Efficiency in China: Spatiotemporal Evolution and Influencing Factors. Land 2022, 12, 75. [Google Scholar] [CrossRef]
- Yang, I.; Jeon, W.H.; Moon, J. A Study on a Distance Based Coordinate Calculation Method Using Inverse Haversine Method. J. Digit. Contents Soc. 2019, 20, 2097–2102. [Google Scholar] [CrossRef]
- Ministry of Natural Resources. Guidelines for the Classification of Land and Sea Use in National Territorial Space Survey; Ministry of Natural Resources: Peterborough, ON, Canada, 2023.
- Jia, R.; Xia, X.; Xuan, Y.; Sun, Z.; Gao, Y.; Qin, S. Low-Carbon Planning of Urban Charging Stations Considering Carbon Emission Evolution Characteristics and Dynamic Demand. Front. Energy Res. 2024, 12, 1359824. [Google Scholar] [CrossRef]
- Wang, H.; Yang, K.; Zou, Y.; Zeng, M.; Deng, S.; Guo, C.; Watanabe, S.; Zhao, M. Chengdu TOD “137” Circle Planning Model and all in One Concept and Practice. Sci. Technol. Rev. 2023, 41, 74–81. [Google Scholar]
- Stojanovski, T. Urban Design and Public Transportation—Public Spaces, Visual Proximity and Transit-Oriented Development (TOD). J. Urban Des. 2020, 25, 134–154. [Google Scholar] [CrossRef]

| Indicators | Calculation Formula Used | Unit | Std | Mean | Min | Max |
|---|---|---|---|---|---|---|
| Floor area ratio (FAR) | / | 2.18 | 4.88 | 0.26 | 12.02 | |
| Floor area ratio attenuation rate (FARa) | % | 0.34 | −0.08 | −3.11 | 0.55 | |
| Building density (D) | % | 11.18 | 39.51 | 2.74 | 97.39 | |
| Information entropy (H) | Nat | 0.33 | 1.28 | 0.00 | 1.86 | |
| Residential land (R) | / | m2 | 254,177.47 | 213,018.80 | 0.00 | 1,241,459.30 |
| Administration and public service land (A) | / | m2 | 114,554.21 | 84,022.81 | 0.00 | 565,102.00 |
| Commercial facility land (B1) | / | m2 | 72,718.87 | 38,150.60 | 0.00 | 466,710.00 |
| Business facility land (B2) | / | m2 | 163,437.32 | 92,178.09 | 0.00 | 1,099,104.20 |
| Green space and square land (G) | / | m2 | 199,416.73 | 192,467.47 | 0.00 | 991,555.50 |
| Road and transportation facilities land (S) | / | m2 | 170,213.86 | 151,779.12 | 0.00 | 1,132,169.58 |
| Industrial land (M) | / | m2 | 87,434.69 | 28,335.38 | 0.00 | 700,006.40 |
| Distance between the initial center and the zoning development center (dSDE) | m | 37.33 | 56.62 | 0.00 | 202.95 | |
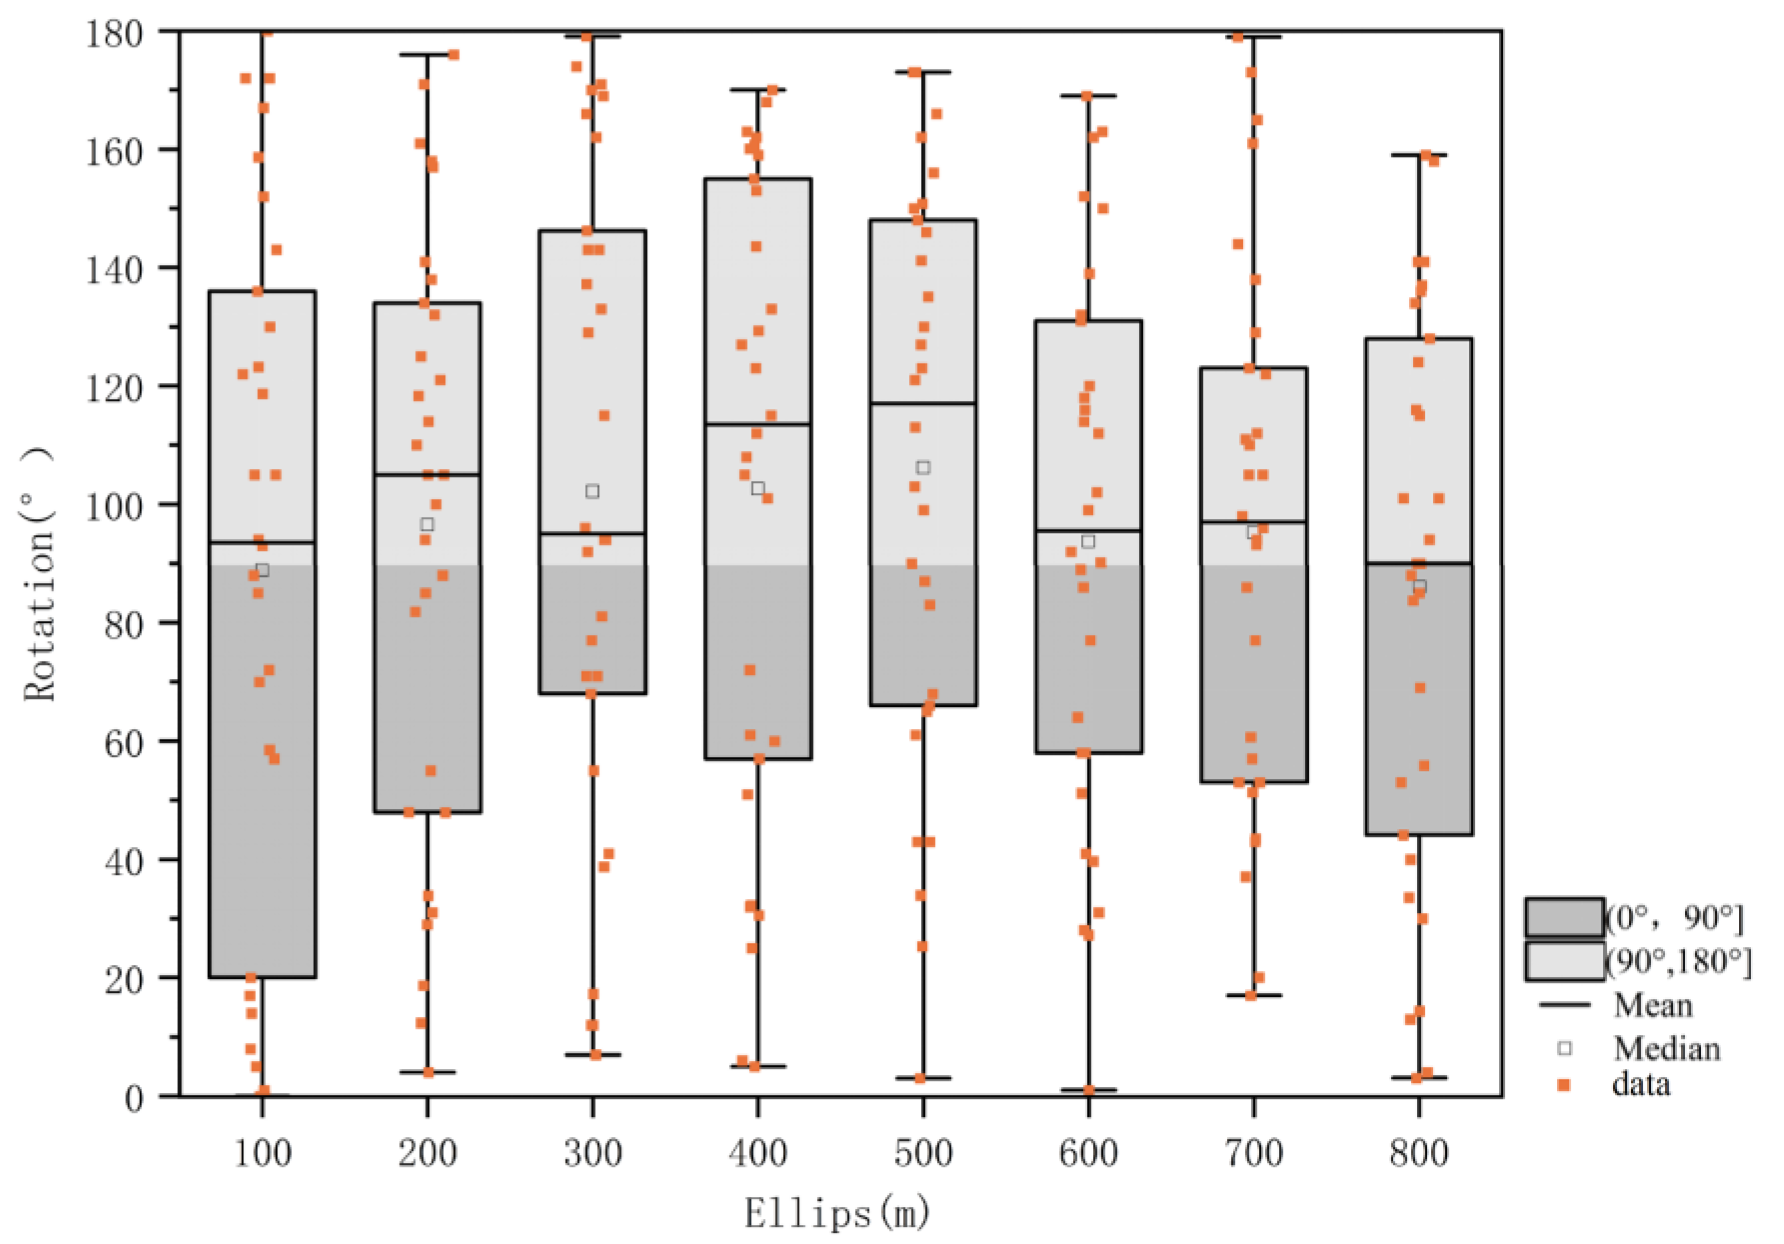
| Rotation () | ° | 50.55 | 96.41 | 0.00 | 179.91 | |
| Flattening ratio () | m | 39.57 | 58.41 | 0.00 | 248.50 | |
| Area of an ellipse (EA) | / | m2 | 415,592.11 | 479,880.42 | 895.18 | 1,452,692.86 |
| Station Code | Site | Station Categories | 100–200 | 200–300 | 300–400 | 400–500 | 500–600 | 600–700 | 700–800 |
|---|---|---|---|---|---|---|---|---|---|
| S1 | Chunxi Road | CC | (−) 0.34 | (+) 0.03 | (−) 0.17 | (−) 0.14 | (−) 0.07 | (−) 0.06 | (−) 0.03 |
| S2 | Tianfu Square | BC | (−) 2.40 | (−) 0.57 | (−) 0.19 | (+) 0.11 | (−) 0.08 | (−) 0.04 | (+) 0.01 |
| S3 | Luomashi | MC | (+) 0.12 | (+) 0.05 | (+) 0.13 | (+) 0.00 | (+) 0.02 | (−) 0.02 | (+) 0.03 |
| S4 | 3rdTianfu Street | BC | (−) 0.05 | (−) 0.36 | (+) 0.01 | (−) 0.02 | (−) 0.07 | (+) 0.16 | (−) 0.04 |
| S5 | North Railway Station | THC | (−) 0.81 | (−) 0.23 | (−) 0.13 | (−) 0.17 | (−) 0.05 | (+) 0.00 | (−) 0.01 |
| S6 | 5thTianfu Street | BC | (−) 3.11 | (+) 0.31 | (−) 0.29 | (−) 0.21 | (+) 0.09 | (+) 0.09 | (+) 0.07 |
| S7 | East Chengdu Railway Station | THC | (+) 0.32 | (+) 0.06 | (+) 0.09 | (+) 0.17 | (+) 0.09 | (−) 0.07 | (−) 0.19 |
| S8 | Chengdu West Railway Station | THC | (+) 0.21 | (−) 0.09 | (+) 0.02 | (+) 0.06 | (+) 0.14 | (+) 0.15 | (+) 0.03 |
| S9 | South Railway Station | THC | (−) 0.44 | (−) 0.22 | (−) 0.40 | (−) 0.20 | (−) 0.17 | (+) 0.00 | (+) 0.01 |
| S10 | Renmin Road North | MC | (−) 0.42 | (−) 0.34 | (+) 0.10 | (+) 0.08 | (+) 0.21 | (+) 0.11 | (+) 0.05 |
| S11 | Incubation Park | MC | (−) 0.56 | (+) 0.13 | (+) 0.06 | (−) 0.02 | (−) 0.22 | (+) 0.11 | (+) 0.06 |
| S12 | People’s Park | MC | (−) 0.87 | (−) 0.01 | (−) 0.04 | (+) 0.16 | (−) 0.01 | (−) 0.01 | (+) 0.00 |
| S13 | Huaxiba | PSC | (+) 0.00 | (+) 0.21 | (−) 0.39 | (−) 0.08 | (+) 0.00 | (−) 0.05 | (−) 0.02 |
| S14 | Chengdu Second People’s Hospital | MC | (−) 0.10 | (+) 0.00 | (+) 0.06 | (+) 0.04 | (+) 0.03 | (−) 0.10 | (−) 0.09 |
| S15 | Sichuan Gymnasium | MC | (+) 0.29 | (+) 0.29 | (−) 0.22 | (−) 0.16 | (−) 0.23 | (−) 0.13 | (−) 0.13 |
| S16 | Nijiaqiao | MC | (+) 0.35 | (−) 0.31 | (−) 0.11 | (−) 0.04 | (−) 0.05 | (−) 0.15 | (−) 0.08 |
| S17 | Wuqing South Road | MC | (−) 1.18 | (−) 0.41 | (−) 0.22 | (−) 0.03 | (+) 0.14 | (+) 0.00 | (−) 0.03 |
| S18 | Xipu | THC | (−) 0.09 | (−) 0.25 | (−) 0.03 | (+) 0.08 | (+) 0.02 | (+) 0.00 | (−) 0.60 |
| S19 | Niuwangmiao | MC | (+) 0.22 | (−) 0.19 | (+) 0.15 | (−) 0.01 | (−) 0.05 | (+) 0.03 | (−) 0.04 |
| S20 | Chadianzi | RC | (−) 0.10 | (+) 0.05 | (+) 0.05 | (−) 0.01 | (+) 0.12 | (+) 0.06 | (−) 0.06 |
| S21 | Financial City | BC | (−) 0.31 | (−) 0.02 | (+) 0.20 | (+) 0.35 | (+) 0.00 | (−) 0.02 | (−) 0.08 |
| S22 | Hongpailou | MC | (−) 0.21 | (−) 0.05 | (+) 0.14 | (+) 0.14 | (+) 0.07 | (+) 0.01 | (−) 0.04 |
| S23 | Culture Palace | PSC | (−) 0.36 | (+) 0.09 | (−) 0.20 | (−) 0.20 | (−) 0.11 | (−) 0.02 | (+) 0.03 |
| S24 | Simaqiao | RC | (−) 0.23 | (+) 0.04 | (−) 0.04 | (−) 0.14 | (+) 0.01 | (+) 0.02 | (+) 0.03 |
| S25 | Yipintianxia | RC | (−) 0.43 | (+) 0.04 | (+) 0.06 | (+) 0.08 | (+) 0.03 | (+) 0.04 | (+) 0.03 |
| S26 | Chengdu University of TCM and Sichuan Provincial People’s Hospital | PSC | (+) 0.55 | (+) 0.04 | (−) 0.18 | (+) 0.06 | (+) 0.03 | (+) 0.00 | (-) 0.05 |
| S27 | Taipingyuan | CC | (−) 0.27 | (+) 0.00 | (+) 0.20 | (+) 0.06 | (−) 0.10 | (+) 0.05 | (+) 0.04 |
| S28 | Yushuang Road | RC | (−) 0.07 | (+) 0.15 | (+) 0.12 | (−) 0.09 | (+) 0.03 | (+) 0.01 | (−) 0.01 |
| S29 | Gaoshengqiao | MC | (−) 0.27 | (−) 0.17 | (−) 0.17 | (+) 0.01 | (−) 0.03 | (−) 0.02 | (+) 0.00 |
| S30 | Dongguang | BC | (−) 0.71 | (−) 0.46 | (+) 0.09 | (+) 0.08 | (+) 0.00 | (+) 0.00 | (−) 0.01 |
| Sum (−) | (−) 13.32 | (−) 3.69 | (−) 2.78 | (−) 1.51 | (−) 1.24 | (−) 0.68 | (−) 1.5 | ||
| Sum (+) | (+) 2.08 | (+) 1.49 | (+) 1.47 | (+) 1.47 | (+) 1.05 | (+) 0.83 | (+) 0.39 | ||
| Sum | 15.40 | 5.19 | 4.25 | 2.99 | 2.28 | 1.51 | 1.89 |
| Indicators | Floor Area Ratio Attenuation Rate (di−dj) | ||||||
|---|---|---|---|---|---|---|---|
| 100−200 | 200−300 | 300−400 | 400−500 | 500−600 | 600−700 | 700−800 | |
| Rate of Change in Building Density (Dr) | 0.867 (0.000 ***) | 0.622 (0.000 ***) | 0.755 (0.000 ***) | 0.81 (0.000 ***) | 0.645 (0.000 ***) | 0.662 (0.000 ***) | 0.853 (0.000 ***) |
| Rate of Change in Information Entropy (Hr) | 0.24 (0.201) | 0.068 (0.721) | 0.036 (0.849) | −0.078 (0.682) | −0.037 (0.847) | 0.168 (0.375) | 0.06 (0.753) |
| Rate of Change in Residential Land (Rr) | −0.64 (0.000 ***) | −0.107 (0.572) | 0.255 (0.173) | −0.45 (0.013 **) | 0.19 (0.314) | −0.185 (0.329) | −0.151 (0.425) |
| Rate of Change in Public Service Land (Ar) | −0.045 (0.812) | −0.075 (0.692) | −0.012 (0.950) | 0.085 (0.654) | 0.055 (0.775) | −0.02 (0.916) | −0.19 (0.314) |
| Rate of Change in Commercial Service Land (B1r) | 0.393 (0.032 **) | −0.013 (0.944) | −0.084 (0.660) | −0.188 (0.319) | 0.158 (0.404) | 0.24 (0.202) | 0.038 (0.843) |
| Rate of Change in Business Office Land (B2r) | 0.529 (0.003 ***) | 0.303 (0.104) | −0.16 (0.398) | −0.121 (0.524) | −0.067 (0.724) | −0.013 (0.945) | −0.123 (0.519) |
| Rate of Change in Green Space and Plaza Land (Gr) | −0.172 (0.364) | −0.21 (0.265) | 0.154 (0.417) | 0.275 (0.141) | 0.199 (0.291) | 0.431 (0.018 **) | 0.354 (0.055 *) |
| Rate of Change in Road and Transportation Facilities Land (Sr) | 0.002 (0.992) | 0.004 (0.985) | −0.111 (0.561) | −0.03 (0.875) | −0.04 (0.834) | 0.395 (0.031 **) | 0.12 (0.528) |
| Rate of Change in Industrial Land (Mr) | 0.071 (0.711) | −0.135 (0.477) | −0.103 (0.587) | −0.254 (0.176) | −0.026 (0.890) | 0.03 (0.875) | 0.122 (0.521) |
| FAR | Distance Between the Initial Center and the Zoning Development Center (dSDE) | |||||||
|---|---|---|---|---|---|---|---|---|
| 100 | 200 | 300 | 400 | 500 | 600 | 700 | 800 | |
| 100 | −0.21 (0.266) | −0.545 (0.002 ***) | −0.004 (0.982) | −0.04 (0.835) | −0.179 (0.344) | −0.097 (0.611) | −0.054 (0.777) | −0.056 (0.768) |
| 200 | −0.232 (0.217) | −0.317 (0.088 *) | −0.038 (0.842) | −0.147 (0.437) | −0.167 (0.377) | −0.185 (0.328) | −0.218 (0.247) | −0.208 (0.271) |
| 300 | −0.224 (0.235) | −0.278 (0.136) | 0.17 (0.368) | 0.004 (0.982) | −0.039 (0.836) | −0.016 (0.933) | −0.037 (0.844) | −0.098 (0.607) |
| 400 | −0.2 (0.289) | −0.277 (0.138) | 0.137 (0.471) | 0.044 (0.816) | −0.05 (0.793) | −0.056 (0.770) | −0.098 (0.606) | −0.186 (0.324) |
| 500 | −0.218 (0.248) | −0.207 (0.273) | 0.14 (0.461) | 0.033 (0.864) | −0.038 (0.840) | −0.033 (0.861) | −0.09 (0.637) | −0.186 (0.324) |
| 600 | −0.168 (0.375) | −0.252 (0.180) | 0.03 (0.877) | −0.037 (0.845) | −0.122 (0.519) | −0.04 (0.833) | −0.057 (0.767) | −0.158 (0.403) |
| 700 | −0.185 (0.327) | −0.313 (0.092 *) | −0.019 (0.921) | −0.065 (0.734) | −0.195 (0.301) | −0.143 (0.450) | −0.155 (0.414) | −0.255 (0.174) |
| 800 | −0.189 (0.316) | −0.331 (0.074 *) | −0.045 (0.814) | −0.112 (0.556) | −0.255 (0.173) | −0.168 (0.376) | −0.128 (0.499) | −0.225 (0.232) |
| FAR | Flattening Ratio (dσ) | |||||||
|---|---|---|---|---|---|---|---|---|
| 100 | 200 | 300 | 400 | 500 | 600 | 700 | 800 | |
| 100 | −0.048 (0.803) | −0.556 (0.001 ***) | −0.299 (0.108) | −0.19 (0.315) | −0.204 (0.280) | −0.148 (0.436) | −0.216 (0.252) | −0.192 (0.308) |
| 200 | −0.034 (0.859) | −0.168 (0.376) | −0.127 (0.503) | 0.116 (0.542) | 0.169 (0.372) | 0.101 (0.594) | −0.061 (0.751) | −0.101 (0.595) |
| 300 | 0.182 (0.335) | 0.002 (0.993) | −0.081 (0.672) | 0.022 (0.908) | 0.084 (0.660) | −0.015 (0.938) | −0.117 (0.538) | −0.232 (0.217) |
| 400 | 0.167 (0.378) | 0.076 (0.688) | −0.01 (0.959) | 0.191 (0.312) | 0.181 (0.338) | −0.017 (0.928) | −0.164 (0.387) | −0.33 (0.075 *) |
| 500 | 0.112 (0.556) | 0.019 (0.920) | 0.056 (0.771) | 0.278 (0.137) | 0.279 (0.136) | 0.034 (0.857) | −0.147 (0.439) | −0.375 (0.041 **) |
| 600 | 0.167 (0.376) | 0.051 (0.790) | 0.088 (0.644) | 0.283 (0.129) | 0.214 (0.256) | 0.021 (0.912) | −0.141 (0.456) | −0.357 (0.053 *) |
| 700 | 0.089 (0.639) | 0.004 (0.982) | 0.108 (0.569) | 0.248 (0.186) | 0.135 (0.478) | −0.038 (0.841) | −0.2 (0.290) | −0.403 (0.027 **) |
| 800 | 0.091 (0.634) | −0.041 (0.831) | 0.07 (0.713) | 0.147 (0.437) | 0.072 (0.707) | −0.059 (0.758) | −0.205 (0.278) | −0.418 (0.022 **) |
| FARa | Distance Between the Initial Center and the Zoning Development Center Attenuation Rate (dSDEr) | ||||||
|---|---|---|---|---|---|---|---|
| 100−200 | 200−300 | 300−400 | 400−500 | 500−600 | 600−700 | 700−800 | |
| 100–200 | −0.337 (0.069 *) | 0.387 (0.035 **) | −0.061 (0.749) | −0.239 (0.203) | 0.23 (0.221) | 0.222 (0.239) | 0.148 (0.434) |
| 200–300 | −0.043 (0.823) | −0.14 (0.460) | −0.004 (0.985) | −0.049 (0.799) | −0.145 (0.444) | −0.052 (0.785) | 0.262 (0.162) |
| 300–400 | 0.022 (0.906) | 0.214 (0.257) | −0.409 (0.025 **) | 0.212 (0.261) | 0.252 (0.179) | 0.25 (0.182) | 0.343 (0.064 *) |
| 400–500 | −0.212 (0.260) | 0.186 (0.325) | 0.002 (0.992) | −0.125 (0.509) | 0.017 (0.931) | 0.215 (0.254) | 0.286 (0.126) |
| 500–600 | 0.256 (0.171) | 0.303 (0.103) | −0.133 (0.483) | 0.095 (0.618) | −0.386 (0.035 **) | −0.175 (0.354) | 0.216 (0.251) |
| 600–700 | 0.112 (0.556) | 0.1 (0.600) | −0.048 (0.803) | 0.421 (0.020 **) | 0.198 (0.293) | −0.029 (0.881) | −0.009 (0.964) |
| 700–800 | −0.065 (0.733) | 0.192 (0.309) | 0.154 (0.417) | 0.034 (0.860) | −0.186 (0.326) | −0.464 (0.010 ***) | −0.255 (0.174) |
Disclaimer/Publisher’s Note: The statements, opinions and data contained in all publications are solely those of the individual author(s) and contributor(s) and not of MDPI and/or the editor(s). MDPI and/or the editor(s) disclaim responsibility for any injury to people or property resulting from any ideas, methods, instructions or products referred to in the content. |
© 2025 by the authors. Licensee MDPI, Basel, Switzerland. This article is an open access article distributed under the terms and conditions of the Creative Commons Attribution (CC BY) license (https://creativecommons.org/licenses/by/4.0/).
Share and Cite
Chai, T.; Lu, F.; Gao, J.; Deng, X.; Gao, R.; He, Q. TOD Zoning Planning: Floor Area Ratio Attenuation Rate and Center Migration Trajectory. Land 2025, 14, 1200. https://doi.org/10.3390/land14061200
Chai T, Lu F, Gao J, Deng X, Gao R, He Q. TOD Zoning Planning: Floor Area Ratio Attenuation Rate and Center Migration Trajectory. Land. 2025; 14(6):1200. https://doi.org/10.3390/land14061200
Chicago/Turabian StyleChai, Tiefeng, Feng Lu, Jing Gao, Xin Deng, Rui Gao, and Qingsong He. 2025. "TOD Zoning Planning: Floor Area Ratio Attenuation Rate and Center Migration Trajectory" Land 14, no. 6: 1200. https://doi.org/10.3390/land14061200
APA StyleChai, T., Lu, F., Gao, J., Deng, X., Gao, R., & He, Q. (2025). TOD Zoning Planning: Floor Area Ratio Attenuation Rate and Center Migration Trajectory. Land, 14(6), 1200. https://doi.org/10.3390/land14061200