Article

Spatial Analysis of Urban Historic Landscapes Based on Semiautomatic Point Cloud Classification with RandLA-Net Model—Taking the Ancient City of Fangzhou in Huangling County as an Example

School of Landscape Architecture, Beijing Forestry University, No. 35 Qinghua East Road, Haidian District, Beijing 100083, China
*
Author to whom correspondence should be addressed.
Land 2025, 14(6), 1156; https://doi.org/10.3390/land14061156
Submission received: 25 April 2025 / Revised: 24 May 2025 / Accepted: 26 May 2025 / Published: 27 May 2025

Abstract

:
Under the synergy of urban heritage conservation and regional cultural continuity, this study explores the spatial features of “mausoleum–city symbiosis” landscapes in Huangling County’s gully regions. Focusing on Fangzhou Ancient City, we address historical spatial degradation caused by excessive industrialization and disordered urban expansion. A methodological framework is proposed, combining low-altitude UAV-derived high-density point cloud data with RandLA-Net for semi-automatic semantic segmentation of buildings, vegetation, and roads by integrating multispectral and geometric attributes. Key findings reveal: (1) Modern buildings’ abnormal elevation in steep slopes disrupts the plateau–city visual corridor; (2) Statistical analysis shows significant morphological disparities between historical and modern streets; (3) Modern structures exceed traditional height limits, while divergent roof slopes aggravate aesthetic fragmentation. This multi-level spatial analysis offers a paradigm for quantifying historical urban spaces and validates deep learning’s feasibility in heritage spatial analytics, providing insights for balancing conservation and development in ecologically fragile areas.

1. Introduction

Human memory depends on space and social environment, and as a form of social existence, cities should be protected as cultural heritage or collective memory [1]. Urban historical and cultural heritage is not only the various tangible and intangible cultural heritage distributed in the urban administrative area, but also the historical neighborhoods, historical urban areas, and historical landscapes of the city, which are important historical and cultural heritage [2]. However, the modernization construction in recent years has led to the rapid expansion of the city, and the contradiction between the demand of urbanization and the traditional historical landscape space has become more and more prominent, and the protection of cultural heritage is facing a lot of challenges [3].
Historic urban landscape, or HUL, is a holistic approach to conservation and development that has emerged in the field of heritage conservation and urban planning [4]. First introduced in the Vienna Memorandum of 2005 [5], the approach focuses on objects to be conserved as a result of the dynamic accumulation of natural and man-made environments over the course of history. The boundaries of historic urban landscapes are not limited to monumental heritage or conservation areas, but encompass a wider range of natural topographies, ecosystems, social networks, and their interrelationships. In terms of practical research, the Report: World Heritage City Lab 2020 [6], published by UNESCO in 2020, demonstrates innovative practices in the conservation of historic urban landscapes through cases of heritage cities in many countries. Internationally, many scholars have also carried out related practices; for example, Wang explored how to balance historical preservation and modernization in the tourism-driven transformation of World Heritage cities by combining urban morphology with Pingyao Ancient City as an example [7]; and Liu et al. evaluated the perceived authenticity of the heritage of Tianjin’s Five Avenues Historic District through a literature review and review of data mining [8]. In addition, many scholars have applied the concept in combination with modern information technology; for example, He et al. developed a three-level assessment model based on the t-test by comparing the landscape differences between the inner and outer parts of the protected area, the edges, and the neighboring areas [7]. Boukratem Oumelkheir et al. combined the theory with the AHP and the GIS, and explored the landscape and heritage conservation decision-making in the Central Historic Area of Algiers as an example [9]. This shows that the conservation and utilization of historic urban landscape with the help of digital technology provides a new method and perspective for the conservation and utilization of historic cultural heritage [10].
In the traditional research process, the study of urban historical landscape mostly relies on satellite remote sensing data [11], although remote sensing technology is suitable for large-scale regional research [12], its spatial resolution is difficult to meet the micro-scale accuracy requirements [13]. As an emerging digital technology, drone tilt photography provides a new path for the protection of historical and cultural heritage. This technique acquires raw images of ground units [13], which are processed through software such as Pix4D and Context Capture [14] to generate foundational geospatial datasets, including Digital Surface Models (DSMs), orthophoto maps, and 3D models [15]. Subsequently, high-density point cloud data are extracted using analytical tools like CloudCompare [16], ArcGIS [17], e Cognition [18], and Terra Solid [19]. By integrating multispectral information and spatial coordinate features, semi-automated object classification is achieved, enabling precise identification of terrain elements such as buildings, vegetation, and infrastructure. On this basis, the quantitative analysis of urban historical landscape space can be accomplished, including the statistics and calculation of key indexes such as settlement structure, street pattern, building height, etc. [16,20,21]. For example, Tang obtained the city model through Smart3D 3D modeling to simulate the storm inundation scenarios in different recurrence periods. Zun et al. realized the multidimensional analysis of spatial morphology by combining the Structure from Motion (SfM) technique and the Ground Control Points (GCPs) to generate the digital surface model, orthophoto, and 3D model [7]. Liu et al. realized the automatic extraction of heritage landscape elements by combining object-oriented image analysis (OBIA) and random forest/Support Vector Machine (SVM) classification methods [13]. It can be seen that the Unmanned Aerial Vehicle (UAV) tilt photography technology has great potential in 3D analysis [22].
Although some scholars have already applied the oblique photographic data to spatial analysis, most of the applications focus on historical buildings [23], urban neighborhood display or engineering construction [24], digital city, resource management, or disaster assessment [25], and less on the field of historical landscape protection. The application of UAV photographic data in the field of urban landscape mainly focuses on the use of aerial photographs as two-dimensional graphics [26,27], while the point cloud data fail to give full play to their potential in three-dimensional spatial analysis due to the complex and cumbersome classification process.
The efficiency of point cloud classification can be significantly enhanced through deep learning methodologies. In spatial environment assessment, conventional frameworks such as convolutional neural networks (CNNs), recurrent neural networks (RNNs), and deep belief networks (DBNs) have been widely adopted. For instance, Wang et al. [28] proposed a spatial coverage convolution (SC-Conv)-based classification method; however, its high computational complexity compromises model flexibility and scalability for large-scale scenes. Qi et al. [29] introduced Point Net, a pioneering network for direct point cloud processing, yet its segmentation performance remains suboptimal in expansive environments. While the enhanced Point Net++ architecture [30] addressed local feature extraction limitations and improved segmentation accuracy, it neglects critical spatial relationships, including inter-point distance and directional dependencies. In contrast, Chen et al. [31] resolved key challenges in traditional random sampling methods—such as information loss at critical points and multi-scale/category imbalances in urban scene point clouds—by developing the RandLA-Net++ and RandLA-Net3+ models. This approach not only maintains computational efficiency but also achieves state-of-the-art semantic segmentation accuracy in complex environments, outperforming existing frameworks in both precision and adaptability.
In summary, RandLA-Net demonstrates distinct advantages as a lightweight network, including computational efficiency, minimal parameterization, and robustness in processing large-scale point clouds [31]. To holistically leverage the spatial coordinates of point clouds, local spatial relationships between points, and multispectral-derived semantic features through data fusion, this study adopts the RandLA-Net framework for semi-automatic point cloud classification. The methodology prioritizes the integration of spectral–geometric hybrid features while maintaining computational scalability, thereby enabling precise identification of architectural, vegetational, and infrastructural elements in complex historical landscapes.
This study aims to construct a spatial analysis paradigm for traditional settlements integrating 3D point cloud technology and deep learning, to reveal the spatial characteristics of the historical landscape of Fangzhou Ancient City and its degradation mechanisms, and to provide methodological support for the digital preservation of “mausoleum–settlement symbiosis”-type settlements in the Loess Plateau. The specific objectives can be decomposed into the following three dimensions:
  • Technological Method Innovation: We develop a technical workflow integrating “UAV oblique photogrammetry–RandLA-Net point cloud classification–multidimensional spatial analysis” to overcome the constraints of conventional surveying methods in analyzing complex historical spaces. A semi-automatic classification framework for historical landscape components is implemented through the fusion of multispectral (RGB) features and geometric attributes (elevation, slope).
  • Spatial Feature Analysis: Systematically quantify evolutionary patterns of spatial features across three tiers: terrain–street–building:
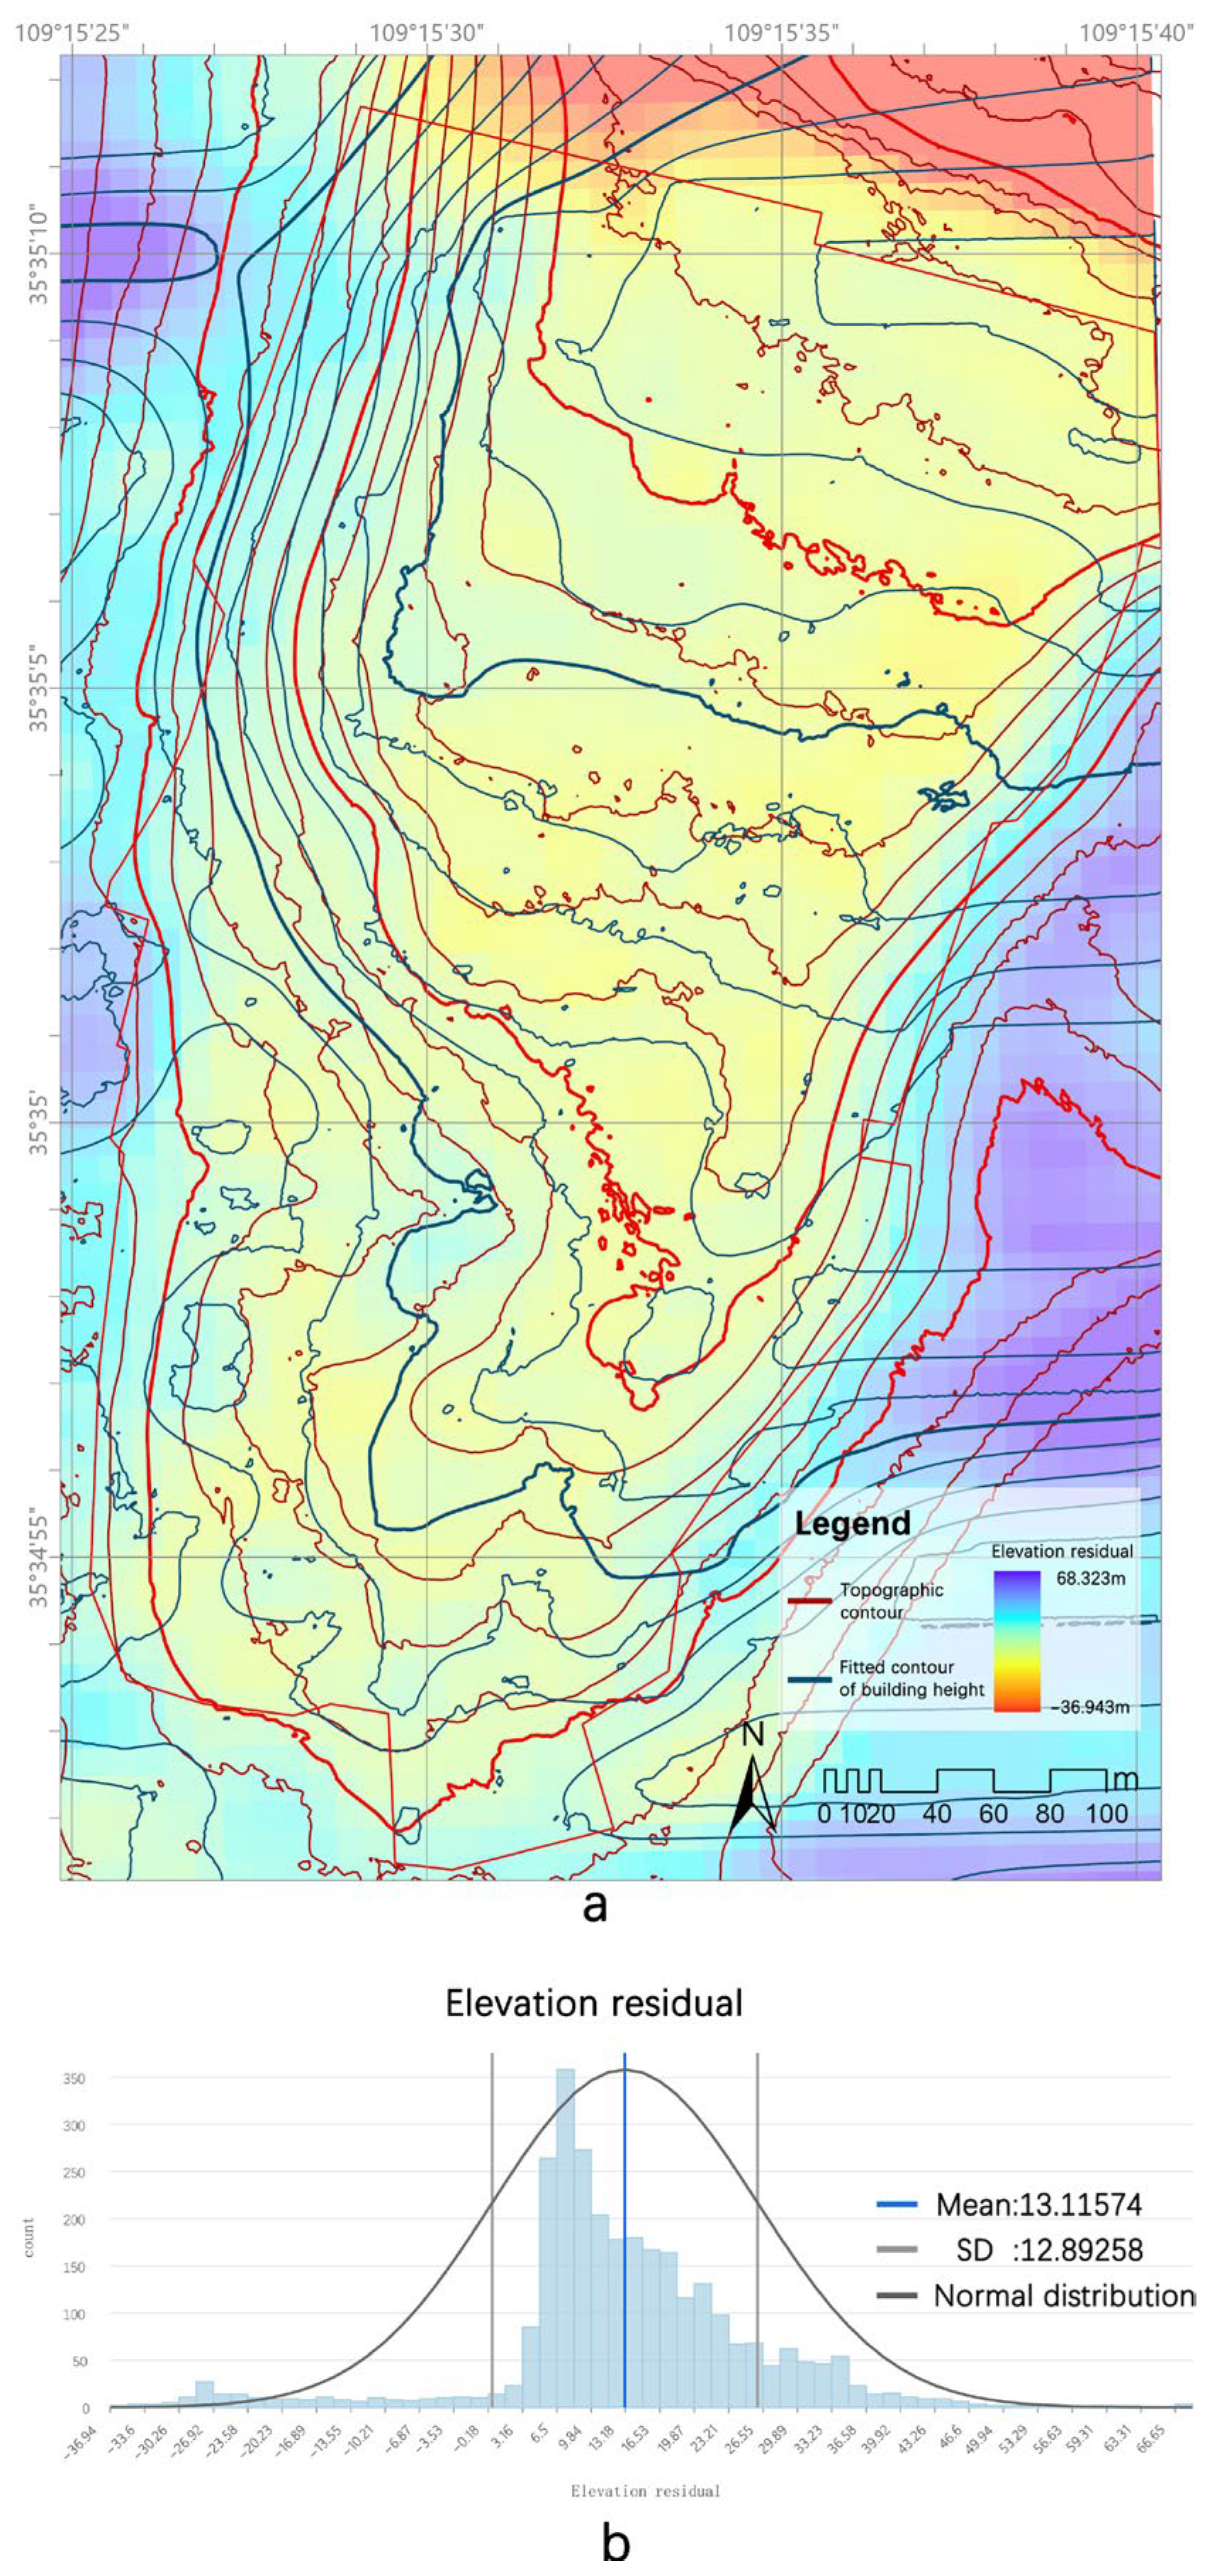
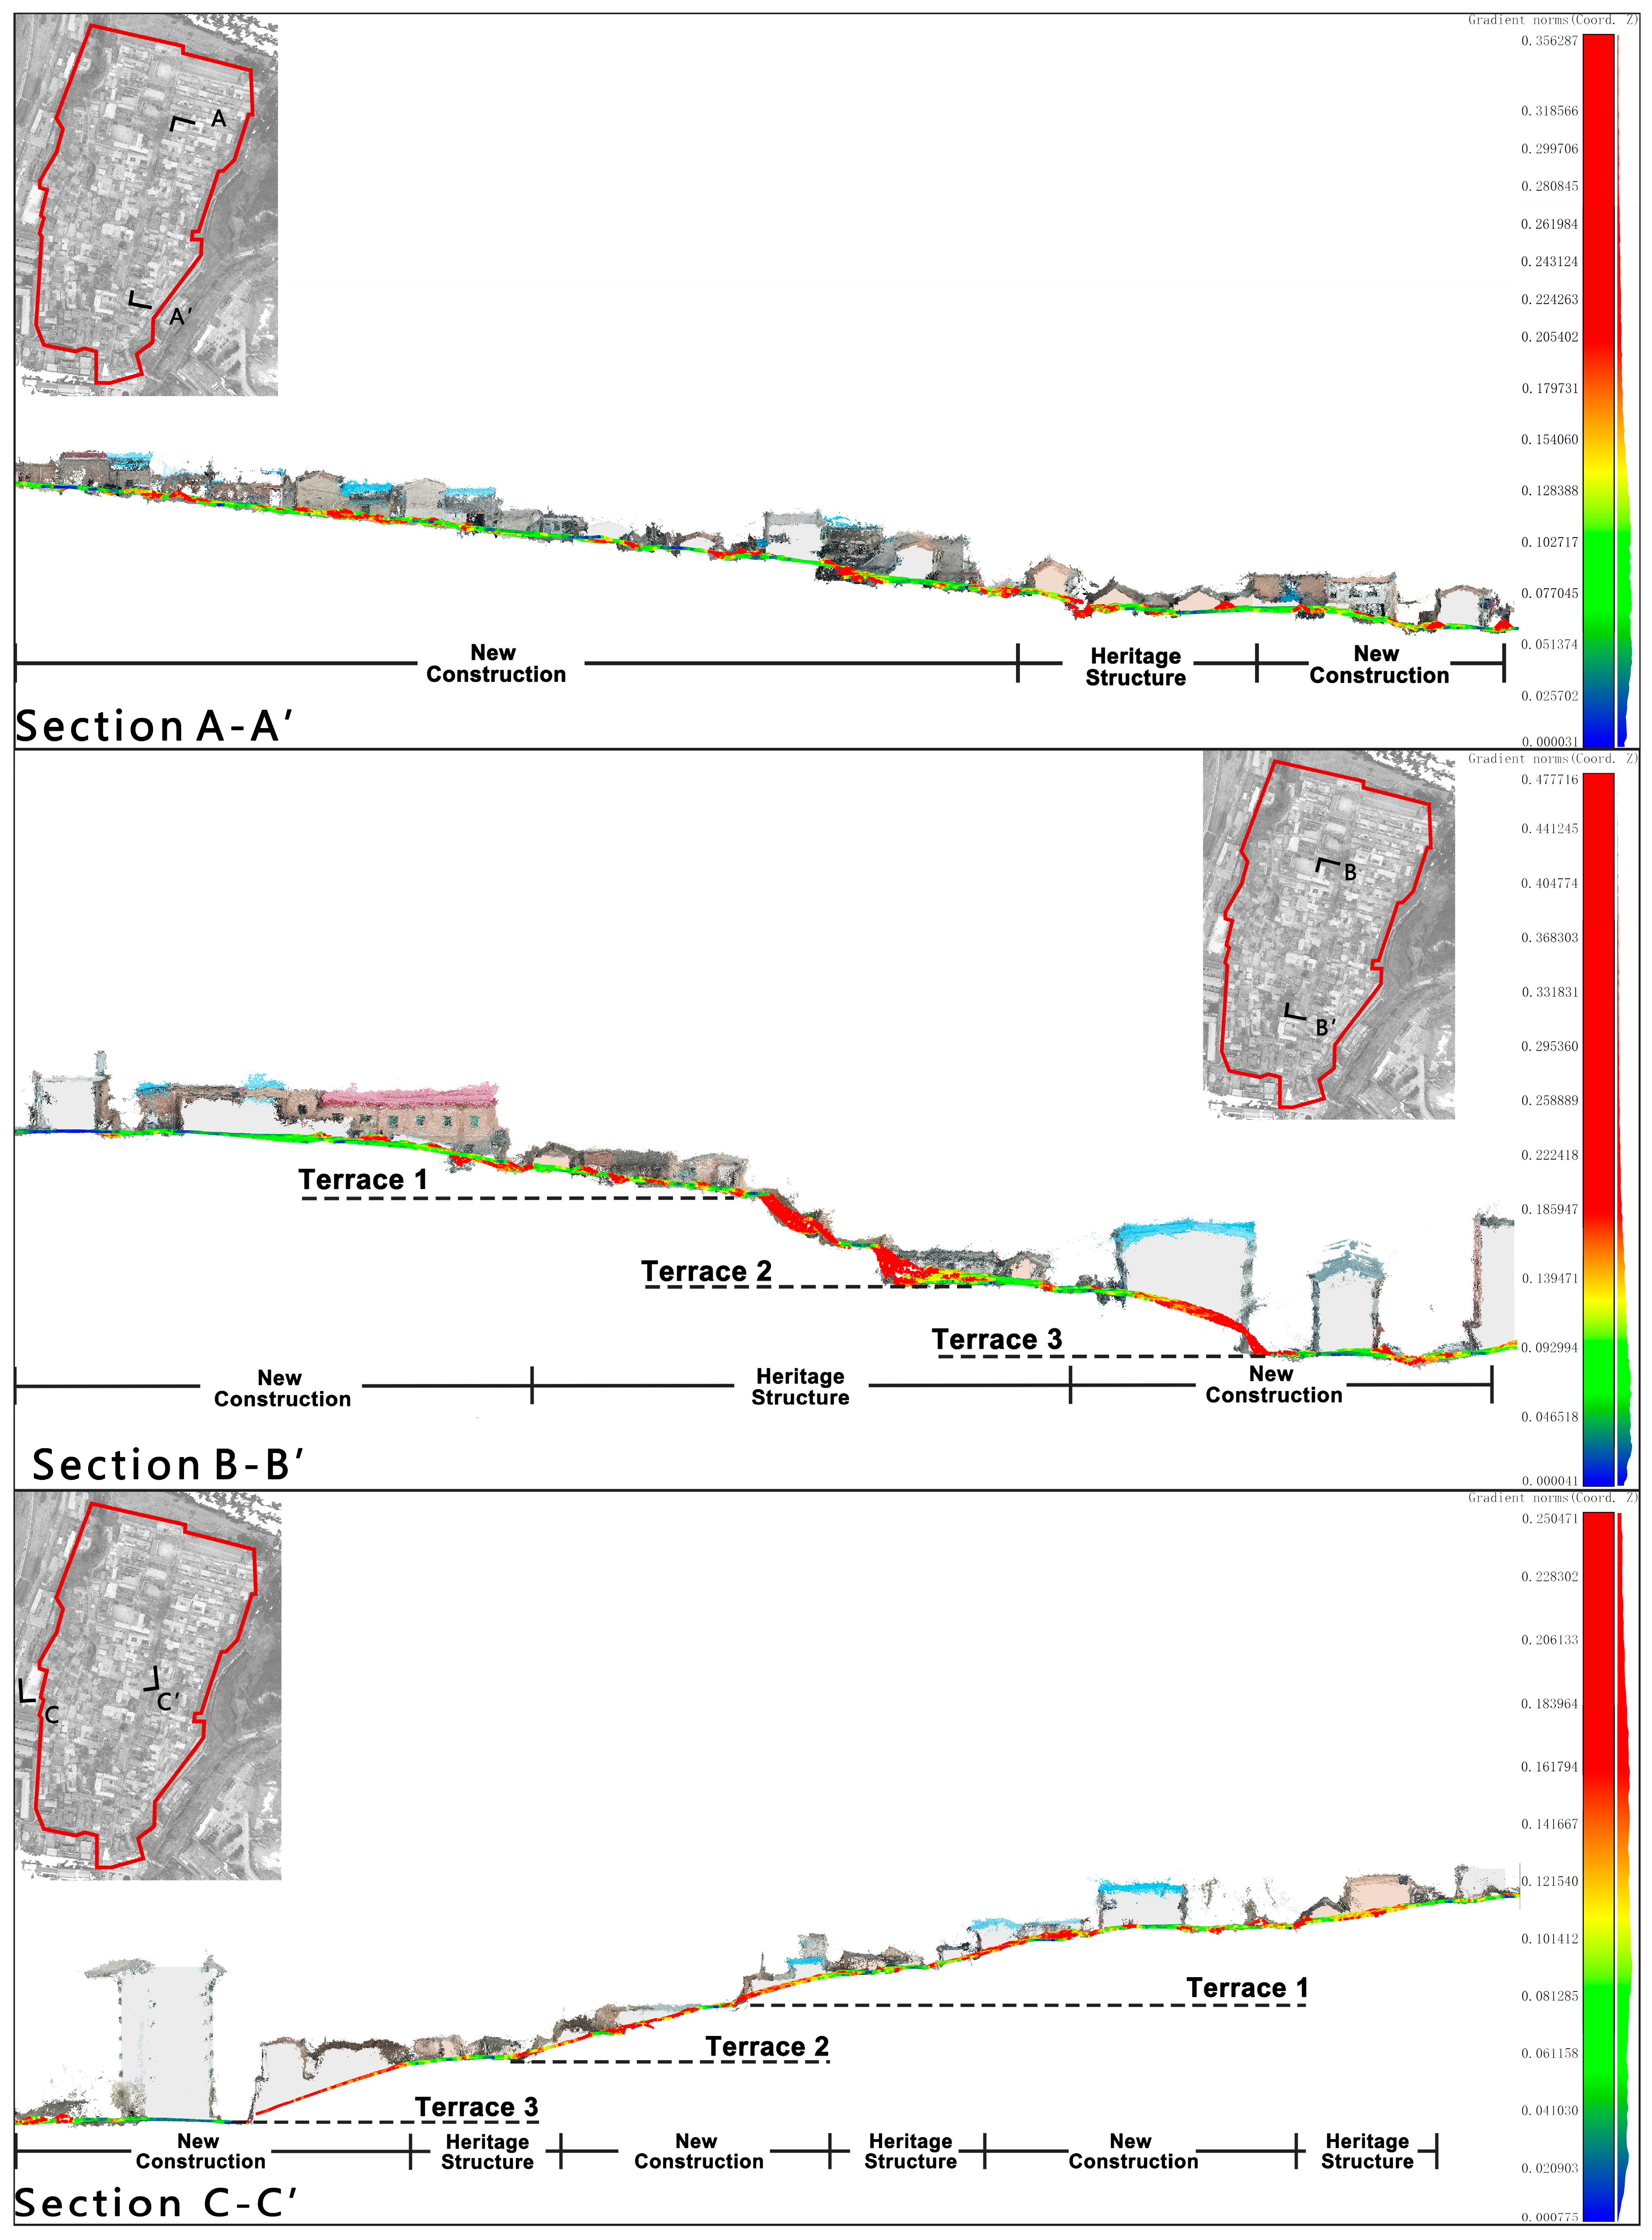
    • Terrain Adaptation Mechanism: Reveal spatial coupling between elevation residuals of historical buildings (ΔH) and topographic relief, identifying critical thresholds at which modern construction disrupts terrace landscape continuity.
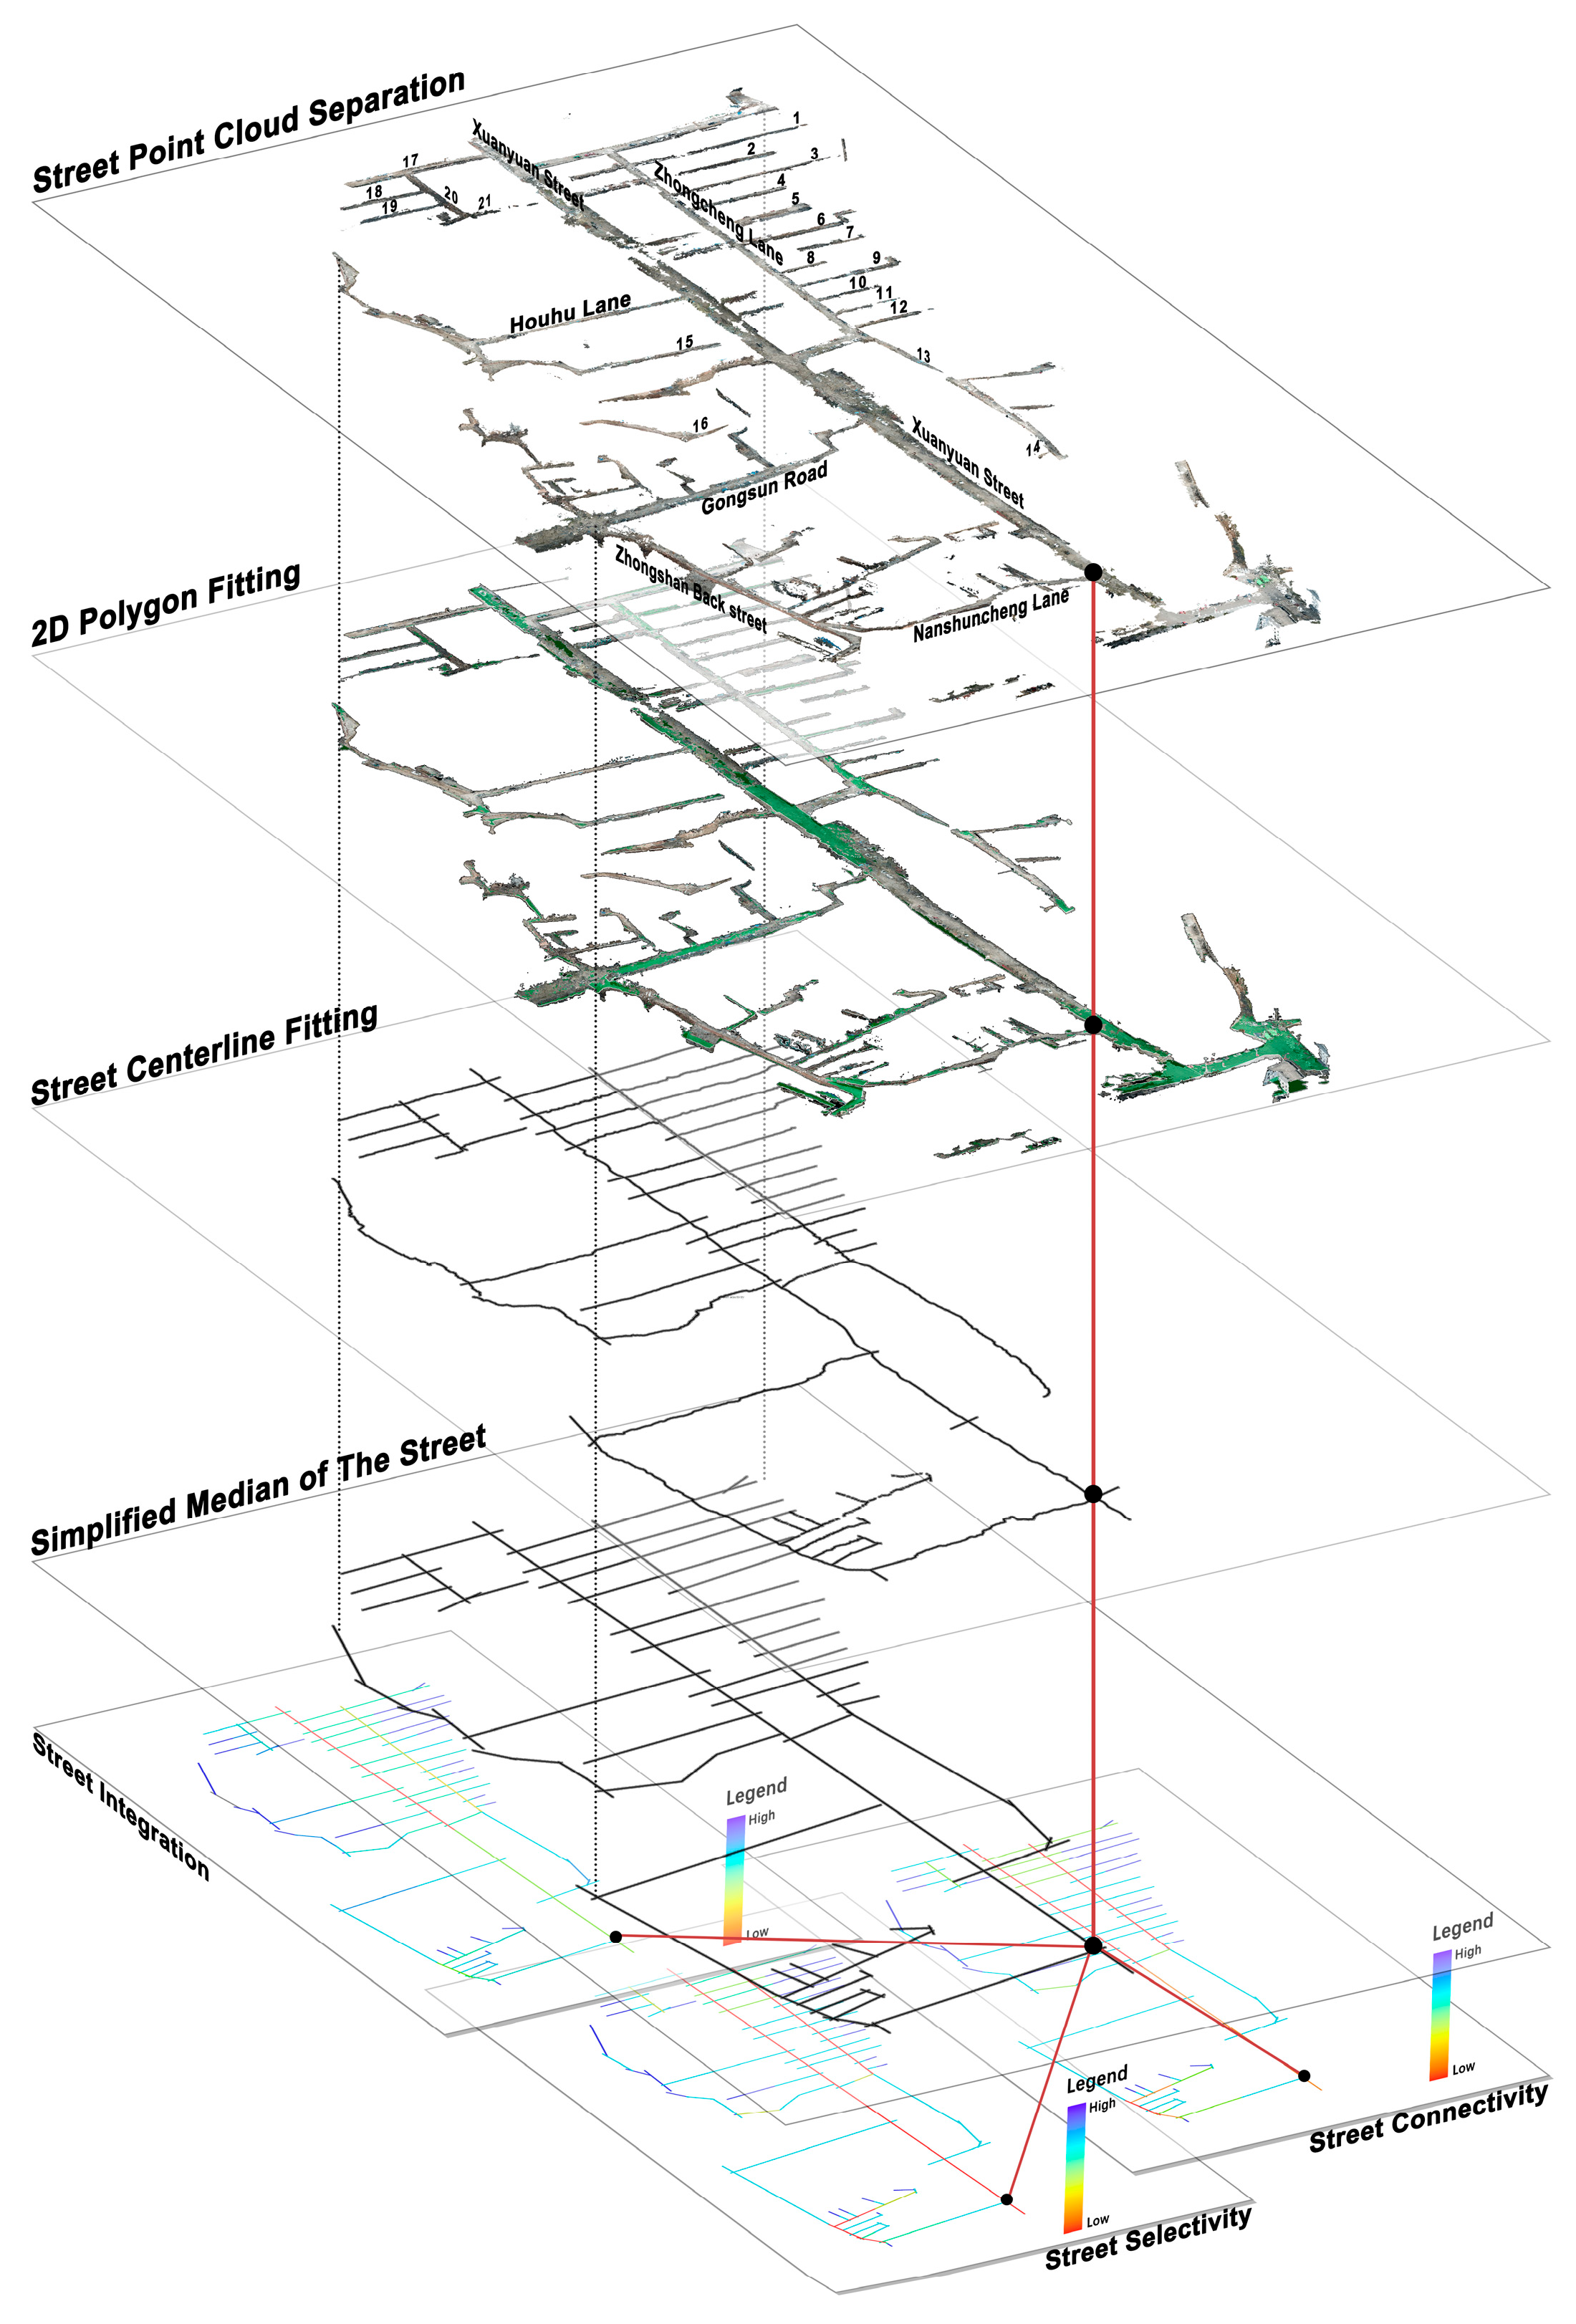
    • Street–Alley Hierarchy: Streamline spatial analysis via point cloud data, evaluating degradation of cultural narrative functions in traditional axial spaces using spatial syntax metrics.
    • Architectural Landscape Alienation: Develop quantitative indices for roof slope dispersion and deviations from traditional height constraints.
  • Methodological Validation: Develop a technical workflow of 3D point cloud dimensionality reduction → 2D topological reconstruction, establishing a multi-scale spatial analysis framework spanning settlement, street, and architectural levels. This approach provides a replicable analytical paradigm for digital preservation of urban historical landscape spaces.

2. Materials and Methods
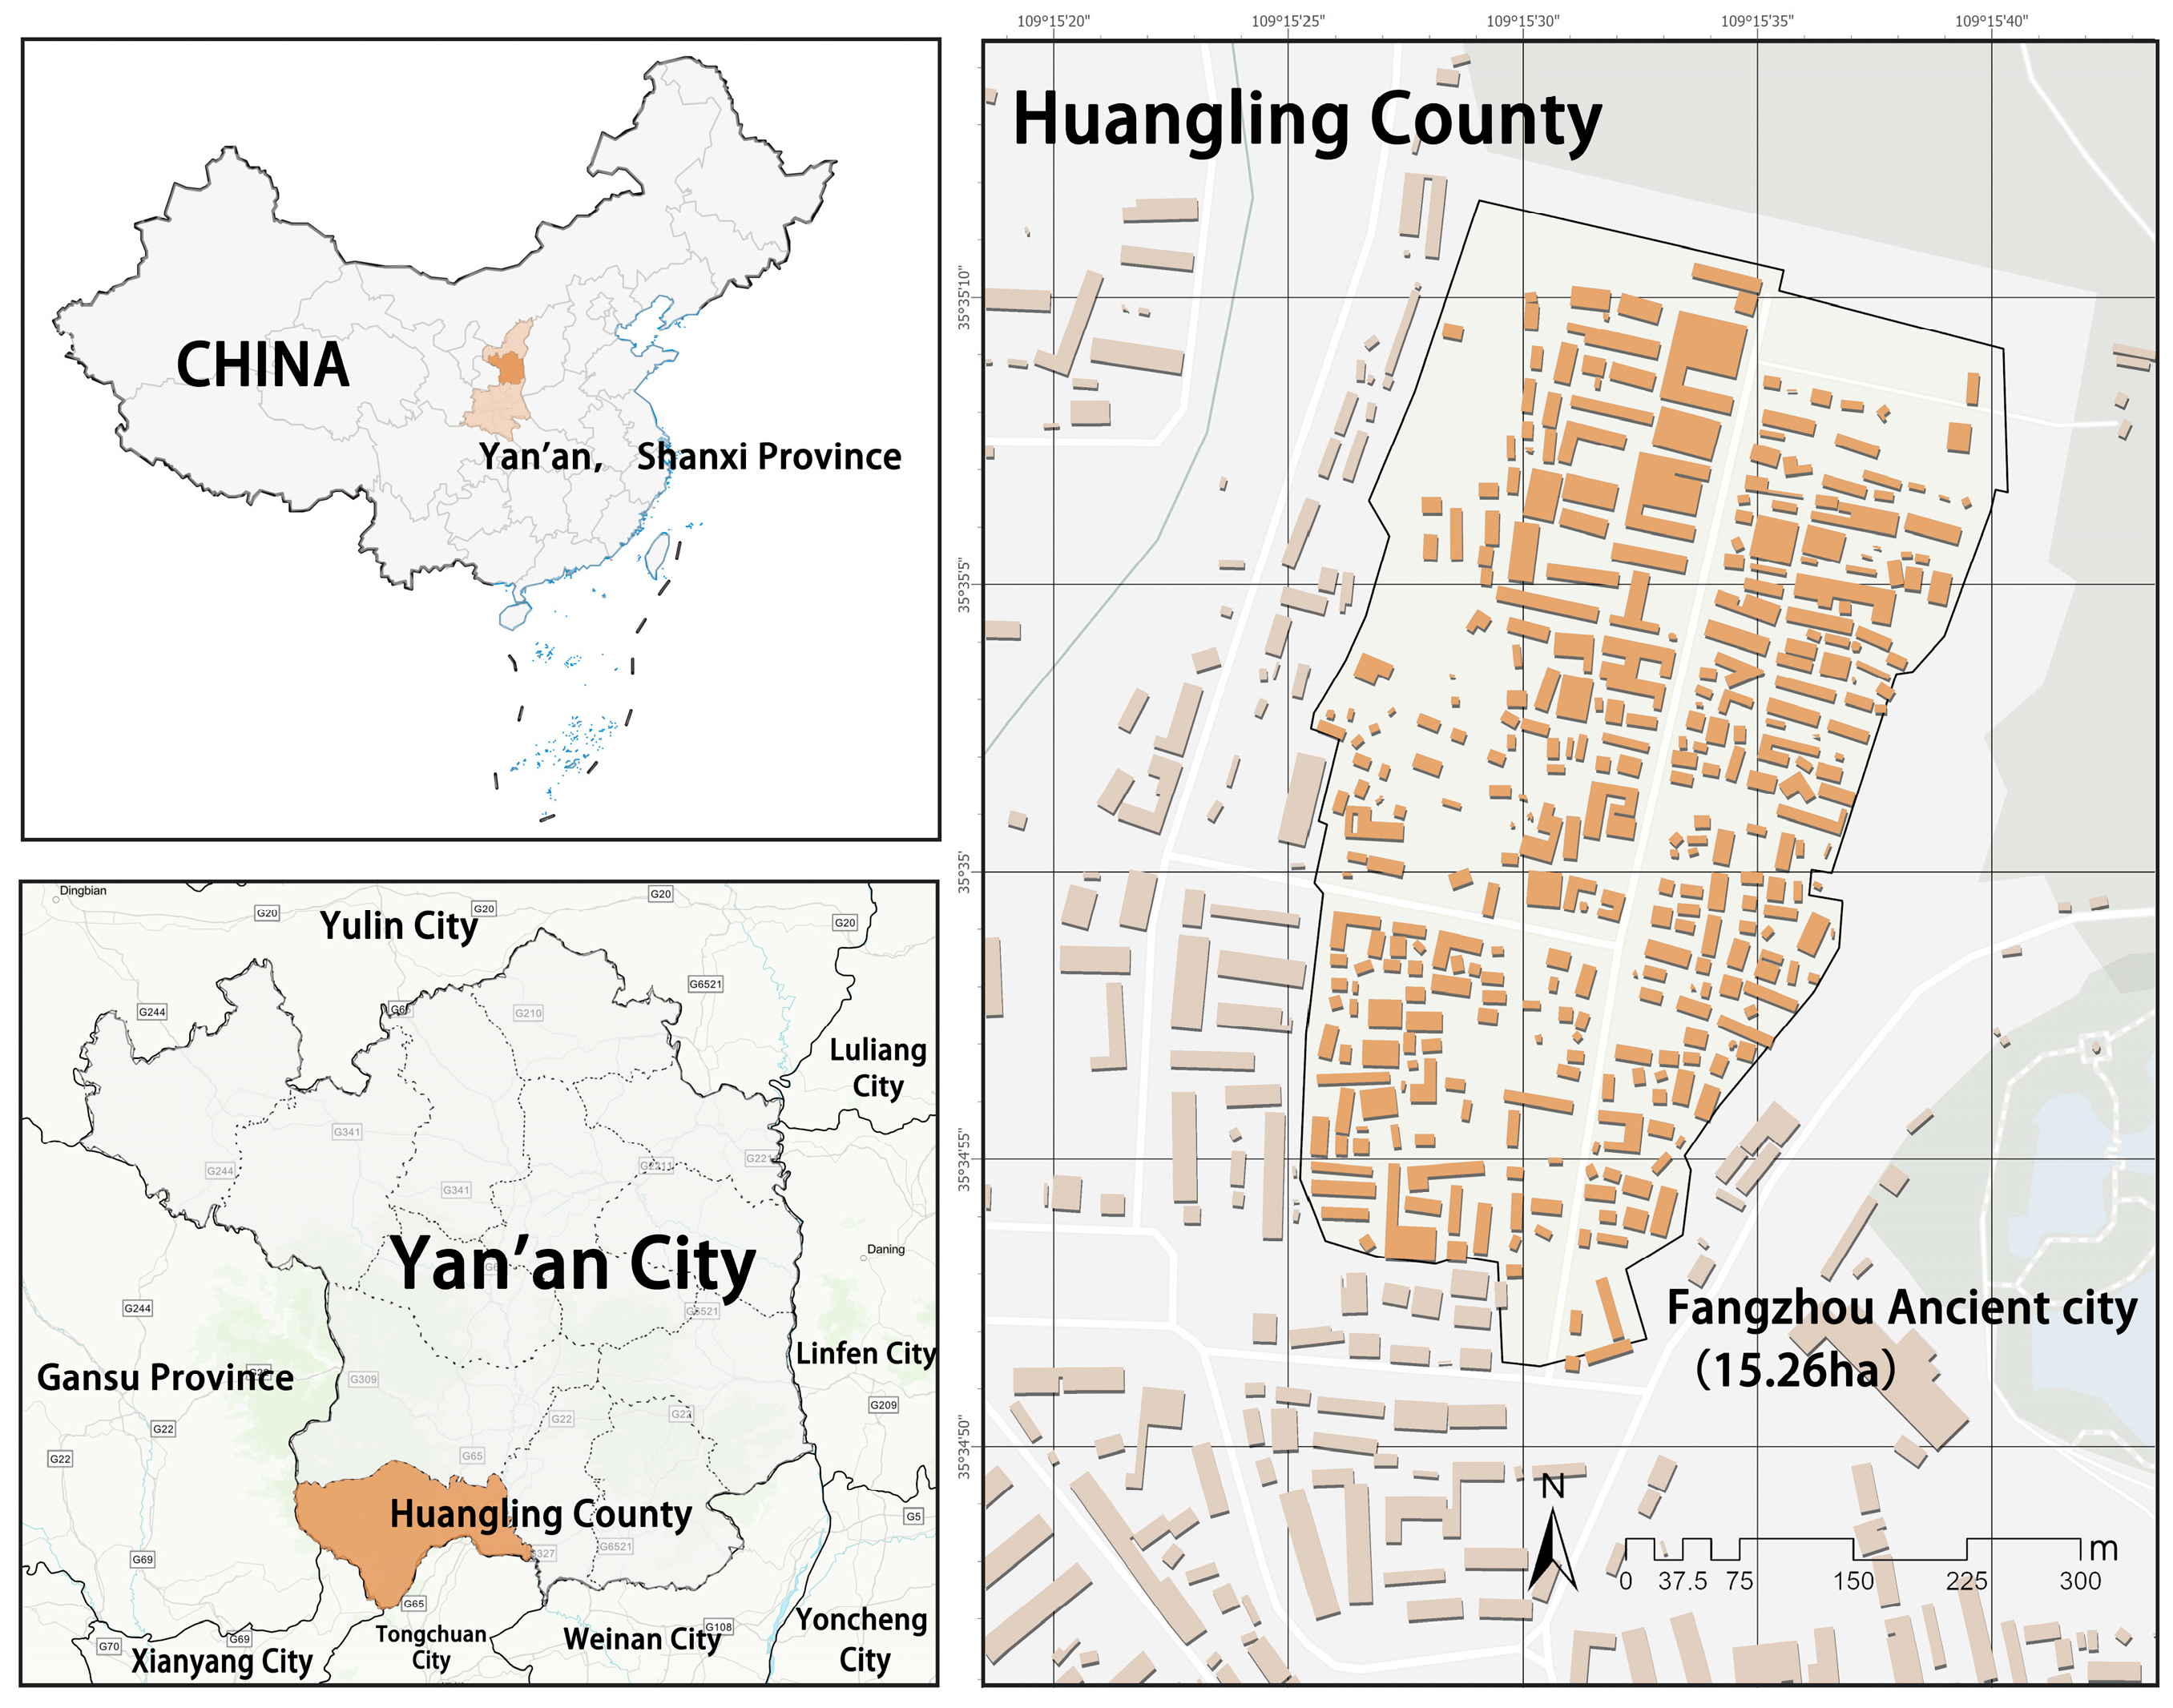
2.1. Study Area

This study focuses on Fangzhou Ancient City in Huangling County, Yan’an City, Shaanxi Province (Figure 1). Situated atop Qiaoshan Mountain, the site lies approximately 500 m north of the Mausoleum of the Yellow Emperor (Huangdi Ling), bounded by the Ju River along its western slope and a deep gully to the east [32]. The Xuan Yuan Temple is located about 800 m east of the gully, with the Upper City residential area adjacent to the south [33]. The ancient city spans 350 m east–west and 450 m north–south, exhibiting an oblong layout. While the western and southern sections of the city walls are no longer extant, a 150 m remnant survives in the eastern portion [34].
Originally constructed during the Tang Dynasty, Fangzhou served dual roles as a residential complex for guardians of the Yellow Emperor’s Mausoleum and a military stronghold defending the northern frontier against nomadic incursions [35]. Its spatial organization manifests the symbolic configuration of “temple-left, administrative-right” (左庙右邑) and “north-city, south-mound” (北城南塬), forming an integrated ceremonial landscape with the imperial mausoleum [36].
However, the accelerating urbanization has intensified the complex relationship and conflicts between the Mausoleum of the Yellow Emperor (Huangdi Ling) and Huangling County. Although Fangzhou Ancient City’s conservation plans prioritize preservation through policy frameworks and management protocols, they inadequately address landscape degradation in the mausoleum’s core buffer zone. This failure has eroded the authenticity and integrity of the Huangdi Ling cultural heritage, diminishing its sacred ancestral ambiance. As a material embodiment of imperial mausoleum culture, Fangzhou Ancient City preserves ritual, military, and postal functions spanning the Tang to Qing dynasties. Its unique cultural landscape emerges from the spatial synergy of mausoleum–city–mountain–water systems, where street networks, architectural remnants, and micro-topographic variations serve as vital archives for studying China’s urban spatial evolution and sociostructural transformations.
This research employs 3D point cloud data to analyze Fangzhou’s settlement patterns, street morphology, and architectural volumetry across three scales, enabling landscape conservation through quantitative spatial characterization.

2.2. Research Methodology

This study constructs a technical pathway for quantitative analysis of urban historical landscape spatial characteristics (Figure 2), comprising three components: field data collection, data processing, and data analysis/application. During the field data acquisition phase, low-altitude UAV aerial photography was employed to obtain 3D point cloud data. Subsequently, the point cloud data underwent processing including denoising, fusion, and object classification. Finally, data analysis and application were conducted based on quantifiable indicators of settlement spatial features. The following section details the technical specifications of each step and explains the data acquisition methods and analytical techniques.

2.2.1. Data Acquisition and Pre-Processing

The study utilized a DJI Mavic Pro drone equipped with a 1/2.3-inch CMOS sensor camera, featuring a 3-axis mechanical gimbal and an F2.2 aperture lens with an equivalent 26 mm focal length, capable of capturing 12.35-megapixel photos and 4K/30 fps videos. The drone integrated GPS+GLONASS dual-mode positioning and a five-directional vision obstacle avoidance system (forward obstacle detection range 0.7–15 m), enabling real-time HD image transmission over 7 km via OcuSync™ transmission. Its 4K imaging resolution and ±0.1 m hovering accuracy meet scientific aerial photography requirements [37].
The UAV operation was conducted from 28–29 November 2024. Considering sunlight intensity and angle, data acquisition was scheduled between 9:00 a.m. and 12:00 p.m. Four predefined flight paths were executed at an altitude of 200 m above terrain, with 80% longitudinal and 60% lateral overlap (exceeding the requirements of Chinese national standard GB/T 27920.1-2011 [38] for 80% forward overlap and 60% side overlap). Each sensor captured 951 aerial images, which were geotagged using 3D positional data (XY coordinates and elevation) derived from onboard GPS. Post-acquisition, data integrity was verified by cross-checking the number of oblique images with PSO data logged by the UAV’s GPS, ensuring temporal synchronization between PSO information and sensor-captured images. Image quality was assessed for overexposure, underexposure, and color consistency, with necessary adjustments applied.
Following data acquisition, preprocessing commenced by importing images into Pix4D mapper 4.6.4. The CGCS2000 geodetic coordinate system was selected, with a Gauss-Krüger projection and defined central meridian. Preliminary tasks—Position and Orientation System (POS) file generation, camera model recognition, and image correction—were automated by the software. Free aerial triangulation processing was executed, producing a quality report (Figure 3) upon completion. After verifying checkpoint accuracy, these checkpoints were designated as control points for subsequent aerial triangulation. High-precision LAS-format point cloud data were generated through aerial triangulation. Although Pix4D includes automated point cloud classification, its low accuracy led us to discard this function. The point cloud was imported into CloudCompare2.13.2 and cropped according to the study area. Gaussian filtering was applied to preprocess the point cloud, removing outliers (extremely high/low points) and gross errors, thereby preparing the dataset for subsequent classification.

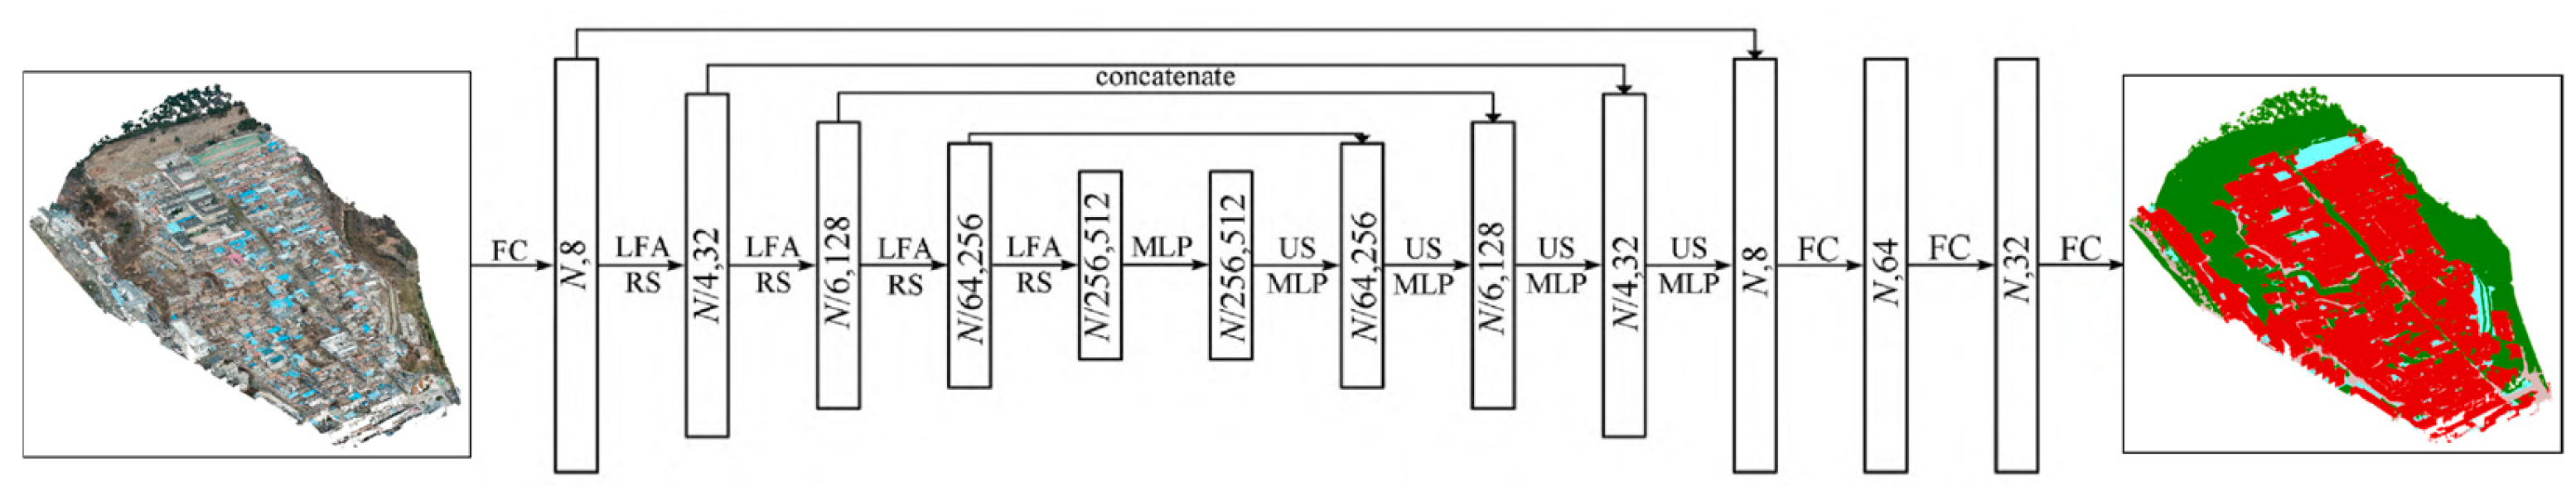
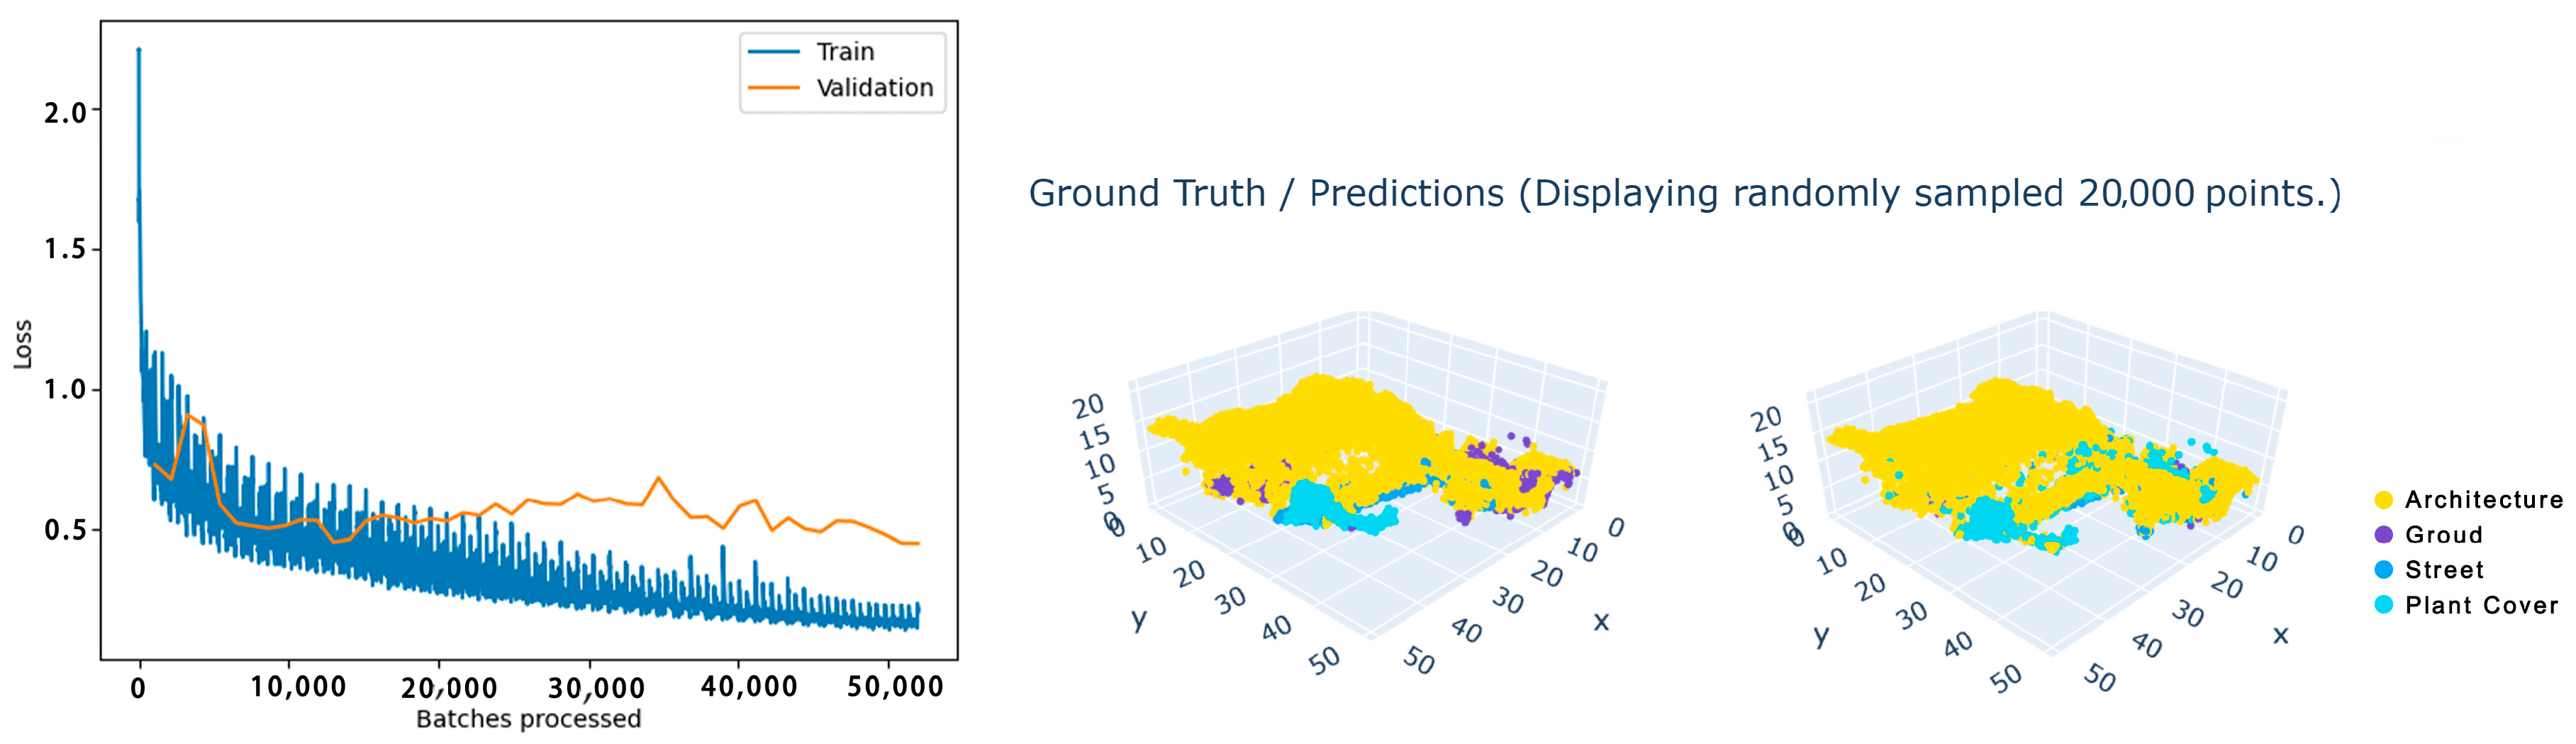
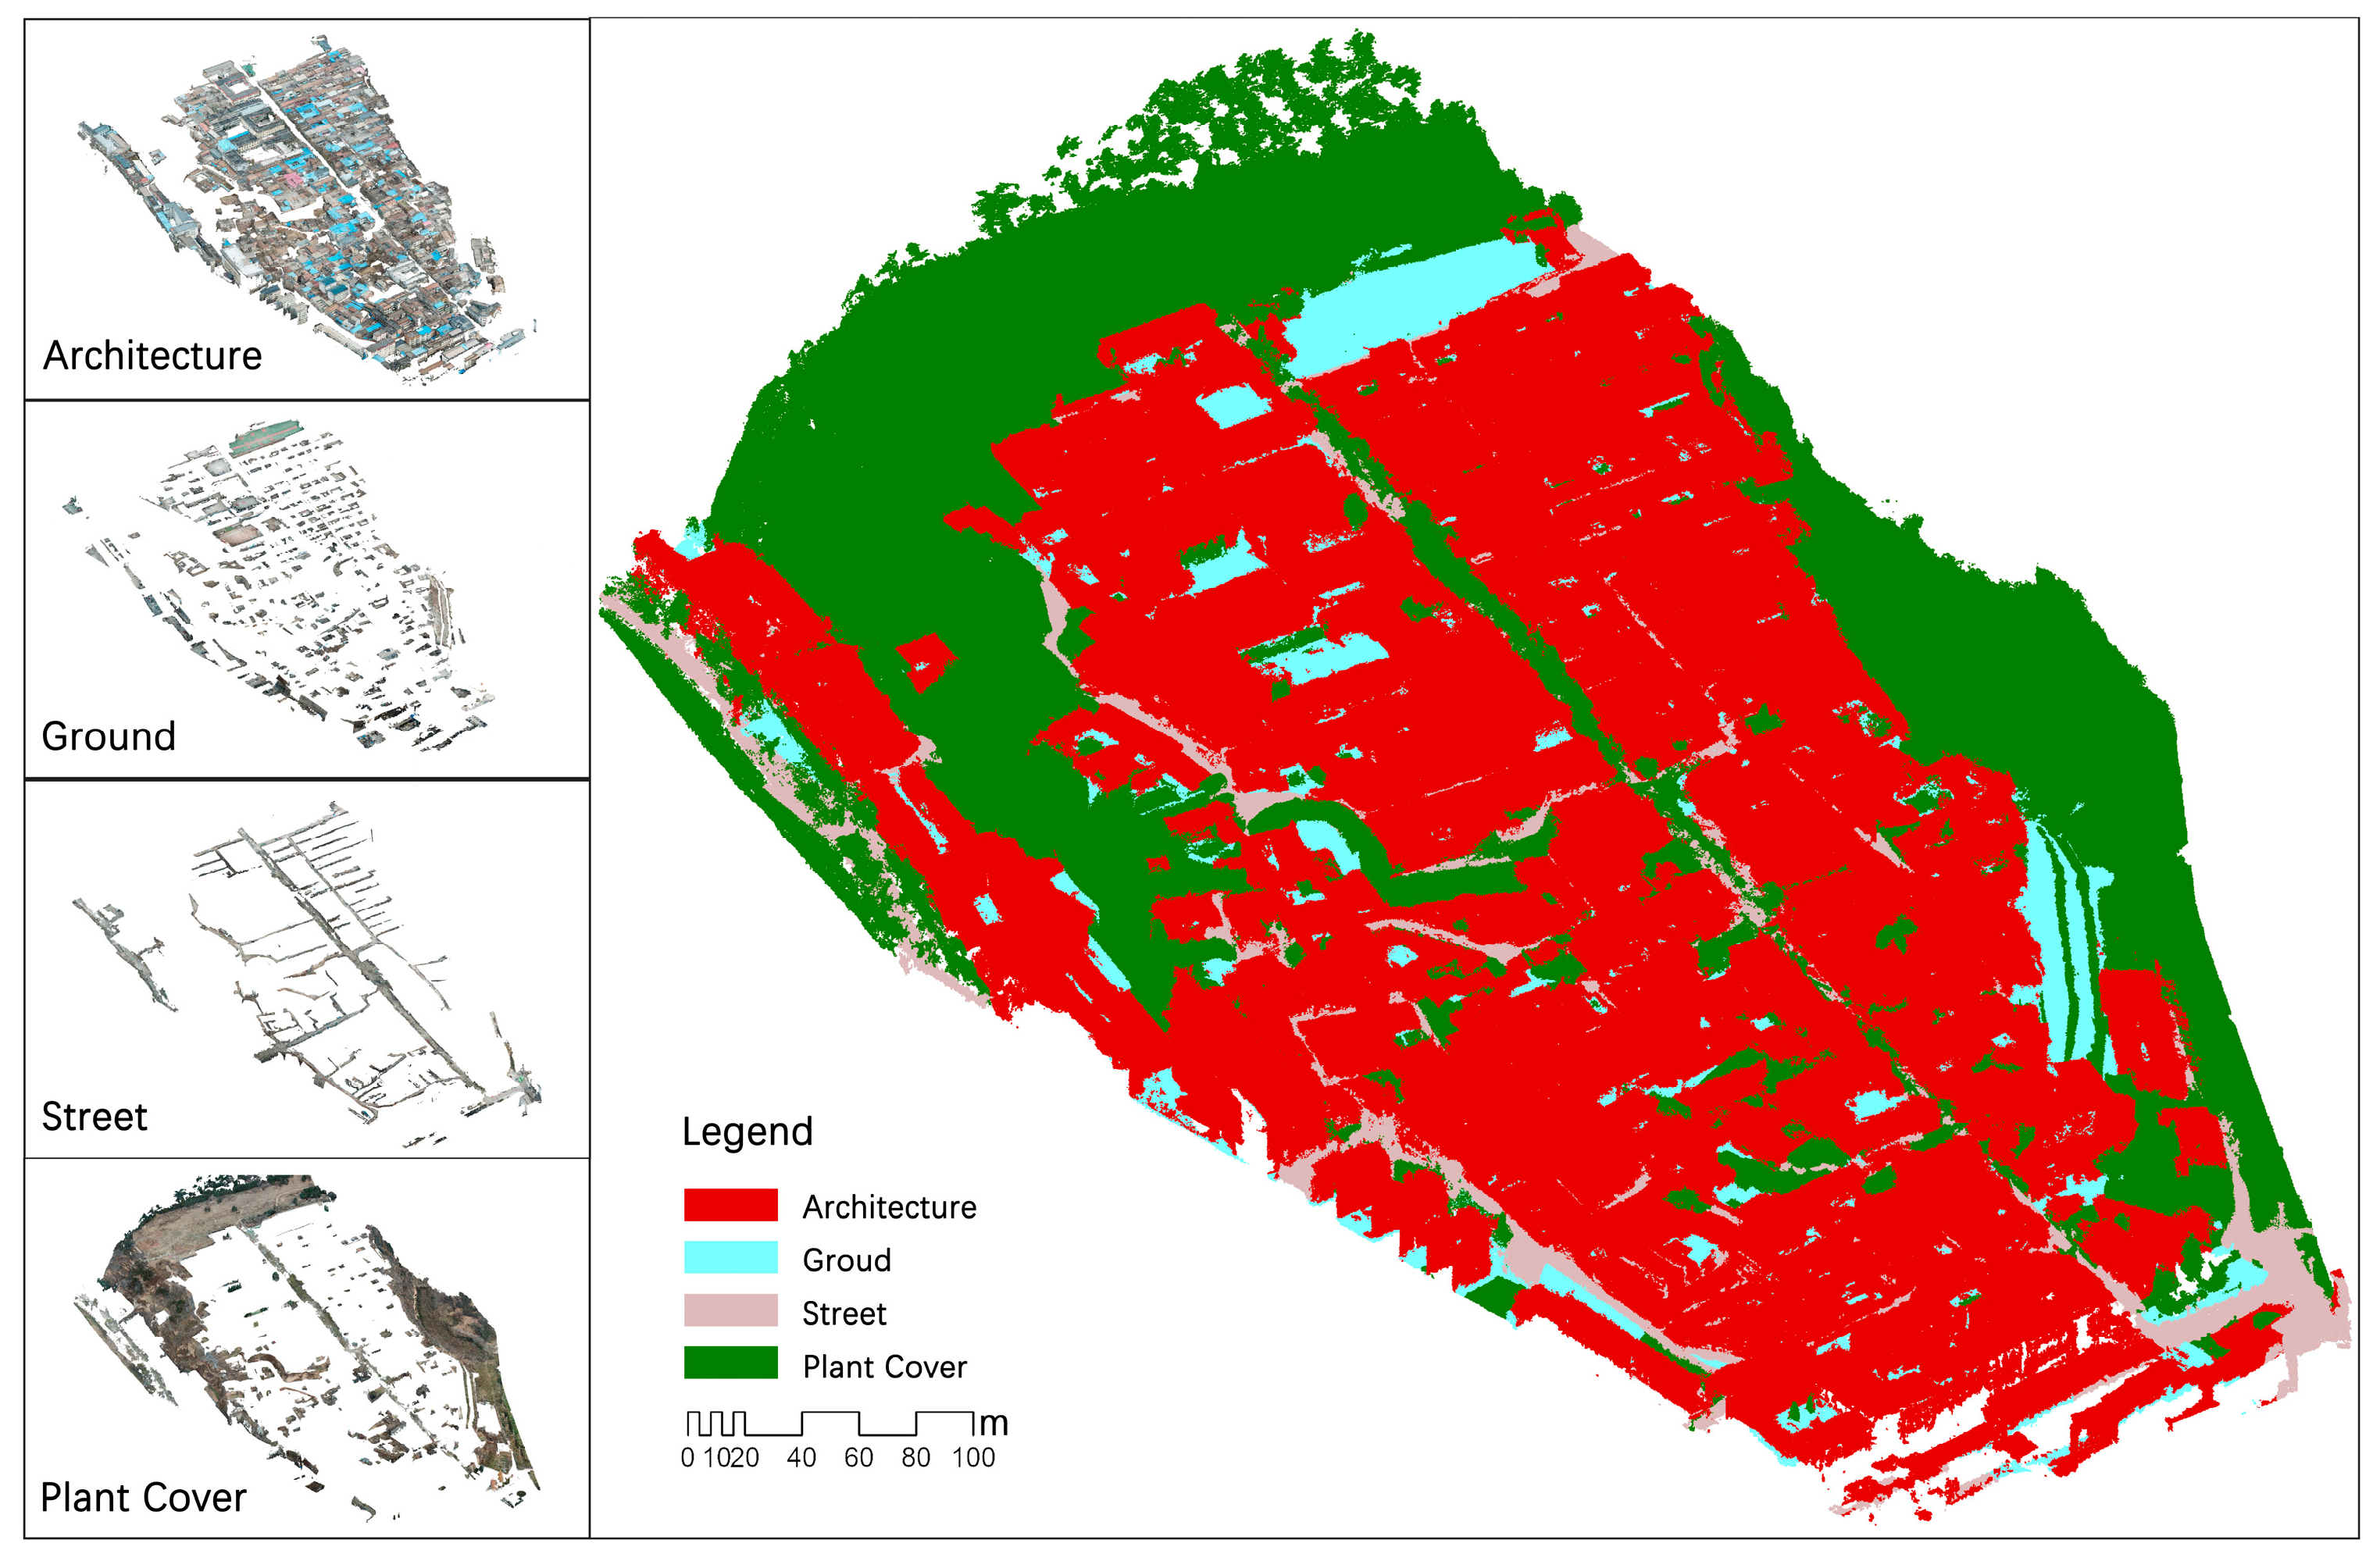
2.2.2. Point Cloud Classification Using the RandLA-Net Model

In this study, the RandLA-Net model is used for deep learning to accomplish point cloud classification, and the RandLA-Net structure follows the idea of coding and decoding with jump connections. The structure of RandLA-Net follows the idea of coding and decoding with jump connections. Its structure is shown in Figure 4, the point cloud is different from the image in that it is impossible to extract the features by traversing the image with the convolutional kernel, so in the semantic segmentation algorithm of the point cloud, the basic unit of RandLA-Net is the multilayer perceptron (MLP). At the encoding side, the point cloud is enriched with the features of the learning points through the local feature aggregation (LFA) algorithm in each layer, and the size of the point cloud is reduced using random sampling (RS), which retains 25% of the number of the point cloud at a time, and the dimension of the features in each layer is (8, 32, 128, 256, 512). The decoding end is up-sampled (US) using a linear interpolation method of each point with the nearest neighbors obtained from the k-nearest neighbor (KNN) classification, which is superimposed with the feature map of the coding end through jump connections, and then fed into the shared MLP for feature dimensionality reduction. Finally, three fully connected layers (FC) with a Dropout layer are used to predict the category of each point [31].
The specific methods of utilizing and classifying point cloud information are as follows: (1) Spatial coordinates: Using the three-dimensional coordinates of points (X, Y, Z) and the relative position difference between the points, the size, height, and distance of the target object can be calculated. (2) Color information: The difference of RGB color values can be used to classify buildings and vegetation of different colors. (3) Relative height information: In CloudCompare, the Cloth Simulation Filter (CSF) plug-in is used to separate ground and non-ground points to generate the DEM digital elevation of the site.
Considering the characteristics of small building volume (average footprint < 200 m2) and dense spatial distribution (point cloud density ≥ 120 points/m3) in the study area, the grid dissection method was used for spatial cell delineation. Based on the characterization of the spatial scale of the site, a sampling grid of 25 m × 25 m (400 cells in total) was set up, and 100 sample slices were selected through a stratified random sampling strategy to ensure that the slices contained a complete combination of ground elements (ground, vegetation, buildings, pavement) and covered the spatial heterogeneity of the whole area. According to the specification of feature classification (GB/T13923-2022) [39], a quadratic classification system was established: ground (code 2), vegetation (code 3), buildings (code 6), and pavement (code 11), and the 3D spatial topology was verified by CloudCompare2.13.2 software when the manual labeling was completed, so as to eliminate mislabeling phenomena caused by the occlusion of point clouds.
After that, the standard RandLA-Net framework was adopted in the ArcGIS Pro 3.3.2 platform for point cloud classification modeling. The RGB multispectral features (red, green, and blue bands) and relative height were used as input attributes to construct the point cloud classification model of urban historical landscape. In the model training phase, this study systematically analyzed the maximum iteration epochs using a controlled variable approach to determine the optimal convergence threshold for model performance. Experimental results demonstrated a significant unimodal distribution pattern in classification accuracy with respect to iteration counts: when the training cycle reached 25 epochs, the validation accuracy was 85.17%; as the number of iterations increased to 50 epochs, the model achieved its peak performance with an accuracy of 86.93% (±0.35%); however, when the iteration count was further increased to 75 epochs, the accuracy dropped to 85.69% (the accuracy values for other iteration counts are not elaborated here in detail). This phenomenon indicates a clear overfitting critical point during the iterative training process. Based on convergence curve analysis, this study found that once the iteration count exceeded 50 epochs, the validation loss function began to exhibit an upward trend, while the performance gap between the training set and validation set gradually widened, manifesting typical overfitting characteristics. Through comprehensive evaluation, 50 epochs were ultimately determined as the optimal iteration threshold. This decision ensured the model’s optimal classification capability while effectively mitigating the risk of overfitting. Consequently, the maximum iteration epoch was set to 50 during the training phase, with a single-cycle dynamic learning rate strategy (initial value: 0.001) implemented, using the validation set F1-score as the model selection criterion.
The model evaluation results (Figure 5) show an overall classification accuracy of 86.93%, with significant category discrepancies. The classification statistics results of the point cloud model are shown in Table 1. Architecture identification achieved optimal performance (F1 = 93.59%), where its high precision (94.24%) and recall (92.94%) indicate the model’s strong ability to capture regular geometric structures. The plant cover category exhibits high recall (88.79%) but low precision (64.55%). Misclassification analysis reveals 561,000 ground points and 606,000 street points erroneously labeled as plant cover, presumed to be due to spectral similarity between plant cover and bare ground. Street category shows severe underdetection (recall rate: 63.28%), with 447,000 street points misclassified as architectures, likely related to partial ground coverage by vegetation. Ground category misclassifications primarily involve cross-confusion with plant cover (accounting for 28.2%). It is recommended to incorporate multi-temporal data or introduce texture features to optimize classification boundaries in future work.
The 3D point cloud model generated for the study area is shown in Figure 6.

2.2.3. Data Analysis and Application

This study focuses on the quantitative analysis of typical spatial characteristics of ancient cities across three levels: topographic environment, street space, and architectural structures. Distinct quantifiable indicators and analytical methods are extracted for each level, as shown in Table 2. Through empirical studies of representative cases, the workflow is demonstrated, enriching research outcomes on urban historical landscape spatial features. Technical methodologies for investigating spatial characteristics at each level are summarized, providing foundational technical support for similar studies.

3. Results

3.1. Settlement Level

In point cloud filtering, the Cloth Simulation Filter (CSF) demonstrates high accuracy. This study uses the point cloud data of Fangzhou Ancient City as an example and applies a modified CSF in CloudCompare software to extract building surfaces. The complete workflow is as follows: set the cloth resolution, project cloth particles, and level the point cloud. During projection, the nearest point cloud point corresponding to each cloth particle is identified and denoted as point P. The pre-projection height HP represents the lowest position to which the cloth particle can descend. The real-time height of moving particles is denoted as H. After iteratively calculating H and HP, if HHP, the particle returns to position P and is set as immovable. The height difference between point cloud points and particles is calculated: if smaller than the threshold Hth (0.5 m), the point is classified as a building point; otherwise, it is classified as a non-building point.
Testing parameters include a grid resolution of 2 m, maximum iterations of 500, and a threshold of 0.5 m. This method generates current ground surfaces by refitting ground-based point clouds, effectively excluding building interference compared to traditional remote sensing-derived elevation data, resulting in current DSM data (Figure 7). The approach enables more scientific and comprehensive extraction of topographic environmental features in Fangzhou Ancient City, significantly enhancing the reliability of analytical result interpretations.

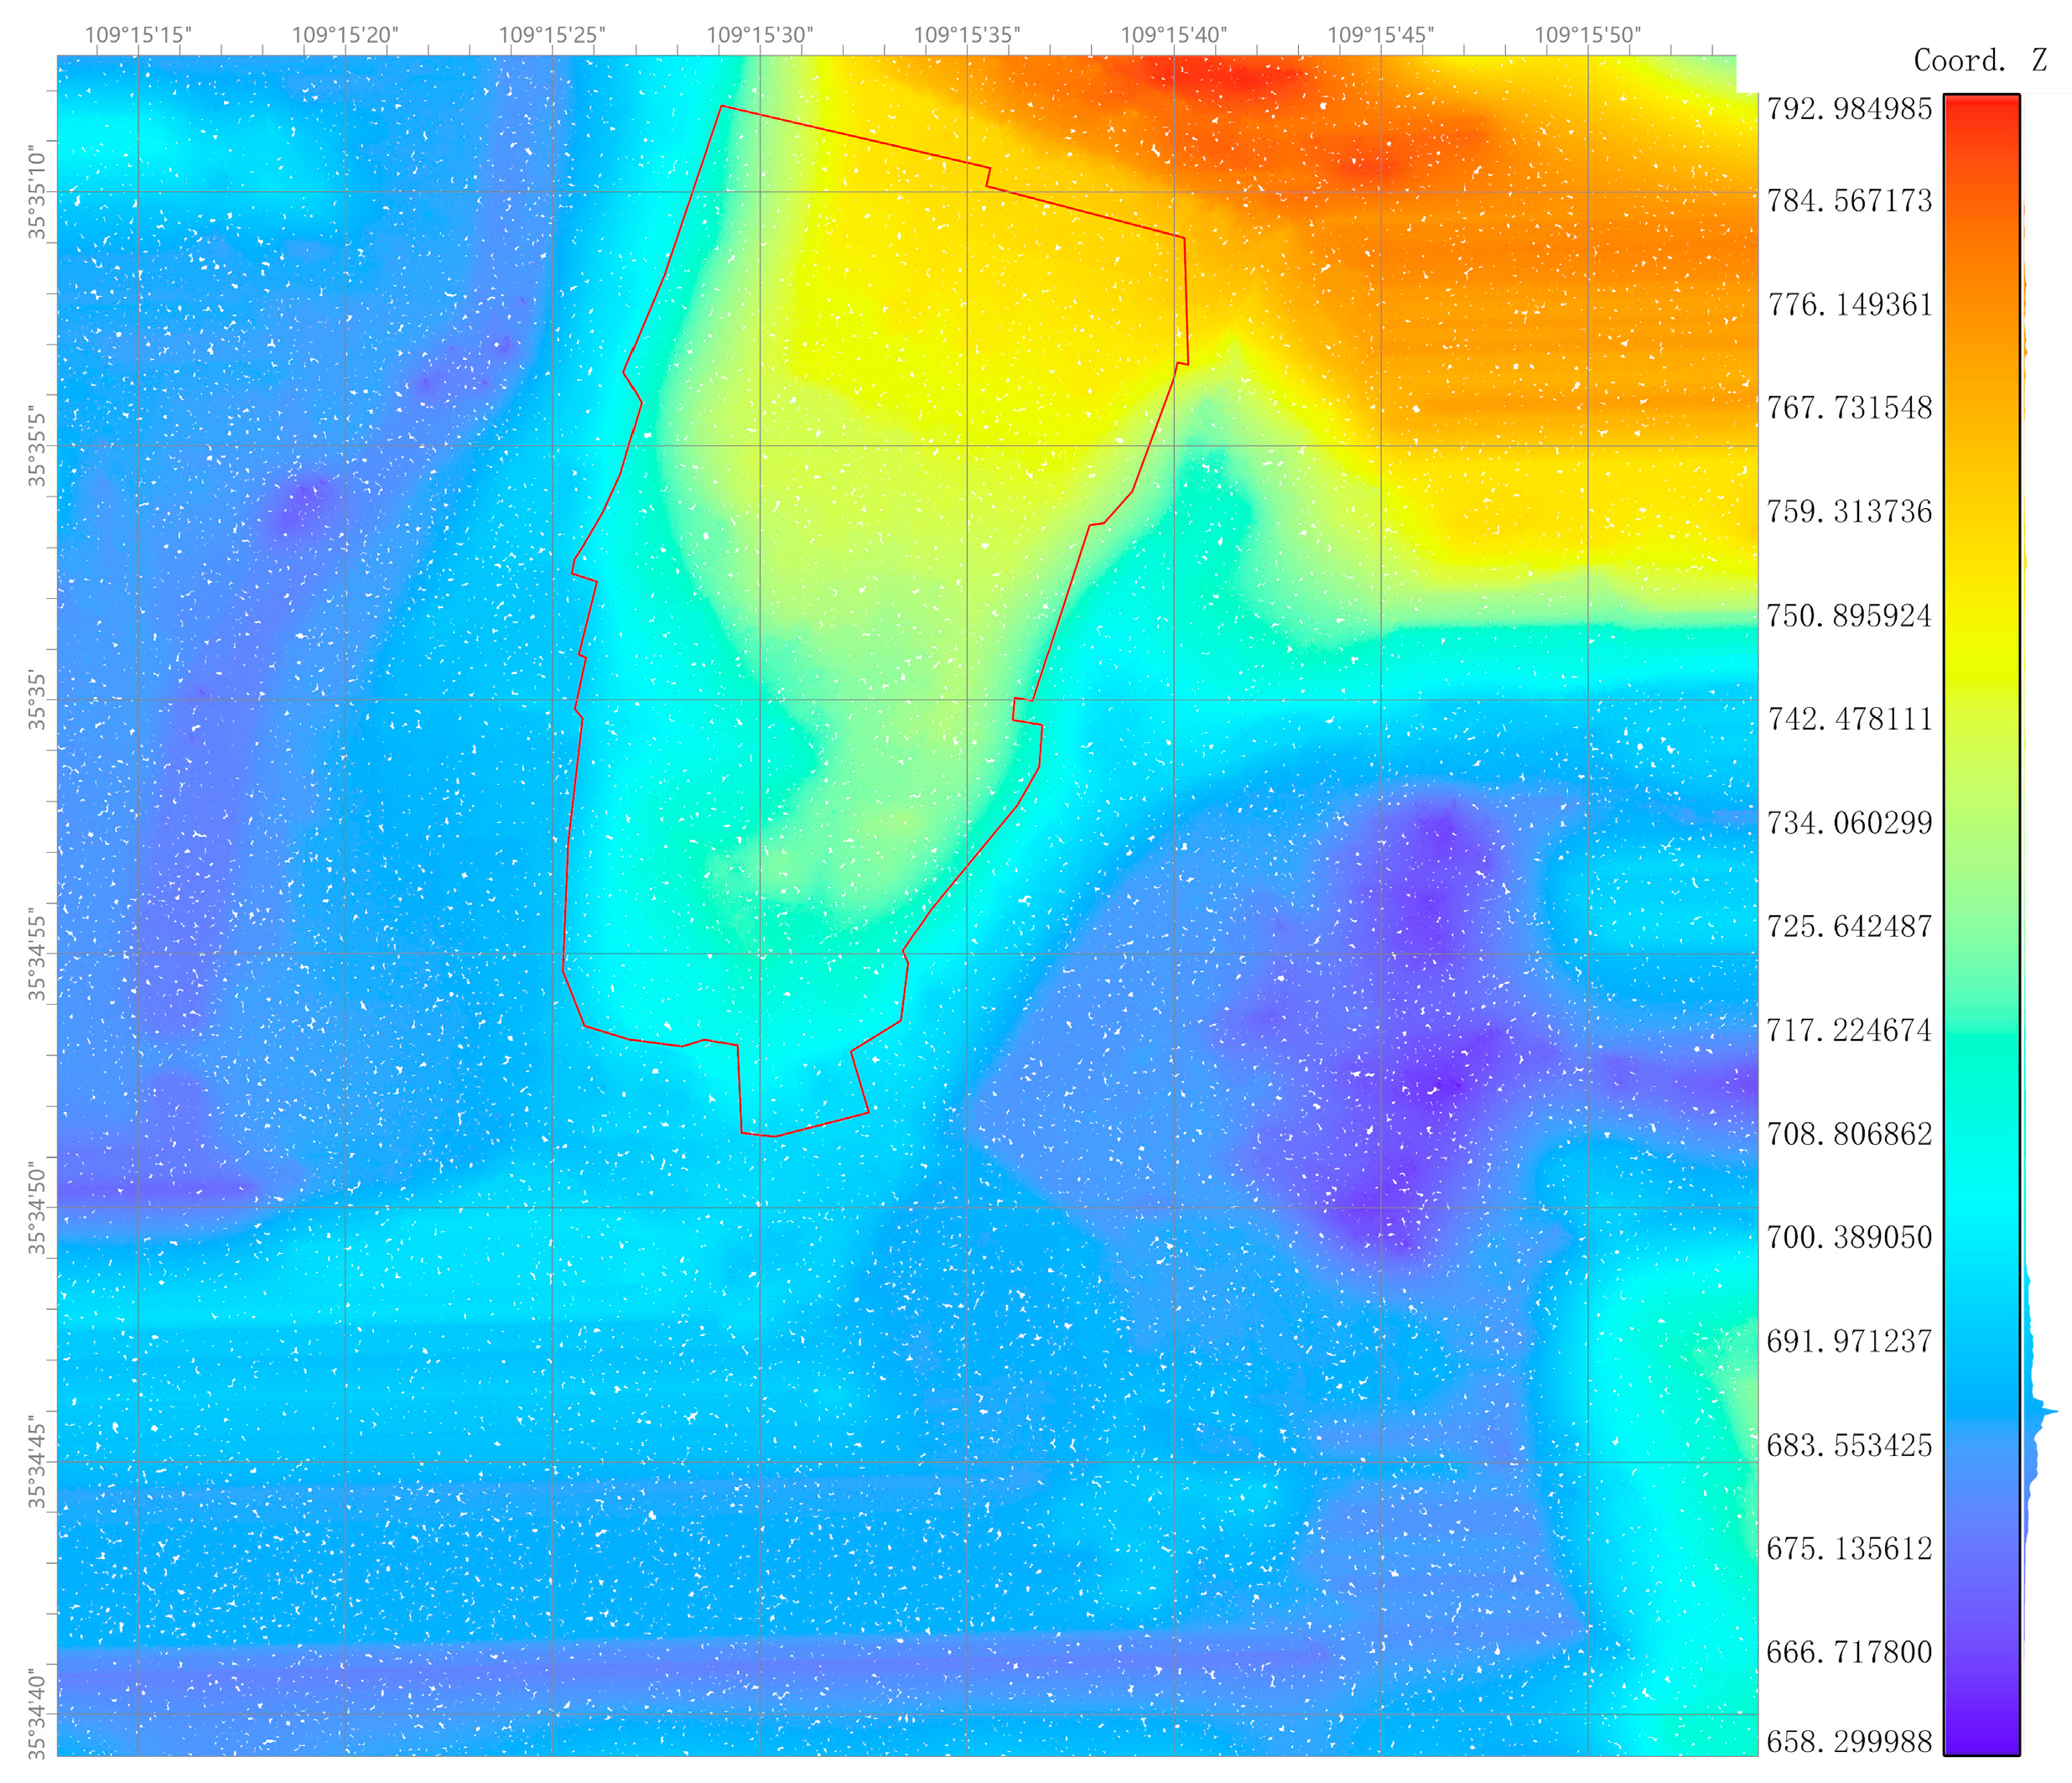
3.1.1. Characterization of Hill Settlements

This study quantitatively analyzes the elevation coordination between buildings and terrain in Fangzhou Ancient City. Due to elevation variations and insufficient prior analysis of building distribution patterns, we first processed the classified building roof point clouds through planar fitting in CloudCompare, generating standardized datasets via regularized sampling. The processed roof point clouds and DEM data were then imported into a GIS platform for spatial overlay analysis using 2 m interval contours. Results demonstrate significant alignment between building roof elevation trends and terrain undulation patterns (Figure 8a).
By converting both datasets into raster formats, we calculated elevation residuals (ΔH = roof elevation − terrain elevation). The residual histogram (Figure 8b) approximates a normal distribution (mean: 13.12 m, SD: 12.89 m), indicating prevalent roof elevations above topographic baselines. Notably, 68.3% of residuals cluster within −20 to +20 m, while 15.2% exhibit substantial positive deviations (>+20 m), peaking at +49.9 m in western slope areas. This reveals anomalous elevation increases in modern constructions, contrasting sharply with historical buildings’ modest residuals (mean: +5.8 m).
The excessive elevation of new buildings conflicts with the hillside’s historical landscape characteristics.

3.1.2. Characterization of Distribution Environment
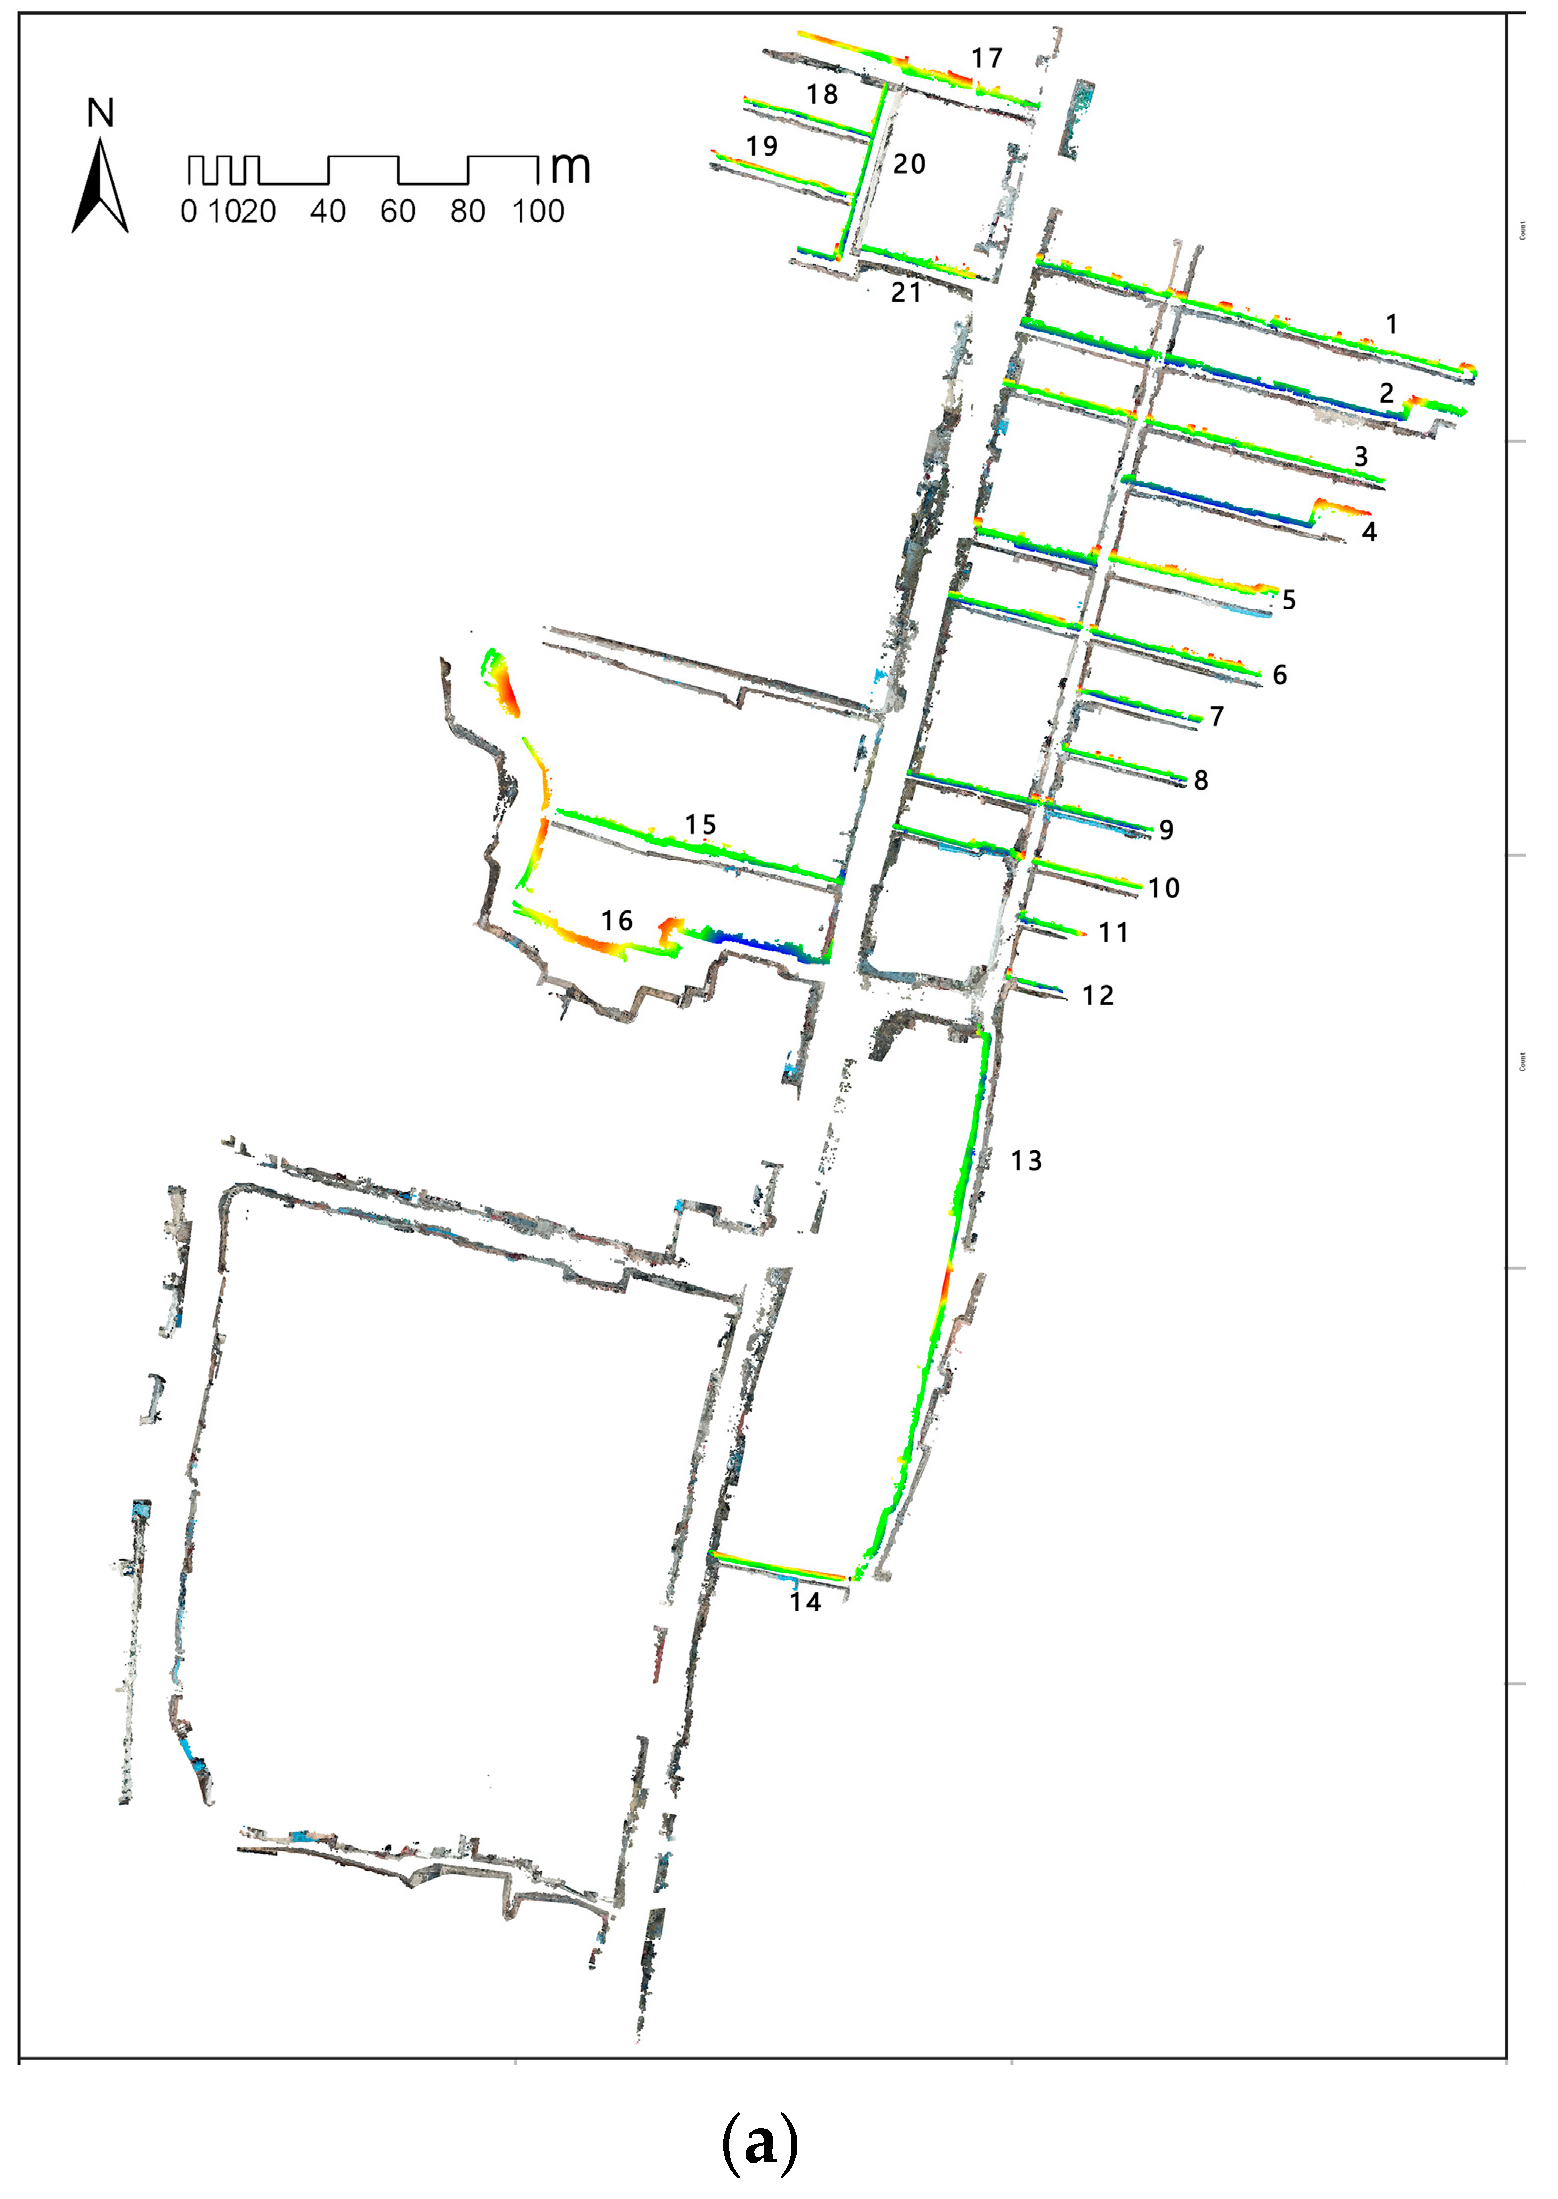
Fangzhou Ancient City is primarily distributed at the base of Qiaoshan Mountain near the Huangdi Mausoleum, utilizing distant mountain vistas to reinforce its central axis. Drawing on the historical routes for mausoleum visitation and ancestral worship in Fangzhou Ancient City, as well as the integrated spatial texture of Loess Plateau–city–water unique to Huangling County, cross-sectional analysis of point cloud data was conducted. By comparatively examining topographic and architectural layers, slope gradients across distinct plots were studied. Geometric analysis of cross-sectional point cloud distances enabled precise slope value calculations.
This study confirms that the unique terrace texture in the gully area of the Loess Plateau is not only the material carrier of the spatial characteristics of Huangling city, but also an important spatial representation of the historical wisdom of urbanization. The weakening of modern construction behavior to adapt to the terrain has led to a break in the loess–city perspective, which is in significant conflict with the spatial philosophy of making the best use of the situation in the traditional concept of urban planning. It is recommended to strengthen the principle of terrain adaptation in the subsequent conservation planning, so as to restore the visual order of loess–urban silhouette.
This study selects settlement cross-sections from three areas (Figure 9) for comparative analysis. The historical architectural clusters exhibit significant topographic adaptation characteristics, predominantly distributed in gently sloped plateau regions (5–15°), forming stepped cascading layouts. Their spatial organization logic demonstrates organic integration with the Loess Plateau’s ridge-gully geomorphology.
In contrast, modern buildings display de-terrainization trends, with construction activities persisting on steep slopes (15–25°). These developments feature increased building density and vertical expansions beyond traditional height limits, resulting in fragmented plateau landscape continuity.
From visual connectivity analysis, the 86 m vertical corridor spanning the Ju River Valley to the plateau summit—a critical interface for perceiving the “city-adapted-to-plateau” (城依塬势) spatial narrative—has been disrupted by unregulated heights of modern buildings. This has severed traditional visual axes, significantly weakening the visual linkage between the plateau and urban areas.
The research confirms that the unique plateau texture of the Loess Plateau gully regions serves not only as the physical carrier of Huangling’s urban spatial identity but also as a spatial manifestation of historical city-building wisdom. Modern construction’s weakened terrain adaptation has fractured the plateau–city visual connectivity, conflicting with the traditional planning philosophy of terrain-responsive design.

3.2. Street Level

3.2.1. Street Spatial Connections

Initially, road surface point clusters are precisely extracted from the dense 3D point cloud data of Fangzhou Ancient Town. Through 2D polygon fitting operations on road boundary points under a maximum computational edge length constraint of 0.5 m, a high-precision polyline boundary model [27] is generated, thereby establishing a three-dimensional street network topological framework.
Subsequently, AutoCAD 2022 is employed to perform medial axis fitting on road-edge polylines, followed by appropriate segmentation and simplification of the derived axes to generate vectorized street network data that accurately reflects real-world spatial configurations.
Ultimately, the simplified axial data is imported into Depthmap for quantitative analysis of network permeability, accessibility, and hierarchical relationships. This is achieved through computation of three core spatial configuration parameters: integration, choice, and connectivity. Integration quantifies global accessibility, where high-value zones correspond to spatial hubs exhibiting significant pedestrian aggregation potential. Choice measures path-crossing likelihood by calculating specific streets’ traversal frequency in global shortest paths. Connectivity evaluates spatial topological correlation intensity, with elevated values indicating increased interface interactions with adjacent spaces, thereby enhancing topological efficiency as circulation corridors (Figure 10).
  • Integration
In Figure 11, streets such as Xuanyuan Street, Zhongshan Back Street, and Houhu Lane appear in red or warm tones, indicating the highest integration values. These streets serve as the ancient city’s arterial roads, connecting key nodes and forming the spatial network’s skeleton. Xuanyuan Street’s high integration reflects its pivotal role in transportation, commerce, and cultural exchange, while Zhongshan Back Street’s elevated accessibility stems from its proximity to dense building clusters or intersections.
Streets like Gongsun Road, Zhongcheng Lane, and Nanshuncheng Lane (displayed in green or yellow) belong to moderate integration levels. Functioning as secondary arterials, they link high-integration main roads with low-integration branches, balancing transit and local service roles. Blue-colored streets (e.g., some branch lanes) exhibit the lowest integration, representing dead-end roads or enclosed blocks. These areas demonstrate poor spatial accessibility and low activity density, corresponding to internal residential alleys.
2.
Choice
High-choice streets typically function as high-traffic mediating corridors, serving as critical connectors between distinct zones. In Figure 12, the street network characteristics of Fangzhou Ancient City are visualized through a blue–red gradient. Arterial roads such as Zhongcheng Lane and Zhongshan Back Street appear in red or orange–red, indicating the highest choice values. These streets form the skeletal framework of the ancient city’s spatial system, responsible for primary traffic organization and spatial connectivity.
Medium-choice streets (e.g., Lanes 1–4, Nanshuncheng Lane), displayed in green, constitute a secondary network. Low-choice routes like Houhu Lane and Gongsun Road appear in blue, primarily serving localized areas. The choice distribution reveals a typical core-periphery structure: high-choice arterials form a cruciform skeleton, medium-choice streets radiate outward, and low-choice branches fill network peripheries.
This hierarchical choice distribution fundamentally reflects the power dynamics and spatial narratives of ancestral ritual practices. In future urban renewal initiatives, strict controls on commercial development should be imposed for high-choice streets (e.g., Xuanyuan Street) to preserve their role as ceremonial pathways. For low-choice alleys, archaeological investigations should uncover latent historical information tied to ritual culture. Micro-interventions—such as bluestone paving and ritual totem reliefs—can enhance their cultural landmark significance.
3.
Connectivity
A street with higher connectivity intersects with more adjacent spaces, offering greater accessibility as a transit route. High-connectivity streets often overlap with historical administrative and commercial centers. In Figure 13, Xuanyuan Street—a historical official thoroughfare—features dense intersections and wide cross-sections, evolved to efficiently manage pedestrian flow between adjacent government offices and markets. However, such arterials face dual pressures of congestion and historical character degradation due to excessive modern traffic loads.
Low-connectivity streets (blue zones), including sections of Houhu Lane and the western segment of Nanshuncheng Lane, are predominantly short branches or dead-end roads connected to only 1–2 streets, primarily serving internal residential access. The poor connectivity and accessibility of residential lanes like Houhu Lane hinder commercial service provision, forcing residents to rely on arterials for daily needs and exacerbating their burden. Additionally, some dead-end roads suffer from inadequate fire lanes and aging infrastructure.
The street network exhibits a polarized arterial overload–branch underutilization pattern. Medium-low connectivity streets (e.g., Gongsun Road) fail to effectively divert arterial traffic, resulting in insufficient network redundancy and reduced systemic resilience.

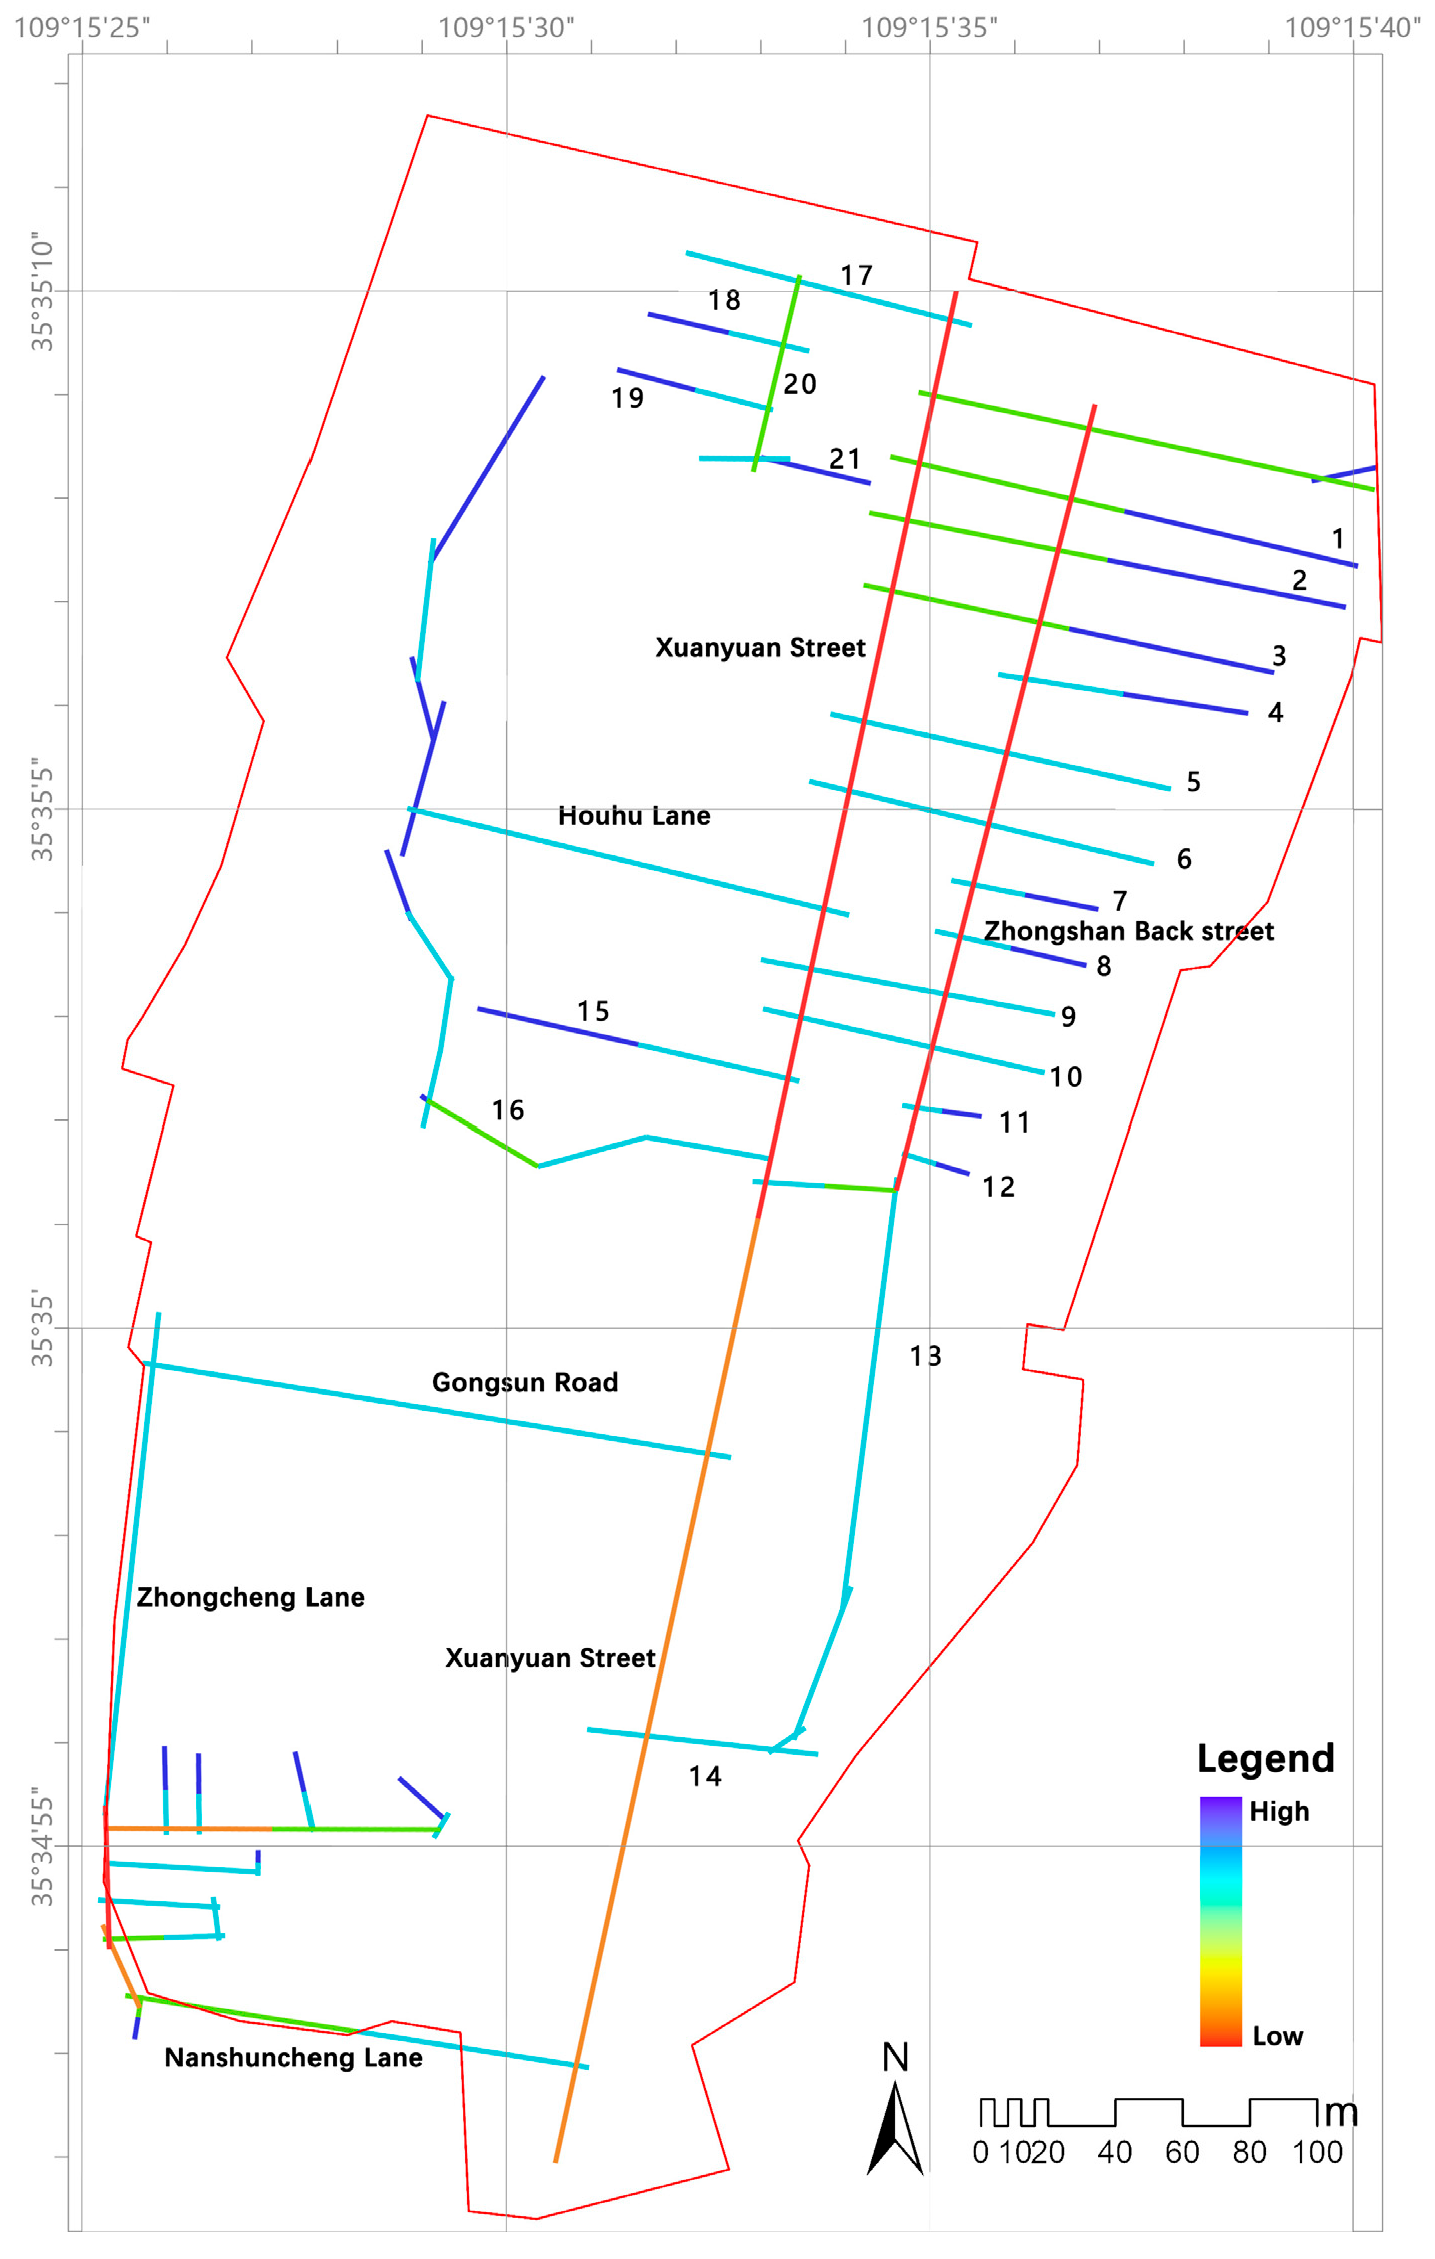
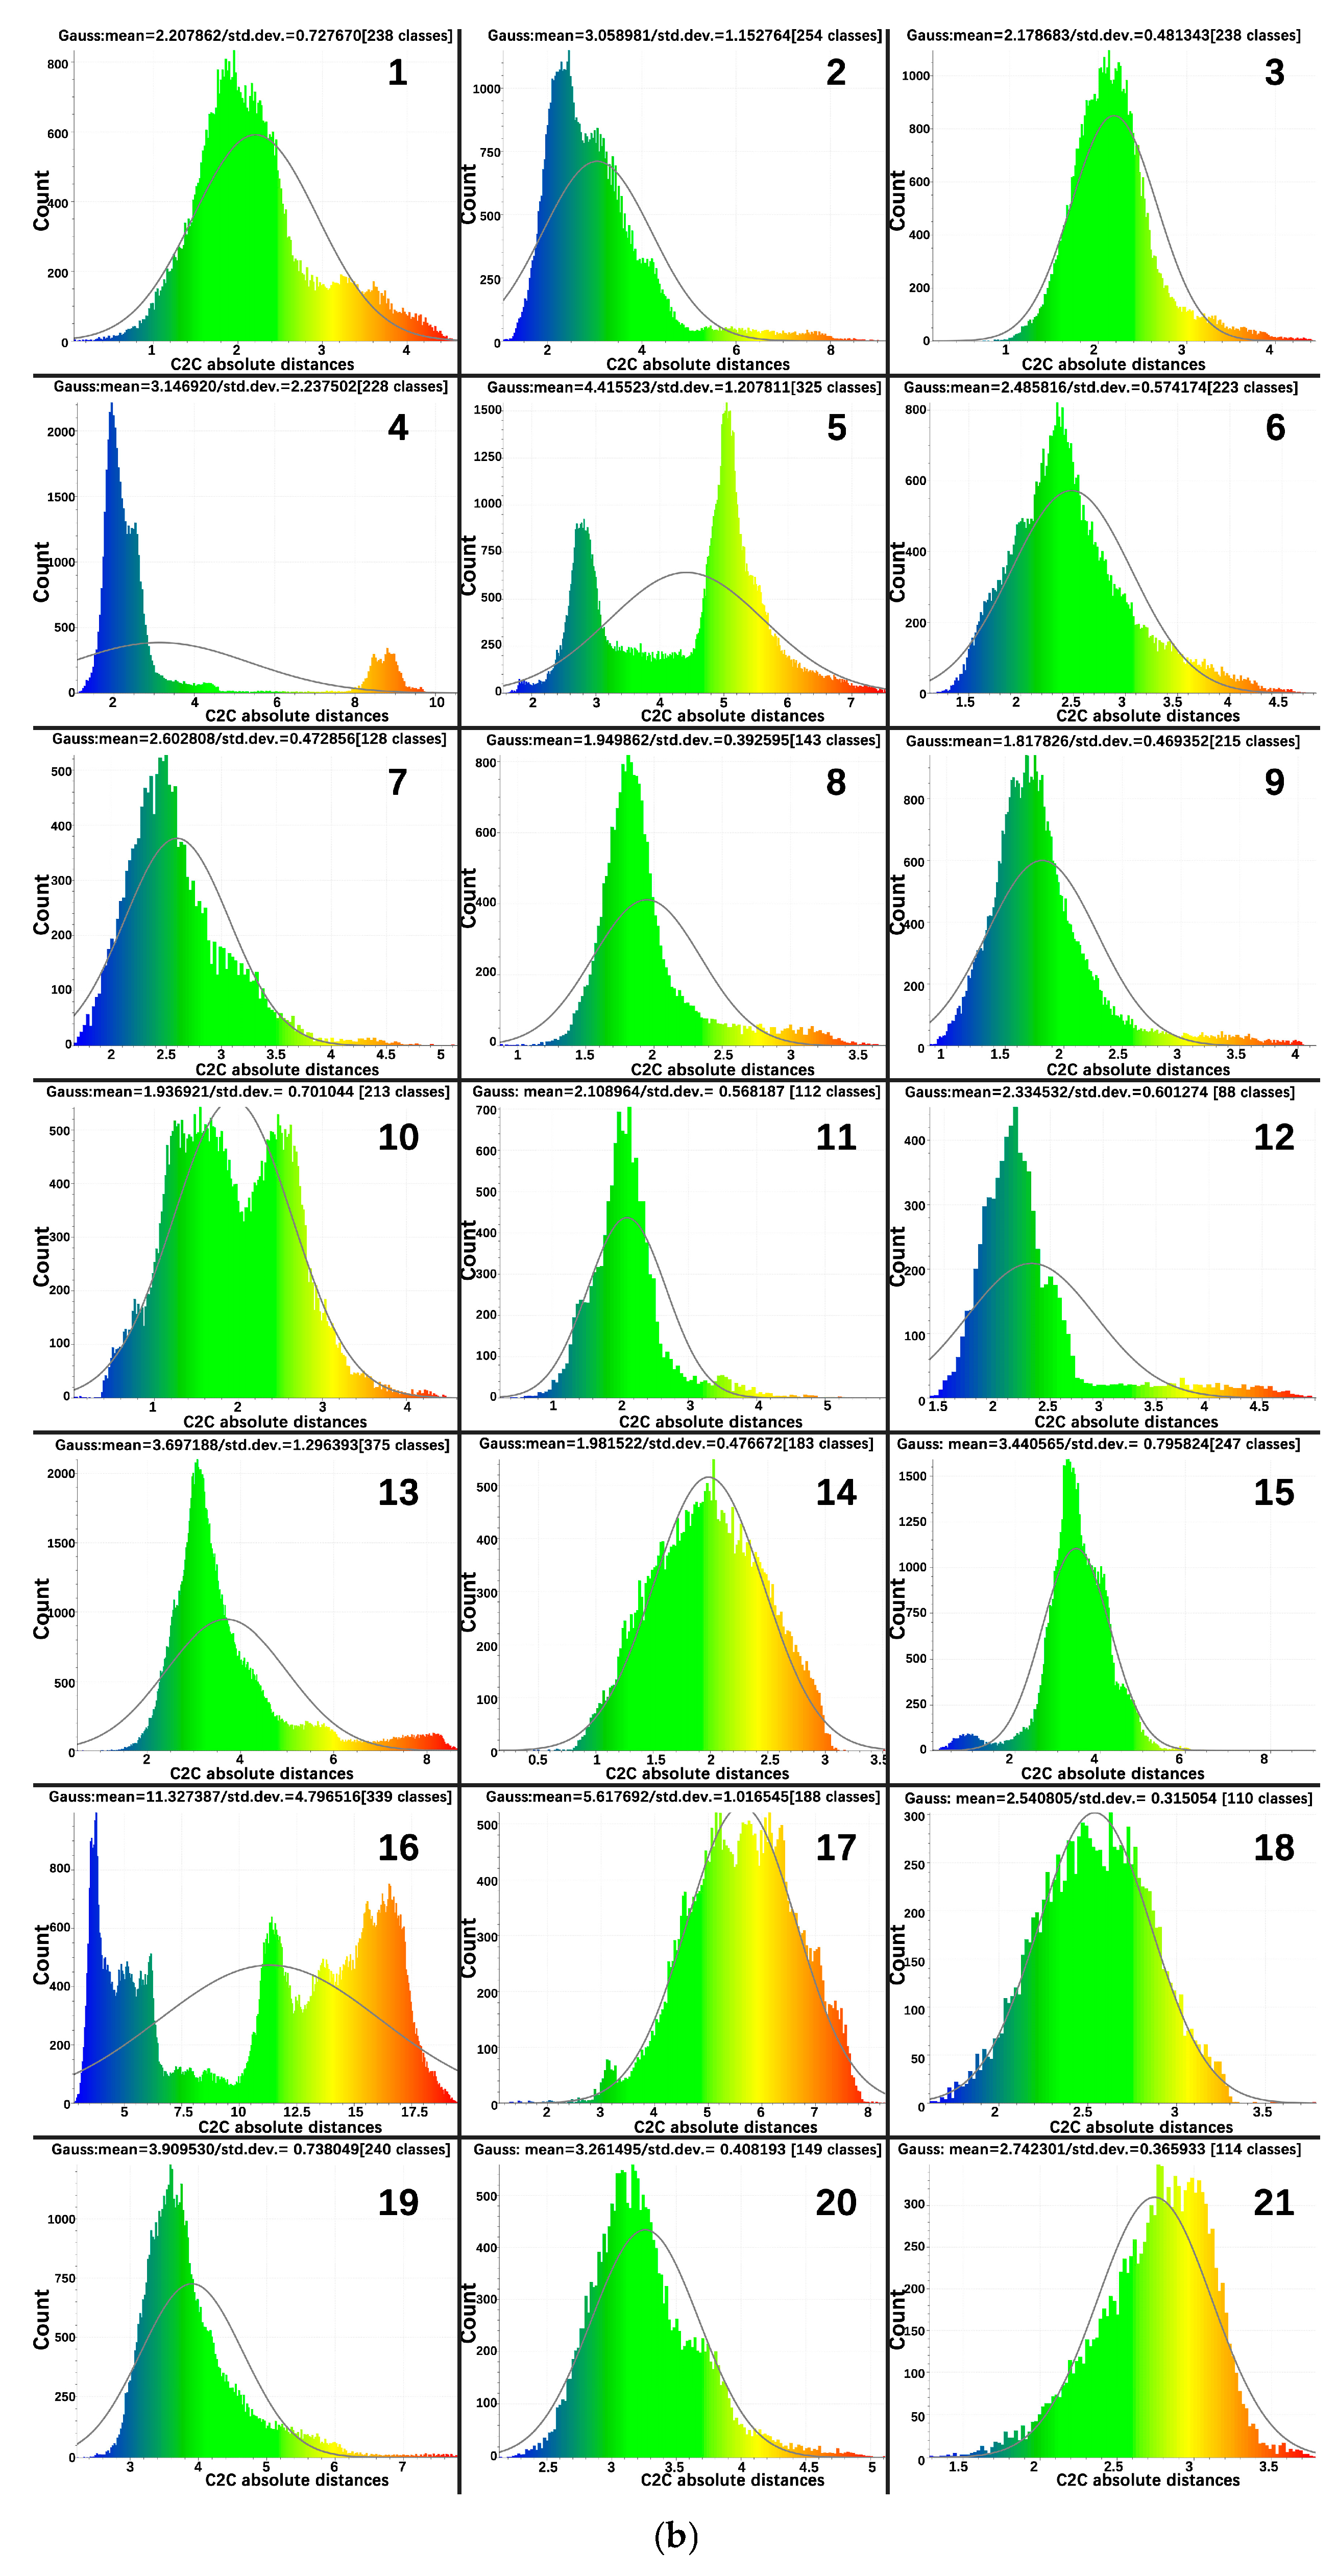
3.2.2. Proportion of Street Space

The street system of Fangzhou Ancient City exemplifies traditional mountainous settlement planning wisdom. The city’s core axis, centered on the north–south oriented Xuanyuan Street, follows natural slopes to form a tiered mountain-adaptive, terrace-constructed three-dimensional traffic network. This hierarchical structure prioritizes primary and secondary routes: Xuanyuan Street, as the primary axis, connects east–west secondary lanes in a fishbone-shaped traffic system. Six historically preserved streets remain verifiable and intact: Xuanyuan Street, Zhongshan Back Street, Zhongcheng Street, Gongsun Street, Houhu Lane, and Nanshuncheng City Lane (Figure 14a). Other streets were constructed during later urban expansion (Figure 15a). Semi-automatic object classification of 3D point cloud data enables extraction of street façade point clouds along ancient streets, facilitating automated street width calculation and spatial quantification.
Quantitative analysis of point cloud data reveals historical streets (Figure 14b) are generally wider than modern counterparts (Figure 15b). The primary axis Xuanyuan Street averages 11.5 m in width, while secondary arterials like Gongsun Road and Zhongcheng Lane exceed 10 m. Such expansive dimensions align with ancient urban planning principles: Xuanyuan Street linked upper and lower city districts as part of ritual processional routes, embodying hierarchical order and solemnity. Streets like Zhongshan Back Street, Houhu Lane, and Nanshuncheng Lane (average width > 4 m) accommodated mixed functions, connecting residences, workshops, and markets while allowing pedestrian flow, goods transport, and vendor space.
In contrast, 71.4% of 21 modern streets (15 lanes) measure 1–3 m wide, with only 6 lanes reaching 3–5 m (Figure 15b). This “miniaturization” reflects typical contradictions in modern urban development: peripheral historic districts are intensively developed, compressing alley widths for land efficiency. Modern streets primarily serve pedestrians, non-motorized vehicles, and compact cars, eliminating traditional carriageway redundancies. Most function as residential access or emergency lanes, lacking historical streets’ multifunctional roles (e.g., markets, public gatherings).
The “broad scale” of historical streets originated from systematic integration of political, economic, and social functions, while modern “narrow lanes” prioritize spatial efficiency amid rapid urbanization. This contrast underscores the need to balance heritage conservation with contemporary demands in urban renewal; for instance, revitalizing narrow lanes through micro-renewal strategies or adopting historical streets’ multidimensional spatial logic to prevent modern streets from becoming purely utilitarian spatial deserts.

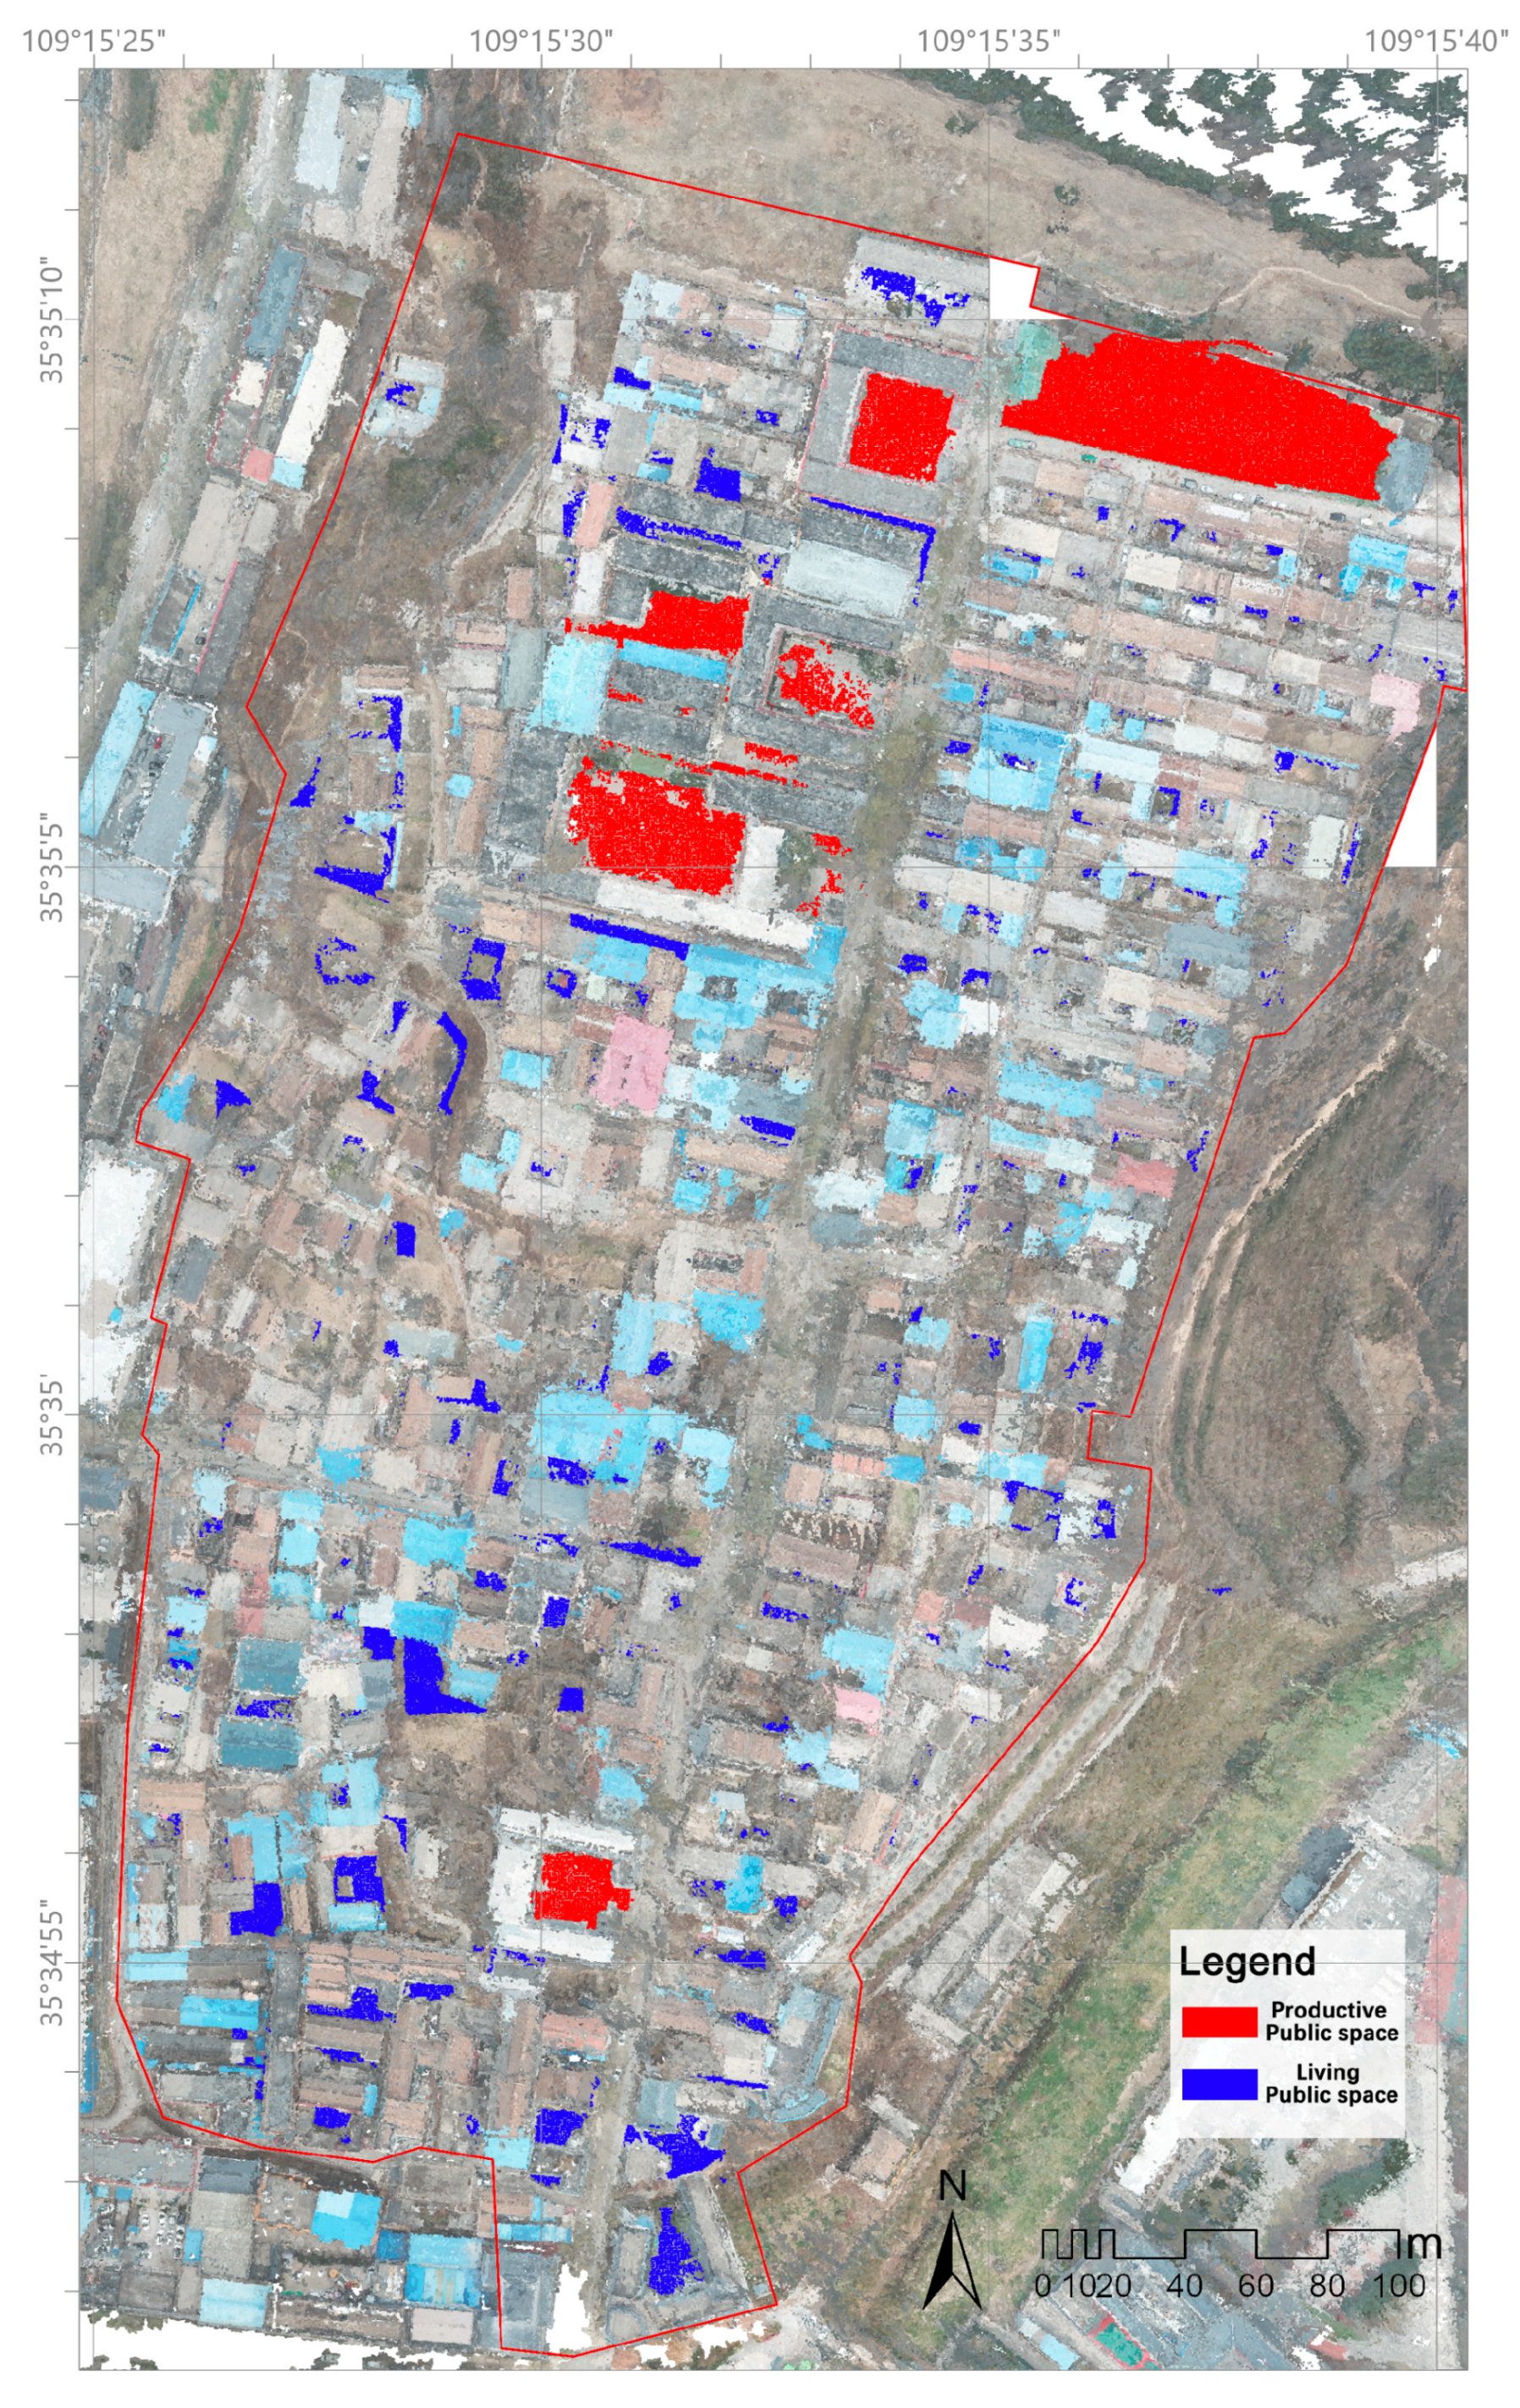
3.2.3. Distribution of Public Space

Through the extraction of ground surfaces (impervious pavement) in point cloud classification, the current distribution of public spaces in the settlement can be mapped (Figure 16). Public spaces in Fangzhou Ancient City exhibit distinct functional differentiation. Living-oriented public spaces (blue areas), accounting for 64.722%, suffer from severely insufficient open spaces for residents’ daily leisure and recreation. These spaces predominantly consist of scattered private courtyards, lacking centralized plazas, parks, or community activity venues, thus failing to support group activities like festivals or children’s play. This results in inward-oriented public life and weakened community cohesion. Productive public spaces (red areas, 35.278%) are concentrated within government institutions (e.g., administrative buildings, cultural centers) and school campuses, primarily serving administrative and educational functions with limited accessibility and public engagement. The overall spatial pattern is characterized by fragmented living spaces and enclosed productive spaces.

3.3. Building Level

In most traditional villages, inadequate regulation of new constructions has resulted in intermingled historic and modern buildings, complicating the delineation of historical landscape zones. Through field surveys and aerial panoramic imagery analysis, historical buildings in Fangzhou Ancient City were identified and categorized into two types (Figure 17). Traditional buildings with gable roofs were segmented from the point cloud data, enabling comparative analysis of traditional and modern architectural features.

3.3.1. Characterization of Building Morphology

By separating traditional and modern buildings in the point cloud data of Fangzhou Ancient City, we conducted statistical analysis on the vertical distribution of building points relative to the ground for height comparison and calculated roof slopes for morphological comparison.
The slope distribution plots of historical buildings (Figure 18b) and modern buildings (Figure 18c) show that the average roof slope of historical buildings is 0.298, while that of modern buildings is 0.294. Although the numerical difference is small, their distribution characteristics differ significantly. The slope peaks of modern buildings are distinctly shifted leftward (toward gentler angles), and their overall slope ranges are narrower than those of historical buildings, indicating a general trend toward flatter roof designs in modern architecture. The city-wide slope distribution map (Figure 18a) further confirms this divergence: newly constructed buildings in the northeastern and southwestern sectors exhibit smaller slopes, forming a sharp contrast with the slope distribution of historical buildings and disrupting the visual coherence of traditional architectural clusters.
The most prominent conflict lies in the stylistic disjunction between old and new buildings. While historical buildings predominantly retain traditional pitched roof forms, the flattened roofs and low slopes of modern constructions (particularly in the northeastern and southwestern sectors) break the original spatial rhythm of the ancient city. This disparity not only weakens the historical–cultural identity of the ancient city but also risks diminishing its overall landscape value due to modern buildings’ lack of regional distinctiveness. Additionally, the higher standard deviation in modern building slopes reflects inconsistent design controls, exacerbating stylistic chaos.
Future planning should strengthen gradient management of slope controls: core conservation zones must strictly adhere to traditional slope ranges, while new construction areas should adjust slope means toward the 0.29–0.30 range and control dispersion to balance functional adaptability and stylistic continuity. Simultaneously, traditional roof morphology could be replicated using modern materials to harmonize technological innovation with heritage preservation.
After separating historical and modern building point clouds, statistical analysis of vertical heights relative to the ground reveals distinct patterns. Historical building heights (Figure 19b) cluster around 2.82 m (standard deviation: 1.73), consistent with traditional single-story dwellings. In contrast, modern buildings average 4.76 m (standard deviation: 4.34)—equivalent to two-story structures—with extremely high data dispersion (standard deviation 2.5× greater than historical buildings), indicating significant height disparities ranging from low bungalows to multi-story complexes (Figure 19c).
The building height distribution map (Figure 19a) confirms this contradiction: architectural heights are highly heterogeneous across the ancient city, with modern buildings in color-contrasted zones drastically exceeding traditional scales, creating visually intrusive focal points. The most critical conflict lies in the dimensional rupture between historical fabric and modern additions. Preserved historical clusters maintain a homogeneous low skyline with rhythmic continuity, while interspersed modern buildings (particularly those averaging 4.76 m, i.e., two or more stories) dominate spatially through vertical prominence, disrupting the original horizontal continuity.

3.3.2. Traditional Building Zoning Control Analysis

Fangzhou Ancient City is an integral component of the Mausoleum of the Yellow Emperor (Huangdi Ling), inextricably linked to its tomb-guarding culture, which forms a critical part of the mausoleum’s ancestral worship traditions. In accordance with the Huangling County Territorial Space Master Plan (2021–2035) [40], the Standard of conservation planning for historic city (1 April 2019) [41], and the Standard for the Planning of Scenic and Historic Areas (1 January 2000) [42], the conservation scope of Fangzhou Ancient City is delineated into two tiers: construction control zones and landscape coordination zones. The construction control zones encompass areas within 20 m on both sides of Xuanyuan Street, while the landscape coordination zones cover areas east of Xuanyuan Street.
Building upon this foundation, the point cloud analysis software was employed to calculate point-to-point distances between the two architectural categories and the Xuanyuan Main Street point cloud layers. The default method for computing distances between two point clouds is the nearest neighbor distance: for each point in the comparison cloud, CloudCompare identifies the closest point in the reference cloud and computes their Euclidean distance. However, when the reference cloud exhibits insufficient density, the nearest neighbor distance may demonstrate limited precision. To mitigate this limitation, CloudCompare offers an intermediate approach that improves accuracy through local surface modeling, which involves constructing a local geometric model around the nearest point to approximate the actual reference surface, thereby achieving enhanced estimation of true distances. Consequently, this study adopted the local surface modeling method for computing point cloud distances between historical and modern buildings. Specifically, a least squares best-fit plane model was implemented for distance statistics, generating a distance heatmap (Figure 20) that visualizes spatial proximity relationships between historical and contemporary structures. Ultimately, by calibrating the color threshold range of the heatmap, the influence boundaries and spatial extent of historical buildings were delineated, serving as a scientific basis for defining core zones of historic landscape preservation.

4. Discussion

The study reveals that the historical architectural complexes of Fangzhou Ancient City are predominantly distributed on gentle slopes of Loess Plateau ridges (slope angles 5–15°), embodying the typical topography-adaptive construction philosophy. An organic coupling exists between building elevations and topographic relief, with the residual mean of roof heights approximately +13.12 m, corresponding to the Loess Plateau landform variations. This discovery aligns closely with the landscape approach advocated by UNESCO, as the historic urban landscape recommends considering terrain, hydrology, and spatial morphology within broader urban contexts [32,43]. Domestic and international studies demonstrate that historical urban areas often exhibit spatially coherent patterns, necessitating enhanced emphasis on revealing and preserving landscape skeleton characteristics during urban heritage conservation. For instance, research on Chiang Mai Old City in Thailand indicates that mid-rise new constructions along primary visual corridors severely impact mountain sightlines, requiring stringent height controls and view corridor protections [44]. Xi’an Ancient City studies employing aerial photogrammetry and GIS technology identified dominant historical landscape patterns including geomantic topography, water system orientations, and community heritage, which show high consistency with extant layouts, revealing the stratigraphic preservation principles of historical landscapes [45]. The unique spatial coupling pattern of mausoleum–city–mountain–water in Fangzhou Ancient City remains rare among World Heritage sites. This symbiotic mausoleum–city morphology not only enriches the historical value of the ancient city but also provides valuable case studies for landscape conservation under the HUL perspective. Our findings suggest that in the unique Loess Plateau environment, conservation planning should emphasize topographic compatibility, implement building height controls in subsequent developments, and restore the traditional visual order of plateau-supported city silhouette.
The historical main street (Xuanyuan Street) in Fangzhou Ancient City exhibits significantly greater width compared to the narrow alleyways in modern developed areas. Statistical analysis reveals that historical streets have an average width of approximately 11.5 m, whereas 71.4% of modern streets and lanes measure less than 3 m in width. This phenomenon aligns with urban morphological patterns observed in scholarly research: historical commercial districts typically feature wider arterial roads, while peripheral residential areas adopt compact layouts. For instance, Shehata (2022) highlights that medieval Arab urban centers often maintained broad streets in market zones, contrasting sharply with surrounding narrow alleys [46]. Spatial syntax analysis further demonstrates that Xuanyuan Street ranks highest in both global integration and selectivity metrics, confirming its critical role as the ancient city’s main axis. This finding corresponds with discoveries in other heritage cities: research in Safranbolu, Türkiye, revealed that streets with the highest global integration values typically serve as primary corridors for pedestrian flow and cultural activities [47]. These results indicate a coherent relationship between street hierarchy and ancient functional zoning in Fangzhou Ancient City. In contrast, the excessive “miniaturization” of newly developed urban blocks reflects a globalized modernization trend where historical district spatial roles are increasingly marginalized. Future studies could incorporate three-dimensional spatial syntax techniques, integrating elevation factors to more precisely quantify the characteristics of three-dimensional spatial networks.
Analysis of building volumes and roof morphology reveals that modern constructions significantly exceed traditional scales in both height and form: modern buildings exhibit an average height of approximately 4.76 m, markedly surpassing that of historical structures, while increased dispersion in roof slopes has led to fragmented visual coherence. The visual clash between historic and contemporary architectural clusters intensifies the urgency for preserving historical fabric. This issue has garnered significant attention in international conservation practices. UNESCO’s historic urban landscape (HUL) approach emphasizes maintaining the integrity and continuity of urban historic areas, while empirical studies demonstrate that mid-rise modern buildings are often identified as threats due to their disruption of sightlines and traditional skylines. For example, analysis around Chiang Mai’s city walls revealed that mid-rise constructions near visual corridors impair the visibility of historic landscapes, prompting recommendations for stricter height regulations [44]. Consequently, this study proposes integrating height and volume controls in Fangzhou Ancient City’s conservation framework, prioritizing restrictions in areas exceeding traditional scales to safeguard the visual order of historic urban silhouettes and landscape integrity.
In terms of technological applications, this study employs multi-view UAV imagery to generate high-density point clouds and integrates the RandLA-Net deep learning framework into the semantic classification workflow, achieving automatic segmentation of architectural, vegetation, and pavement elements with an overall classification accuracy of 86.93%. This approach significantly streamlines the workload of traditional manual classification while enhancing precision, aligning with the global trend of leveraging deep learning to improve 3D modeling and analysis in cultural heritage contexts. For instance, Matrone et al. developed a point cloud dataset tailored for heritage scenarios and emphasized the potential of deep learning in large-scale point cloud classification [48]. In Lyon, France, the 3D modeling of historic urban districts underscores the principle of preserving digital traces for heritage, positioning digital representations of urban spatial structures as decision-making references and communication tools [49]. The integration of point cloud technology with Building Information Modeling (BIM) has also gained international prominence. In a collaborative project between Autodesk and Brazil’s Ibirapuera Museum, laser-scanned buildings and surrounding parks were used to construct comprehensive BIM models for heritage conservation, operational management, and expansion planning [50]. Croce et al. proposed utilizing machine learning algorithms to semantically annotate architectural point clouds, generating Heritage Building Information Models (H-BIM) that combine pure geometric point clouds with semantic attributes for intelligent heritage management [51]. Furthermore, this study implements spatial syntax to achieve the transformation of 3D data into 2D topological representations, providing novel quantitative tools for HUL conservation. The application of digital technologies has also been recognized by academia: Ababneh et al. highlighted that 3D scanning and Virtual Reality (VR)/Augmented Reality (AR) methods can generate precise digital models of heritage scenarios to aid conservation and dissemination [52]. Aligning with this philosophy, our research establishes a new paradigm for multi-level analysis of historic urban landscapes through the deep fusion of point clouds and imagery, consistent with recent frameworks that evaluate heritage corridors using multi-source data and AI-driven semantic segmentation [53].

5. Conclusions

5.1. Key Research Findings

This study proposes and validates a quantitative analytical framework integrating UAV point clouds, deep learning, and spatial analysis for historic landscape assessment in Fangzhou Ancient City, located in the Loess Plateau gully region. The research systematically reveals multiple spatial characteristics of the ancient city:
  • Topographic adaptability: Historical architectural clusters were constructed on gentle slopes of Loess Plateau terraces, forming an organic coupling with undulating landforms, whereas modern buildings exhibit anomalous elevation increases on steep slopes, causing visual corridor ruptures between the plateau–city interface.
  • Street hierarchy: The main arterial road (e.g., Xuanyuan Street) demonstrates the greatest width and spatial integration values, highlighting its core function as a cultural axis, while newly constructed alleys are predominantly narrow, eroding the continuity of historic spatial patterns.
  • Morphological evolution: Modern buildings widely exceed traditional height limits, with diversified roof slopes exacerbating visual fragmentation and intensifying clashes between historic and contemporary architectural clusters.
  • Methodological innovation: By leveraging the RandLA-Net model and multi-spectral features, high-accuracy point cloud semantic segmentation (overall accuracy 86.93%) was achieved in complex historic urban environments, establishing a technical pathway for 3D extraction and 2D analysis of heritage spatial features. These findings comprehensively illustrate the spatial evolution of Fangzhou Ancient City under its mausoleum–city–mountain–water coupling pattern and provide quantitative foundations for planning decisions.

5.2. Theoretical and Practical Implications

This study emphasizes the holistic and multi-scale conservation of historic towns from the historic urban landscape (HUL) perspective, aligning closely with established conservation frameworks. UNESCO’s historic urban landscape approach advocates for safeguarding the integration of natural, social, cultural, and urban morphological systems [43]. Our empirical analysis of the intrinsic relationships between Fangzhou Ancient City’s architectural heritage, topography, street network layouts, and cultural functions substantiates this comprehensive perspective. Theoretically, we highlight the synergy between topographic adaptability and cultural continuity, integrating the traditional mausoleum–city symbiosis pattern into modern conservation frameworks, thereby enriching the theoretical dimensions of HUL [54].
Practically, the study proposes actionable conservation strategies, such as enforcing stricter controls in areas with elevation differentials exceeding 20 m and restoring the continuous width of primary street corridors. These recommendations resonate with the HUL principle of balancing preservation and development. Furthermore, the research demonstrates the potential of digital technologies in heritage conservation—precise quantification of historic spatial features through point cloud classification and spatial syntax provides data-driven decision-making tools for policymakers. This offers transferable insights for revitalizing similar historic settlements and advances heritage conservation practices in China’s Loess Plateau and other topographically complex regions.
Currently, the Huangling County Territorial Space Master Plan (2021–2035) [40] defines only rudimentary protection boundaries for Fangzhou Ancient City, lacking detailed analysis or measures for preserving its holistic spatial character. By systematically analyzing residual elevation differentials, street width distributions, spatial connectivity, and morphological contrasts between historic and modern buildings (e.g., height and slope variations), this study proposes science-based strategies: residual threshold controls (prioritizing monitoring in ΔH > +20 m zones) and slope gradient management (maintaining 5–15° slopes in core areas). These strategies provide a scientific foundation for refining conservation measures under the Huangling County Territorial Space Master Plan (2021–2035) [40]. Additionally, the developed point cloud classification framework (overall accuracy: 86.93%) can be directly applied to spatial diagnostics of analogous traditional settlements.

5.3. Methodological Limitations

While this study achieved meaningful results, several limitations warrant acknowledgment:
Point Cloud Classification Constraints: The application of RandLA-Net, though effective, represents a preliminary attempt. Despite achieving high classification accuracy (86.93%), challenges persist in scenarios with vegetation occlusion, leading to misclassification errors. Future studies could refine network architectures or leverage larger sample datasets to enhance semantic segmentation accuracy and detail recognition capabilities [55,56], thereby improving classification precision, reducing vegetation-induced errors, and enabling finer distinctions between land cover types and material properties.
Data Resolution Limitations: The point cloud data, constrained by UAV imaging resolution, failed to achieve 3D modeling analysis of architectural details or courtyard-scale features. Resolution limitations directly impact the refinement of oblique photogrammetry models, particularly in densely vegetated areas where UAV systems struggle to capture complete surface information, resulting in significant point cloud gaps. Integrating high-resolution LiDAR or terrestrial laser scanning could enhance data completeness and support fine-grained modeling of courtyard spaces.
Spatial Syntax Dimensionality: While the automated extraction of road centerlines from point clouds simplified traditional spatial syntax workflows and improved data accuracy, the study was constrained by Depthmap’s limitation to 2D planar analysis. Road centerlines with elevation data were flattened during processing. Future work could extend Depthmap’s functionality through modular development to enable 3D spatial syntax analysis, integrating variables such as slope, visibility, and multi-dimensional topological coupling, thereby advancing 3D assessments of spatial integration, connectivity, and node values.
Temporal and Socio-Cultural Scope: The reliance on cross-sectional data from a single time point precludes longitudinal comparisons of landscape evolution. Additionally, the exclusion of socio-economic factors and community perceptions limits a holistic understanding of historical landscape dynamics.
Generalizability: As the study focuses on a specific Loess Plateau settlement type, the generalizability of findings requires further validation in diverse urban and geographical contexts.

5.4. Future Research Directions

Within China’s evolving framework for historic urban landscape conservation, policies and practices are undergoing progressive refinement. The State Council and cultural heritage authorities have issued multiple regulations and plans, such as the Regulations on the Protection of National Famous Historical and Cultural Cities, Towns, and Villages [57], institutionalizing conservation objectives. However, these policies predominantly focus on planning controls and aesthetic restoration, with limited systematic integration of digital technologies. Current conservation efforts in most historic urban areas still rely on 2D planning maps and traditional field surveys, while digital tools remain largely confined to museum exhibitions or static displays. Reports indicate that China’s cultural heritage digitization remains in its nascent stage, hindered by data silos, high costs, limited immersive experiences, and underdeveloped market mechanisms, all of which constrain deeper technological integration [58]. Although some cities have piloted 3D scanning and modeling, overall application levels lag behind international best practices. Leveraging UAV point cloud data offers a viable pathway for advancing digital conservation of urban historic landscapes. Future research should expand in the following directions.
First, deploying higher-resolution UAVs combined with handheld LiDAR devices (e.g., multi-source aerial surveys integrated with terrestrial laser scanning) could acquire richer point cloud data [59], addressing vegetation-induced data gaps and enhancing material classification capabilities (e.g., distinguishing traditional blue bricks from concrete). This would enable the construction of detailed vector-based 3D models to support precise analyses of building volumes, roof morphology, and courtyard spaces [60].
Second, establishing spatiotemporal models through regular UAV surveys could automate comparative analysis of key indicators (e.g., building height variations, visual corridor flux) and enable real-time alerts for anomalous changes. Time-series point cloud data would facilitate multi-temporal monitoring of historic urban areas, dynamically tracking shifts in architectural height and visual connectivity to support heritage change warnings and conservation efficacy assessments. This shift from experience-based judgment to data-driven precision management could catalyze intelligent upgrades in conservation practices [55].
Third, leveraging diverse point cloud processing platforms—each with distinct technical strengths—could optimize data utilization [61]. For instance, Context Capture outperforms PIX4D in UAV-based 3D reconstruction, generating vector models with superior completeness and geometric accuracy. Such tools could enable in-depth courtyard-scale studies, analyzing spatial forms and functions of individual buildings and traditional courtyards to decode the composition and evolution of historic urban fabrics.
Additionally, integrating generated 3D models into microclimate simulation software could combine AI with urban environmental analysis. Wind fields, thermal environments, solar exposure, drainage, and water catchment patterns [62] could be assessed to evaluate the environmental adaptability of traditional block layouts, uncovering climate-responsive wisdom in historic spatial designs and guiding low-impact development strategies.
Simultaneously, merging point cloud data with GIS and remote sensing platforms would enable comprehensive spatial evaluations [63]. A BIM-GIS integrated smart monitoring platform [62] could establish closed-loop workflows combining real-time UAV surveys with dynamic analysis, achieving intelligent, multi-dimensional management of historic urban spaces.
This study validates the feasibility of synergizing deep learning and oblique photogrammetry for historic landscape conservation. Future research should further explore interdisciplinary pathways between AI and heritage science, transforming conservation practices from passive restoration to proactive adaptive management. Advancing cross-disciplinary integration between AI and urban–rural heritage conservation could provide innovative methodological support for the dynamic preservation and sustainable development of historic urban landscapes.

Author Contributions

All authors contributed to the study’s conception and design. Material preparation, data collection, and analysis were performed by all authors. The first draft of the manuscript was written by J.W., and all authors commented on previous versions of the manuscript. All authors have read and agreed to the published version of the manuscript.

Funding

This research received no external funding.

Data Availability Statement

Research data required for scientific studies that comply with the laws and regulations of the People’s Republic of China can be obtained by contacting the corresponding author. Data will be provided upon approval.

Conflicts of Interest

The authors declare they have no relevant financial or non-financial interests to disclose.

References

  1. Farahani, L.M.; Setayesh, M.; Shokrollahi, L. Contextualizing Palimpsest of Collective Memory in an Urban Heritage Site: Case Study of Chahar Bagh, Shiraz—Iran. Archnet-IJAR 2015, 9, 218–231. [Google Scholar] [CrossRef]
  2. Khalaf, R.W. A Proposal to Apply the Historic Urban Landscape Approach to Reconstruction in the World Heritage Context. Hist. Env. Policy Pract. 2018, 9, 39–52. [Google Scholar] [CrossRef]
  3. Jiang, J.; Zhou, T.; Han, Y.; Ikebe, K. Urban Heritage Conservation and Modern Urban Development from the Perspective of the Historic Urban Landscape Approach: A Case Study of Suzhou. Land 2022, 11, 1251. [Google Scholar] [CrossRef]
  4. Wang, S.; Gu, K. Pingyao: The Historic Urban Landscape and Planning for Heritage-Led Urban Changes. Cities 2020, 97, 102489. [Google Scholar] [CrossRef]
  5. UNESCO. Vienna Memorandum on ‘World Heritage and Contemporary Architecture-Managing the Historic Urban Landscape’; UNESCO: Paris, France, 2005. [Google Scholar]
  6. UNESCO World Heritage Centre. UNESCO’s World Heritage City Lab; UNESCO: Paris, France, 2025. [Google Scholar]
  7. He, Q.; Larkham, P.; Wu, J. Evaluating Historic Preservation Zoning Using a Landscape Approach. Land Use Policy 2021, 109, 105737. [Google Scholar] [CrossRef]
  8. Liu, T.; Butler, R.J.; Zhang, C. Evaluation of Public Perceptions of Authenticity of Urban Heritage under the Conservation Paradigm of Historic Urban Landscape—A Case Study of the Five Avenues Historic District in Tianjin, China. J. Archit. Conserv. 2019, 25, 228–251. [Google Scholar] [CrossRef]
  9. Oumelkheir, B.; Nadia, D. Assessment Process in the Delimitation of Historic Urban Landscape of Algiers by AHP. Misc. Geogr. 2021, 25, 110–126. [Google Scholar] [CrossRef]
  10. Zhao, X.; Marnane, K.; Greenop, K. The Role of Digital Technologies in Recording Values of Human Settlements: Testing a Practical Historic Urban Landscape Approach in China and India. Digit. Creat. 2021, 32, 253–274. [Google Scholar] [CrossRef]
  11. Li, X.; Hou, W.; Liu, M.; Yu, Z. Traditional Thoughts and Modern Development of the Historical Urban Landscape in China: Lessons Learned from the Example of Pingyao Historical City. Land 2022, 11, 247. [Google Scholar] [CrossRef]
  12. Sun, J.; Shao, L. Interpretation of Historic Urban Landscape Genes: A Case Study of Harbin, China. Land 2024, 13, 1988. [Google Scholar] [CrossRef]
  13. Wang, Y.; Jin, C.; Xu, D.; Wang, T.; Wang, B. Analysis of Multi-Dimensional Layers in Historic Districts Based on Theory of the Historic Urban Landscape: Taking Shenyang Fangcheng as an Example. Land 2024, 13, 1736. [Google Scholar] [CrossRef]
  14. Liu, Y.Q.; Chen, G.L.; Cai, Y.Z.; Li, M.H.; Chen, D.A.; Hu, X.Z. A Building Boundary Extraction Method Based on Adaptive Segmentation of Oblique Photogrammetric Point Cloud Density. Bull. Surv. Mapp. 2022, 9, 52–57. [Google Scholar] [CrossRef]
  15. Li, R. Evaluation of Rural Landscape Characteristics Based on UAV Oblique Photography: A Case Study of Zhanqi Village, Chengdu. Master’s Thesis, Sichuan Agricultural University, Chengdu, China, 2022. [Google Scholar] [CrossRef]
  16. Teng, Z.; Li, C.; Zhao, W.; Wang, Z.; Li, R.; Zhang, L.; Song, Y. Extraction and Analysis of Spatial Feature Data of Traditional Villages Based on the Unmanned Aerial Vehicle (UAV) Image. Mob. Inf. Syst. 2022, 2022, 1–16. [Google Scholar] [CrossRef]
  17. Zhu, C.; Li, R.; Luo, J.; Li, X.; Du, J.; Ma, J.; Hou, C.; Zeng, W. Research on Evaluating the Characteristics of the Rural Landscape of Zhanqi Village, Chengdu, China, Based on Oblique Aerial Photography by Unmanned Aerial Vehicles. Sustainability 2024, 16, 5151. [Google Scholar] [CrossRef]
  18. Wang, L.L.; Liu, Y.R.; Huang, W.C.; Han, J. Research on the Analysis Method of Traditional Village Landscape Features Based on Digital Technology: A Case Study of Xiaocuo Village, Quanzhou. Chin. Landsc. Archit. 2023, 39, 13–19. [Google Scholar] [CrossRef]
  19. Liu, Z.W.; Wang, T.F.; Jin, H.; He, D.; Lei, Y.K. Mountain Landscape Planning Based on UAV Oblique Photography: A Case Study of Xiangshan Village, Xinmi City. For. Surv. Plan. 2020, 45, 1–8. [Google Scholar]
  20. Liu, C.; Cao, Y.; Yang, C.; Zhou, Y.; Ai, M. Pattern Identification and Analysis for the Traditional Village Using Low Altitude UAV-Borne Remote Sensing: Multifeatured Geospatial Data to Support Rural Landscape Investigation, Documentation and Management. J. Cult. Herit. 2020, 44, 185–195. [Google Scholar] [CrossRef]
  21. Cen, Y.; Jia, W.; Dai, W.; Wang, C.; Wu, H. Analysis of Color Landscape Characteristics in “Beautiful Village” of China Based on 3D Real Scene Models. Rev. Int. Geomatique 2024, 33, 93–109. [Google Scholar] [CrossRef]
  22. Li, Z.; Wang, T.; Sun, S. Research on Quantitative Analysis Methods for the Spatial Characteristics of Traditional Villages Based on Three-Dimensional Point Cloud Data: A Case Study of Liukeng Village, Jiangxi, China. Land 2024, 13, 1261. [Google Scholar] [CrossRef]
  23. Kaushal, S.S.; Soto, M.G.; Napolitano, R. Three-Dimensional Digital Documentation of Tornado-Damaged Heritage Buildings. J. Struct. Eng. 2024, 150, 04724002. [Google Scholar] [CrossRef]
  24. Nwaogu, J.M.; Yang, Y.; Chan, A.P.C.; Chi, H. Application of Drones in the Architecture, Engineering, and Construction (AEC) Industry. Autom. Constr. 2023, 150, 104827. [Google Scholar] [CrossRef]
  25. Du, S.Y.; Liang, H. Application of UAV Oblique Photography in 3D Real Scene Modeling for Construction Projects. J. Civ. Eng. Inf. Technol. 2018, 10, 72–77. [Google Scholar] [CrossRef]
  26. RandLA-Net: Efficient Semantic Segmentation of Large-Scale Point Clouds-All Databases. Available online: https://webofscience.clarivate.cn/wos/alldb/full-record/PPRN:14889910 (accessed on 14 April 2025).
  27. Li, Z.; Sun, S.; Zhou, C.C.; Tong, X.X.; Zhang, Y.X.; Li, Y. The “Correct Approach” to China’s Traditional Village Digital Museum: Mining and Quantifying Traditional Village Wisdom Through 3D Computational Analysis. Archit. J. 2019, 2, 74–80. [Google Scholar]
  28. Wang, C.; Ning, X.; Sun, L.; Zhang, L.; Li, W.; Bai, X. Learning Discriminative Features by Covering Local Geometric Space for Point Cloud Analysis. IEEE Trans. Geosci. Remote Sens. 2022, 60, 1–15. [Google Scholar] [CrossRef]
  29. Guo, Z.; Feng, C.-C. Using Multi-Scale and Hierarchical Deep Convolutional Features for 3D Semantic Classification of TLS Point Clouds. Int. J. Geogr. Inf. Sci. 2020, 34, 661–680. [Google Scholar] [CrossRef]
  30. Qi, C.R.; Yi, L.; Su, H.; Guibas, L.J. PointNet++: Deep Hierarchical Feature Learning on Point Sets in a Metric Space. arXiv 2017, arXiv:1706.02413. [Google Scholar] [CrossRef]
  31. Chen, J.; Zhao, Y.; Meng, C.; Liu, Y. Multi-Feature Aggregation for Semantic Segmentation of an Urban Scene Point Cloud. Remote Sens. 2022, 14, 5134. [Google Scholar] [CrossRef]
  32. Wang, H. Research on the Renewal Strategy of Fangzhou Ancient City in Huangling County from the Perspective of Spatial Genes. In Proceedings of the 2024 Annual Conference of China Urban Planning, Hefei, China, 26–28 April 2024; pp. 3180–3191. [Google Scholar] [CrossRef]
  33. Yin, X.M.; Zhang, K.L. Research on the Protection and Development of Imperial Mausoleum Cultural Heritage in Urban Renewal. Small Town Constr. 2020, 38, 53–60. [Google Scholar]
  34. Li, C.Y.; Li, Y.; Wang, R.R. Conservation and Renewal Strategies for Fangzhou Ancient City in Huangling from the Perspective of Urban Cultural Context. In Proceedings of the 2024 Annual Conference of China Urban Planning, Hefei, China, 26–28 April 2024; pp. 3473–3488. [Google Scholar] [CrossRef]
  35. Yin, X.M. Study on the Evolution of Spatial Patterns of Fangzhou Ancient City under the Influence of Mausoleum-City Relationships during the Ming and Qing Dynasties. Master’s Thesis, Beijing Forestry University, Beijing, China, 2021. [Google Scholar] [CrossRef]
  36. Huang, J.Y.; Wang, J.T. Living by the Mausoleum: Preliminary Study on the Construction of Human Settlements in Huangling Historical City. In Proceedings of the 2018 Annual Conference of China Urban Planning, Hangzhou, China, 24–26 November 2018; pp. 94–104. Available online: https://kns.cnki.net/KCMS/detail/detail.aspx?dbcode=CPFD&dbname=CPFDLAST2018&filename=ZHCG201811004010 (accessed on 5 February 2025).
  37. Colomina, I.; Molina, P. Unmanned Aerial Systems for Photogrammetry and Remote Sensing: A Review. ISPRS J. Photogramm. Remote Sens. 2014, 92, 79–97. [Google Scholar] [CrossRef]
  38. GB/T 27920.1-2011; Technical Specifications for UAV Aerial Photogrammetry—Part 1; General Requirements. Standards Press of China: Beijing, China, 2011.
  39. GB/T 13923-2022; Classification and Codes for Fundamental Geographic Information Features. Standards Press of China: Beijing, China, 2022.
  40. Huangling County People’s Government. Comprehensive Territorial Spatial Plan of Huangling County (2021–2035); Huangling County Natural Resources Bureau: Yan’an, China, 2021. [Google Scholar]
  41. GB 5035-2018; Standardization Administration of China. Standard for the Protection Planning of Historic and Cultural Cities. China Architecture & Building Press: Beijing, China, 2019.
  42. GB 50298-1999; Standardization Administration of China. Standard for the Planning of Scenic and Historic Areas. China Standards Press: Beijing, China, 2000.
  43. United Nations Educational, Scientific and Cultural Organization (UNESCO). Recommendation on the Historic Urban Landscape; UNESCO: Paris, France, 2011. [Google Scholar]
  44. Sukwai, J.; Mishima, N.; Srinurak, N. Identifying Visual Sensitive Areas: An Evaluation of View Corridors to Support Nature–Culture Heritage Conservation in Chiang Mai Historic City. BuiltHeritage 2022, 6, 23. [Google Scholar] [CrossRef]
  45. Wang, X.; Han, F.; Bian, X.; Li, Z. Mapping the Past with Present Digital Tools: Historic Urban Landscape Research in Chinese City, Xi’an Walled City Area. BuiltHeritage 2018, 2 (Suppl. S4), 42–57. [Google Scholar] [CrossRef]
  46. Shehata, A.M. Current Trends in Urban Heritage Conservation: Medieval Historic Arab City Centers. Sustainability 2022, 14, 607. [Google Scholar] [CrossRef]
  47. Körmeçli, Ş.P. Accessibility of Urban Tourism in Historical Areas: Analysis of UNESCO World Heritage Sites in Safranbolu. Sustainability 2024, 16, 2485. [Google Scholar] [CrossRef]
  48. Matrone, F.; Lingua, A.; Pierdicca, R.; Malinverni, E.S.; Paolanti, M.; Grilli, E.; Remondino, F.; Murtiyoso, A.; Landes, T. A Benchmark for Large-Scale Heritage Point Cloud Semantic Segmentation. Int. Arch. Photogramm. Remote Sens. Spatial Inf. Sci. 2020, 43, 1419–1426. [Google Scholar] [CrossRef]
  49. CNRS Images. How Forest Models Are Reconstructed in 3D from Photogrammetric Surveys. Available online: https://images.cnrs.fr/en/video/4059 (accessed on 24 May 2025).
  50. Autodesk. Digitizing Ipiranga Museum: Preserving Cultural Heritage Through GIS and BIM. Available online: https://www.autodesk.com/autodesk-university/de/article/Digitizing-Ipiranga-Museum-Preserving-Cultural-Heritage-through-GIS-and-BIM-2022 (accessed on 24 May 2025).
  51. Croce, V.; Caroti, G.; De Luca, L.; Jacquot, K.; Piemonte, A.; Véron, P. From the Semantic Point Cloud to Heritage-Building Information Modeling: A Semiautomatic Approach Exploiting Machine Learning. Remote Sens. 2021, 13, 461. [Google Scholar] [CrossRef]
  52. Ababneh, A. Digital Solutions for Cultural Heritage: Preservation, Interpretation, and Engagement in Line with the Venice Charter Principles. In Proceedings of the VIPERC2024: 3rd International Conference on Visual Pattern Extraction and Recognition for Cultural Heritage Understanding, Bari, Italy, 1 September 2024; Volume 3838. [Google Scholar]
  53. Chen, J.; Zhao, X.; Wang, H.; Yan, J.; Yang, D.; Xie, K. Portraying Heritage Corridor Dynamics and Cultivating Conservation Strategies Based on Environment Spatial Model: An Integration of Multi-Source Data and Image Semantic Segmentation. Herit. Sci. 2024, 12, 1–17. [Google Scholar] [CrossRef]
  54. Marmol, U.; Borowiec, N. Analysis and Verification of Building Changes Based on Point Clouds from Different Sources and Time Periods. Remote Sens. 2023, 15, 1414. [Google Scholar] [CrossRef]
  55. Yi, W.; Sutrisna, M. Drone Scheduling for Construction Site Surveillance. Comput. Aided Civ. Infrastruct. Eng. 2021, 36, 3–13. [Google Scholar] [CrossRef]
  56. Kleinschroth, F.; Banda, K.; Zimba, H.; Dondeyne, S.; Nyambe, I.; Spratley, S.; Winton, R.S. Drone Imagery to Create a Common Understanding of Landscapes. Landsc. Urban Plan. 2022, 228, 104571. [Google Scholar] [CrossRef]
  57. State Council of the People’s Republic of China. Regulations on the Protection of Historical and Cultural Cities, Towns and Villages; State Council: Beijing, China, 2019. (In Chinese) [Google Scholar]
  58. Tencent Research Institute. China Cultural Heritage Digitization Research Report 2023–2024; Tencent Research Institute: Shenzhen, China, 2024. (In Chinese) [Google Scholar]
  59. Lee, H.; Kim, B.-W.; Park, B.-W. Building 3D Reconstruction by the Integration of Drone and Terrestrial Laser Scanner Data. J. Korean Soc. Surv. Geod. Photogramm. Cartogr. 2024, 42, 245–252. [Google Scholar] [CrossRef]
  60. Stek, T.D. Drones over Mediterranean Landscapes: The Potential of Small UAV’s (Drones) for Site Detection and Heritage Management in Archaeological Survey Projects—A Case Study from Le Pianelle in the Tappino Valley, Molise (Italy). J. Cult. Herit. 2016, 22, 1066–1071. [Google Scholar] [CrossRef]
  61. Zhang, C.; Tian, Y.; Zhang, J. Complex Image Background Segmentation for Cable Force Estimation of Urban Bridges with Drone-Captured Video and Deep Learning. Struct. Control. Health Monit. 2022, 29, e2910. [Google Scholar] [CrossRef]
  62. Cho, H.L.J.; Lee, S.B.; Yoo, H.C. A Study on DEM-Based Automatic Calculation of Earthwork Volume for BIM Application. J. Korean Soc. Surv. Geod. Photogramm. Cartogr. 2020, 38, 131–140. [Google Scholar] [CrossRef]
  63. Uribe, P.; Angás, J.; Romeo, F.; Pérez-Cabello, F.; Santamaría, D. Mapping Ancient Battlefields in a Multi-Scalar Approach Combining Drone Imagery and Geophysical Surveys: The Roman Siege of the Oppidum of Cabezo de Alcal? (Azaila, Spain). J. Cult. Herit. 2021, 48, 11–23. [Google Scholar] [CrossRef]
Figure 1. Study area (Fangzhou Ancient City) is located in Huangling County, Yan’an City, Shaanxi Province, China.
Land 14 01156 g001
Figure 2. Data processing routes.
Land 14 01156 g002
Figure 3. Quality analysis results.
Land 14 01156 g003
Figure 4. Overall structure of RandLA-Net.
Land 14 01156 g004
Figure 5. Curves of model evaluation results.
Land 14 01156 g005
Figure 6. Point cloud classification results.
Land 14 01156 g006
Figure 7. Study site DEM.
Land 14 01156 g007
Figure 8. (a) Fitted plot of ground and building elevations at study site; (b) histogram of elevation residuals.
Land 14 01156 g008
Figure 9. Distribution of buildings in different regions and point cloud cross-section.
Land 14 01156 g009
Figure 10. Spatial syntax analysis process.
Land 14 01156 g010
Figure 11. Street integration.
Land 14 01156 g011
Figure 12. Street selectivity.
Land 14 01156 g012
Figure 13. Street connectivity.
Land 14 01156 g013
Figure 14. (a) Distribution of historic streets and alleys; (b) historic street width statistics.
Land 14 01156 g014
Figure 15. (a) Distribution of common streets and alleys; (b) variation in width of common streets and alleys.
Land 14 01156 g015aLand 14 01156 g015b
Figure 16. Map of types and distribution of public spaces.
Land 14 01156 g016
Figure 17. Map of building types and distribution.
Land 14 01156 g017
Figure 18. (a) Roof slope distribution of buildings in the old city of Fangzhou; (b) roof slope statistics of historical buildings; (c) roof slope statistics of modern buildings.
Land 14 01156 g018
Figure 19. (a) Roof height distribution of buildings in the old city of Fangzhou; (b) roof height statistics of historical buildings; (c) roof height statistics of modern buildings.
Land 14 01156 g019
Figure 20. Thermal map of distance of historic buildings to modern buildings.
Land 14 01156 g020
Table 1. Classification and statistical results of point cloud model.
Class NamePrecisionRecallF1_Score
2Ground0.8463980.659517
3Plant cover0.6455260.887858
6Architecture0.9424020.929425
11Street0.7929040.63281
Table 2. Quantitative indicators and analytical methods.
GradeSpatial CharacteristicsQuantitative IndicatorsAnalyzing Software/Instructions
Colony levelMountain settlement characterizationTerrain fitIn conjunction with GIS
DEMDirect computation through the point cloud
Elevation residualsIn conjunction with GIS
Distributional environmental characteristicsSlopeDirect computation through the point cloud
Building profiles
Street levelStreet space proportionsStreet widthDirect computation through the point cloud
Street space connectionsIntegrationIn conjunction with GIS
Selectivity
Connection value
Public spaceDistribution of public spaceDirect computation through the point cloud
Architectural levelBuilding morphological featuresBuilding roof slopesDirect computation through the point cloud
Building roof height
Relationship between historic and modern architectureBuilding spacing
Disclaimer/Publisher’s Note: The statements, opinions and data contained in all publications are solely those of the individual author(s) and contributor(s) and not of MDPI and/or the editor(s). MDPI and/or the editor(s) disclaim responsibility for any injury to people or property resulting from any ideas, methods, instructions or products referred to in the content.

