1. Introduction
Arid areas constitute approximately 40% of the Earth’s terrestrial surface and are crucial for preserving global biodiversity and ecological equilibrium [
1,
2]. Nonetheless, these areas are characterized by limited precipitation, substantial diurnal temperature variations, and sparse vegetation, rendering their ecological environments particularly vulnerable [
3,
4]. With the acceleration of global urbanization and the intertwining of factors such as land-use change, climate change, and human activities, urban ecosystems in arid areas are facing more severe challenges [
5,
6,
7]. Changes in land-use types alter the structure of local ecosystems and affect their balance [
8]. The unique climate leads to localized land degradation and desertification, increased soil erosion, and altered soil pH levels, leading to a decline in ecosystem health [
9,
10]. In addition, population growth and economic development are putting pressure on natural resources and challenging the ECC of arid areas [
11,
12]. Given the substantial consequences linked to these challenges, it is essential to conduct comprehensive research on the ECC in arid areas globally, alongside the formulation of sustainable management strategies. These initiatives are vital not only for the conservation of the global ecosystems but also for promoting sustainable development.
In recent years, there has been a notable increase in global research concerning ECC [
13,
14]. However, the diversity in research emphases and the distinct ecological characteristics of various regions have resulted in considerable discrepancies in the selection of indicators. Coastal regions with humid climates often focus on metrics like population density, per capita water resources, and vegetation coverage [
15,
16]. Arid areas prioritize indicators such as soil moisture and drought due to water scarcity and ecological fragility [
17,
18]. Nature reserves emphasize species diversity, ecosystem integrity, and ecological service value to protect biodiversity and ecological baselines [
19]. However, these context-specific indicators are hindered by inconsistent frameworks and a lack of adaptability. This limitation diminishes their effectiveness in addressing the complex ecological pressures resulting from climate change and human activities.
Current ECC assessment methods include the ecological footprint method and integrated assessment models [
20,
21]. The ecological footprint method measures carrying capacity by calculating the ecologically productive land used for human consumption and waste [
22]. However, its reliance on static data limits monitoring of long-term changes in ecosystems, hindering the development of effective ecological protection strategies [
23]. Integrated models, such as the pressure-state-response (PSR) and driving pressure-state-impact-response (DPSIR) frameworks, provide multi-dimensional analyses of ecosystem conditions and human activities [
24,
25]. Nevertheless, these models lack standardized indicator sets, necessitating context-specific parameter adjustments that diminish cross-regional comparability [
26,
27]. Both methods are straightforward and effective in quantifying resource consumption and multidimensional system analysis. However, the absence of a dynamic, data-driven framework may restrict the understanding of the complexities of human activities and the evolving nature of ECC.
Despite these advancements, global ECC research continues to be constrained by fragmented inquiries. Many studies concentrate on isolated factors, such as water availability or livestock carrying capacity [
28,
29]. In contrast, neglecting the intricate interactions among land degradation, water scarcity, and human activities [
30,
31]. This oversight leads to discrepancies between assessment results and actual conditions. Furthermore, the close connection between geological features, socio-economic systems, and ecosystems is frequently overlooked [
32,
33]. This connection is crucial for regional sustainable development. The constraints identified in existing research underscore a conflict between the comprehensive characteristics of ecosystems and the segmented structure of assessment methodologies. Therefore, future investigations can improve evaluation frameworks by incorporating geo-environmental and socio-economic variables. This integration will enable more thorough assessments of ecosystem condition and change while also addressing the intrinsic complexity and susceptibility of ecosystems.
In light of the ecological issues in arid areas and the characteristics of ECC evaluation methods, we propose an evaluation of ECC in arid areas based on the AHP-EW model. This study aims to address the following scientific questions: (1) How to construct an ECC evaluation based on the AHP-EW model suitable for arid areas, using Urumqi as a case study, selecting appropriate indicators according to local ecological characteristics, and building a suitable ECC evaluation model; (2) how to better understand the changes in Urumqi’s ECC through analysis and provide reasonable suggestions for local ecological protection based on the analysis.
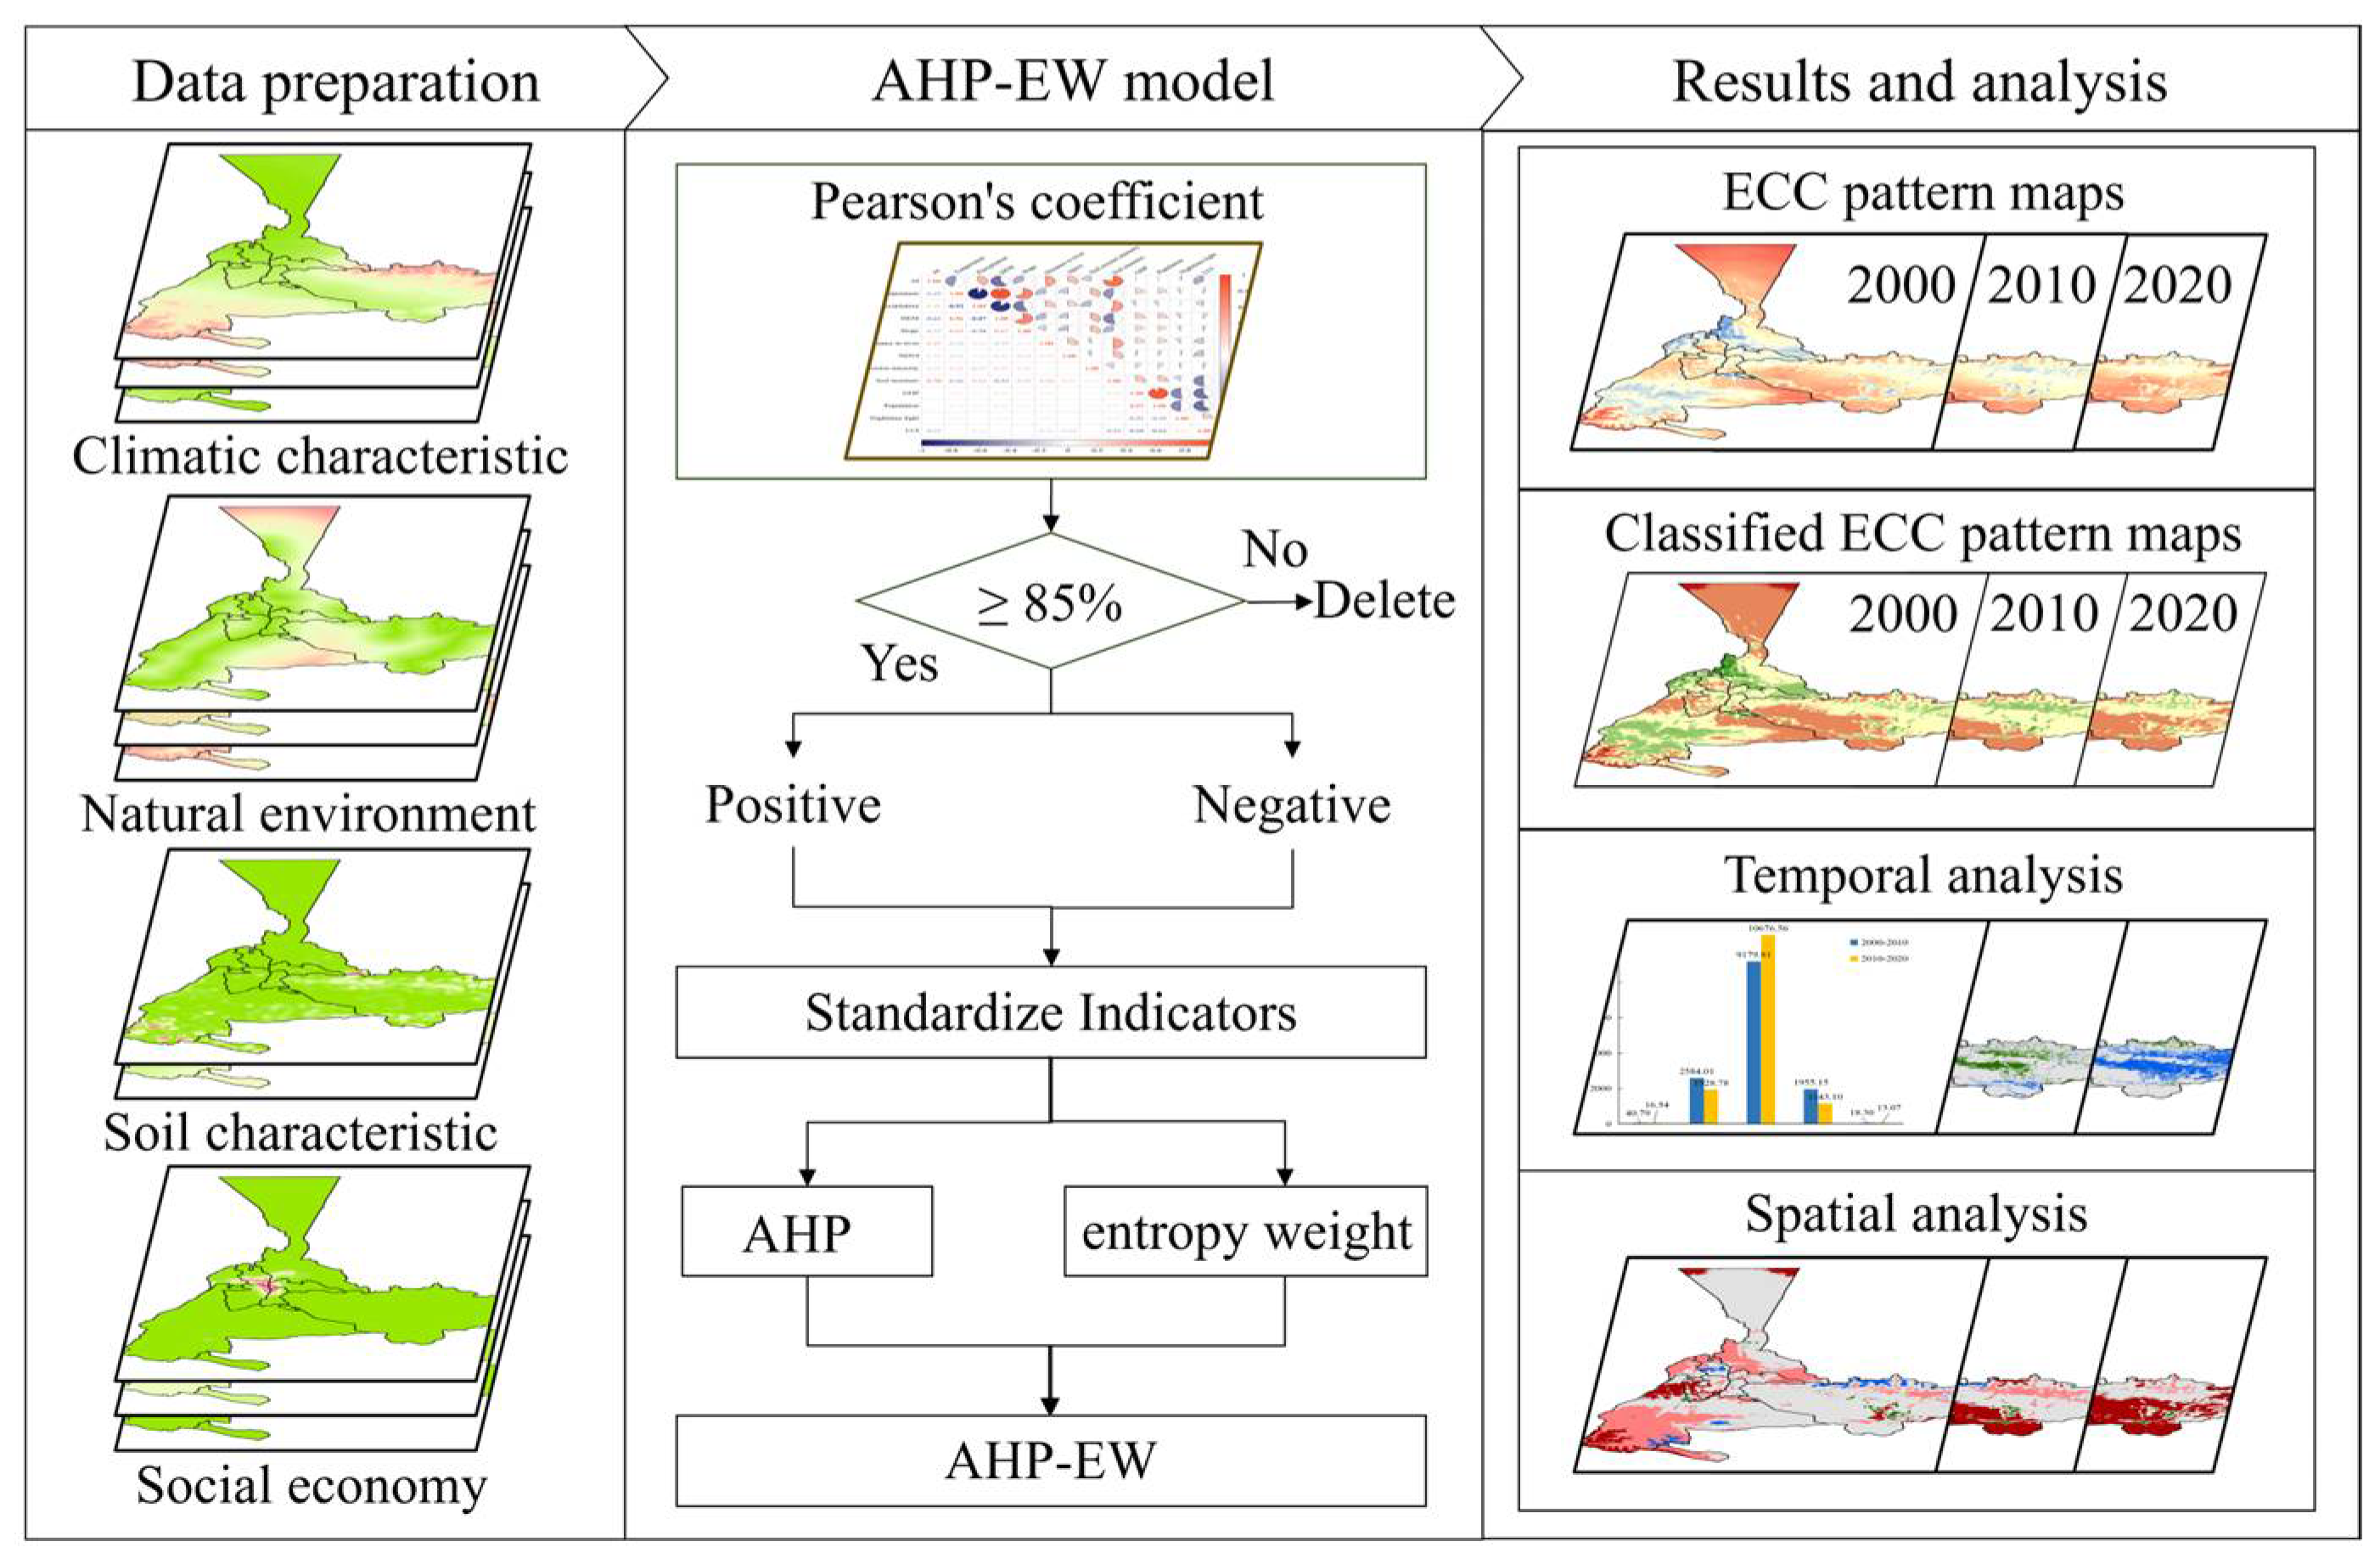
In this study, the ECC evaluation index system in line with the characteristics of Urumqi was constructed by comprehensively considering the factors of climate, soil, socio-economy, and natural environment. After analyzing and screening the correlation of indicators, the AHP-EW model was used for weighting. Then, we drew the spatial distribution map of ECC and analyzed the changes by statistical and spatial autocorrelation methods. This research enriches the theoretical framework for assessing the ECC of arid areas and reveals how multiple factors interact to influence this capacity. The findings offer valuable insights for effective ecological protection policies and improved land-use planning, promoting harmony between economic and ecological development. Additionally, this study establishes a methodological framework for global research on ECC. It also contributes to the advancement of theories related to ECC assessment in arid areas. It helps standardize ECC criteria worldwide and guides sustainable development in other arid areas globally.
4. Results
4.1. 2000–2020. ECC Patterns
According to the ECC evaluation index system (c.f.
Table 4), the positive and negative indices were normalized separately, and the weight results are shown in
Table 5. Among them, NDVI (0.27), soil moisture (0.21), and AI (0.14) had the highest weights, followed by DEM (0.10), while soil erosion (0.01) had the lowest weight. Higher NDVI values indicate richer vegetation cover, which can improve soil quality and reduce soil erosion, directly reflecting the health of the ecosystem and significantly influencing ECC. In arid areas, soil moisture is crucial for plant growth and survival, making it closely related to ECC. The AI reflects the balance between precipitation and evapotranspiration, indicating the degree of regional aridity; thus, it has a higher weight due to its substantial impact on local ECC. DEM represents topography and geomorphology, indirectly affecting the ecosystem by influencing water and heat redistribution. Overall, the distribution of these weights aligns well with the ECC characteristic of arid areas.
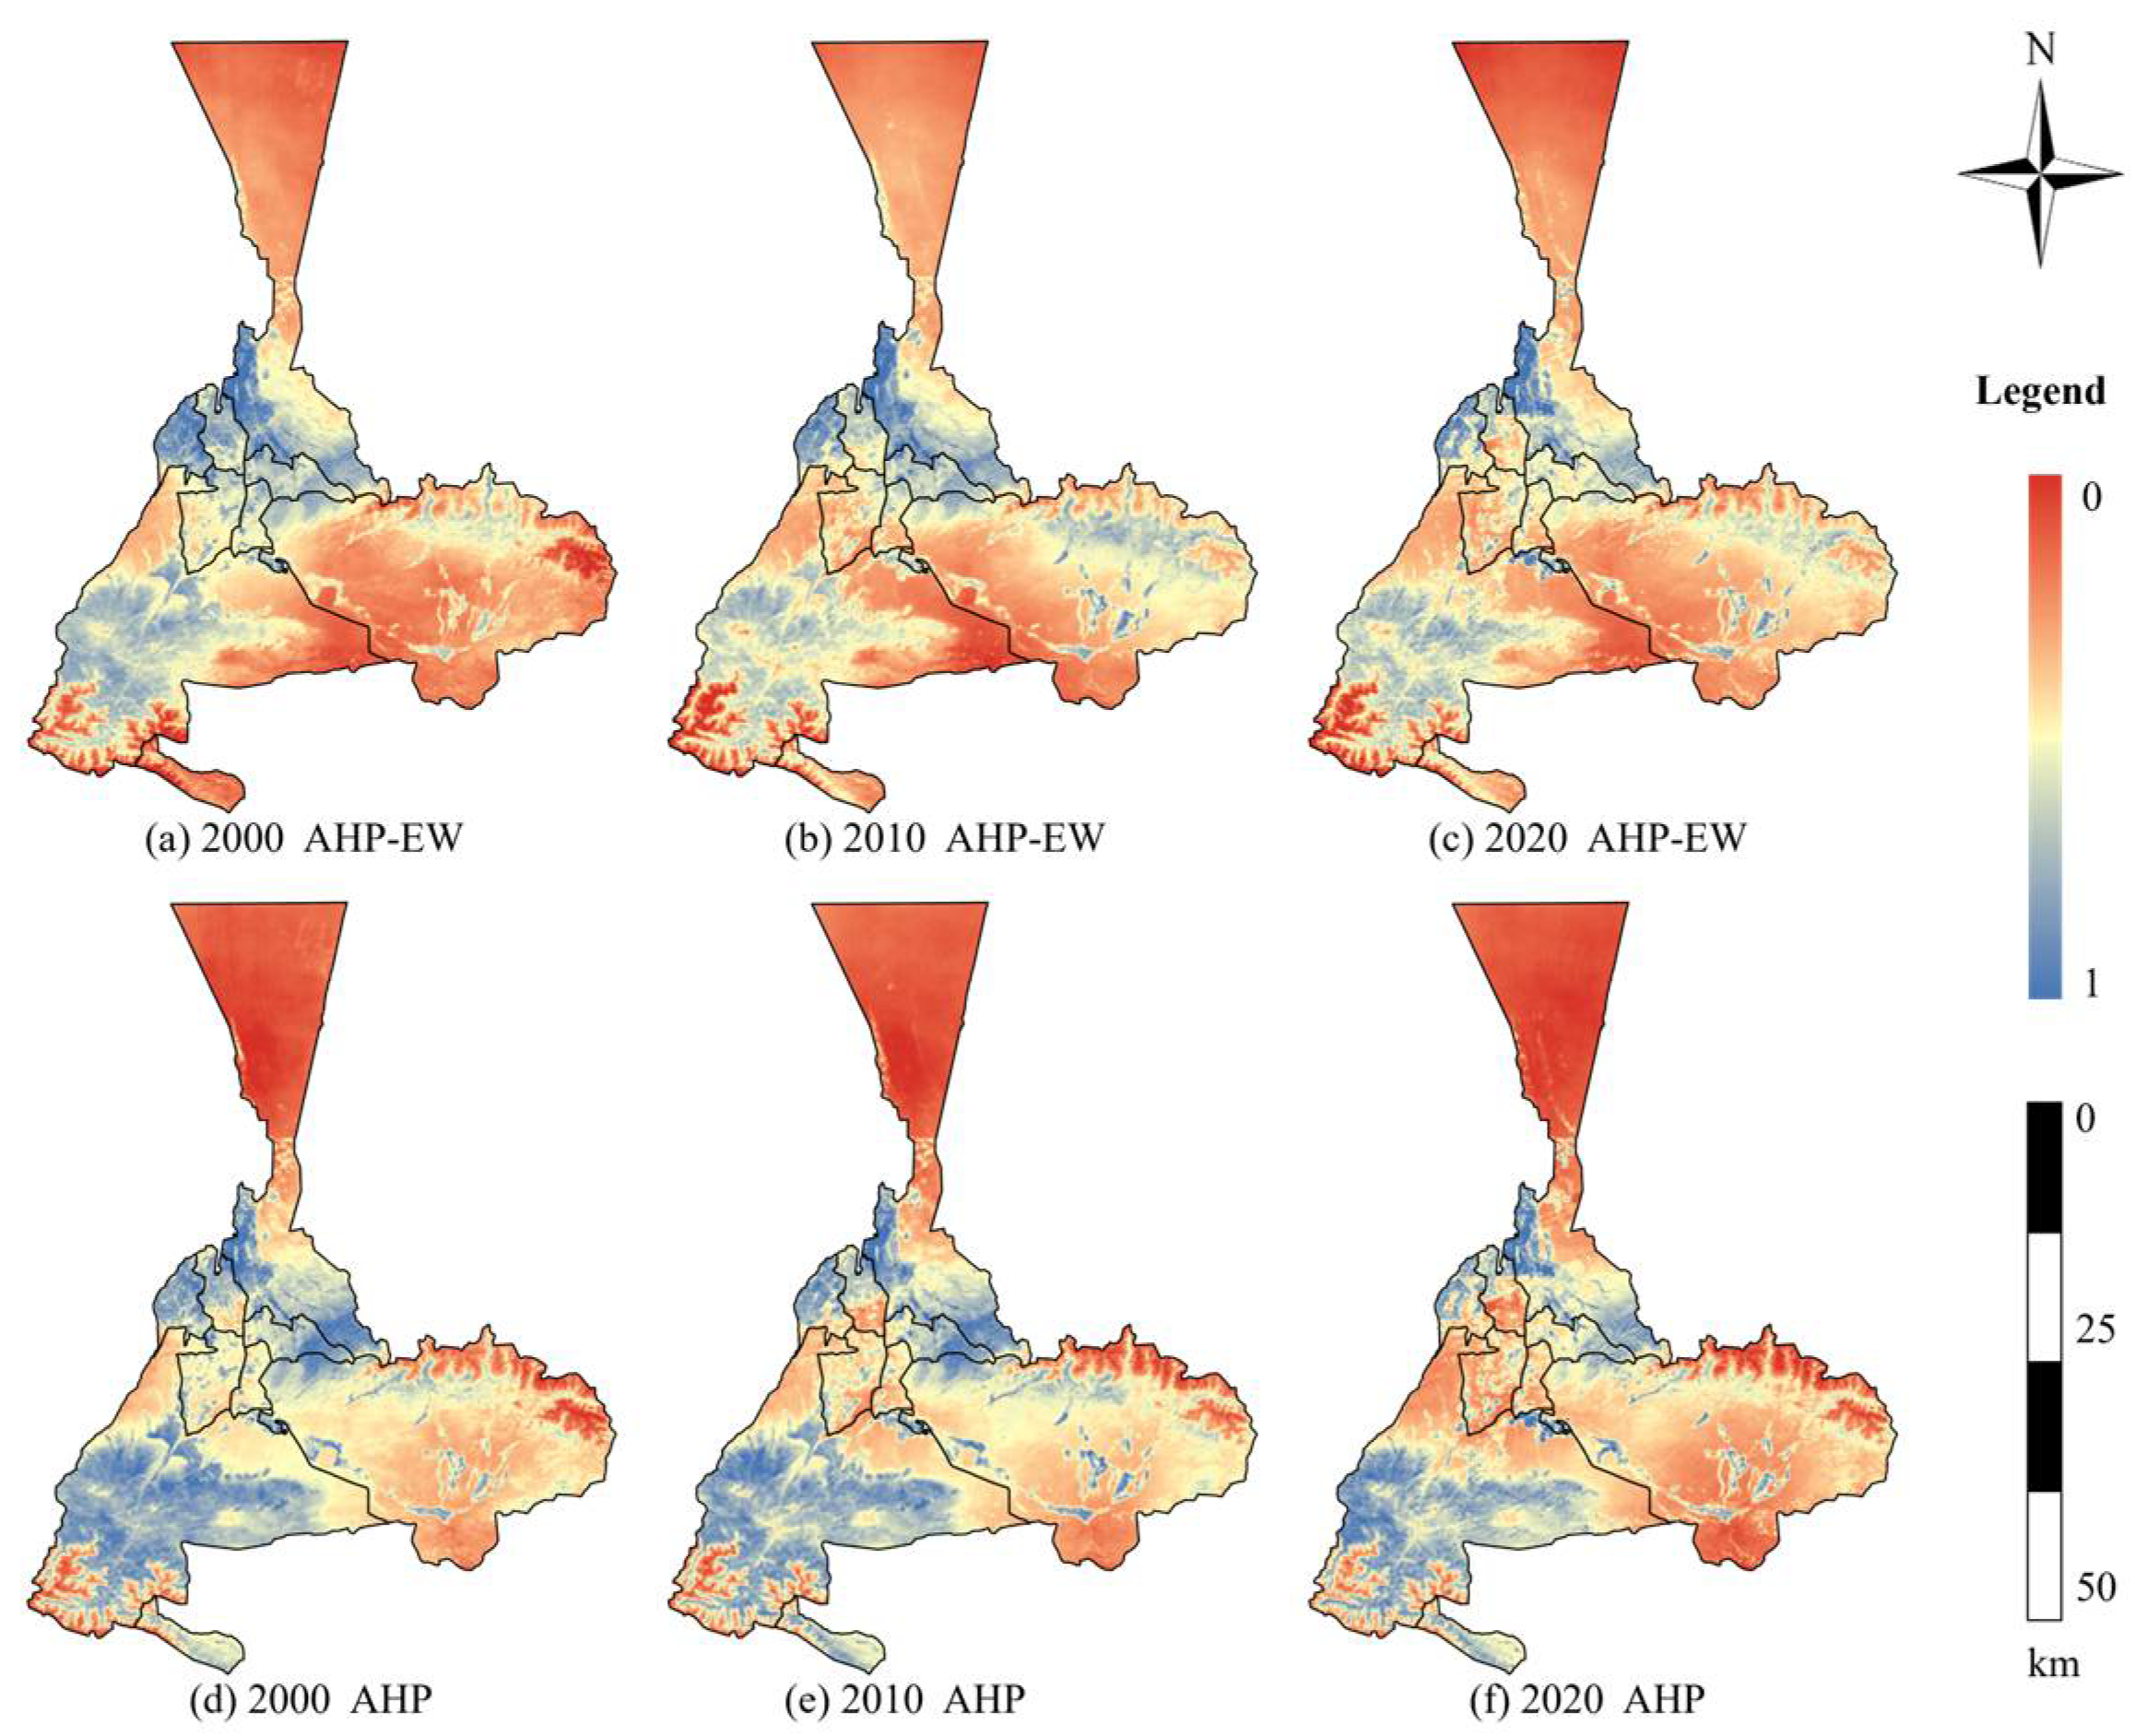
The ECC patterns for Urumqi from 2000 to 2020 were finally obtained by calculating the ten indicators (
Figure 5). Visual analysis revealed low ECC values in the northern and southeastern regions, while higher ECC values were observed in the central and southwestern areas. Between 2000 and 2020, there was an increasing trend in the extent and intensity of the low-value areas, whereas there was a decreasing trend in those of high-value ECC areas.
Figure 5a–c illustrates the evaluation results using the AHP-EW model, while
Figure 5d–f presents the AHP method results. In terms of spatial distribution, the AHP method does not clearly distinguish between the ECC in the central urban boundary area and the southern area, making it difficult to accurately show the differences resulting from changes in land use and natural conditions. In contrast, the AHP-EW method captures these changes more effectively. The boundaries of ECC influenced by human activities are delineated in urban expansion areas, and in mountainous and other regions with complex natural conditions, variations in ECC among smaller areas are represented with greater precision through color depth, adequately reflecting the spatial heterogeneity of the ecological environment. Therefore, the AHP-EW model provides better results than individual weighting methods.
4.2. Classified ECC Patterns
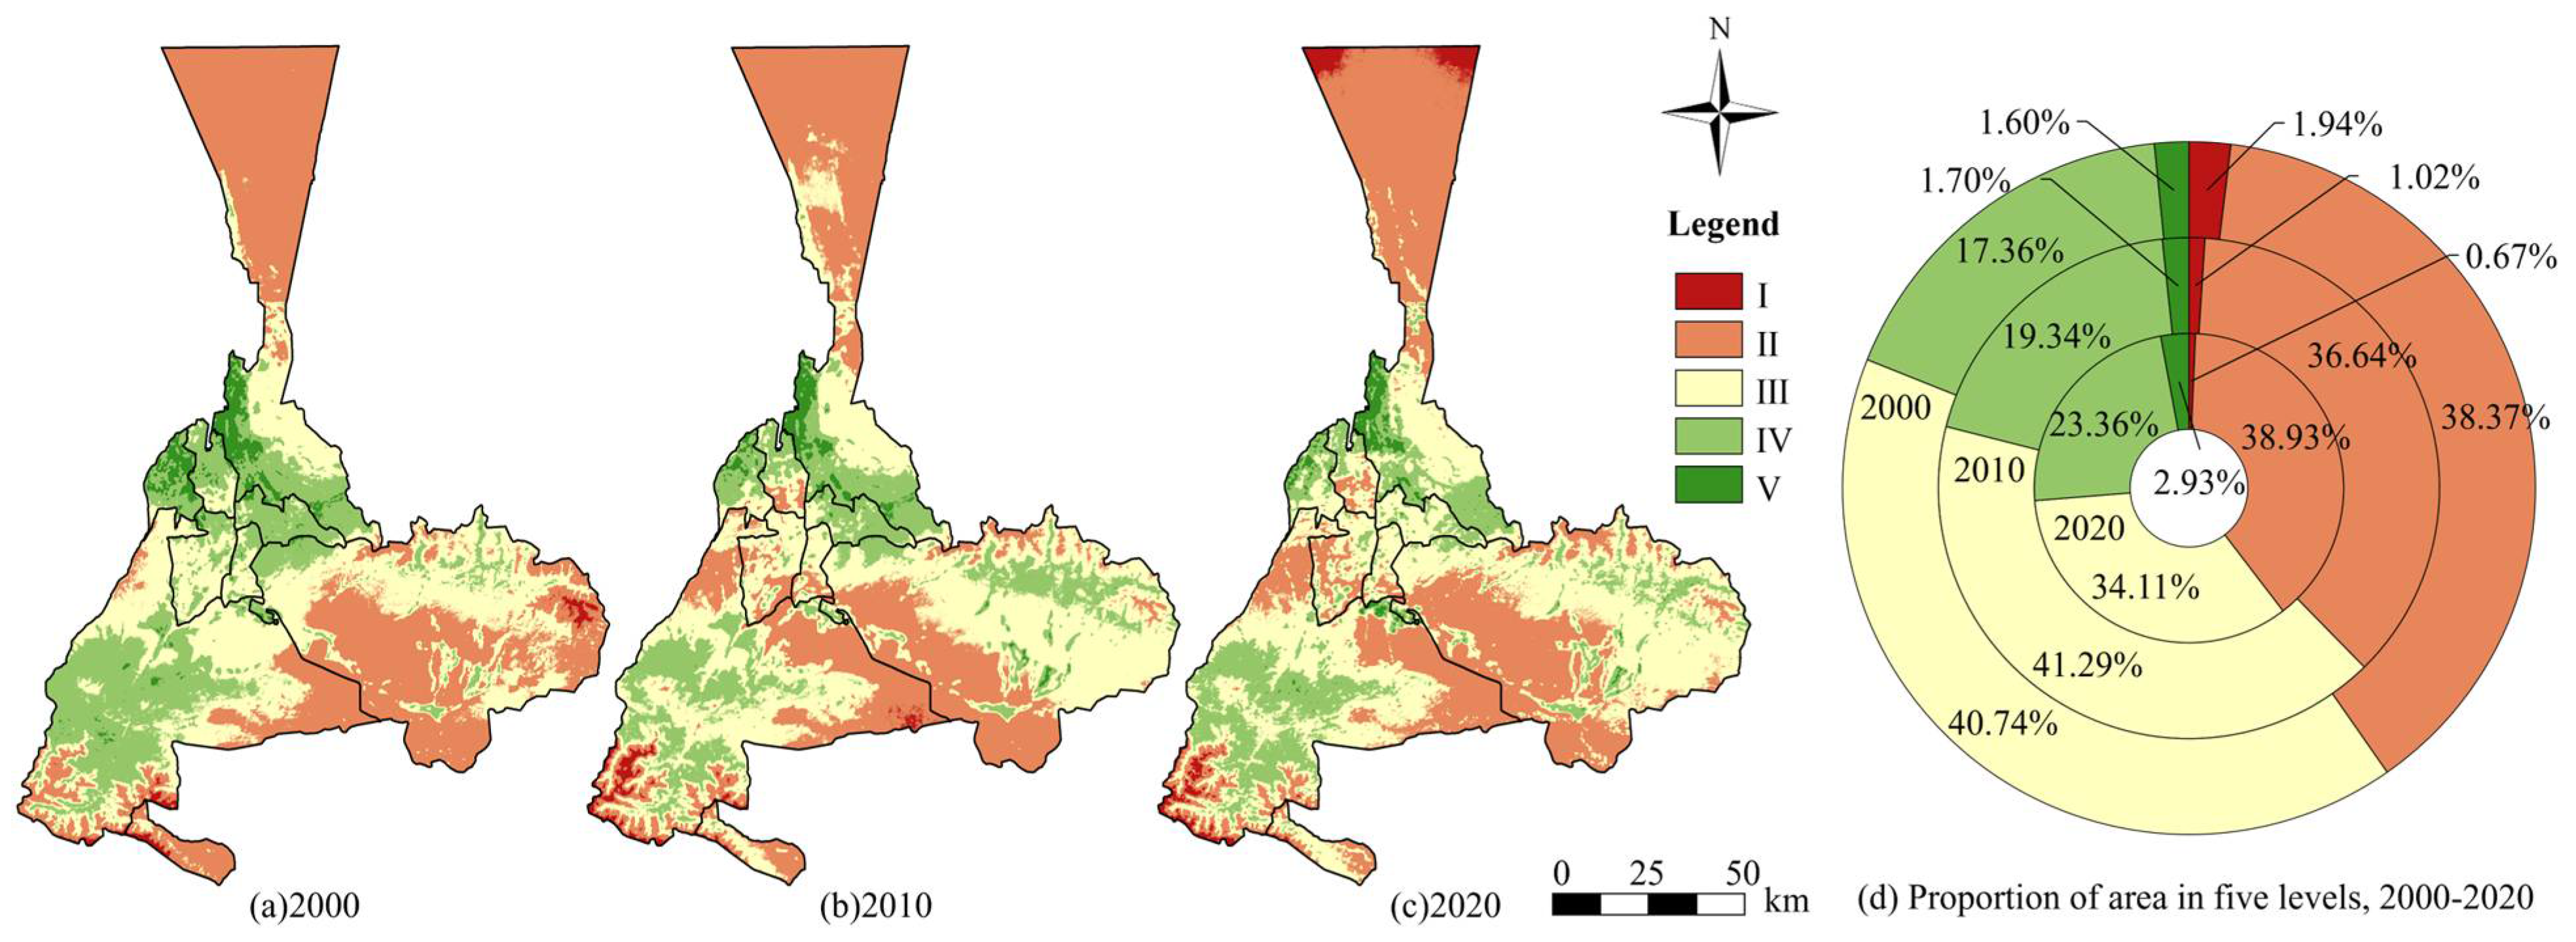
To be able to visualize the temporal changes in the ECC more intuitively, we classify the ECC maps into five classes at 0.2 intervals using the equal interval method [
60], and the specific classification is shown in
Table 6. The grades are classified from I to V, with each grade corresponding to specific value ranges: 0–0.2, 0.2–0.4, 0.4–0.6, 0.6–0.8, and 0.8–1.0. These grades reflect the condition of the ECC, categorized as poor, fair, medium, good, and excellent, respectively.
We used the reclassification tool in ArcMap 10.7 to classify the ECC pattern and finally derived the classified ECC pattern in Urumqi from 2000 to 2020.
Figure 6a–c shows the ECC patterns based on the five classes over 20 years, with more distinct ECC distributions and trends than the ECC pattern map (c.f.
Figure 5). Levels I and II (the most severe levels) occurred in the northern and southern regions of Urumqi, while level V (the best level) appeared in the central region of the city. Among all the twenty years, level II has the largest proportion, followed by level III, while level I and level V have the smallest proportion. From 2000 to 2020, ECC improved in the southeastern part of Urumqi and decreased in the northern and central areas. In the central area, the development of local urbanization has triggered a transformation in land-use types and an expansion of built-up areas. Consequently, the ecological status of this region has deteriorated.
4.3. Spatiotemporal Changes in ECC Patterns in Urumqi
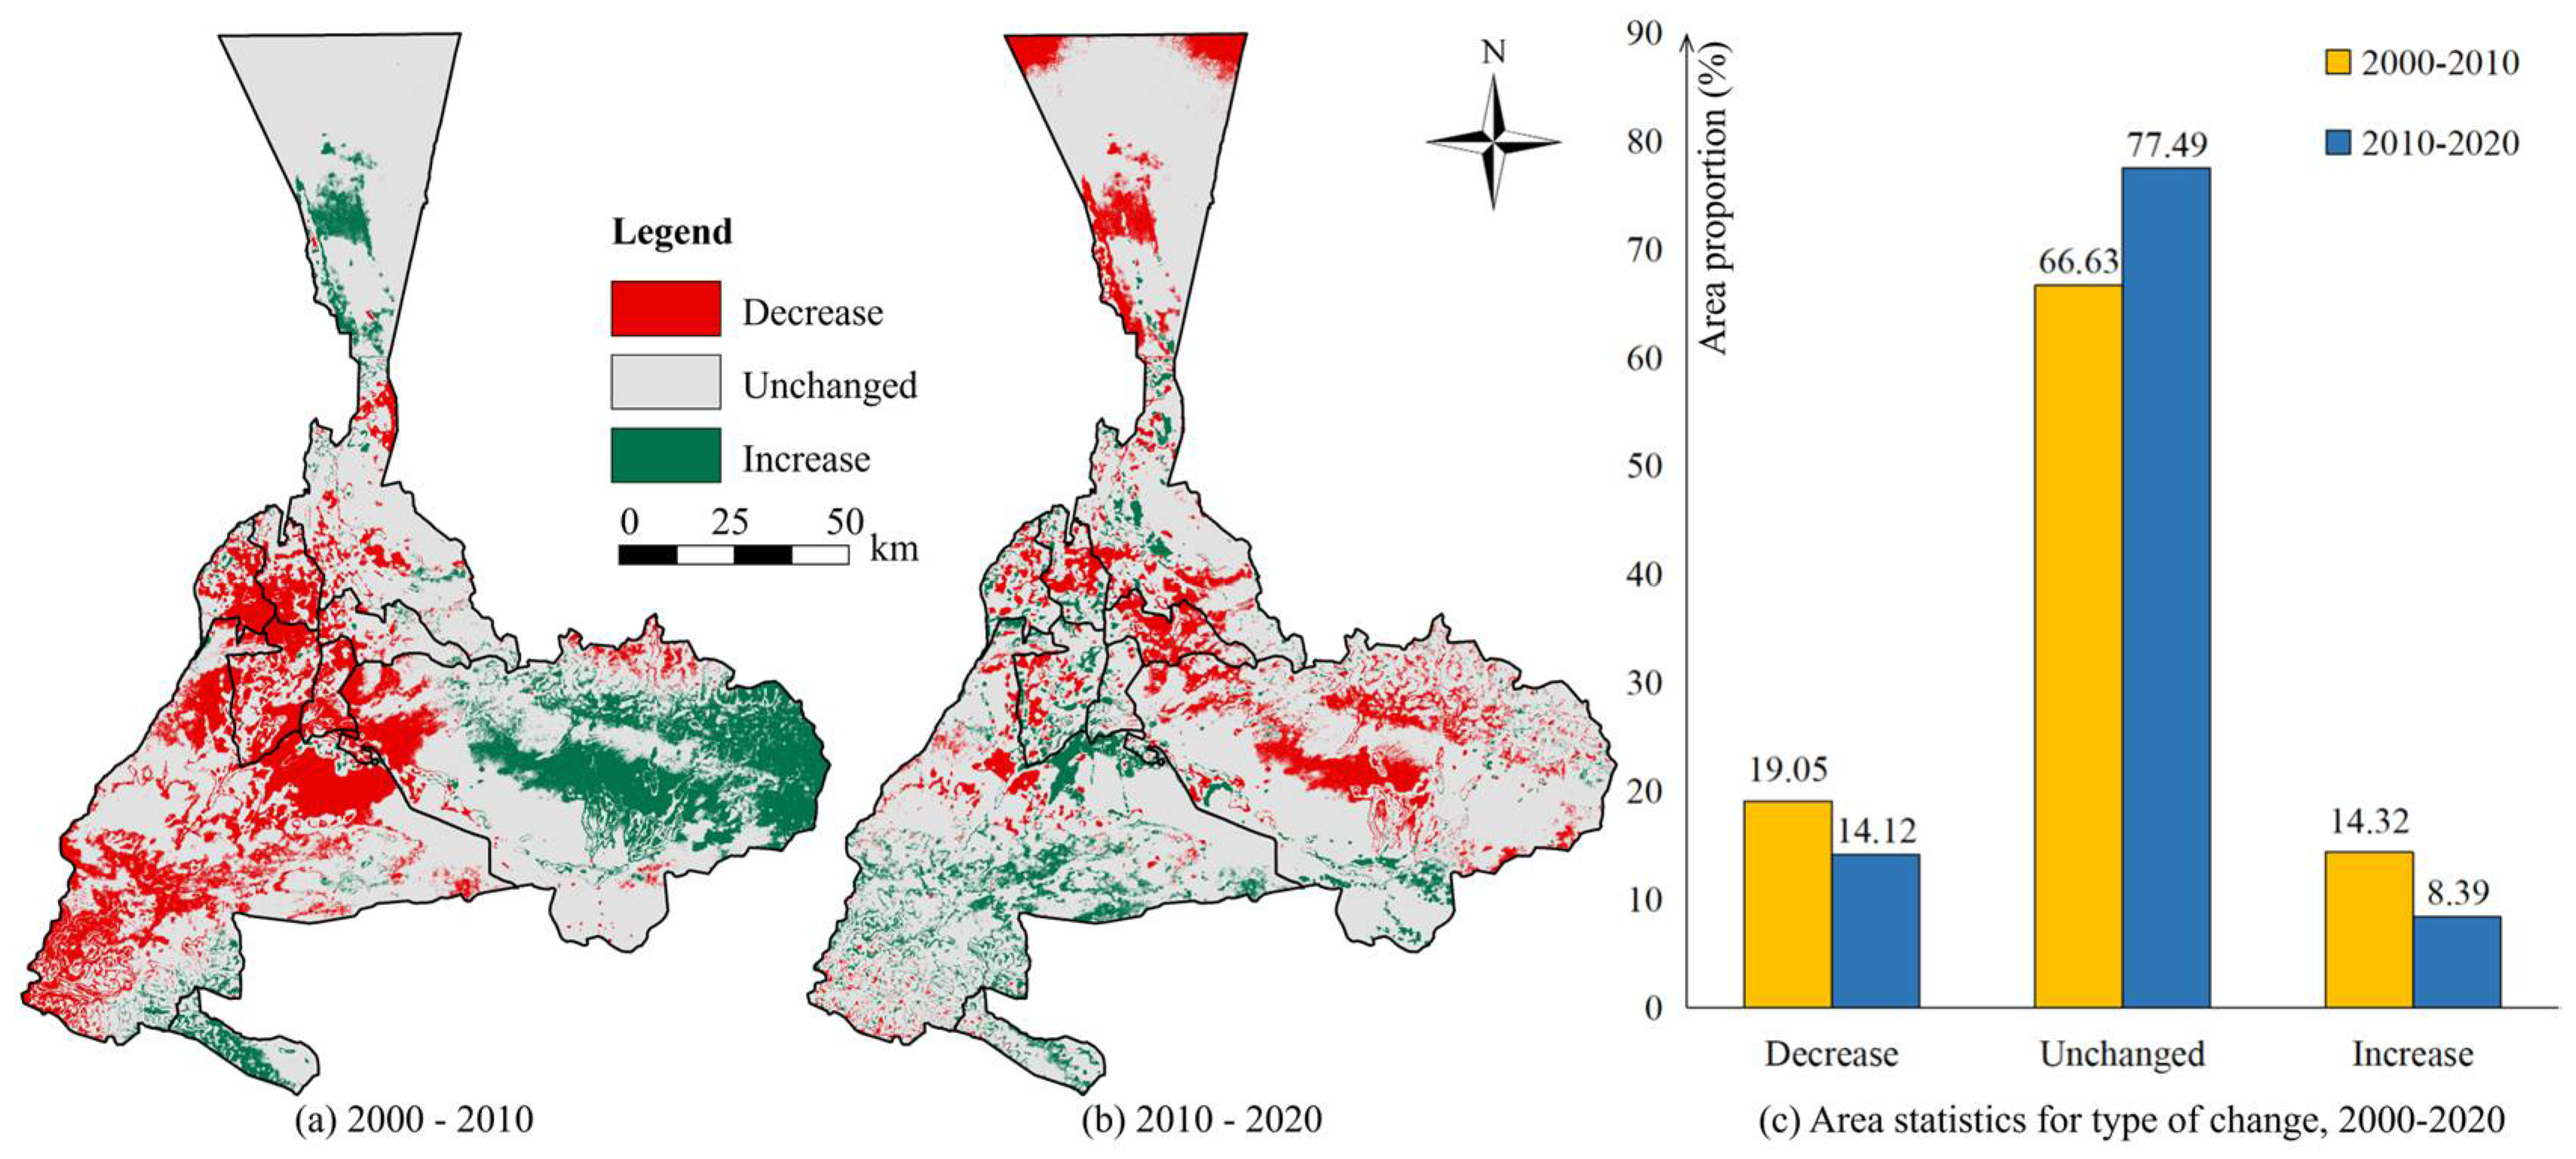
Figure 7a shows that the areas with decreasing ECC levels from 2000 to 2010 are concentrated in the central and western regions, mainly in Urumqi County, Toutunhe District, Sayibak District, and Xinshi District. The areas with decreasing ECC levels from 2010 to 2020 are significantly smaller than the areas with decreasing ECC levels from 2000 to 2010 (
Figure 7b). The areas with no change in ECC from 2000 to 2010 and from 2010 to 2020 account for 66.63% and 77.49% of the total area, respectively (
Figure 7c). From 2000 to 2010, 19.05% of the total area had a reduced ECC level, while from 2010 to 2020, 14.12% of the total area had a reduced ECC level. The rate of increase in ECC level was 14.32% and 8.39% from 2000 to 2010 and 2010 to 2020, respectively. In conclusion, from 2000 to 2020, the area with decreasing ECC levels in Urumqi is larger than the area with increasing ECC levels, showing a general trend of decreasing. ECC. This result is consistent with the findings of other related literature (1 − α > 0.95) and validates the reliability of this study [
60,
61].
Between 2000 and 2010, the Western Development Strategy focused on expanding local energy resources and promoting high-water-consuming agricultural practices. This approach led to the overexploitation of water resources and the degradation of pastureland, resulting in a decline in ECC. After 2010, policies shifted towards ecological restoration, introducing measures such as grazing bans, water-saving technologies, and spatial controls defined by “three zones and three lines”. These initiatives effectively slowed the decline of ECC. However, ongoing conflicts over water rights between agriculture and industry, the lack of market-based ecological compensation mechanisms, and inadequate cross-regional coordination have hindered ecological restoration efforts. As a result, these challenges highlight the long-term struggle for arid areas to balance development and ecological protection.
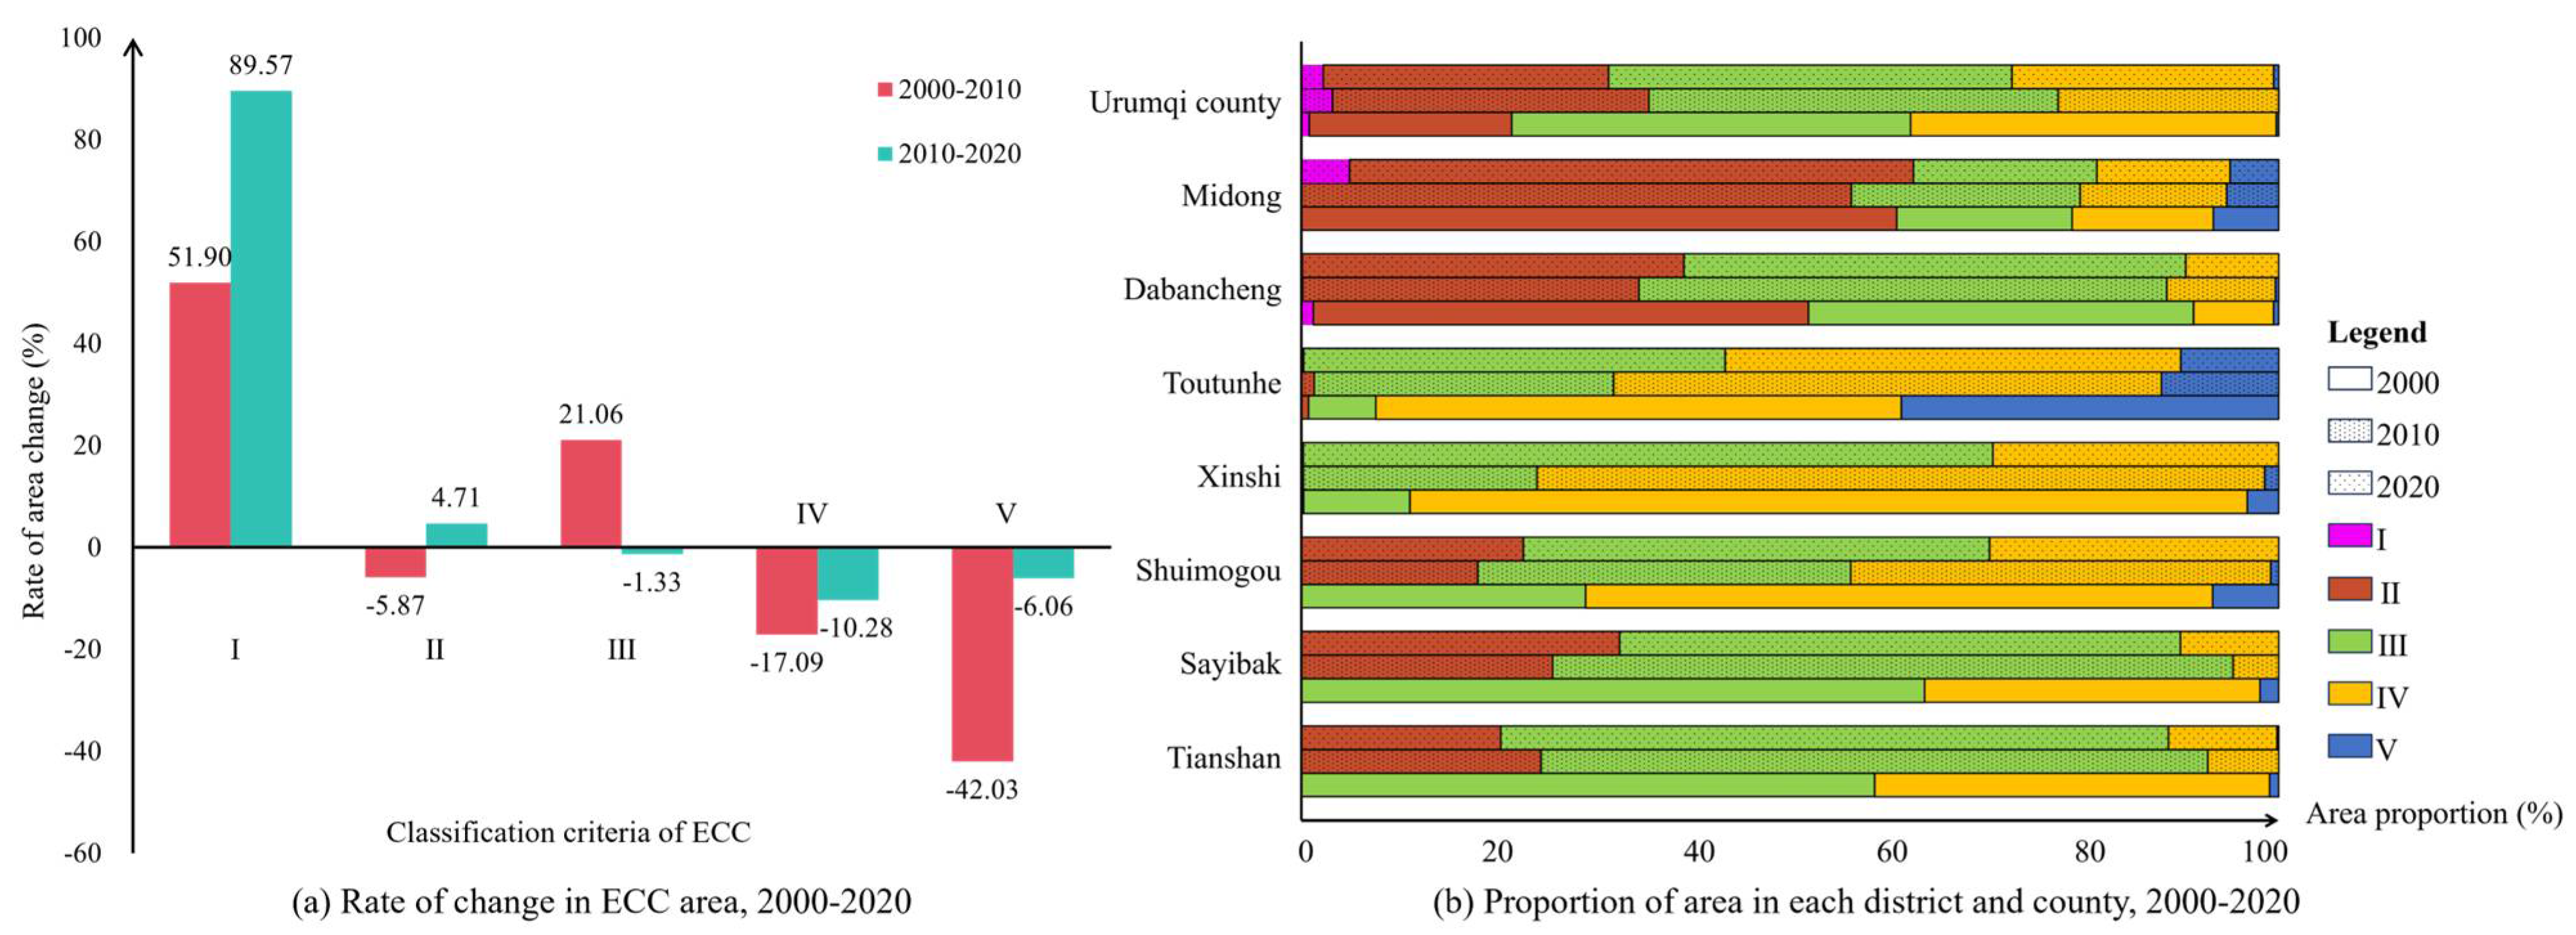
To analyze changes in the distribution of ECC in Urumqi, we calculated the rate of change across five levels (
Figure 8a). We also compiled statistics by administrative districts to assess ECC changes and understand regional distributions (
Figure 8b).
As shown in
Figure 8a, level I has a growth rate of 51.90% from 2000 to 2010, increasing to 89.57% from 2010 to 2020. This indicates that its ECC continues to rise without significant improvement, likely due to climate change. Level II decreases by 5.87% from 2000 to 2010 but rebounds by 4.71% from 2010 to 2020, resulting in an overall decline, though some improvement in ECC is evident. In contrast, level III increases by 21.06% from 2000 to 2010 but decreases by 1.33% from 2010 to 2020, showing a net increase. Levels IV and V both show a decline: level IV decreases by 17.09% and level V by 42.03% from 2000 to 2010, with further declines of 10.28% and 6.06%, respectively, from 2010 to 2020. This suggests that while levels IV and V continue to decline over the past 20 years, the rate of decline has slowed, especially for level V, reflecting the effectiveness of ecological protection policies.
Figure 8b shows that different districts and counties have different ECC changes over the 20 years. For Urumqi County, the proportion of ECC level III is always the highest during these 20 years, followed by levels IV, II, and I, while the proportion of level V is the lowest. This indicates that the ECC of the region is mainly dominated by level III. Notably, the increasing proportions of levels I and II suggest a decline in ECC. In Midong District, the ECC status is mainly characterized by level II. In 2020, the proportion of level I increased significantly, while the proportion of level V continued to decrease. This implies that there might be certain inadequacies in the local ecological protection measures. In Dabancheng District, level III has the highest proportion. The proportions of levels I and V decrease, and the proportions of the remaining levels increase only slightly. This indicates an improvement in the ECC of the area.
Toutunhe District has a relatively good ecological status among these regions. The proportions of levels III and IV are continuously increasing, although the proportion of ECC level V has decreased. This indicates that ecological protection in the area still needs to be further strengthened. In Xinshi District, levels III and IV predominate, with level I at the lowest. Level III is increasing, while IV and V are declining significantly, possibly due to local economic policies harming the ecology. Shuimogou District, Sayibak District, and Tianshan District show similar trends. Levels III and IV have the highest proportions, and II and III are increasing. However, IV and V are decreasing substantially, indicating that despite initial environmental improvement, ecologically favorable areas are deteriorating. Thus, protective measures must be adjusted and strengthened.
In terms of the change from 2000 to 2020, the proportion of the area in sub-regions I and II mostly decreased year by year, which indicates that the scope of the lower ecological level areas is shrinking. The proportion of levels III, IV, and V was increasing accordingly, which implied that the ecological environment was moving towards a better level and that the ECC was gradually improving. However, the magnitude and rate of change in each subregion varied among districts and counties due to the differences in natural geographic conditions and human activities, so it is necessary to explore the influencing factors in depth to support the formulation of ecological protection strategies.
4.4. Spatial Clustering of ECC Patterns in Urumqi
We calculated the global Moran’s I index for the Urumqi ECC, and the results are presented in
Table 7. All
p-values were less than 0.001, demonstrating statistical significance. This indicates that the ECC exhibits strong spatial autocorrelation and a distinct clustering phenomenon.
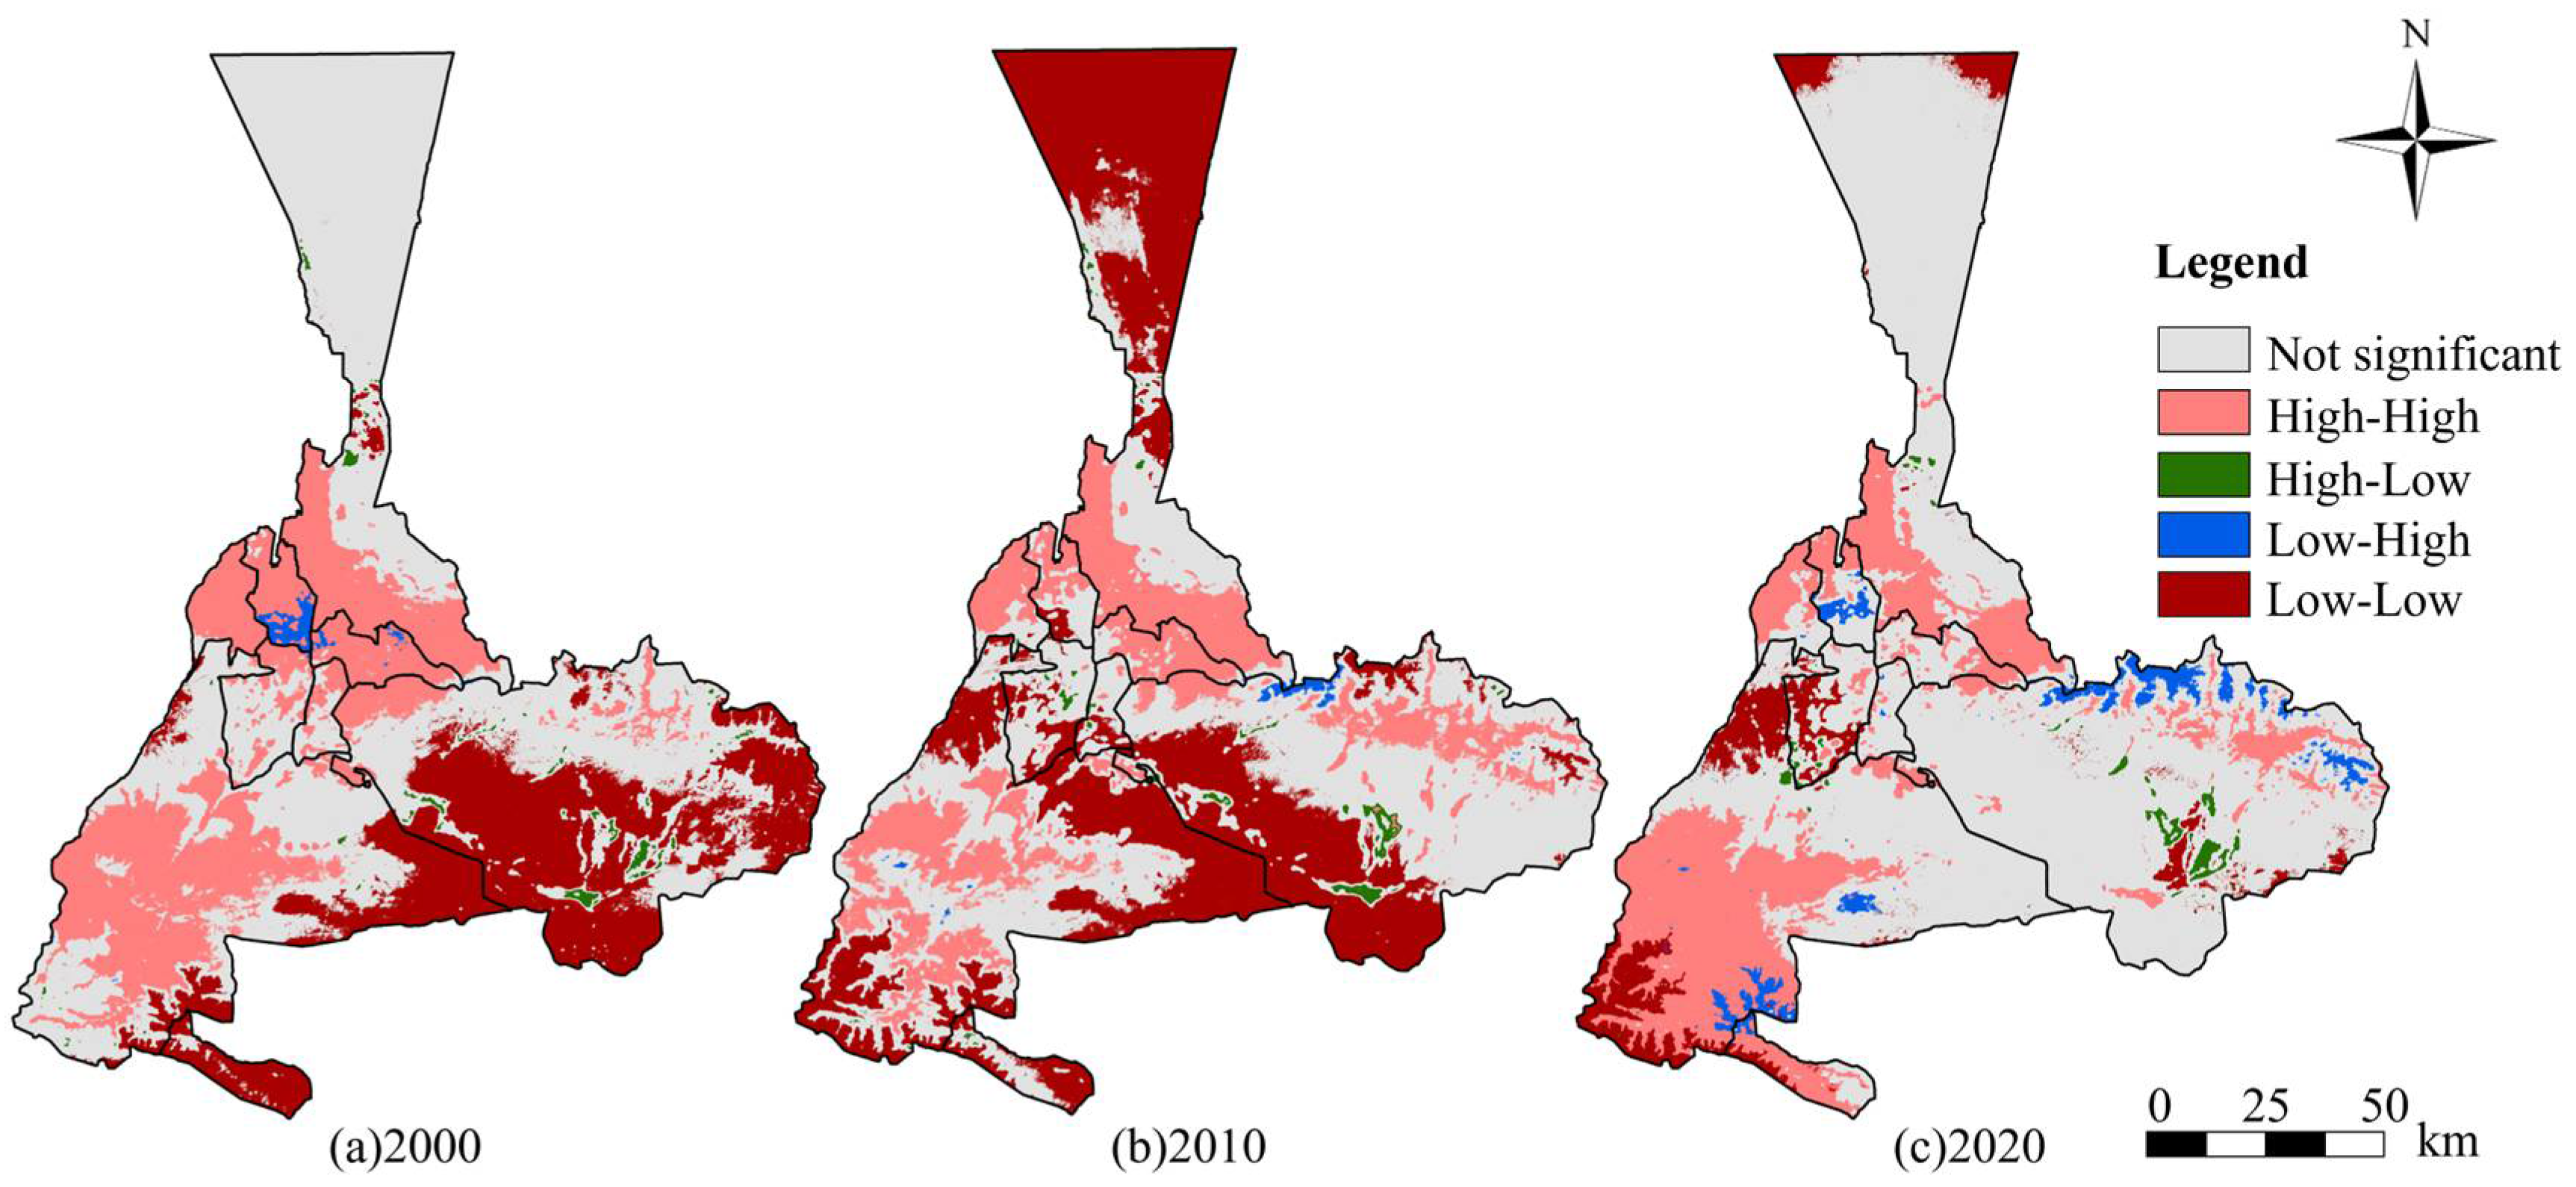
To better understand the spatial distribution of ECC in Urumqi, we conducted a cluster analysis (
Figure 9). Based on the analysis in
Figure 9, the ECC of Urumqi has witnessed substantial changes over the past two decades. High-high clustering areas are predominantly situated in the central plain and Urumqi County, indicating that these areas have excellent performance of ECC and show clustering.
The ECC of Urumqi County decreased from 2000 to 2010. This decline may be attributed to the expansion of construction land that occurred during the region’s economic development, which often overlooked ecological protection. However, starting in 2010, an ecological protection policy was implemented. As a result, the region has improved its ECC by focusing on the development of eco-tourism, along with agriculture, forestry, and animal husbandry. In contrast, the central plains, where arable and construction lands are concentrated and human activities are prevalent, have experienced a different trend. The increase in economic levels and the rapid pace of urbanization have led to changes in land use and the heat island effect. Consequently, there have been consistent declines in ECC and a decrease in high-high clustering in this area.
By 2020, high clustering in built-up areas continued to decline, while the southern part of Urumqi showed an upward trend. The rapid urbanization of these built-up areas has led to a decrease in land-use conversion ratios and the area of urban green spaces, intensifying the heat island effect and resulting in declining ecological conditions. However, the southern region, influenced by local policies, has actively developed the eco-tourism industry and placed greater emphasis on ecological protection, which has improved local ecological conditions. At the same time, the areas with low clustering decreased in both the Midong District and the Dabancheng District. Overall, the ECC of the built-up areas in Urumqi has been steadily declining, while the ecological condition in the southern areas has been improving. This demonstrates spatial heterogeneity in ecological condition changes within Urumqi. Despite improvements in certain regions, the Midong and Dabancheng districts continue to struggle with low ECC, primarily due to land degradation and urban expansion. Thus, even in areas that have made ecological progress, those with low ECC still require attention.
Low-low clustering indicates regions with poor ECC. In 2000, such areas were mainly situated in the southern part, including sections of Dabancheng District and Urumqi County, where severe soil desertification, induced by natural conditions, led to unsatisfactory ECC performance. Notably, in 2010, the northern part of Midong District, a desert area, experienced significant ECC deterioration due to arid climate and other adverse conditions. The southern part of Midong District witnessed a reduction and eastward expansion, influenced by the adjacent Tutunhe development zone, which focuses on manufacturing, causing a decline in ECC. In 2020, local ecological policies contributed to the continuous improvement in ECC in the southern part of Midong District.
4.5. Analysis of the Driving Factors of ECC
To further understand the key factors influencing changes in ECC, we selected the previous evaluation indicators as the independent variables and ECC as the dependent variable and conducted an analytical test of the drivers using geographic detectors (
Figure 10).
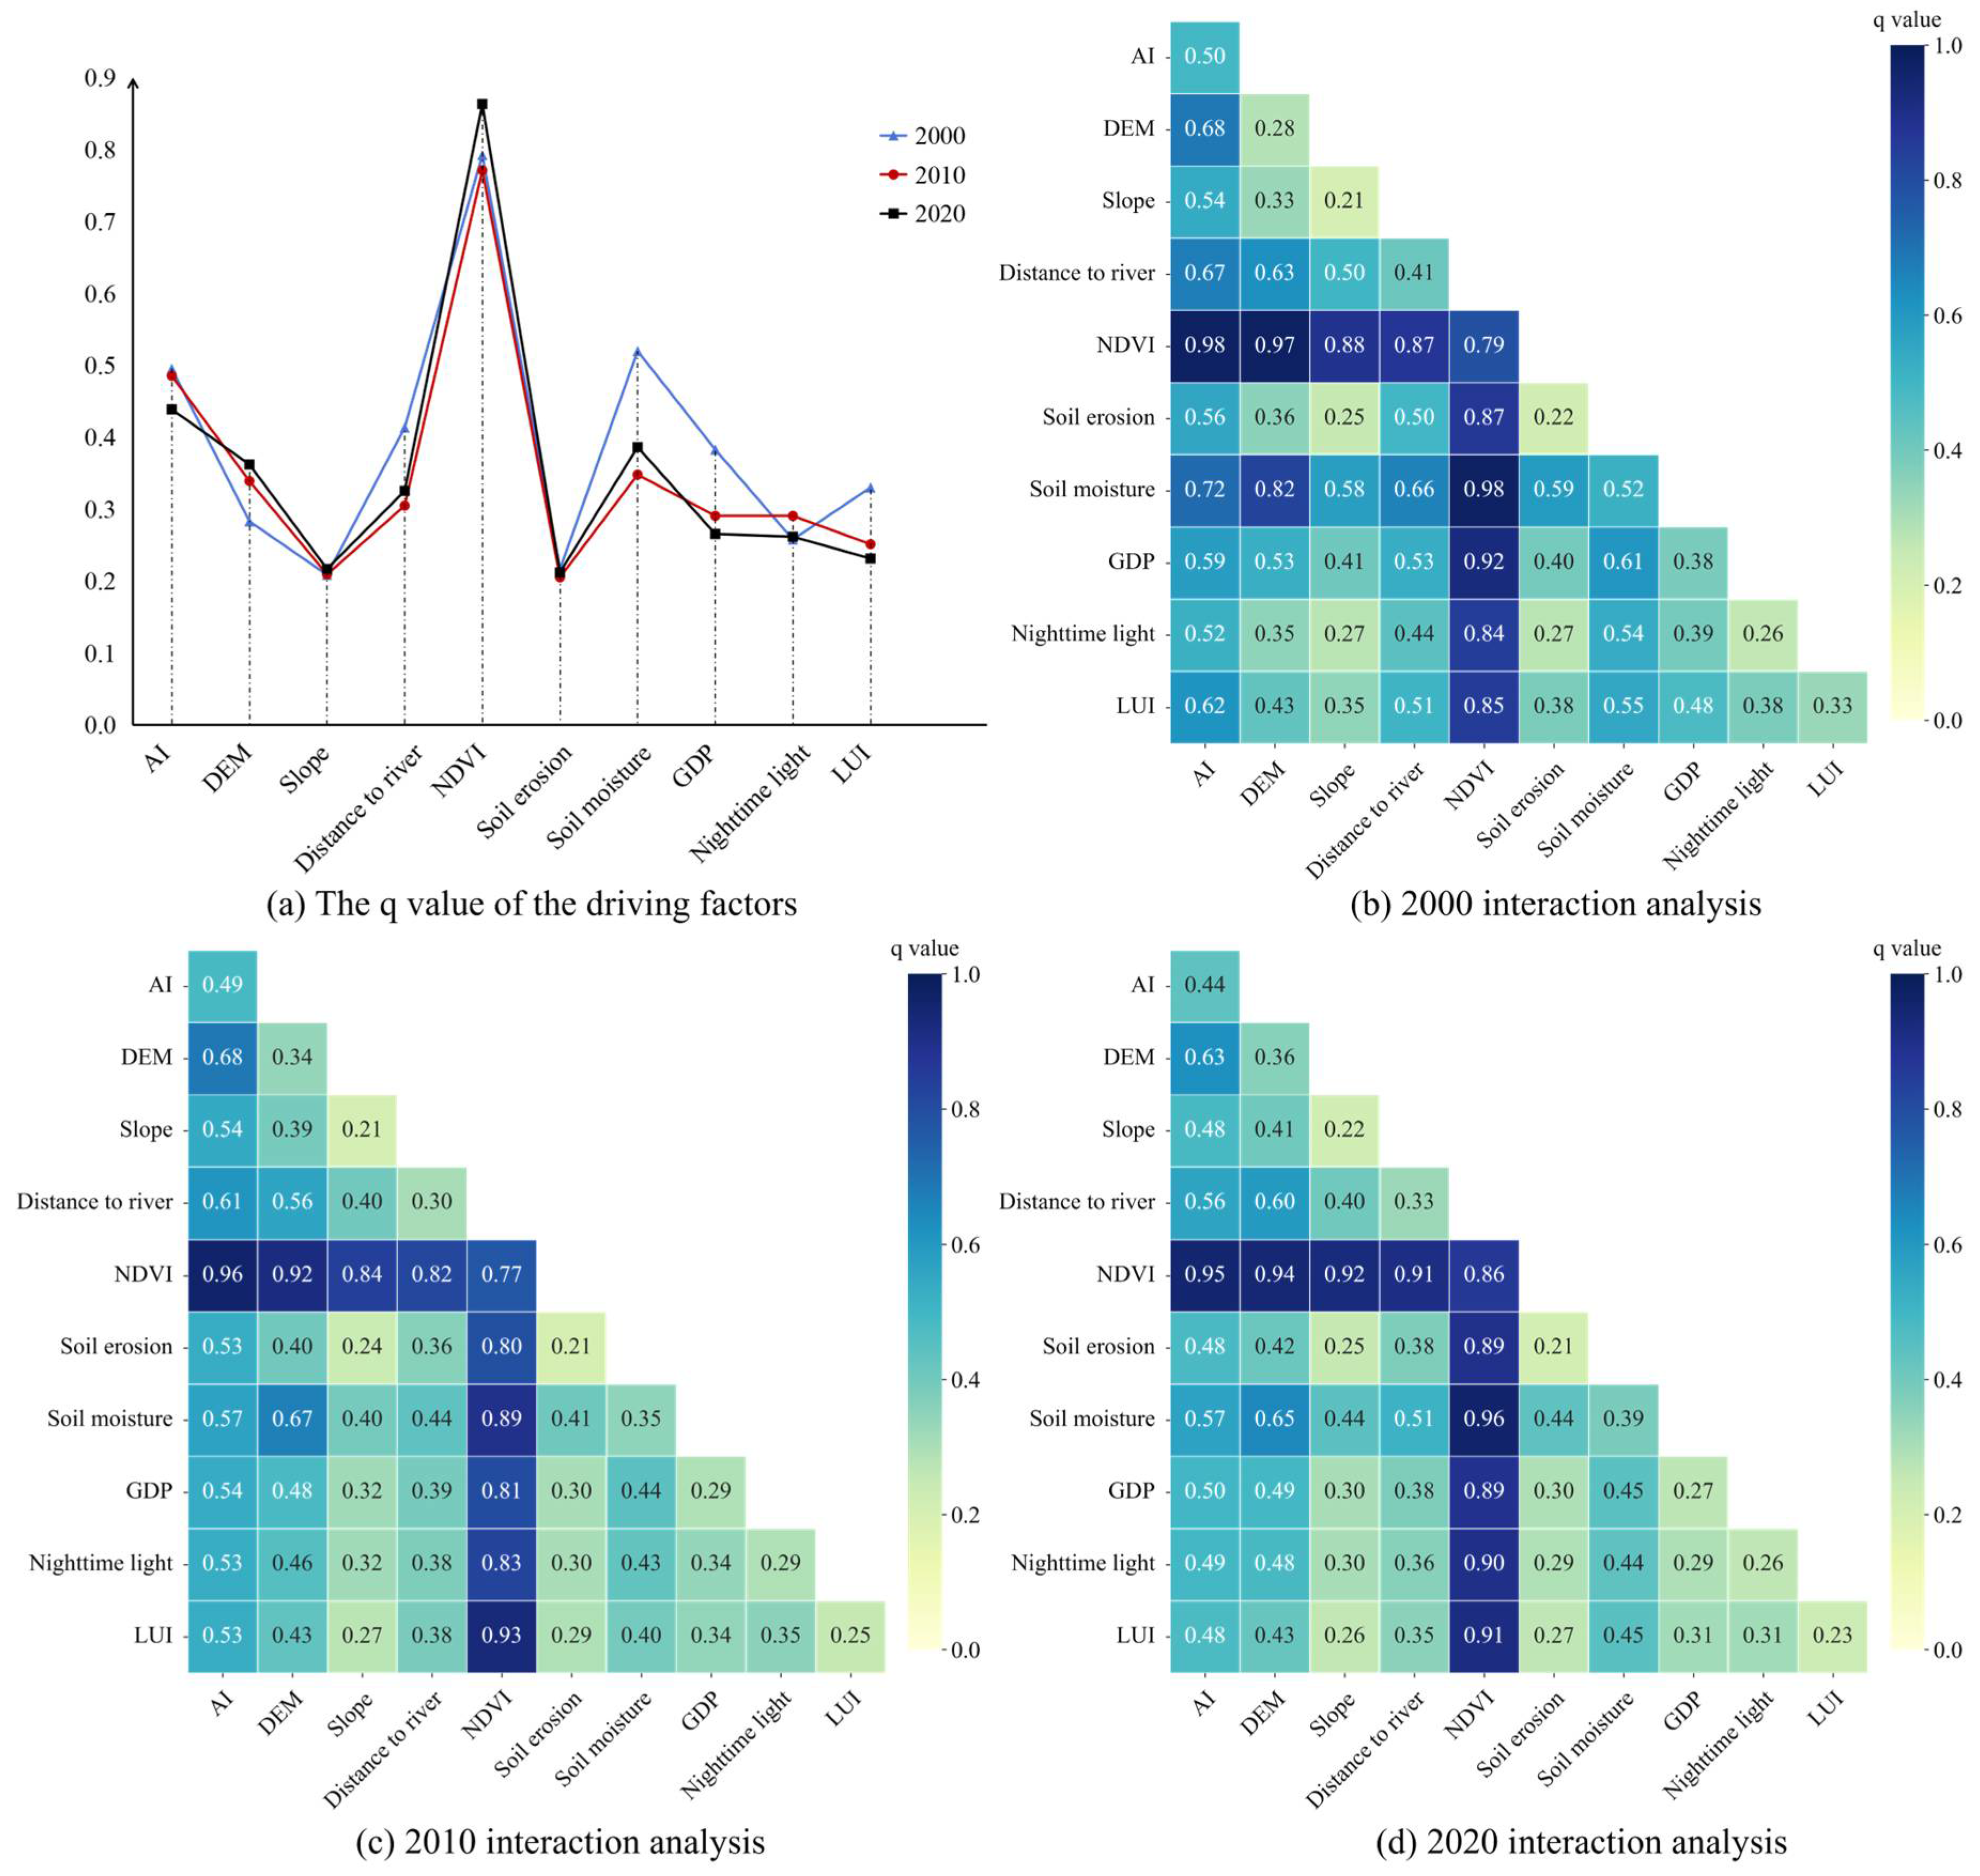
As shown in
Figure 10a, the core drivers of ECC changes in the study area from 2000 to 2020 were vegetation cover, as measured by the NDVI, soil moisture, and AI. The q value of NDVI consistently remained the highest (2000: 0.79; 2010: 0.77; 2020: 0.86), highlighting the dominant role of vegetation restoration or degradation on ECC. The distance to the river factor initially decreases before increasing again. This pattern suggests early influences from water conservancy projects, followed by a renewed emphasis on their importance during extreme climate events. Socio-economic indicators, such as GDP and population, are declining, which indicates a weakening of robust development models in urbanization. The stability of nighttime lights reflects the optimization of ecological spaces in urban areas. Additionally, declines in soil moisture and AI metrics point to the impact of climate change on the hydrological cycle. Furthermore, the low and stable soil erosion value may be connected to land-use changes, such as converting farmland back to forest. Overall, the region’s driving mechanisms have shifted from socio-economic dominance to a synergistic influence of nature and climate. Future planning should prioritize harmonizing ecological protection with climate adaptation.
Figure 10b–d illustrates the results of the interaction analysis of drivers in the study area from 2000 to 2020, highlighting the correlations between various factors and their effects on ECC. In 2000, the interaction q values for most factors ranged from 0.6 to 0.9. Notably, the interaction q value of the NDVI with other factors was significant, reaching 0.98 when combined with the AI. This indicates a strong interaction among the factors that collectively influence ECC. In the ECC ecosystem, vegetation growth is affected by climate factors and drought conditions, while drought conditions also impact climate and vegetation, creating a complex network of interactions.
In 2010, the interaction q values of some factors changed. For example, the interaction q value of NDVI and AI increased to 1.03, while the interaction q value of AI and temperature rose from approximately 0.66 to 0.68. These changes adjusted the interaction relationships among the factors and altered the overall influence pattern on ECC. On one hand, this can be attributed to local ecological protection policies that improved vegetation’s drought survival conditions, enhanced drought tolerance, and increased the interaction between NDVI and AI. On the other hand, rapid urbanization shifted land use, converting natural land into construction land, which destroyed vegetation and made it more susceptible to drought damage. This negatively impacted NDVI.
In 2020, the interaction q values of certain factors differed from those in the previous two years. For instance, the interaction q value of NDVI and soil moisture was about 0.96, while the interaction q value of soil moisture and DEM decreased from 0.58 to 0.44. This indicates that factor interactions evolved dynamically, altering their combined effects on ECC. The reason for this change lies in the new ecological protection policy, which focuses on ecosystem integrity and the sustainable use of resources. This has led to land-use changes associated with urbanization, emphasizing eco-efficiency and the rational planning of urban green spaces and ecological areas, further adjusting factor interactions. Moreover, the increasing impacts of climate change and extreme weather events pose greater challenges to ecosystem stability, prompting adaptive changes in factor interactions to address the new environmental challenges.
5. Discussions
5.1. Selection of ECC Evaluation Indicators
In the process of establishing an ECC assessment model tailored to the arid city of Urumqi, the selection of evaluation indicators assumes paramount importance. In this study, with a focus on the distinctive ecological issues of arid areas, a multidimensional evaluation index system was developed for the ECC assessment of Urumqi. This system was constructed based on four key dimensions: climatic characteristics, natural environment, soil characteristics, and socio-economic factors.
Currently, many traditional indicator systems for assessing ecological conditions in drylands are relatively simplistic. These systems often focus on a single factor, such as water resources or vegetation cover, by themselves [
62,
63]. This single-factor approach fails to adequately capture the complex ecological processes in arid areas and tends to overlook the interactions between various ecological elements and human activities. As a result, this can lead to an incomplete understanding of ecological conditions and yield inaccurate assessments. While it is true that some more complex comprehensive indicator systems exist, they also have limitations. Notably, they often do not take into account the unique ecological characteristics of arid areas, such as AI applications and soil moisture levels [
15,
64]. In contrast, the indicator system of this study fully incorporates these crucial factors, allowing for a more precise reflection of the actual ECC in arid areas.
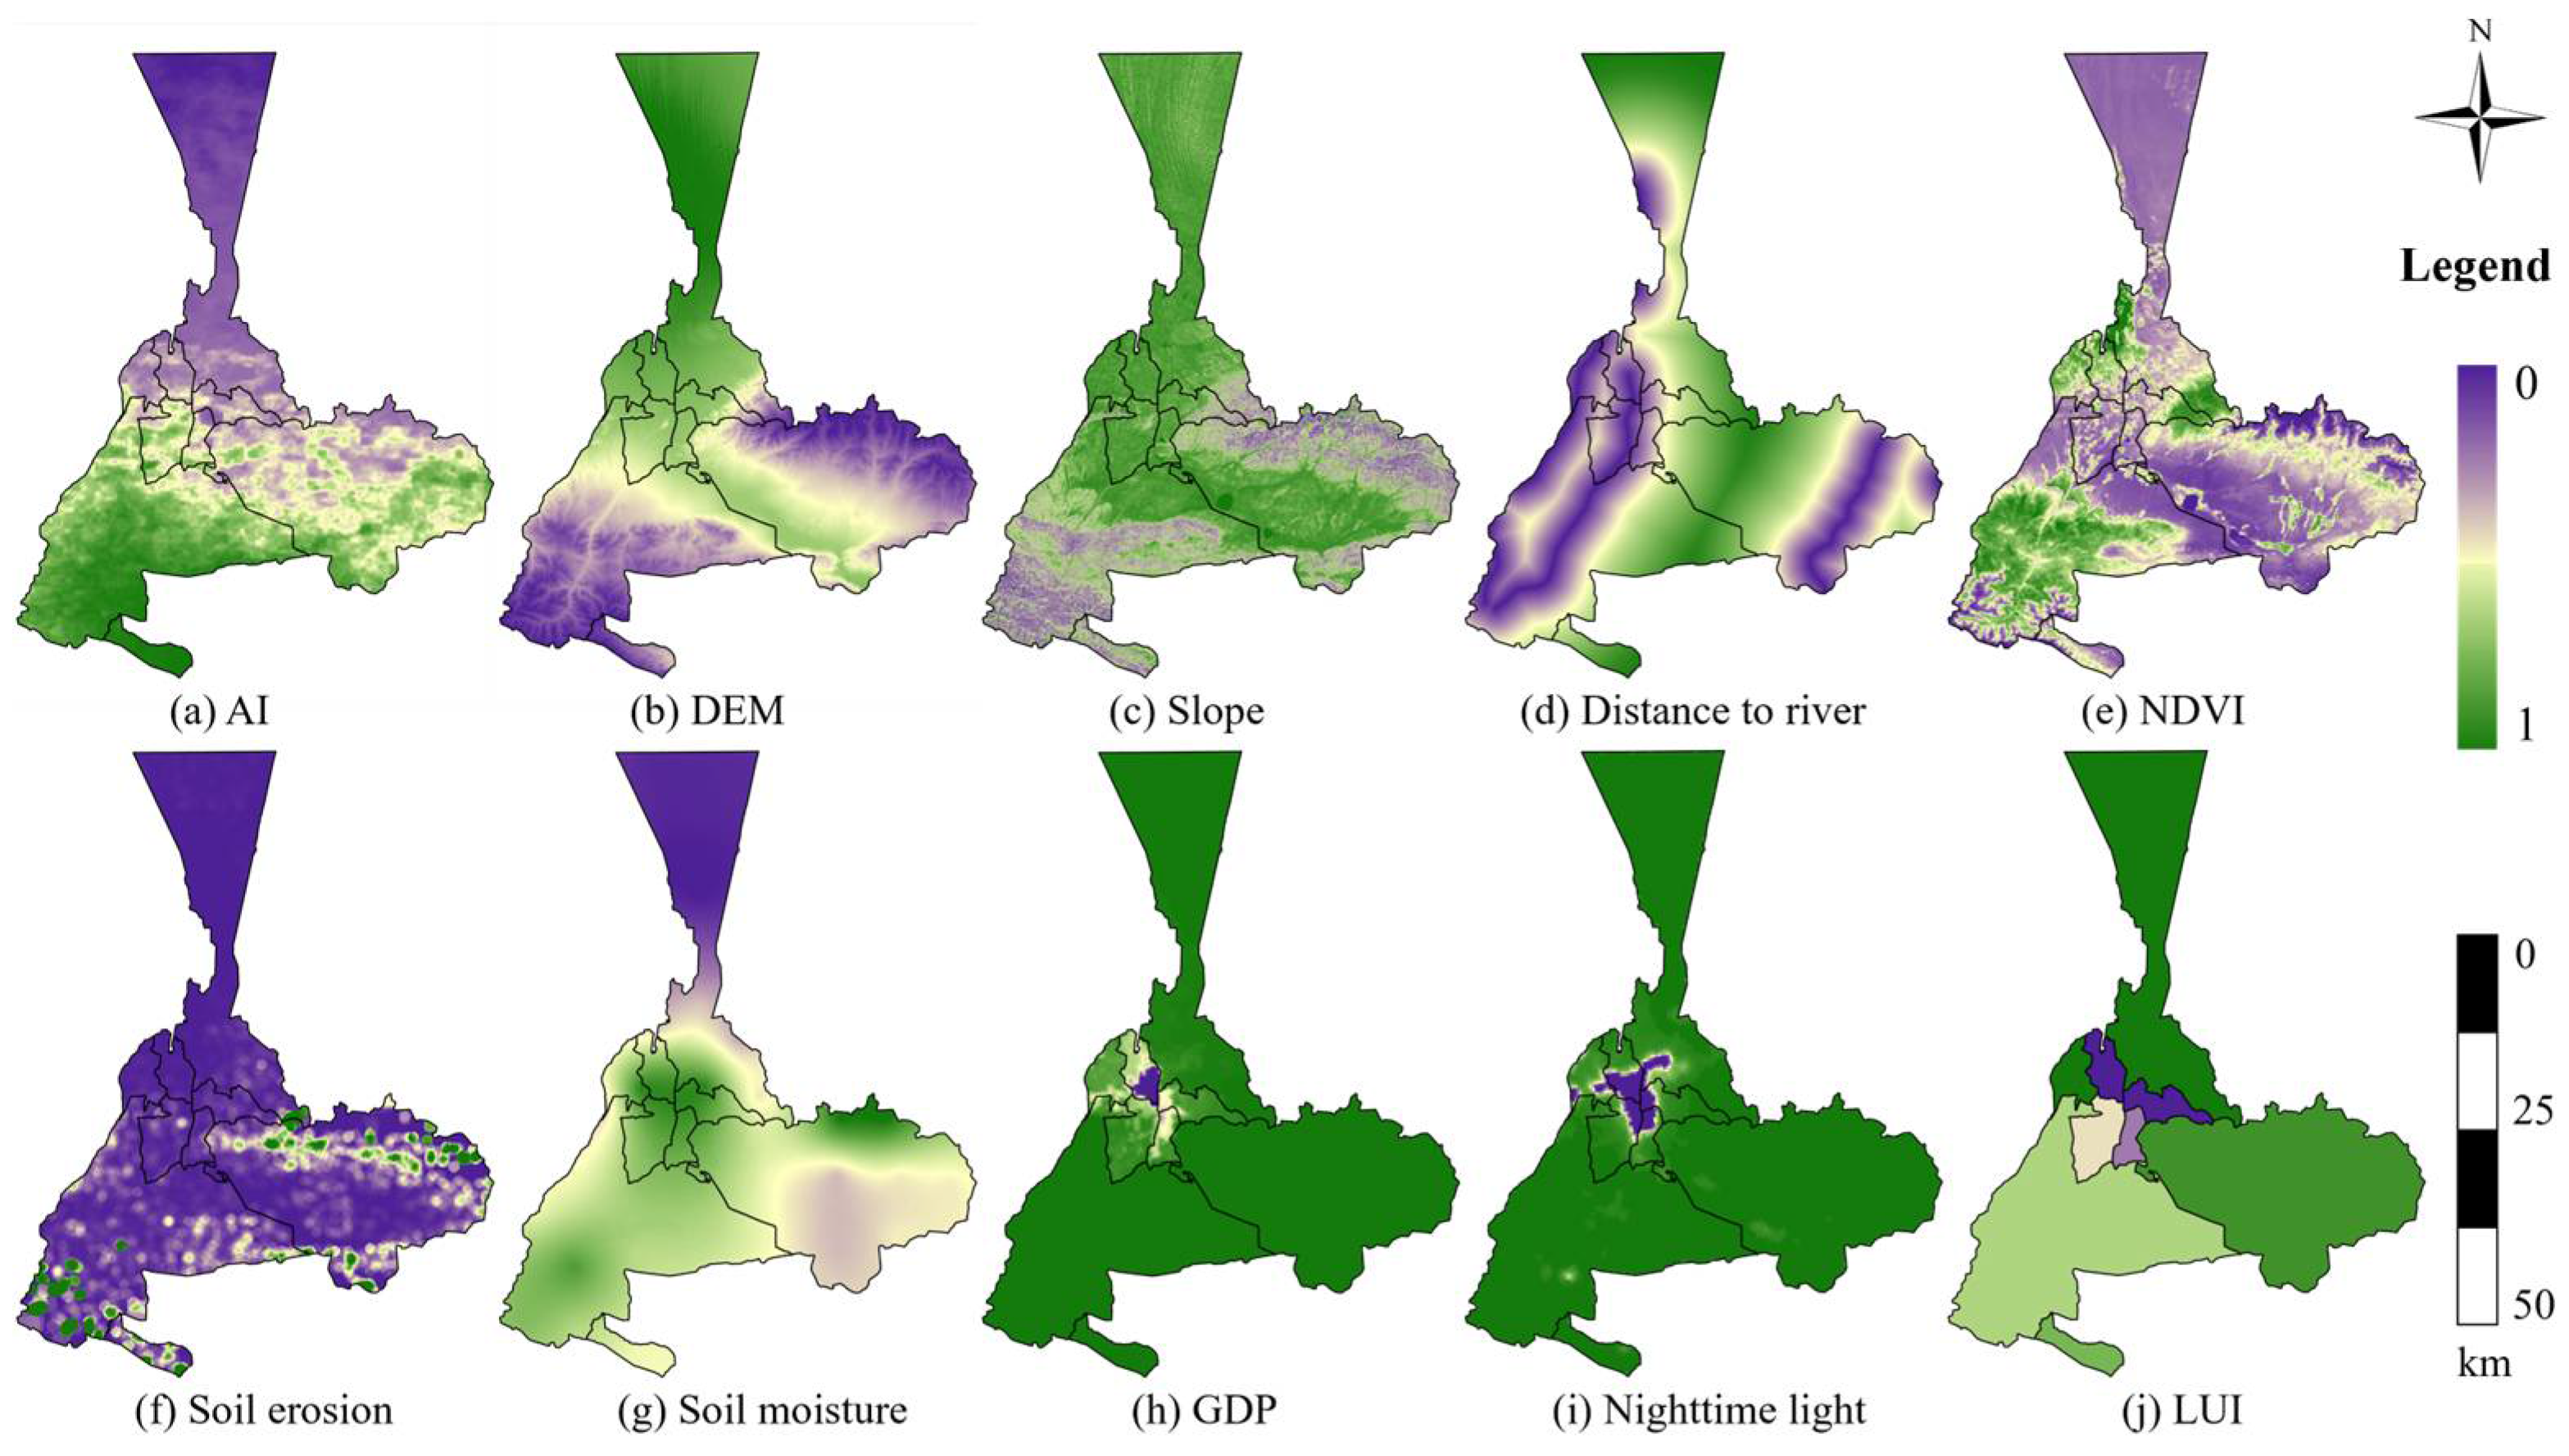
Regarding climatic characteristics, the AI, temperature, and precipitation were identified as the key indicators. These indicators serve to illustrate the impact of climate change on ECC. As demonstrated by previous research [
65,
66], extreme climate change in arid areas can exert a significant influence on ECC. The findings obtained from our research indicate that precipitation exhibits a positive correlation with ECC, while temperature and the AI are negatively correlated, which is consistent with existing literature.
Turning to the natural environment, indicators such as the DEM, slope, and distance from the river were incorporated. These factors are directly associated with soil and water conservation as well as vegetation cover. As indicated by the research [
62,
63],4, the terrain complexity and water resource distribution are significant natural factors affecting ECC. Specifically, it has been found that DEM and slope are negatively correlated with ECC, whereas NDVI is positively correlated. This implies that robust vegetation has a positive contribution to ECC.
Soil quality is of vital significance for plant growth and land-use efficiency. Soil erosion is one of the main factors leading to a decline in ECC [
67,
68]. As for socio-economic factors, variables including GDP, population density, and night-light intensity were selected. Uzunali and Yazici found that the level of economic development and the frequency of social activities have a substantial impact on ECC [
69]. The intensity of socio-economic activities affects the level of resource consumption and environmental pollution [
70].
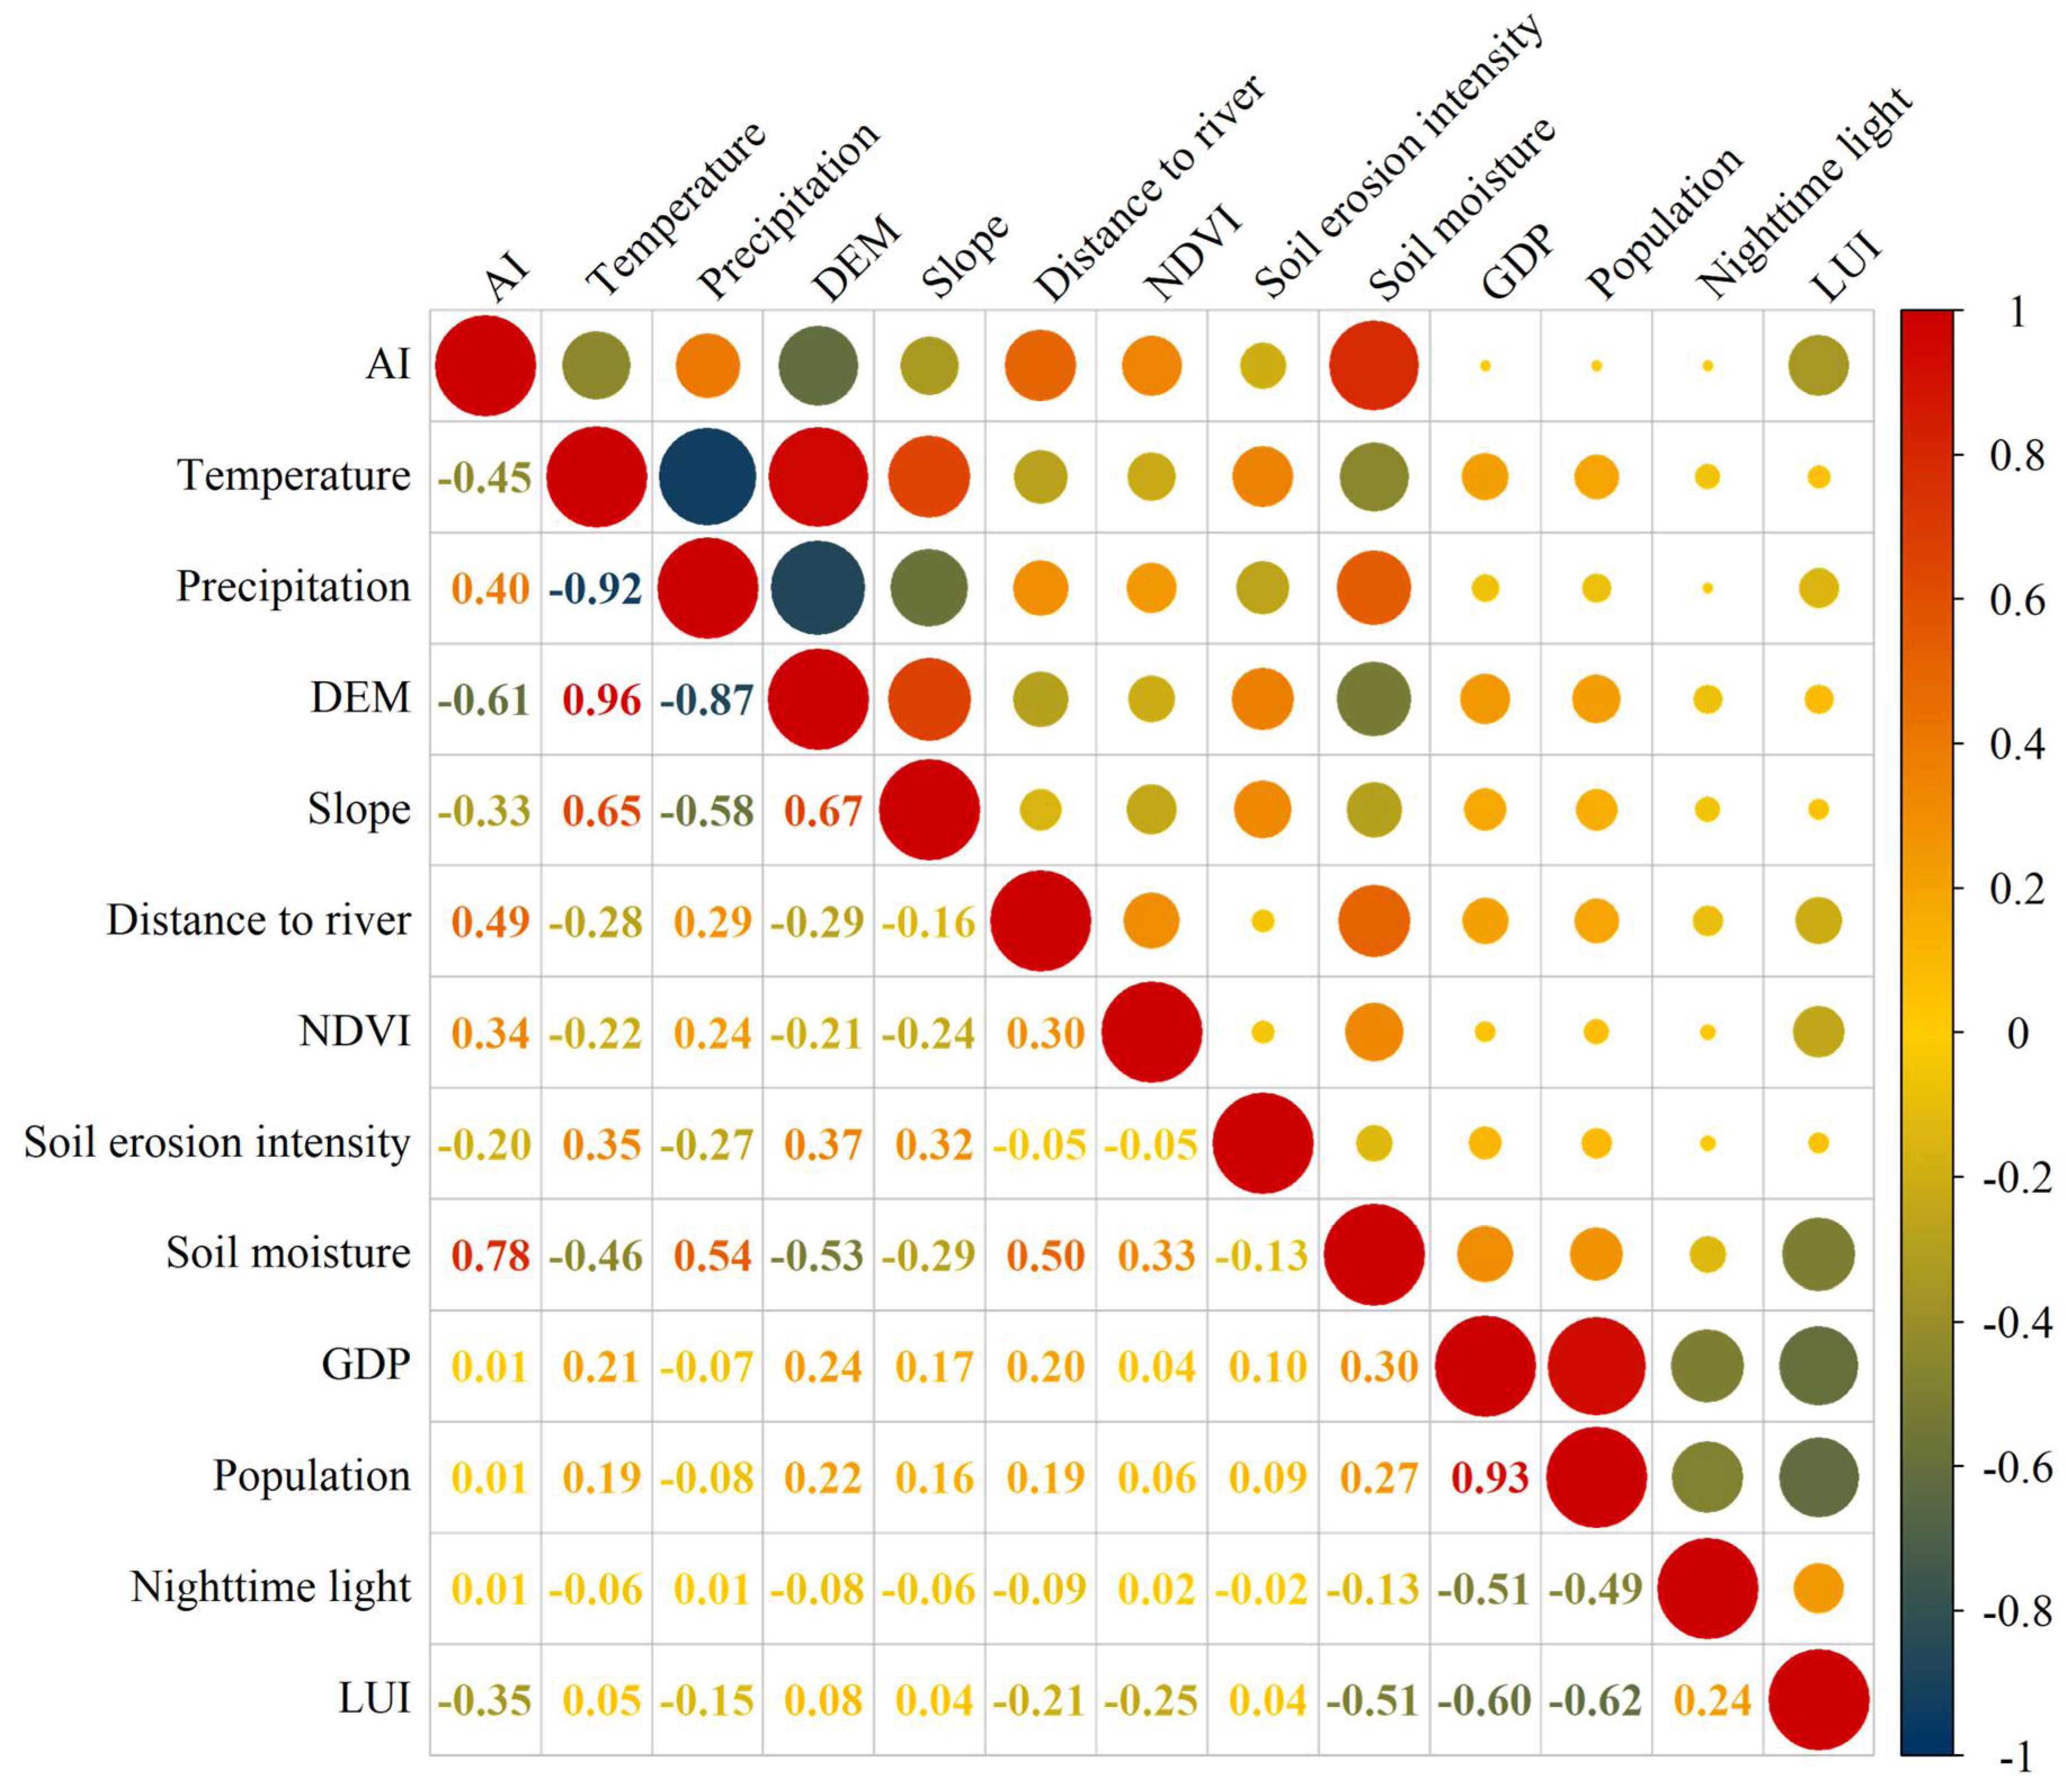
By analyzing the Pearson correlation coefficients among these indicators, ten indicators for ECC assessment were finalized. This process not only ensures the validity and independence of the selected indicators but also helps to circumvent the issue of multicollinearity, thereby enhancing the reliability of the assessment results.
5.2. Methodology for the Weighting of Indicators
In a multi-criteria comprehensive evaluation system, the weighting of indicators is crucial as it determines their relative importance within the evaluation framework. A rational weighting method accurately reflects each indicator’s contribution to the evaluation objective, thereby enhancing the scientific validity and reliability of the results [
71]. Currently, methods for weighting indicators can be broadly classified into subjective and objective [
72].
Among the subjective methods, the AHP is widely used [
73]. This method is characterized by its systematic approach, which effectively addresses hierarchical and structural problems by integrating qualitative and quantitative analyses [
74]. In practice, AHP constructs a hierarchical model that allows experts to make comparative judgments regarding the relative importance of elements at different levels, thus determining their respective weights. However, this method heavily relies on expert judgment, and assessment discrepancies can lead to unreasonable weight assignments.
Objective weighting methodologies encompass techniques such as principal component analysis and the entropy weighting method [
75]. Principal component analysis serves to convert multiple correlated indicators into a limited number of uncorrelated principal components, thereby effectively mitigating issues of multicollinearity and redundancy [
76]. Nonetheless, the principal components derived from this analysis are linear combinations of the original indicators, which can complicate their practical interpretation and present challenges for decision-makers. In contrast, the entropy weighting method autonomously allocates weights based on the variability of the indicator data, thereby eliminating subjective bias and promoting objectivity and fairness [
77]. However, this method is exclusively dependent on data dispersion, which may result in the neglect of the intrinsic significance of the indicators within real-world applications.
In light of the advantages and disadvantages associated with different methodologies, we have chosen to implement the AHP-EW model for indicator weighting. This model integrates the merits of both subjective and objective methodologies. It harnesses expert insights to capture the practical relevance of the indicators while simultaneously employing objective data for the computation of weights. This dual methodology effectively mitigates the shortcomings inherent in relying on a singular approach, thereby yielding a more holistic representation of each indicator’s status within the evaluation framework and enhancing the precision of the results.
5.3. Suggestions
Based on this study on the ECC of arid areas, although the AHP-EW model has achieved some results, there is still much room for optimization. This study faces some limitations regarding data acquisition, particularly in remote areas where the accuracy and completeness of data need improvement. These limitations may introduce bias in the assessment of ecological conservation challenges, affecting the precise formulation of conservation strategies. In future research, we should consider utilizing advanced monitoring technologies, such as remote sensing satellites and drones, for data collection. Moreover, employing multi-source data fusion methods will enable us to integrate various types of data, thereby enhancing data quality and improving the reliability of research findings in arid areas.
In constructing an evaluation index system for arid ecosystems, existing indicators must be enhanced to reflect the unique and complex nature of these ecosystems. It is crucial to incorporate additional metrics that capture the ecological characteristics of arid areas, such as the soil wind erosion modulus. This modulus directly indicates the extent of wind-induced soil erosion and is vital for assessing the risk of land degradation. Additionally, the frequency of sandstorms, a meteorological phenomenon specific to arid areas, serves as another important indicator closely linked to changes in ecological quality.
Improvements can also be made to the AHP-EW model itself. First, the AHP-EW model should be compared with other advanced weighting methods, such as fuzzy hierarchical analysis and gray relational weighting. This cross-validation will facilitate a comprehensive examination of the strengths and weaknesses associated with various methodologies for assessing ECC in arid areas. It aims to refine the combination coefficients for both subjective and objective weights within the AHP-EW model. Additionally, the incorporation of ecosystem service valuation techniques into the AHP-EW model proves advantageous. Specifically, by quantifying the economic benefits derived from ecosystems, the evaluation of ecosystem services enriches the overall depiction of ecosystem value within the assessment model and reinforces the scientific basis for the weighting procedure.
When formulating policies for the ecological sustainable development of arid areas, governments at all levels are advised to:
- (1)
Set up a Monitoring and Early Warning System: Evaluate the significance and sensitivity of key indicators like vegetation coverage and climate change. Leverage big data for real-time monitoring and analysis and define scientific thresholds. Trigger immediate warnings and activate emergency plans upon abnormal indicator readings.
- (2)
Carry out Differentiated Protection: In ecologically fragile areas with low carrying capacity, such as desert interiors, ban non-essential development activities like mining and large-scale farming. In areas with stable ecology and high carrying capacity, encourage the development of characteristic ecological agriculture and ecotourism while strengthening supervision.
- (3)
Boost Urban Ecological Development: Plan cities in arid areas scientifically. Utilize idle land to expand urban green spaces, choose drought-resistant plants, and build ecological corridors.
- (4)
Intensify Water Resource Conservation: Promote water-saving irrigation methods like drip and sprinkler irrigation to increase agricultural water efficiency. Also, establish an ecological compensation mechanism to compensate regions and residents whose development is limited by ecological protection and spur all parties’ enthusiasm for ecological protection.
6. Conclusions
We constructed an AHP-EW method based on the combination of AHP and the entropy weight method to assess spatiotemporal ECC patterns and provide data support for regulation measures. Compared with earlier used AHP methods, our AHP-EW method considered important indicators, including land use, vegetation, soil, location, topography, climate, and socio-economics, and synthesized both subjective weighting and objective weighting methods. In Urumqi, NDVI, soil moisture, and drought intensity were the most important indicators affecting the ECC pattern, accounting for about 65% of the total weight. Temporally, the ECC in Urumqi shows an overall decreasing trend, with a decreasing rate of 19.05% from 2000 to 2010 and a decreasing rate of 14.12% from 2010 to 2020. Regionally, the ECC patterns of the districts and counties differ significantly. Midong District, Dabancheng District, and Urumqi County have relatively poor ECC, while Toutunhe District has a better ECC condition.
In the future, in addition to expanding the assessment scale, in-depth studies should focus on analyzing the impacts of climate change, land-use conversion, and policy interventions on ECC. It is also important to predict the developmental trends of ECC and to promote the integration of multidisciplinary research. Additionally, to better address upcoming ecological challenges, predictive analyses of climate change and land-use changes should be conducted. For instance, climate models can be used to forecast future climate trends, while remote sensing data can track land-use changes, enabling the implementation of proactive ecological protection measures.


