

Investigating the Spatiotemporal Dynamics of Campus Surface Heat Island with High-Resolution Thermal Infrared Imaging

Abstract
1. Introduction
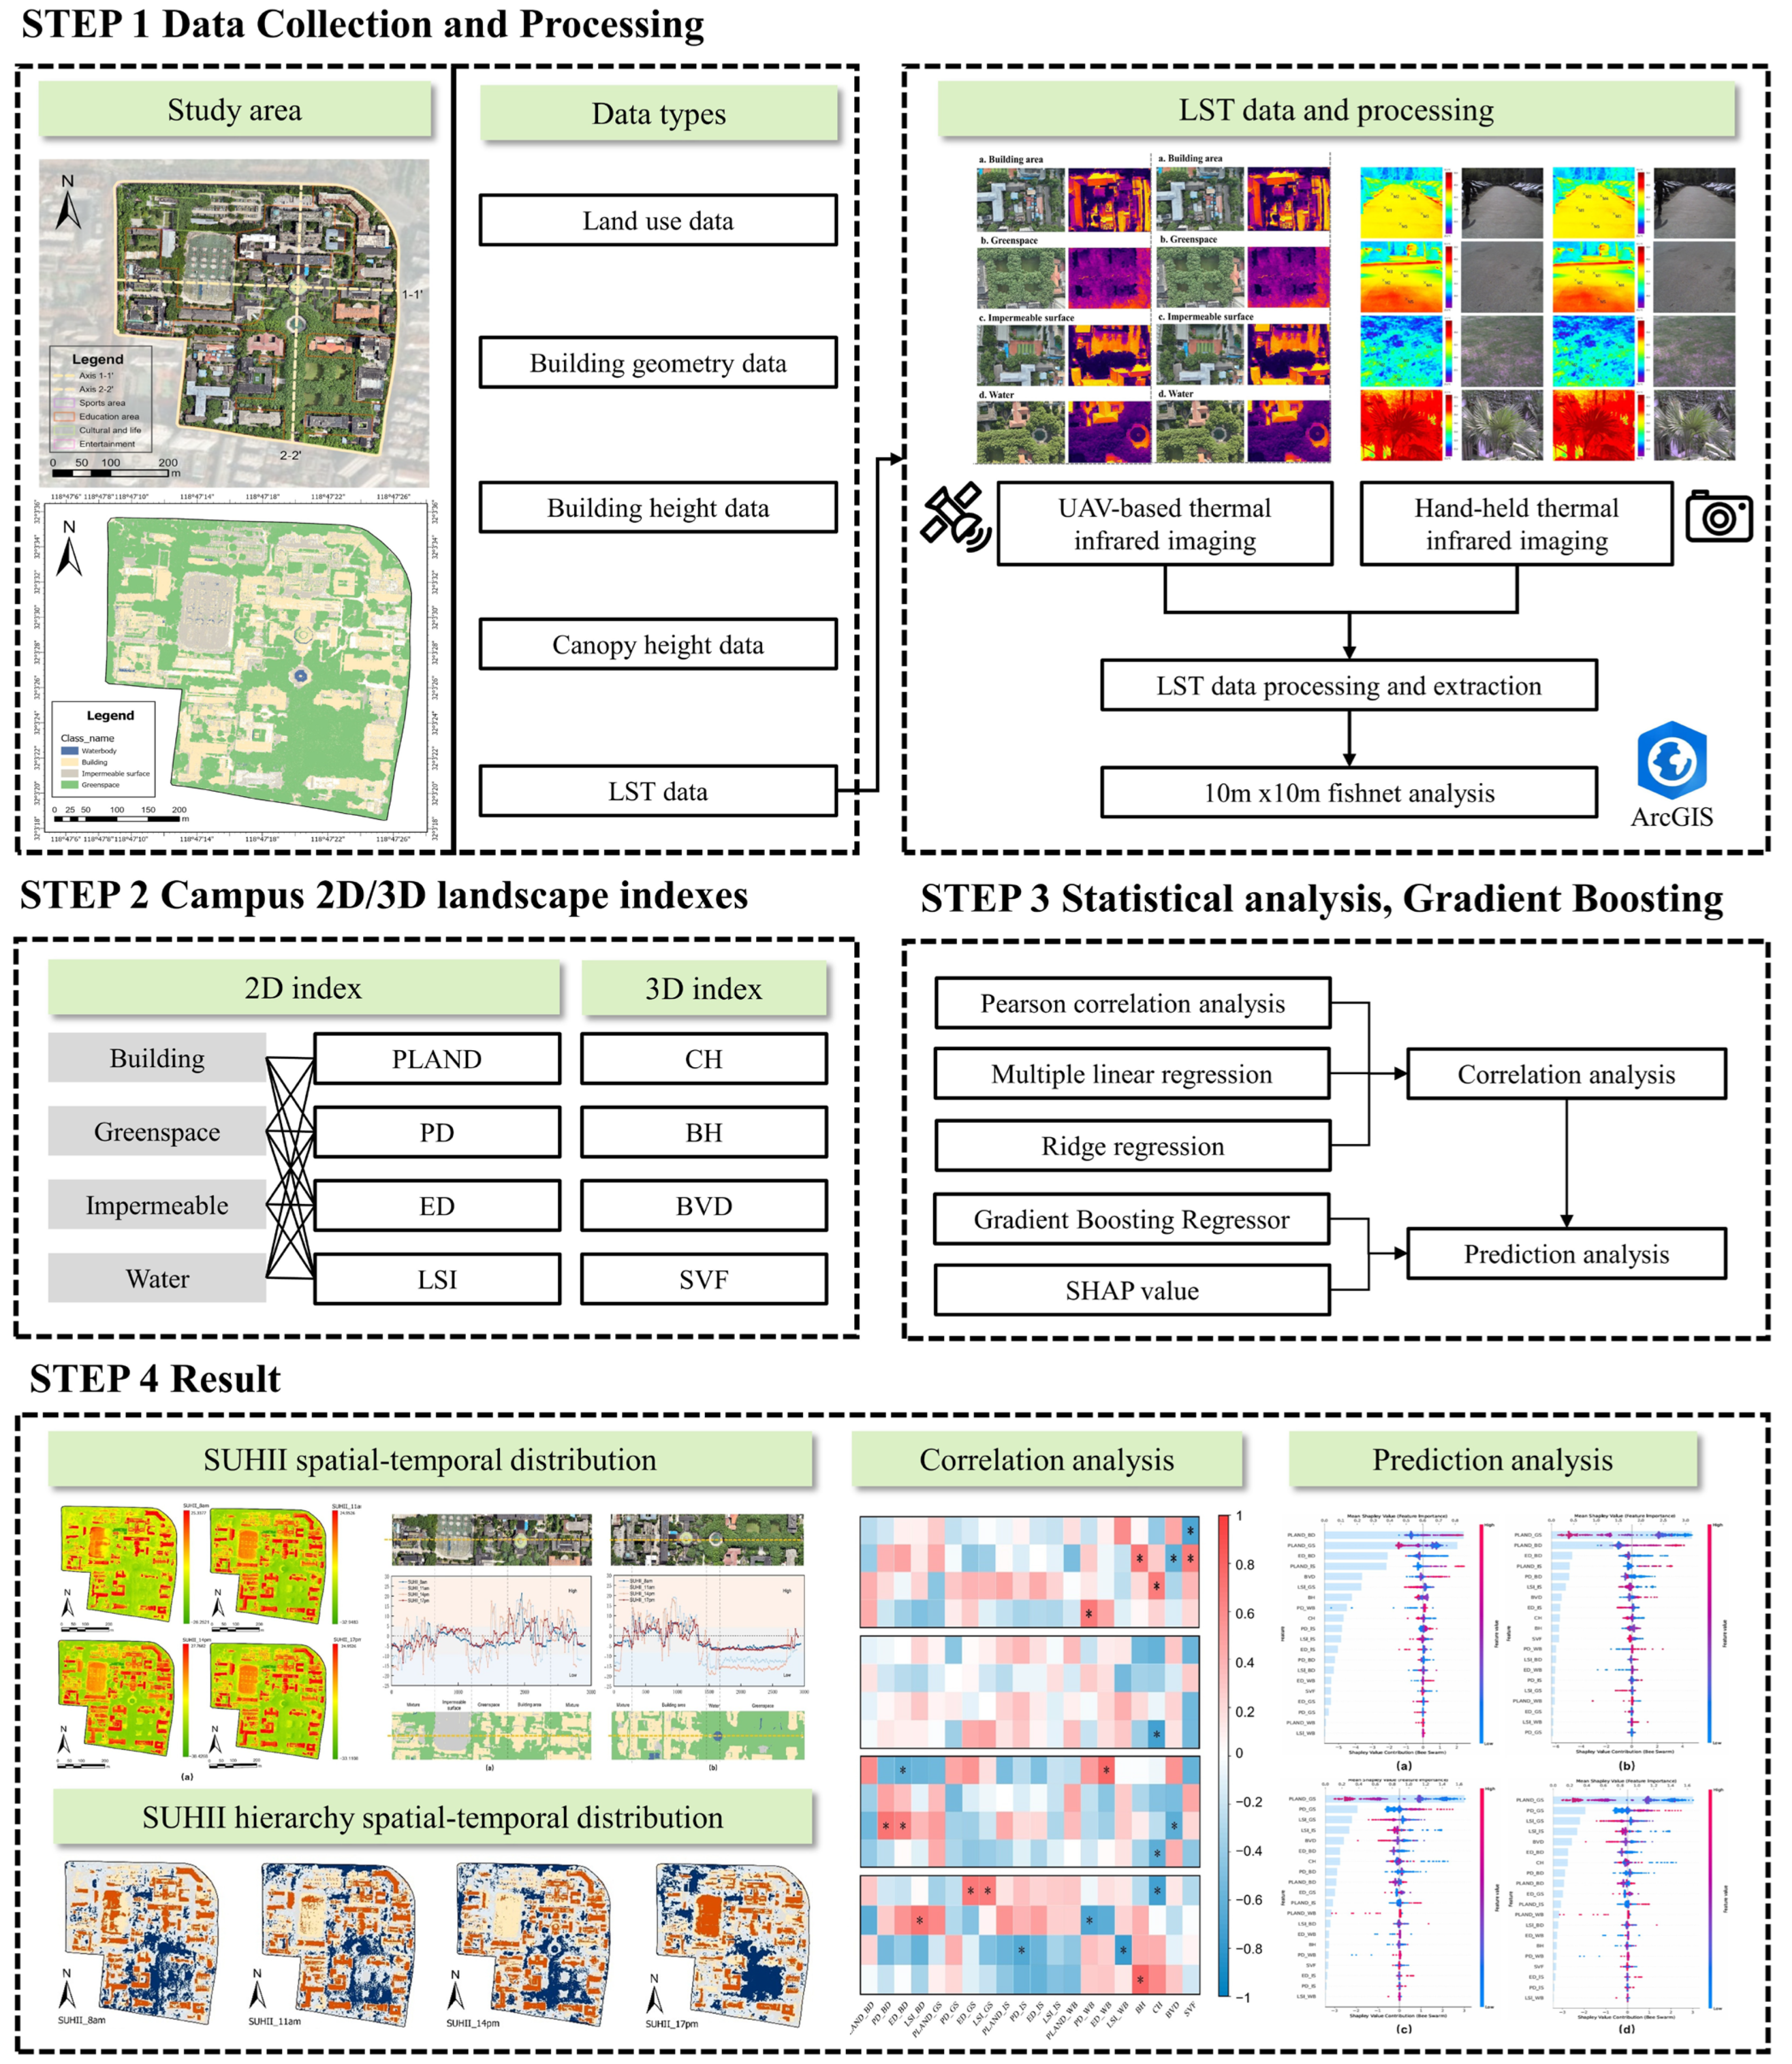
2. Materials and Methods
2.1. Study Area
2.2. Data Collection
2.3. Methods
2.3.1. High Resolution Thermal Infrared Imaging
- (1)
- UAV-based thermal infrared imaging
- (2)
- Handheld thermal infrared imaging
2.3.2. LST Processing and Extraction
- (1)
- Surface temperature conversion
- (2)
- Emissivity correction
- (3)
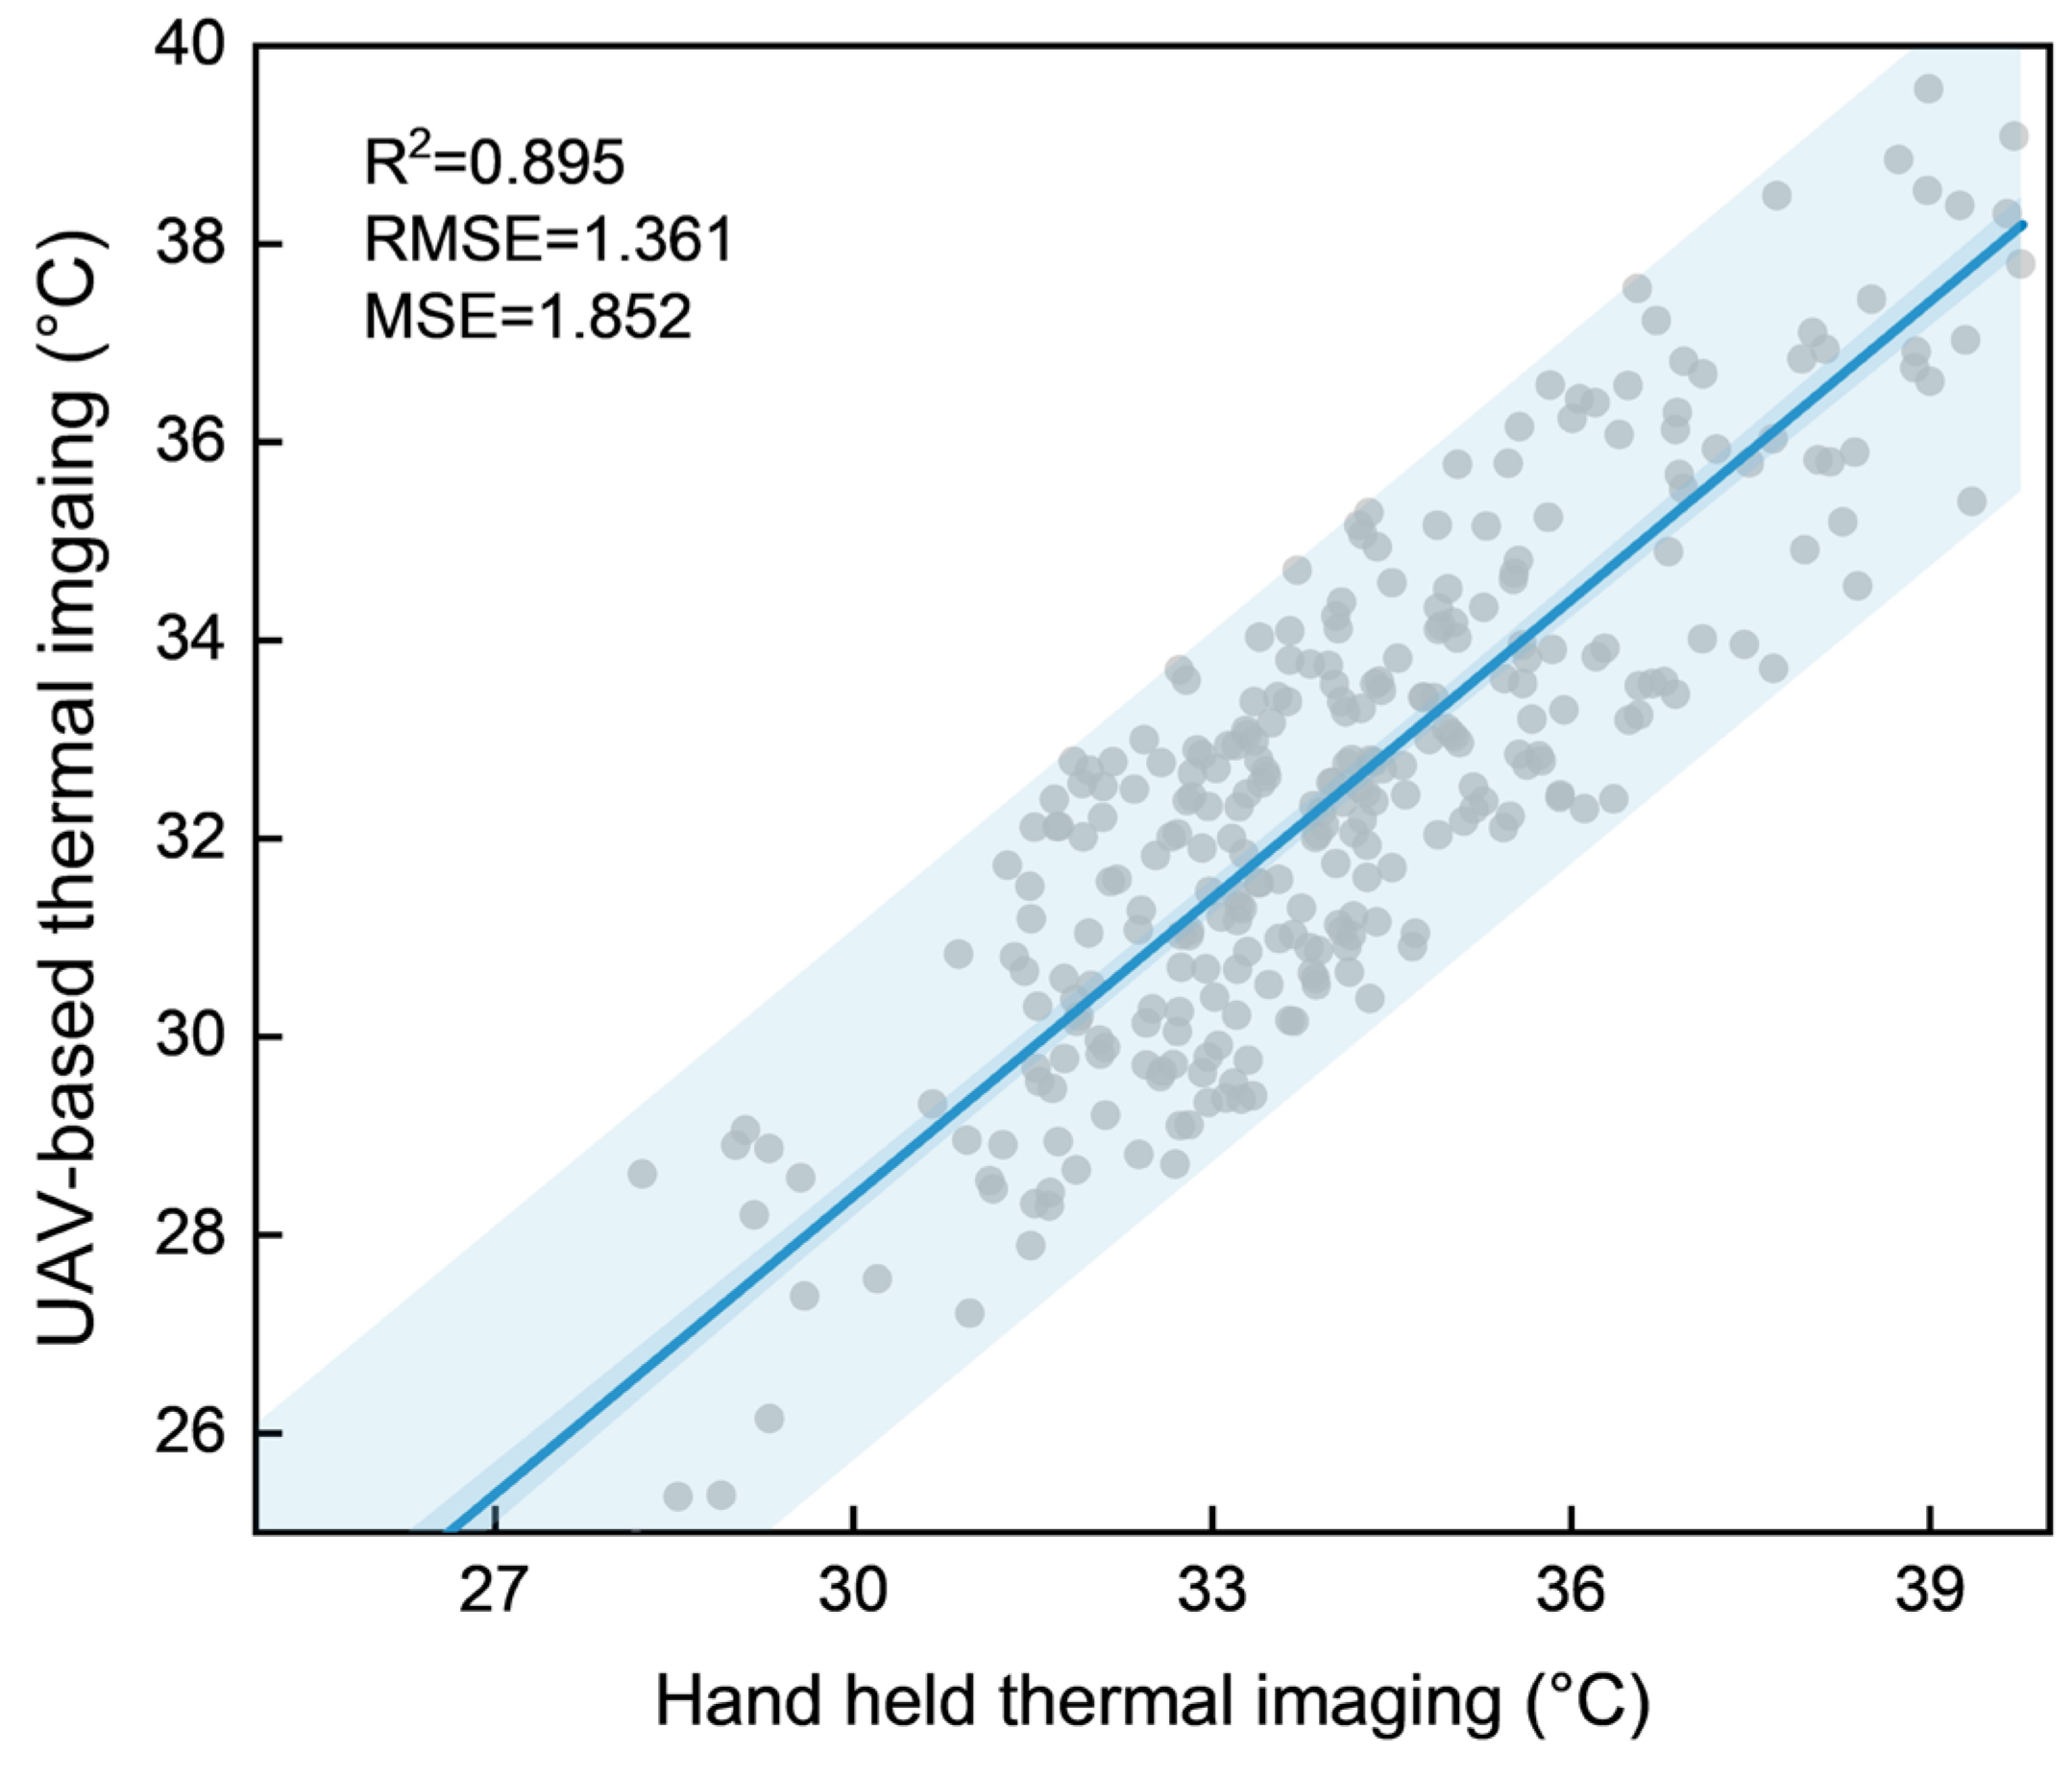
- Accuracy Verification
2.3.3. Campus 2D/3D Landscape Indicators
2.3.4. Evaluation of Surface Urban Heat Island
2.3.5. Statistical Analysis, Gradient Boosting, and SHAP Model
3. Results
3.1. Verification of UAV and Handheld Thermal Infrared Imaging
3.2. Characteristics of SUHII Spatiotemporal Distribution SUHII
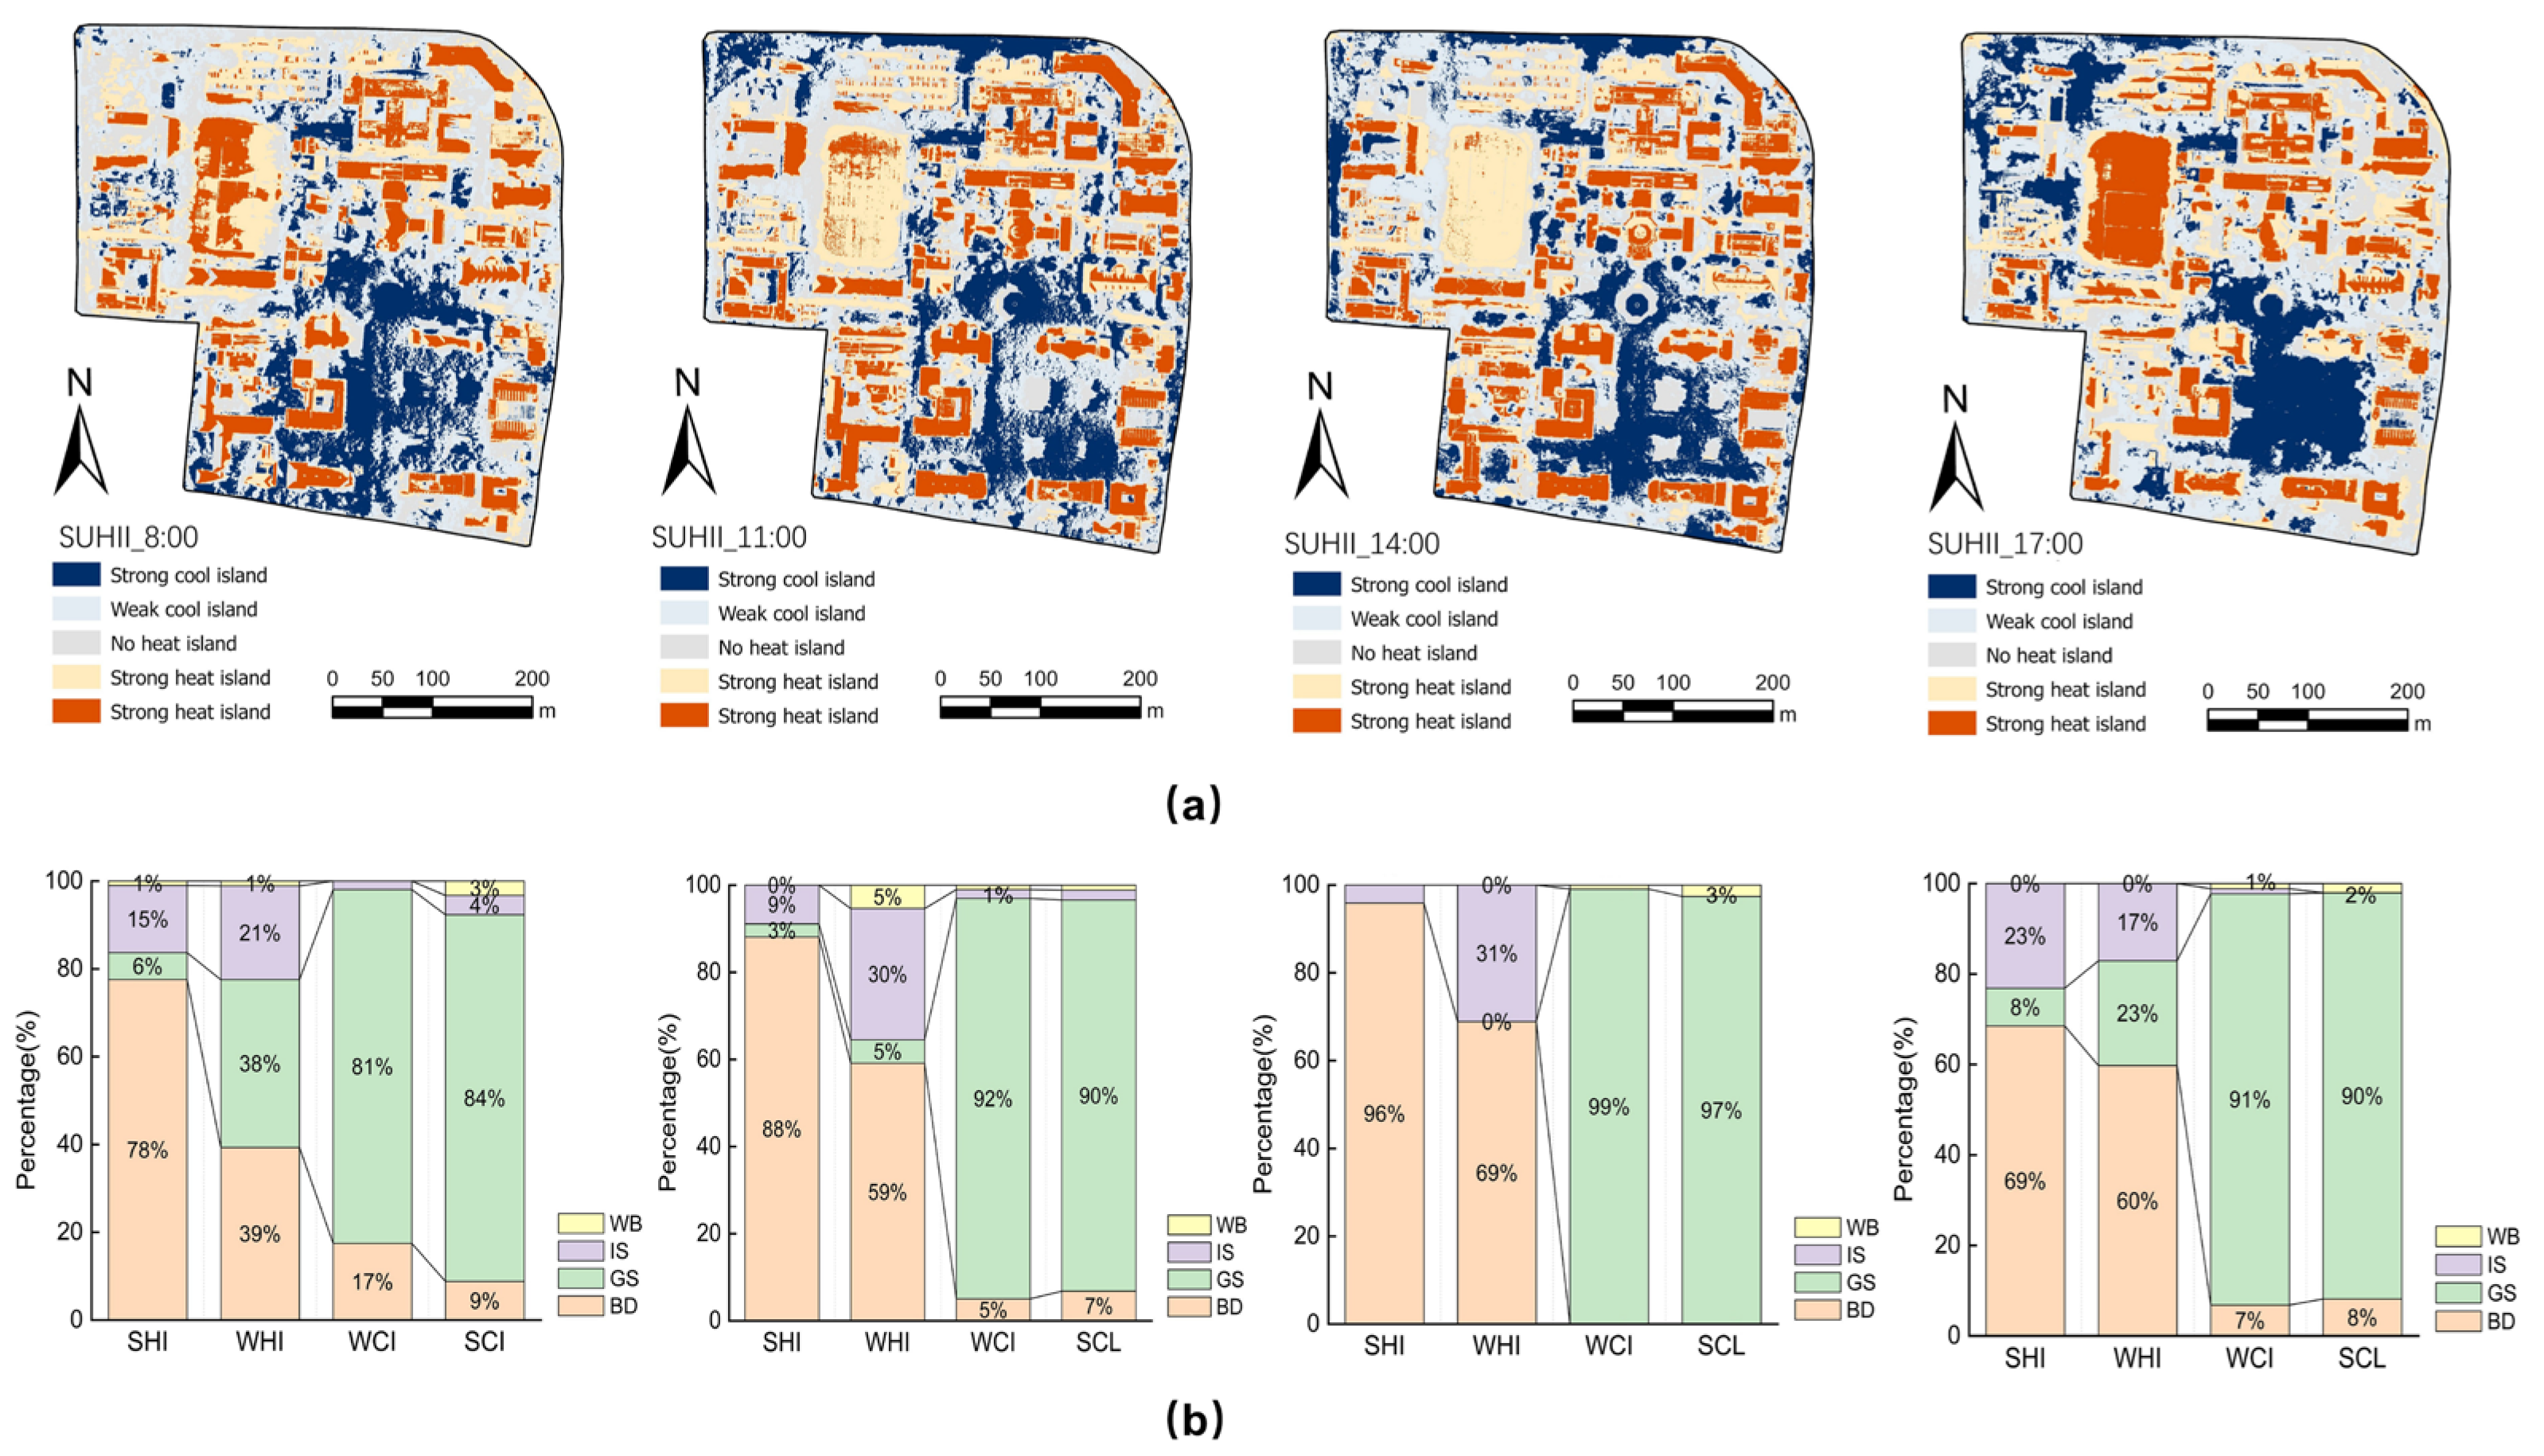
3.2.1. SUHII Spatiotemporal Distribution
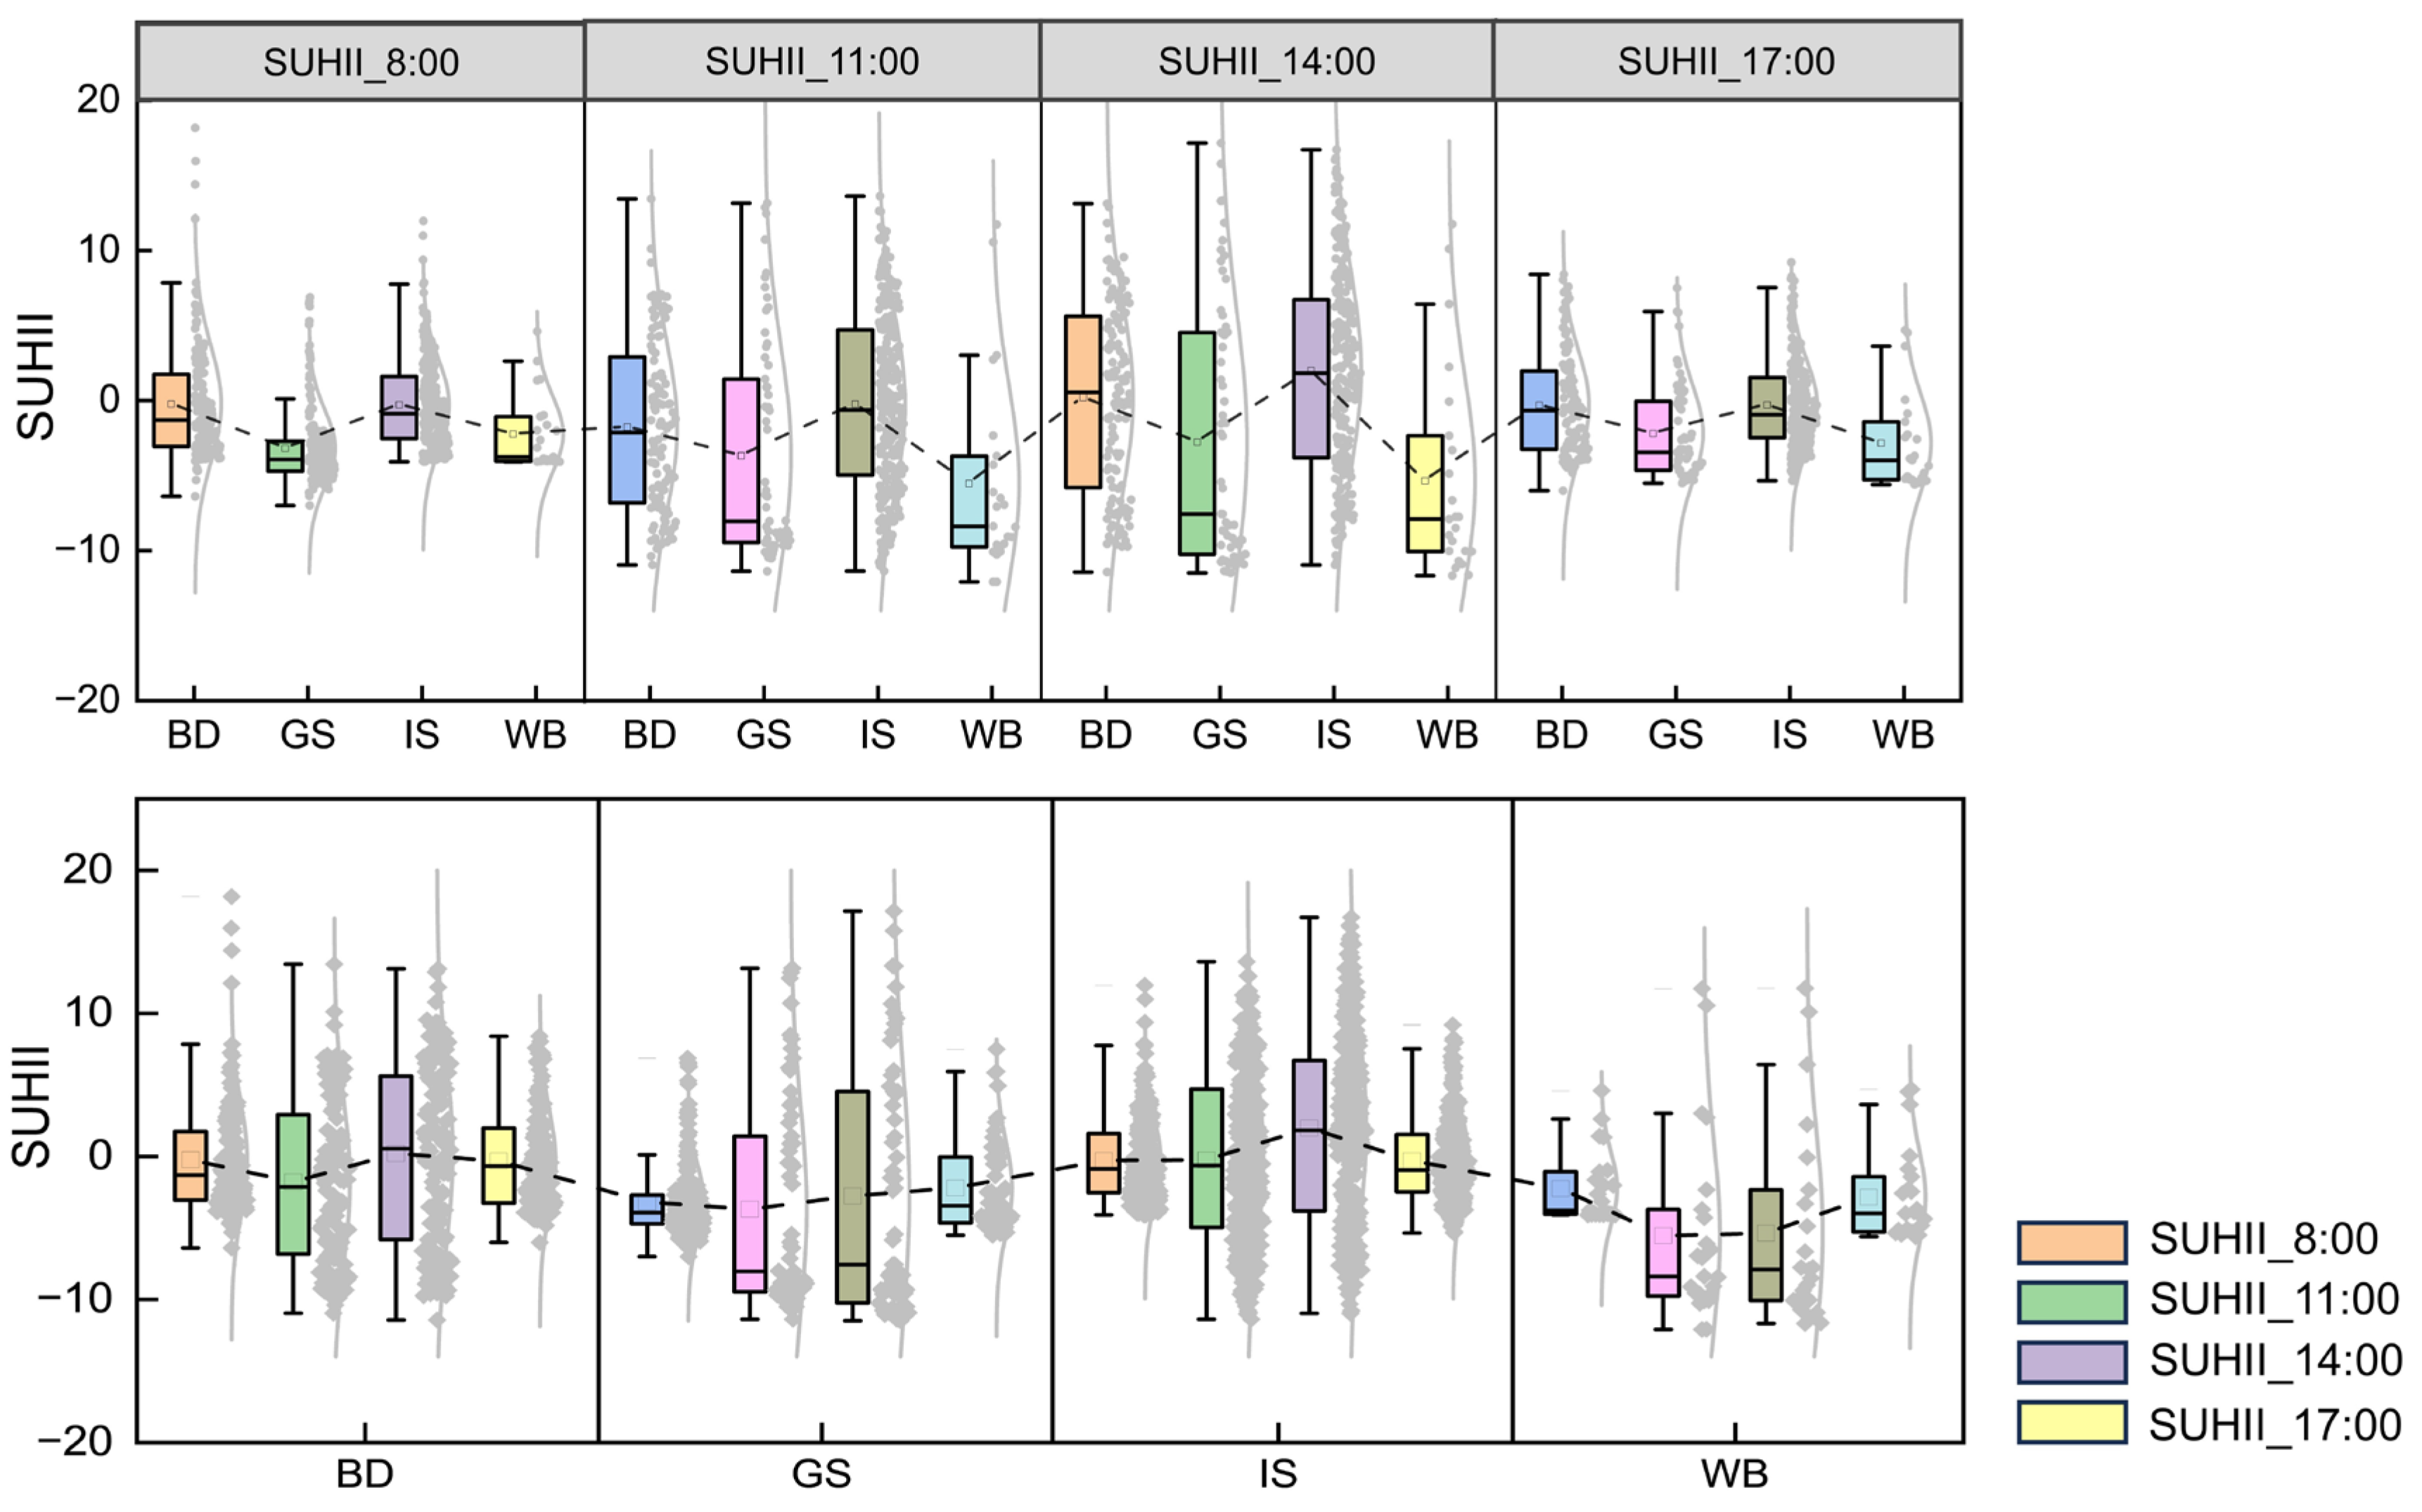
3.2.2. SUHII Hierarchy and Its Spatiotemporal Distribution
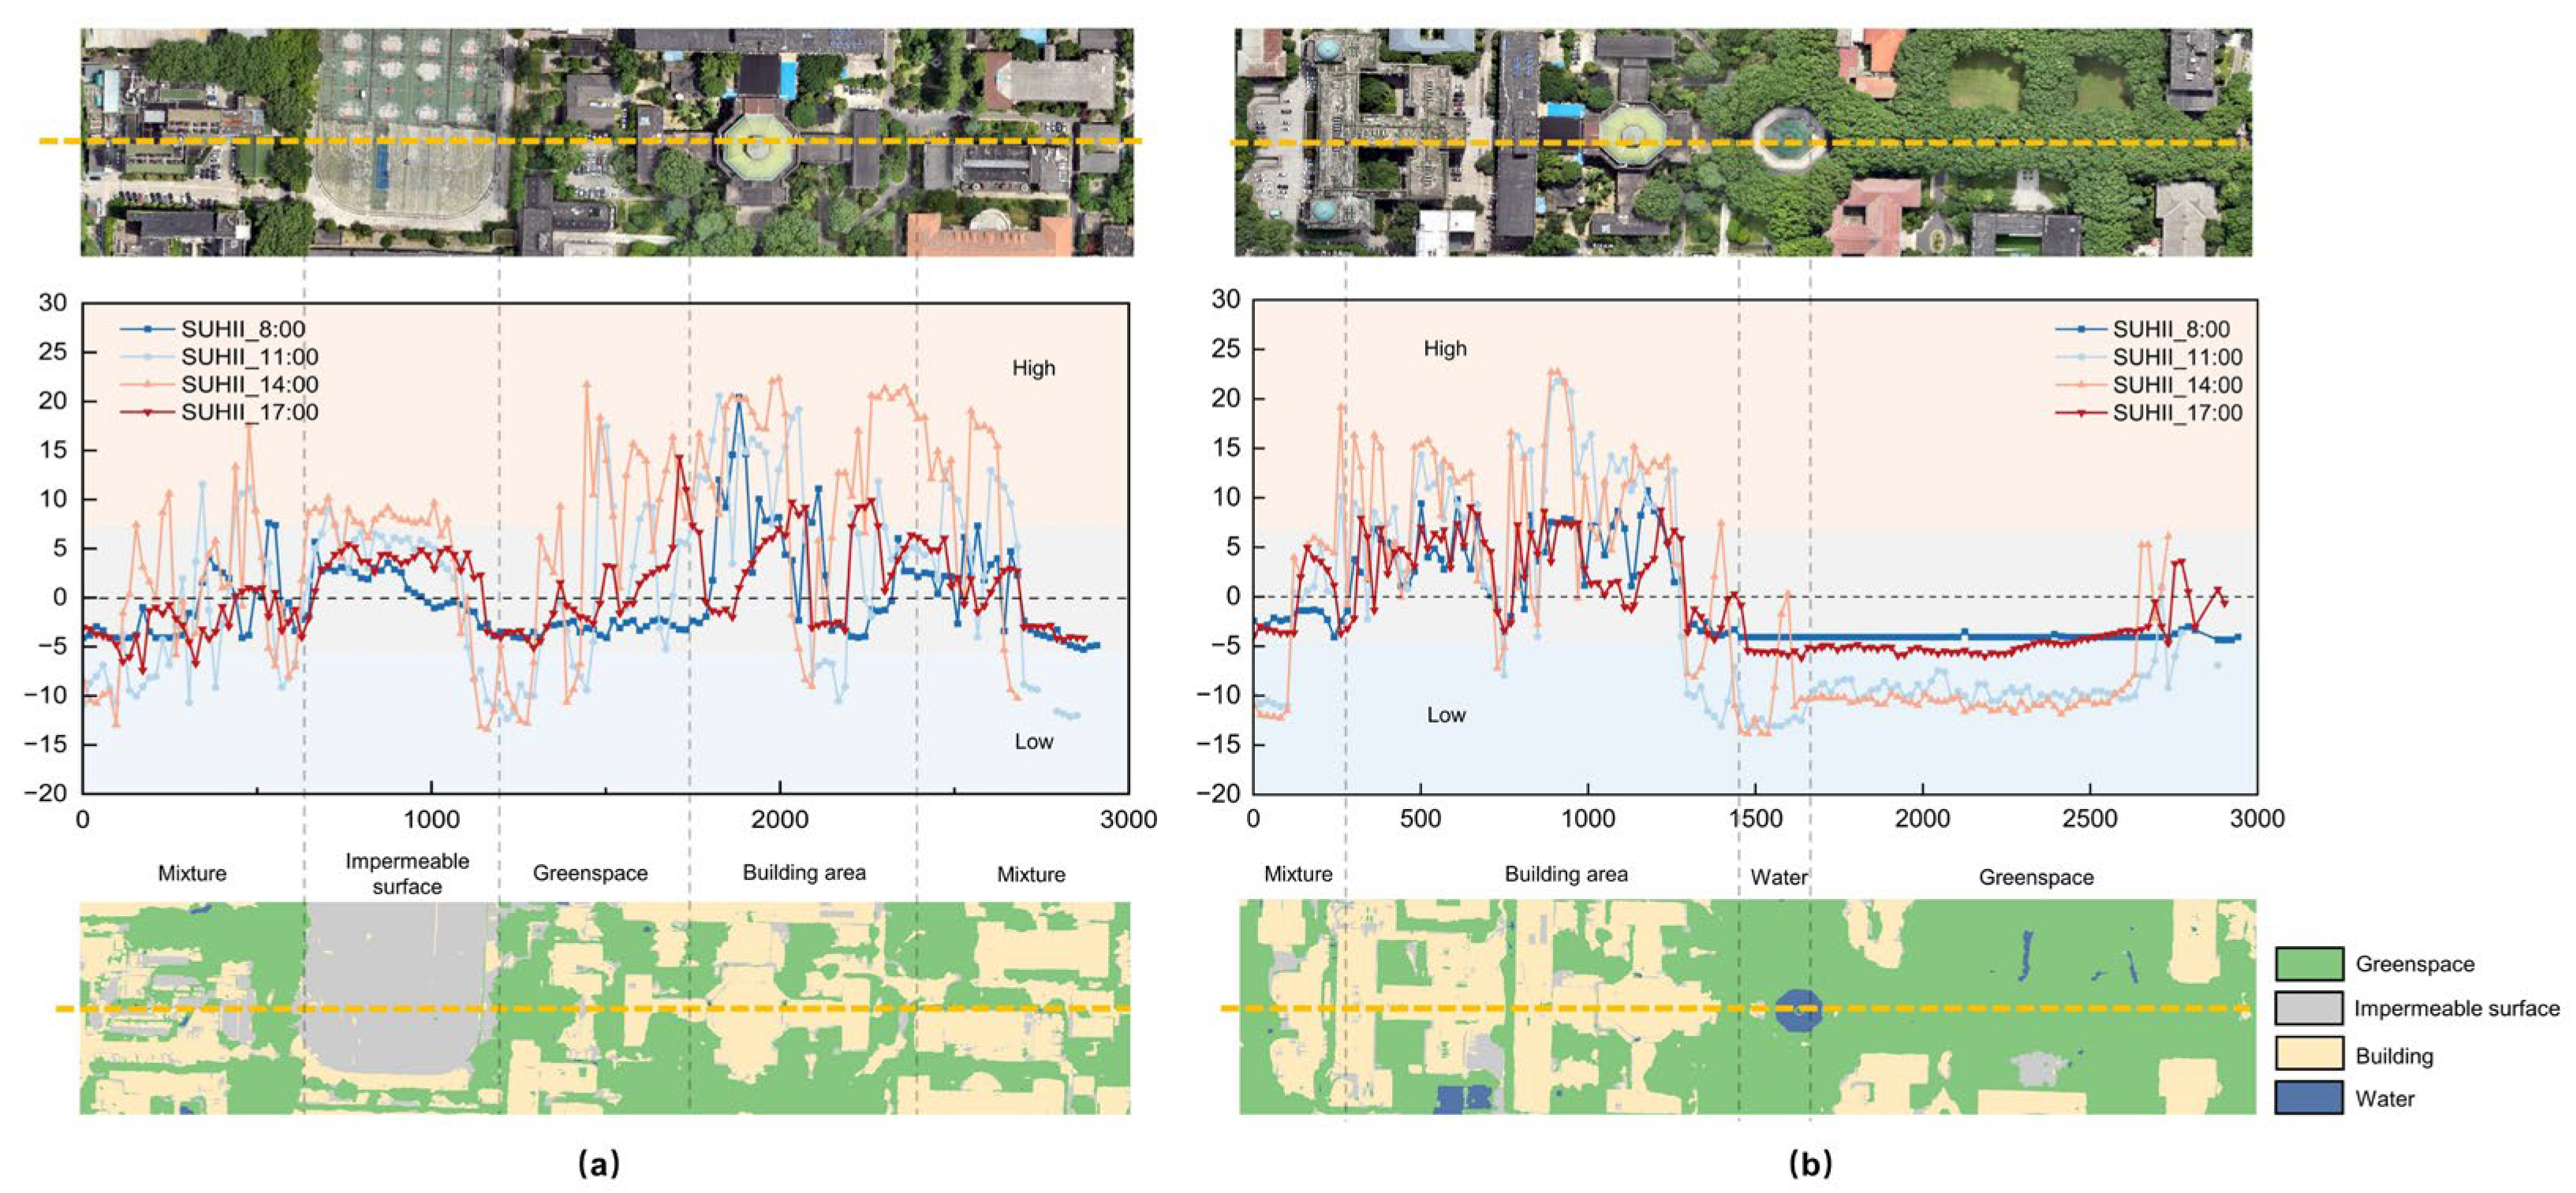
3.2.3. Axis Analysis
3.3. Correlation Between SUHII and Campus 2D/3D Landscape Indicators
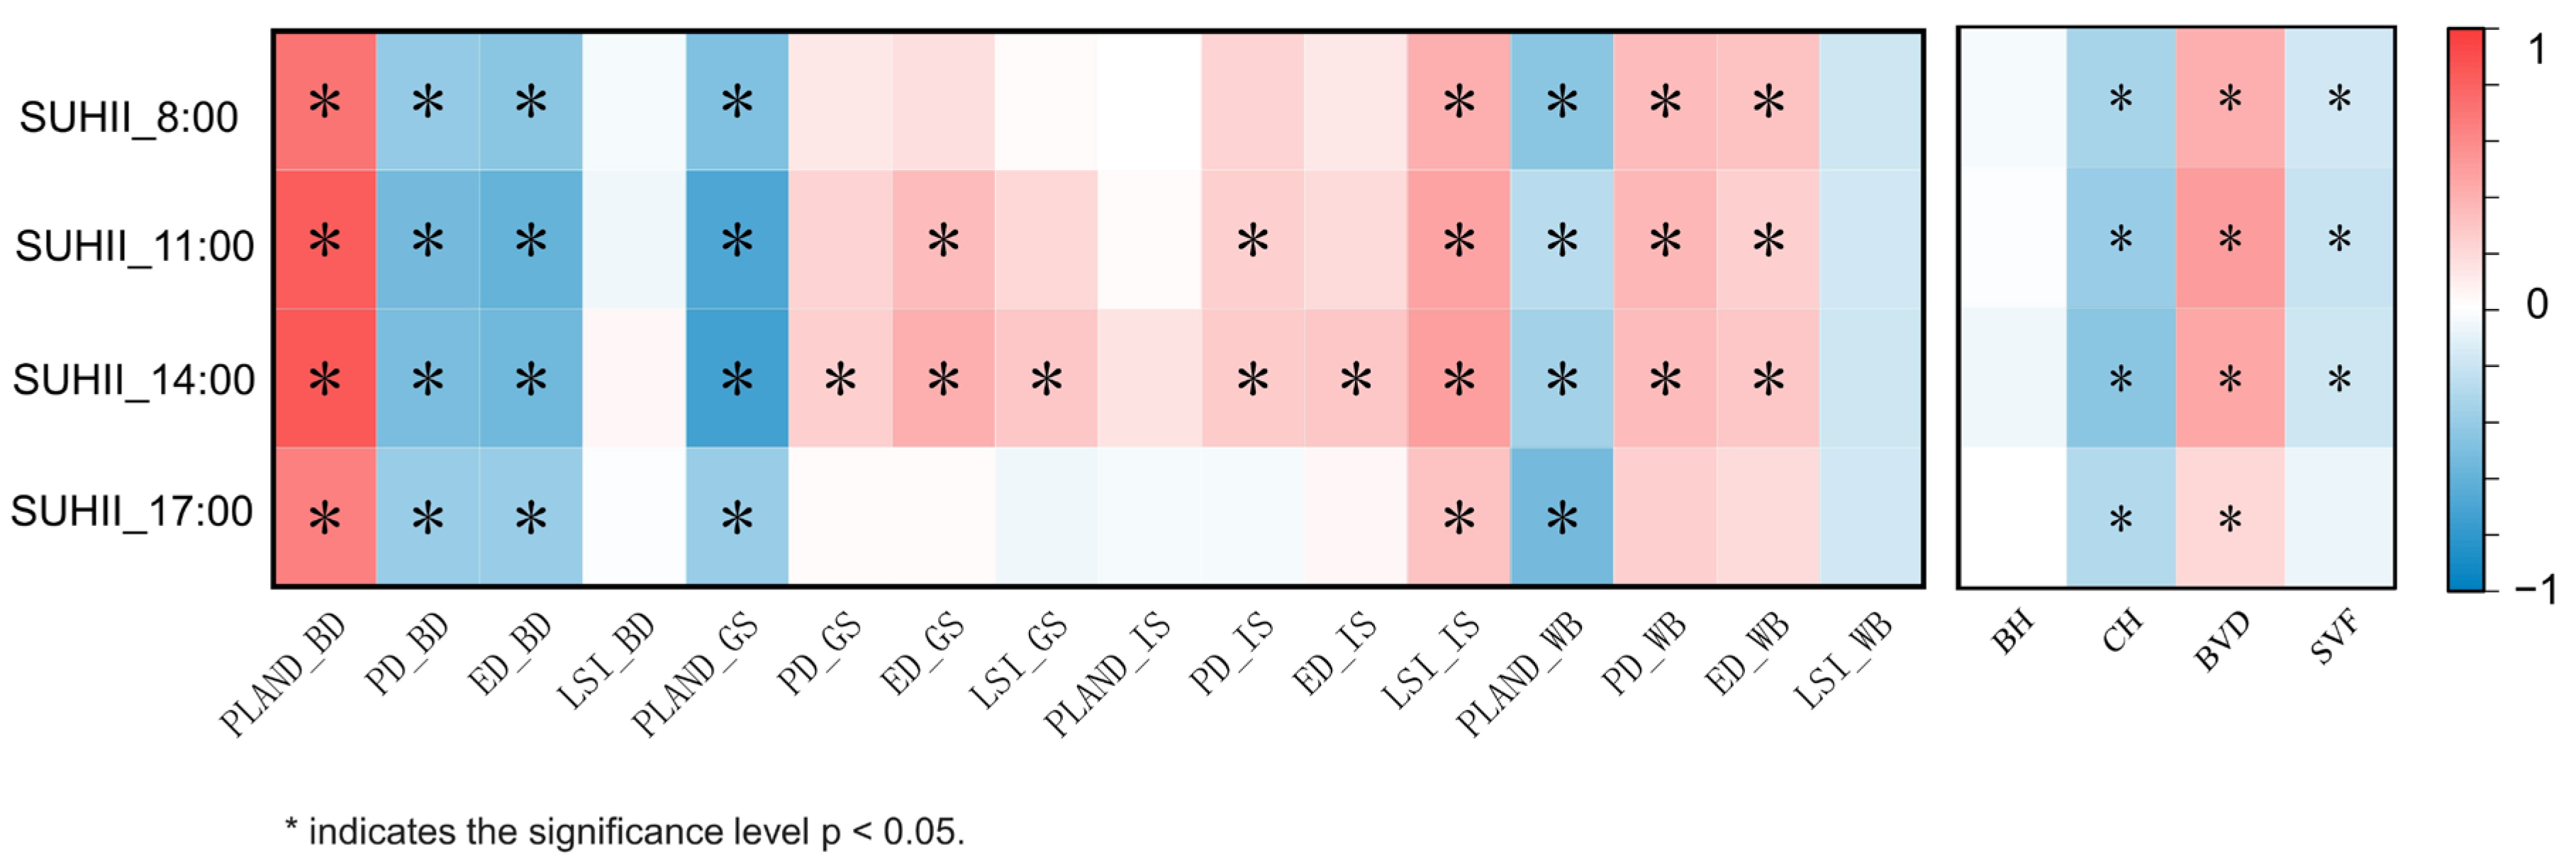
3.3.1. Correlation Between the Campus 2D/3D Landscape Index and SUHII Spatiotemporal Distribution
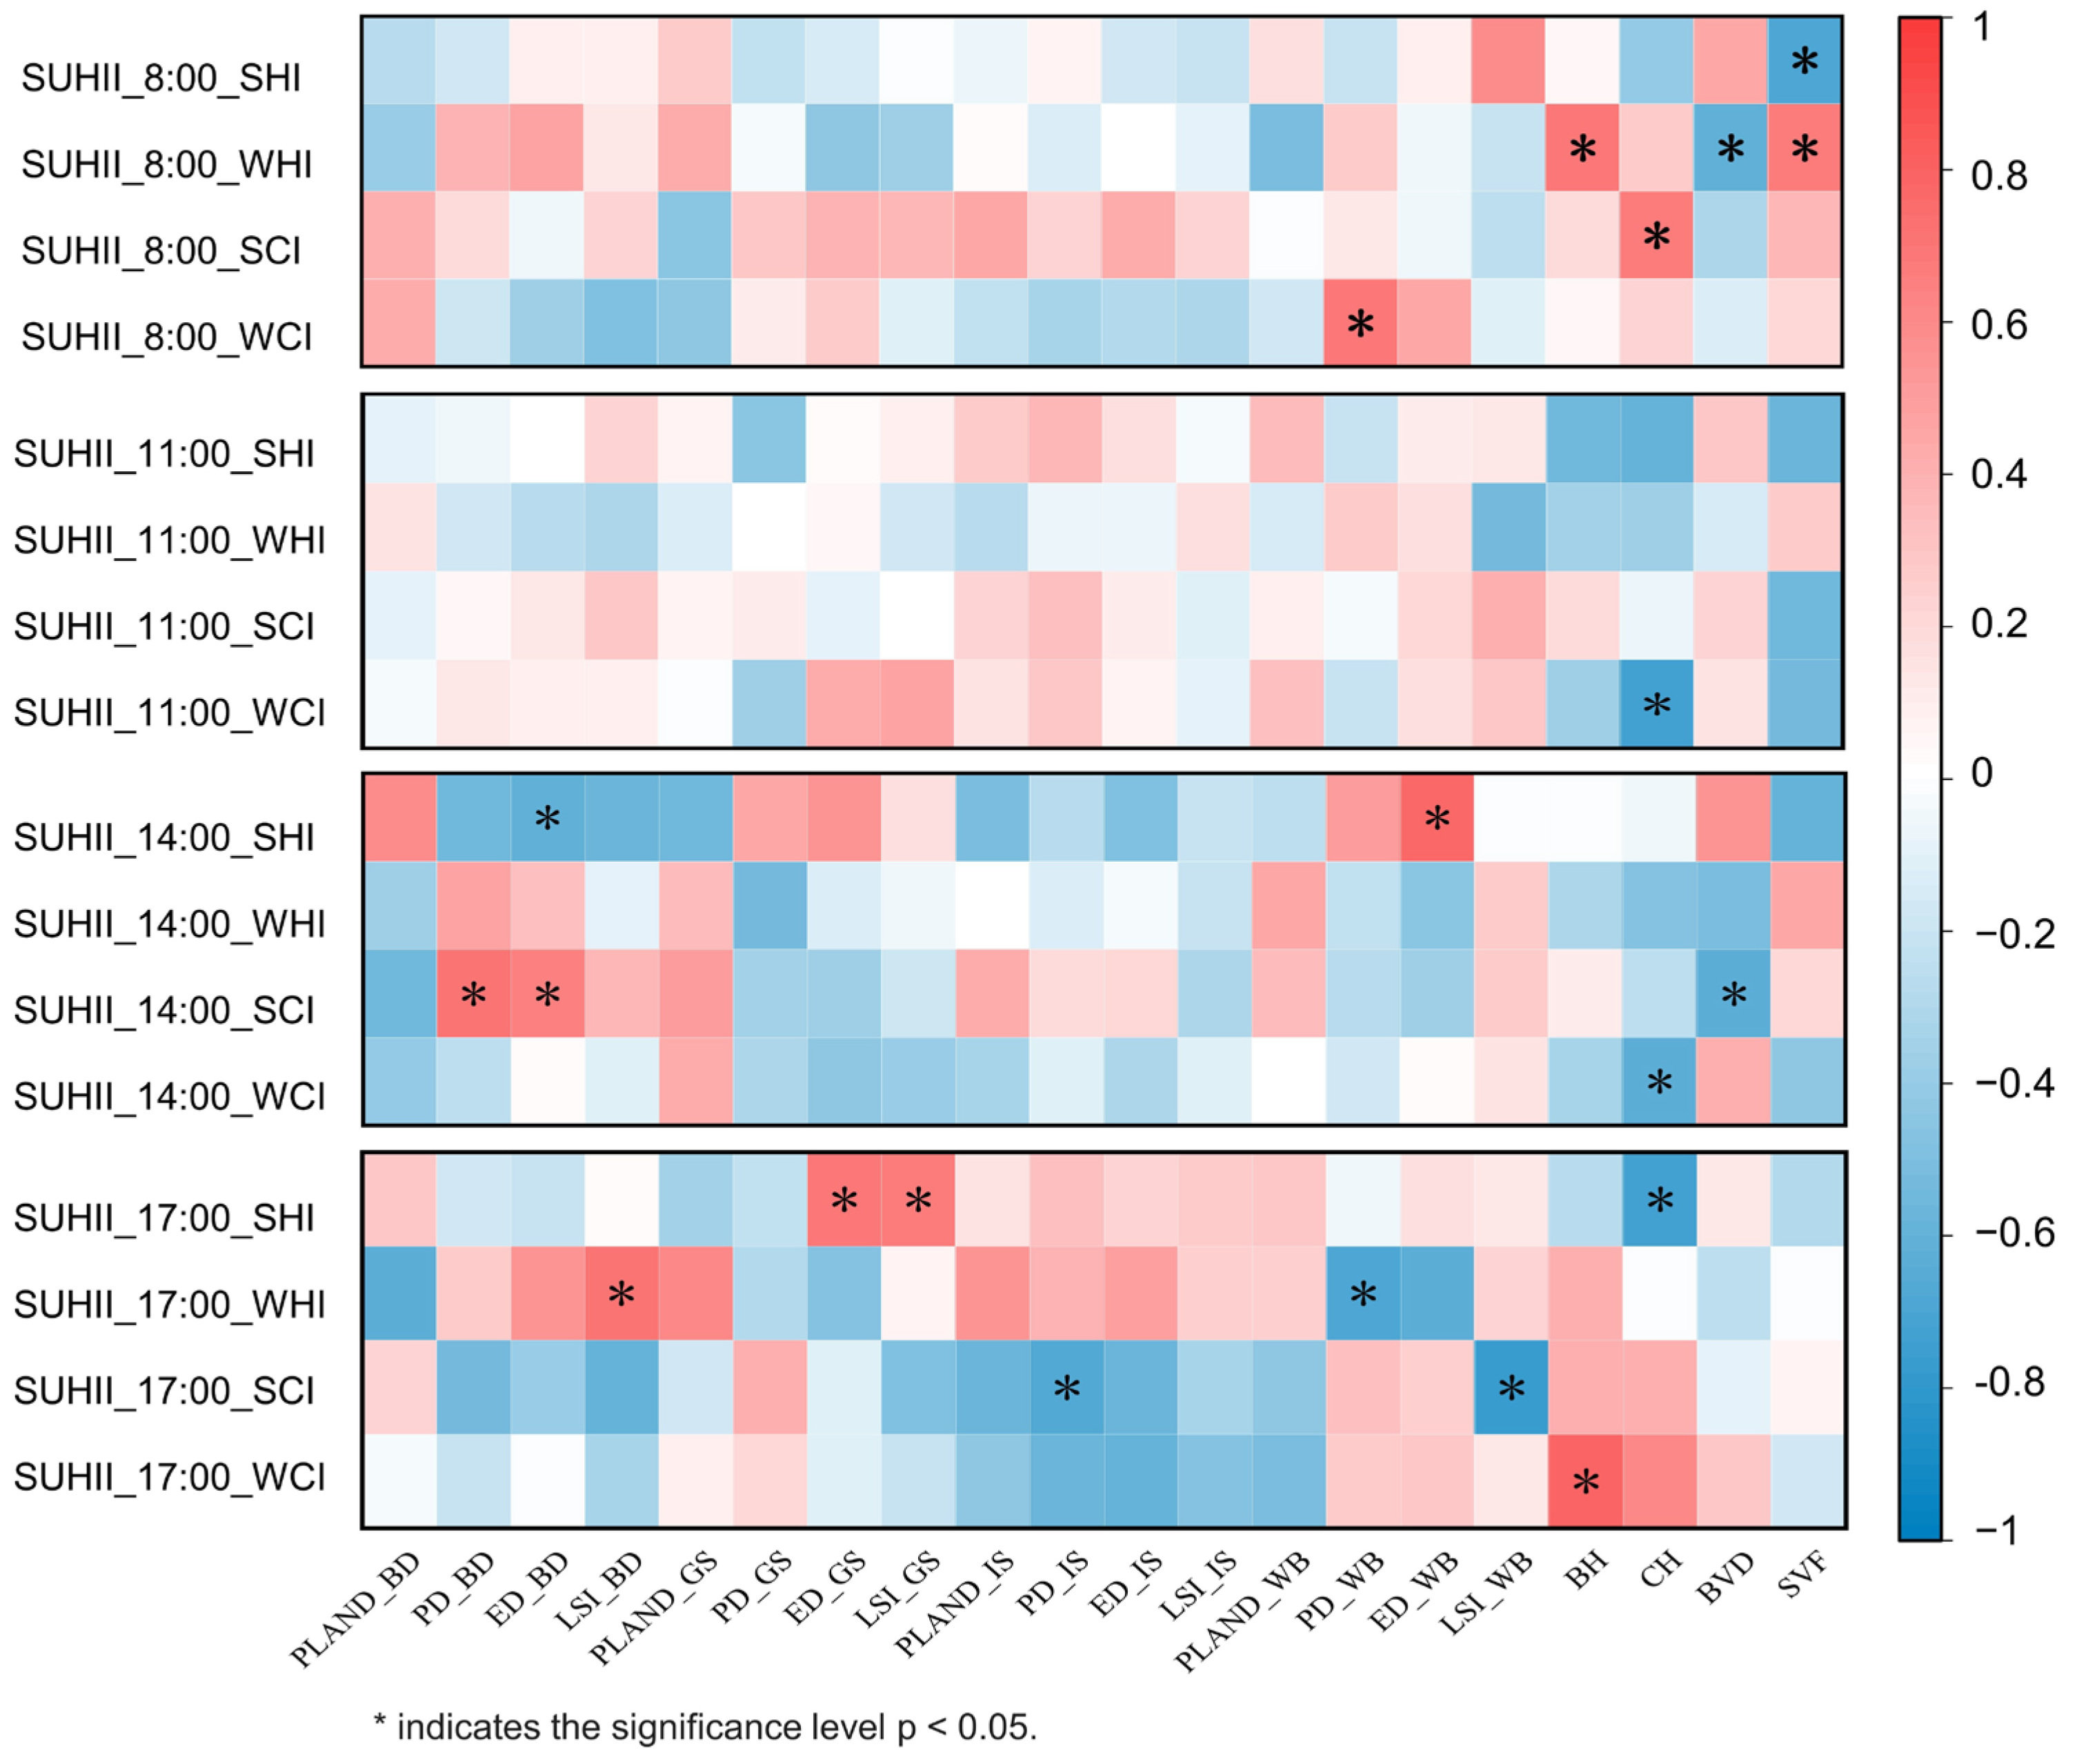
3.3.2. Correlation of the Campus 2D/3D Landscape Index and SUHI Intensity Level
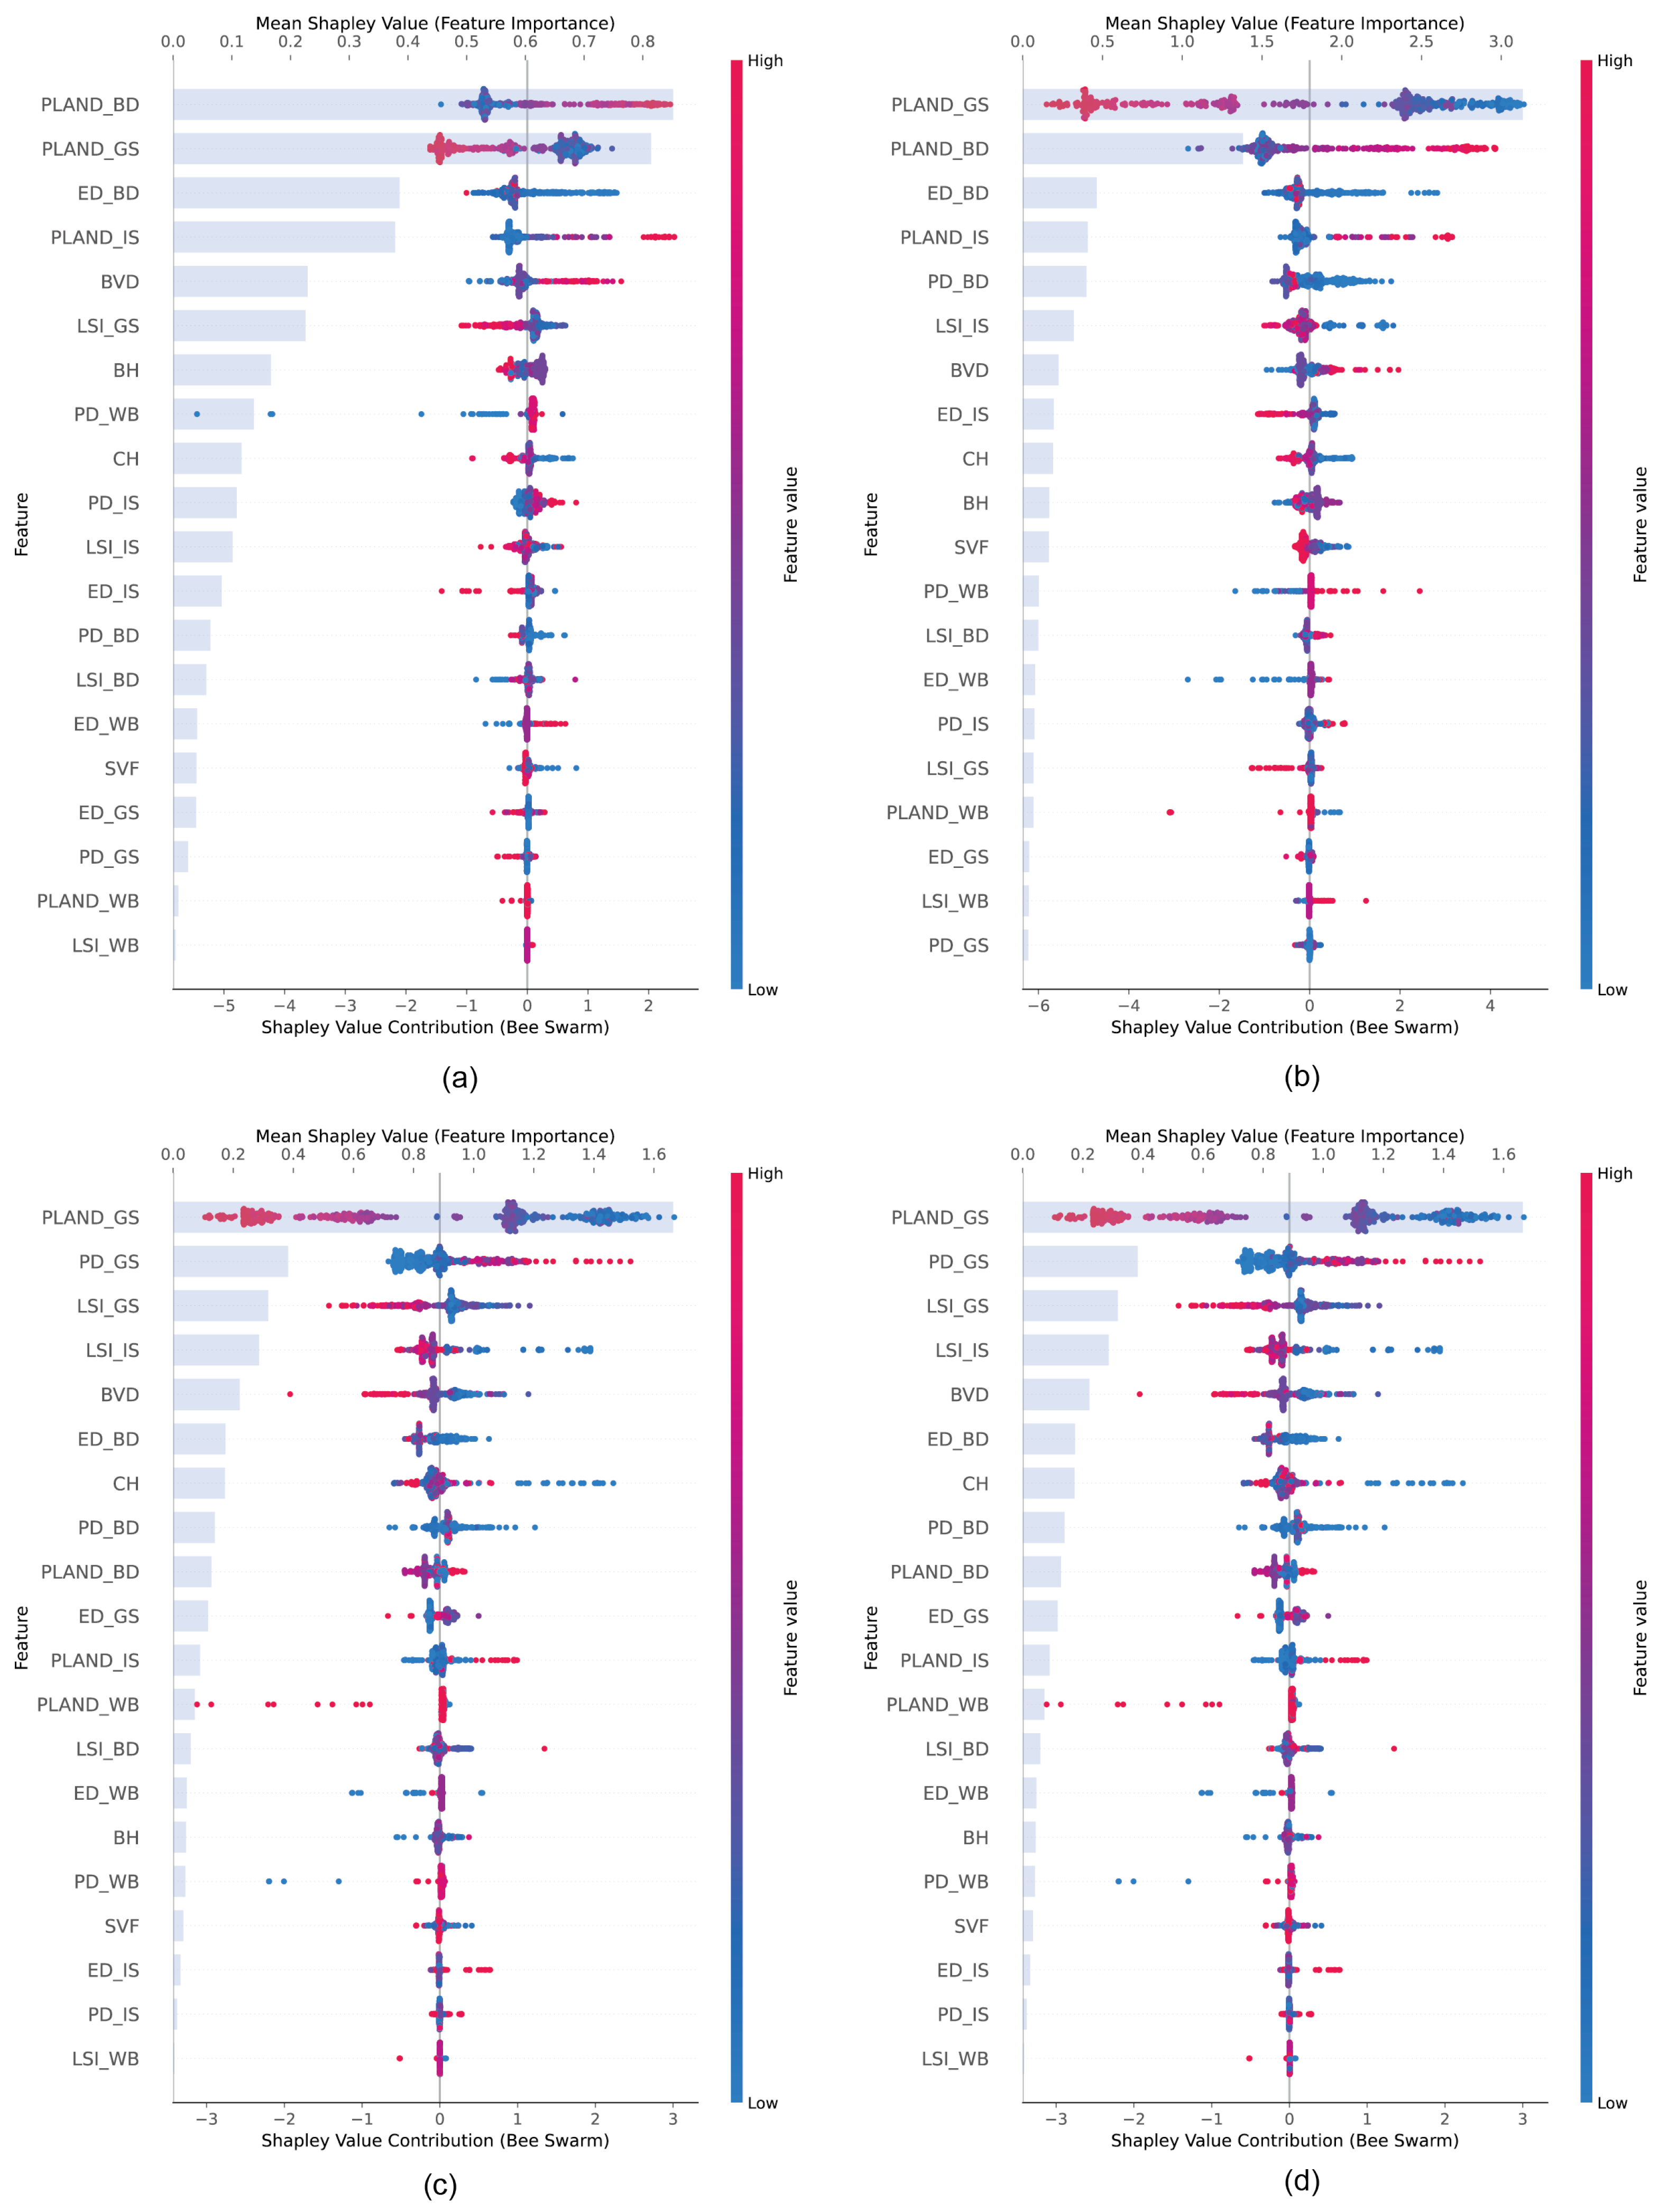
3.4. Predicting the Contribution of Campus 2D/3D Landscape Patterns to SUHII
4. Discussion
4.1. Applicability of High-Precision Thermal Infrared Remote Sensing in Surface Urban Heat Island Research
4.2. Key Factors Affecting the Campus
4.3. Implications for Urban Planning and Design
4.4. Limitations and Future Work
5. Conclusions
Author Contributions
Funding
Data Availability Statement
Acknowledgments
Conflicts of Interest
Abbreviations
| UHI | Urban heat island |
| SUHI | Surface urban heat island |
| SUHII | Surface urban heat island intensity |
| MLR | Multivariate linear regression |
| OLS | Ordinary least squares |
| GBR | Gradient-boosted regression tree model |
| RG | Ridge regression |
| SHI | Strong heat island |
| WHI | Weak heat island |
| NHI | No heat island |
| SCI | Strong cool island |
| WCI | Weak cool island |
Appendix A

| No. | Name | Plant Families | Breast Height Diameter (cm) | Tree Height (m) | Crown Diameter (m) |
|---|---|---|---|---|---|
| 1 | Cinnamomumcamphora (L.) Presl | Lauraceae | 24.2 | 14.2 | 4.6 |
| 2 | Bischofia polycarpa (H.Lév.) Airy Shaw | Euphorbiaceae | 26.1 | 18.8 | 5.2 |
| 3 | Ligustrum lucidum Ait. | Oleaceae | 14.6 | 16.4 | 4.2 |
| 4 | Koelreuteriapaniculata | Sapindaceae | 18.7 | 15.6 | 5.0 |
| 5 | Acer palmatumThunb | Sapindaceae | 12.4 | 11.8 | 3.6 |
| 6 | Cerasusserrulata (Lindl.) Londonvar. lannesiana (Carri.) Makino | Rosaceae | 10.4 | 13.8 | 4.0 |
| 7 | GinkgobilobaL | Ginkgoaceae | 12.0 | 15.8 | 3.4 |
| 8 | Eriobotryajaponica | Rosaceae | 14.5 | 12.6 | 3.6 |
| 9 | MagnoliaGrandiflora Linn | Magnoliaceae | 14.3 | 12.8 | 3.8 |
| 10 | MalushallianaKoehne | Rosaceae | 10.8 | 13.2 | 2.8 |
| Axis 1-1 | Mean (°C) | Standard Deviation (°C) | Maximum (°C) | Minimum (°C) | Range (°C) |
|---|---|---|---|---|---|
| SUHII_8:00 | −1.03 | 4.72 | 21.27 | −7.09 | 28.36 |
| SUHII_11:00 | −0.72 | 8.69 | 18.00 | −16.98 | 34.98 |
| SUHII_14:00 | −0.46 | 9.62 | 17.94 | −19.27 | 37.21 |
| SUHII_17:00 | −0.35 | 4.36 | 13.62 | −13.62 | 27.24 |
| Axis 2-2 | Mean (°C) | Standard Deviation (°C) | Maximum (°C) | Minimum (°C) | Range (°C) |
| SUHII_8:00 | −2.28 | 4.72 | 9.68 | −6.90 | 16.58 |
| SUHII_11:00 | −4.90 | 9.97 | 19.04 | −16.51 | 35.55 |
| SUHII_14:00 | −6.28 | 10.90 | 18.27 | −19.11 | 37.38 |
| SUHII_17:00 | −2.36 | 4.60 | 8.24 | −7.34 | 15.58 |
Appendix B
References
- United Nations. Climate Report. United Nations. Available online: https://www.un.org/en/climatechange/reports?gad_source=1&gclid=Cj0KCQjwxsm3BhDrARIsAMtVz6NYaKRMhM30OFkKx52uvqXLLij0Z6Qa6fIylZ5APkrtXbw7kv4MtdYaAkH-EALw_wcB (accessed on 24 September 2024).
- Dai, Y.; Liu, T. Spatiotemporal Mechanism of Urban Heat Island Effects on Human Health—Evidence from Tianjin City of China. Front. Ecol. Evol. 2022, 10, 1010400. [Google Scholar] [CrossRef]
- Deng, X.; Cao, Q.; Wang, L.; Wang, W.; Wang, S.; Wang, S.; Wang, L. Characterizing Urban Densification and Quantifying Its Effects on Urban Thermal Environments and Human Thermal Comfort. Landsc. Urban Plan. 2023, 237, 104803. [Google Scholar] [CrossRef]
- You, M.; Huang, J.; Guan, C. Are New Towns Prone to Urban Heat Island Effect? Implications for Planning Form and Function. Sustain. Cities Soc. 2023, 99, 104939. [Google Scholar] [CrossRef]
- Chandan, D.; Mark, R.; Nicholas, J.; Jane, P. Unlivable: What the Urban Heat Island Effect Means for East Asia’s Cities|GFDRR; World Bank: Washington, DC, USA, 2023. [Google Scholar]
- Gao, K.; Haddad, S.; Paolini, R.; Feng, J.; Altheeb, M.; Mogirah, A.A.; Moammar, A.B.; Santamouris, M. The Use of Green Infrastructure and Irrigation in the Mitigation of Urban Heat in a Desert City. Build. Simul. 2024, 17, 679–694. [Google Scholar] [CrossRef]
- Stewart, I.D.; Oke, T.R. Local Climate Zones for Urban Temperature Studies. Bull. Am. Meteorol. Soc. 2012, 93, 1879–1900. [Google Scholar] [CrossRef]
- Addas, A.; Goldblatt, R.; Rubinyi, S. Utilizing Remotely Sensed Observations to Estimate the Urban Heat Island Effect at a Local Scale: Case Study of a University Campus. Land 2020, 9, 191. [Google Scholar] [CrossRef]
- Luo, P.; Yu, B.; Li, P.; Liang, P.; Liang, Y.; Yang, L. How 2D and 3D Built Environments Impact Urban Surface Temperature under Extreme Heat: A Study in Chengdu, China. Build. Environ. 2023, 231, 110035. [Google Scholar] [CrossRef]
- Henn, K.A.; Peduzzi, A. Surface Heat Monitoring with High-Resolution UAV Thermal Imaging: Assessing Accuracy and Applications in Urban Environments. Remote Sens. 2024, 16, 930. [Google Scholar] [CrossRef]
- Lin, S.; Ramani, V.; Martin, M.; Arjunan, P.; Chong, A.; Biljecki, F.; Ignatius, M.; Poolla, K.; Miller, C. District-Scale Surface Temperatures Generated from High-Resolution Longitudinal Thermal Infrared Images. Sci. Data 2023, 10, 859. [Google Scholar] [CrossRef]
- Vanos, J.; Pfautsch, S. Building and School-Playground Design to Protect from Weather Extremes. In The Impact of Extreme Weather on School Education; Routledge: London, UK, 2023; pp. 94–118. [Google Scholar] [CrossRef]
- Qi, Y.; Chen, L.; Xu, J.; Liu, C.; Gao, W.; Miao, S. Influence of University Campus Spatial Morphology on Outdoor Thermal Environment: A Case Study from Eastern China. Energy Built Environ. 2023, 6, 43–56. [Google Scholar] [CrossRef]
- Ke, X.; Men, H.; Zhou, T.; Li, Z.; Zhu, F. Variance of the Impact of Urban Green Space on the Urban Heat Island Effect among Different Urban Functional Zones: A Case Study in Wuhan. Urban For. Urban Green. 2021, 62, 127159. [Google Scholar] [CrossRef]
- Bai, Y.; Wang, K.; Ren, Y.; Li, M.; Ji, R.; Wu, X.; Yan, H.; Lin, T.; Zhang, G.; Zhou, X.; et al. 3D Compact Form as the Key Role in the Cooling Effect of Greenspace Landscape Pattern. Ecol. Indic. 2024, 160, 111776. [Google Scholar] [CrossRef]
- Li, Y.; Schubert, S.; Kropp, J.P.; Rybski, D. On the Influence of Density and Morphology on the Urban Heat Island Intensity. Nat. Commun. 2020, 11, 2647. [Google Scholar] [CrossRef]
- Li, Z.; Hu, D. Exploring the Relationship between the 2D/3D Architectural Morphology and Urban Land Surface Temperature Based on a Boosted Regression Tree: A Case Study of Beijing, China. Sustain. Cities Soc. 2022, 78, 103392. [Google Scholar] [CrossRef]
- Khan, M.S.; Ullah, S.; Chen, L. Variations in Surface Urban Heat Island and Urban Cool Island Intensity: A Review Across Major Climate Zones. Chin. Geogr. Sci. 2023, 33, 983–1000. [Google Scholar] [CrossRef]
- Wu, W.-B.; Yu, Z.-W.; Ma, J.; Zhao, B. Quantifying the Influence of 2D and 3D Urban Morphology on the Thermal Environment across Climatic Zones. Landsc. Urban Plan. 2022, 226, 104499. [Google Scholar] [CrossRef]
- Mo, Y.; Huang, Y.; Zhong, R.; Wang, B.; Guo, Z. Investigating the Effects of 2D/3D Urban Morphology on Land Surface Temperature Using High-Resolution Remote Sensing Data. Buildings 2025, 15, 1256. [Google Scholar] [CrossRef]
- Liu, Y.; Wang, Z.; Liu, X.; Zhang, B. Complexity of the Relationship between 2D/3D Urban Morphology and the Land Surface Temperature: A Multiscale Perspective. Environ. Sci. Pollut. Res. 2021, 28, 66804–66818. [Google Scholar] [CrossRef]
- Guo, F.; Wu, Q.; Schlink, U. 3D Building Configuration as the Driver of Diurnal and Nocturnal Land Surface Temperatures: Application in Beijing’s Old City. Build. Environ. 2021, 206, 108354. [Google Scholar] [CrossRef]
- Rodríguez, M.V.; Melgar, S.G.; Márquez, J.M.A. Assessment of Aerial Thermography as a Method of in Situ Measurement of Radiant Heat Transfer in Urban Public Spaces. Sustain. Cities Soc. 2022, 87, 104228. [Google Scholar] [CrossRef]
- Fu, H.; Jiao, Y.; Deng, L.; Wang, W. Dynamic Impacts of Vegetation Growth and Urban Development on Microclimate and Building Energy Consumption. Sustain. Cities Soc. 2025, 126, 106382. [Google Scholar] [CrossRef]
- Hami, A.; Abdi, B. Students’ Landscaping Preferences for Open Spaces for Their Campus Environment. Indoor Built Environ. 2021, 30, 87–98. [Google Scholar] [CrossRef]
- Liu, Y.; Chen, C.; Li, J.; Chen, W.-Q. Characterizing Three Dimensional (3-D) Morphology of Residential Buildings by Landscape Metrics. Landsc. Ecol. 2020, 35, 2587–2599. [Google Scholar] [CrossRef]
- Han, D.; Xu, X.; Qiao, Z.; Wang, F.; Cai, H.; An, H.; Jia, K.; Liu, Y.; Sun, Z.; Wang, S.; et al. The Roles of Surrounding 2D/3D Landscapes in Park Cooling Effect: Analysis from Extreme Hot and Normal Weather Perspectives. Build. Environ. 2023, 231, 110053. [Google Scholar] [CrossRef]
- Han, D.; Cai, H.; Wang, F.; Wang, M.; Xu, X.; Qiao, Z.; An, H.; Liu, Y.; Jia, K.; Sun, Z.; et al. Understanding the Role of Urban Features in Land Surface Temperature at the Block Scale: A Diurnal Cycle Perspective. Sustain. Cities Soc. 2024, 111, 105588. [Google Scholar] [CrossRef]
- Yu, Q. Assessing the Cooling Effects of Urban Vegetation on Urban Heat Mitigation in Selected U.S. Cities. Master’s Thesis, University of South Florida, Tampa, FL, USA, 2018. Available online: https://digitalcommons.usf.edu/etd/8147 (accessed on 2 May 2025).
- Liu, L.; Zheng, B. Greenspace Coverage vs. Enhanced Vegetation Index: Correlations with Surface Urban Heat Island Intensity in Different Climate Zones. Urban Clim. 2024, 58, 102140. [Google Scholar] [CrossRef]
- Gage, E.A.; Cooper, D.J. Relationships between Landscape Pattern Metrics, Vertical Structure and Surface Urban Heat Island Formation in a Colorado Suburb. Urban Ecosyst. 2017, 20, 1229–1238. [Google Scholar] [CrossRef]
- Kim, S.W.; Brown, R.D. Urban Heat Island (UHI) Variations within a City Boundary: A Systematic Literature Review. Renew. Sustain. Energy Rev. 2021, 148, 111256. [Google Scholar] [CrossRef]
- He, B.-J. Towards the next Generation of Green Building for Urban Heat Island Mitigation: Zero UHI Impact Building. Sustain. Cities Soc. 2019, 50, 101647. [Google Scholar] [CrossRef]
- Oke, T.R. The Energetic Basis of the Urban Heat Island. Q. J. R. Meteorol. Soc. 1982, 108, 1–24. [Google Scholar] [CrossRef]
- Sobrino, J.A.; Irakulis, I. A Methodology for Comparing the Surface Urban Heat Island in Selected Urban Agglomerations Around the World from Sentinel-3 SLSTR Data. Remote Sens. 2020, 12, 2052. [Google Scholar] [CrossRef]
- Xu, Z.; Zhao, S. Scale Dependence of Urban Green Space Cooling Efficiency: A Case Study in Beijing Metropolitan Area. Sci. Total Environ. 2023, 898, 165563. [Google Scholar] [CrossRef]
- Zhang, J.; Tu, L.; Shi, B. Spatiotemporal Patterns of the Application of Surface Urban Heat Island Intensity Calculation Methods. Atmosphere 2023, 14, 1580. [Google Scholar] [CrossRef]
- Cai, X.; Yang, J.; Zhang, Y.; Xiao, X.; Xia, J. Cooling Island Effect in Urban Parks from the Perspective of Internal Park Landscape. Humanit. Soc. Sci. Commun. 2023, 10, 674. [Google Scholar] [CrossRef]
- Anjos, M.; Lopes, A. Urban Heat Island and Park Cool Island Intensities in the Coastal City of Aracaju, North-Eastern Brazil. Sustainability 2017, 9, 1379. [Google Scholar] [CrossRef]
- Li, B.; Zhang, Y.; Zhao, S.; Zhao, L.; Wang, M.; Pei, H. Urban Heat Island Effect in Different Sizes from a 3D Perspective: A Case Study in the Beijing-Tianjin-Hebei Region. Land 2025, 14, 463. [Google Scholar] [CrossRef]
- Friedman, J.H. Greedy Function Approximation: A Gradient Boosting Machine. Ann. Stat. 2001, 29, 1189–1232. [Google Scholar] [CrossRef]
- Tanoori, G.; Soltani, A.; Modiri, A. Machine Learning for Urban Heat Island (UHI) Analysis: Predicting Land Surface Temperature (LST) in Urban Environments. Urban Clim. 2024, 55, 101962. [Google Scholar] [CrossRef]
- Shapley, L.S. A Value for N-Person Games; RAND Corporation: Santa Monica, CA, USA, 1952; Available online: https://www.rand.org/pubs/papers/P295.html (accessed on 18 April 2025).
- Lundberg, S.M.; Lee, S.-I. A Unified Approach to Interpreting Model Predictions. arXiv 2017, arXiv:1705.07874. [Google Scholar]
- Yuan, B.; Zhou, L.; Hu, F.; Wei, C. Effects of 2D/3D Urban Morphology on Land Surface Temperature: Contribution, Response, and Interaction. Urban Clim. 2024, 53, 101791. [Google Scholar] [CrossRef]
- Kalogeropoulos, G.; Tzortzi, J.; Dimoudi, A. Remote Sensing and Field Measurements for the Analysis of the Thermal Environment in the “Bosco Verticale” Area in Milan City. Land 2024, 13, 182. [Google Scholar] [CrossRef]
- Ma, X.; Yang, J.; Zhang, R.; Yu, W.; Ren, J.; Xiao, X.; Xia, J. XGBoost-Based Analysis of the Relationship Between Urban 2-D/3-D Morphology and Seasonal Gradient Land Surface Temperature. IEEE J. Sel. Top. Appl. Earth Obs. Remote Sens. 2024, 17, 4109–4124. [Google Scholar] [CrossRef]
- Xu, H.; Sheng, K.; Gao, J. Mitigation of Heat Island Effect by Green Stormwater Infrastructure: A Comparative Study between Two Diverse Green Spaces in Nanjing. Front. Ecol. Evol. 2023, 11, 307756. [Google Scholar] [CrossRef]


| Equipment | Equipment Parameters | Description |
|---|---|---|
| Thermal imaging camera | Camera | DFOV: 61° Equivalent focal length: 40 mm Aperture: f/1.0 Focus distance: 5 m to infinity |
| Pixel spacing | 12 µm | |
| Frame rate | 30 Hz | |
| Infrared temperature range | −20 °C~150 °C | |
| Resolution of infrared image | 640 × 512 px | |
| Wavelength range | 8 µm–14 µm | |
| Overlap rate | 80% | |
| Measurement method | Wide angle + infrared orthophoto acquisition | |
| DJI Mavic 3T drone | Type | Quadcopter |
| Wheelbase | Diagonal: 380.1 mm | |
| Maximum flight time | 45 min | |
| Maximum tilt angle | 30° | |
| Maximum horizontal flight speed | 15 m/s | |
| Maximum wind speed | 12 m/s | |
| Flight altitude | 120 m | |
| Operating outdoor temperature range | −10 °C~40 °C | |
| Testo-8751i Thermal Imager | Resolution of infrared image | 160 × 120 px or 320 × 240 px |
| Thermal sensitivity | <50 mK | |
| Infrared temperature measurement range | −30 °C~350 °C | |
| Automatic hot or cold spot detection | Directly shows the critical temperature conditions |
| Indicators | Description | Refs. | |
|---|---|---|---|
| 2D indicators | Percentage of landscape (PLAND) | A is total area (m2), is area of type I landscape area (m2), PLAND eexpresses the proportion of each type of landscape in the built environment. | [26,27] |
| Patch density (PD) | PD represents the degree of landscape fragmentation per square meters. Its value will increase along with the increase in landscape fragmentation. | [18] | |
| Landscape shape index (LSI) | E is the total side length of a certain type of landscape. LSI represents the complexity of a certain type of landscape shape. | [18] | |
| Edge density (ED) | Edge density (ED) can be calculated by taking the total length of all boundary segments within a landscape and dividing it by the landscape’s total area (m2). | [18] | |
| 3D indicators | Building height (BH) | Building height (BH) is retrieved from the Baidu open Map API platform through Python. Then, it conducts the geometrics corrections using the campus architectural CAD design drawings. | [28] |
| Canopy height (CH) | Canopy height (CH) is extracted based on the normalized digital surface model (DSM) obtained from orthophotography, enabling accurate height extraction. Then, it verifies the accuracy of DSM data through field surveys of vegetation type, tree height, and crown diameter. | [29] | |
| Building volume density (BVD) | Ci is the coverage building area, Hi is the building height. BVD is used to quantify the building volume density on a site. | [21] | |
| Sky view factor (SVF) | Sky view factor (SVF) is commonly used to measure the proportion of sky visible at a certain point. Among them, αi refers to the azimuth angle of the i-th sector, while βi indicates the sector’s maximum height and N represents the overall number of sectors. | [28] | |
| Class | Threshold Classification |
|---|---|
| Strong heat island (SHI) | SUHIIi ≥ SUHIImean + 1.5 × SUHIIsd |
| Weak heat island (WHI) | SUHIImean + 0.5 × SUHIIsd ≤ SUHIIi < SUHIImean + 1.5 × SUHIIsd |
| No heat island (NHI) | SUHIImean − 0.5 × SUHIIsd < SUHIIi < SUHIImean + 0.5 × SUHIIsd |
| Weak cool island (WCI) | SUHIImean − 1.5 × SUHIIsd ≤ SUHIIi ≤ SUHIImean − 0.5 × SUHIIsd |
| Strong cool island (SCI) | SUHIIi < SUHIImean − 1.5 × SUHIIsd |
| Land Use | UAV-Based Camera | Handheld Imager | ||||
|---|---|---|---|---|---|---|
| Average (°C) | Min. (°C) | Max. (°C) | Average (°C) | Min. (°C) | Max. (°C) | |
| Building | 41.02 | 35.40 | 43.90 | 40.51 | 36.91 | 42.78 |
| Greenspace | 34.59 | 29.42 | 38.25 | 28.46 | 26.60 | 30.90 |
| Impervious surface | 36.09 | 33.28 | 38.01 | 33.46 | 29.30 | 38.32 |
| Water body | 27.16 | 25.70 | 29.10 | 26.96 | 29.21 | 25.14 |
| 2D Indicator | B | SE(B) | Beta | B/SE(B) |
|---|---|---|---|---|
| PLAND_BD | 9.160795 | 0.419227 | 0.359699 | 21.85163 |
| PD_BD | 0.561313 | 1.339662 | 0.008217 | 0.418996 |
| ED_BD | −0.7845 | 0.155486 | −0.09542 | −5.04547 |
| LSI_BD | −0.38762 | 0.149185 | −0.0567 | −2.59828 |
| PLAND_GS | −8.92217 | 0.40302 | −0.36014 | −22.1383 |
| ED_GS | 0.724983 | 0.244178 | 0.066937 | 2.969074 |
| LSI_GS | −0.13117 | 0.181419 | −0.01668 | −0.72302 |
| PD_IS | −5.46872 | 11.16566 | −0.01135 | −0.48978 |
| ED_IS | 1.119746 | 1.013537 | 0.024418 | 1.104791 |
| LSI_IS | 0.059661 | 0.110067 | 0.012142 | 0.542047 |
| 3D Indicator | B | SE(B) | Beta | B/SE(B) |
| BH | 0.00625 | 0.015669 | 0.007984 | 0.398913 |
| CH | −0.05779 | 0.018747 | −0.0647 | −3.08279 |
| BVD | 0.027278 | 0.009067 | 0.062375 | 3.008631 |
| SVF | −2.22628 | 0.989313 | −0.04503 | −2.25033 |
| SUHII_8:00 | SUHII_11:00 | SUHII_14:00 | SUHII_17:00 | |
| R2 | 0.605 | 0.840 | 0.903 | 0.580 |
| Adj.R2 | 0.573 | 0.827 | 0.895 | 0.546 |
| F | 19.347 | 66.299 | 117.638 | 17.426 |
| Sig. | 0.000 | 0.000 | 0.000 | 0.000 |
| Strong Heat Island (SHI) | ||||
|---|---|---|---|---|
| Indicator | B | Beta | Tolerence | VIF |
| SVF | −15.354 | −0.937 | 0.177 | 5.654 |
| PD_WB | 1.507 | 0.657 | 0.145 | 6.896 |
| ED_BD | −2.32 | −0.534 | 0.125 | 8.013 |
| PD_GS | −107.838 | −0.497 | 0.168 | 5.953 |
| CH | −0.165 | −0.405 | 0.258 | 3.875 |
| Weak Heat Island (WHI) | ||||
| Indicator | B | Beta | Tolerence | VIF |
| ED_BD | −3.525 | −1.143 | 0.125 | 8.013 |
| PD_GS | 18.099 | 0.118 | 0.168 | 5.953 |
| ED_GS | −0.362 | −0.102 | 0.404 | 2.474 |
| PLAND_IS | 29.116 | 0.369 | 0.232 | 4.306 |
| LSI_IS | −0.411 | −0.338 | 0.353 | 2.834 |
| Strong Cold Island (SCI) | ||||
| Indicator | B | Beta | Tolerence | VIF |
| SVF | −11.951 | −1.134 | 0.177 | 5.654 |
| BVD | −0.107 | −1.111 | 0.107 | 9.359 |
| CH | 0.278 | 1.068 | 0.258 | 3.875 |
| PD_GS | −119.397 | −0.857 | 0.168 | 5.953 |
| PLAND_IS | −48.853 | −0.684 | 0.232 | 4.306 |
| Weak Cold Island (WCI) | ||||
| Indicator | B | Beta | Tolerence | VIF |
| BVD | 0.05 | 1.22 | 0.107 | 9.359 |
| PLAND_IS | 35.497 | 1.163 | 0.232 | 4.306 |
| PD_GS | 65.629 | 1.101 | 0.168 | 5.953 |
| PLAND_WB | 83.85 | 1.057 | 0.193 | 9.700 |
| SVF | 4.629 | 1.028 | 0.177 | 5.654 |
| Dataset | Training | Testing | ||||
|---|---|---|---|---|---|---|
| R2 | RMSE | MSE | R2 | RMSE | MSE | |
| SUHII_8:00 | 0.934 | 0.775 | 0.601 | 0.541 | 2.259 | 5.103 |
| SUHII_11:00 | 0.969 | 1.102 | 1.214 | 0.854 | 2.526 | 6.381 |
| SUHII_14:00 | 0.989 | 0.767 | 0.588 | 0.940 | 1.873 | 3.508 |
| SUHII_17:00 | 0.933 | 0.849 | 0.721 | 0.758 | 1.732 | 3.000 |
| Average | 0.957 | 0.873 | 0.781 | 0.773 | 2.098 | 4.498 |
| Variable | Regression Coefficient of SUHII | |||
|---|---|---|---|---|
| SUHII_8:00 | SUHII_11:00 | SUHII_14:00 | SUHII_17:00 | |
| Campus 2D indicators | 72.6% | 84.1% | 90.8% | 78.6% |
| Campus 3D indicators | 26.4% | 39.2% | 38.9% | 12.1% |
| All of campus 2D/3D indicators | 80.7% | 91.7% | 96.7% | 86.9% |
Disclaimer/Publisher’s Note: The statements, opinions and data contained in all publications are solely those of the individual author(s) and contributor(s) and not of MDPI and/or the editor(s). MDPI and/or the editor(s) disclaim responsibility for any injury to people or property resulting from any ideas, methods, instructions or products referred to in the content. |
© 2025 by the authors. Licensee MDPI, Basel, Switzerland. This article is an open access article distributed under the terms and conditions of the Creative Commons Attribution (CC BY) license (https://creativecommons.org/licenses/by/4.0/).
Share and Cite
Dong, W.; Wu, J.; Yang, Y.; Shen, S. Investigating the Spatiotemporal Dynamics of Campus Surface Heat Island with High-Resolution Thermal Infrared Imaging. Land 2025, 14, 1142. https://doi.org/10.3390/land14061142
Dong W, Wu J, Yang Y, Shen S. Investigating the Spatiotemporal Dynamics of Campus Surface Heat Island with High-Resolution Thermal Infrared Imaging. Land. 2025; 14(6):1142. https://doi.org/10.3390/land14061142
Chicago/Turabian StyleDong, Wei, Jinxiu Wu, Yanxiang Yang, and Shuyu Shen. 2025. "Investigating the Spatiotemporal Dynamics of Campus Surface Heat Island with High-Resolution Thermal Infrared Imaging" Land 14, no. 6: 1142. https://doi.org/10.3390/land14061142
APA StyleDong, W., Wu, J., Yang, Y., & Shen, S. (2025). Investigating the Spatiotemporal Dynamics of Campus Surface Heat Island with High-Resolution Thermal Infrared Imaging. Land, 14(6), 1142. https://doi.org/10.3390/land14061142