
Temporal and Spatial Patterns of Blue Carbon Storage in Mangrove and Salt Marsh Ecosystems in Guangdong, China

Abstract
1. Introduction
2. Materials
2.1. Study Area
2.2. Datasets
2.2.1. Landsat Data and Preprocessing
2.2.2. Reference Data
3. Methods
3.1. Detection of Mangroves and Salt Marshes
3.2. Dynamic Degree of Area
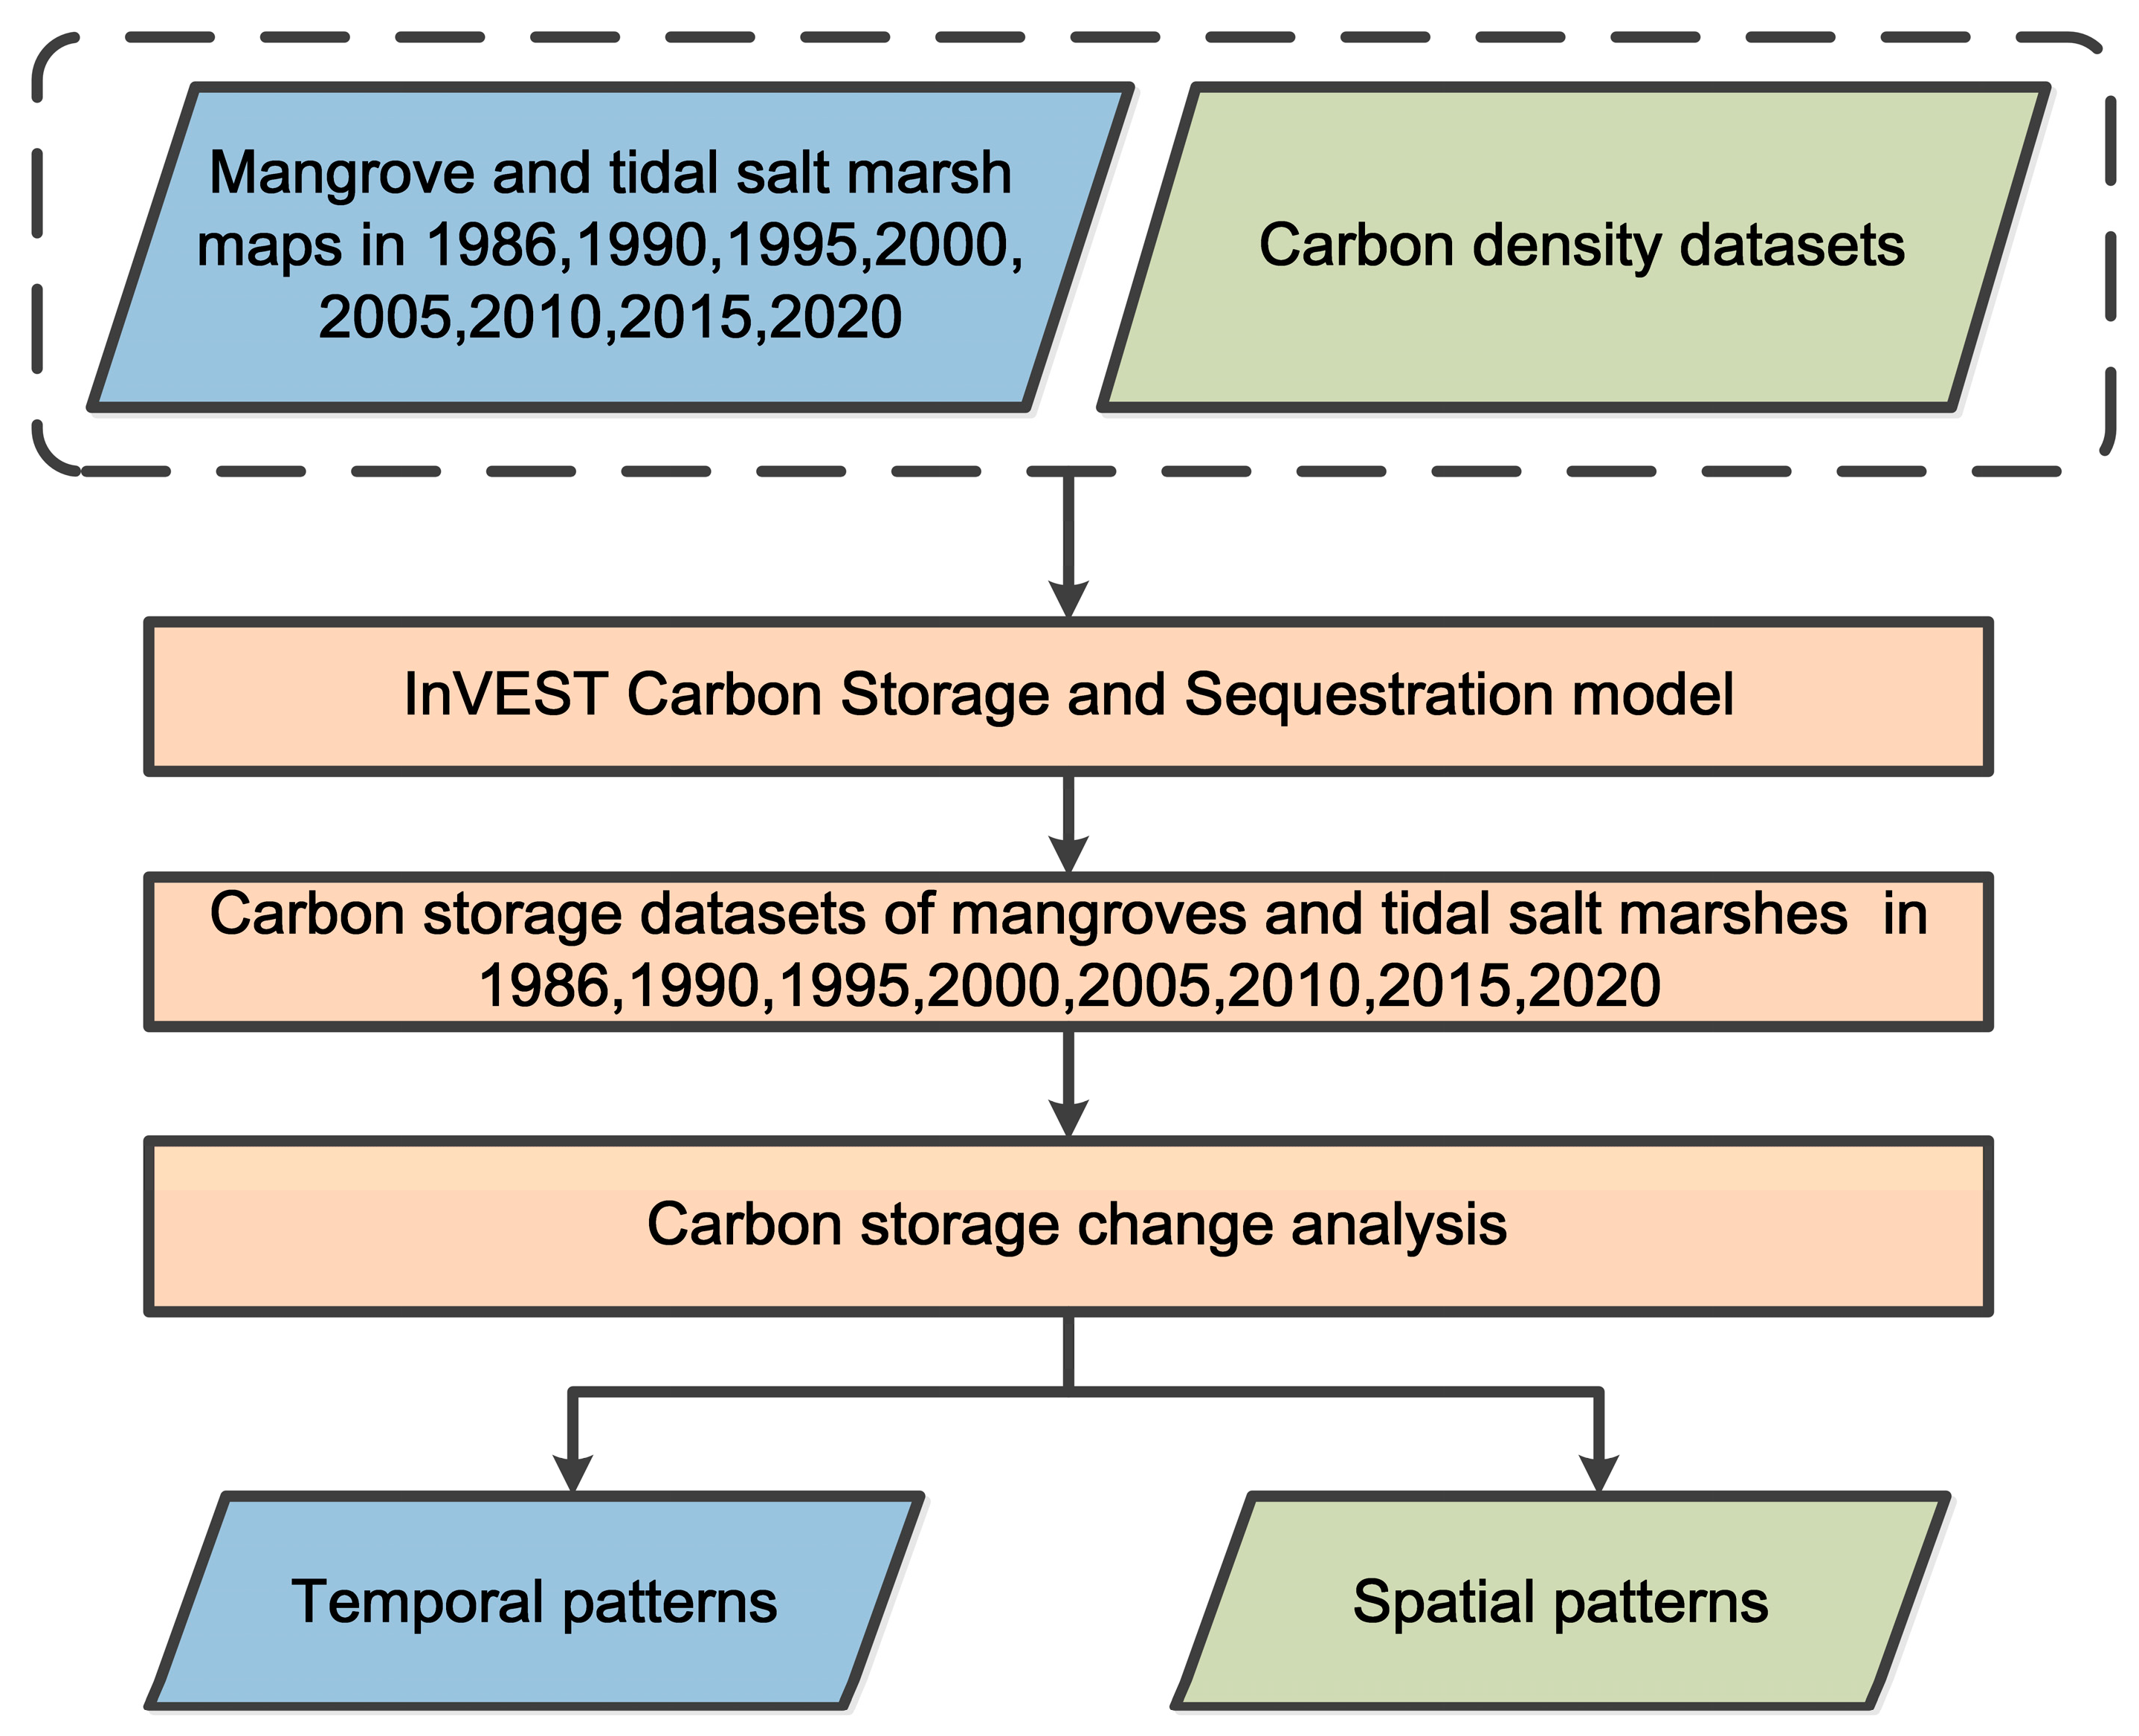
3.3. Carbon Storage Assessment for Mangroves and Salt Marshes with the InVEST Model
4. Results
4.1. Accuracy Assessment
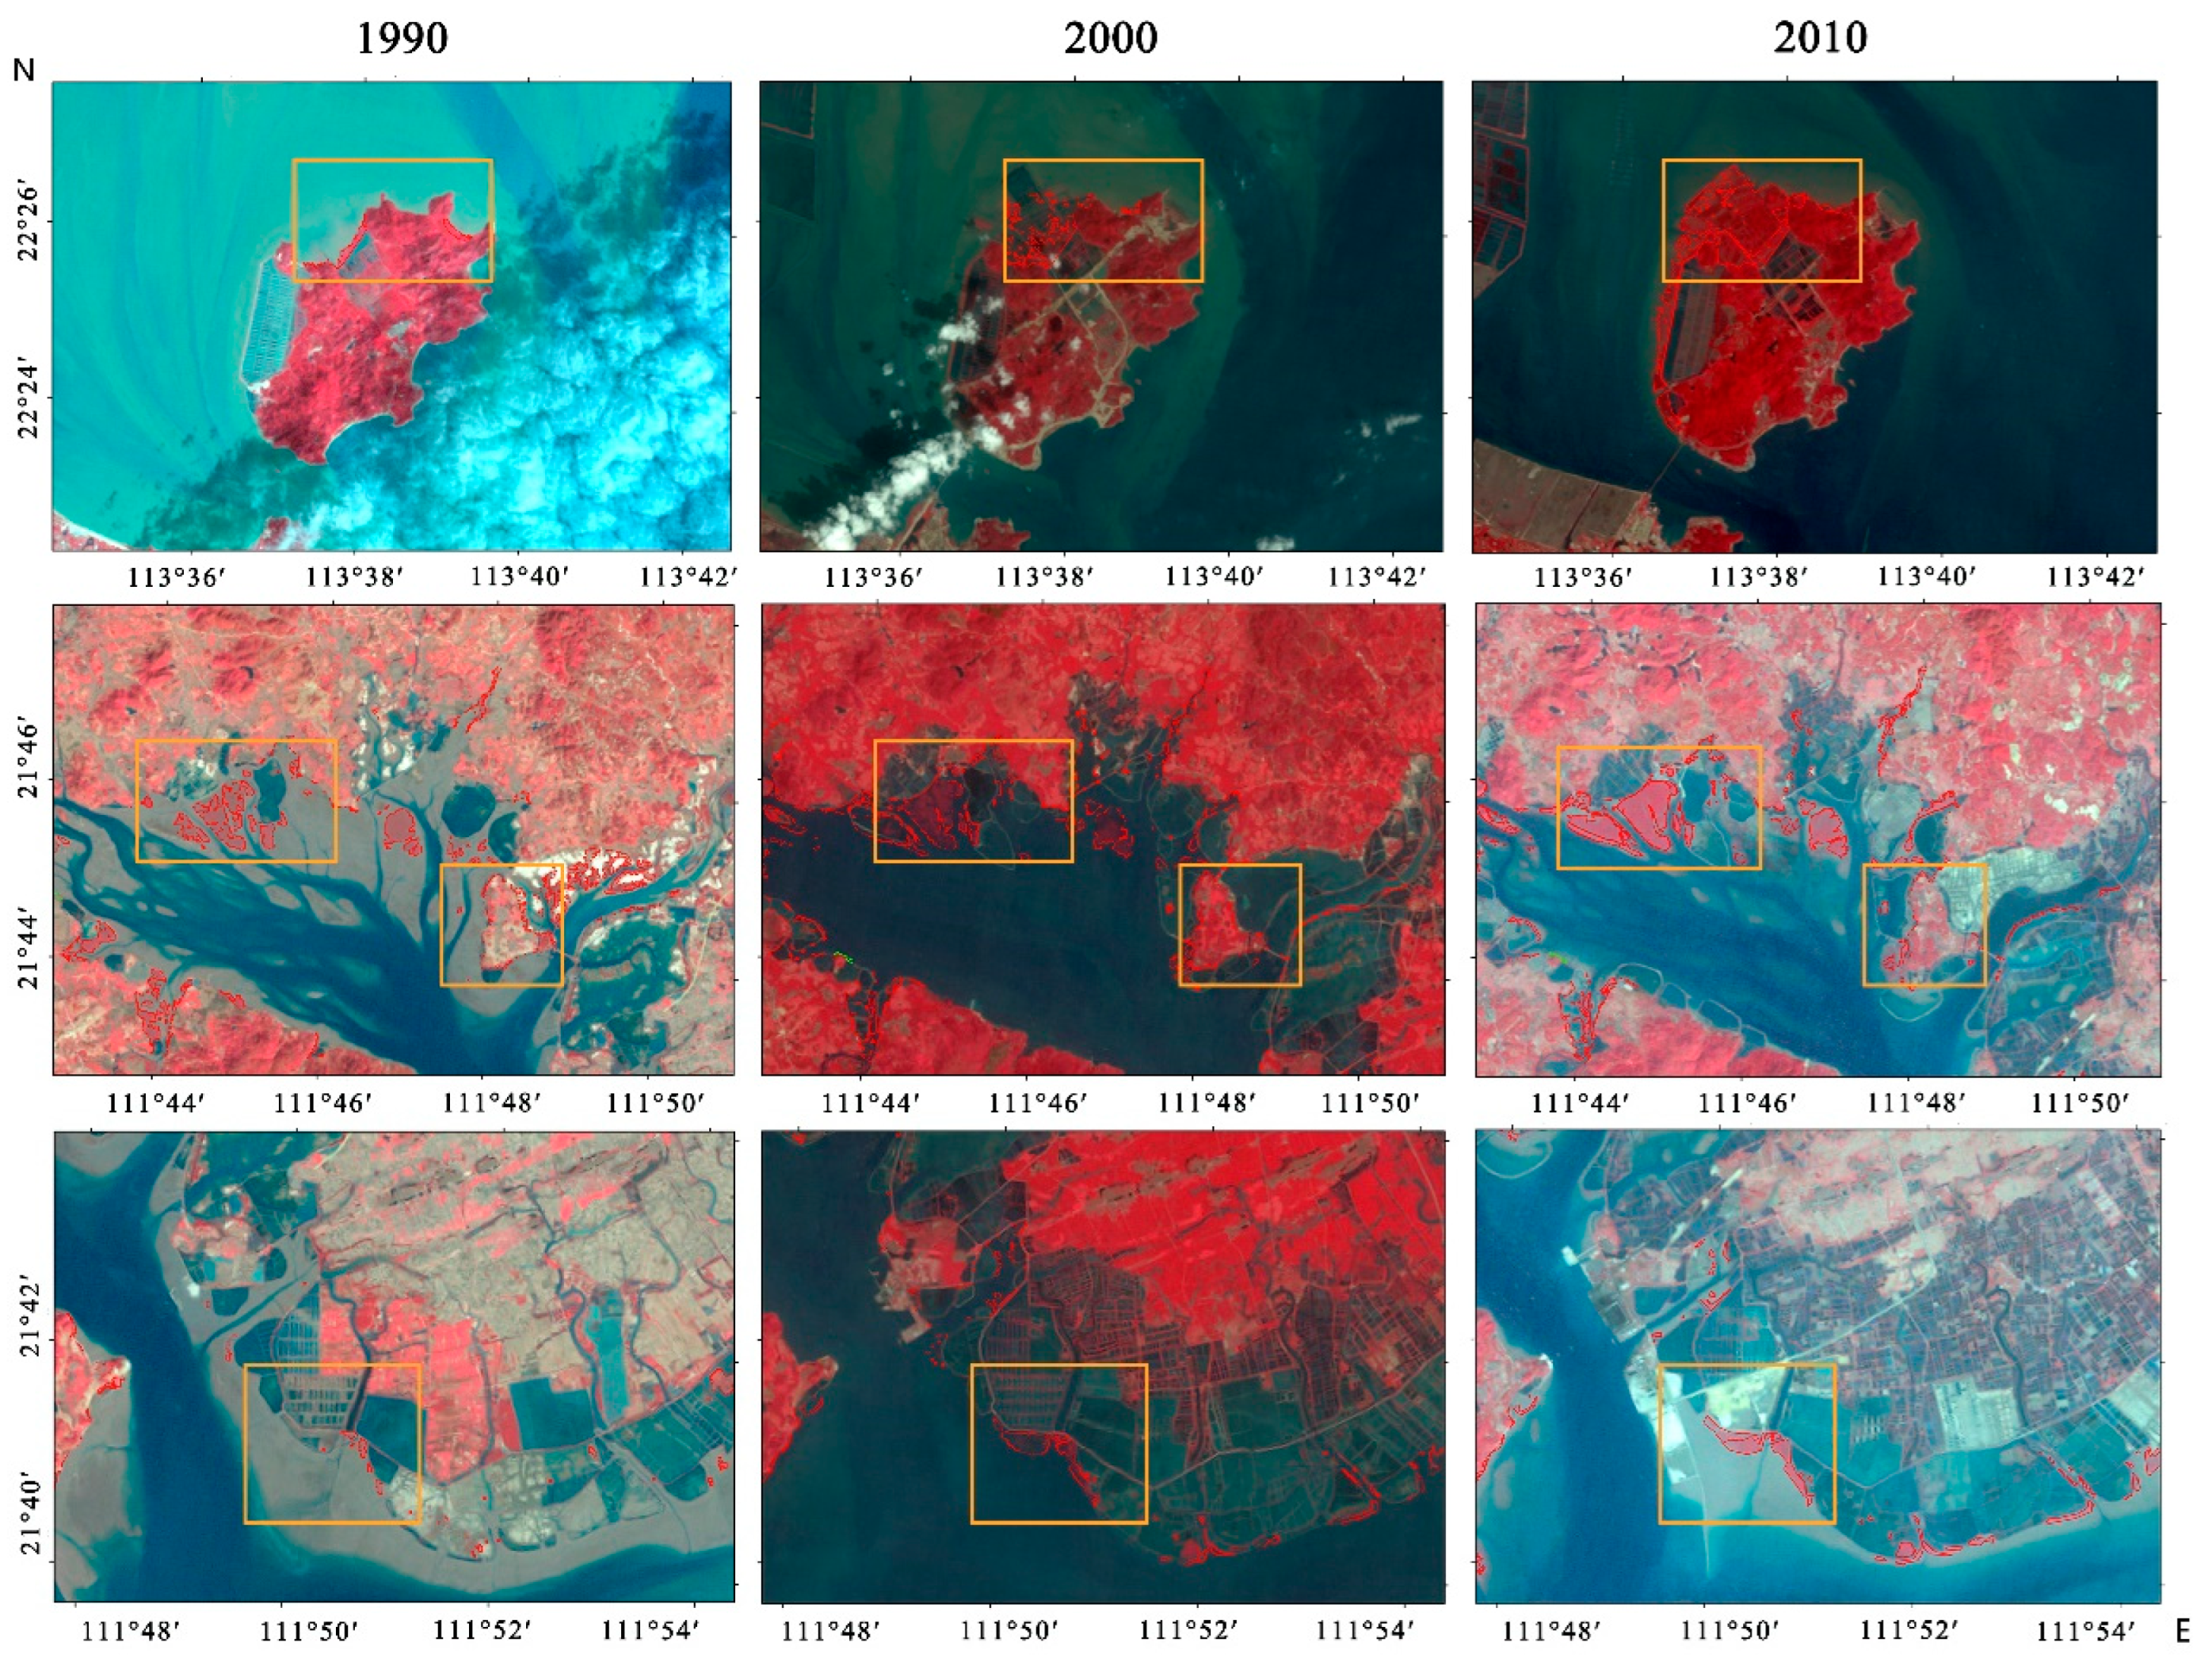
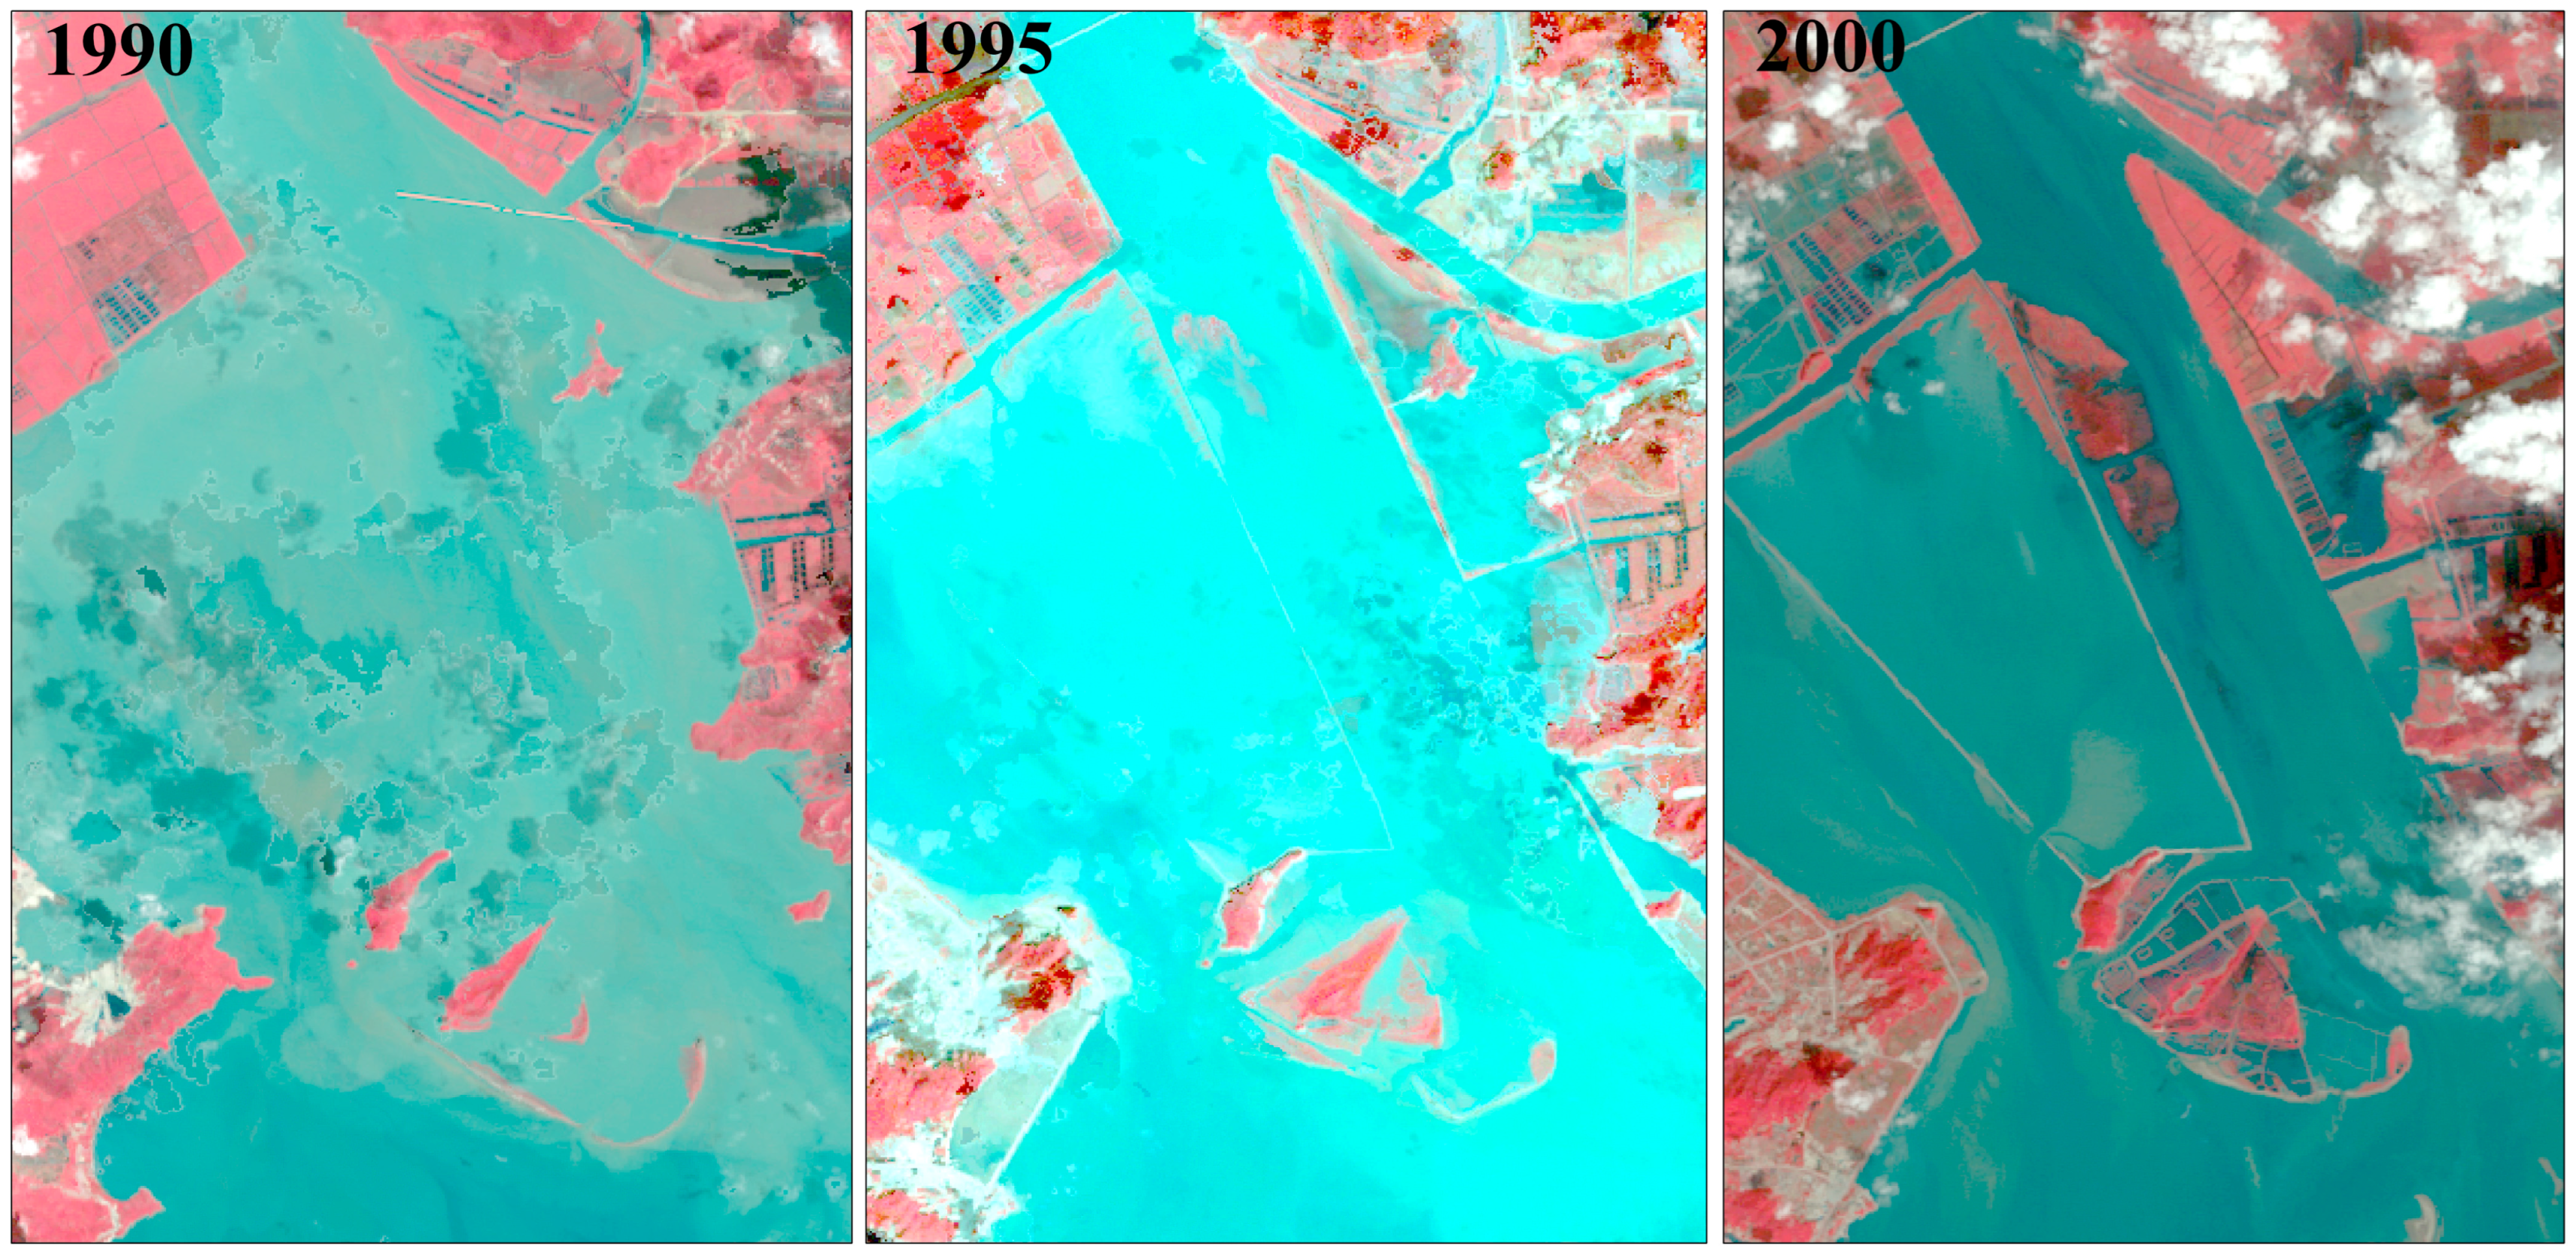
4.2. Spatiotemporal Patterns of Mangroves
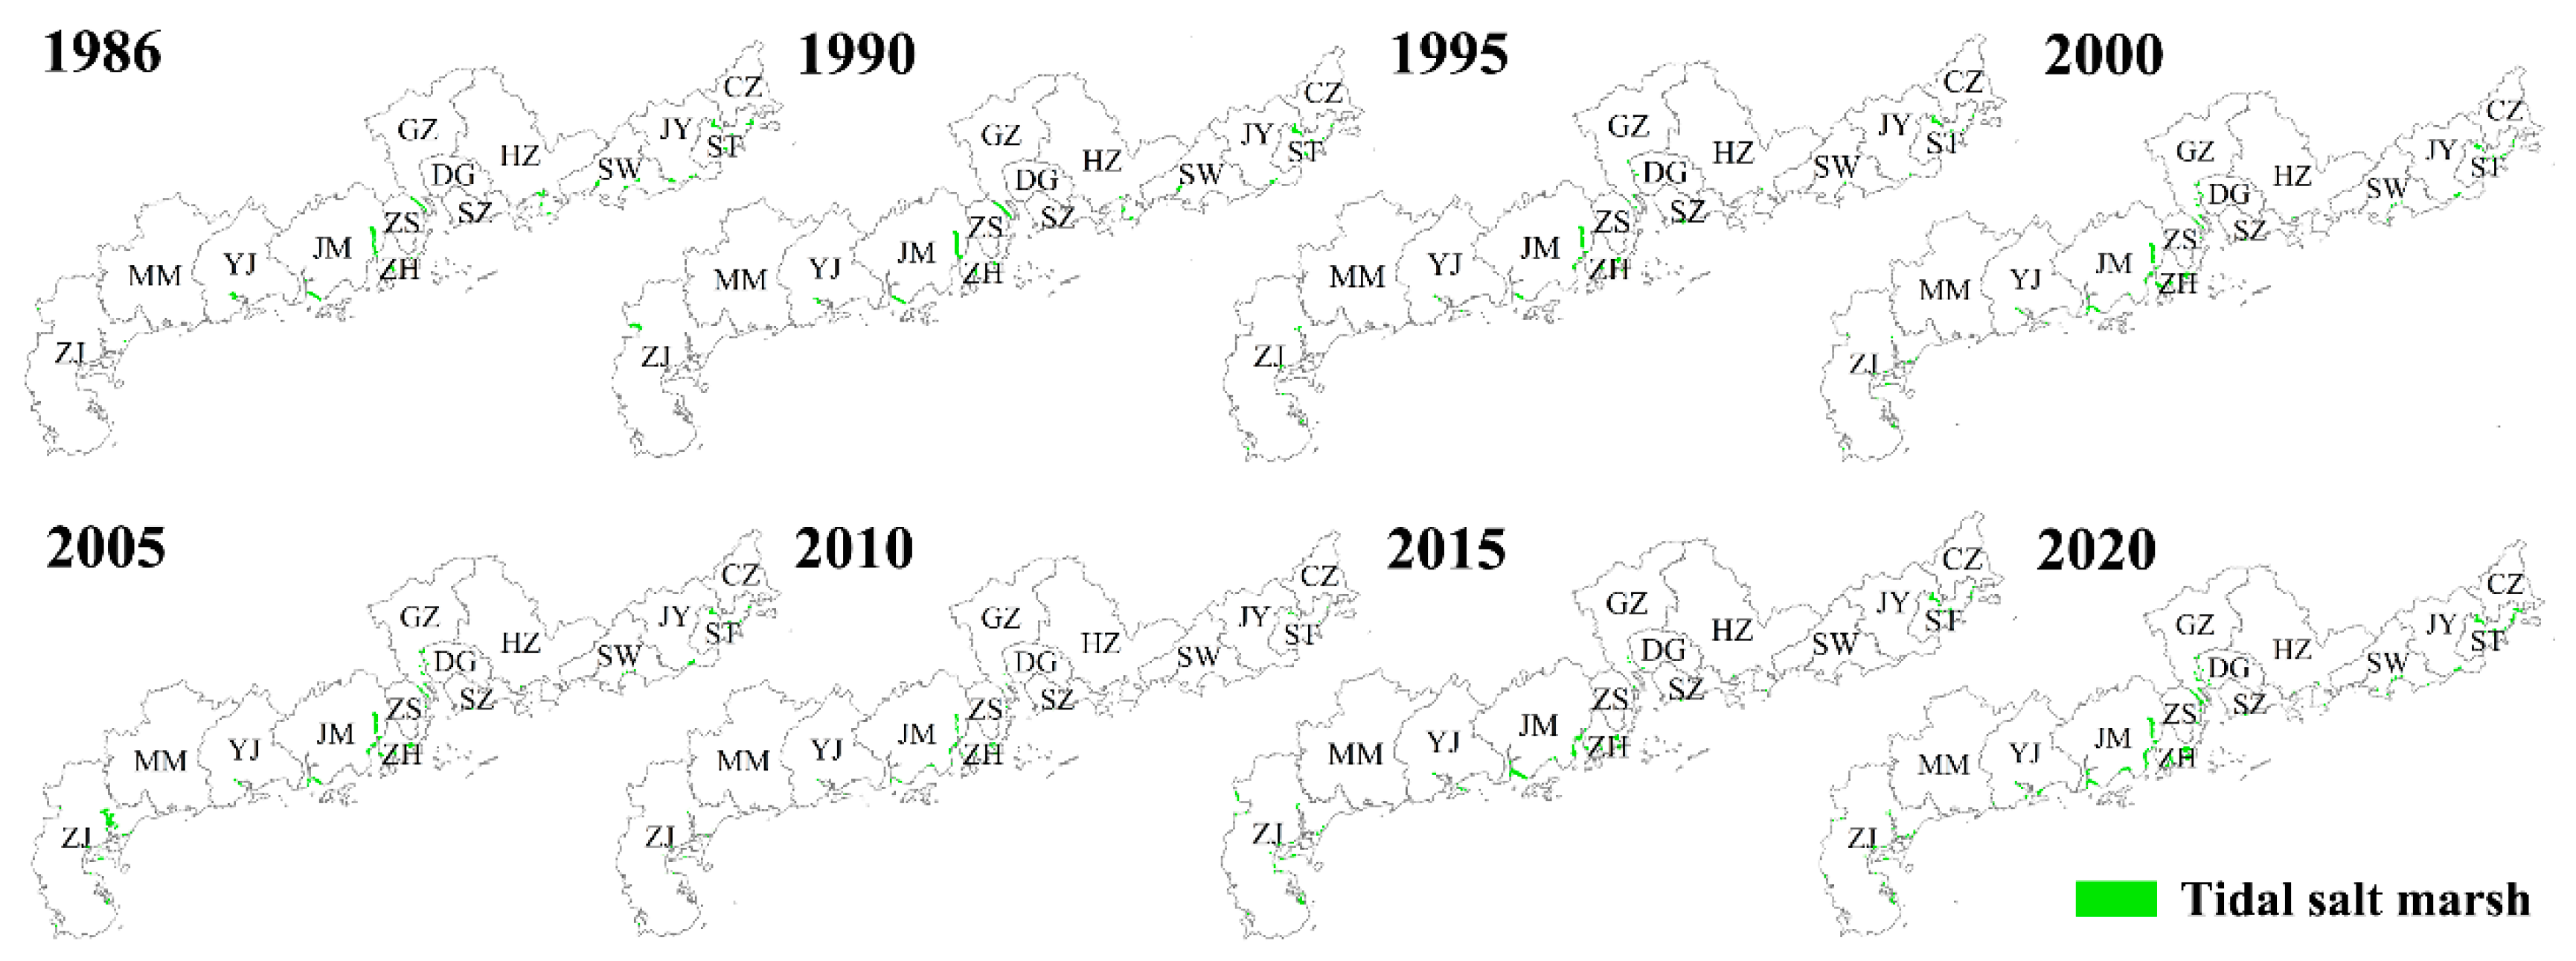
4.3. Spatiotemporal Patterns of Salt Marshes
4.4. Spatiotemporal Analysis of Carbon Storage in Mangroves and Salt Marshes
5. Discussion
5.1. Mangroves and Salt Marshes in Guangdong
5.2. Factors Affecting Mangroves and Salt Marshes
5.3. Implications for Blue Carbon Ecosystem Management in Guangdong
5.4. Limitations and Future Improvements
6. Conclusions
- (1)
- The proposed method provided two coastal vegetation detection methods, exploring the potential of utilizing phenological features to improve the identification accuracy. The overall accuracies of the mangrove and salt marsh detection results exceeded 90%, suggesting good consistency with the validation data.
- (2)
- Over the study period, the mangrove extent showed a trend of decreasing from 1986 to 1995, then fluctuated from 1995 to 2005, and presented an upward trend from 2005 to 2020. The overall trend of the salt marsh area was upward, with small fluctuations from 1986 to 2020.
- (3)
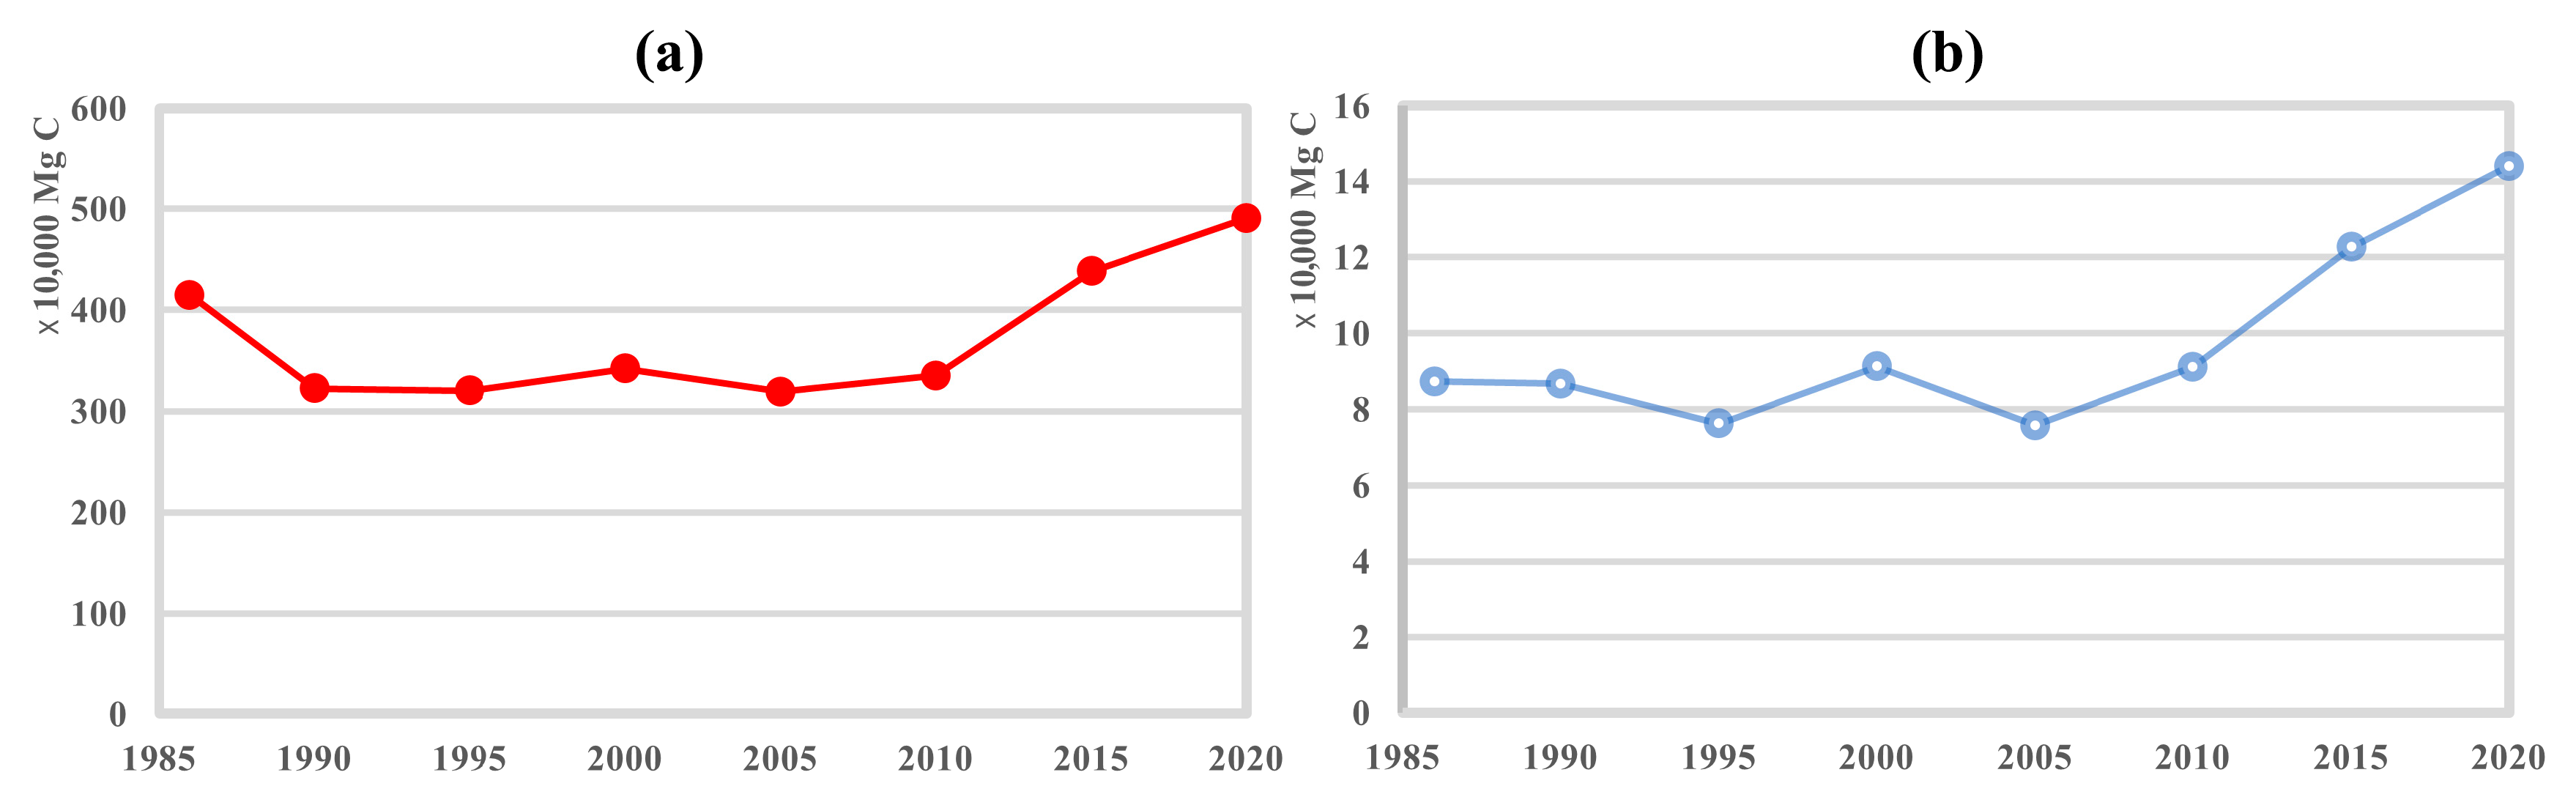
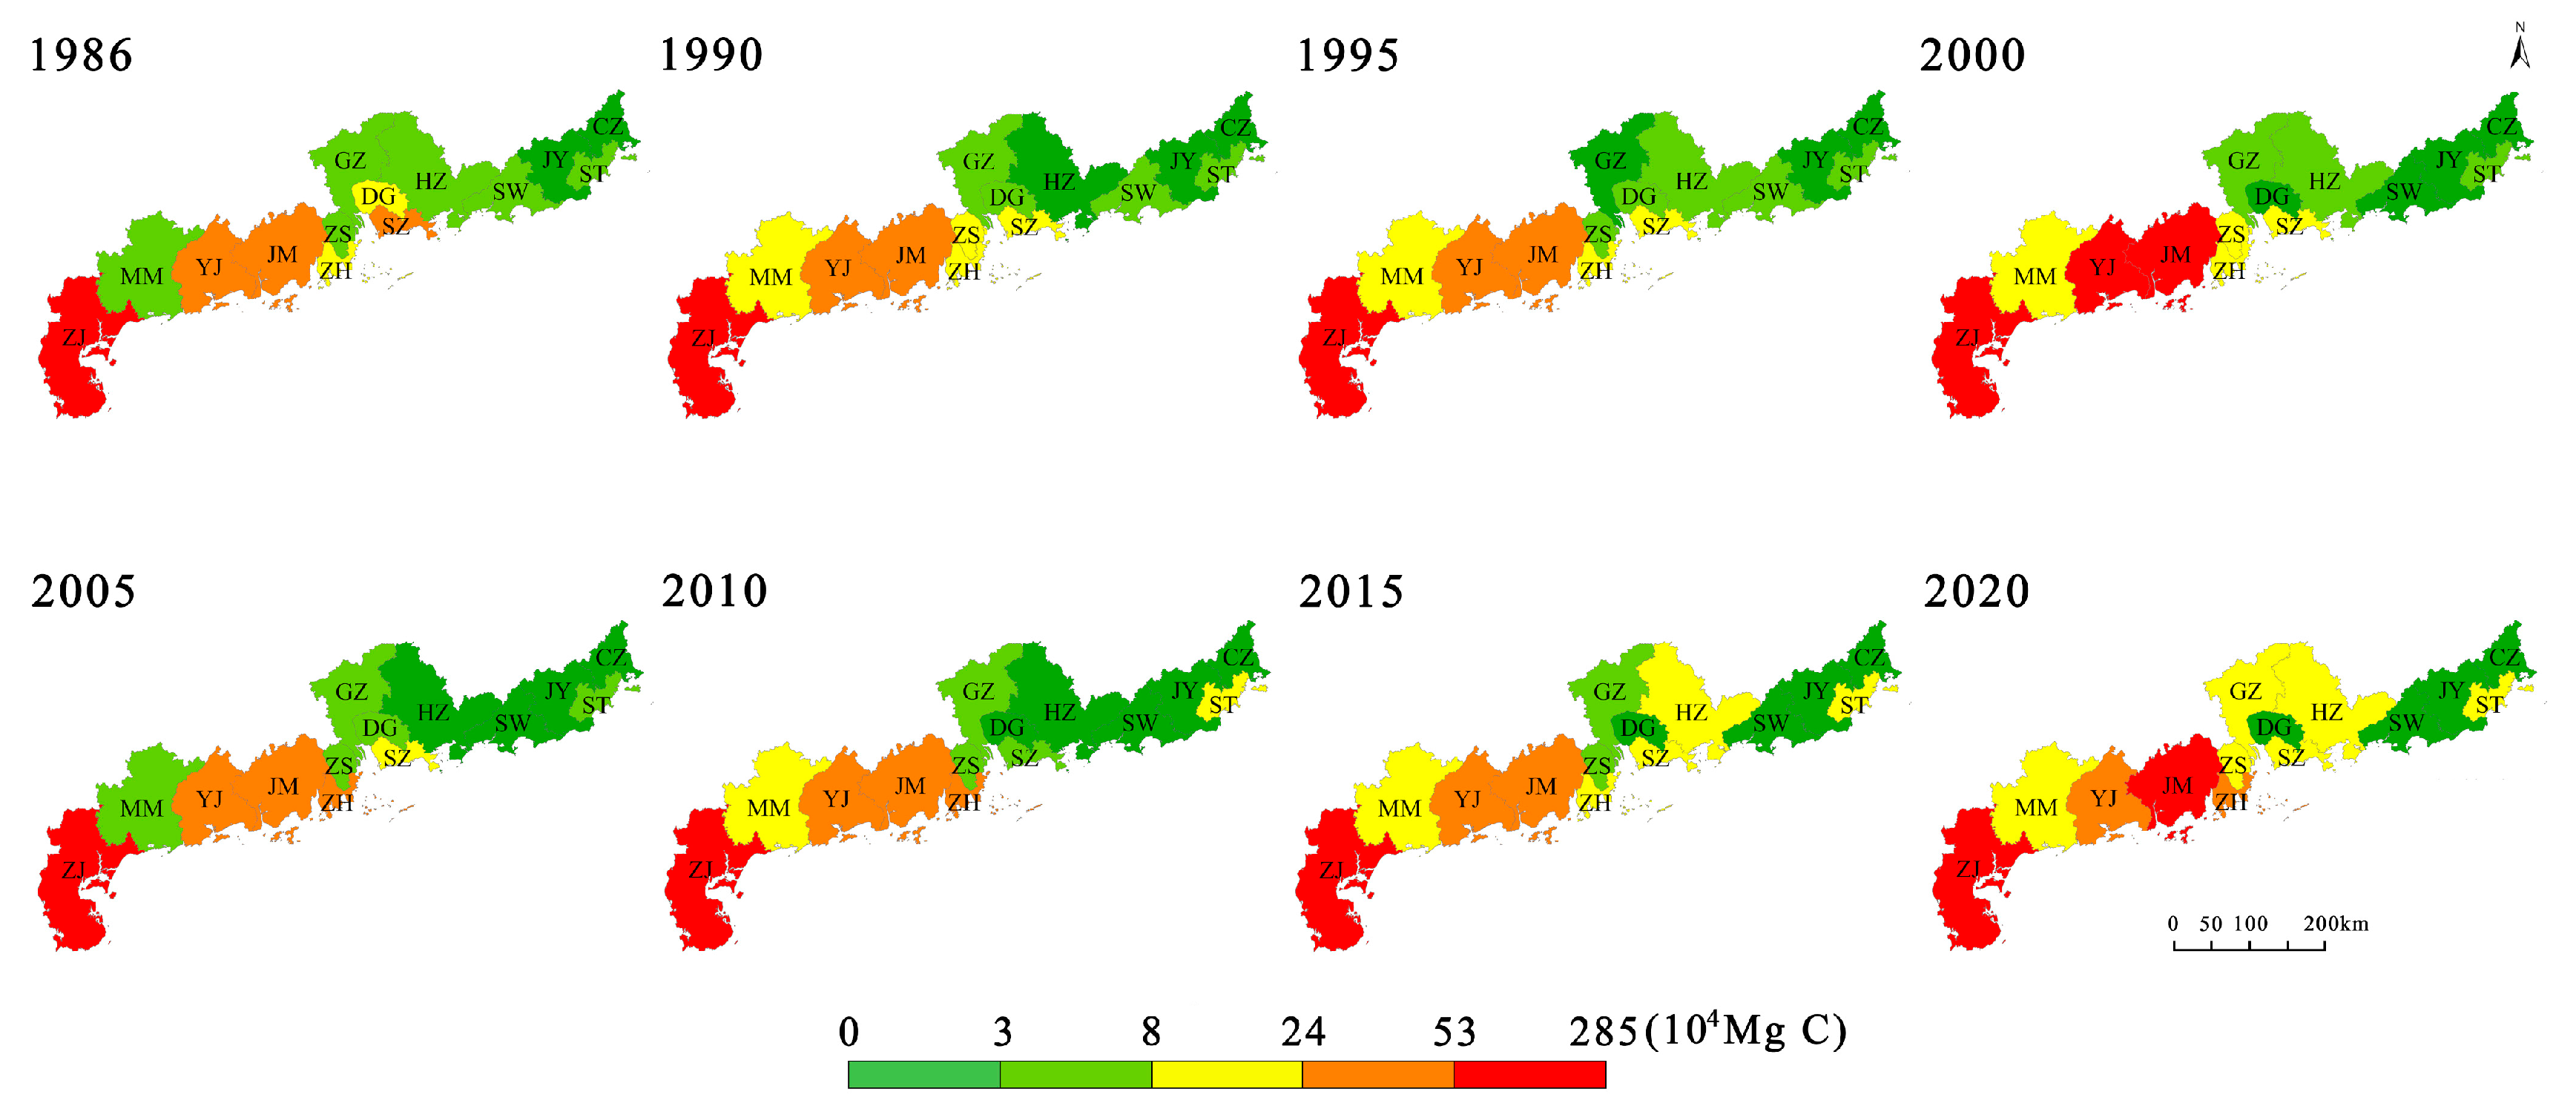
- The mangrove carbon storage in Guangdong increased from 414.66 104 Mg C to 490.49 104 Mg C during 1986–2020, with Zhanjiang having the largest mangrove carbon storage increase. The distribution pattern of mangrove carbon storage in Guangdong exhibits significant spatial heterogeneity, characterized by higher values in western Guangdong and lower values in eastern Guangdong.
- (4)
- The salt marsh carbon storage in Guangdong grew from 8.73 104 Mg C in 1986 to 14.39 104 Mg C in 2020, with Zhuhai having the largest increase in salt marsh carbon storage. The high salt marsh carbon storage areas in Guangdong are mainly concentrated in Zhuhai, Jiangmen, Zhanjiang, Shantou, and Jieyang.
- (5)
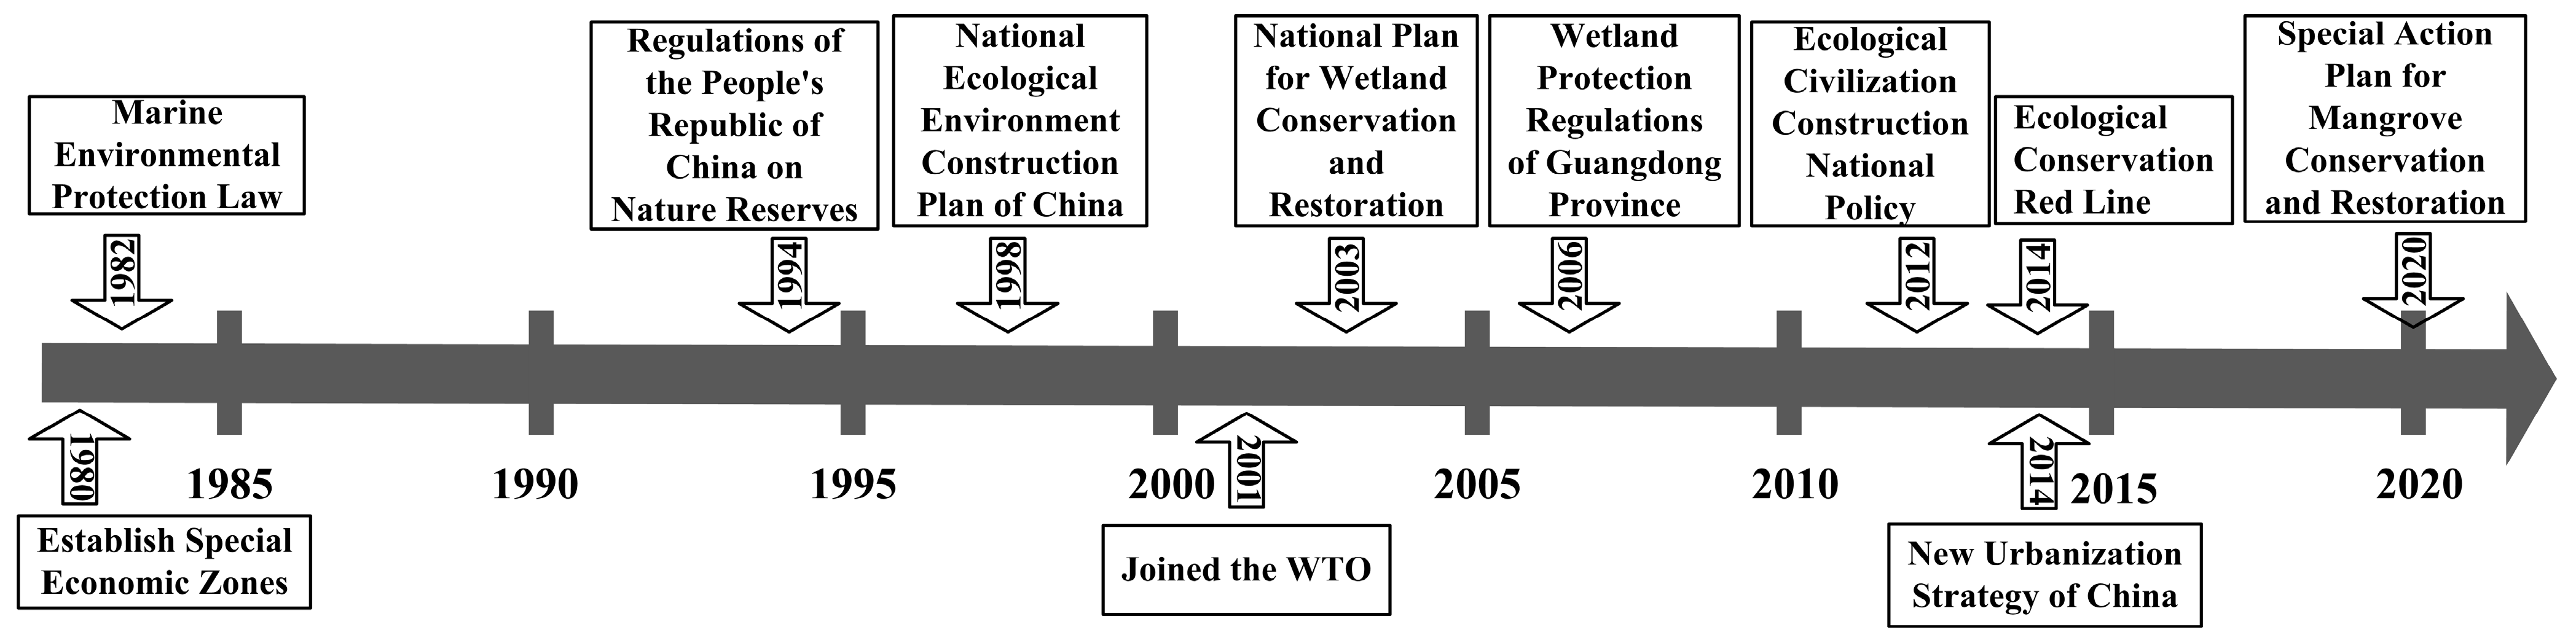
- The temporal changes in mangrove and salt marsh carbon storage could be separated into three stages: a decreasing period, a fluctuating period, and a rapidly increasing period, during which the ecological and economic policies played a crucial role. The turning points of carbon storage dynamics for mangroves and salt marshes were consistent with the timing of the policy implementation.
- (6)
- The multi-decadal blue carbon datasets and their temporal-spatial change analysis results here can offer a scientific basis for coastal ecosystem restoration, nature-based climate solutions, and a decision-support tool for sustainable coastal zone management. In addition, based on Landsat imagery, the proposed method could be employed in other coastal ecotones in China, enabling regional and national blue carbon monitoring programs.
Supplementary Materials
Author Contributions
Funding
Data Availability Statement
Acknowledgments
Conflicts of Interest
Appendix A


References
- Macreadie, P.I.; Anton, A.; Raven, J.A.; Beaumont, N.; Connolly, R.M.; Friess, D.A.; Kelleway, J.J.; Kennedy, H.; Kuwae, T.; Lavery, P.S. The future of Blue Carbon science. Nat. Commun. 2019, 10, 3998. [Google Scholar] [CrossRef] [PubMed]
- Macreadie, P.I.; Costa, M.D.; Atwood, T.B.; Friess, D.A.; Kelleway, J.J.; Kennedy, H.; Lovelock, C.E.; Serrano, O.; Duarte, C.M. Blue carbon as a natural climate solution. Nat. Rev. Earth Environ. 2021, 2, 826–839. [Google Scholar] [CrossRef]
- Alongi, D.M. Global significance of mangrove blue carbon in climate change mitigation. Science 2020, 2, 67. [Google Scholar] [CrossRef]
- Choudhary, B.; Dhar, V.; Pawase, A.S. Blue carbon and the role of mangroves in carbon sequestration: Its mechanisms, estimation, human impacts and conservation strategies for economic incentives. J. Sea Res. 2024, 199, 102504. [Google Scholar] [CrossRef]
- Sousa, A.I.; Lillebø, A.I.; Pardal, M.A.; Caçador, I. The influence of Spartina maritima on carbon retention capacity in salt marshes from warm-temperate estuaries. Mar. Pollut. Bull. 2010, 61, 215–223. [Google Scholar] [CrossRef]
- Costanza, R.; d’Arge, R.; De Groot, R.; Farber, S.; Grasso, M.; Hannon, B.; Limburg, K.; Naeem, S.; O’neill, R.V.; Paruelo, J. The value of the world’s ecosystem services and natural capital. Nature 1997, 387, 253–260. [Google Scholar] [CrossRef]
- Morris, R.L.; Fest, B.; Stokes, D.; Jenkins, C.; Swearer, S.E. The coastal protection and blue carbon benefits of hybrid mangrove living shorelines. J. Environ. Manag. 2023, 331, 117310. [Google Scholar] [CrossRef] [PubMed]
- Davis, J.L.; Currin, C.A.; O’Brien, C.; Raffenburg, C.; Davis, A. Living shorelines: Coastal resilience with a blue carbon benefit. PLoS ONE 2015, 10, e0142595. [Google Scholar] [CrossRef]
- Fu, C.; Steckbauer, A.; Mann, H.; Duarte, C.M. Achieving the Kunming–Montreal global biodiversity targets for blue carbon ecosystems. Nat. Rev. Earth Environ. 2024, 5, 538–552. [Google Scholar] [CrossRef]
- Wei, S.; Lin, Y.; Wan, L.; Lin, G.; Zhang, Y.; Zhang, H. Developing a grid-based association rules mining approach to quantify the impacts of urbanization on the spatial extent of mangroves in China. Int. J. Appl. Earth Obs. 2021, 102, 102431. [Google Scholar] [CrossRef]
- Wei, S.; Zhang, H.; Xu, Z.; Lin, G.; Lin, Y.; Liang, X.; Ling, J.; Wee, A.K.S.; Lin, H.; Zhou, Y. Coastal urbanization may indirectly positively impact growth of mangrove forests. Commun. Earth Environ. 2024, 5, 608. [Google Scholar] [CrossRef]
- Tay, J.Y.; Wong, S.K.; Chou, L.; Todd, P.A. Land reclamation and the consequent loss of marine habitats around the Ayer Islands, Singapore. Nat. Singap. 2018, 11, 1–5. [Google Scholar]
- Slamet, N.S.; Dargusch, P.; Aziz, A.A.; Wadley, D. Mangrove vulnerability and potential carbon stock loss from land reclamation in Jakarta Bay, Indonesia. Ocean. Coast. Manag. 2020, 195, 105283. [Google Scholar] [CrossRef]
- Lovelock, C.E.; Reef, R. Variable impacts of climate change on blue carbon. One Earth 2020, 3, 195–211. [Google Scholar] [CrossRef]
- Raihan, A. A review of tropical blue carbon ecosystems for climate change mitigation. J. Environ. Sci. Econo. 2023, 2, 14–36. [Google Scholar] [CrossRef]
- Fan, B.; Li, Y. China’s conservation and restoration of coastal wetlands offset much of the reclamation-induced blue carbon losses. Glob. Chang. Biol. 2024, 30, e17039. [Google Scholar] [CrossRef]
- Li, P.; Liu, D.; Liu, C.; Li, X.; Liu, Z.; Zhu, Y.; Peng, B. Blue carbon development in China: Realistic foundation, internal demands, and the construction of blue carbon market trading mode. Front. Mar. Sci. 2024, 10, 1310261. [Google Scholar] [CrossRef]
- Liu, H.; Wang, H.; Nong, H.; He, Y.; Chen, Y.; Wang, H.; Yu, M. Opportunities and implementation pathway for China’s forestry development under the “Dual Carbon” strategy. Carbon. Res. 2024, 3, 59. [Google Scholar] [CrossRef]
- Wang, F.; Liu, J.; Qin, G.; Zhang, J.; Zhou, J.; Wu, J.; Zhang, L.; Thapa, P.; Sanders, C.J.; Santos, I.R. Coastal blue carbon in China as a nature-based solution toward carbon neutrality. Innovation 2023, 4, 100481. [Google Scholar] [CrossRef]
- Howard, J.; Hoyt, S.; Isensee, K.; Pidgeon, E.; Telszewski, M. Coastal Blue Carbon: Methods for Assessing Carbon Stocks and Emissions Factors in Mangroves, Tidal Salt Marshes, and Seagrass Meadows; Conservation International, Intergovernmental Oceanographic Commission of UNESCO, International Union for Conservation of Nature: Arlington, VA, USA, 2014. [Google Scholar]
- Deng, Y.; Jiang, W.; Wu, Z.; Peng, K.; Ling, Z.; Li, Z.; Wang, X. Assessing and characterizing carbon storage in wetlands of the Guangdong–Hong Kong–Macau Greater Bay Area, China, during 1995–2020. IEEE J. Sel. Top. Appl. Earth Obs. Remote Sens. 2022, 15, 6110–6120. [Google Scholar] [CrossRef]
- Wang, G.; Guan, D.; Peart, M.; Chen, Y.; Peng, Y. Ecosystem carbon stocks of mangrove forest in Yingluo Bay, Guangdong Province of South China. For. Ecol. Manag. 2013, 310, 539–546. [Google Scholar] [CrossRef]
- Liu, H.; Ren, H.; Hui, D.; Wang, W.; Liao, B.; Cao, Q. Carbon stocks and potential carbon storage in the mangrove forests of China. J. Environ. Manag. 2014, 133, 86–93. [Google Scholar] [CrossRef] [PubMed]
- Li, K.; Huang, H.; Yan, R.; Zhang, S.; Dong, D.; Peng, B. Carbon storage potential and influencing factors of mangrove plantation in Kaozhouyang, Guangdong Province, South China. Front. Mar. Sci. 2025, 11, 1439266. [Google Scholar]
- Tue, N.T.; Dung, L.V.; Nhuan, M.T.; Omori, K. Carbon storage of a tropical mangrove forest in Mui Ca Mau National Park, Vietnam. Catena 2014, 121, 119–126. [Google Scholar] [CrossRef]
- Bansal, S.; Creed, I.F.; Tangen, B.A.; Bridgham, S.D.; Desai, A.R.; Krauss, K.W.; Neubauer, S.C.; Noe, G.B.; Rosenberry, D.O.; Trettin, C. Practical guide to measuring wetland carbon pools and fluxes. Wetlands 2023, 43, 105. [Google Scholar]
- Li, P.; Chen, J.; Li, Y.; Wu, W. Using the InVEST-PLUS model to predict and analyze the pattern of ecosystem carbon storage in Liaoning Province, China. Remote Sens. 2023, 15, 4050. [Google Scholar] [CrossRef]
- Huang, C.; Zhang, C.; Li, H. Assessment of the impact of rubber plantation expansion on regional carbon storage based on time series remote sensing and the InVEST model. Remote Sens. 2022, 14, 6234. [Google Scholar] [CrossRef]
- He, Y.; Ma, J.; Zhang, C.; Yang, H. Spatio-temporal evolution and prediction of carbon storage in Guilin based on FLUS and InVEST models. Remote Sens. 2023, 15, 1445. [Google Scholar] [CrossRef]
- Veisi Nabikandi, B.; Shahbazi, F. Determining carbon storage content at different pools under various land uses in Miandoab region using remotely-sensed data and InVEST model. J. Nat. Environ. 2024, 77, 241–253. [Google Scholar]
- Kafy, A.-A.; Saha, M.; Fattah, M.A.; Rahman, M.T.; Duti, B.M.; Rahaman, Z.A.; Bakshi, A.; Kalaivani, S.; Rahaman, S.N.; Sattar, G.S. Integrating forest cover change and carbon storage dynamics: Leveraging Google Earth Engine and InVEST model to inform conservation in hilly regions. Ecol. Indic. 2023, 152, 110374. [Google Scholar] [CrossRef]
- Fu, Q.; Xu, L.; Zheng, H.; Chen, J. Spatiotemporal dynamics of carbon storage in response to urbanization: A case study in the Su-Xi-Chang region, China. Processes 2019, 7, 836. [Google Scholar] [CrossRef]
- Li, J.; Yan, D.; Yao, X.; Liu, Y.; Xie, S.; Sheng, Y.; Luan, Z. Dynamics of carbon storage in saltmarshes across China’s Eastern Coastal Wetlands from 1987 to 2020. Front. Mar. Sci. 2022, 9, 915727. [Google Scholar] [CrossRef]
- Tian, J.; Wang, L.; Yin, D.; Li, X.; Diao, C.; Gong, H.; Shi, C.; Menenti, M.; Ge, Y.; Nie, S.; et al. Development of spectral-phenological features for deep learning to understand Spartina alterniflora invasion. Remote Sens. Environ. 2020, 242, 111745. [Google Scholar] [CrossRef]
- Zhao, C.; Jia, M.; Wang, Z.; Mao, D.; Wang, Y. Toward a better understanding of coastal salt marsh mapping: A case from China using dual-temporal images. Remote Sens. Environ. 2023, 295, 113664. [Google Scholar] [CrossRef]
- Zhang, X.; Liu, L.; Zhao, T.; Wang, J.; Liu, W.; Chen, X. Global annual wetland dataset at 30 m with a fine classification system from 2000 to 2022. Sci. Data 2024, 11, 310. [Google Scholar] [CrossRef]
- Zhang, Z.; Xu, N.; Li, Y.; Li, Y. Sub-continental-scale mapping of tidal wetland composition for East Asia: A novel algorithm integrating satellite tide-level and phenological features. Remote Sens. Environ. 2022, 269, 112799. [Google Scholar] [CrossRef]
- Dong, D.; Wang, C.; Yan, J.; He, Q.; Zeng, J.; Wei, Z. Combing Sentinel-1 and Sentinel-2 image time series for invasive Spartina alterniflora mapping on Google Earth Engine: A case study in Zhangjiang Estuary. J. Appl. Remote Sens. 2020, 14, 044504. [Google Scholar]
- Peng, Y.; Zheng, M.; Zheng, Z.; Wu, G.; Chen, Y.; Xu, H.; Tian, G.; Peng, S.; Chen, G.; Lee, S.Y. Virtual increase or latent loss? A reassessment of mangrove populations and their conservation in Guangdong, southern China. Mar. Pollut. Bull. 2016, 109, 691–699. [Google Scholar] [CrossRef]
- Wang, Y.; Chao, B.; Dong, P.; Zhang, D.; Yu, W.; Hu, W.; Ma, Z.; Chen, G.; Liu, Z.; Chen, B. Simulating spatial change of mangrove habitat under the impact of coastal land use: Coupling MaxEnt and Dyna-CLUE models. Sci. Total Environ. 2021, 788, 147914. [Google Scholar] [CrossRef]
- Dong, D.; Huang, H.; Guo, B.; Yang, J.; Gao, Q.; Wei, Z.; Sun, Y. Mangrove and Salt Marsh Detection in a Mangrove-Saltmarsh Ecotone Using Segment Anything Model from Drone Imagery. In Proceedings of the 2024 Photonics & Electromagnetics Research Symposium (PIERS), Chengdu, China, 21–25 April 2024; pp. 1–7. [Google Scholar]
- Wang, H.; Peng, Y.; Wang, C.; Wen, Q.; Xu, J.; Hu, Z.; Jia, X.; Zhao, X.; Lian, W.; Temmerman, S. Mangrove loss and gain in a densely populated urban estuary: Lessons from the Guangdong-Hong Kong-Macao Greater Bay Area. Front. Mar. Sci. 2021, 8, 693450. [Google Scholar] [CrossRef]
- Giri, C. Observation and Monitoring of Mangrove Forests Using Remote Sensing: Opportunities and Challenges. Remote Sens. 2016, 8, 783. [Google Scholar] [CrossRef]
- Chen, B.; Xiao, X.; Li, X.; Pan, L.; Doughty, R.; Ma, J.; Dong, J.; Qin, Y.; Zhao, B.; Wu, Z. A mangrove forest map of China in 2015: Analysis of time series Landsat 7/8 and Sentinel-1A imagery in Google Earth Engine cloud computing platform. ISPRS J. Photogramm. Remote Sens. 2017, 131, 104–120. [Google Scholar] [CrossRef]
- Bunting, P.; Rosenqvist, A.; Hilarides, L.; Lucas, R.M.; Thomas, N.; Tadono, T.; Worthington, T.A.; Spalding, M.; Murray, N.J.; Rebelo, L.-M. Global mangrove extent change 1996–2020: Global mangrove watch version 3.0. Remote Sens. 2022, 14, 3657. [Google Scholar] [CrossRef]
- Bunting, P.; Rosenqvist, A.; Lucas, R.M.; Rebelo, L.-M.; Hilarides, L.; Thomas, N.; Hardy, A.; Itoh, T.; Shimada, M.; Finlayson, C.M. The global mangrove watch—A new 2010 global baseline of mangrove extent. Remote Sens. 2018, 10, 1669. [Google Scholar] [CrossRef]
- Jia, M.; Wang, Z.; Luo, L.; Zhang, R.; Zhang, H. Global status of mangrove forests in resisting cyclone and tsunami. Innov. Geosci. 2023, 1, 100024. [Google Scholar] [CrossRef]
- Jia, M.; Wang, Z.; Mao, D.; Ren, C.; Song, K.; Zhao, C.; Wang, C.; Xiao, X.; Wang, Y. Mapping global distribution of mangrove forests at 10-m resolution. Sci. Bull. 2023, 68, 1306–1316. [Google Scholar] [CrossRef]
- Jia, M.; Wang, Z.; Wang, C.; Mao, D.; Zhang, Y. A new vegetation index to detect periodically submerged Mangrove forest using single-tide sentinel-2 imagery. Remote Sens. 2019, 11, 2043. [Google Scholar] [CrossRef]
- Jia, M.; Wang, Z.; Zhang, Y.; Mao, D.; Wang, C. Monitoring loss and recovery of mangrove forests during 42 years: The achievements of mangrove conservation in China. Int. J. Appl. Earth Obs. Geoinf. 2018, 73, 535–545. [Google Scholar] [CrossRef]
- Campbell, A.D.; Wang, Y. Salt marsh monitoring along the mid-Atlantic coast by Google Earth Engine enabled time series. PLoS ONE 2020, 15, e0229605. [Google Scholar] [CrossRef]
- Liu, M.; Li, H.; Li, L.; Man, W.; Jia, M.; Wang, Z.; Lu, C. Monitoring the invasion of Spartina alterniflora using multi-source high-resolution imagery in the Zhangjiang Estuary, China. Remote Sens. 2017, 9, 539. [Google Scholar] [CrossRef]
- Mao, D.; Liu, M.; Wang, Z.; Li, L.; Man, W.; Jia, M.; Zhang, Y. Rapid Invasion of Spartina Alterniflora in the Coastal Zone of Mainland China: Spatiotemporal Patterns and Human Prevention. Sensors 2019, 19, 2308. [Google Scholar] [CrossRef]
- Wang, X.; Wang, L.; Tian, J.; Shi, C. Object-based spectral-phenological features for mapping invasive Spartina alterniflora. Int. J. Appl. Earth Obs. 2021, 101, 102349. [Google Scholar] [CrossRef]
- Zhang, X.; Xiao, X.; Wang, X.; Xu, X.; Qiu, S.; Pan, L.; Ma, J.; Ju, R.; Wu, J.; Li, B. Continual expansion of Spartina alterniflora in the temperate and subtropical coastal zones of China during 1985–2020. Int. J. Appl. Earth Obs. 2023, 117, 103192. [Google Scholar] [CrossRef]
- Campbell, A.D.; Fatoyinbo, L.; Goldberg, L.; Lagomasino, D. Global hotspots of salt marsh change and carbon emissions. Nature 2022, 612, 701–706. [Google Scholar] [CrossRef]
- Dong, D.; Gao, Q.; Huang, H. Mangroves Invaded by Spartina alterniflora Loisel: A Remote Sensing-Based Comparison for Two Protected Areas in China. Forests 2024, 15, 1788. [Google Scholar] [CrossRef]
- Pan, D.; Zhang, S.; Qin, D.; Yang, Z.; Wu, F.; Zhou, C.; Bai, Y.; Hao, Z.; Ouyang, X.; Yang, P.; et al. Current structural status and optimized protection strategies for coastal blue-carbon ecosystems in China. Strateg. Study CAE 2024, 26, 233–245. (In Chinese) [Google Scholar]
- Xiao, N.; Tang, L. Guangdong has identified five key tasks for ecological conservation and restoration in territorial space. The Chinese Newspaper of Land and Resources, 15 September 2022; p. 001. (In Chinese) [Google Scholar] [CrossRef]
- Shao, Y.; Lin, Y. Nearly 95% of Mangroves Have Been Incorporated into Ecological Conservation Red Lines. Available online: https://lyj.gd.gov.cn/gkmlpt/content/4/4686/post_4686411.html#2441 (accessed on 25 March 2025). (In Chinese)
- Mai, W. Guangdong explores the joint development of mangrove protection and economic construction. Insight China 2023, 26, 52–53. (In Chinese) [Google Scholar]
- Wang, X.; Xiao, X.; Zou, Z.; Chen, B.; Ma, J.; Dong, J.; Doughty, R.B.; Zhong, Q.; Qin, Y.; Dai, S. Tracking annual changes of coastal tidal flats in China during 1986–2016 through analyses of Landsat images with Google Earth Engine. Remote Sens. Environ. 2020, 238, 110987. [Google Scholar] [CrossRef]
- Wang, X.; Xiao, X.; Zou, Z.; Hou, L.; Qin, Y.; Dong, J.; Doughty, R.B.; Chen, B.; Zhang, X.; Chen, Y. Mapping coastal wetlands of China using time series Landsat images in 2018 and Google Earth Engine. ISPRS J. Photogramm. Remote Sens. 2020, 163, 312–326. [Google Scholar] [CrossRef]
- Ministry of Natural Resources of the People’s Republic of China. Specifications for Field Work of Low-Altitude Digital Aerial Photogrammetry; Ministry of Natural Resources of the People’s Republic of China: Beijing, China, 2021. (In Chinese)
- Tucker, C.J. Red and photographic infrared linear combinations for monitoring vegetation. Remote Sens. Environ. 1979, 8, 127–150. [Google Scholar] [CrossRef]
- Huete, A.; Liu, H.; Batchily, K.; Van Leeuwen, W. A comparison of vegetation indices over a global set of TM images for EOS-MODIS. Remote Sens. Environ. 1997, 59, 440–451. [Google Scholar] [CrossRef]
- Gao, B.-C. NDWI—A normalized difference water index for remote sensing of vegetation liquid water from space. Remote Sens. Environ. 1996, 58, 257–266. [Google Scholar] [CrossRef]
- Wang, X.; Xiao, X.; Xu, X.; Zou, Z.; Chen, B.; Qin, Y.; Zhang, X.; Dong, J.; Liu, D.; Pan, L. Rebound in China’s coastal wetlands following conservation and restoration. Nat. Sustain. 2021, 4, 1076–1083. [Google Scholar] [CrossRef]
- Mahdianpari, M.; Salehi, B.; Mohammadimanesh, F.; Homayouni, S.; Gill, E. The First Wetland Inventory Map of Newfoundland at a Spatial Resolution of 10 m Using Sentinel-1 and Sentinel-2 Data on the Google Earth Engine Cloud Computing Platform. Remote Sens. 2018, 11, 43. [Google Scholar] [CrossRef]
- Dong, D.; Huang, H.; Gao, Q. Tracking the Dynamics of Spartina alterniflora with WorldView-2/3 and Sentinel-1/2 Imagery in Zhangjiang Estuary, China. Water 2024, 16, 1780. [Google Scholar] [CrossRef]
- Qiu, H.; Hu, B.; Zhang, Z. Impacts of land use change on ecosystem service value based on SDGs report--Taking Guangxi as an example. Ecol. Indic. 2021, 133, 108366. [Google Scholar] [CrossRef]
- Zhang, H.; Li, H.; Chen, Z. Analysis of land use dynamic change and its impact on the water environment in Yunnan plateau lake area-A case study of the Dianchi Lake drainage area. Procedia Environ. Sci. 2011, 10, 2709–2717. [Google Scholar]
- Gao, T.; Guan, W.; Mao, J.; Jiang, Z.; Liao, B. Carbon storage and influence factors of major mangrove communities in Fucheng, Leizhou Peninsula, Guangdong Province. Ecol. Environ. Sci. 2017, 26, 985–990. (In Chinese) [Google Scholar] [CrossRef]
- Qin, G.; Zhang, J.; Zhou, J.; Lu, Z.; Wang, F. Soil carbon stock and potential carbon storage in the mangrove forests of Guangdong. Trop. Geogr. 2023, 43, 23–30. (In Chinese) [Google Scholar] [CrossRef]
- China Association of Oceanic Engineering. Technical Guideline for Investigation and Assessment of Coastal Ecosystem—Part 4: Salt Marshes; China Association of Oceanic Engineering: Beijing, China, 2020. (In Chinese) [Google Scholar]
- Ma, C.; Ai, B.; Zhao, J.; Xu, X.; Huang, W. Change detection of mangrove forests in coastal Guangdong during the past three decades based on remote sensing data. Remote Sens. 2019, 11, 921. [Google Scholar] [CrossRef]
- Wang, W. Spatio-Temporal Analysis of Mangrove Along the South China Sea for 30 Years. Master’s Thesis, Lanzhou Jiaotong University, Lanzhou, China, 2017. (In Chinese). [Google Scholar]
- Wu, P.; Zhang, J.; Ma, Y.; Li, X. Remote sensing monitoring and analysis of the changes of mangrove resources in China in the past 20 years. Adv. Mar. Sci. 2013, 31, 406–414. (In Chinese) [Google Scholar]
- Zhao, C.P.; Qin, C.Z. A detailed mangrove map of China for 2019 derived from Sentinel-1 and -2 images and Google Earth images. Geosci. Data J. 2022, 9, 74–88. [Google Scholar] [CrossRef]
- Hu, Y.; Tian, B.; Yuan, L.; Li, X.; Huang, Y.; Shi, R.; Jiang, X.; Sun, C. Mapping coastal salt marshes in China using time series of Sentinel-1 SAR. ISPRS J. Photogramm. Remote Sens. 2021, 173, 122–134. [Google Scholar] [CrossRef]
- Chen, G.; Jin, R.; Ye, Z.; Li, Q.; Gu, J.; Luo, M.; Luo, Y.; Christakos, G.; Morris, J.; He, J. Spatiotemporal mapping of salt marshes in the intertidal zone of China during 1985–2019. J. Remote Sens. 2022, 2022, 9793626. [Google Scholar] [CrossRef]
- Gu, J.; Jin, R.; Chen, G.; Ye, Z.; Li, Q.; Wang, H.; Li, D.; Christakos, G.; Agusti, S.; Duarte, C.M. Areal extent, species composition, and spatial distribution of coastal saltmarshes in China. IEEE J. Sel. Top. Appl. Earth Obs. Remote Sens. 2021, 14, 7085–7094. [Google Scholar] [CrossRef]
- Liu, M.; Mao, D.; Wang, Z.; Li, L.; Man, W.; Jia, M.; Ren, C.; Zhang, Y. Rapid Invasion of Spartina alterniflora in the Coastal Zone of Mainland China: New Observations from Landsat OLI Images. Remote Sens. 2018, 10, 1933. [Google Scholar] [CrossRef]
- Meng, Y.; Gou, R.; Bai, J.; Moreno-Mateos, D.; Davis, C.C.; Wan, L.; Song, S.; Zhang, H.; Zhu, X.; Lin, G. Spatial patterns and driving factors of carbon stocks in mangrove forests on Hainan Island, China. Glob. Ecol. Biogeogr. 2022, 31, 1692–1706. [Google Scholar] [CrossRef]
- Li, J.; Yan, D.; Yao, X.; Xie, S.; Liu, Y.; Sheng, Y.; Luan, Z. Carbon Storage Estimation of Coastal Wetlands in China. Acta Pedol. Sin. 2023, 60, 800–814. [Google Scholar]
- Commission for Environmental Cooperation. North America’s Blue Carbon: Assessing Seagrass, Salt Marsh and Mangrove Distribution and Carbon Sinks; Commission for Environmental Cooperation: Montreal, QC, Canada, 2016. [Google Scholar]
- Li, T.; Li, M.-Y.; Tian, L. Dynamics of carbon storage and its drivers in Guangdong Province from 1979 to 2012. Forests 2021, 12, 1482. [Google Scholar] [CrossRef]
- Gu, J.; Luo, M.; Zhang, X.; Christakos, G.; Agusti, S.; Duarte, C.M.; Wu, J. Losses of salt marsh in China: Trends, threats and management. Estuar. Coast. Shelf Sci. 2018, 214, 98–109. [Google Scholar] [CrossRef]
- Deegan, L.A.; Johnson, D.S.; Warren, R.S.; Peterson, B.J.; Fleeger, J.W.; Fagherazzi, S.; Wollheim, W.M. Coastal eutrophication as a driver of salt marsh loss. Nature 2012, 490, 388–392. [Google Scholar] [CrossRef] [PubMed]
- Luo, Q.; Li, Z.; Huang, Z.; Abulaiti, Y.; Yang, Q.; Yu, S. Retrieval of Mangrove leaf area index and its response to typhoon based on WorldView-3 image. Remote Sens. Appl. Soc. Environ. 2023, 30, 100931. [Google Scholar] [CrossRef]
- Alongi, D.M. Mangrove forests: Resilience, protection from tsunamis, and responses to global climate change. Estuar. Coast. Shelf S. 2008, 76, 1–13. [Google Scholar] [CrossRef]
- Liu, K.; Liu, L.; Liu, H.; Li, X.; Wang, S. Exploring the effects of biophysical parameters on the spatial pattern of rare cold damage to mangrove forests. Remote Sens. Environ. 2014, 150, 20–33. [Google Scholar] [CrossRef]
- Dong, L.; Cao, J.; Liu, X. Recent developments in sea-level rise and its related geological disasters mitigation: A review. J. Mar. Sci. Eng. 2022, 10, 355. [Google Scholar] [CrossRef]
- Guangdong Provincial Department of Marine Affairs and Fisheries. 2016 Guangdong Provincial Marine Disaster Bulletin. 2017. Available online: https://nr.gd.gov.cn/attachment/0/412/412082/3186917.pdf (accessed on 20 March 2025). (In Chinese)
- Kelleway, J.J.; Cavanaugh, K.; Rogers, K.; Feller, I.C.; Ens, E.; Doughty, C.; Saintilan, N. Review of the ecosystem service implications of mangrove encroachment into salt marshes. Glob. Change Biol. 2017, 23, 3967–3983. [Google Scholar] [CrossRef]
- Yu, X.; Yang, J.; Liu, L.; Tian, Y.; Yu, Z. Effects of Spartina alterniflora invasion on biogenic elements in a subtropical coastal mangrove wetland. Environ. Sci. Pollut. Res. 2015, 22, 3107–3115. [Google Scholar] [CrossRef]
- Zheng, X.; Javed, Z.; Liu, B.; Zhong, S.; Cheng, Z.; Rehman, A.; Du, D.; Li, J. Impact of Spartina alterniflora invasion in coastal wetlands of China: Boon or bane? Biology 2023, 12, 1057. [Google Scholar] [CrossRef]
- Zhang, W.; Zeng, C.; Tong, C.; Zhang, Z.; Huang, J. Analysis of the expanding process of the Spartina alterniflora salt marsh in Shanyutan wetland, Minjiang River estuary by remote sensing. Procedia Environ. Sci. 2011, 10, 2472–2477. [Google Scholar] [CrossRef]
- Okoye, O.K.; Li, H.; Gong, Z. Retraction of invasive Spartina alterniflora and its effect on the habitat loss of endangered migratory bird species and their decline in YNNR using remote sensing technology. Ecol. Evol. 2020, 10, 13810–13824. [Google Scholar] [CrossRef]
- Zhao, C.; Li, Y.; Jia, M.; Wu, C.; Zhang, R.; Ren, C.; Wang, Z. Advancing mangrove species mapping: An innovative approach using Google Earth images and a U-shaped network for individual-level Sonneratia apetala detection. ISPRS J. Photogramm. Remote Sens. 2024, 218, 276–293. [Google Scholar] [CrossRef]
- Dasgupta, S.; Sobhan, M.I.; Huq, M.; Khan, Z.H. Mangroves and Coastal Protection: A Potential Triple-Win for Bangladesh. Available online: https://blogs.worldbank.org/en/endpovertyinsouthasia/mangroves-and-coastal-protection-potential-triple-win-bangladesh (accessed on 10 May 2025).
- An, D.; Miao, S.; Chen, W.; Tao, W.; Zeng, Q.; Long, L.; Chen, J.; Yi, Z. Population characteristics of seedlings under the man-840 made Sonneratia apetala forest at Qi’ao island, Zhuhai. J. Guangzhou Univ. (Nat. Sci.) 2015, 14, 50–55. (In Chinese) [Google Scholar]
- Tan, F.; Lu, C.; Lin, J.; Le, T.; You, H.; Wang, X.; Huang, X. Investigation Report on the Introduction and Spread Status of Exotic Mangrove Plants in Fujian Province. Fujian For. 2018, 04, 28–33. (In Chinese) [Google Scholar]
- Ren, H.; Jian, S.; Lu, H.; Zhang, Q.; Shen, W.; Han, W.; Yin, Z.; Guo, Q. Restoration of mangrove plantations and colonisation by native species in Leizhou bay, South China. Ecol. Res. 2008, 23, 401–407. [Google Scholar] [CrossRef]
- Ren, H.; Chen, H.; Li, Z.a.; Han, W. Biomass accumulation and carbon storage of four different aged Sonneratia apetala plantations in Southern China. Plant Soil 2010, 327, 279–291. [Google Scholar] [CrossRef]
- He, Z.; Sun, H.; Peng, Y.; Hu, Z.; Cao, Y.; Lee, S.Y. Colonization by native species enhances the carbon storage capacity of exotic mangrove monocultures. Carbon. Balance Manag. 2020, 15, 28. [Google Scholar] [CrossRef] [PubMed]
- Xu, Y.; Liao, B.; Jiang, Z.; Xin, K.; Xiong, Y.; Zhang, Y. Examining the differences between invasive sonneratia apetala and native kandelia obovata for mangrove restoration: Soil organic carbon, nitrogen, and phosphorus content and pools. J. Coast. Res. 2021, 37, 708–715. [Google Scholar] [CrossRef]
- Wang, W.; Fu, H.; Lee, S.Y.; Fan, H.; Wang, M. Can strict protection stop the decline of mangrove ecosystems in China? From rapid destruction to rampant degradation. Forests 2020, 11, 55. [Google Scholar] [CrossRef]
- Ai, B.; Ma, C.; Zhao, J.; Zhang, R. The impact of rapid urban expansion on coastal mangroves: A case study in Guangdong Province, China. Front. Earth Sci.-PRC 2020, 14, 37–49. [Google Scholar] [CrossRef]
- Li, T.; Ma, Y.; Wang, D.; Wang, A.; Zhou, Y. Status degradation causes, and protection measures of the Pearl River Estuary seashore wetland. J. Trop. Oceanogr. 2011, 30, 77–84. (In Chinese) [Google Scholar]
- Cui, B.; Xie, T.; Wang, Q.; Li, S.; Yan, J.; Yu, S.; Liu, K.; Zheng, J.; Liu, Z. Impact of large-scale reclamation on coastal wetlands and implications for ecological restoration, compensation, and sustainable exploitation framework. Bull. Chin. Acad. Sci. 2017, 32, 418–425. (In Chinese) [Google Scholar]
- Cheng, J.; Li, M.; Chen, R. The Area of Mangroves in Guangdong Ranks First Nationally. Available online: http://lyj.gd.gov.cn/gkmlpt/content/2/2513/post_2513779.html#2441 (accessed on 17 June 2019). (In Chinese)
- Song, S.; Ding, Y.; Li, W.; Meng, Y.; Zhou, J.; Gou, R.; Zhang, C.; Ye, S.; Saintilan, N.; Krauss, K.W.; et al. Mangrove reforestation provides greater blue carbon benefit than afforestation for mitigating global climate change. Nat. Commun. 2023, 14, 756. [Google Scholar] [CrossRef] [PubMed]
- Dontis, E.E.; Radabaugh, K.R.; Chappel, A.R.; Russo, C.E.; Moyer, R.P. Carbon storage increases with site age as created salt marshes transition to mangrove forests in Tampa Bay, Florida (USA). Estuari. Coasts 2020, 43, 1470–1488. [Google Scholar] [CrossRef]
- Zhang, G.; Bai, J.; Jia, J.; Wang, X.; Wang, W.; Zhao, Q.; Zhang, S. Soil organic carbon contents and stocks in coastal salt marshes with Spartina alterniflora following an invasion chronosequence in the Yellow River Delta, China. Chin. Geogr. Sci. 2018, 28, 374–385. [Google Scholar] [CrossRef]
- Gu, J.; Wu, J.; Xie, D. Coastal salt marsh changes in China: Landscape pattern, driving factors, and carbon dynamics. Geogr. Sustain. 2025, 6, 100281. [Google Scholar] [CrossRef]
- Xu, W.; Cheng, Y.; Luo, M.; Mai, X.; Wang, W.; Zhang, W.; Wang, Y. Progress and Limitations in Forest Carbon Stock Estimation Using Remote Sensing Technologies: A Comprehensive Review. Forests 2025, 16, 449. [Google Scholar] [CrossRef]
- Xing, S.; Yang, S.; Sun, H.; Wang, Y. Spatiotemporal Changes of Terrestrial Carbon Storage in Rapidly Urbanizing Areas and Their Influencing Factors: A Case Study of Wuhan, China. Land 2023, 12, 2134. [Google Scholar] [CrossRef]
- Guo, Y.; Cheng, L.; Ding, A.; Yuan, Y.; Li, Z.; Hou, Y.; Ren, L.; Zhang, S. Geodetector model-based quantitative analysis of vegetation change characteristics and driving forces: A case study in the Yongding River basin in China. Int. J. Appl. Earth Obs. Geoinf. 2024, 132, 104027. [Google Scholar] [CrossRef]
- Li, X.-W.; Miao, H.-Z. How to Incorporate Blue Carbon into the China Certified Emission Reductions Scheme: Legal and Policy Perspectives. Sustainability 2022, 14, 10567. [Google Scholar] [CrossRef]


| Ecosystem Type | Sources | ||||
|---|---|---|---|---|---|
| mangroves | 153.23 | 28.28 | 230 | 0.66 | [22,73,74] |
| salt marshes | 3.22 | 3.99 | 106.5 | 1.02 | - |
| Year | 1986 | 1990 | 1995 | 2000 | 2005 | 2010 | 2015 | 2020 |
|---|---|---|---|---|---|---|---|---|
| Overall Accuracy | 96% | 96% | 96% | 95% | 94% | 96% | 95% | 98% |
| Kappa | 0.94 | 0.95 | 0.94 | 0.93 | 0.92 | 0.94 | 0.92 | 0.97 |
| Year | Mangroves | Salt Marshes | ||
|---|---|---|---|---|
| Area Change (ha) | Dynamic Degree | Area Change (ha) | Dynamic Degree | |
| 1986–1990 | −2242.05 | −5.57% | −4.86 | −0.16% |
| 1990–1995 | −49.24 | −0.13% | −91.66 | −2.42% |
| 1995–2000 | 524.11 | 1.35% | 130.94 | 3.94% |
| 2000–2005 | −552.37 | −1.33% | −135.29 | −3.40% |
| 2005–2010 | 388.98 | 1.00% | 134.28 | 4.07% |
| 2010–2015 | 2497.7 | 6.14% | 274.78 | 6.92% |
| 2015–2020 | 1272.69 | 2.40% | 185.1 | 3.46% |
| 1986–2020 | 1839.82 | 0.54% | 493.29 | 1.91% |
Disclaimer/Publisher’s Note: The statements, opinions and data contained in all publications are solely those of the individual author(s) and contributor(s) and not of MDPI and/or the editor(s). MDPI and/or the editor(s) disclaim responsibility for any injury to people or property resulting from any ideas, methods, instructions or products referred to in the content. |
© 2025 by the authors. Licensee MDPI, Basel, Switzerland. This article is an open access article distributed under the terms and conditions of the Creative Commons Attribution (CC BY) license (https://creativecommons.org/licenses/by/4.0/).
Share and Cite
Dong, D.; Huang, H.; Gao, Q.; Li, K.; Zhang, S.; Yan, R. Temporal and Spatial Patterns of Blue Carbon Storage in Mangrove and Salt Marsh Ecosystems in Guangdong, China. Land 2025, 14, 1130. https://doi.org/10.3390/land14061130
Dong D, Huang H, Gao Q, Li K, Zhang S, Yan R. Temporal and Spatial Patterns of Blue Carbon Storage in Mangrove and Salt Marsh Ecosystems in Guangdong, China. Land. 2025; 14(6):1130. https://doi.org/10.3390/land14061130
Chicago/Turabian StyleDong, Di, Huamei Huang, Qing Gao, Kang Li, Shengpeng Zhang, and Ran Yan. 2025. "Temporal and Spatial Patterns of Blue Carbon Storage in Mangrove and Salt Marsh Ecosystems in Guangdong, China" Land 14, no. 6: 1130. https://doi.org/10.3390/land14061130
APA StyleDong, D., Huang, H., Gao, Q., Li, K., Zhang, S., & Yan, R. (2025). Temporal and Spatial Patterns of Blue Carbon Storage in Mangrove and Salt Marsh Ecosystems in Guangdong, China. Land, 14(6), 1130. https://doi.org/10.3390/land14061130