Article

Analysis of Coupled and Coordinated Development of Cultivated Land Multifunction and Agricultural Mechanization in China

1
School of Public Administration, China University of Geosciences, Wuhan 430074, China
2
School of Business Administration, Guangxi University of Finance and Economics, Nanning 530007, China
3
College of Geography and Environmental Science, Northwest Normal University, Lanzhou 730070, China
4
Key Laboratory for Rule of Law Research, Ministry of Natural Resources, Wuhan 430074, China
*
Author to whom correspondence should be addressed.
Land 2025, 14(5), 999; https://doi.org/10.3390/land14050999
Submission received: 10 February 2025 / Revised: 6 March 2025 / Accepted: 4 April 2025 / Published: 5 May 2025

Abstract

:
Cultivated land (CL), as the foundation of agricultural production, possesses multifunctionality, and its utilization mode directly influences the agricultural modernization process. This study systematically analyzed the coupled and coordinated development characteristics and driving mechanisms of cultivated land multifunction (CLM) and agricultural mechanization (AM) using data from 31 Chinese provinces between 2011 and 2021, aiming to reveal the complexity of regional agricultural modernization and provide scientific evidence for differentiated agricultural development strategies. Key research findings: (1) From 2011 to 2021, the levels of CLM utilization, AM development index, and their coupling coordination consistently increased, but regional development disparities were prominent. The CLM level in western regions was significantly lower than in eastern and central regions, with regional differences in AM development gradually expanding. (2) Driving factors of coupled and coordinated development varied significantly across regions: eastern regions were primarily driven by technological innovation, central regions were influenced by production efficiency and social security, and western regions were mainly constrained by ecological functions. (3) Natural conditions such as cultivated land area, quality, and land flatness significantly impact the coordinated development of AM and CLM. This study innovatively constructed an evaluation index system for CLM and AM coupling coordination, integrating socio-economic and remote sensing data. By employing entropy weight TOPSIS and coupling coordination models, it conducted an in-depth analysis of long-term temporal changes and revealed the internal mechanisms of regional coordinated development through spatial econometric methods. The research results not only provide theoretical support for regional agricultural modernization but also offer scientific references for formulating differentiated agricultural development policies, promoting synergistic development of agricultural modernization and ecological civilization construction, and exploring more precise and sustainable regional agricultural development paths.

1. Introduction

Cultivated land (CL), as an integrated system of nature and socio-economic factors, possesses cultivated land multifunction (CLM) [1]. The CLM is its objective and intrinsic attribute [2]. With the continuous advancement of socio-economic development and ecological civilization construction, the CLM characteristics have gradually gained attention, expanding its resource utilization from a single production function to social security and ecological functions [3].
Historically, China has been dominated by the production function in CL utilization, resulting in inadequate multifunction use, particularly in understanding its ecological and social security functions [4]. This has led to a series of serious issues, including disorderly competition for CL demand, land marginalization, and degradation of CL ecosystems [5].
The CLM is not only manifested in its role as the foundation of food production but also encompasses its critical functions in ecological protection, social stability, and economic development. First, the ecological function of CL provides ecosystem services such as biodiversity habitats, carbon storage, and soil and water conservation, which are crucial for maintaining ecological balance and addressing climate change [6,7]. Second, the social function of CL is reflected in its guarantee of food security and impact on rural social structures. Rational CL utilization can promote social stability and economic development in rural areas, especially in densely populated regions where land use directly relates to local residents’ livelihoods and quality of life [8,9,10].
Economically, the CLM also includes its support for agricultural economics and related industry development. Through rational land management and agricultural technology application, CL can achieve sustainable agricultural production, improve land use efficiency, and promote agricultural economic growth [11,12]. For instance, in some regions, introducing diverse crop cultivation and ecological agricultural practices can reduce dependence on chemical inputs without sacrificing yield, thereby realizing ecological intensification of agriculture [13,14].
Facing the increasingly tense relationship between humans and land, and the growing demand for CLM from urban and rural residents, China urgently needs to transform CL protection into multifunctional land management. China has implemented ecological strategies and continuously improved its CL protection system, establishing a comprehensive protection and management system based on “quantity, quality, and ecology”, laying a crucial foundation for ensuring food security, promoting high-quality agricultural development, and accelerating agricultural modernization [15]. Simultaneously, improving agricultural mechanization (AM) is one of the important pathways to achieving high-quality agricultural development and modernization [16].
Modern agriculture is based on AM as its material and technological foundation, and the level of AM has become an important indicator of a country’s agricultural industrialization and modernization [17]. In the 1940s, the United States was the first to achieve agricultural modernization characterized primarily by mechanization, significantly improving agricultural labor productivity and agricultural product yields [18]. China has consistently placed high importance on AM, enabling its rapid development [19]. However, compared to developed countries, China’s AM still faces challenges such as regional imbalance, uncoordinated levels, and low-quality efficiency, and the relationship between these issues and CLM utilization has not been systematically studied.
Although AM can improve production efficiency, if its development is out of balance with CLM utilization, it may lead to a series of environmental and social problems, including soil compaction, biodiversity reduction, and loss of traditional agricultural landscape culture [20,21]. Therefore, exploring the coupled and coordinated relationship between CLM utilization and AM is of significant guiding importance for developing more rational CL utilization policies and AM development strategies, especially in achieving coordinated economic, social, and ecological development.
Currently, research on multi-functional land use has been increasingly focused on identifying [6,22,23], evaluating [24,25], and understanding the spatial differentiation [26,27] of land use functions. This body of work is crucial for sustainable land management and planning, whereas AM research has concentrated on technological innovation [28,29], development models [30,31], and benefit evaluation [32,33]. Although these studies have laid the foundation for understanding CLM and AM development, several limitations remain: ① Existing research predominantly associates CLM utilization with external factors such as urbanization and industrialization [34,35], with limited attention to interactions with internal agricultural modernization elements. ② There is a lack of systematic and long-term analysis of the coupled coordination relationship between CLM utilization and AM. ③ Regional difference analyses often remain at the descriptive level, lacking in-depth exploration of the formation mechanisms.
The innovations of this study are primarily reflected in the following aspects: ① For the first time, a comprehensive evaluation index system for coupled coordination between CLM utilization and AM is constructed, filling the theoretical gap in CLM and AM collaborative development research. ② Innovative integration of socio-economic and remote sensing data, employing entropy weight TOPSIS and coupling coordination models to conduct in-depth analysis of provincial-level long-term temporal changes from 2011–2021, revealing the evolution patterns of coupling coordination relationships. ③ Utilizing spatial econometric methods to identify regional differentiation characteristics of coupling coordination, and through QAP regression analysis, quantitatively parsing the driving mechanisms behind regional coordination differences for the first time, providing a scientific basis for differentiated policy formulation.
Based on the above analysis, this study aims to address the following scientific questions: ① Investigate the coupling coordination degree and spatio-temporal evolution characteristics of CLM and AM across different regions. ② Identify the interaction mechanisms and critical influencing factors between CLM utilization and AM. ③ Reveal the formation causes of regional coordination differences and propose targeted policy recommendations.
To this end, this research adopted a combined approach of socio-economic and remote sensing data. It comprehensively employed the entropy weight TOPSIS model to construct an evaluation index system, analyzed the coordination relationship between CLM utilization and AM through a coupling coordination model, and used global and local spatial autocorrelation analysis to identify spatial aggregation characteristics of provincial coordination. Innovatively, the QAP regression method was applied to deeply explore the internal mechanisms causing regional coordination differences.
The research findings will provide theoretical support and decision-making references for optimizing CL resource allocation, promoting coordinated development of AM and CLM, and advancing regional agricultural sustainable modernization. The study holds significant theoretical value and practical importance for achieving rural revitalization strategies and high-quality agricultural development.

2. Materials and Methods

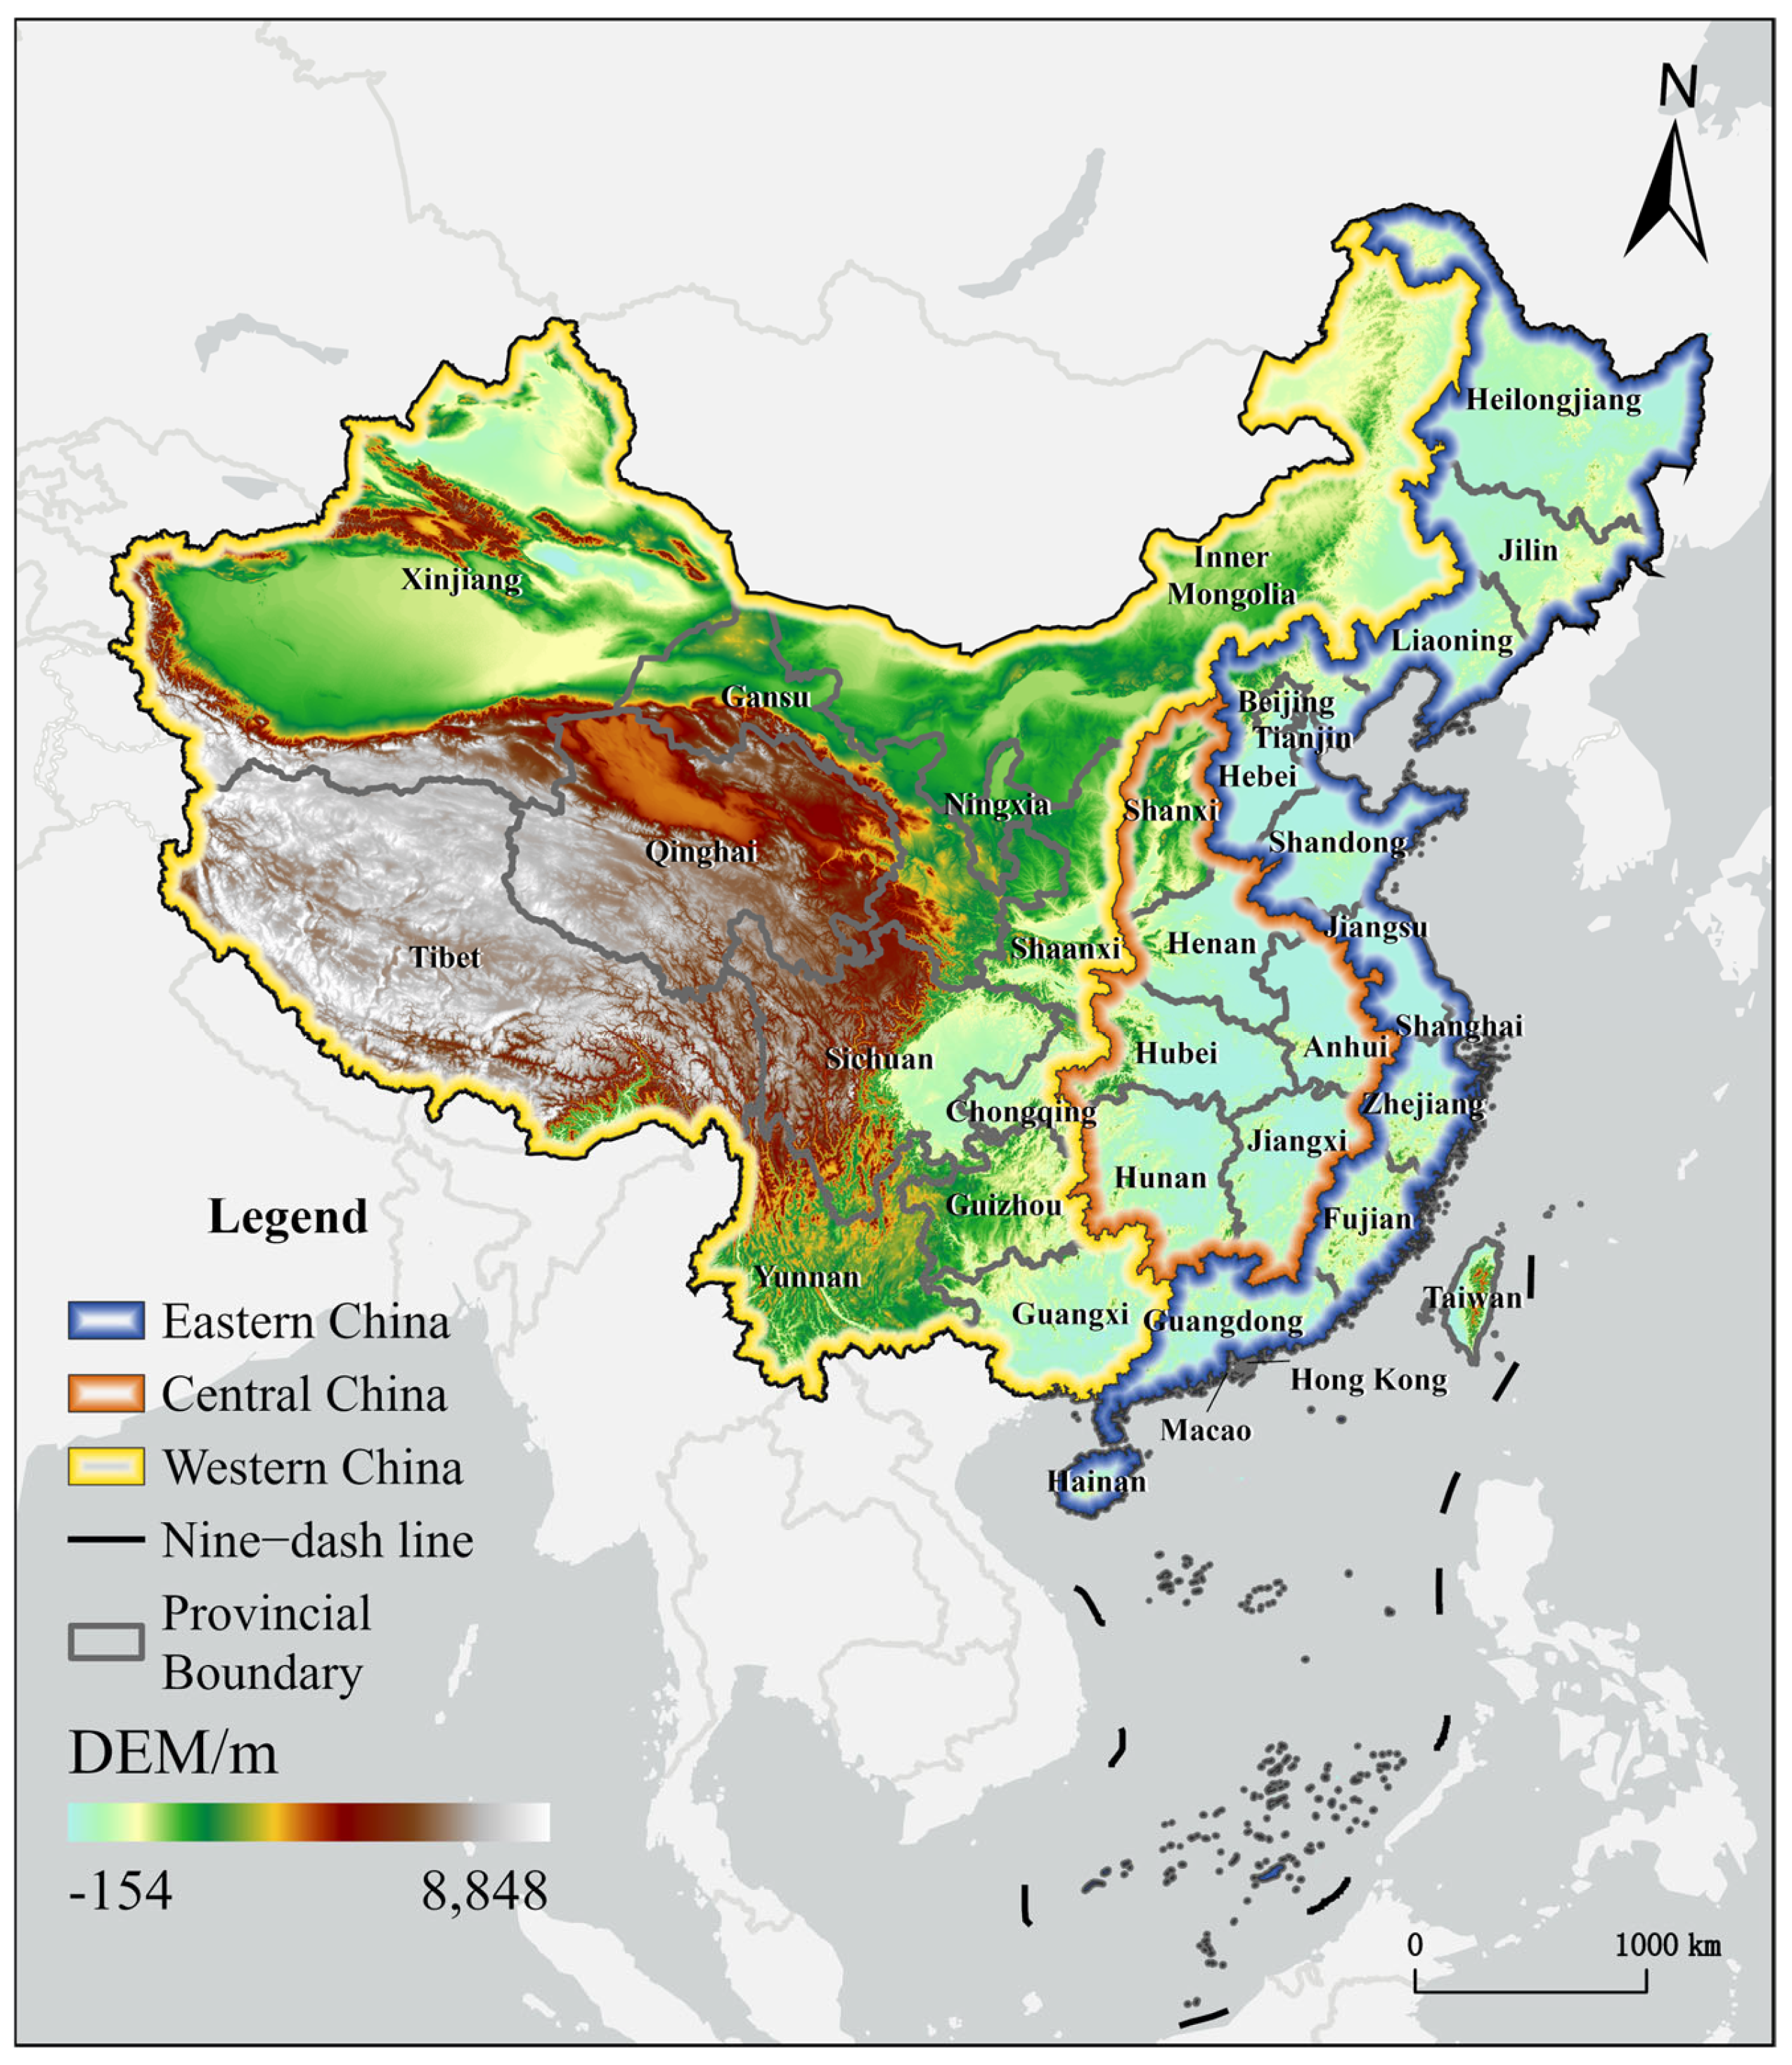
2.1. Study Area Overview

China, located in East Asia, is vast in territory with complex terrain, spanning multiple climate zones and geographical regions. The research area selected for this study encompasses three major regions of China: Eastern, Central, and Western regions, covering 31 provinces (autonomous regions and municipalities), excluding Hong Kong, Macau, and Taiwan due to data availability constraints. Based on comprehensive considerations of economic development levels, geographical location, and resource endowments, the country is divided into Eastern, Central, and Western regions (Figure 1).
Eastern Region: Includes provinces and municipalities such as Beijing, Tianjin, Hebei, Shanghai, Jiangsu, Zhejiang, Fujian, and Shandong. Located in the North China Plain and Yangtze River Delta, the terrain is primarily characterized by plains and hills, with a mild climate, abundant precipitation, and favorable agricultural production conditions.
Central Region: Comprises provinces including Shanxi, Anhui, Jiangxi, Henan, Hubei, and Hunan. The terrain features a mix of plains, hills, and mountains, spanning the Yellow River and Yangtze River basins. With diverse climate types, agricultural production exhibits strong regional characteristics.
Western Region: Includes municipalities and provinces such as Chongqing, Sichuan, Guizhou, Yunnan, Shaanxi, Gansu, Qinghai, and Xinjiang. Characterized by plateaus, mountains, and basins, the terrain is complex with significant climate variations, presenting numerous geographical and climatic challenges for agricultural production.

2.2. Data Sources

Considering data availability, this study selected 31 provinces in China (excluding Hong Kong, Macau, and Taiwan) as research samples, with the research period spanning from 2011 to 2021. Original data were sourced from annual publications including the China Statistical Yearbook, China Rural Statistical Yearbook, Agricultural Statistical Yearbook, China Environmental Statistical Yearbook, China Agricultural Machinery Statistical Yearbook, Urban Statistical Yearbook, provincial and municipal statistical yearbooks, and environmental bulletins (detailed indicator data sources are shown in Table 1). Occasional missing data were interpolated using interpolation methods.

2.3. Research Methods

2.3.1. Coupling Coordination Analysis Method

Coupling coordination mechanism (CCM) is a crucial tool for evaluating and analyzing interactions between two or more systems. CCM assesses the interaction and coordination degree between systems, helping to understand and optimize their collaborative development [38,39,40]. CCM has been widely applied in fields such as cultural heritage protection and tourism development [38], economic–resource–environmental systems [40], higher education and environmental governance [41], and county-level new urbanization and logistics industries [8]. CCM can help us understand the relationship between multi-functional CL utilization and AM.
Conceptual Definition of CLM Utilization: Since the agricultural multifunction concept was proposed in the 1980s, the multifunction concept has been widely used in ecosystem management, agricultural development, landscape management, and land system changes [42,43,44] CL is a type of land use generated through development, arrangement, or reclamation of other land types. From its definition, CL functions refer to the utility of CL in satisfying multiple human needs [45]. In recent years, CLM research has gained widespread attention in China, aiming to reconstruct CL resource value and promote sustainable development. Research indicates that CLM encompasses not only production functions but also includes multiple functions such as ecological, economic, social security, and cultural landscape functions. Production and economic functions: The production and economic value of CLM is significant, playing a critical role in food production and economic development [35,46,47]. Ecological functions: CL’s ecological functions play a crucial role in environmental protection and ecological balance, especially in ecologically fragile regions [48,49,50]. Social and cultural functions: CL also provides social security and cultural landscape functions, supporting social stability and cultural inheritance [46,51,52,53,54].
AM Development Connotation: AM is an important technological progress process of transforming traditional agriculture into modern agriculture, influenced by natural production conditions and economic development, with staged developmental characteristics [17]. Productivity and economic benefits: AM significantly improves agricultural productivity and economic efficiency. For instance, in Hubei Province, China, improved mechanization levels significantly increased crop yields and income [55]. In Nepal, mechanization enhanced agricultural product production efficiency and farmers’ living standards [56]. Environment and sustainability: AM has dual impacts on environment and sustainability. In China, mechanization promoted sustainable land cultivation practices, reduced fertilizer usage, and protected CL [57]. However, in Africa, mechanization might lead to deforestation and soil erosion [58,59]. Socio-economic impacts: Mechanization can increase income, reduce labor intensity, and free up time for other agricultural and non-agricultural activities. It may also trigger land use conflicts and gender inequalities [59]. Staged development: AM’s development is staged, with its impact on production and income increasing as mechanization levels rise [55]. In Myanmar, rapid mechanization was achieved through a dynamic outsourcing service market [60]. In summary, AM has significant positive effects on improving productivity and economic efficiency but may also bring environmental and social challenges. Through appropriate policy and technological support, sustainable AM can be achieved, promoting traditional agriculture’s transformation into modern agriculture.
Coupling Coordination Relationship Construction: The interaction between CLM utilization and AM development involves multiple aspects of mutual influence and interaction (Figure 2). (1) Mutual promotion: Improved mechanization levels can increase CL production efficiency, promote crop yields, and meet social demands. Enhanced production functions simultaneously encourage broader application of mechanization technologies. AM improves social security by increasing production efficiency, reducing labor costs, and increasing farmer incomes. Improved social security, in turn, promotes farmers’ acceptance and investment in mechanization. (2) Collaborative development: During AM development, emerging technologies such as environmentally friendly machinery, precise fertilization, and irrigation can enhance CL’s ecological benefits and achieve sustainable development while ensuring production and returns. (3) Constraining factors: AM advancement is constrained by funding limitations, technological capabilities, management levels, insufficient infrastructure, low technological levels, and low farmer acceptance of machinery. Policy orientation and market environments significantly impact CLM utilization and AM development. Rational policies can guide and stimulate farmers’ machinery use and improve CLM utilization. (4) Feedback mechanism: While promoting AM, attention must be paid to its ecological environment impact: if ecological benefits are unsatisfactory, it may lead to unsustainable land resource utilization, negatively affecting production functions. Rural social structural changes and labor population reduction will make mechanization increasingly important. Improved farmer income and living standards will further incentivize agricultural machinery investment.
Based on the above theoretical analysis, we constructed a comprehensive assessment indicator system to systematically analyze the coupling coordination mechanism between the two (Table 1). CLM utilization level subsystem: The selected indicators include production function, social security function, and ecological function, all based on their importance in reflecting CLM utilization efficiency and AM development [61,62,63,64]. ① Production function: Grain sown area yield: Production per unit of CLM area, reflecting land productivity; Grain output per hectare: Directly reflecting CLM production efficiency; Land reclamation rate: Proportion of effectively utilized CLM area to total arable land area; Cropping index: Number of crops planted on the same land within one growing season. ② Social security function: Rural employment: Number of laborers in rural areas engaged in agricultural and related economic activities; Farmers’ per capita net income: Annual economic benefits after necessary expenditures; Per capita CLM management area: Reflecting land resource utilization and production capacity; Urban–rural income ratio: Comparing urban and rural residents’ income. ③ Ecological function: Carbon emissions: In 2023, China contributed about a quarter of global total emission growth, with CLM utilization being a significant contributor [65]; Calculating CLM carbon emissions based on agricultural input increases (fertilizers, agricultural films, pesticides); CLM ecological service value: Using the ecosystem service value (ESV) assessment method based on China’s annual land cover dataset (CLCD) remote sensing data [37,66].
AM development level subsystem: Primarily referenced from Chinese industry standards [67], with adjustments for data availability: Removed agricultural machinery value profit rate indicator due to data acquisition difficulties; Replaced agricultural labor machinery value with agricultural diesel usage per labor, as diesel is primarily used for agricultural machinery.
Weight determination: ① For CLM utilization level system: Used Entropy-TOPSIS method to determine weights for production, social security, and ecological function subsystems; Conducted two-stage weight calculation; Entropy-TOPSIS is a multi-attribute decision-making method combining entropy weight and TOPSIS methods. ② For AM development level system: Retained national standard weights for comprehensive mechanization level, comprehensive guarantee capacity, and comprehensive efficiency. ③ Data standardization: Used range standardization method; Converted negative indicators to positive indicators.

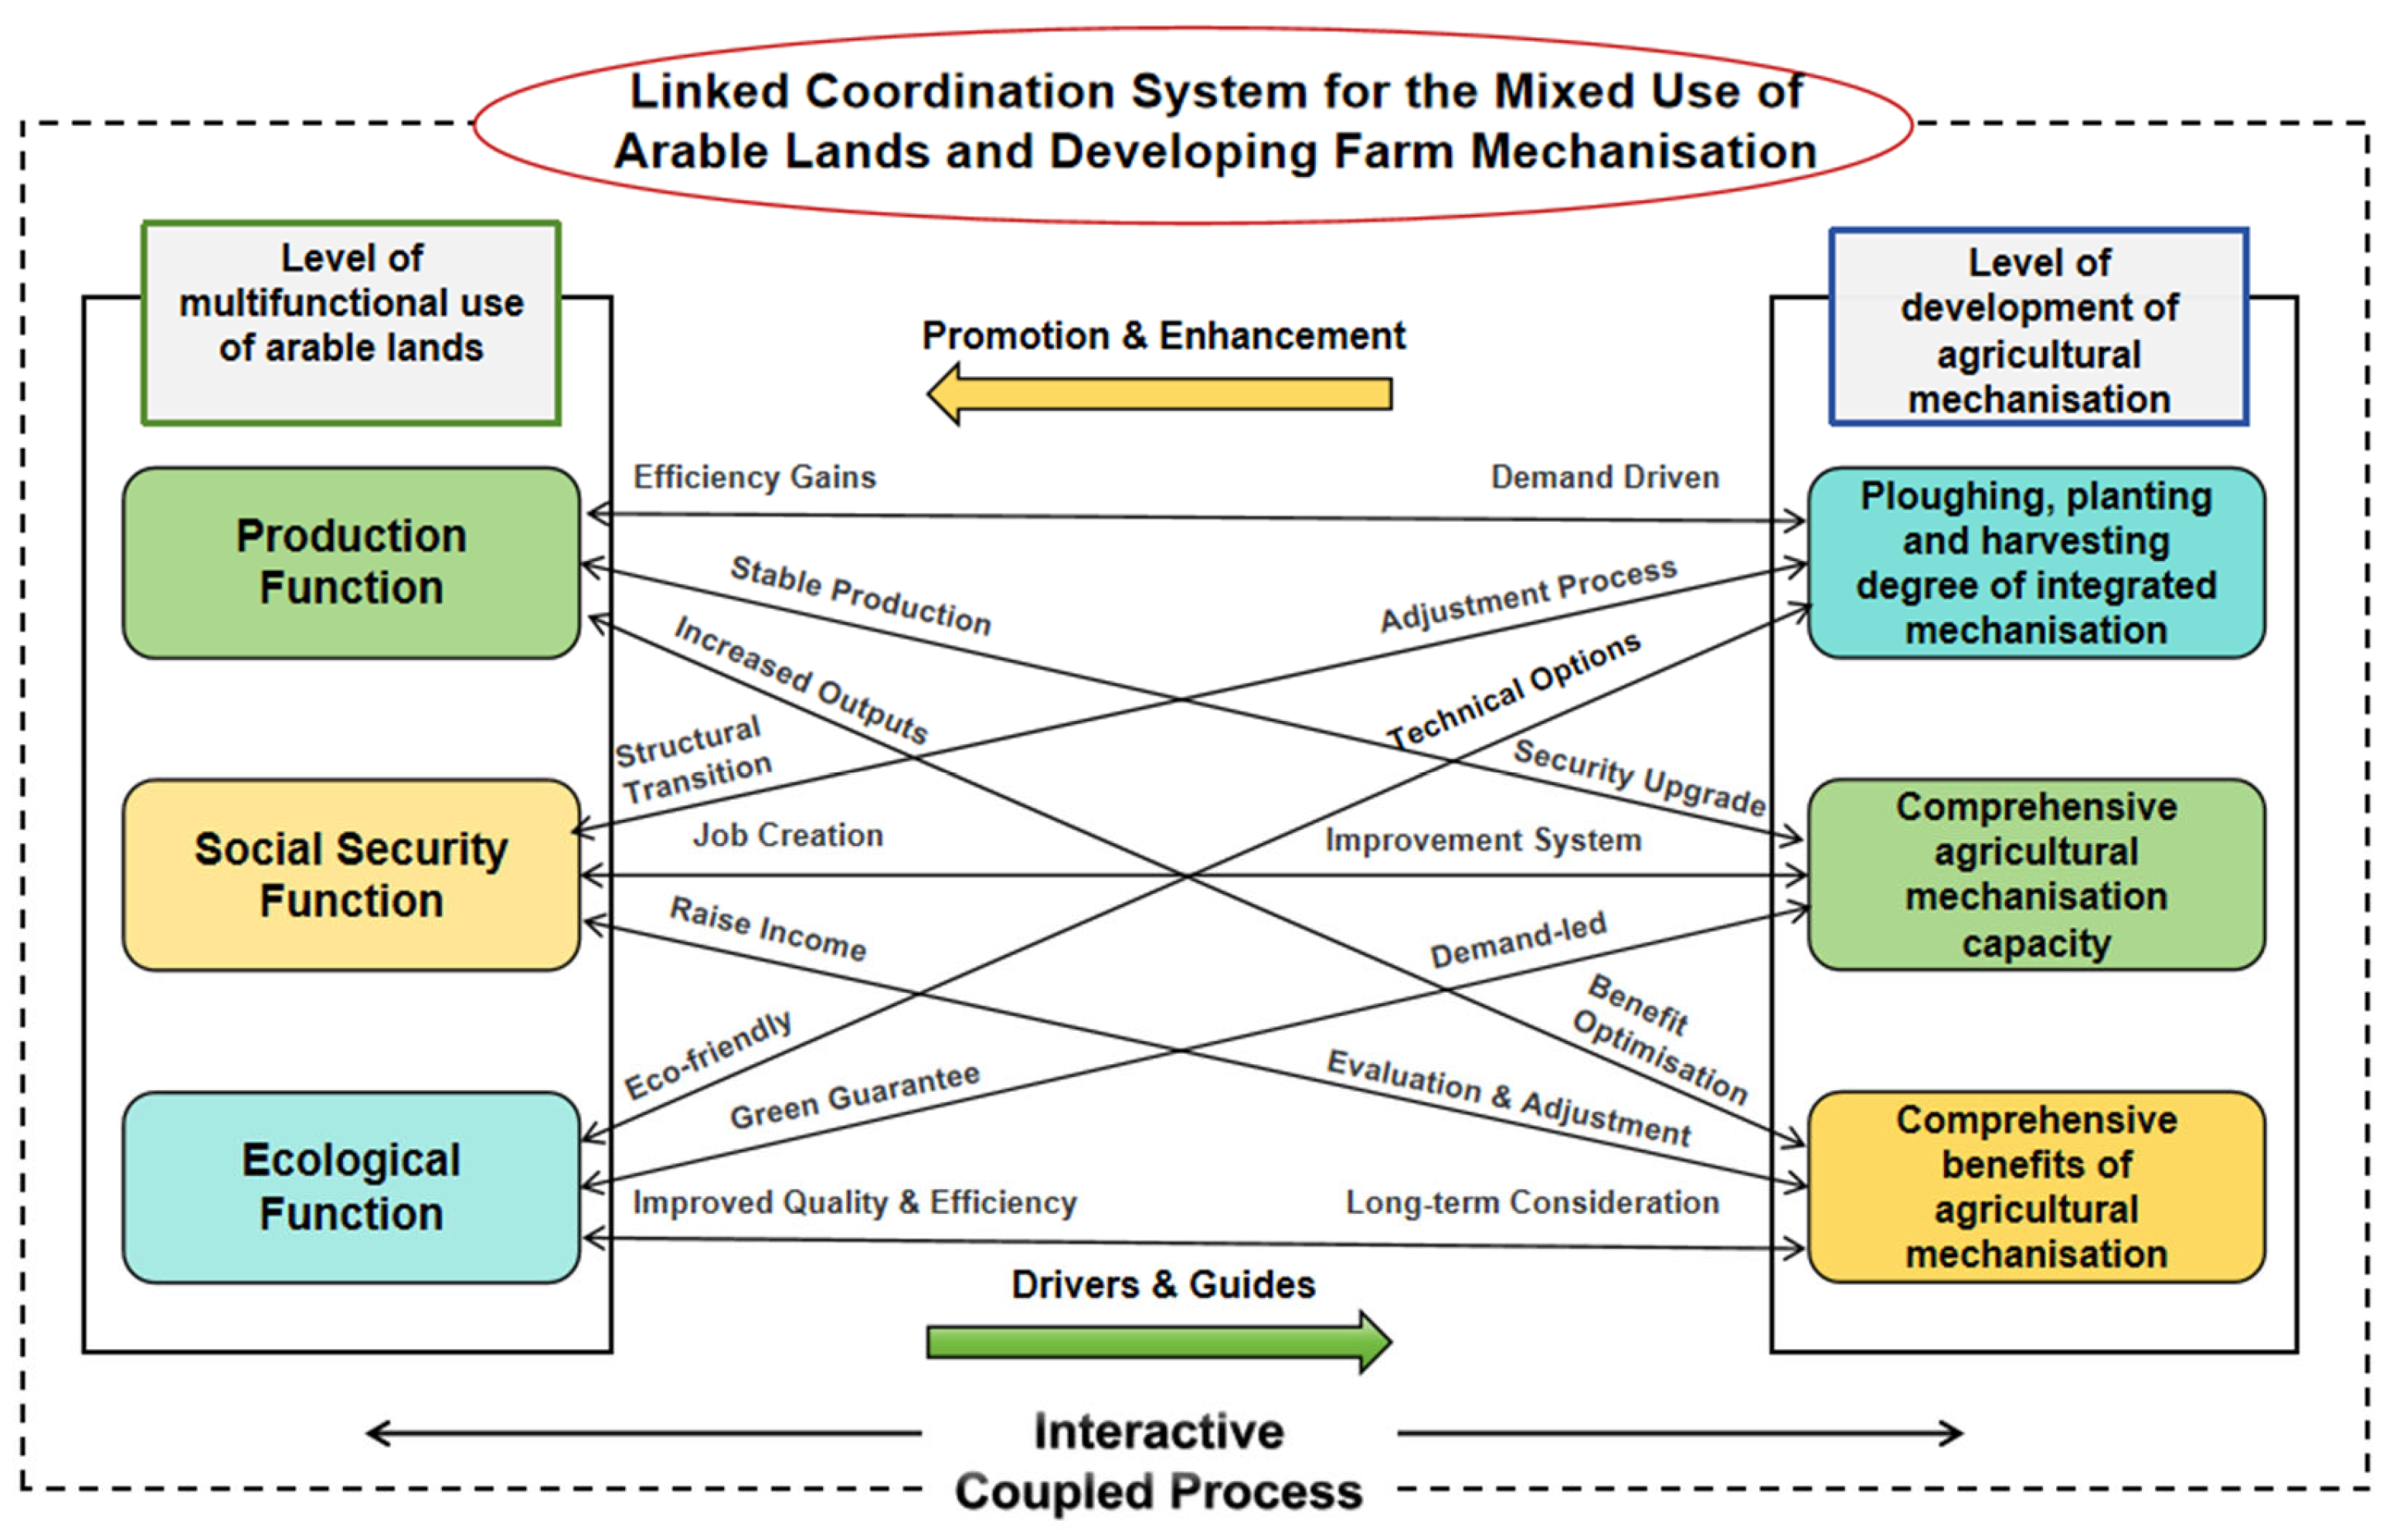
2.3.2. Coupled Coordination Mechanism

This study adopted the CCM model modified by Wang et al. [68], which offers the advantage of dispersing the coupling degree (C) as much as possible within the [0, 1] range, enhancing the differentiation of C values, thereby improving effectiveness in social science research.
The CCM is constructed based on the following key assumptions: The CLM system and AM Development system are relatively independent yet closely interconnected subsystems, characterized by multidimensional functional interactions and a non-linear dynamic coordination development relationship; The selected indicators can comprehensively and objectively reflect the key characteristics and internal mechanisms of system development; the Entropy-TOPSIS method can relatively objectively determine indicator weights, revealing the differential contributions of various indicators to system development; the system coupling coordination degree exhibits dynamic changes across temporal and spatial dimensions, influenced by multiple factors; range standardization of data eliminates dimensional differences, ensuring indicator comparability and objectivity; the improved coupling coordination mechanism model can effectively capture the complex relationship between CLM utilization and AM development. The specific formula is
C = [ 1 ( U 2 U 1 ) 2 ] × U 1 U 2
T = α 1 U 1 + α 2 U 2 , α 1 + α 2 = 1
D = C × T
Eq: C is the degree of coupling, representing the two systems of multifunctional utilization of arable land and agricultural mechanization development, respectively. D is the degree of coordination. T is the evaluation index of the two systems because T is equally important in the CCM, so will, respectively, take α 1 , α 2 0.5. Drawing on related research [39], the degree of coordination is divided into extremely dysfunctional: extreme dysfunction (ED) (0.000~0.099), severe dysfunction (SD) (0.100~0.199), moderate disorder (MD) (0.200~0.299), mild imbalance (MI) (0.300~0.399), border dissonance (BD) (0.400~0.499), barely coordinated (BC) (0.500~0.599), elementary coordination (EC) (0.600~0.699), intermediate coordination (IC) (0.700~0.799), good coordination (GC) (0.800~0.899), quality coordination (QC) (0.900~1.000) 10 levels.

2.3.3. Spatial Autocorrelation Analysis

Important tools in spatial statistics for analyzing the autocorrelation of spatial data are the Global Moran Index and the Local Moran Index [69,70,71,72]. These indices can help in understanding the spatial distribution pattern of the CCM indices of CLM and development of AM. The spatial relationship is chosen from the adjacent side corners, and the province of Hainan, which does not have any provinces bordering it, is not included in the analysis. In this study, spatial autocorrelation analysis was conducted using GeoDa 1.22.0 software, which provides powerful spatial statistical analysis capabilities and can precisely calculate Moran’s indices and visualize spatial distribution patterns.

2.3.4. Quadratic Assignment Procedure (QAP)

The quadratic assignment procedure (QAP) is a non-parametric test that compares the values of each element corresponding to two (or more) square matrices. It can be used to obtain the correlation coefficient between two matrices by comparing the difference matrices of the variables in the CCM of CLM and AM between provinces or regions, and at the same time perform a non-parametric test on the coefficients. It is based on substituting matrix data, randomly relabeling each input matrix data multiple times, continuously calculating the test statistic, and then evaluating the proportion greater than (less than) or equal to the observed value by a specific principle [73,74]. In this research, the QAP analysis was completed using UCINET 6 software(Version 6.186), a professional tool for social network analysis and matrix operations that can accurately perform QAP analysis and provide detailed statistical results.

3. Results

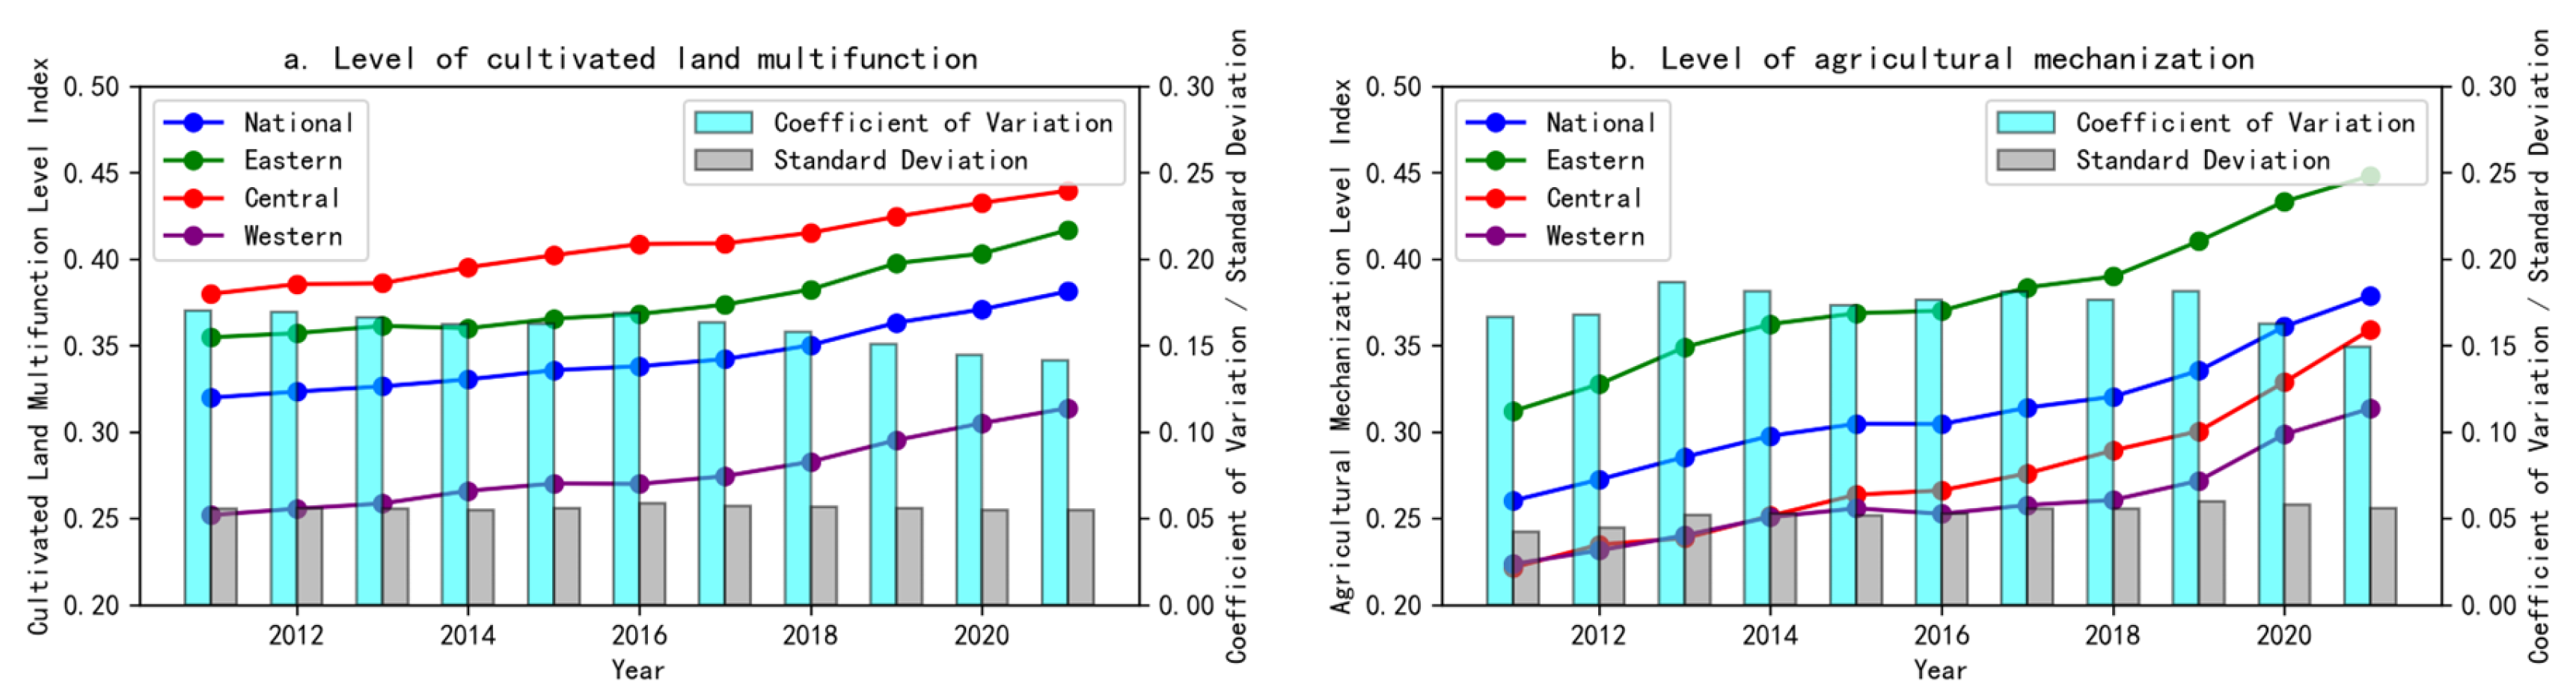
3.1. Temporal and Spatial Changes in CLM Utilization and AM Development

From 2011 to 2021, both the CLM utilization level index and AM development index showed an upward trend. The CLM utilization level index increased from 0.320 to 0.381, with the coefficient of variation gradually decreasing from 0.170 to 0.141, and the standard deviation showing no significant changes (fluctuating within 0.01). The AM development index rose from 0.260 to 0.379, with a more pronounced upward trend compared to the CLM utilization level index. Its coefficient of variation fluctuated, and the standard deviation increased annually from 0.042 to 0.056.
The inter-provincial differences in CLM utilization level were gradually narrowing, while the inter-provincial differences in AM development were gradually increasing. Regionally, the western regions showed lower CLM utilization and AM development levels compared to the national average and other regions. The central region’s CLM utilization level was higher than the eastern region and national average, while its AM development level remained lower than the eastern region and national average. From 2015 onwards, the central region began to diverge from the western region (Figure 3).
To highlight the temporal and spatial differences in CLM utilization and AM development across provinces, the level indices were categorized into five grades: 0–0.199 (low level), 0.2–0.399 (relatively low level), 0.4–0.599 (medium level), 0.6–0.799 (relatively high level), and 0.8–1 (high level), with a temporal and spatial change map created (Figure 4).
For CLM utilization levels in China, the spatial distribution shows a north–south and east–west gradient: higher in the north and east, lower in the south and west. Only Heilongjiang Province reached a relatively high level, starting at 0.722 in 2011 and rising to 0.783 in 2021, the highest nationwide. The northwestern region had the most low-level provinces. By 2021, the Shaanxi–Gansu–Ningxia region emerged from the low-level category, leaving only Qinghai and Tibet at the low level.
Regarding AM development, in 2011, most regions were at low and relatively low levels. Tianjin and Shanghai were relatively advanced, reaching a medium level. By 2016, low-level areas began to decrease, and in 2021, only Yunnan remained at a low level. The Jiangsu–Zhejiang region developed rapidly, with Jiangsu reaching a relatively high level by 2016 and Zhejiang by 2021. Spatially, except for the southern provinces of Guangxi, Guangdong, Yunnan, and Hainan, coastal and border provinces generally showed higher development levels compared to inland regions.

3.2. CLM and AM Development Coupling Coordination Analysis

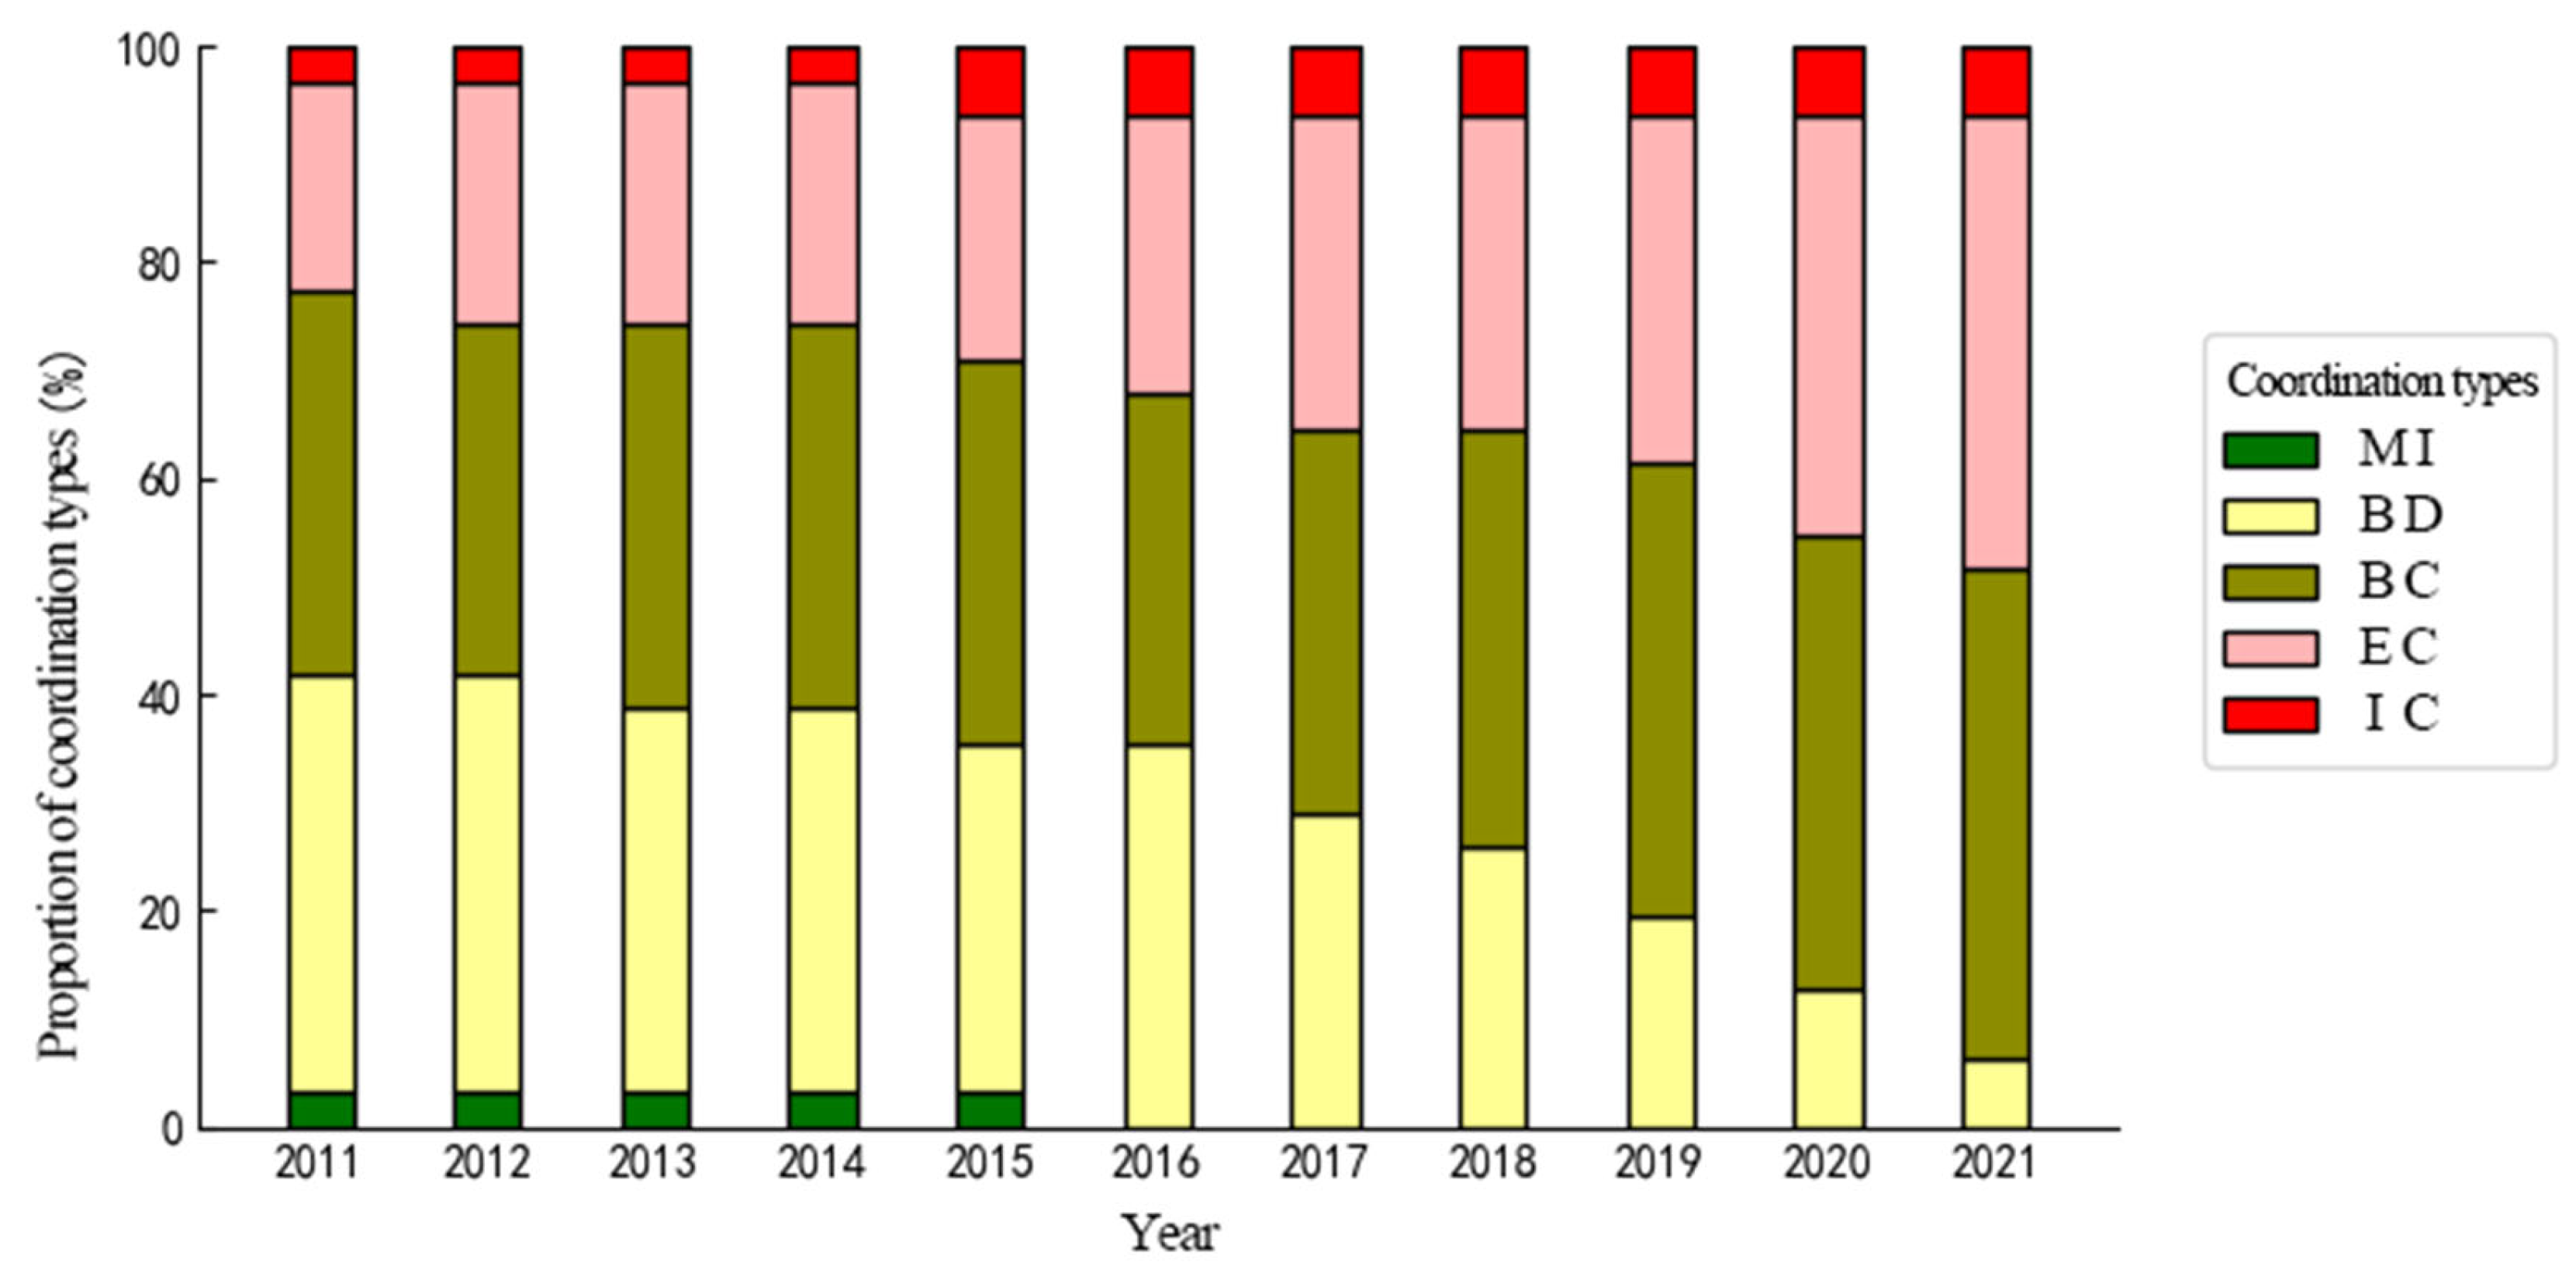
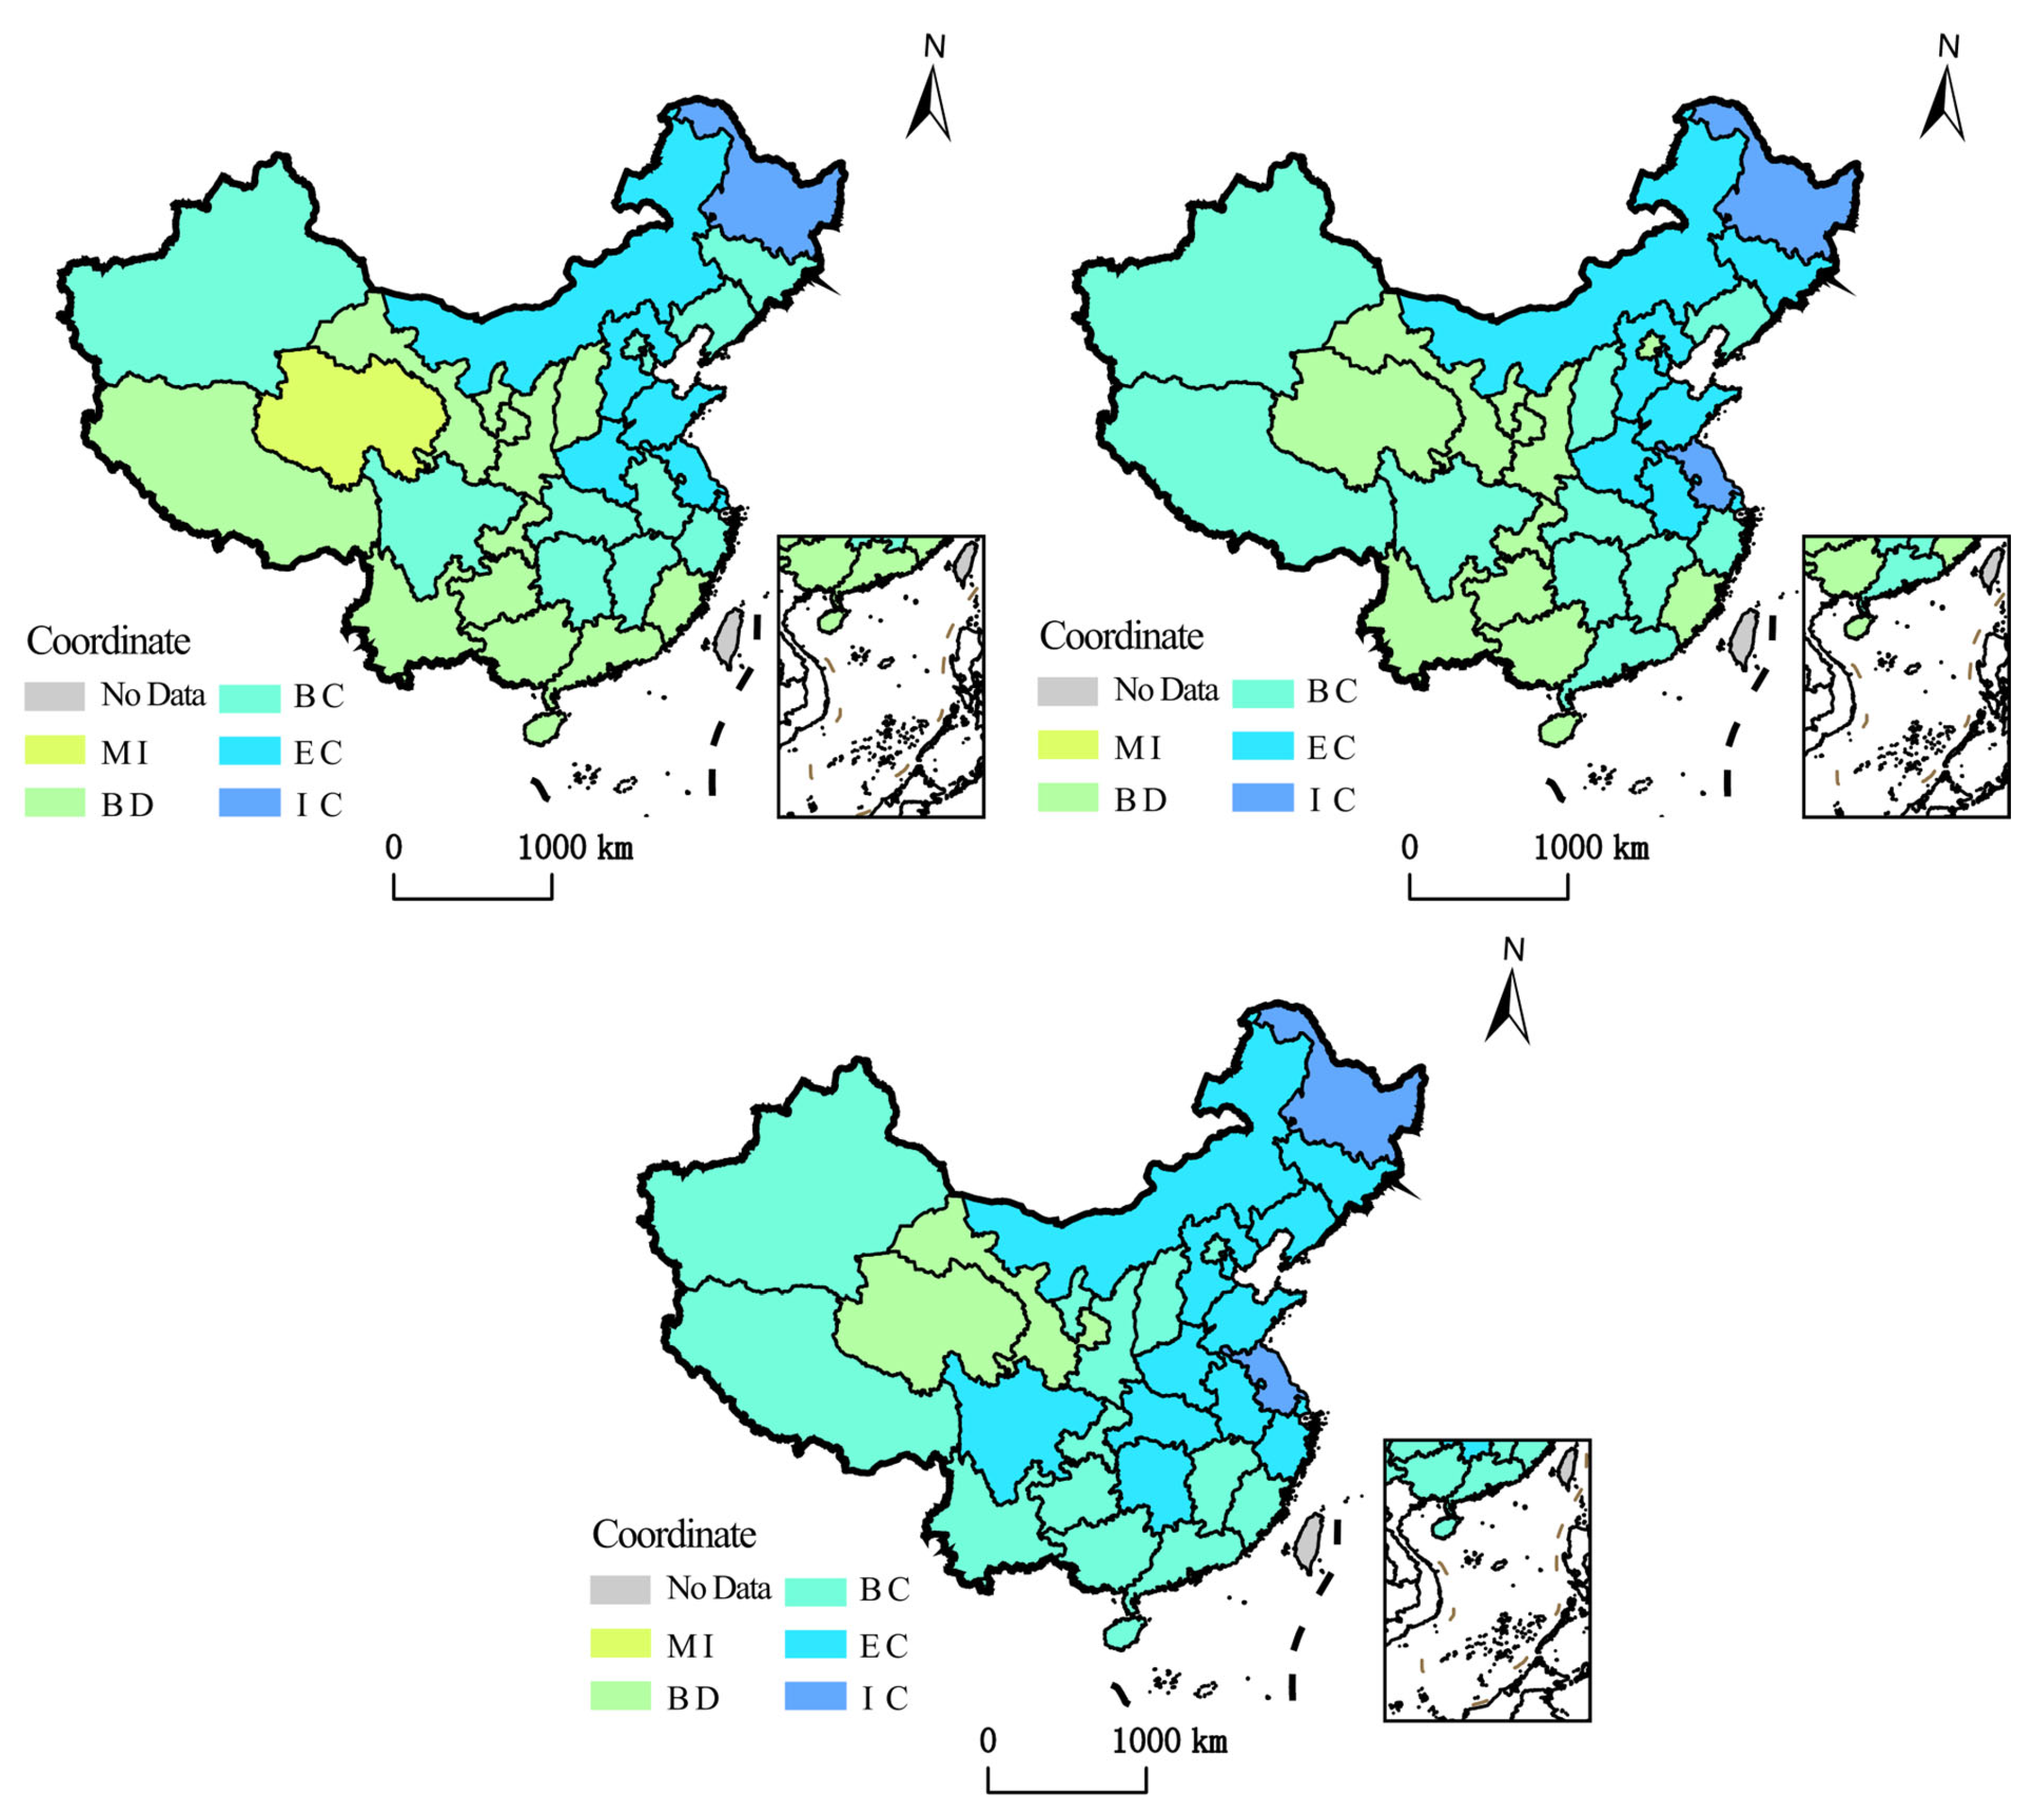
3.2.1. Overall Changes in Coupling Coordination Degree

From 2011 to 2021, the coupling coordination level between CLM and AM development in China increased annually. The overall spatial pattern showed the following: eastern region > central region > national average > western region.
The central region had the highest average annual growth rate at 1.46%, followed by the western region at 1.35%, and the eastern region at 1.27%, which was lower than the national average of 1.33% (Table 2). If maintaining this growth rate, the central region is projected to surpass the eastern region by 2036.
According to the coordination type classification, the proportion of provinces in medium-level and primary coordination in China gradually increased, while the proportion of mild disorder and near-disorder provinces gradually decreased. Since 2016, there have been no provinces in the mild disorder category (Figure 5).
Heilongjiang Province had the highest coordination degree nationwide, reaching a peak of 0.782 in 2021, followed by Jiangsu Province with a maximum of 0.736 in 2020. Qinghai Province had the lowest coordination degree, with only 0.363 in 2011, which was near disorder. Spatially, the northern regions showed higher coordination degrees. The coordination degrees of various regions gradually increased, and by 2021, only Gansu and Qinghai were near disorder, while all other regions in the country had reached barely coordinated or above (Figure 6).

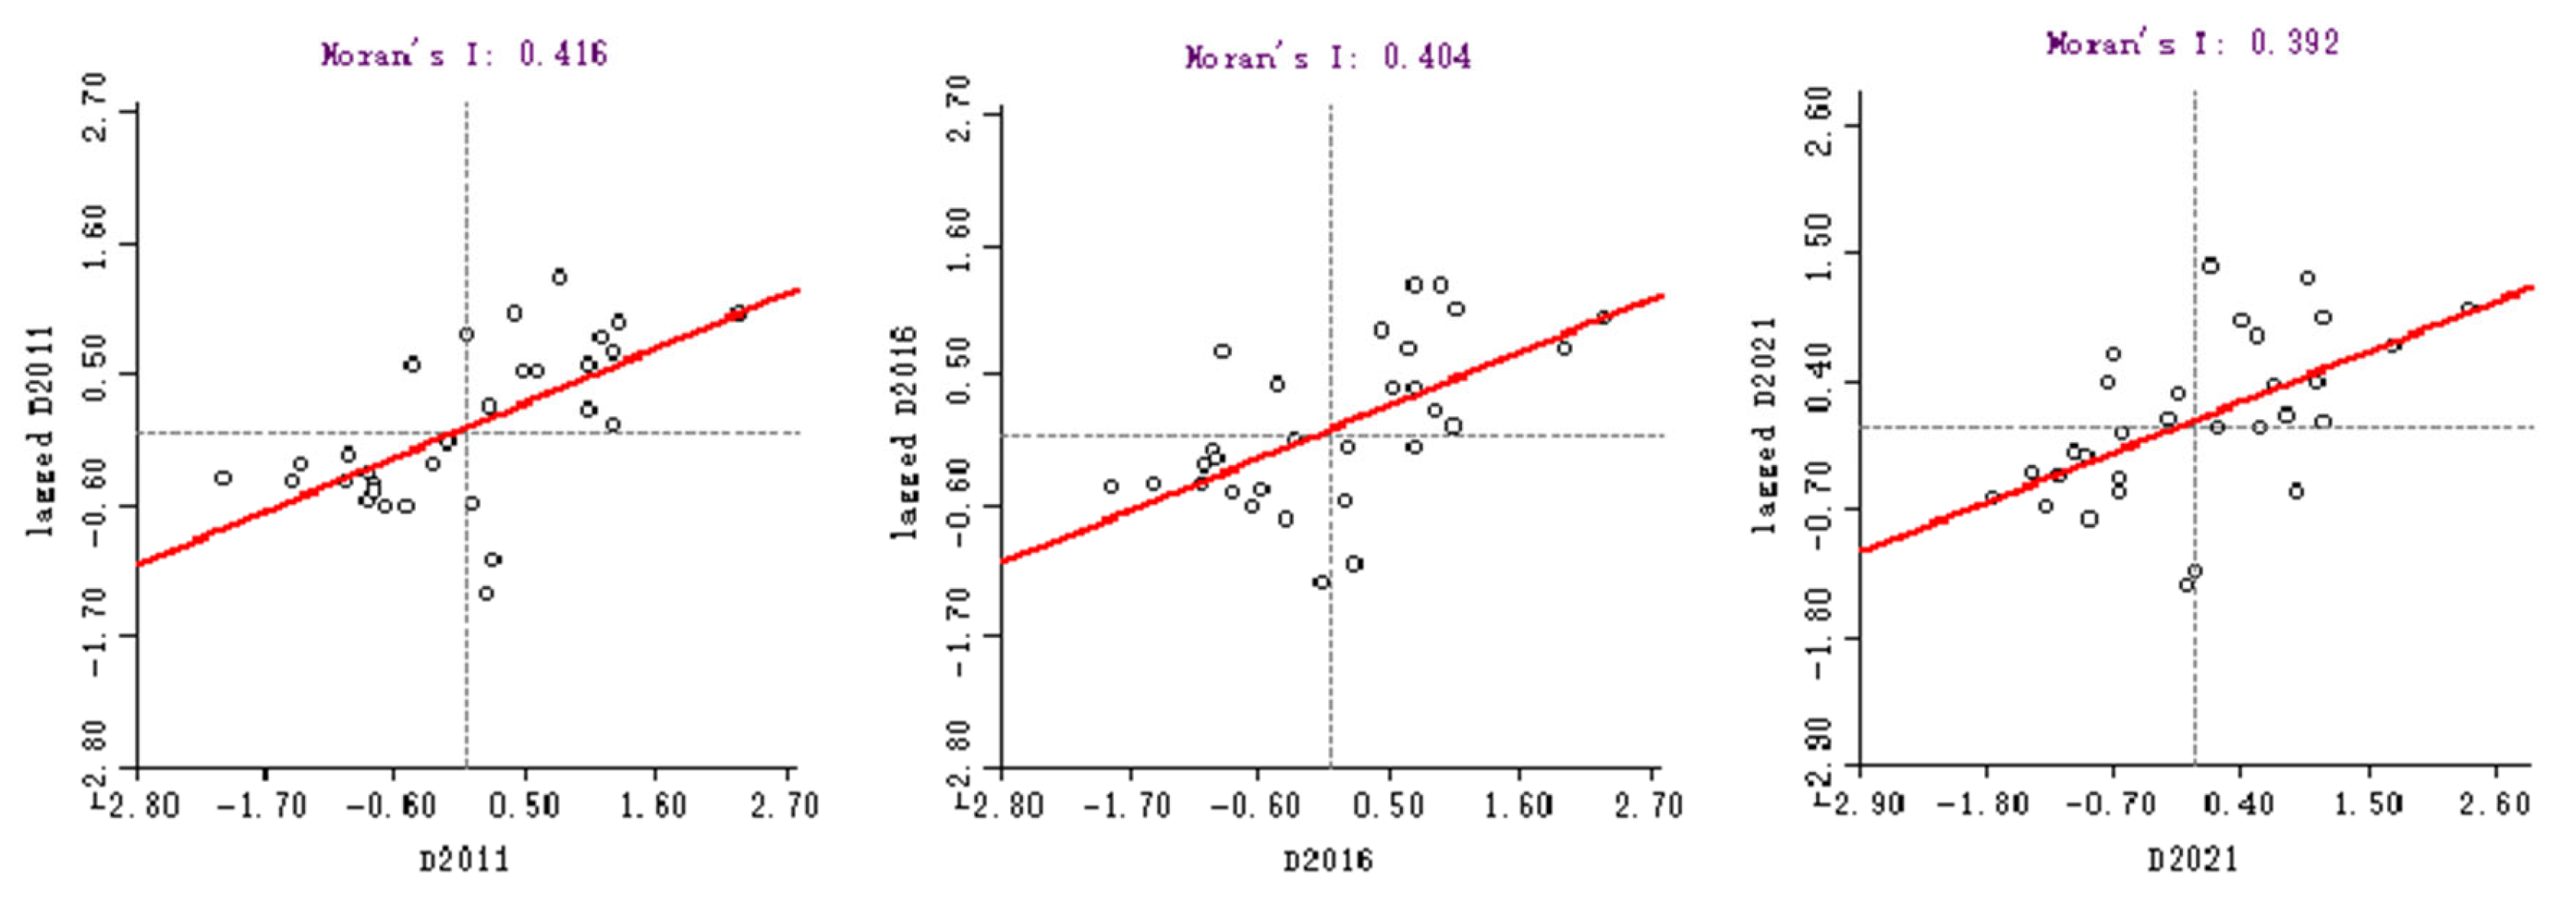
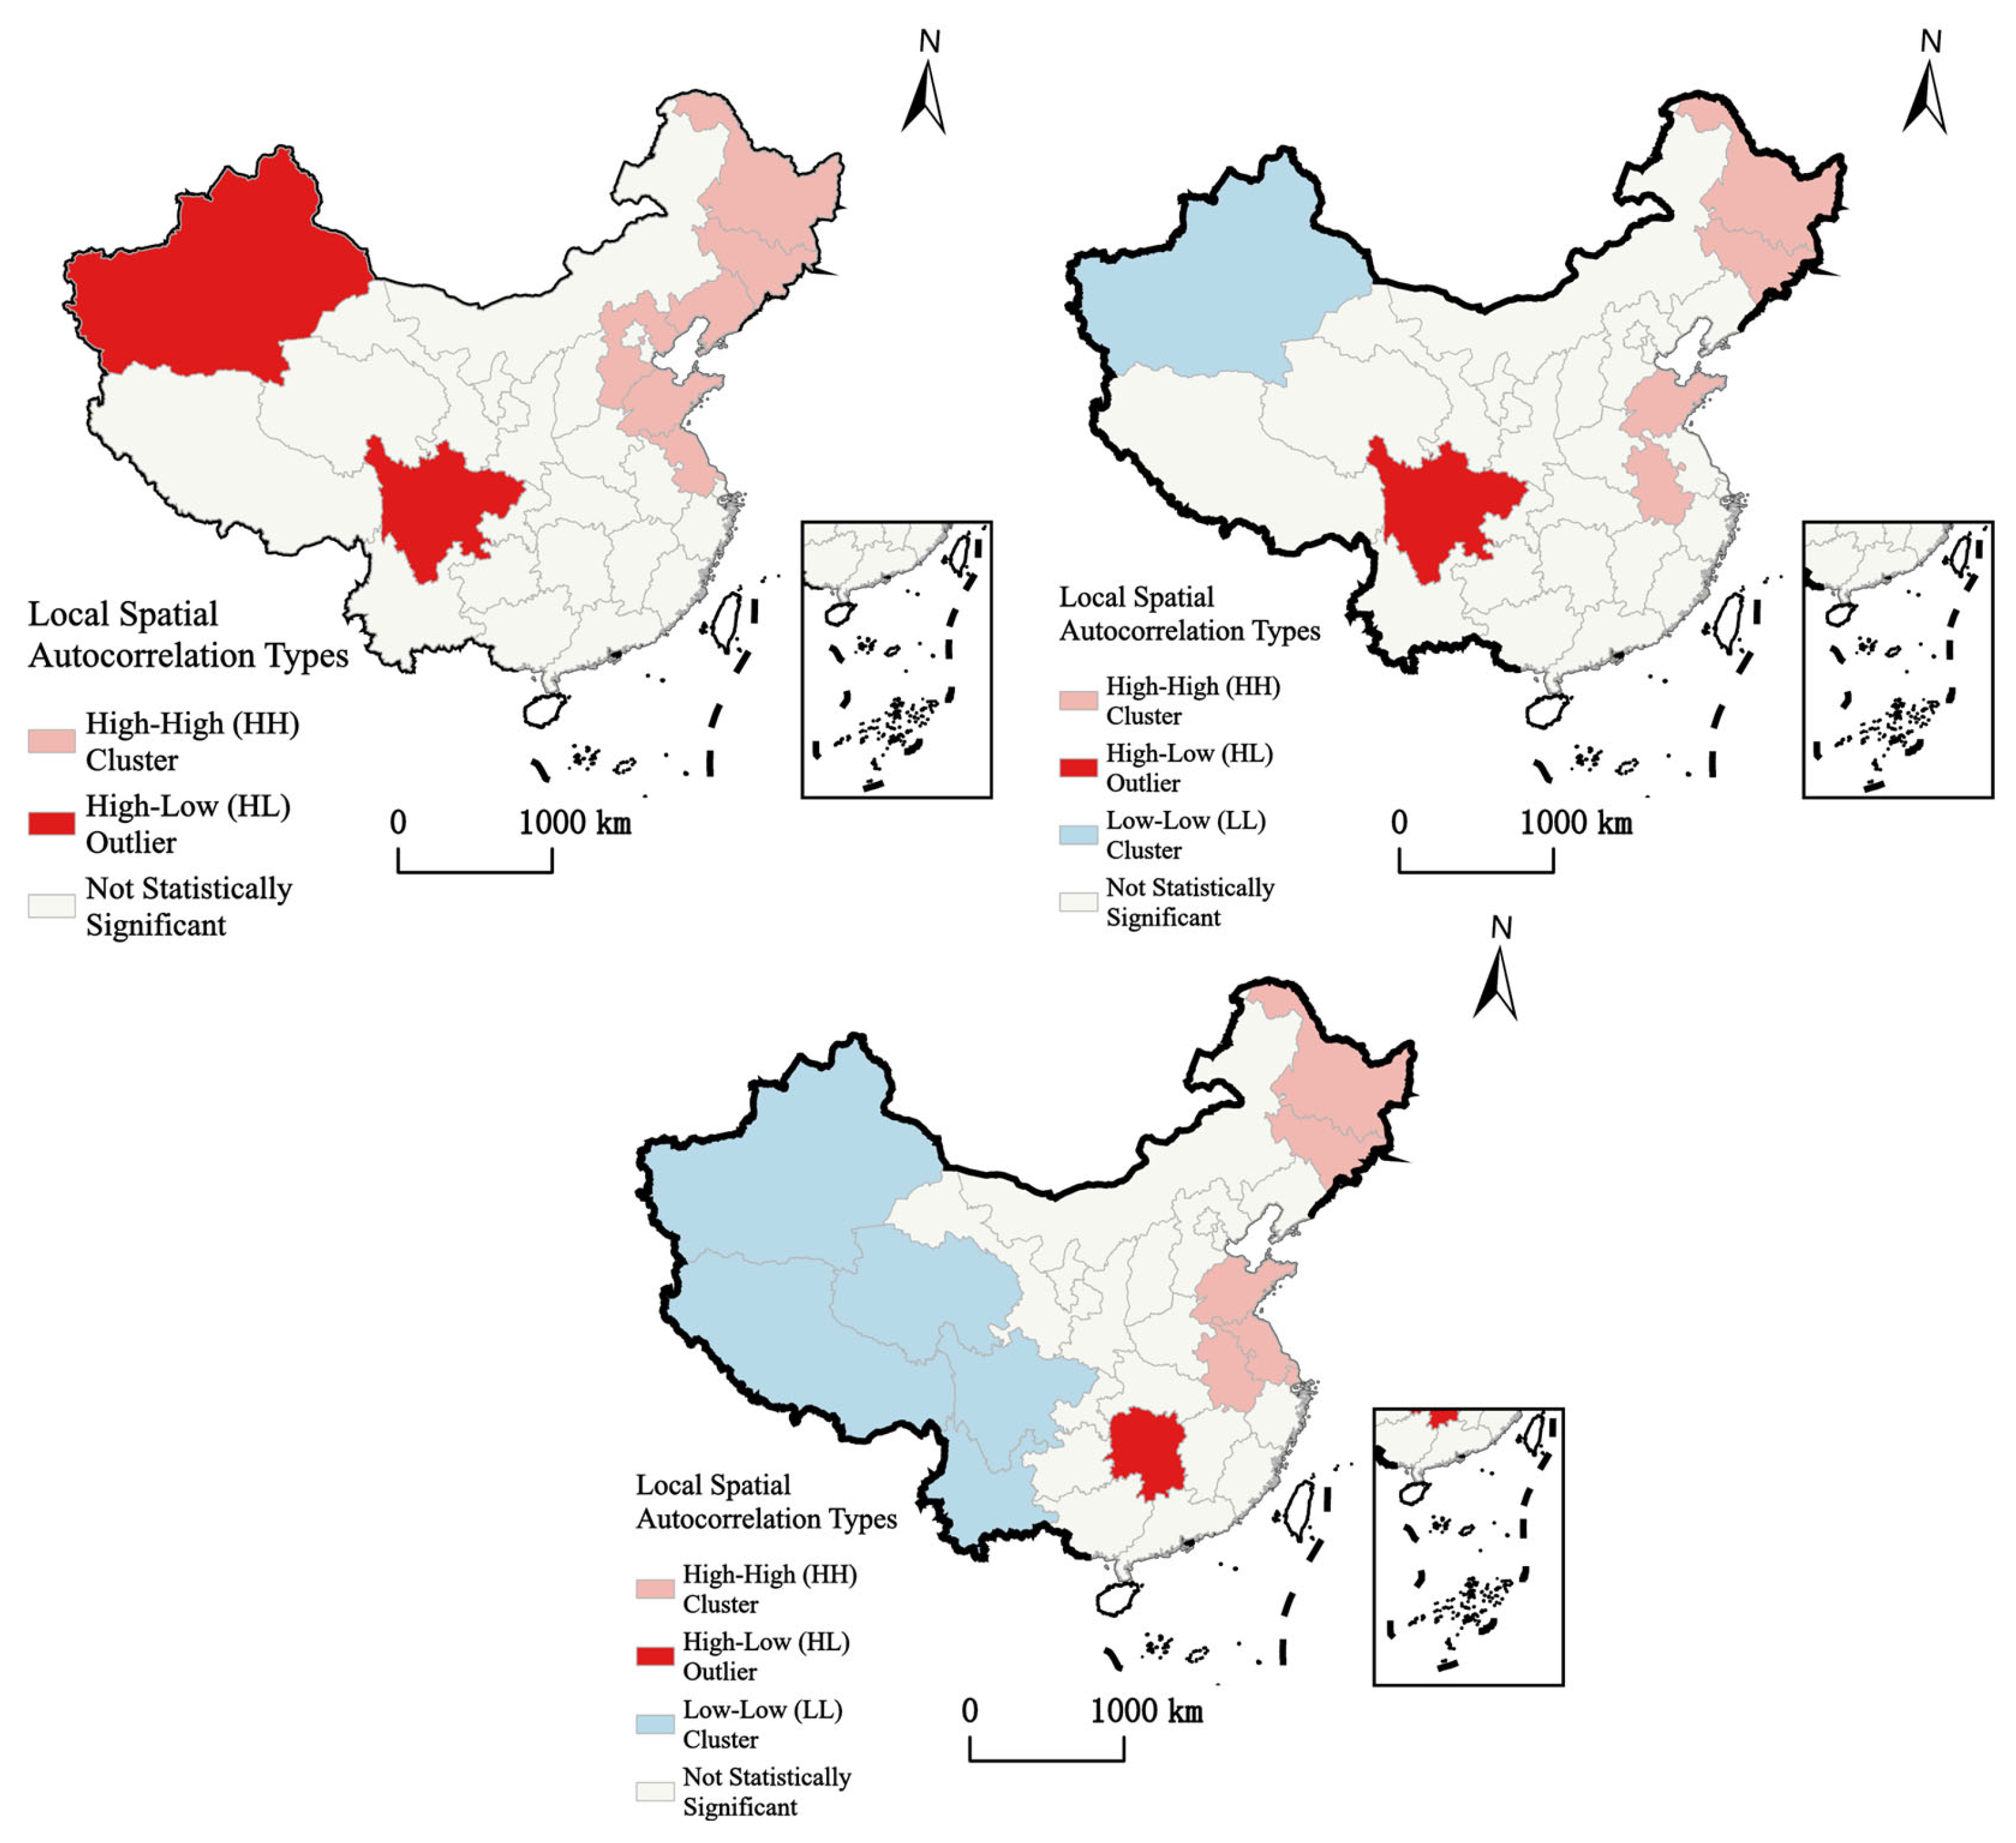
3.2.2. Spatial Effects of Coupling Coordination Degree

From 2011 to 2021, the global Moran’s I values were positive and statistically significant (p < 0.001) in previous analyses. This indicates that the coordination of CLM and AM in different regions of China exhibit significant positive spatial autocorrelation, meaning that high-coordination areas tend to be adjacent, with high-coordination clusters and low-coordination clusters relatively concentrated in space. The Moran’s I index showed a distinct “rise–fall–rise–fall” M-shaped fluctuation trend (Table 3), which may be related to the implementation of policies promoting AM and CLM, the development of AM technologies that improved coordination levels between different regions, and the emergence of collaborative development effects in some areas that drove the improvement of coordination in surrounding regions.
By conducting local spatial autocorrelation analysis and plotting the Moran’s I scatter plot, local spatial autocorrelation characteristics can be explored. The four quadrants in the Moran scatter plot are used to determine the relationship between a region and its expected neighboring regions: Quadrant I (HH) represents areas with high values themselves and high values in surrounding regions; Quadrant II (LH) represents areas with low self-values but high values in surrounding regions; Quadrant III (LL) represents areas with low self-values and low values in surrounding regions; Quadrant IV (HL) represents areas with high self-values but surrounded by low values. Most regions fall in the first and third quadrants, namely, HH and LL types, with only a few points in the second and fourth quadrants (LH and HL transition and radiation areas) (Figure 7). From 2011 to 2021, LL-type regions were mostly located in the western and central regions, while North China, East China, and Northeast China (except Fujian) belonged to the HH type.
Verification of local spatial autocorrelation analysis and LISA cluster map: In 2011, Heilongjiang, Jilin, Liaoning, Jiangsu, Zhejiang, and Hebei provinces, showed significant HH type. As traditional agricultural and economically developed regions in China, these areas demonstrated high coordination of AM and CLM, with adjacent regions also showing high coordination, reflecting high agricultural modernization levels and rational resource allocation, forming a good agglomeration effect. Xinjiang and Sichuan provinces showed significant HL type, with high coordination but low coordination in surrounding areas, possibly indicating significant improvements in AM or land use, but uneven development in neighboring regions. Other provinces’ results were not significant.
In 2016, Anhui Province was added to the significant HH type, indicating improved coordination of AM and land use. Liaoning, Hebei, and Jiangsu provinces lost their significant HH type, possibly due to slowing coordination growth or significant changes in surrounding regions. Xinjiang changed from HL to LL type, suggesting a decline in coordination and potential bottlenecks in agricultural development or resource reallocation.
By 2021, Sichuan Province also changed from significant HL to LL type. Qinghai, Tibet, and Yunnan provinces were added to the LL type, forming a contiguous significant LL type area in western China. This indicates low coordination and spatial clustering, highlighting the relatively backward agricultural development in these regions and the need for more policy support and resource investment. Hunan Province became a significant HL type, potentially requiring enhanced inter-regional coordination and resource sharing.
Significant HH types remained in Heilongjiang and Jilin provinces in the Northeast; Jiangsu, Zhejiang, and Anhui provinces; and Shanghai in East China. These regions maintained high coordination levels with consistent internal and external coordination, forming significant agglomeration effects. However, compared to 2011, the significant HH types were now concentrated in Northeast and East China, unable to form a continuous agglomeration effect (Figure 8).

3.3. Analysis of Driving Mechanisms of Coupling Coordination Degree

To analyze the driving mechanism of regional differences in coupling coordination between CLM and AM in China, potential driving factors were selected as variables to construct a difference matrix, which then underwent QAP regression analysis with the coordination degree difference matrix (variables selected using 2011–2021 mean values).

3.3.1. Internal Driving Factors

The coordination degree model is primarily composed of two systems of CLM functional levels and AM development, consisting of six subsystems. Therefore, the coordination degree results are mainly influenced by these subsystems. These were used as internal factors to construct a difference matrix with coupling coordination degree: (A) Production Function Differences; (B) Social Security Function Differences; (C) Ecological Function Differences; (D) Comprehensive Mechanization Level of Cultivation Differences; (E) Agricultural Mechanization Comprehensive Guarantee Capacity Differences; (F) Agricultural Mechanization Comprehensive Benefit Differences. This study conducted empirical research through the QAP regression analysis method.
Based on the QAP regression results (Table 4), the internal driving factors affecting the coupling coordination degree differences of CLM and AM nationwide include production function differences, social security function differences, ecological function differences, and comprehensive mechanization level of cultivation differences. These factors showed high significance: production function differences, social security function differences, ecological function differences, and comprehensive mechanization level of cultivation differences (p < 0.001), as well as AM comprehensive guarantee capacity differences (p < 0.05), while AM comprehensive benefit differences were not significant. Among these internal factors, production function differences had the highest standardized correlation coefficient (0.340), followed by a comprehensive mechanization level of cultivation differences (0.316). Due to the regression coefficient differences being within 0.1 for the four highly significant internal driving factors, it is difficult to determine which factor is the primary cause of coordination degree differences. However, differences in CL production function had the greatest impact on coordination degree differences between provinces. From a system perspective, differences in CLM functional levels were the main driving factors of coordination degree differences between provinces, with all subsystem regression results being significant and their total correlation coefficients (0.872) higher than those of AM development differences (0.508).
When conducting QAP regression analysis by region, the results showed significant differences across three regions. In the eastern region, the comprehensive mechanization level of cultivation differences was highly significant, with the highest regression coefficient of 0.569; AM comprehensive guarantee capacity differences were not significant. Additionally, the total correlation coefficients of CLM functional differences (1.14) were greater than those of AM development differences (0.943). In the central region, only production function differences and social security function differences were significant, with social security function differences having the highest correlation coefficient of 0.878, followed by production function differences at 0.724; the total correlation coefficients of CLM functional differences (1.955) were far higher than those of AM development differences (0.031). In the western region, only ecological function differences were significant, with a correlation coefficient of 0.726; simultaneously, the total correlation coefficients of CLM functional differences (1.305) were also far higher than those of AM development differences (0.158).
From the perspective of differences between provinces within the same region, coordination degree differences among eastern provinces were influenced by multiple factors without a single dominant factor, though the comprehensive mechanization level of cultivation differences had a relatively significant impact. Coordination degree differences among central provinces were primarily caused by production function differences and social security function differences. Coordination degree differences among western provinces were mainly due to ecological function differences. Overall, differences in CLM functional levels in the central and western regions were the primary driving factors of coordination degree differences.

3.3.2. External Driving Factors

The factors influencing the coupling coordination of CLM functional levels and AM development in China are complex, involving natural, socio-economic, and basic conditions. Existing research suggests that natural environment, socio-economic development, informatization conditions, and agricultural basic conditions can impact CLM and AM development (Table 5). For further exploration of potential external factors affecting regional differences in coupling coordination, these external factor indicators were standardized, and difference matrices were constructed, combined with coupling coordination degree difference matrices, and analyzed using QAP regression analysis method.
According to the QAP regression results in Table 6, most external driving factors’ regression results were not significant, possibly due to QAP’s inability to definitively identify variable impacts. Statistical methods alone cannot conclusively determine that these factors do not influence CLM functional levels and AM development. However, some results demonstrated significance and can be referenced for potential impacts. The most significant factor was cultivated land area (p < 0.001), with the highest correlation coefficient of 0.437. Subsequently, significant factors included land quality (0.349), land flatness (0.282), and number of rural cooperatives per 10,000 rural residents (0.181).

4. Discussion

4.1. Formation Mechanism of Regional Differences

4.1.1. Regional Differences in Cultivated Land Multifunction Levels

This study revealed that the CLM level in western regions is significantly lower than in eastern and central regions. Jiang et al. [46] found that semi-mountainous and mountainous areas have lower multifunctional intensity compared to plain areas, with most of China’s semi-mountainous and mountainous regions concentrated in the western region, consistent with this study’s conclusions on spatial differentiation of CLM. Additionally, Yuan et al. [79] suggested that increasing landscape fragmentation might affect CLM capacity, further explaining the lower land use levels in western regions.
Consistent with Gao et al.’s [48] research on CLM in Northeast China, our study also found that the coupling coordination degree in the northeast gradually improved and was significantly higher than in southern regions. However, the enhancement of economic and social functions hindered ecological function improvements [80]. Our research further revealed Heilongjiang Province’s unique position as the highest-level region, possibly attributed to its abundant CL resources and policy support, with 44% and 48% of its CL soil classified as premium grade [81].
Notably, regional differences are gradually narrowing, potentially benefiting from recent national policy support and technological promotion for western regions. Zhang et al. [82] pointed out that land use transformation (LUT) represents the crucial interaction between socio-economic development and land use patterns, with regional difference reduction reflecting policy intervention and technological diffusion’s key roles. Ma et al. [47] supported this view, indicating that China’s CL “structure–function” transformation stabilized during the third phase (2003–2017), particularly in western provinces like Yunnan, Shaanxi, Gansu, and Xinjiang, where fertilizer usage and multiple cropping index gradually decreased, and returning CL to forests and grasslands played a significant role in ecological function transformation. These policy and technological measures effectively promoted western region development, gradually narrowing the gap with eastern and central regions.

4.1.2. Regional Differences in Agricultural Mechanization Development Levels

Consistent with Wang et al.’s [83] research on AM regional differences, our study also demonstrates that eastern regions’ AM levels are significantly higher than western regions, potentially closely related to eastern regions’ advantages in technology, capital, and policies. However, our research further discovered that provincial differences in AM development are gradually expanding. Li et al. [84] argue that eastern regions, as economically developed areas with higher agricultural modernization levels, exhibit more apparent technological diffusion effects. Ma et al. [47] noted that under globalization, eastern regions demonstrate stronger technological diffusion and resource allocation capabilities in agricultural modernization, potentially a crucial reason for expanding regional differences.
Notably, in spatial distribution characteristics, AM development is generally higher in border and coastal provinces, with southern provinces like Guangxi, Guangdong, Yunnan, and Hainan being relatively lower. Although Guangdong and Hainan are coastal with strong economic foundations (Guangdong has consistently ranked first in provincial GDP for 36 years), their AM development levels are relatively lower compared to Zhejiang and Jiangsu provinces. This might be due to terrain limitations restricting large agricultural machinery promotion, with these provinces’ economies primarily focused on industry and service sectors, as well as having resource and policy tilts more directed towards high-tech industries.
Typically, border regions have complex terrains, mostly hilly and mountainous, with uneven land surfaces unfavorable for large agricultural machinery usage and with scattered agricultural land increasing mechanization promotion difficulties. Border region economies are agriculture-based but relatively underdeveloped, with insufficient government resource allocation and limited AM investments [85]. However, in-depth research revealed that border provinces like Xinjiang, Tibet, Inner Mongolia, Heilongjiang, and Jilin have considerable AM levels. Behind this phenomenon lies unique geographical advantages, agricultural production models, and policy support. Unlike Yunnan and Guangxi’s tropical mountainous border provinces, these regions possess extensive plains and grasslands, providing excellent conditions for large agricultural machinery usage. Simultaneously, special national policies supporting border province agriculture, agricultural science and technology innovation investments, and farmers’ acceptance of modern agricultural technologies collectively drive AM development. This discovery not only challenges traditional stereotypes but provides a richer perspective on understanding China’s agricultural modernization, also indicating that AM levels are complex results of multiple factor interactions.

4.1.3. Spatial Heterogeneity of Coupling Coordination

This study’s empirical analysis of CLM utilization and AM coupling coordination development reveals significant spatial heterogeneity across different regions. Heilongjiang Province stands as an exemplar of coordinated development, warranting in-depth exploration of its successful experience. Regional difference analysis shows clear geographical gradient characteristics in coupling coordination. Central regions experienced the fastest coupling coordination growth, potentially resulting from continuous investments in agricultural technological innovation and factor resource allocation. Western regions followed closely, indicating initial effectiveness of national agricultural support policies. In contrast, eastern regions’ growth was relatively slow, possibly reflecting their agricultural development having entered a mature stage with limited marginal improvement space. Gansu and Qinghai provinces exhibited the lowest coupling coordination, closely related to their geographical conditions and economic characteristics. Located in western marginal regions with complex terrains and harsh natural conditions, these provinces face numerous agricultural production challenges. Notably, western regions’ overall coupling coordination was below the national average, highlighting unbalanced agricultural modernization development. Zhang et al.’s [82] research on land use transformation provides theoretical explanation for this phenomenon, indicating regional development differences as inevitable results of complex socio-economic system evolution. Jiangsu Province, ranking second only to Heilongjiang, offers valuable experience, potentially benefiting from continuous investments in agricultural science and technology innovation, land transfer, and mechanization promotion.
The spatial heterogeneity of regional agricultural development reflects the complexity of China’s agricultural modernization process. Moran’s I index’s dynamic changes reveal deeper mechanisms of regional agricultural coordinated development, highlighting policy guidance, technological innovation, and resource allocation’s critical roles. Future regional agricultural development requires more precise and differentiated development strategies. This means developing context-specific strategies based on different regions’ actual conditions, strengthening technological innovation and resource sharing, optimizing inter-regional collaborative development mechanisms, and addressing regional development imbalances targeted. Northeast and East China’s sustained high-level coordinated development highlights regional innovation capabilities and resource optimization’s importance. In contrast, western regions face more severe structural challenges, with natural geographical conditions, technological innovation capabilities, and resource investment limitations constraining agricultural modernization processes. Coordination degree changes in provinces like Xinjiang and Sichuan reflect agricultural development’s dynamic adjustments. This transformation process not only reflects regional agricultural development’s intrinsic complexity but also indicates agricultural modernization’s need for more precise and differentiated development paths.

4.1.4. Analysis of Driving Factors for Intra-Regional Differences

Through QAP regression analysis, this study deeply explored driving factors influencing China’s CLM utilization and AM development coupling coordination, revealing complex impact mechanisms. Research results demonstrate multi-dimensional and differentiated factor effects. In eastern regions, coordination difference characteristics appear multi-faceted and complex. Consistent with existing research [84], we found no single dominant factor, but comprehensive mechanization level differences relatively stand out. This discovery reveals technological factors’ critical role in eastern regions’ agricultural modernization processes. Differences in AM levels across provinces might stem from comprehensive interactions of technological innovation capabilities, capital investments, and agricultural operation scales. For instance, Zhejiang and Jiangsu provinces’ leading advantages in AM result not only from economic foundations but are closely related to long-term technological accumulation and innovation investments.
Central regions’ coordination difference formation mechanisms appear more definitive. Production and social security function significant differences became primary factors driving inter-provincial coordination degree differences. This finding highly aligns with Ma et al.’s [47] research on agricultural function transformation. As China’s important agricultural production base, central region provinces exhibit significant differences in agricultural production efficiency and farmers’ social security levels, directly influencing CLM utilization and AM coordinated development levels.
Western regions’ coordination differences primarily result from ecological function differences, further verifying Ma et al.’s [47] research conclusions on western regions’ agricultural ecological function transformation. Influenced by terrain, climate, and natural resources, western provinces demonstrate significant differences in ecological function maintenance and improvement. For example, provinces like Gansu and Qinghai face more severe challenges in ecological function maintenance due to unique geographical environments.
CLM utilization level differences in central and western regions were confirmed as primary driving factors for coordination degree differences. This discovery transcends traditional single-dimensional analysis, revealing CLM utilization’s complexity. These differences not only reflect unbalanced development but provide crucial theoretical guidance and practical references for China’s differentiated agricultural modernization development paths.

4.2. Policy Recommendations for Regional Agricultural Development

Based on regional differences in agricultural development and CLM utilization and AM coordination issues, the following policy recommendations are proposed:
First, eastern regions, as high-level coordinated development areas, should continuously promote AM technological innovation. Specific measures include increasing agricultural science and technology innovation investments, focusing on agricultural machinery equipment research and development; establishing AM technological innovation platforms; and encouraging collaboration between agricultural machinery enterprises, universities, and research institutions. Through technological innovation, eastern regions can not only maintain their AM leading advantages and further enhance agricultural production efficiency and international competitiveness but also leverage spatial effects to drive neighboring provinces’ development. However, it is necessary to note that innovation costs are high, technological promotion exhibits regional differences, and innovation result transformation cycles are long, potentially affecting policy implementation effectiveness.
Second, central regions, as coordination development potential areas, should optimize production functions and social security systems. Recommendations include improving agricultural socialized service systems, enhancing farmers’ social security levels, and promoting agricultural production’s specialization and scale. This will help narrow regional agricultural development gaps, improve agricultural production efficiency, and enhance farmers’ living standards. However, challenges such as significant fund investment pressures, complex rural social security system construction, and geographical and economic obstacles to agricultural production scaling might constrain policy effective implementation. Therefore, targeted measures must be adopted to ensure smooth policy implementation.
Western regions, facing structural challenges, should focus on ecological function protection and sustainable development. Specific policy measures include implementing returning CL to forests and grasslands programs, developing ecological agriculture, establishing ecological compensation mechanisms, and addressing natural geographical condition limitations. Additionally, enhancing technological innovation capabilities and optimizing resource investment mechanisms are crucial to ensuring ecological and economic coordinated development. For transformation provinces like Xinjiang and Sichuan, dynamic adjustment and precise support policies should be adopted. First, identify regional agricultural development structural problems, develop differentiated agricultural modernization paths, balance economic development and ecological protection, strengthen regional collaborative innovation, and optimize resource allocation mechanisms to promote sustainable development. Overall development principles should include context-specificity, precise policy implementation, innovation strengthening, resource allocation optimization, and regional collaborative emphasis. These measures will help enhance western regions’ agricultural sustainable development capabilities, although they face challenges like natural condition constraints, high ecological restoration investments, and difficulties balancing economic development with ecological protection. Through effective policy implementation, these problems can be gradually overcome.

4.3. Research Limitations and Prospects

Despite using socio-economic and remote sensing data and constructing a comprehensive evaluation system through entropy weight TOPSIS and coupling coordination models, conducting spatial autocorrelation and QAP regression analyses, this study may still have the following limitations:
(1)
Large research scale. Focusing on China’s provincial-level CLM utilization and AM coupling coordination development provides a macroscopic policy-making basis but has limited guiding significance due to the large scale. Moreover, provinces exhibit significant differences in socio-economic development levels, agricultural types, geographical conditions, and policy environments, and provincial-scale analysis might fail to reveal specific local problems or potential opportunities.
(2)
Data accuracy and timeliness. Socio-economic data primarily originated from annual statistical yearbooks, comprehensively reflecting provinces’ indicator developments. However, annual statistical data’s timeliness and regional granularity might affect analysis results, especially regarding subtle policy changes and short-term economic fluctuations. Remote sensing data, mainly used for ecological indicator calculations, provide objective spatial information for CLM utilization’s ecological dimensions but might also affect analysis precision through timeliness and spatial resolution limitations.
(3)
Model limitations. This study employed entropy weight TOPSIS and coupling coordination models for evaluation system construction. While effective for comprehensive evaluation and coupling relationship analysis, these methods’ inherent assumptions and simplifications might lead to insufficient consideration of some influencing factors. For instance, coupling coordination models often assume linear relationships between factors, but actual relationships between AM and CL ecological functions might be non-linear and intricately interconnected.

5. Conclusions

Through empirical analysis of coupling coordination between CLM and AM development across different regions in China, this study revealed significant regional differences and their driving factors. The core findings are summarized as follows:
(1)
Development Trends and Imbalance: From 2011 to 2021, China’s CLM levels and AM development indices both showed upward trends, with coupling coordination development levels also improving. However, regional imbalances persist, particularly with AM development differences gradually expanding. Western regions’ CLM levels are significantly lower than other regions, primarily influenced by natural conditions.
(2)
Driving Factors: Eastern regions’ agricultural modernization critically depends on technological factors; central regions are influenced by production efficiency and social security differences; western regions’ coordination differences mainly stem from ecological function vulnerability. Therefore, western regions need to develop AM according to local conditions.
(3)
Natural Condition Impacts: Natural conditions such as CL area, quality, and land flatness significantly impact coordinated development of AM and CLM. Additionally, rural cooperative numbers, as a manifestation of institutional innovation, to some extent promote agricultural development, emphasizing the complexity of regional agricultural development.
Future agricultural development should focus more on the following aspects:
(1)
Eastern Regions: Continuously promote AM technological innovation and optimize technology promotion and application to enhance CLM levels.
(2)
Central Regions: Optimize production functions and social security systems, promote mechanization development through policy guidance and financial support, and achieve coordinated improvement of CLM and AM.
(3)
Western Regions: Strengthen ecological function protection and restoration, enhance agricultural production capacity, and overcome challenges in agricultural modernization processes.
This research provides a new perspective for understanding the complexity of China’s agricultural modernization and offers practical recommendations for policymakers in promoting regional coordinated development.

Author Contributions

Data curation, E.H., D.L. and X.D.; investigation, Y.Z., H.K., Z.L. (Zixuan Liu) and Z.Y.; methodology, S.F. and L.G.; writing—original draft, Y.Q.; writing—review and editing, Z.L. (Zhongbo Li). All authors have read and agreed to the published version of the manuscript.

Funding

This research received no external funding.

Data Availability Statement

The data presented in this study are available in the National Bureau of Statistics of China Statistical Database at: https://www.stats.gov.cn/ (accessed on 3 March 2025), reference number CN-11-2005.

Conflicts of Interest

We declare that this manuscript entitled “Analysis of Coupled and Coordinated Development of Cultivated Land Multifunction and Agricultural Mechanization in China” is original and has not been published before and is not currently being considered for publication elsewhere. The authors declare that they have no known competing financial interests or personal relationships that could have appeared to influence the work reported in this paper.

References

  1. Gu, G.; Shi, L.; Wen, Q.; Niu, S. Coupling and coordination of the multifunction and value of arable land at the regional scale from the perspective of rural hollowing governance. Prog. Geogr. 2024, 43, 587–602. [Google Scholar] [CrossRef]
  2. Song, X.; Ouyang, Z. Route of Multifunctional Cultivated Land Management in China. J. Nat. Resour. 2012, 27, 540–551. [Google Scholar] [CrossRef]
  3. Wei, X.; Lin, L.; Luo, P.; Wang, S.; Yang, J.; Guan, J. Spatiotemporal pattern and driving force analysis of multi-functional coupling coordinated development of cultivated land. Trans. Chin. Soc. Agric. Eng. (Trans. CSAE) 2022, 38, 260–269. [Google Scholar] [CrossRef]
  4. Liu, C.; Xu, Y.; Sun, P.; Liu, J. Progress and prospects of multi-functionality of land use research. Prog. Geogr. 2016, 35, 1087–1099. [Google Scholar] [CrossRef]
  5. Xiang, J.; Liao, X.; Song, X.; Xiong, J.; Ma, W.; Huang, J. Regional convergence of cultivated land multifunctions in China. Resour. Sci. 2019, 41, 1959–1971. [Google Scholar] [CrossRef]
  6. Kremen, C.; Merenlender, A.M. Landscapes that work for biodiversity and people. Science 2018, 362, eaau6020. [Google Scholar] [CrossRef]
  7. Li, C.; Wang, X.; Ji, Z.; Li, L.; Guan, X. Optimizing the use of cultivated land in China’s main grain-producing areas from the dual perspective of ecological security and leading-function zoning. Int. J. Environ. Res. Public Health 2022, 19, 13630. [Google Scholar] [CrossRef]
  8. Liu, Z.; Xin, Z.; Guo, C.; Zhao, Y. An Analysis Method of System Coupling and Spatio-Temporal Evolution of County New Urbanization and Logistics Industry. Systems 2024, 12, 185. [Google Scholar] [CrossRef]
  9. Yu, Y.; Lin, J.; Zhou, P.; Zheng, S.; Li, Z. Cultivated Land Input Behavior of Different Types of Rural Households and Its Impact on Cultivated Land-Use Efficiency: A Case Study of the Yimeng Mountain Area, China. Int. J. Environ. Res. Public Health 2022, 19, 14870. [Google Scholar] [CrossRef]
  10. Chen, C.H. A novel multi-criteria decision-making model for building material supplier selection based on entropy-AHP weighted TOPSIS. Entropy 2020, 22, 259. [Google Scholar] [CrossRef]
  11. Liang, X.; Jin, X.; Ren, J.; Gu, Z.; Zhou, Y. A research framework of land use transition in Suzhou City coupled with land use structure and landscape multifunctionality. Sci. Total Environ. 2020, 737, 139932. [Google Scholar] [CrossRef] [PubMed]
  12. Yang, D.; Liu, Z.; Zhang, P.; Chen, Z.; Chang, Y.; Wang, Q.; Zhang, X.; Lu, R.; Li, M.; Xing, G.; et al. Understanding Relationships between Cultivated Land Pressure and Economic Development Level across Spatiotemporal Characteristics: Implications for Supporting Land-Use Management Decisions. Int. J. Environ. Res. Public Health 2022, 19, 16362. [Google Scholar] [CrossRef] [PubMed]
  13. Gurr, G.M.; Lu, Z.; Zheng, X.; Xu, H.; Zhu, P.; Chen, G.; Yao, X.; Cheng, J.; Zhu, Z.; Catindig, J.L.; et al. Multi-country evidence that crop diversification promotes ecological intensification of agriculture. Nat. Plants 2016, 2, 1–4. [Google Scholar] [CrossRef] [PubMed]
  14. Montoya, D.; Gaba, S.; De Mazancourt, C.; Bretagnolle, V.; Loreau, M. Reconciling biodiversity conservation, food production and farmers’ demand in agricultural landscapes. Ecol. Model. 2020, 416, 108889. [Google Scholar] [CrossRef]
  15. Ke, X. Regarding new thoughts on cultivated land protection and utilization. China Land 2023, 9, 28–31. [Google Scholar] [CrossRef]
  16. Luo, X.; Liao, J.; Hu l Zang, Y.; Zhou, Z. Improving agricultural mechanization level to promote agricultural sustainable development. Trans. Chin. Soc. Agric. Eng. (Trans. CSAE) 2016, 32, 1–11. [Google Scholar] [CrossRef]
  17. Yang, M.; Bai, R.; Liu, M.; Tu, Z. Development of Agricultural Mechanization and Construction of Modern Agriculture. Trans. Chin. Soc. Agric. Mach. 2005, 36, 68–72. [Google Scholar]
  18. Wang, B.; Ma, X.; Wang, F.; Chen, Z.; Lin, B. Integration of agricultural machinery and agronomy promoting high-quality and efficient development of agricultural mechanization. Agric. Eng. 2024, 14, 5–9. [Google Scholar]
  19. Cao, N.; Zhang, J. Empirical analysis on the contribution rate of agricultural mechanization to farmers′ income increase in China. J. Chin. Agric. Mech. 2024, 45, 327–332. [Google Scholar]
  20. Yan, F.; Sun, X.; Chen, S.; Dai, G. Does agricultural mechanization improve agricultural environmental efficiency? Front. Environ. Sci. 2024, 11, 1344903. [Google Scholar] [CrossRef]
  21. Zalidis, G.; Stamatiadis, S.; Takavakoglou, V.; Eskridge, K.; Misopolinos, N. Impacts of agricultural practices on soil and water quality in the Mediter-ranean region and proposed assessment methodology. Agric. Ecosyst. Environ. 2002, 88, 137–146. [Google Scholar] [CrossRef]
  22. Fan, Y.; Jin, X.; Gan, L.; Jessup, L.; Pijanowski, B.; Yang, X.; Xiang, X.; Zhou, Y. Spatial identification and dynamic analysis of land use functions reveals distinct zones of multiple functions in eastern China. Sci. Total Environ. 2018, 642, 33–44. [Google Scholar] [CrossRef] [PubMed]
  23. Zou, L.; Liu, Y.; Yang, J.; Yang, S.; Wang, Y.; Zhi, C.; Hu, X. Quantitative identification and spatial analysis of land use ecological-production-living functions in rural areas on China’s southeast coast. Habitat Int. 2020, 100, 102182. [Google Scholar] [CrossRef]
  24. Xue, M.; Wang, H.; Wei, Y.; Ma, C.; Yin, Y. Spatial Characteristics of Land Use Multifunctionality and Their Trade-Off/Synergy in Urumqi, China: Implication for Land Space Zoning Management. Sustainability 2022, 14, 9285. [Google Scholar] [CrossRef]
  25. Zhou, D.; Xu, J.; Lin, Z. Conflict or coordination? Assessing land use multi-functionalization using production-living-ecology analysis. Sci. Total Environ. 2017, 577, 136–147. [Google Scholar] [CrossRef]
  26. Qu, Y.; Jiang, G.; Zhao, Q.; Ma, W.; Zhang, R.; Yang, Y. Geographic identification, spatial differentiation, and formation mechanism of multifunction of rural settlements: A case study of 804 typical villages in Shandong Province, China. J. Clean. Prod. 2017, 166, 1202–1215. [Google Scholar] [CrossRef]
  27. Willemen, L.; Verburg, P.H.; Hein, L.; van Mensvoort, M.E. Spatial characterization of landscape functions. Landsc. Urban Plan. 2008, 88, 34–43. [Google Scholar] [CrossRef]
  28. Khaled, R.; Hammas, L. Technological Innovation and the Agricultural Sustainability. Environ. Agric. Inform. 2016, 7, 1–14. [Google Scholar] [CrossRef]
  29. Yin, S.; Wang, Y.; Xu, J. Developing a Conceptual Partner Matching Framework for Digital Green Innovation of Agricultural High-End Equipment Manufacturing System Toward Agriculture 5.0: A Novel Niche Field Model Combined With Fuzzy VIKOR. Front. Psychol. 2022, 13, 924109. [Google Scholar] [CrossRef]
  30. Devkota, R.; Pant, L.; Gartaula, H.; Patel, K.; Gauchan, D.; Hambly-Odame, H.; Thapa, B.; Raizada, M. Responsible Agricultural Mechanization Innovation for the Sustainable Development of Nepal’s Hillside Farming System. Sustainability 2020, 12, 374. [Google Scholar] [CrossRef]
  31. Ganguly, K.; Gulati, A.; Von Braun, J. Innovations Spearheading the Next Transformations in India’s Agriculture; ERN: Innovation (Topic); International Food Policy Research Institute (IFPRI): Washington, DC, USA, 2017. [Google Scholar] [CrossRef]
  32. Harahap, B.; Widodo, W.; Sutanto, A.; Sapar; Syafruddin. The effect of the agricultural mechanization assistance model on socio-economic changes of farmer groups in Palopo city, Indonesia. Int. J. Sci. Res. Manag. 2024, 12, 497–505. [Google Scholar] [CrossRef]
  33. Zhang, M.; Fang, K.; Zhang, D.; Zeng, D. Relationship between the evaluation of agricultural scientific and technological innovation capacity and the influencing factors of green agriculture. PLoS ONE 2023, 18, e0295281. [Google Scholar] [CrossRef] [PubMed]
  34. Niu, P.; Zhou, J.; Yang, Y.; Xia, Y. Evolution and Trade-Off in the Multifunctional Cultivated Land System in Henan Province, China: From the Perspective of the Social-Ecological System. Front. Ecol. Evol. 2022, 10, 822807. [Google Scholar] [CrossRef]
  35. Yu, M.; Yang, Y.; Chen, F.; Zhu, F.; Qu, J.; Zhang, S. Response of agricultural multifunctionality to farmland loss under rapidly urbanizing processes in Yangtze River Delta, China. Sci. Total Environ. 2019, 666, 1–11. [Google Scholar] [CrossRef]
  36. Ding, B.; Zhao, Y.; Deng, J. Calculation, Decoupling Effects and Driving Factors of Carbon Emission From Planting Industry in China. Chin. J. Agric. Resour. Reg. Plan. 2022, 43, 1–11. [Google Scholar]
  37. Yang, J.; Huang, X. The 30 m Annual Land Cover Dataset and Its Dynamics in China from 1990 to 2019. Earth Syst. Sci. Data 2021, 13, 3907–3925. [Google Scholar] [CrossRef]
  38. Geng, Y.; Zhu, H.; Zhu, R. Coupling Coordination between Cultural Heritage Protection and Tourism Development: The Case of China. Sustainability 2022, 14, 15421. [Google Scholar] [CrossRef]
  39. Deng, Z.; Xiao, Q.; Wang, J.; Li, L. Spatiotemporal characteristics and driving mechanism of the coupling coordination between digital economy and green development in China. Acta Geogr. Sin. 2024, 79, 971–990. [Google Scholar] [CrossRef]
  40. Xing, L.; Xue, M.; Hu, M. Dynamic simulation and assessment of the coupling coordination degree of the economy–resource–environment system: Case of Wuhan City in China. J. Environ. Manag. 2019, 230, 474–487. [Google Scholar] [CrossRef]
  41. Geng, Y.; Geng, Y.; Huang, F.; Huang, F. Coupling coordination between higher education and environmental governance: Evidence of western China. PLoS ONE 2022, 17, e0271994. [Google Scholar] [CrossRef]
  42. Frei, B.; Queiroz, C.; Chaplin-Kramer, B.; Andersson, E.; Renard, D.; Rhemtulla, J.M.; Bennett, E.M. A brighter future: Complementary goals of diversity and multifunctionality to build resilient agricultural landscapes. Glob. Food Secur. 2020, 26, 100407. [Google Scholar] [CrossRef]
  43. Huang, J.; Tichit, M.; Poulot, M.; Darly, S.; Li, S.; Petit, C.; Aubry, C. Comparative review of multifunctionality and ecosystem services in sustainable agriculture. J. Environ. Manag. 2015, 149, 138–147. [Google Scholar] [CrossRef] [PubMed]
  44. Wittwer, R.A.; Bender, S.F.; Hartman, K.; Hydbom, S.; Lima, R.A.A.; Loaiza, V.; Nemecek, T.; Oehl, F.; Olsson, P.A.; Petchey, O.; et al. Organic and conservation agriculture promote ecosystem multifunctionality. Sci. Adv. 2021, 7, eabg6995. [Google Scholar] [CrossRef] [PubMed]
  45. Song, X.; Ouyang, Z. Connotation of Multifunctional Cultivated Land and Its Implications for Cultivated Land Protection. Prog. Geogr. 2012, 31, 859–868. [Google Scholar] [CrossRef]
  46. Jiang, G.; Wang, M.; Qu, Y.; Zhou, D.; Ma, W. Towards cultivated land multifunction assessment in China: Applying the “influencing factors-functions-products-demands” integrated framework. Land Use Policy 2020, 99, 104982. [Google Scholar] [CrossRef]
  47. Ma, L.; Long, H.; Tu, S.; Zhang, Y.; Zheng, Y. Farmland transition in China and its policy implications. Land Use Policy 2020, 92, 104470. [Google Scholar] [CrossRef]
  48. Gao, J.; Zhu, Y.; Zhao, R.; Sui, H. The Use of Cultivated Land for Multiple Functions in Major Grain-Producing Areas in Northeast China: Spatial-Temporal Pattern and Driving Forces. Land 2022, 11, 1476. [Google Scholar] [CrossRef]
  49. Liu, C.; Xu, Y.; Huang, A.; Liu, Y.; Wang, H.; Lu, L.; Sun, P.; Zheng, W. Spatial identification of land use multifunctionality at grid scale in farming-pastoral area: A case study of Zhangjiakou City, China. Habitat Int. 2018, 76, 48–61. [Google Scholar] [CrossRef]
  50. Tang, F.; Li, Y.; Liu, X.; Huang, J.; Zhang, Y.; Xu, Q. Understanding the Relationships between Landscape Eco-Security and Multifunctionality in Cropland: Implications for Supporting Cropland Management Decisions. Int. J. Environ. Res. Public Health 2023, 20, 1938. [Google Scholar] [CrossRef]
  51. Liu, S.; Zhou, Y.; Qi, Y.; Chen, Y.; Liu, W.; Xu, H.; Wang, S. Study on the multifunctional spatial-temporal evolution and coupling coordination of cultivated land: A case study of Hebei Province, China. PLoS ONE 2024, 19, e0306110. [Google Scholar] [CrossRef]
  52. Ma, L.; Li, Y.; Cui, X.; Tao, T. Land management and rural development in northwest China. Land 2022, 11, 1423. [Google Scholar] [CrossRef]
  53. Tahat, M.M.; Alananbeh, K.M.; Othman, Y.A.; Leskovar, D.I. Soil Health and Sustainable Agriculture. Sustainability 2020, 12, 4859. [Google Scholar] [CrossRef]
  54. Tarolli, P.; Straffelini, E. Agriculture in Hilly and Mountainous Landscapes: Threats, Monitoring and Sustainable Management. Geogr. Sustain. 2020, 1, 70–76. [Google Scholar] [CrossRef]
  55. Peng, J.; Zhao, Z.; Liu, D. Impact of Agricultural Mechanization on Agricultural Production, Income, and Mechanism: Evidence From Hubei Province, China. Front. Environ. Sci. 2022, 10, 838686. [Google Scholar] [CrossRef]
  56. Prasad, K.A. Impacts of Agricultural Mechanization: A Case of Palpa District of Nepal. Acta Mech. Malays. 2020, 3, 16–19. [Google Scholar] [CrossRef]
  57. Zhang, N.; Zhang, X.; Xiu, C. Does Agricultural Mechanization Help Farmers to Strengthen Sustainability and Protect Cultivated Land? Evidence from 2118 Households in 10 Provinces of China. Sustainability 2024, 16, 6136. [Google Scholar] [CrossRef]
  58. Daum, T.; Adegbola, Y.; Kamau, G.; Kergna, A.; Daudu, C.; Zossou, R.; Crinot, G.; Houssou, P.; Mose, L.; Ndirpaya, Y.; et al. Perceived effects of farm tractors in four African countries, highlighted by participatory impact diagrams. Agron. Sustain. Dev. 2020, 40, 1–19. [Google Scholar] [CrossRef]
  59. Daum, T.; Adegbola, Y.; Kamau, G.; Kergna, A.; Daudu, C.; Zossou, R.; Crinot, G.; Houssou, P.; Moses, L.; Ndirpaya, Y.; et al. Impacts of Agricultural Mechanization: Evidence from Four African Countries; SRPN: Labor Market Issues (Topic); Elsevier: Amsterdam, The Netherlands, 2020. [Google Scholar] [CrossRef]
  60. Belton, B.; Win, M.; Zhang, X.; Filipski, M. The rapid rise of agricultural mechanization in Myanmar. Food Policy 2021, 101, 102095. [Google Scholar] [CrossRef]
  61. Shi, Y.; Zhao, H.; Yun, W.; Tang, H.; Xu, Y. Analysis on spatial differentiation of arable land multifunction and socio-economic coordination model in Beijing. Resour. Sci. 2015, 37, 247–257. [Google Scholar]
  62. Wang, C.; Peng, Q.; Tang, N.; Li, H. Spatio-temporal Evolution and the Synergy and Trade-off Relationship of Cultivated Land Multi-function in 2005–2015: A Case of Shapingba District, Chongqing City. Sci. Geogr. Sin. 2018, 38, 590–599. [Google Scholar] [CrossRef]
  63. Zhang, Y.; Long, H.; Ge, D.; Tu, S.; Qu, Y. Spatio-temporal characteristics and dynamic mechanism of farmland functions evolution in the Huang-Huai-Hai Plain. Acta Geogr. Sin. 2018, 73, 518–534. [Google Scholar] [CrossRef]
  64. Fei, R.; Lin, Z.; Chunga, J. How land transfer affects agricultural land use efficiency: Evidence from China’s agricultural sector. Land Use Policy 2021, 103, 105300. [Google Scholar] [CrossRef]
  65. IEA. CO2 Emissions in 2023; IEA: Paris, France, 2024; Available online: https://www.iea.org/reports/co2-emissions-in-2023 (accessed on 3 March 2025).
  66. Xie, G.; Zhang, C.; Zhen, L.; Zhang, L. Dynamic changes in the value of China’s ecosystem services. Ecosyst. Serv. 2017, 26, 146–154. [Google Scholar] [CrossRef]
  67. NY/T 1408.1-2007; Evaluation of Agricultural Mechanization Level—Part 1: Planting Industry. Ministry of Agriculture of the People’s Republic of China: Beijing, China; China Standards Press: Beijing, China, 2007.
  68. Wang, S.-J.; Kong, W.; Ren, L.; Zhi, D.-D.; Dai, B.-T. Research on misuses and modification of coupling coordination degree model in China. J. Nat. Resour. 2021, 36, 793–810. [Google Scholar] [CrossRef]
  69. Getis, A.; Ord, J.K. The Analysis of Spatial Association by Use of Distance Statistics. Geogr. Anal. 1992, 24, 189–206. [Google Scholar] [CrossRef]
  70. Getis, A.; Griffith, D.A. Spatial Autocorrelation: A Primer. Resour. Publ. Geogr. Assoc. Am. Geogr. 1988, 64, 88. [Google Scholar] [CrossRef]
  71. Mitchell, A. The ESRI Guide to GIS Analysis; ESRI Press: Redlands, CA, USA, 2005; Volume 2. [Google Scholar]
  72. Goodchild, M.F. Spatial Autocorrelation; Catmog 47; Geo Books: Washington, DC, USA, 1986. [Google Scholar]
  73. Borgatti, S.P.; Everett, M.G.; Freeman, L.C. Ucinet for Windows: Software for Social Network Analysis; Analytic Technologies: Harvard, MA, USA, 2007. [Google Scholar]
  74. Liu, J. QAP: A Unique Method of Measuring “Relationships” in Relational Data. Chin. J. Sociol. 2007, 27, 164–174. (In Chinese) [Google Scholar]
  75. Bian, Y.C.; Wu, L.H.; Bai, J.H. Does High-speed Rail Improve Regional Innovation in China? J. Financ. Res. 2019, 468, 132–149. [Google Scholar]
  76. Lu, Y.; Zhang, K.; Ou, Y. Does Land Finance Hinder Regional Innovation? Based on the Data of 267 Prefectural-Level City in China. J. Financ. Res. 2018, 455, 101–119. [Google Scholar]
  77. Ministry of Agriculture. Bulletin on the Quality Grades of Cultivated Land Nationwide. Ministry of Agriculture and Rural Affairs Website. 2017. Available online: http://www.moa.gov.cn/nybgb/2015/yi/201711/t20171129_5922750.htm (accessed on 3 March 2025).
  78. Zhang, D.; Wang, R.; Zhang, J. A Dataset of 1 km Grid Cultivated Land Fragmentation in China (2020). China Sci. Data 2024, 9, 1–10. [Google Scholar] [CrossRef]
  79. Yuan, J.-T.; Chen, W.-X.; Zeng, J. Spatio-temporal differentiation of cropland use change and its impact on cropland NPP in China. J. Nat. Resour. 2023, 38, 3135–3149. [Google Scholar] [CrossRef]
  80. Gong, H.; Zhao, Z.; Chang, L.; Li, G.; Li, Y.; Li, Y. Spatiotemporal Patterns in and Key Influences on Cultivated-Land Multi-Functionality in Northeast China’s Black-Soil Region. Land 2022, 11, 1101. [Google Scholar] [CrossRef]
  81. Ren, S.; Song, C.; Ye, S.; Cheng, F.; Akhmadov, V.; Kuzyakov, Y. Land use evaluation considering soil properties and agricultural infrastructure in black soil region. Land Degrad. Dev. 2023, 34, 5373–5388. [Google Scholar] [CrossRef]
  82. Zhang, S.; Hu, W.; Li, M.; Guo, Z.; Wang, L.; Wu, L. Multiscale research on spatial supply-demand mismatches and synergic strategies of multifunctional cultivated land. J. Environ. Manag. 2021, 299, 113605. [Google Scholar] [CrossRef] [PubMed]
  83. Wang, S.; Sun, Y.; Yang, C. Comparative Static Analysis on the Agricultural Mechanization Development Levels in China’s Provincial Areas. Processes 2022, 10, 1332. [Google Scholar] [CrossRef]
  84. Li, X.; Guan, R. How does agricultural mechanization service affect agricultural green transformation in China? Int. J. Environ. Res. Public Health 2023, 20, 1655. [Google Scholar] [CrossRef]
  85. Ichniarsyah, A.N.; Erniati. The role of mechanization in agricultural development on border areas. IOP Conf. Ser. Earth Environ. Sci. 2020, 542, 012062. [Google Scholar] [CrossRef]
Figure 1. Research area overview. The administrative boundaries of China are based on the standard map with map approval number GS(2020)4632, downloaded from the Ministry of Natural Resources of the People’s Republic of China standard map service website, with no modifications to the base map (hereinafter the same). The world base map is sourced from Esri, TomTom, Garmin, FAO, NOAA, and USGS.
Land 14 00999 g001
Figure 2. Coupled coordination mechanism of multifunctional land use and development of agricultural mechanization.
Land 14 00999 g002
Figure 3. Trend of changes in levels of cultivated land multifunction and agricultural mechanization in China from 2011 to 2021.
Land 14 00999 g003
Figure 4. Spatial pattern of levels of cultivated land multifunction and agricultural mechanization in China from 2011 to 2021.
Land 14 00999 g004
Figure 5. Proportional relationship between cultivated land multifunction and type of coordination of agricultural mechanization, China, 2011–2021.
Land 14 00999 g005
Figure 6. Spatial pattern of coordination degrees between cultivated land multifunction and agricultural mechanization in China from 2011 to 2021.
Land 14 00999 g006
Figure 7. Local Moran scatter plot of coordination degree between cultivated land multifunction and agricultural mechanization in China from 2011 to 2021.The Local Moran's I scatter plot depicts the spatial distribution of standardized observed values (x-axis) and their spatial lags (y-axis), divided into four quadrants by intersecting dashed lines (passing through the origin): (1) HH quadrant indicates high local values surrounded by high regional values; (2) LH quadrant represents low local values amid high-value neighboring regions; (3) LL quadrant shows low local values surrounded by low regional values; (4) HL quadrant depicts high local values surrounded by low-value regions. The red diagonal line represents the regression line's slope, revealing the linear relationship between observed and spatial lagged values.
Land 14 00999 g007
Figure 8. LISA cluster map of coordination degree between cultivated land multifunction and agricultural mechanization in China from 2011 to 2021.
Land 14 00999 g008
Table 1. Evaluation index system of coupling and coordination between cultivated land multifunction and agricultural mechanization in China. The plus sign (“+”) represents a positive correlation or synergistic effect between variables. The minus sign (“−”) represents an inverse relationship between variables.
System LevelCriteria LayerWeightIndicator Layer (Units)WeightImpactIndicator Calculation and Data Sources
Level of multi-functional utilisation of arable landProduction functions0.25Yield of grain sown/(tonnes/ha)0.15+Grain sown area/grain production, China Rural Statistics Yearbook
Grain output per hectare of arable land/(tonnes/ha)0.31+Total grain output/cultivated land area, Agricultural Statistics Yearbook, China Rural Statistics Yearbook
Land resettlement rate/per cent0.34+Arable land/total land area, China Rural Statistics Yearbook
Recultivation index0.21+Sown area/cultivated land, China Rural Statistics Yearbook
Social security functions0.18Number of people employed in villages/(10,000 people)0.33+China Rural Statistical Yearbook
Per capita net income of farmers/(yuan)0.18+China Rural Statistical Yearbook
Per capita operating area of arable land/(ha)0.34+Arable land/agricultural population, China Rural Statistical Yearbook
Urban–rural income ratio0.14Per capita disposable income of urban residents/per capita net income of farmers, Statistical Yearbook and Urban Statistical Yearbook
Ecological function0.57Carbon emission/(tonnes)0.20Fertiliser use × 0.89 + Plastic film use × 5.18 + Agricultural diesel use × 0.59 + Pesticide use × 4.93 + Crop sown area × 312.6 + Irrigated area × 266.48 [36], China Rural Statistical Yearbook, China Environmental Statistical Yearbook
Ecological service value of arable land0.80+Ecosystem service value assessment method, using CLCD [37] as the base map to calculate the total ecological service value of arable land in each region
Level of agricultural mechanisationWater for integrated mechanisation of cultivation, planting and harvesting0.18Degree of mechanisation of ploughing/(%)0.4+Machine ploughing area/cultivable land, China Rural Statistical Yearbook, China Agricultural Machinery Statistical Yearbook
Mechanisation of sowing/(%)0.3+Machine sown area/total sown area of crops, China Rural Statistics Yearbook, China Agricultural Machinery Statistics Yearbook
Degree of harvesting mechanisation/%0.3+Machine harvested area/total harvested area, China Rural Statistics Yearbook, China Agricultural Machinery Statistics Yearbook
Comprehensive agricultural mechanisation capacity0.53Agricultural diesel use per agricultural labourer/(t/person)0.3+Agricultural diesel usage/number of agricultural labour force, China Rural Statistical Yearbook, China Agricultural Machinery Statistical Yearbook
Agricultural machinery power per unit sown area/(kW/ha)0.3+Total power of agricultural machinery/total sown area of crops, China Rural Statistical Yearbook, China Agricultural Machinery Statistical Yearbook
Proportion of professionally trained farm machinery personnel/%0.4+Professionally trained rural agricultural machinery personnel/total rural agricultural machinery personnel, China Agricultural Machinery Statistical Yearbook
Comprehensive benefits of agricultural mechanisation0.29Agricultural labour productivity/(yuan/person)0.4+Total output value of agriculture, forestry, animal husbandry, and fishery/number of agricultural labourers; China Statistical Yearbook; China Rural Statistical Yearbook
Average sown area of agricultural labour/(ha/person)0.3+Total sown area of crops/number of agricultural labour force, China Rural Statistics Yearbook
Proportion of agricultural labourers in the total number of employed persons in society/%0.3+Number of agricultural labour force/number of employees in the whole society, China Statistical Yearbook, China Rural Statistical Yearbook
Table 2. Coordination degree between cultivated land multifunction and agricultural mechanization in China from 2011 to 2021.
Year20112012201320142015201620172018201920202021
National0.5220.5290.5360.5430.5480.5480.5540.5610.5720.5860.599
Eastern0.5600.5680.5780.5820.5860.5860.5940.6020.6150.6260.638
Central0.5340.5430.5440.5540.5620.5660.5710.5790.5870.6030.620
Western0.4750.4800.4860.4950.4980.4970.5020.5070.5180.5350.545
Table 3. Global Moran’s I for coordination degree between cultivated land multifunction and agricultural mechanization in China from 2011 to 2021.
Year20112012201320142015201620172018201920202021
Moran’s I0.4156030.4276970.4430860.4094100.3891660.4044940.4225780.4595960.4530150.4291860.392223
Z-value3.8325233.9400164.0626393.7817523.6028353.7409863.8975674.2083934.1551603.9436173.626975
p-value0.0001270.0000810.0000490.0001560.0003150.0001830.0000970.0000260.0000330.0000800.000287
Table 4. Regression results of internal driving factors for the formation of coordination degree differences in China and the three major regions. Randomly permuted 5000 times, the same hereinafter.
NationalA (***)B (***)C (***)D (***)E (*)F
Standardised correlation coefficient0.3400.2850.2470.3160.1320.060
p-value0.0000.0000.0010.0000.0320.136
EastA (*)B (*)C (*)D (***)EF (*)
standardised correlation coefficient0.3700.3590.4110.5690.0550.319
p-value0.0140.0120.0140.0010.3330.034
CentralA (*)B (**)CDEF
standardised correlation coefficient0.7240.8780.3530.193−0.082−0.08
p-value0.0120.0020.1210.1960.420.367
WestABC (***)DEF
standardised correlation coefficient0.2130.3660.7260.122−0.2270.263
p-value0.1920.0770.0010.2240.0560.129
* (p < 0.05): Significant at 5% level. ** (p < 0.01): Highly significant at 1% level. *** (p < 0.001): Extremely significant at 0.1% level.
Table 5. Potential external driving factors affecting coupling coordination degree.
Potential FactorsCharacterisation IndicatorsAbbreviationsIndicator Calculation and Data Sources
Natural environmental factorsArable land qualityFQ i = 1 10 α i × ( 11 i ) , i is arable land quality grade; α i is the proportion of arable land in each quality grade, estimated from the national bulletin on arable land quality grades issued [67]
Arable land areaFAChina Statistical Yearbook
Land flatnessLFAverage slope of arable land in each province of China based on DEM calculation [75,76,77]
Fragmentation of arable landFFExtracted from the 2020 China 1 km grid cropland fragmentation dataset [78]
Average annual precipitationAAPChina Climate Bulletin
Economic development factorsGross regional productGDPChina Statistical Yearbook
Per capita net income of farmersPCIChina Rural Statistics Yearbook
Social factorsNumber of people employed in primary industryEPIChina Statistical Yearbook
Urbanisation levelULUrban resident population/resident population, China Statistical Yearbook
Informatisation conditionsSoftware business incomeDFChina Statistical Yearbook, NBS and provincial statistical yearbooks
Agricultural basic conditionsAgricultural loansALRural Financial Services Report of China, all years
Transport network densityTND(railway mileage + road mileage)/area of administrative division, National Bureau of Statistics
Number of farmers’ specialised co-operative societies per 10,000 people in rural areasCCChina Rural Statistical Yearbook
Average years of education of rural residentsAYChina Rural Statistical Yearbook
Table 6. Regression results of external driving factors for the formation of coordination degree differences across China.
MarkFQ (*)FA (***)LF (*)FFAAPGDPPCI
Standardised correlation coefficient0.3490.4370.2820.038−0.0330.1710.058
p-value0.0200.0000.0200.2660.3240.0690.240
MarkEPIULDFALTNDCC (*)AY
standardised correlation coefficient−0.05−0.0670.0280.1870.0980.1810.019
p-value0.2500.2670.3310.0630.1050.0400.323
* (p < 0.05): Significant at 5% level. *** (p < 0.001): Extremely significant at 0.1% level.
Disclaimer/Publisher’s Note: The statements, opinions and data contained in all publications are solely those of the individual author(s) and contributor(s) and not of MDPI and/or the editor(s). MDPI and/or the editor(s) disclaim responsibility for any injury to people or property resulting from any ideas, methods, instructions or products referred to in the content.

