
Assessment of the Spatiotemporal Evolution Characteristics and Driving Factors of Ecological Vulnerability in the Hubei Section of the Yangtze River Economic Belt

 ,
,  and
and
Abstract

1. Introduction
2. Materials and Methods
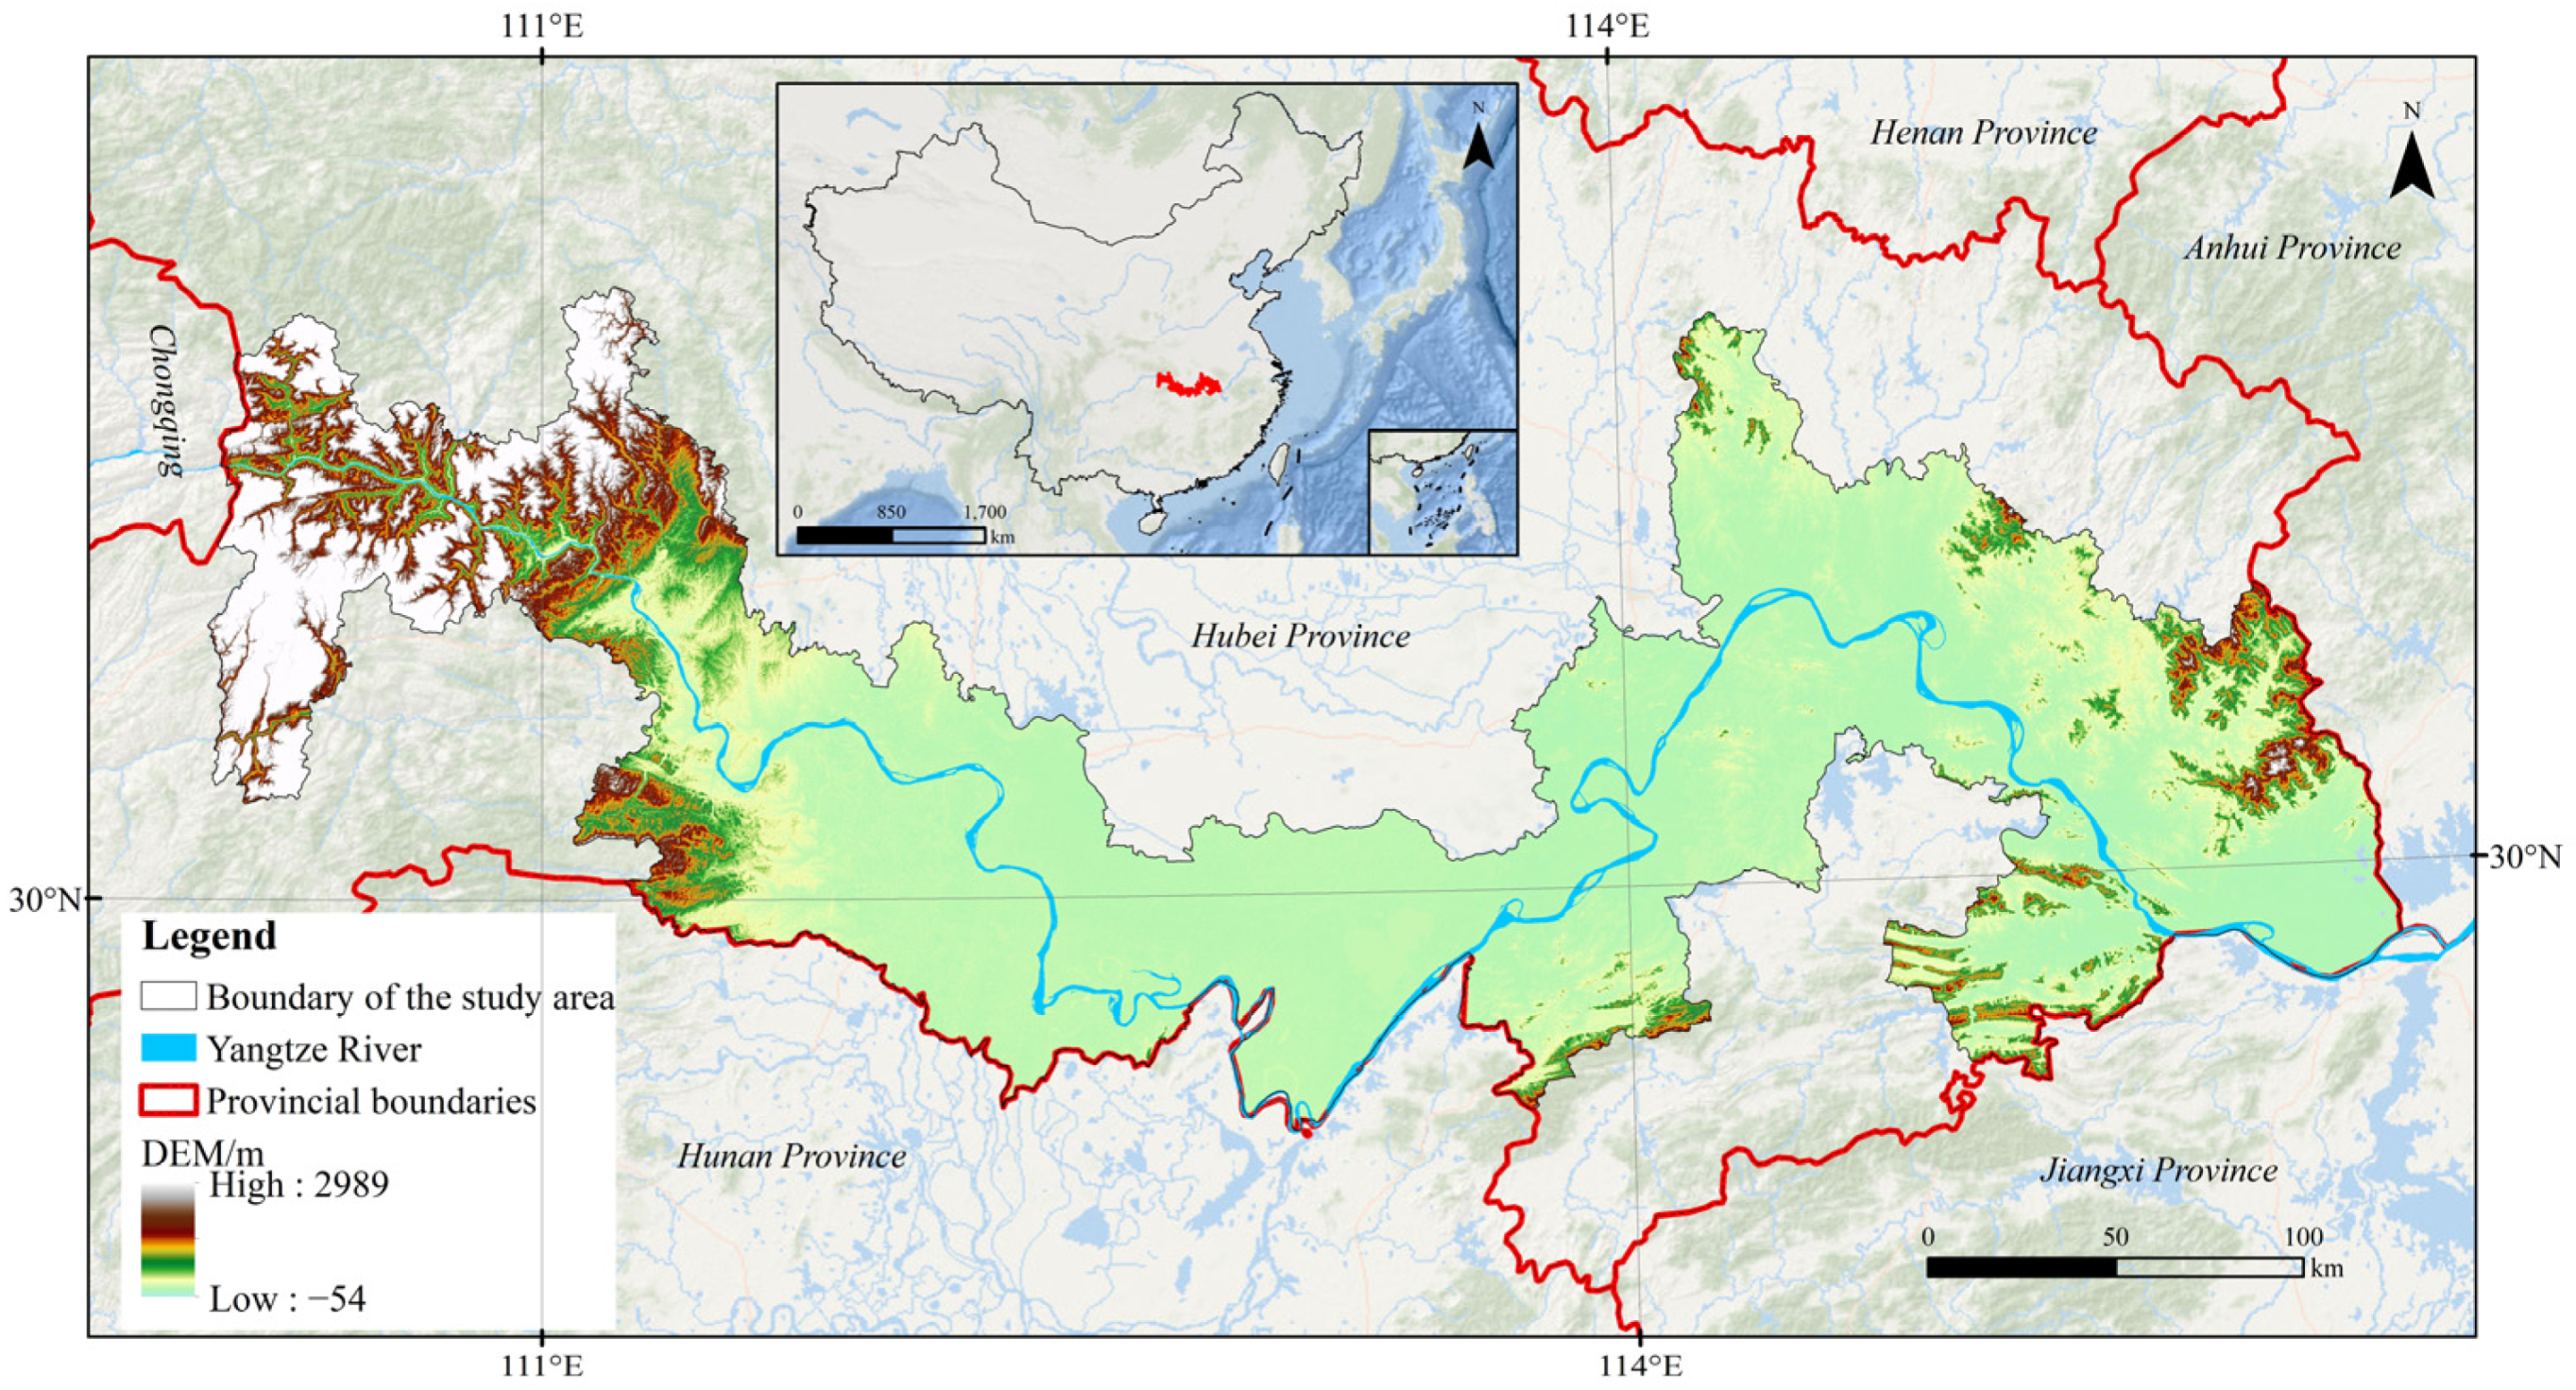
2.1. Overview of the Study Area
2.2. Data Sources and Processing
2.3. Research Methodology
2.3.1. Evaluation Indicators
2.3.2. G1 Method
- 1.
- Determine the indicator order relationship and the importance of the indicator relative to the evaluation criteria as x1 > x2 > … > xm.
- 2.
- Rational judgment based on expert experience in determining the ratio of relative importance levels between neighboring indicators rk.
- 3.
- Calculate the weighting factor wk.
2.3.3. CRITIC Method
- 1.
- For data standardization, see Equations (1) and (2).
- 2.
- The standard deviation of each indicator and the correlation coefficient between indicators of the standard matrix X are as follows:
- 3.
- Indicator informativeness:
- 4.
- Calculate objective weights for indicators:
2.3.4. Game Theory Combination Weighting
2.3.5. Ecological Vulnerability Evaluation Model
2.3.6. Theil Index
2.3.7. Getis–Ord Gi*
2.3.8. Ridge Regression Model
3. Results
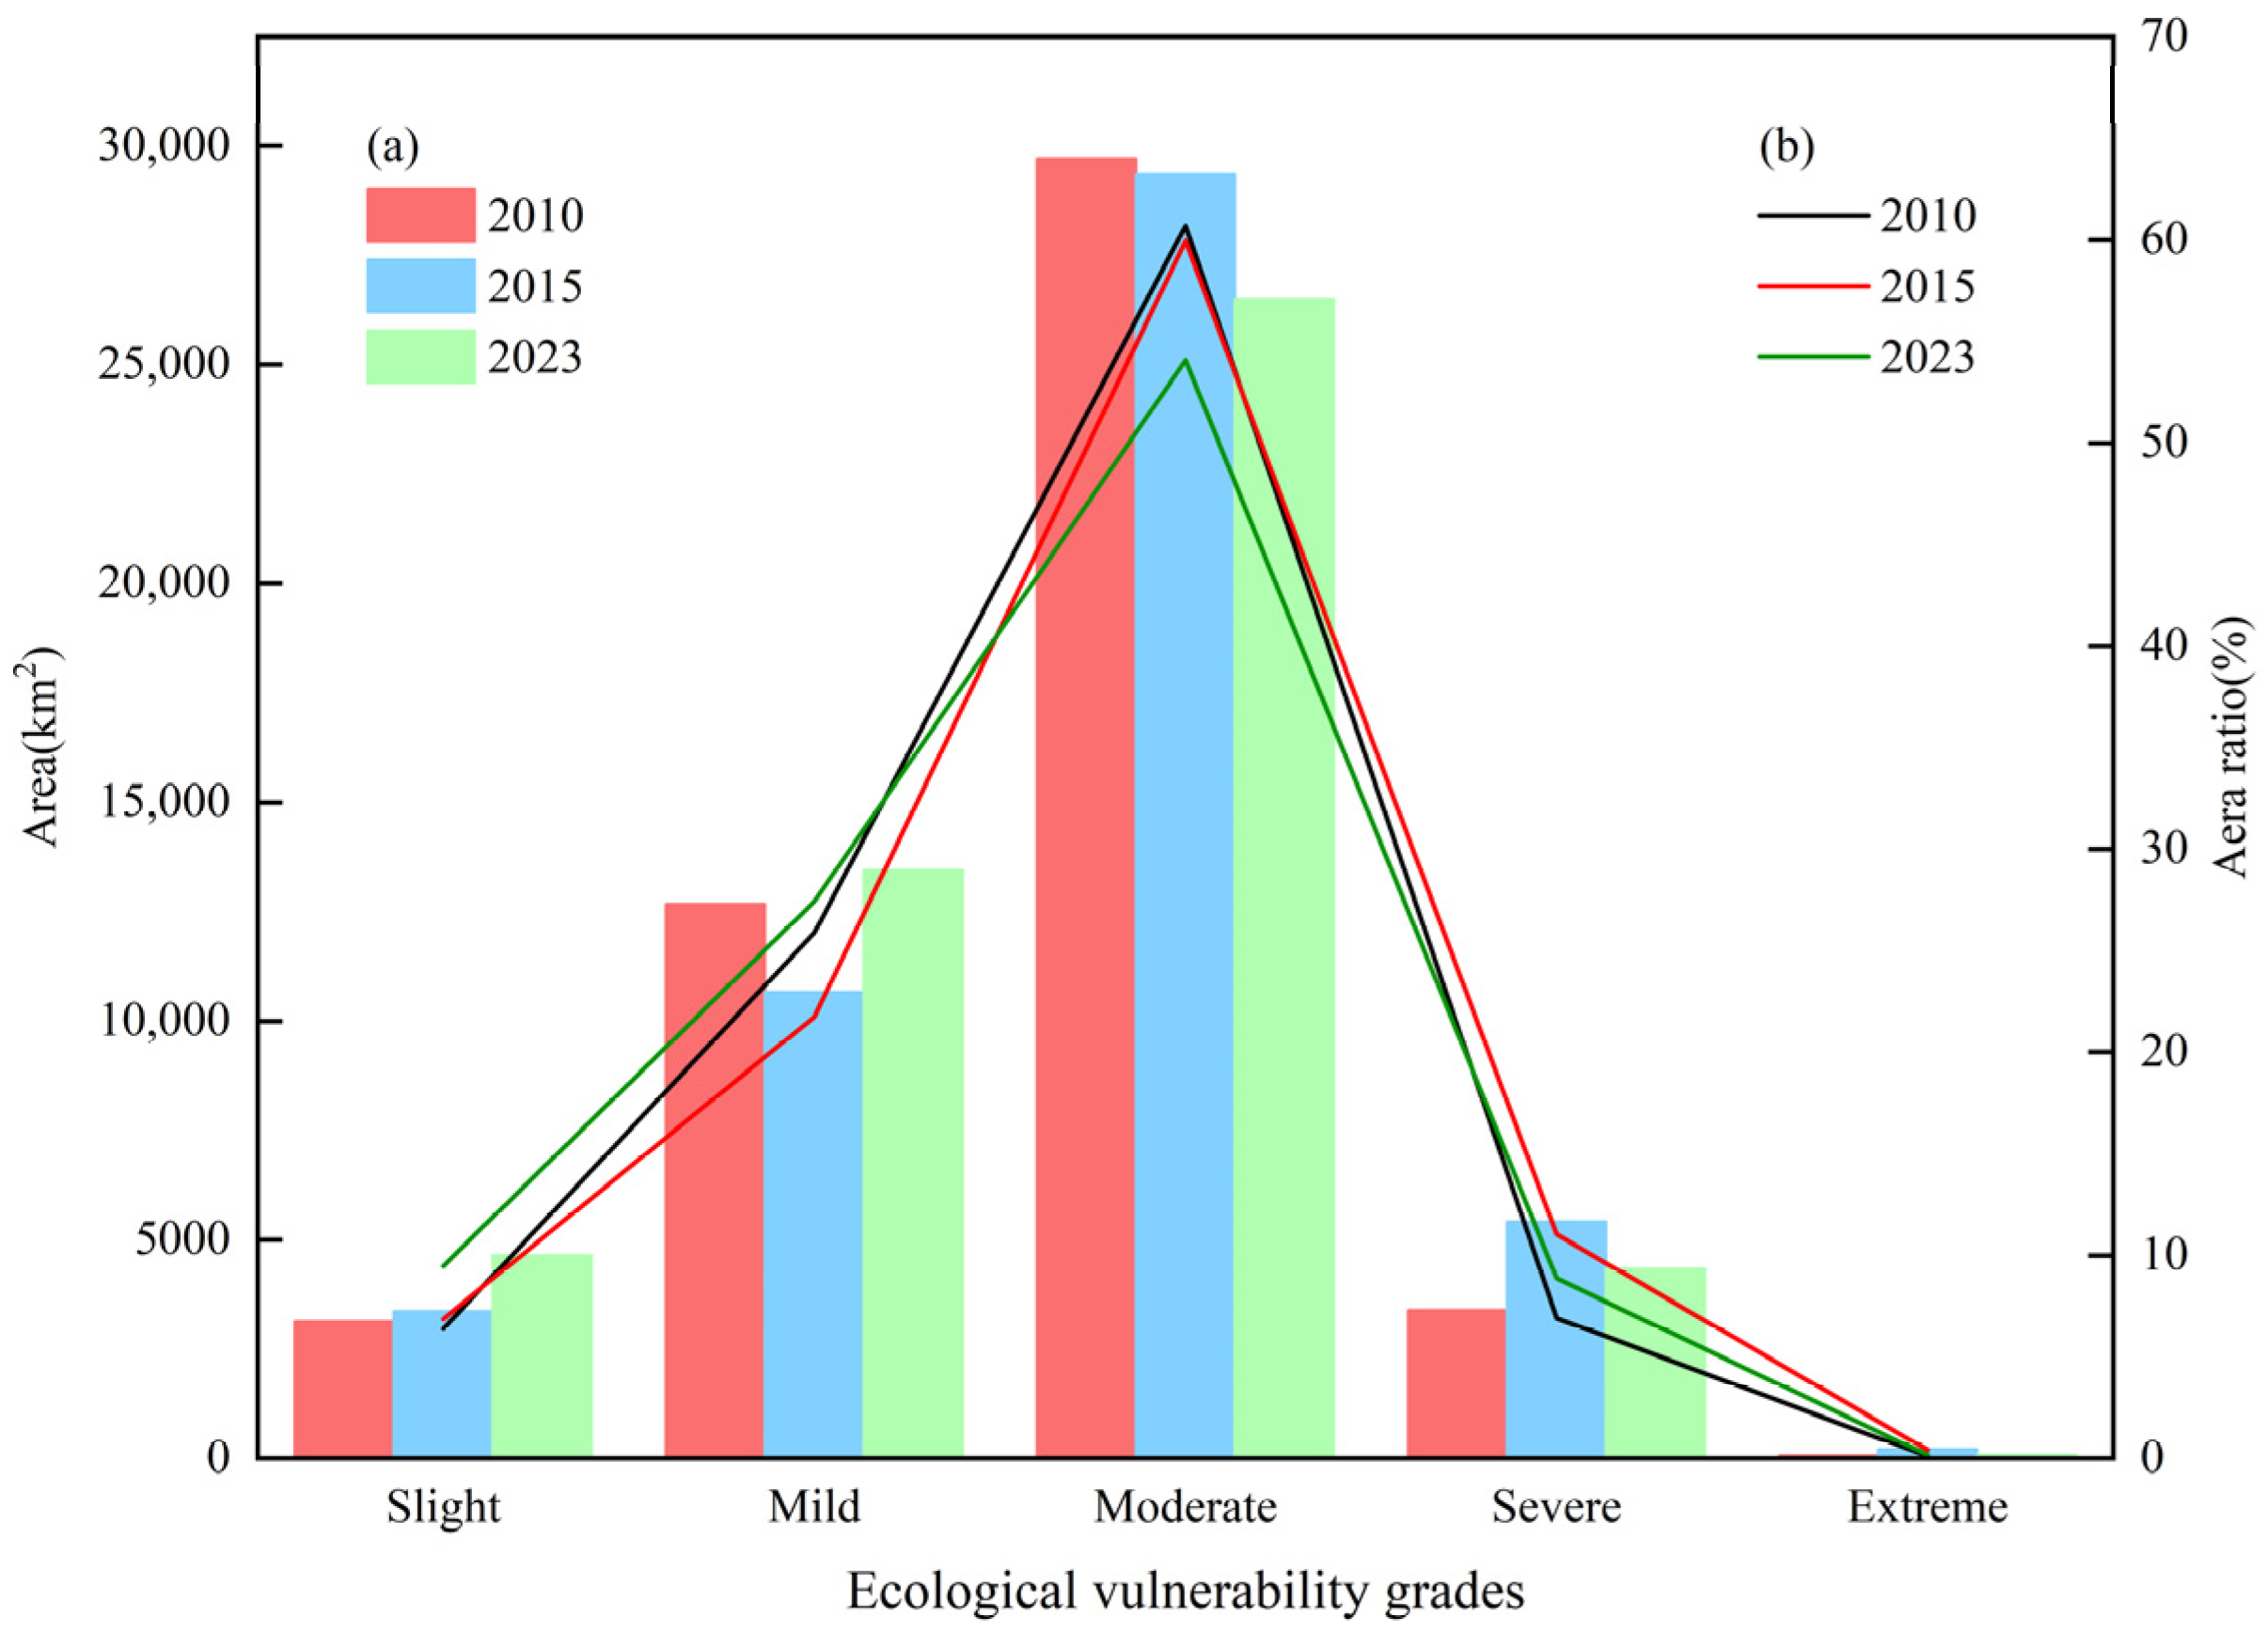
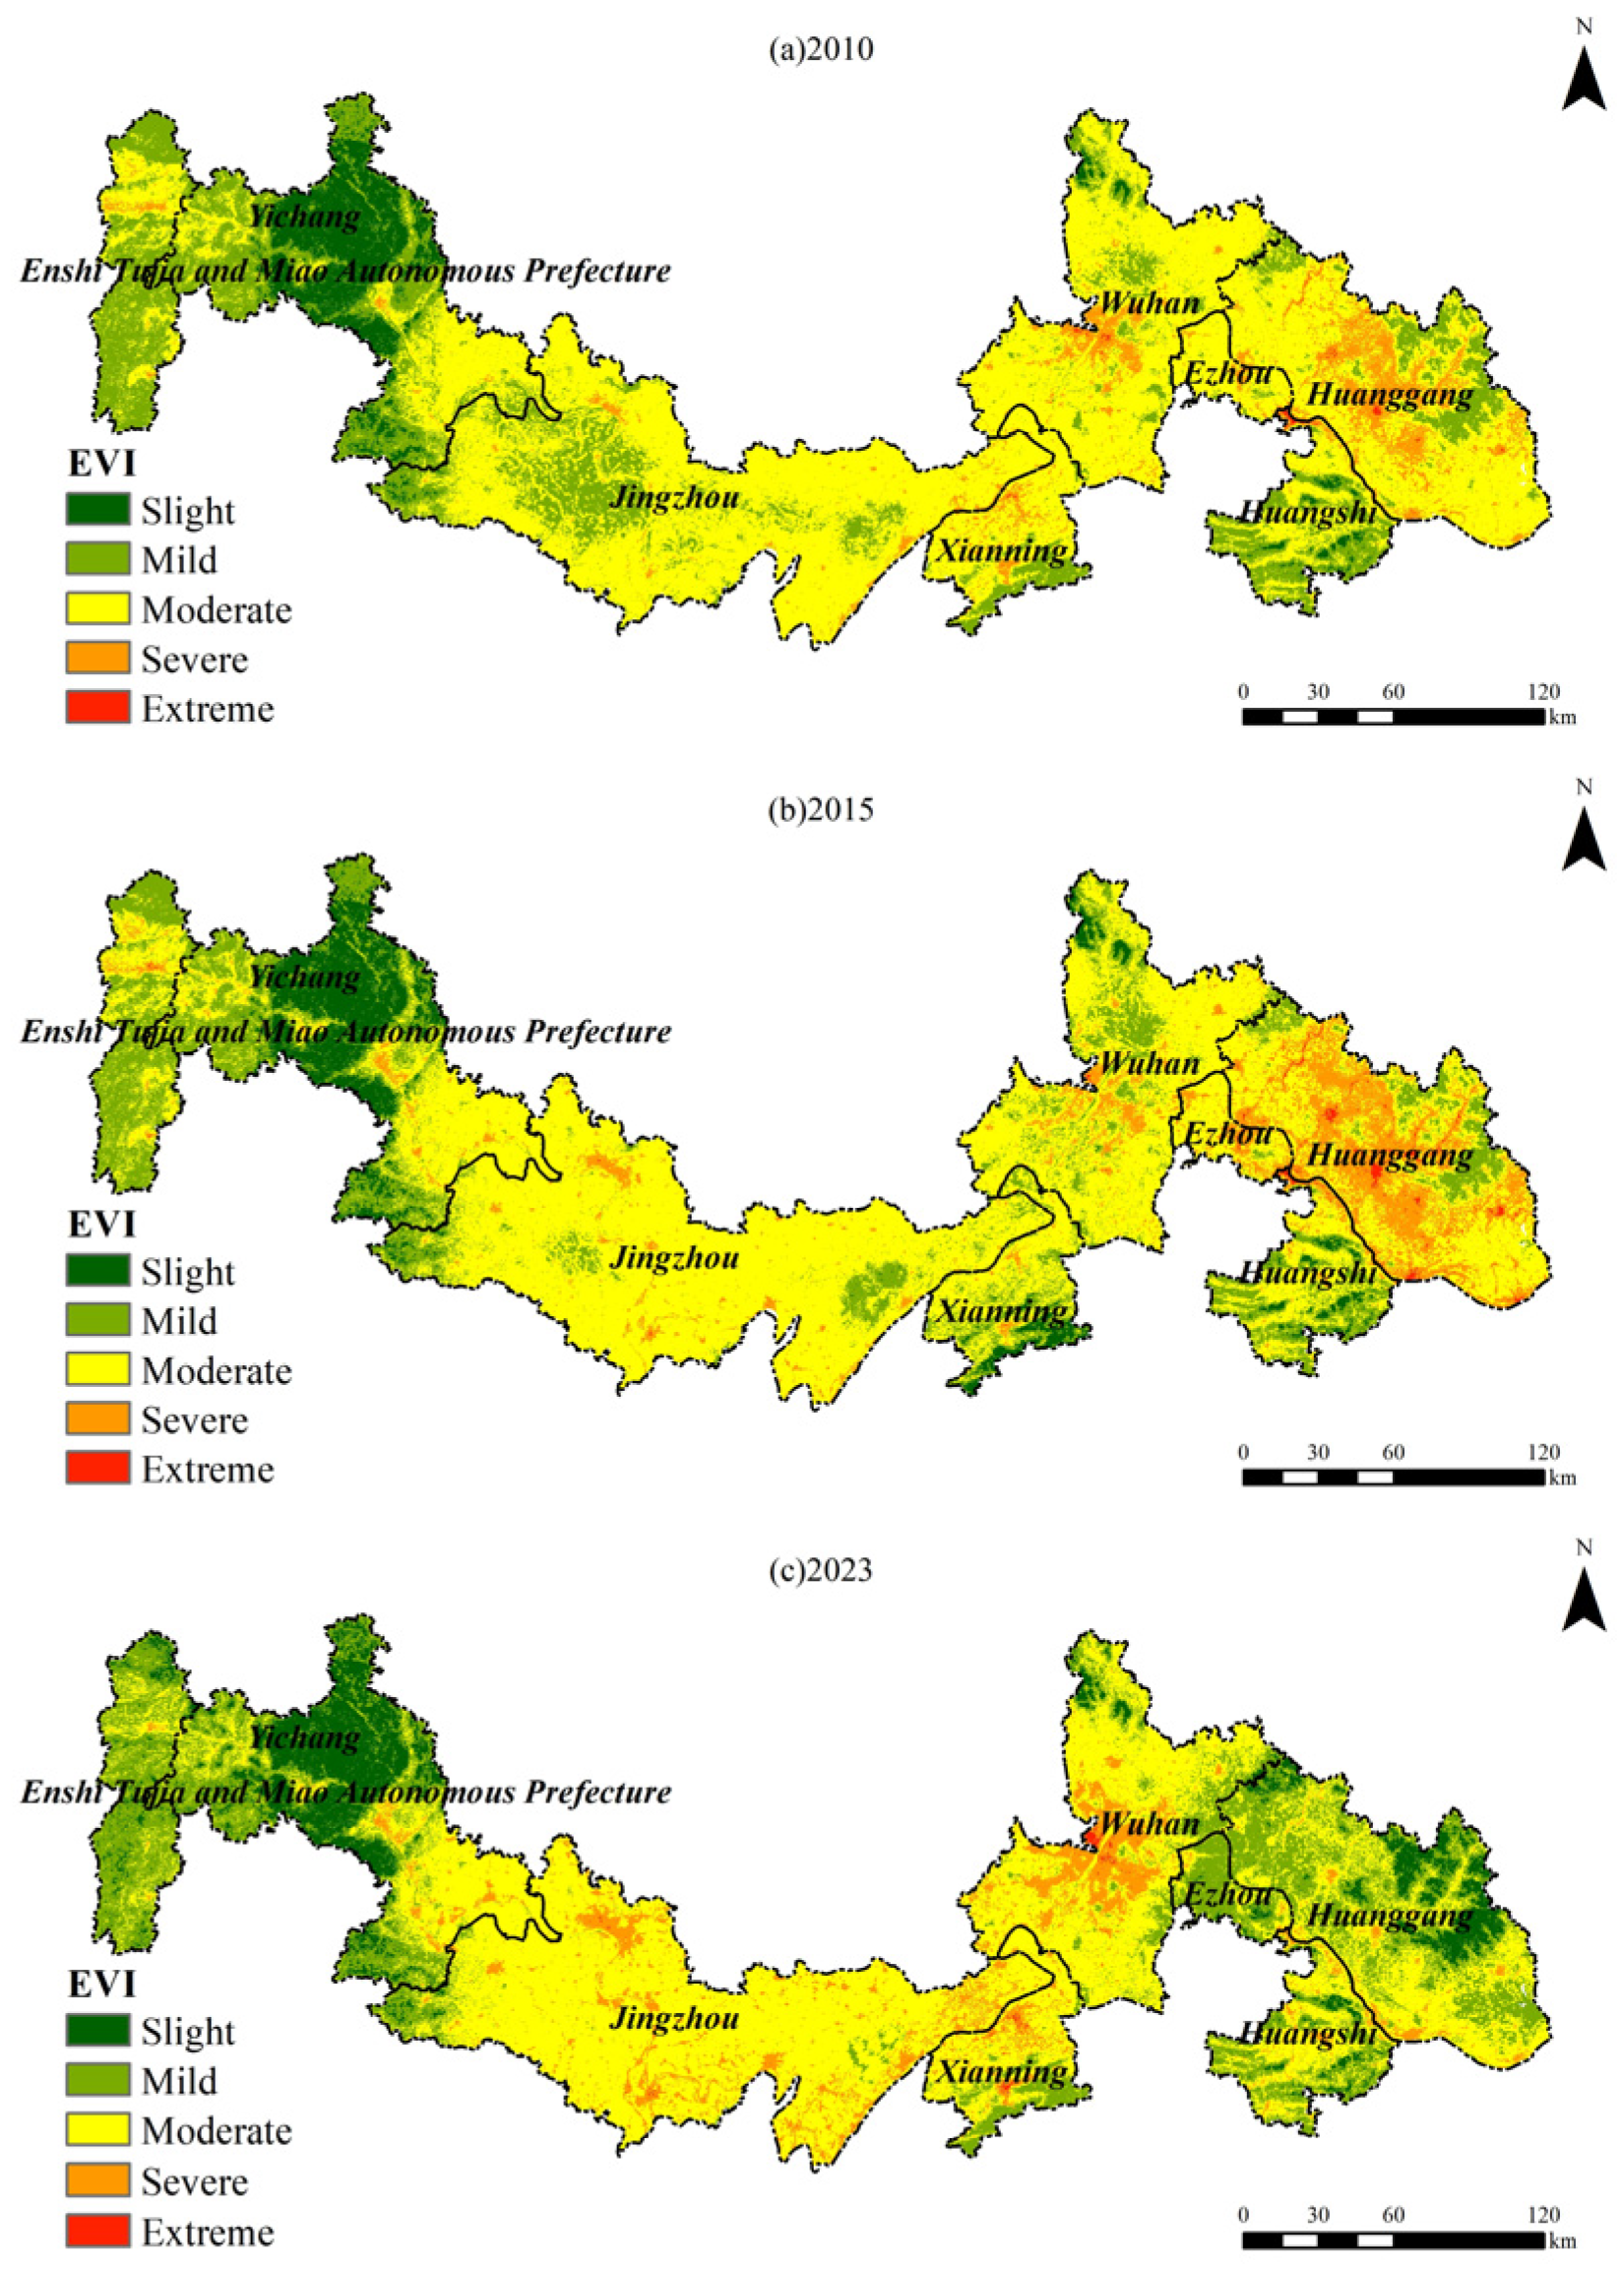
3.1. Ecological Vulnerability Spatiotemporal Evolution Characteristics
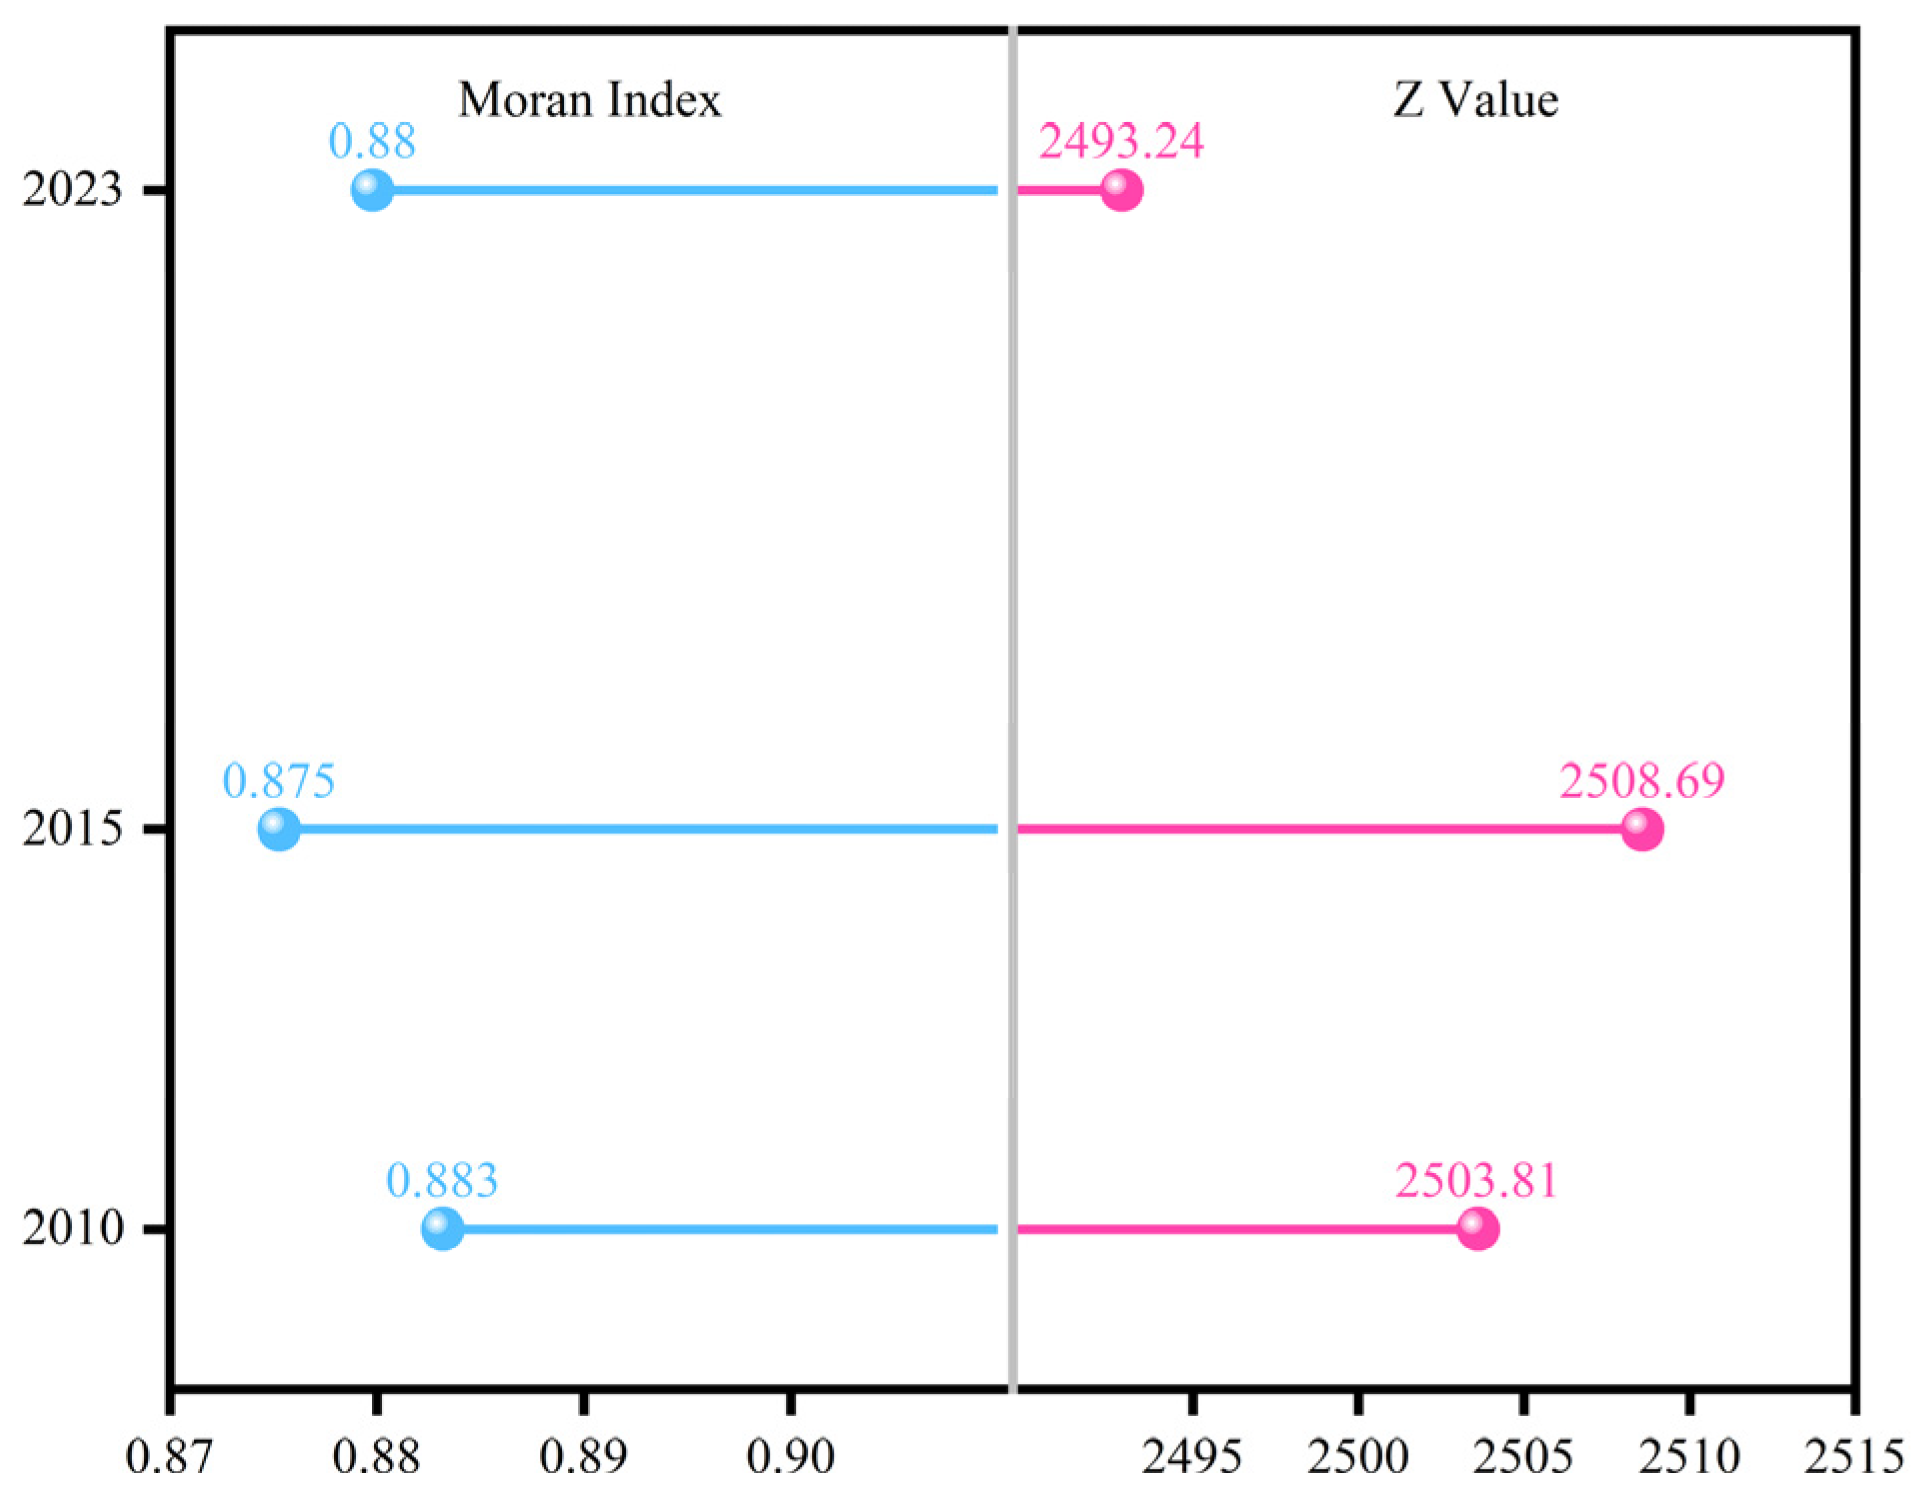
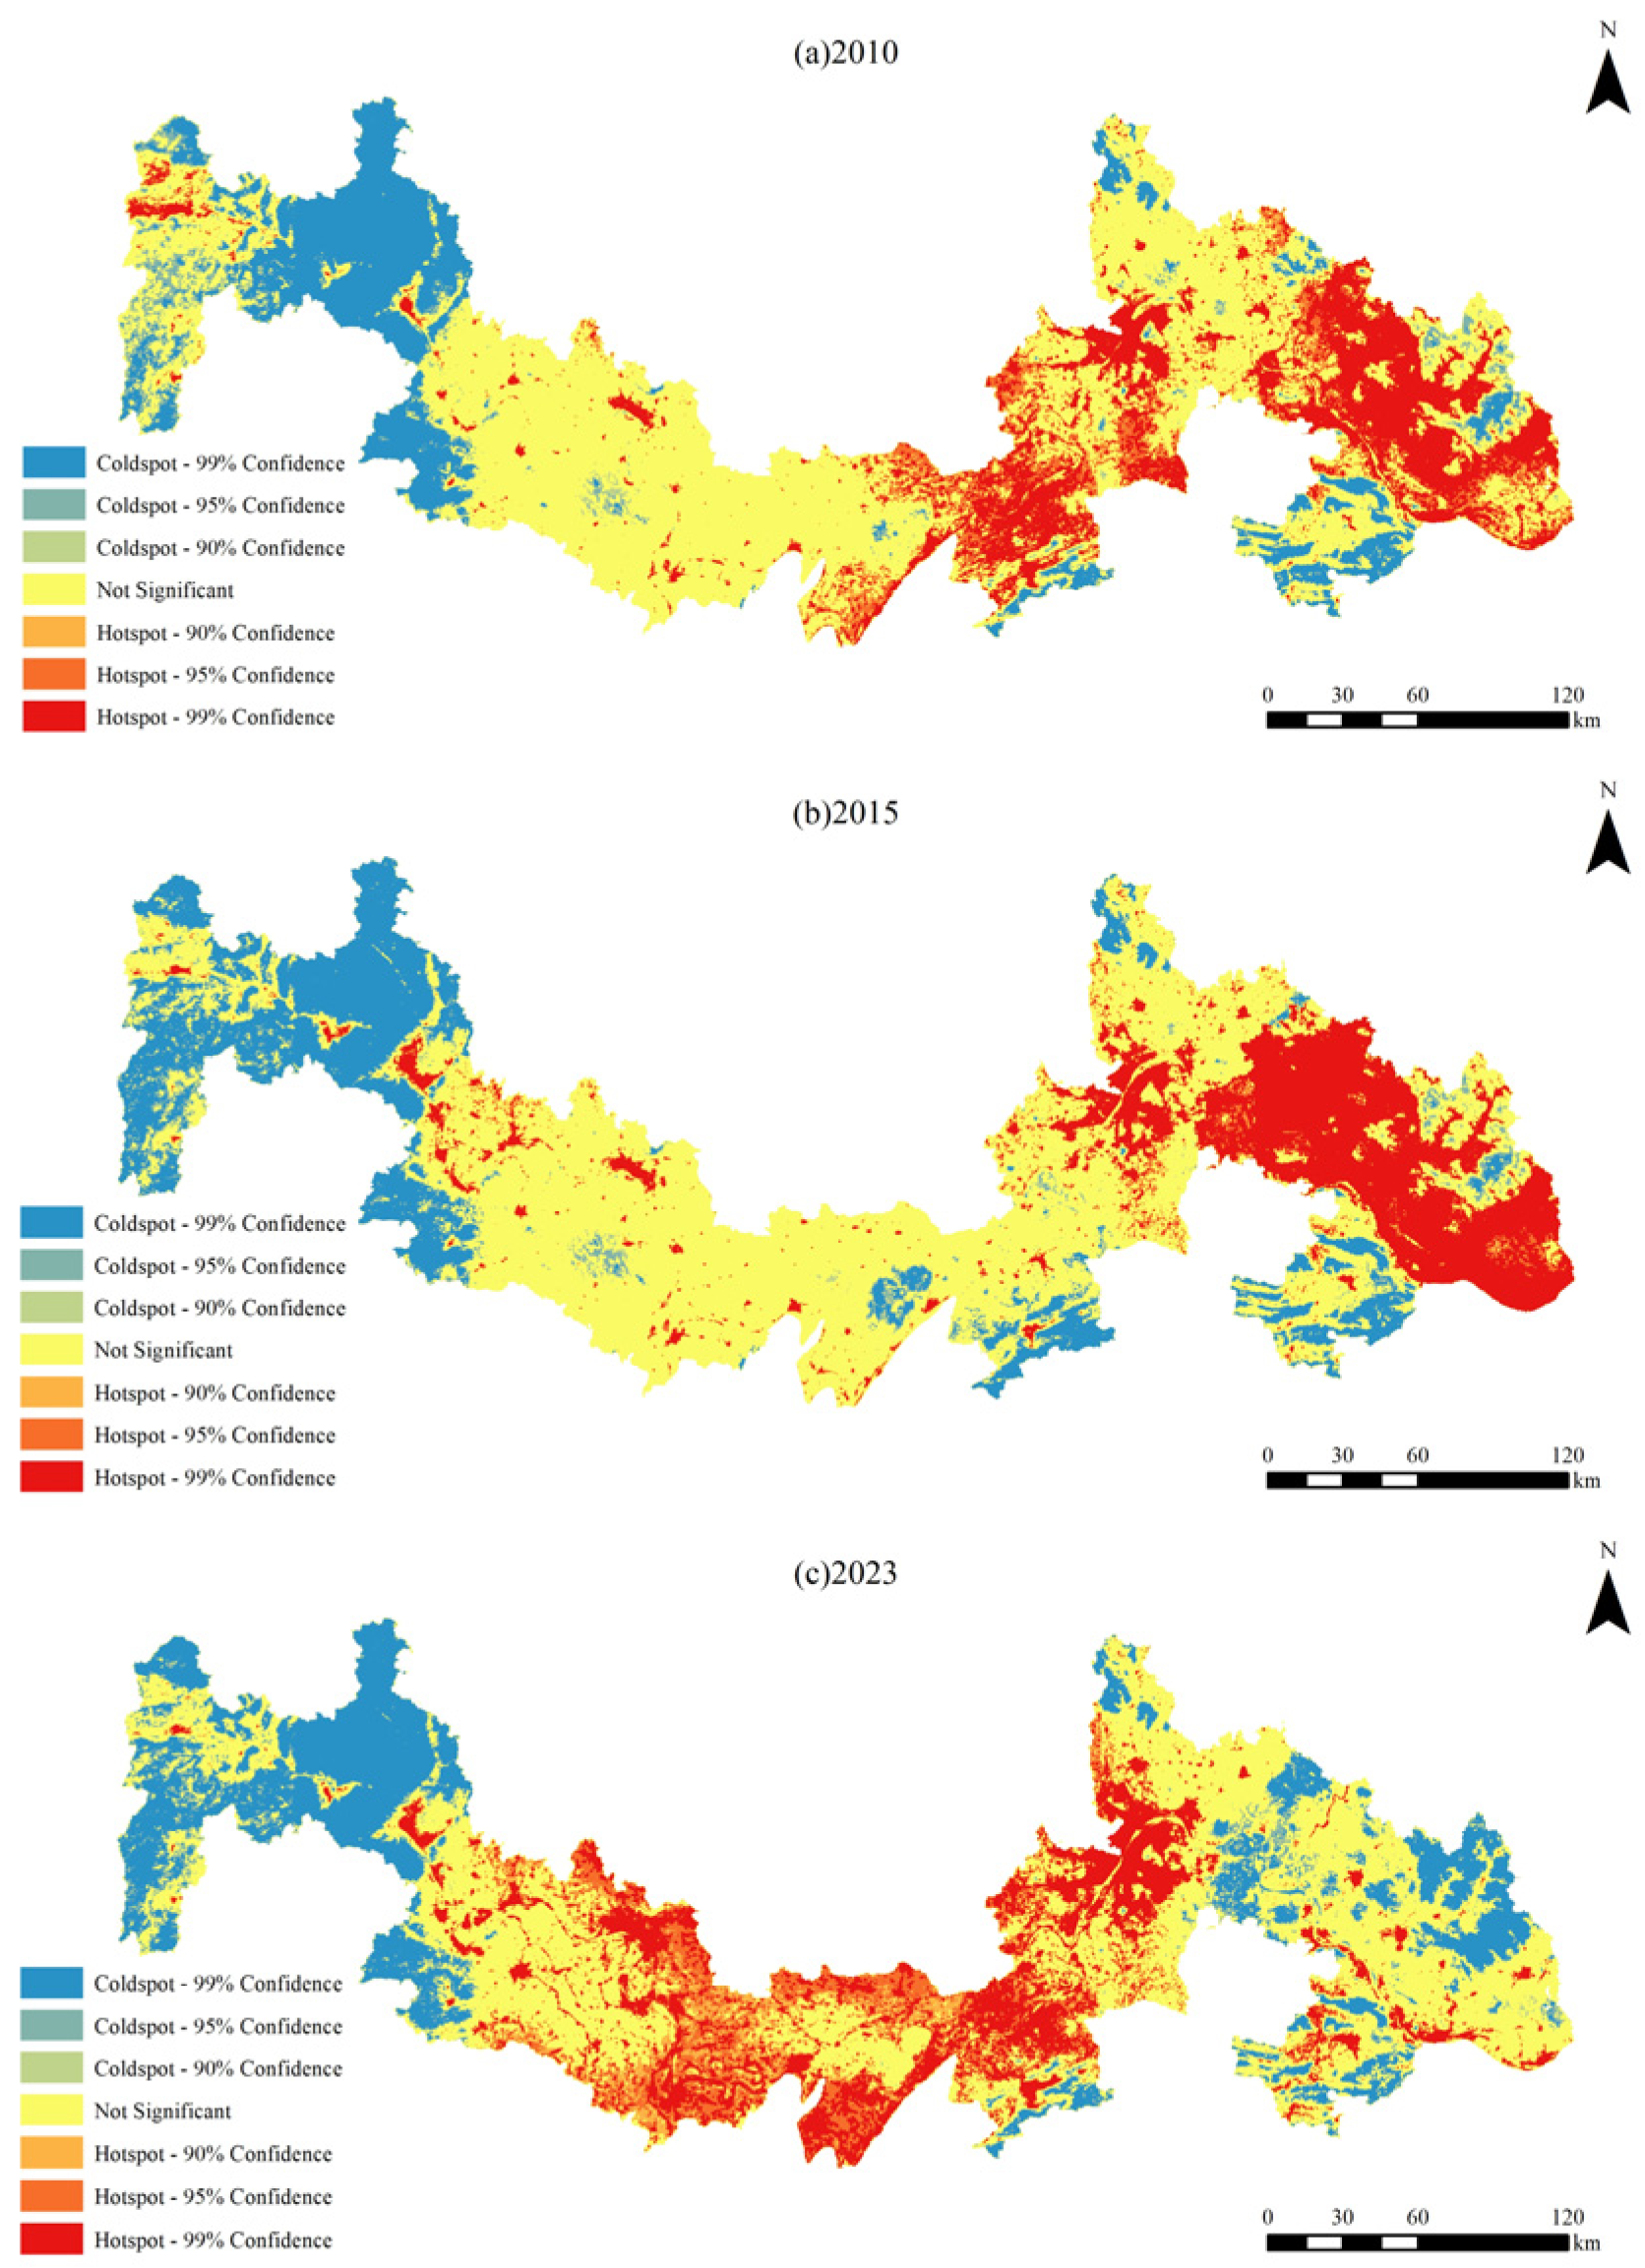
3.2. Spatial Clustering Patterns of Ecological Vulnerability
3.3. Trends in Ecological Vulnerability
3.3.1. Trends in Overall Vulnerability
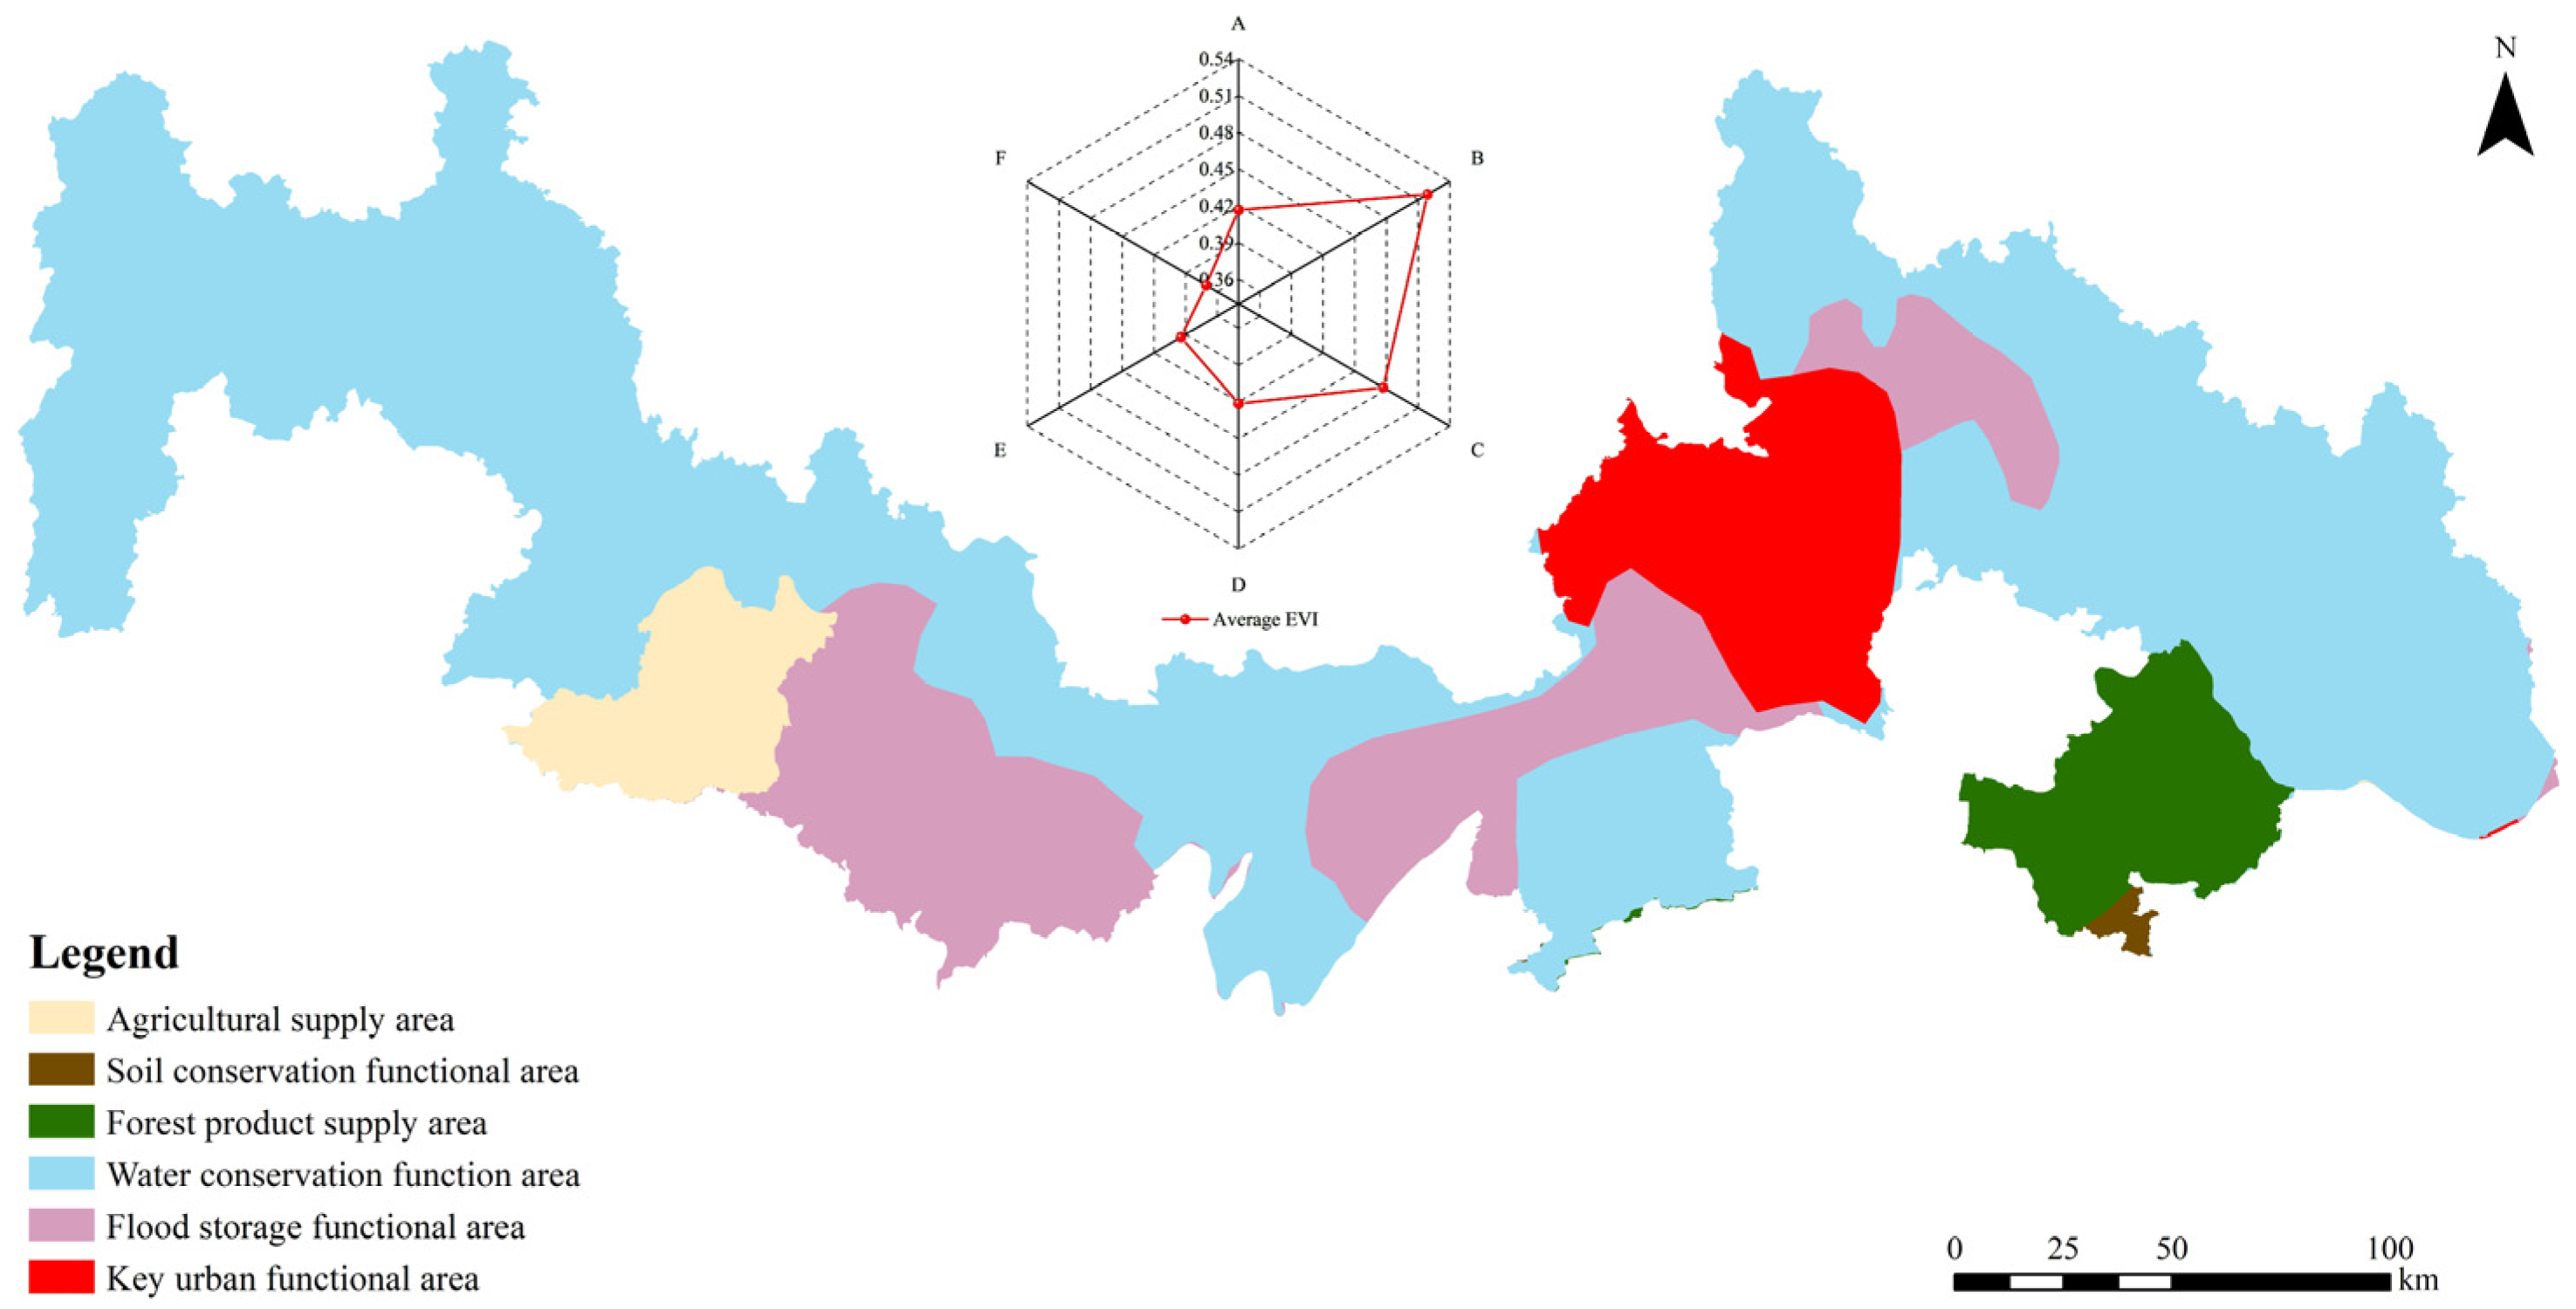
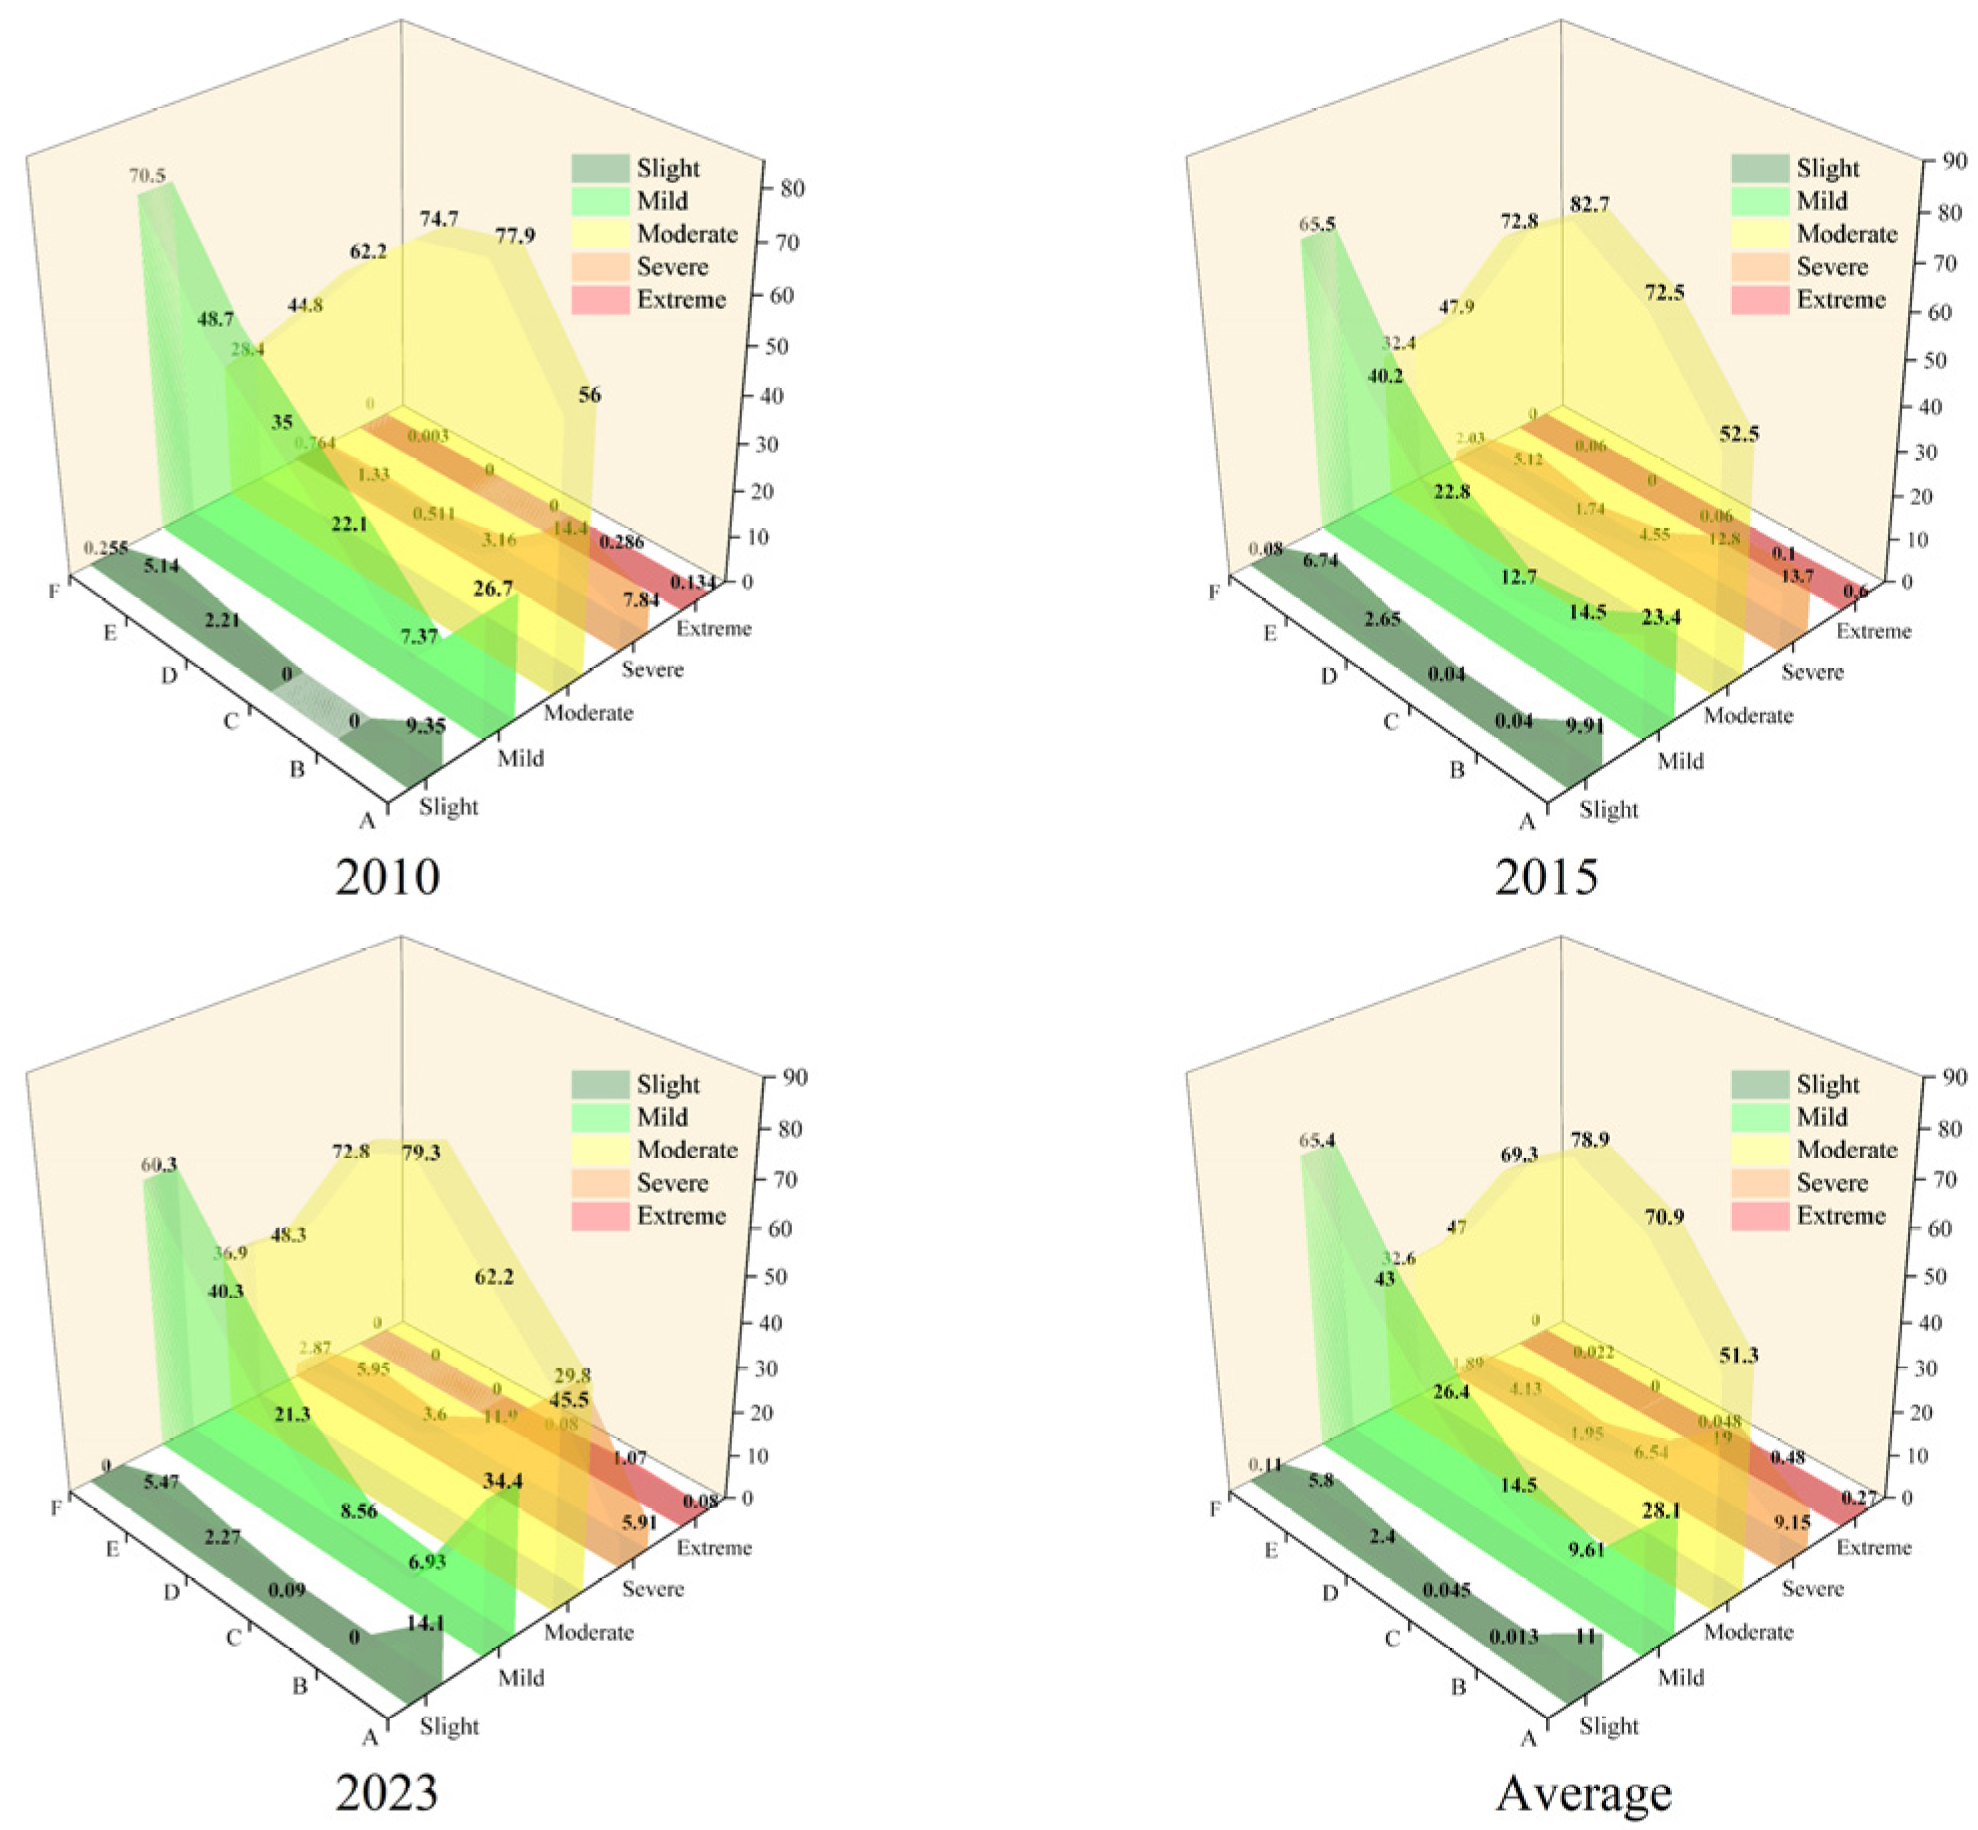
3.3.2. Trends in Vulnerability of Ecological Functional Protection Zones
3.4. Analysis of Ecological Vulnerability Drivers
3.4.1. Indicator Correlation Analysis and Covariance Diagnosis
3.4.2. Factors Influencing Ecological Vulnerability
4. Discussion
4.1. Spatiotemporal Evolution Pattern of Ecological Vulnerability in the Hubei Section of the YREB
4.2. Trends in Ecological Vulnerability in Six Types of Ecological Functional Protection Zones
4.3. Drivers of Ecological Vulnerability
4.4. Recommendations for Ecologically Sustainable Development
4.5. Limitations and Future Directions
5. Conclusions
- (1)
- Spatially, there was significant variation in the distribution of ecological vulnerability within the study area, with the eastern and central regions showing higher vulnerability compared to the western region. Temporally, from 2010 to 2023, the overall ecological vulnerability in the Hubei section of the Yangtze River Economic Belt remained at a moderate level, with a trend of initially increasing and then decreasing vulnerability. The area of severe vulnerability increased from 2010 to 2015, but from 2015 to 2023, there was a noticeable decrease in vulnerability, particularly in the moderate, severe, and extreme categories.
- (2)
- The Theil index values for the YREB in Hubei from 2010 to 2023 were 0.371, 0.365, and 0.398, showing an overall “V”-shaped upward trend. This indicates that the spatial pattern of ecological vulnerability in the study area was concentrated and exhibited a decreasing-then-increasing degree of spatial aggregation. Hot-spots were mainly concentrated in the eastern and central areas, while cold-spots were primarily observed in the western region. From 2010 to 2015, the central hot-spot area decreased, while the western cold-spot area expanded. From 2015 to 2023, both the central hot-spots and eastern cold-spots increased in size.
- (3)
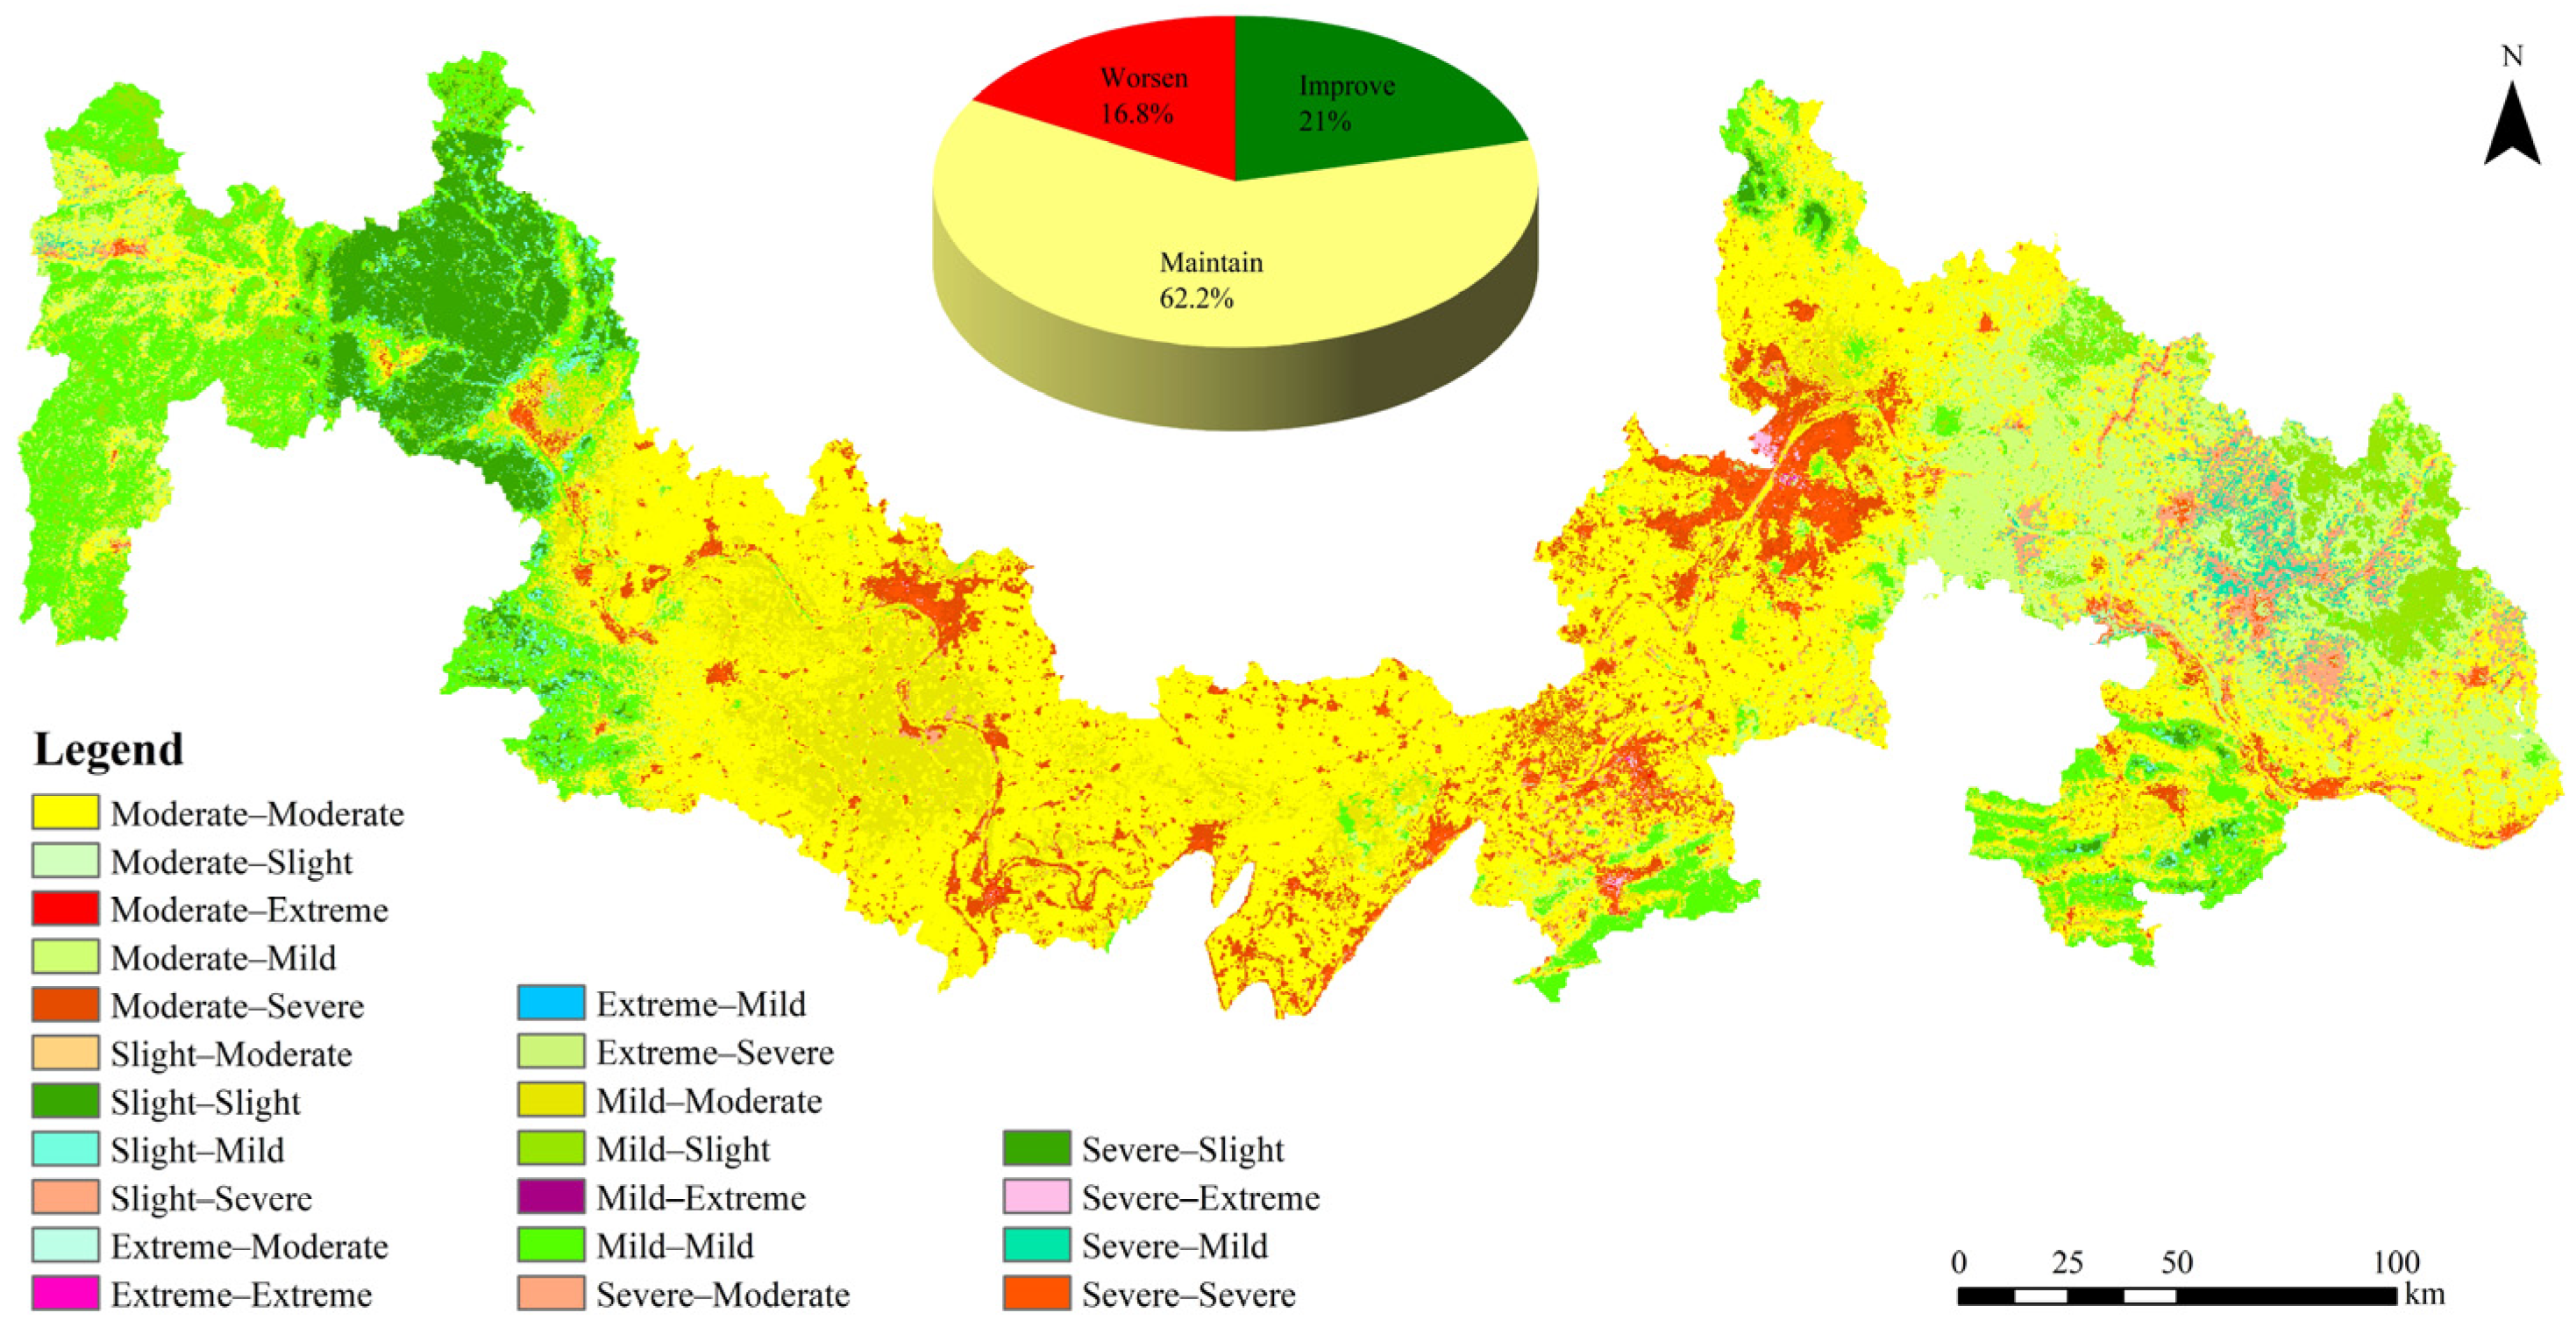
- Spatially, the central plain area of the study region generally maintained a moderate level of vulnerability, but some urban areas transitioned from moderate or severe to severe or extreme vulnerability. The western region saw a significant decrease in vulnerability levels. Temporally, from 2010 to 2023, approximately 62.2% of the vulnerable area remained at the same level, with a trend of transitioning from higher to lower vulnerability levels overall.
- (4)
- Among the six types of ecological function conservation areas, soil conservation areas had the highest proportion of low and moderate vulnerability, while key urban areas had a high proportion of severe and extreme vulnerability (up to 90%). From 2010 to 2023, except for water conservation areas, overall ecological vulnerability increased in other protected areas.
- (5)
- Based on ridge regression modeling, HDI was the main driving factor affecting ecological vulnerability in the study area. Among the four criterion layers, the pressure layer had the highest average regression coefficient, indicating its significant impact. When considering individual indicators and criterion dimensions, human activities were the strongest driver of changes in ecological vulnerability index in this research area.
Author Contributions
Funding
Data Availability Statement
Conflicts of Interest
References
- Wu, S.; Tian, B.; Gu, S.; Hu, Y. Spatial-Temporal Evolution of Ecological Vulnerability in Beijing-Tianjin-Hebei Region Based on PSRM Model. Environ. Sci. 2023, 44, 5630–5640. [Google Scholar] [CrossRef]
- He, L.; Shen, J.; Zhang, Y. Ecological Vulnerability Assessment for Ecological Conservation and Environmental Management. J. Environ. Manag. 2018, 206, 1115–1125. [Google Scholar] [CrossRef]
- Hu, X.; Ma, C.; Huang, P.; Guo, X. Ecological Vulnerability Assessment Based on AHP-PSR Method and Analysis of Its Single Parameter Sensitivity and Spatial Autocorrelation for Ecological Protection—A Case of Weifang City, China. Ecol. Indic. 2021, 125, 107464. [Google Scholar] [CrossRef]
- Polsky, C.; Neff, R.; Yarnal, B. Building Comparable Global Change Vulnerability Assessments: The Vulnerability Scoping Diagram. Glob. Environ. Change 2007, 17, 472–485. [Google Scholar] [CrossRef]
- Xiao, H.; Shao, H.; Long, J.; Zhang, S.; He, S.; Wang, D. Spatial-Temporal Pattern Evolution and Geological Influence Factors Analysis of Ecological Vulnerability in Western Sichuan Mountain Region. Ecol. Indic. 2023, 155, 110980. [Google Scholar] [CrossRef]
- Beroya-Eitner, M.A. Ecological Vulnerability Indicators. Ecol. Indic. 2016, 60, 329–334. [Google Scholar] [CrossRef]
- Boori, M.S.; Choudhary, K.; Paringer, R.; Kupriyanov, A. Using RS/GIS for Spatiotemporal Ecological Vulnerability Analysis Based on DPSIR Framework in the Republic of Tatarstan, Russia. Ecol. Inform. 2022, 67, 101490. [Google Scholar] [CrossRef]
- Wu, X.; Tang, S. Comprehensive Evaluation of Ecological Vulnerability Based on the AHP-CV Method and SOM Model: A Case Study of Badong County, China. Ecol. Indic. 2022, 137, 108758. [Google Scholar] [CrossRef]
- Wu, S.; Tian, B.; Gu, S.; Yang, L.; Hu, Y. The Influence of Vegetation Coverage on the Dynamic Evolution of Ecological Vulnerability: A Case Study of Zhangjiakou, Hebei Province. Res. Soil Water Conserv. 2024, 31, 310–320. [Google Scholar] [CrossRef]
- Zou, T.; Chang, Y.; Chen, P.; Liu, J. Spatial-Temporal Variations of Ecological Vulnerability in Jilin Province (China), 2000 to 2018. Ecol. Indic. 2021, 133, 108429. [Google Scholar] [CrossRef]
- Guo, B.; Zang, W.; Luo, W. Spatial-Temporal Shifts of Ecological Vulnerability of Karst Mountain Ecosystem-Impacts of Global Change and Anthropogenic Interference. Sci. Total Environ. 2020, 741, 140256. [Google Scholar] [CrossRef] [PubMed]
- Huo, T.; Zhang, X.; Zhou, Y.; Chen, W. Evaluation and Correlation Analysis of Spatio-Temporal Changes of Ecological Vulnerability Based on VSD Model: A Case in Suzhou Section, Grand Canal of China. Acta Ecol. Sin. 2022, 42, 2281–2293. [Google Scholar]
- Li, Y.; Li, C.; Jia, X.; Wu, J.; Zhang, X.; Mei, X.; Zhu, R.; Wang, D. Spatiotemporal Changes and Causes of Ecological Vulnerability in Ulansuhai Basin. J. Geo-Inf. Sci. 2023, 25, 2039–2054. [Google Scholar] [CrossRef]
- Xue, L.; Wang, J.; Wei, G. Dynamic Evaluation of the Ecological Vulnerability Based on PSR Modeling for the Tarim River Basin in Xinjiang. J. Hohai Univ. (Nat. Sci.) 2019, 47, 13–19. [Google Scholar] [CrossRef]
- Jiang, Y.; Shi, B.; Su, G.; Lu, Y.; Li, Q.; Meng, J.; Ding, Y.; Song, S.; Dai, L. Spatiotemporal Analysis of Ecological Vulnerability in the Tibet Autonomous Region Based on a Pressure-State-Response-Management Framework. Ecol. Indic. 2021, 130, 108054. [Google Scholar] [CrossRef]
- Xie, W.; Zhao, X.; Fan, D.; Zhang, J.; Wang, J. Assessing Spatio-Temporal Characteristics and Their Driving Factors of Ecological Vulnerability in the Northwestern Region of Liaoning Province (China). Ecol. Indic. 2024, 158, 111541. [Google Scholar] [CrossRef]
- Xia, M.; Jia, K.; Zhao, W.; Liu, S.; Wei, X.; Wang, B. Spatio-Temporal Changes of Ecological Vulnerability across the Qinghai-Tibetan Plateau. Ecol. Indic. 2021, 123, 107274. [Google Scholar] [CrossRef]
- Wu, J.; Zhang, Z.; He, Q.; Ma, G. Spatio-Temporal Analysis of Ecological Vulnerability and Driving Factor Analysis in the Dongjiang River Basin, China, in the Recent 20 Years. Remote Sens. 2021, 13, 4636. [Google Scholar] [CrossRef]
- Singh, P.; Hasnat, M.; Rao, M.N.; Singh, P. Fuzzy Analytical Hierarchy Process Based GIS Modelling for Groundwater Prospective Zones in Prayagraj, India. Groundw. Sustain. Dev. 2021, 12, 100530. [Google Scholar] [CrossRef]
- Li, G.; Li, J.; Sun, X.; Zhao, M. Research on a Combined Method of Subjective-Objective Weighing and the Its Rationality. Manag. Rev. 2017, 29, 17–26+61. [Google Scholar] [CrossRef]
- Xu, Y.; Yang, L.; Zhang, C.; Zhu, J. Comprehensive Evaluation of Water Ecological Environment in Watersheds: A Case Study of the Yangtze River Economic Belt, China. Environ. Sci. Pollut. Res. 2023, 30, 30727–30740. [Google Scholar] [CrossRef] [PubMed]
- Liu, J.; Tian, Y.; Huang, K.; Yi, T. Spatial-Temporal Differentiation of the Coupling Coordinated Development of Regional Energy-Economy-Ecology System: A Case Study of the Yangtze River Economic Belt. Ecol. Indic. 2021, 124, 107394. [Google Scholar] [CrossRef]
- Gong, G.; Zhao, Y. Ecology versus Economic Development: Effects of China’s Yangtze River Economic Belt Strategy. Int. Stud. Econ. 2024, 19, 330–352. [Google Scholar] [CrossRef]
- Yang, X.; Meng, F.; Fu, P.; Zhang, Y.; Liu, Y. Spatiotemporal Change and Driving Factors of the Eco-Environment Quality in the Yangtze River Basin from 2001 to 2019. Ecol. Indic. 2021, 131, 108214. [Google Scholar] [CrossRef]
- Pan, Z.; Gao, G.; Fu, B. Spatiotemporal Changes and Driving Forces of Ecosystem Vulnerability in the Yangtze River Basin, China: Quantification Using Habitat-Structure-Function Framework. Sci. Total Environ. 2022, 835, 155494. [Google Scholar] [CrossRef]
- Wang, Y.; Zang, X.; Xu, W.; Yang, C.; Jin, Y.; Ren, J.; He, X. Ecological Vulnerability and DrivingForces in the Jiangsu Section of the Yangtze River Economic Belt Based on the SRP Model and GeoDetector. Remote Sens. Nat. Resour. 2024. Available online: https://link.cnki.net/urlid/10.1759.P.20240731.1444.012 (accessed on 15 November 2024).
- Liu, R.; Wang, R.; Ren, X.; Deng, T.; Zhang, X. Water Safety and Synergistic Innovation Mechanism in Hubei Yangtze RiverEconomic Belt. Ecol. Econ. 2018, 34, 180–185. [Google Scholar]
- Zhu, J.; Liu, C.; Ke, X.; Huang, L.; Jiao, W. Analysis on the Change Characteristics of Ecological Product Production Capacity in Urbanization Process: A Case Study of Hubei Yangtze River Economic Zone. Ecol. Environ. Sci. 2024, 33, 469–477. [Google Scholar] [CrossRef]
- Gao, J.; Shi, Y.; Zhang, H.; Chen, X.; Zhang, W.; Shen, W.; Xiao, T.; Zhang, Y. China Regional 250m Normalized Difference Vegetation Index Data Set (2000–2023). National Tibetan Plateau/Third Pole Environment Data Center. 2023. Available online: https://data.tpdc.ac.cn/zh-hans/data/10535b0b-8502-4465-bc53-78bcf24387b3 (accessed on 1 October 2024).
- Yang, J.; Huang, X. The 30 m Annual Land Cover Datasets and Its Dynamics in China from 1985 to 2023. Earth Syst. Sci. Data 2024, 13, 3907–3925. [Google Scholar] [CrossRef]
- Peng, S. 1-Km Monthly Precipitation Dataset for China (1901–2023). National Tibetan Plateau/Third Pole Environment Data Center 2020. Available online: https://www.tpdc.ac.cn/zh-hans/data/faae7605-a0f2-4d18-b28f-5cee413766a2 (accessed on 1 October 2024).
- Peng, S. 1-Km Monthly Mean Temperature Dataset for China (1901–2023). National Tibetan Plateau/Third Pole Environment Data Center 2019. Available online: https://data.tpdc.ac.cn/en/data/71ab4677-b66c-4fd1-a004-b2a541c4d5bf/ (accessed on 1 October 2024).
- Peng, S.; Ding, Y.; Liu, W.; Li, Z. 1 Km Monthly Temperature and Precipitation Dataset for China from 1901 to 2017. Earth Syst. Sci. Data 2019, 11, 1931–1946. [Google Scholar] [CrossRef]
- Cai, X.; Li, Z.; Liang, Y. Tempo-Spatial Changes of Ecological Vulnerability in the Arid Area Based on Ordered Weighted Average Model. Ecol. Indic. 2021, 133, 108398. [Google Scholar] [CrossRef]
- Guo, C.X.; Zhu, Y.Q.; Sun, W.; Song, J. Dataset of Biological Abundance Index of China in 1985 and 2005 at 1 Km Resolution. J. Glob. Change Data Discov. 2017, 1, 60–65. [Google Scholar] [CrossRef]
- Li, Z.; Guan, D.; Zhou, L.; Zhang, Y. Constraint Relationship of Ecosystem Services in the Yangtze River Economic Belt, China. Environ. Sci. Pollut. Res. 2022, 29, 12484–12505. [Google Scholar] [CrossRef] [PubMed]
- Yang, Y. Evolution of Habitat Quality and Association with Land-Use Changes in Mountainous Areas: A Case Study of the Taihang Mountains in Hebei Province, China. Ecol. Indic. 2021, 129, 107967. [Google Scholar] [CrossRef]
- Guo, F.; Liu, X.; Mamat, Z.; Zhang, W.; Xing, L.; Wang, R.; Luo, X.; Wang, C.; Zhao, H. Analysis of Spatiotemporal Variations and Influencing Factors of Soil Erosion in the Jiangnan Hills Red Soil Zone, China. Heliyon 2023, 9, e19998. [Google Scholar] [CrossRef] [PubMed]
- Zhang, Y.; Zhang, P.; Liu, Z.; Xing, G.; Chen, Z.; Chang, Y.; Wang, Q. Dynamic Analysis of Soil Erosion in the Affected Area of the Lower Yellow River Based on RUSLE Model. Heliyon 2024, 10, e23819. [Google Scholar] [CrossRef]
- Wang, X.; Guo, Y. Analyzing the Consistency of Comparison Matrix Based on G1 Method. Chin. J. Manag. Sci. 2006, 14, 65–70. [Google Scholar] [CrossRef]
- Amusan, O.T.; Nwulu, N.I.; Gbadamosi, S.L. Multi-Criteria Decision-Based Hybrid Energy Selection System Using CRITIC Weighted CODAS Approach. Sci. Afr. 2024, 26, e02372. [Google Scholar] [CrossRef]
- Dai, R.; Xiao, C.; Liang, X.; Yang, W.; Chen, J.; Zhang, L.; Zhang, J.; Yao, J.; Jiang, Y.; Wang, W. Spatial-Temporal Evolution Law Analysis of Resource and Environment Carrying Capacity Based on Game Theory Combination Weighting and GMD-GRA-TOPSIS Model. Evidence from 18 Cities in Henan Province, China. J. Clean. Prod. 2024, 439, 140820. [Google Scholar] [CrossRef]
- Wang, L.; Huang, Q. Assessment of Ecological Vulnerability in Western Region Based on Game Theory Combination Empowerment. Jiangsu Agric. Sci. 2016, 44, 318–322. [Google Scholar] [CrossRef]
- Tang, Q.; Wang, J.; Jing, Z. Tempo-Spatial Changes of Ecological Vulnerability in Resource-Based Urban Based on Genetic Projection Pursuit Model. Ecol. Indic. 2021, 121, 107059. [Google Scholar] [CrossRef]
- Luo, Q.; Bao, Y.; Wang, Z.; Chen, X.; Wei, W.; Fang, Z. Vulnerability Assessment of Urban Remnant Mountain Ecosystems Based on Ecological Sensitivity and Ecosystem Services. Ecol. Indic. 2023, 151, 110314. [Google Scholar] [CrossRef]
- Qu, H.; You, C.; Feng, C.-C.; Guo, L. The Spatial Spillover Effects of Ecosystem Services: A Case Study in Yangtze River Economic Belt in China. Ecol. Indic. 2024, 168, 112741. [Google Scholar] [CrossRef]
- Roy, S.; Saha, M.; Hasan, M.M.; Razzaque, A.; Sumaiya, N.; Hoque, M.A.-A.; Misiūnė, I.; Ambrosino, M.; Depellegrin, D. Multi-Pressure Based Environmental Vulnerability Assessment in a Coastal Area of Bangladesh: A Case Study on Cox’s Bazar. Geomatica 2024, 76, 100030. [Google Scholar] [CrossRef]
- Yang, F.; Yang, L.; Fang, Q.; Yao, X. Impact of Landscape Pattern on Habitat Quality in the Yangtze River Economic Belt from 2000 to 2030. Ecol. Indic. 2024, 166, 112480. [Google Scholar] [CrossRef]
- Theil, H.; Scholes, M. Forecast Evaluation Based on a Multiplicative Decomposition of Mean Square Errors. Econometrica 1967, 35, 70–88. [Google Scholar] [CrossRef]
- Gong, J.; Jin, T.; Cao, E.; Wang, S.; Yan, L. Is Ecological Vulnerability Assessment Based on the VSD Model and AHP-Entropy Method Useful for Loessial Forest Landscape Protection and Adaptative Management? A Case Study of Ziwuling Mountain Region, China. Ecol. Indic. 2022, 143, 109379. [Google Scholar] [CrossRef]
- McDonald, G.C. Ridge Regression. Wiley Interdiscip. Rev.-Comput. Stat. 2009, 1, 93–100. [Google Scholar] [CrossRef]
- Wang, X.; Wang, X.; Gao, X. The Spatial–temporal Patterns and Influencing Factors of Medical and Health Resources Mismatch in Gansu Province. Med. Soc. 2024, 37, 20–25+54. [Google Scholar] [CrossRef]
- Choi, S.H.; Jung, H.-Y.; Kim, H. Ridge Fuzzy Regression Model. Int. J. Fuzzy Syst. 2019, 21, 2077–2090. [Google Scholar] [CrossRef]
- Dar, I.S.; Chand, S.; Shabbir, M.; Kibria, B.M.G. Condition-Index Based New Ridge Regression Estimator for Linear Regression Model with Multicollinearity. Kuwait J. Sci. 2023, 50, 91–96. [Google Scholar] [CrossRef]
- Shi, Z.; Zhou, S. A Study on the Dynamic Evaluation of Ecosystem Health in the Yangtze River Basin of China. Ecol. Indic. 2023, 153, 110445. [Google Scholar] [CrossRef]


| Data Type | Data Content | Data Sources | Data Use |
|---|---|---|---|
| NDVI | MOD13Q1 | Institute of Tibetan Plateau Research Chinese Academy of Sciences (https://data.tpdc.ac.cn, accessed on 1 October 2024). | Calculation of vegetation cover, cover and management factors |
| Terrain | ASTER GDEM | Geospatial Data Cloud (https://www.gscloud.cn/, accessed on 1 October 2024). | Calculate DEM, slope, terrain undulation, slope length and gradient factor. |
| Land use | 30 m CLCD Land Use | Zenodo (https://zenodo.org/records/12779975, accessed on 1 October 2024). | Calculation of HDI, habitat quality index, biological abundance, landscape diversity index, soil and water conservation factors |
| Water system | Hubei Provincial Water System | OpenStreetMap (https://www.openstreetmap.org/, accessed on 1 October 2024). | Calculation of water system density |
| Hydrological | 1000 m precipitation, temperature | Institute of Tibetan Plateau Research Chinese Academy of Sciences (https://data.tpdc.ac.cn, accessed on 2 October 2024). | Calculation of mean annual precipitation, mean annual temperature, rainfall erosivity factor |
| Soil type | 1000 m grid | Harmonized World Soil Database (HWSD, accessed on 2 October 2024). | Calculation of soil erodibility factor |
| Population | 1000 m grid | LandScan Global (https://landscan.ornl.gov/, accessed on 2 October 2024). | Calculation of population density |
| GDP per capita | 1000 m grid | Resource and Environmental Science Data Platform (https://www.resdc.cn, accessed on 2 October 2024). | Calculation of GDP per capita |
| Socio-economic | Socio-economic indicators from 2010 to 2023 | Hubei Province, Municipal Statistical Yearbook | Calculation of sewage treatment rate, green area ratio in built-up areas |
| Criterion Layer | Indicator | Resolution | Direction | Ecological Significance |
|---|---|---|---|---|
| Pressure (P) | Population density (A1) | 1000 m | + | Population pressure on land and environment |
| GDP per capita (A2) | 1000 m | − | Level of regional economic development | |
| Water system density (A3) | 1:1 million | + | Waterway connectivity | |
| HDI (A4) | 30 m | + | Level of human activity | |
| State (S) | Slope (B1) | 30 m | + | Topographic and geomorphologic conditions |
| DEM (B2) | 30 m | + | Topographic and geomorphologic conditions | |
| Terrain undulation (B3) | 30 m | + | Topographic and geomorphologic conditions | |
| Soil erosion intensity (B4) | 300 m | + | Soil erosion conditions | |
| Average annual precipitation (B5) | 1000 m | − | Hydrothermal conditions | |
| Average annual temperature (B6) | 1000 m | + | Hydrothermal conditions | |
| Response (R) | Habitat quality index (C1) | 30 m | − | Habitat quality status |
| Bioabundance (C2) | 30 m | − | Ecosystem diversity | |
| Vegetation cover (C3) | 250 m | − | Degree of surface vegetation cover | |
| SHDI (C4) | 30 m | − | Landscape heterogeneity | |
| Management (M) | Sewage treatment rate (D1) | 300 m | − | Disposal of pollutants |
| Green area ratio in built-up areas (D2) | 300 m | − | Urban greening status |
| Indicator | G1 Method | CRITIC Method | Game Theory Combination Weights |
|---|---|---|---|
| Population density | 0.0814 | 0.0077 | 0.0441 |
| GDP per capita | 0.0471 | 0.1160 | 0.0820 |
| Water system density | 0.0565 | 0.0807 | 0.0688 |
| HDI | 0.0678 | 0.0429 | 0.0552 |
| Slope | 0.0288 | 0.0505 | 0.0397 |
| DEM | 0.0171 | 0.0528 | 0.0351 |
| Terrain undulation | 0.0240 | 0.0439 | 0.0340 |
| Soil erosion intensity | 0.0345 | 0.0073 | 0.0208 |
| Average annual precipitation | 0.0580 | 0.0701 | 0.0641 |
| Average annual temperature | 0.0483 | 0.0310 | 0.0396 |
| Habitat quality index | 0.0913 | 0.0931 | 0.0922 |
| Bioabundance | 0.0913 | 0.0874 | 0.0893 |
| Vegetation cover | 0.1460 | 0.0474 | 0.0962 |
| SHDI | 0.0761 | 0.0734 | 0.0747 |
| Sewage treatment rate | 0.0549 | 0.0915 | 0.0734 |
| Green area ratio in built-up areas | 0.0768 | 0.1045 | 0.0908 |
| Indicator | Tolerance | VIF |
|---|---|---|
| A1 | 0.740 | 1.35 |
| A2 | 0.645 | 1.55 |
| A3 | 0.648 | 1.54 |
| A4 | 0.085 | 11.72 |
| B1 | 0.115 | 7.51 |
| B2 | 0.028 | 35.55 |
| B3 | 0.088 | 11.43 |
| B4 | 0.951 | 1.05 |
| B5 | 0.287 | 3.48 |
| B6 | 0.036 | 27.60 |
| C1 | 0.224 | 4.46 |
| C2 | 0.058 | 17.18 |
| C3 | 0.548 | 1.82 |
| C4 | 0.822 | 1.22 |
| D1 | 0.280 | 3.57 |
| D2 | 0.273 | 3.67 |
| K = 0.196 | Non-Standardized Coefficient | Standardized Coefficient | T Value | p | R2 | |
|---|---|---|---|---|---|---|
| Regression Coefficient B | Standard Error | Standard Coefficients Beta | ||||
| A1 | 0.207 | 0.001 | 0.032 | 150.865 | 0.000 *** | 0.968 |
| A2 | 0.105 | 0.001 | 0.027 | 123.254 | 0.000 *** | |
| A3 | 0.116 | 0 | 0.178 | 813.538 | 0.000 *** | |
| A4 | 0.209 | 0 | 0.197 | 873.237 | 0.000 *** | |
| B1 | 0.005 | 0 | 0.005 | 22.583 | 0.000 *** | |
| B2 | -0.019 | 0 | −0.02 | −112.39 | 0.000 *** | |
| B3 | -0.025 | 0 | −0.023 | −101.469 | 0.000 *** | |
| B4 | 0.1 | 0.001 | 0.021 | 101.587 | 0.000 *** | |
| B5 | 0.065 | 0 | 0.109 | 465.336 | 0.000 *** | |
| B6 | 0.031 | 0 | 0.027 | 134.009 | 0.000 *** | |
| C1 | 0.157 | 0 | 0.344 | 1373.421 | 0.000 *** | |
| C2 | 0.114 | 0 | 0.246 | 1185.908 | 0.000 *** | |
| C3 | 0.161 | 0 | 0.149 | 647.541 | 0.000 *** | |
| C4 | 0.133 | 0 | 0.162 | 777.082 | 0.000 *** | |
| D1 | 0.106 | 0 | 0.175 | 740.633 | 0.000 *** | |
| D2 | 0.157 | 0 | 0.197 | 856.449 | 0.000 *** | |
Disclaimer/Publisher’s Note: The statements, opinions and data contained in all publications are solely those of the individual author(s) and contributor(s) and not of MDPI and/or the editor(s). MDPI and/or the editor(s) disclaim responsibility for any injury to people or property resulting from any ideas, methods, instructions or products referred to in the content. |
© 2025 by the authors. Licensee MDPI, Basel, Switzerland. This article is an open access article distributed under the terms and conditions of the Creative Commons Attribution (CC BY) license (https://creativecommons.org/licenses/by/4.0/).
Share and Cite
Wu, S.; Zeng, G.; Sun, J.; Liu, X.; Li, X.; Zeng, Q.; Gu, S. Assessment of the Spatiotemporal Evolution Characteristics and Driving Factors of Ecological Vulnerability in the Hubei Section of the Yangtze River Economic Belt. Land 2025, 14, 996. https://doi.org/10.3390/land14050996
Wu S, Zeng G, Sun J, Liu X, Li X, Zeng Q, Gu S. Assessment of the Spatiotemporal Evolution Characteristics and Driving Factors of Ecological Vulnerability in the Hubei Section of the Yangtze River Economic Belt. Land. 2025; 14(5):996. https://doi.org/10.3390/land14050996
Chicago/Turabian StyleWu, Shuai, Guanzhong Zeng, Jie Sun, Xiaohuang Liu, Xuanhui Li, Qinghua Zeng, and Shijie Gu. 2025. "Assessment of the Spatiotemporal Evolution Characteristics and Driving Factors of Ecological Vulnerability in the Hubei Section of the Yangtze River Economic Belt" Land 14, no. 5: 996. https://doi.org/10.3390/land14050996
APA StyleWu, S., Zeng, G., Sun, J., Liu, X., Li, X., Zeng, Q., & Gu, S. (2025). Assessment of the Spatiotemporal Evolution Characteristics and Driving Factors of Ecological Vulnerability in the Hubei Section of the Yangtze River Economic Belt. Land, 14(5), 996. https://doi.org/10.3390/land14050996