Abstract
Terraces have long transformed steep slopes into gradual steps, reducing erosion and enabling agriculture on marginal land. In France’s Roya Valley, these dry stone structures, neglected for decades, demonstrated remarkable resilience during storm Alex in October 2020. This prompted civil society and researchers to identify terraces that could support food security and agri-tourism initiatives. This study aimed to develop a semi-automatic method for detecting and mapping terraced areas using LiDAR and orthophoto data from French repositories, processed with GIS and analyzed through a Support Vector Machine (SVM) classification algorithm. The model identified 18 terraces larger than 1 hectare in Saorge and 35 in La Brigue. Field visits confirmed evidence of abandonment in several areas. Accuracy tests showed a user accuracy (UA) of 97% in Saorge and 72% in La Brigue. This disparity reflects site-specific differences, including terrain steepness, vegetation density, and data resolution. These results highlight the value of machine learning for terrace mapping while emphasizing the need to account for local geomorphological and data-quality factors to improve model performance. Enhanced terrace detection supports sustainable land management, agricultural revitalization, and risk mitigation in mountainous regions, offering practical tools for future landscape restoration and food resilience planning.
1. Introduction
Terraces are constructed as a sequence of flat or gently inclined platforms resembling giant staircases along a hillside. Each step is typically reinforced by a retaining wall made of stone or earth, allowing otherwise steep terrain to be transformed into cultivable plots. According to [1], terraces are often called contour or bench terraces, significantly reducing slope gradients and minimizing soil erosion. They follow the natural topography and contour lines of the ground. Contour terrace construction entails building a sequence of horizontal platforms down the slope with retaining walls or embankments to stop soil movement, as these are crucial structural components of terraces, preventing soil erosion and supporting the upper terrace’s weight. These structures preserve arable soil, slow water runoff, and reduce landslide risks, ensuring long-term agricultural productivity and slope stability [2]. Terraces are built in various areas, such as coastal areas and river valleys [3]. Terracing techniques have been extensively investigated across different regions, illustrating how human societies adapt to diverse climatic and geographical conditions [4]. They have been implemented for centuries in various parts of Asia, Africa, Europe, and South America (Figure 1). Various types of terraced slopes are identified based on their intended purposes, especially in the field of agriculture [5,6]. This includes (1) broad-base terraces for moderately steep farming slopes, (2) narrow-base terraces, a suitable construct for stable hillside agriculture, (3) grassed back-slope terraces, which are water mainly for erosion control and slope stability, (4) diversion terraces, used for accumulation prevention and intercepting water overflows, (5) retention terraces that help water retention on the slope, and (6) bench terraces for a conducive spaced planting beds. Thus, throughout human history, artificial terraces have been extensively employed as agricultural landforms worldwide [7,8]. One of the purposes of these terraces is to redirect and hold back water during times of high flow, preventing flooding in populated and agricultural areas [2]. These carefully designed structures have been crucial in optimizing farming practices in mountain areas. They enable cultivation in challenging landscapes, preserving soil quality, regulating water usage, and increasing crop yields [9].
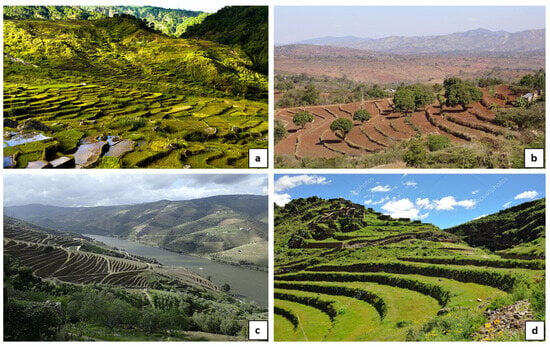
Figure 1.
Terraces around the world. (a) Rice terraces near Sagada, Philippines (Image by Jojo Nicdao) (b) Fanya Juu Terraces in Kenya (Image by Handspeter Lineger, WOCAT) (c) Terraced slopes, Duoro Valley, Portugal (Image by M. Hewes) (d) Hillside terraces in Urubamba Valley, Peru, South America (Photo by Jacek Kadaj). (The photos are licensed under the Creative Commons Attribution-Share Alike 3.0 Unported, Infonet-biovision.org, [10], and Depositphotos).
In the Mediterranean area, terracing is a unique anthropogenic feature that has been used for agricultural purposes since the Neolithic age [11]. The construction of such features allowed the locals to cultivate on steep mountain slopes [12]. These structures are usually walled with dry stone, which is vital to their stability, notwithstanding the benefits it delivers [3]. The wall is constructed with a little upstream slant to withstand physical pressures and hold dirt upstream. The wall’s height controls the fruiting body’s size as it influences water retention, soil depth, and crop suitability. Taller walls allow for deeper soils and better water retention, supporting high-value perennial crops, such as fruit trees, while lower walls are often used for annual or shallow-rooted crops. Additionally, higher terraces can reduce irrigation needs and buffer fields from extreme runoff events. To increase stability on slopes, the base of the wall is frequently in close contact with a rocky surface.
A retaining wall serves as a vaulted structure in situations where difficulties such as streams, big roots, or crumbly rocks are present [3]. However, throughout history, most of these structures have been threatened with abandonment as the changes in agricultural practices and urbanization of the region have been rapidly growing [13]. The globalization of agricultural systems has resulted in the necessity for appropriate management techniques in the face of disruptions and challenges [14].
In contrast to metropolitan areas, rural and mountainous areas have received less attention when it comes to food-related issues [15]. Rural and mountainous areas in Europe have experienced a significant decline in agricultural land use, with studies indicating that over 20% of terraces in Mediterranean regions have been abandoned in the past 50 years [16]. This abandonment exacerbates soil erosion, biodiversity loss, and increased natural hazard risks, highlighting the urgent need for a renewed focus on sustainable land management and food security in these landscapes. Inaccessible services, especially transportation, poor incomes, and other issues plague the middle and upper Alpes-Maritimes region of France [16]. For instance, the Roya, Vésubie, Tinée, and Moyen Var valleys were significantly impacted by Storm Alex in 2020, highlighting the importance of resilient development [16]. The « Diagnostic du système alimentaire de la région Provence-Alpes-Côte d’Azur, de sa durabilité et de sa résilience » highlights agriculture as key development lever, encouraging tourism through local product valorization and agrotourism [17].
This study seeks to address key scientific questions related to the semi-automatic detection and mapping of agricultural terraces in mountainous landscapes:
- How effectively can LiDAR and orthophoto data be integrated with machine learning techniques to identify terraced areas?
- What are the spatial patterns and characteristics of terraces in relation to local topography?
- How do site-specific factors influence detection accuracy?
The specific purpose of the study is to develop and evaluate a geospatial framework that combines Remote Sensing, GIS, and Support Vector Machine (SVM) algorithms to map terraces in the Roya Valley, Southeast France. SVMs are a class of supervised machine learning algorithms used for classification and regression tasks. In the context of Remote Sensing, SVMs classify land cover types based on input training data, effectively separating classes such as agricultural terraces from other landscape features. This method aims to support post-disaster land use planning, promote food resilience, and enhance agrotourism development by identifying terraces with agricultural potential. Researchers and members of civil society are working together on the research-action project Cultures en terrasse dans la Roya (https://www.terrassesroya.eu/; accessed 10 April 2023) to investigate terraces and the accompanying productive systems. Using LIDAR images, one of the objectives of the study is to identify and map terraces (Figure 2), drawing on earlier research conducted in Spain [18]. Extensive mapping of terrace-occupied areas and analyses of terrace dynamics will aid in sustainable land management and future development in the area. This research project intends to offer useful insights for spatial planning and the promotion of sustainable farming practices by incorporating multiple stakeholders and considering the distinctive qualities of terraces [19,20,21].

Figure 2.
Terrace in the Roya Valley. Image from the “Cultures en terrasses” project, (a) terraces used for backyard gardening, and (b) terraces for olive plantations.
The innovative aspect of our approach is to develop a semi-automatic method for detecting and mapping terraced areas using LiDAR data and orthophotos from French databases, processed with a GIS and analyzed using machine learning. In summary, terrace agriculture remains a vital land-use system in mountainous Mediterranean landscapes. Ensuring its sustainability is essential not only for preserving cultural heritage and food sovereignty but also for maintaining ecological stability and mitigating natural hazards in these fragile environments.
2. Materials and Methods
The semi-automatic detection developed technique of agricultural terraces, which we have developed in our work, comprises gathering primary data from the French open-access geodata repository of LiDAR information and orthophoto for the Roya Valley in the Alpes-Maritimes department, southeast of France. This data was used for the preprocessing techniques in GIS, which will be elaborated on in the succeeding sections. Furthermore, the acquired data will be used to calculate the slope surface parameters such as curvature, elevation, and gradient, which will be the base information on the candidate terraced areas [22]. In addition, building and training terraced models for machine learning were performed under the supervised classification scheme of the features primarily identified in the field. The resulting information serves as a classification model of the terraced features within the site based on training data.
2.1. The Framework Structure
The workflow for this study has shown various procedures to generate the semi-automatically detected terrace model (Figure 3). The initial phase includes the acquisition of LiDAR data and Orthophoto information from the French open-access geodata repository, the IGN, also known as Institut National de l’Information Géographique et Forestière https://geoservices.ign.fr/lidarhd (accessed on 1 April 2023).
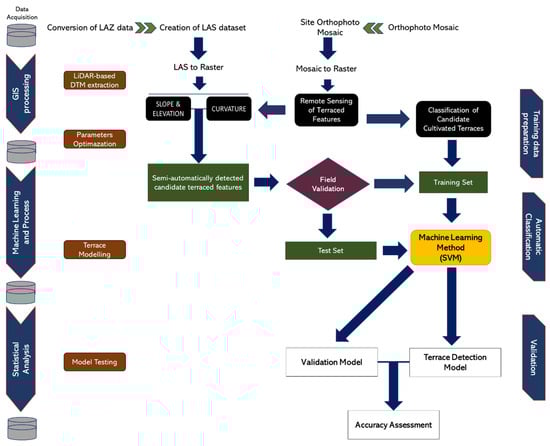
Figure 3.
The framework structure of this study.
The acquired data are exported in ArcGIS Pro 3.1.0 software for GIS processing. Multiple 2 km × 2 km tiles of 1 m-resolution LiDAR data in LAZ format for Saorge and La Brigue villages are converted into the LAS dataset format using the convert LAS tool. LAS is an uncompressed LiDAR data format that stores detailed point clouds and metadata, while LAZ is its lossless-compressed counterpart, significantly reducing file sizes without losing data accuracy. Once the conversion is carried out, the LAS files are integrated into one LAS Dataset of LiDAR data using the Create LAS Dataset tools.
The LAS dataset for each village is then converted into a 1 m-resolution Digital Surface Model (DSM) raster file, which will be subjected to optimization based on geomorphological properties required in classifying terraced slopes. This means that the DSM is refined using specific terrain attributes—such as slope gradient, curvature, and surface texture—that are essential for identifying and distinguishing terraced landforms from other types of terrain. Simultaneously, the acquired orthophoto was processed in the software by creating a mosaic dataset within the same geodatabase. The orthophoto segments are then added to the dataset before it is exported as a single raster file that will be used in the GIS processing. LiDAR data generates high-resolution Digital Surface Models that capture subtle terrain variations, such as slope gradients and curvature, critical for detecting terraced platforms. In parallel, high-resolution orthophotos provide geometrically accurate imagery that refines the visual delineation of terrace boundaries. The integration of these complementary datasets enables a robust semi-automatic detection method, improving classification accuracy and reducing false positives.
2.2. Study Area
The area of study is in the southern part of the Roya Valley region in the southeastern section of the Alpes-Maritimes, France (Figure 4). The valley watershed covers a total land area of approximately 467 km2.
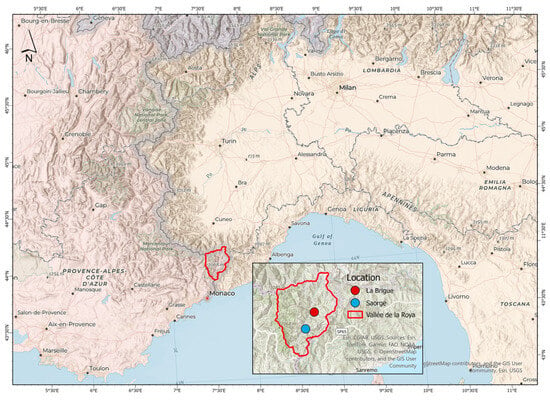
Figure 4.
The study areas along the Vallée de la Roya.
It is bounded by Italian territory in the north and eastern sections. The Roya Valley is a huge watershed having multiple drainage basins that converge towards the main Roya River channel traversing the central portion of the valley and draining into the Italian portion of the Mediterranean Sea. The Roya valley covers five (5) villages, namely Tende, Fontan, Breil-sur-Roya, La Brigue, and Saorge, to which the terrace feature detection is carried out.
For this study, we will focus on the last two villages, summarized in Table 1, because, based on our reconnaissance field observation, their terraced slopes show clear signs of cultivation development.

Table 1.
Fundamental details regarding the study regions.
This study aims to develop a semi-automatic detection approach for the precise identification and mapping of terraced areas in Southeast France for agricultural purposes using LiDAR, orthophoto, and machine learning techniques. The research aims to enhance our understanding of terrace distribution, quantify its extent, and provide valuable insights for optimizing agricultural practices and promoting sustainable land use planning.
In Roya Valley, the [23] project highlighted the importance of terrace cultivation dynamics, which were considered essential for sustainable land management in the region. To facilitate terrace identification, research, and preservation, the project emphasized the need for precise cartographic depictions of terraces. The research shed light on the historical and cultural relevance of the terraces in the Roya Valley, as well as their spatial distribution and characteristics. It contributed to the existing body of knowledge on terrace systems, their role in shaping landscapes, and their support for agricultural activities. However, the study also concluded that such detailed mapping was lacking at this scale, underscoring the need for further research, hence the relevance of this work. While the ALPTER project focused on specific locations within the hinterland of Nice, rather than exhaustively covering a large region, its findings underscored the importance of integrating cartographic methods, such as Remote Sensing and GIS, to effectively map and monitor terraced landscapes. These mapping techniques provided valuable information for landscape analysis and planning, aiding well-informed land-use management decisions.
2.3. Terrace Detection Background
Three (3) different practices are generally used to identify terraces, each of them being composed of three methods [24]. The first method involves characterizing the surface flow path, while the second is automatically detecting terraces using statistical analysis, and finally, the last method includes Terrestrial Laser Scanner (TLS) data 3D modeling. The first method calls for the identification of terraces in the ground that show failure in the form of bulging walls, which are thought to be caused by the water pressure in the subsurface. To determine how topography affects subsurface pressure, the model considers hydrologic surface flow and geotechnical slope processes [2]. Meanwhile, the second method automatically classified terraces using feature extraction techniques employing statistical analysis. The resulting model was derived using the equations of [25,26]. Such a method is usually performed for the rapid detection of the location of terraces.
The last method is a 3D simulation using TLS, a ground-based LiDAR device that rapidly captures high-resolution 3D spatial data by emitting laser pulses and measuring their return times. It generates dense point clouds for accurate modeling of complex structures and terrains, proving essential in engineering, architecture, and heritage conservation. The final topographic model in this method allows precise detection of the movement of the terrace walls because of loading.
Digital Elevation Models (DEMs) obtained from Pleiades satellites and Light Detection and Ranging (LiDAR) DEMs were used to compare detection rates for agricultural terraces along the Peyne catchment in southern France in [20] analysis. In their research, they used geomorphometric analysis, which is comparable to the second technique used by [25], to find terraced slopes. Comparative examination of the DEM and Digital Surface Model (DSM) acquired from Pleiades and LiDAR, respectively, also revealed considerable performance variations. Terraces over 2 m in height can be reliably found using DEMs taken from the Pleiades [12]. However, when a Digital Terrain Model (DTM) is used, detection through LiDAR outperforms the satellite image (Pleiades) performance, even though the latter can produce a promising result through continuous DTM creation that covers a wider range of possible outputs.
2.3.1. Machine Learning in Terrace Detection Studies
Terrace detection research has substantially advanced thanks to the combination of Geographic Information System (GIS) and machine learning techniques. Utilizing these tools, researchers have investigated several methods for locating and mapping terraces [27]. For example, used a combination of GIS and Machine Learning approaches for terrace extraction in mountainous locations. GIS serves as the spatial framework for managing, visualizing, and analyzing terrain data, such as Digital Elevation Models and orthophotos. Machine learning algorithms such as SVMs process these spatial datasets by classifying land cover types based on training samples identifying terraces through pattern recognition of topographic and visual features. To locate prospective terraces, the authors used elevation data from orthophotos and LiDAR. Then, using a collection of spectral, textural, and topographic properties, they classified and mapped terraces using a Random Forest algorithm, an ensemble machine learning algorithm that builds multiple decision trees on random subsets of data and aggregates their predictions to improve accuracy and prevent overfitting. The improved accuracy and predictive power of the Random Forest algorithm result from its ensemble approach, combining multiple decision trees to reduce overfitting and better capture complex, non-linear relationships in the data. Factors such as variable importance measures and bootstrapped sample generation enhance classification robustness compared to single classifiers. The study showed that machine learning techniques are excellent at precisely identifying and mapping terraces.
In addition, ref. [28] investigated how to combine deep learning methods with GIS to extract terraces. Machine learning encompasses a range of algorithms that learn from data, while deep learning focuses on using multi-layer neural networks to automatically extract complex features from raw data. To automatically identify and map terraces from high-resolution satellite photos, they used a Convolutional Neural Network (CNN). A sizable dataset of terrace image annotations was used to train the CNN algorithm. CNNs excel at detecting spatial patterns in high-resolution images due to their ability to automatically learn hierarchical feature representations. Unlike traditional classifiers that rely on manually selected features, CNNs identify complex spatial structures, making them especially effective for recognizing terraces in heterogeneous landscapes. The study proved that deep learning techniques could correctly recognize terraces even in intricate settings.
Furthermore, ref. [29] presents an integrated approach for automatic terrace information extraction and highlights its advantages over traditional machine learning approaches. The proposed method effectively considers the spatial relationship between pixels, resulting in a high user accuracy (UA) of 91.84% in the selected sample areas. This indicates the superiority of the proposed approach compared to both traditional machine learning and spectral angle mapper methods. One notable strength of the deep learning-based terraces information extraction approach is its robustness to the confidence threshold of predicted images.
Over 80% of the pixels in the sample areas were classified accurately. However, it should be noted that the classification of blurry pixels, particularly those at the edge of the target object, remains challenging. Such pixel classification accuracy achieved by CNNs surpasses traditional manual and rule-based mapping approaches, which typically yield accuracies between 60–75% in complex terrains [12]. This demonstrates the potential of deep learning models to enhance the efficiency and reliability of terrace mapping workflows.
The research emphasizes the broader potential of the proposed methodology beyond just terrace extraction. While existing literature recognizes its effectiveness in classifying and distinguishing image defects using neural networks [29], this approach holds promise for various other applications such as terrace monitoring, soil erosion assessment, and agricultural production management.
Given its ability to handle complex terrace extraction tasks stemming from large datasets and augmentation, a deep learning-based approach could prove valuable in these domains. Moreover, addressing challenges such as class disproportion and optimizing model parameters is crucial to ensure accurate results and alleviate fitting discrepancies, which remain significant problems. Furthermore, integrating this methodology into conventional Remote Sensing image segmentation techniques could yield encouraging outcomes.
2.3.2. The Support Vector Machine (SVM)
Machine learning techniques have been used more frequently and demonstrated as effective tools in a wide range of natural science disciplines [30]. This is a result of increased processing efficiency and sophisticated statistical techniques [31]. Ref. [32] laid the foundation for the Support Vector Machine (SVM), a supervised learning technique (Learning from labeled examples) based on structural risk reduction and statistical learning theory. SVM is a supervised classification approach derived from statistical learning theory that produces good classification results from complex and noisy data [33]. It classifies the groups by employing a decision surface that optimizes the spacing between the classes [34].
Here, in the context of terrace detection, the classification will be in the binary format; hence, the linear SVM learning method shall be employed. This involves converting the original input space into a higher-dimensional feature space using the training data [1,35]. By maximizing the margins between class boundaries, the SVM algorithm identifies the best hyperplane H (Figure 5a) in the feature space [36].
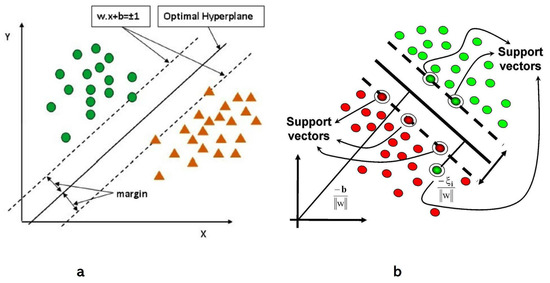
Figure 5.
The conceptual model of support vector machine training. (a) The base concept of the Support Vector Machine process (b) details of support vectors along the hyperplane. (Adopted from [35] page 3).
The training points that are closest to the ideal hyperplane are known as support vectors. Furthermore, the classification of new information can be accomplished by employing the decision surface once it has been acquired. This approach considers the training dataset to consist of instance-label pairs such that Xi ∈ Rn (dimensional space, d), yi ∈ {1, −1} and i = 1, …. n [37], where each instance (xi) represents a vector of input space containing elevation, slope gradient, profile curvature, and even the spectral signatures of the corresponding RGB values of the slope.
The labels (yi) correspond to the classes “terraced pixels” and “non-terraced pixels” (1 and −1, respectively). The goal of the SVM algorithm is to find an optimal separating hyperplane that accurately distinguishes the two classes (1 and −1) based on the provided training data.
Additionally, the nearest samples from both sides of the hyperplane maintain their maximum separation from the hyperplane (Figure 5b). The defined function of the discriminant is
where w = (w1, w2, …wn) is a vector consisting of n elements (weight factor), where n represents the dimension of the feature space.
g(x) = (w * x) + b
Additionally, b denotes a scalar value (bias), and (w * x) denotes the inner product between vectors w and x. Following the rule of classification method indicated by [38], which states:
f(x) = Sign[(w * x) + b]
f(x) > 0 {x ∈ class yi = +1}
f(x) < 0 {x ∈ class yi = −1}
Consequently, the optimization problem can be stated as follows:
Minimize 1/2 |(|w|)|2
Subject to yi [(w * xi) + b] > 1.
The particular problem above can be solved by the Lagrangian multipliers (i = 1, 2, …, n) [39]. The linearly constrained problem can be expressed as follows using Lagrange multipliers:
The best-separating hyperplane for linearly non-separable data has been generalized by the cost function solution. This method optimizes the margin and simultaneously minimizes the mistake by minimizing the cost function. A definition of the new cost function is:
where C is a parameter used to calculate the misclassification penalty, and ξi are slack variables—a measure of how much a data point deviates from the ideal margin, allowing the SVM to gently tolerate some misclassification—and are used as a measure of the non-separability of data. The adjusted constraint for the new cost function minimization in Equation (8) is
The kernel approach is used to improve the model’s performance for settings that are linearly non-separable. In this instance, a non-linear transformation Ø(➋) is used to convert the samples from the primary dimensional space into the higher dimensional space Ø(x) ∈ Rnh. In this situation, the inner product in the converted space [(Ø(xi)* Ø(xj)] has substituted the place of the inner product in Equation (7). In the higher-dimensional space, the inner product is effectively calculated using the kernel function. If the kernel function is consistent with Mercer’s theorem [40], the inner product is given by:
K(xi, xj) = Ø(xi)T * Ø(xj)
This kind of kernel function allows the inner product computation to be omitted, which transforms Equation (7) into
In lower-dimensional space, the final discriminant function f(x) can be represented as
where Ns is the number of support vectors. The SVM model’s kernel is essential. Various researchers are proposing new kernels, but the following four fundamental kernels are the best and currently available in ArcGIS Pro:
linear: K(xi,x) = xiT * xi
In the equations above γ, r and d are all parameters of the kernel.
2.4. GIS Processing
The preprocessing of LiDAR data involves utilizing geospatial analysis within a GIS environment. The initial step entails converting the existing LAS dataset into a DSM raster file through the ‘LAS dataset to Raster’ conversion tool in ArcGIS Pro. The LAS dataset filter is activated by selecting the ground point classification. This guarantees that the resulting raster surface model represents most of the bare earth.
In addition to default settings, the binning approach is employed, and the minimum cell assignment method is chosen to establish the output extent based on the lowest value found among the points within each cell. The ‘focal statistics’ tool is then utilized to calculate the median values of the input LiDAR-based DEM raster. Subsequently, the calculated median serves as an input to the same GIS tool to calculate the median. By recalculating the median values of the DEM raster file, a digital terrain model (DTM) raster of the LiDAR data is generated, where the values of all neighboring input cells determine the values of each output cell. This technique facilitates the elimination of unfiltered raster values that correspond to vegetation.
Furthermore, the spectral data undergo processing in GIS by consolidating them into a single raster file derived from the orthophotomosaic raster dataset. To achieve this, the conversion tool ‘mosaic to raster’ is employed, which tiles and combines the orthophoto segments of the study areas to their spatial reference. Throughout the conversion process, the pixel type and cell size are set to their default values, which align with the characteristics of the original downloaded data.
For this specific study, the orthophoto exhibits a cell size of 0.2 m × 0.2 m and employs a 32-bit floating pixel type. The band classification follows the RGB (Red, Green, Blue) scheme, where band 1 represents the red channel, band 2 represents the green channel, and band 3 represents the blue channel. During Remote Sensing (RS) analysis to identify potential terrace fields, it is possible to adjust these band assignments to emphasize specific features in the photographs, thereby refining the interpretation and analysis of the data.
2.4.1. Candidate Terraces Selection Through RS and Surface Parameters
Detection of candidate terraced slopes was performed through RS using the orthophotos as well as geoprocessing of terrain properties of the site using the DTM in GIS. Identification through the orthophotos can be obvious, as terrace characteristics are readily evident. This is because the orthophotos of the sites are in the high-resolution spectrum hence, they shall appear as distinct linear or stepped landforms on sloping terrain [12]. The orthophotos used in this study were acquired in 2020, while the LiDAR HD data used to generate the Digital Terrain Model (DTM) was collected between 2021 and 2023 by the French national mapping agency (IGN) as part of their national LiDAR HD program.
Moreover, the following distinctive characteristics are considered in classifying candidate terraced slopes from the orthophoto:
- Terraces frequently form straight or gently curved lines along the slope’s contour. This includes elevated embankments or prominent margins dividing several terrace levels that might be seen as these linear features.
- Orthophotos show a series of level platforms or terraces arranged in a stair-like pattern in stepped terraces. These stairs may be a sign of terraces, especially if they match the land’s natural curves.
- Variations in vegetation cover are observed on terraces depending on how they are used and maintained. The vegetation patterns on terraces that have been well-maintained are more consistent than those on terraces that have been neglected or abandoned. This case is used as the basis for classifying candidate terraces for cultivation potential and is consequently used as part of the training data for machine learning (Table 2).
Table 2. Summary of identified terrace and non-terrace features through Remote Sensing, which serves as the training set.
- Due to changes in soil properties brought on by terrace building or maintenance activities, terraces show variances in soil color or texture from the surrounding terrain.
The candidate terraced slopes identified through RS are digitized and will be part of the terraces inventory, while the slope curvature, slope gradient, and elevation of the sites are calculated using the spatial analyst tool in ArcGIS Pro. Additionally, the zonal statistics tool is used to compute the mean slope elevation value for each zone in the orthophoto using the DTM data [3]. Using the “Raster Calculator” tool, slope elevation and slope gradient values are combined and recalculated by eliminating the range of values that are not considered terrain properties of terraced slopes as previously identified. The GIS input calculation is indicated in the equation
≪ con ((((slope gradient > minimum value) & (slope gradient < maximum value)) & (slope elevation > minimum value) & (slope elevation < maximum value)), 1, 0) ≫.
The resulting map is a binary raster where 1 signifies the terraced slopes while 0 represents the null.
Furthermore, the construction and design principles of terraces result in their characteristic positive curvature. This positive curvature actively aids in controlling water runoff by promoting even flow across each terrace level, thereby preventing excessive erosion and facilitating water retention and distribution in agricultural fields [41]. Hence, in this case, the positive curvature values calculated through the spatial analyst tool in GIS are also used to identify candidate terraced slopes.
Using the general information acquired from both geomorphologic characteristics and RS, the output is a semi-automatically detected candidate terraced feature that will be subjected to field validation.
2.5. Field Validation and Data Preparation
The inventory of semi-automatically detected candidate terraced slopes from the previous section was characterized based on their geomorphology, and their locations have been identified from RS. This data is employed during field validation to verify the actual characteristics of terraced slopes, such as slope, elevation, and geographic location, and to assess their condition on site. Three categories are determined to classify the terraced slopes based on their activity status (Figure 6):

Figure 6.
The three (3) classifications of the terraced slopes based on their activity status (a) in rest mode, (b) cultivated, (c) long abandoned (d) recently abandoned.
- Terraces that are currently “in rest mode”. These terraces are cultivated in specific seasons only. Hence, they are mainly grass fields.
- Terraces that are cultivated with plantations. These terraced slopes are occupied by olive trees, chestnuts, and even fruit trees (e.g., plums). Moreover, terraces, where greenhouses are cultivated, will also be classified under this category.
- Terraces that are currently barren or uncultivated. These are terraces that may have been abandoned and uncultivated for years. Some of these terraces may be located along higher elevations and highly steep gradient slopes or even near forested regions.
After the field validation, the essential information, such as the coordinate location, terrace status, cultivation type, etc., is encoded in the attributes of the digitized features of the semi-automatically detected candidate terraced slopes from Section 2.4.1. Moreover, the summary of classification types added to the training set is in Table 3, and assigned to the test set is in Table 4.
Table 3.
A summary of the field-identified classes was added to the training set.
Table 4.
Summary of identified classes allocated for the test set. Terraced surfaces are represented by code 1—structures, roads—2, water bodies or features (grassland for La Brigue)—3, and forested areas or trees—4.
To avoid machine confusion and biased classification during the SVM training process, the classification types of the test set are concealed using integer codes. Specifically, terraced surfaces are represented by code 1, structures and roads by 2, water bodies or features (grassland for La Brigue) by 3, and forested areas or trees by 4 (Table 4). Subsequently, the validated terraced slopes will also be divided into 70–30 partitions, where 70% of the samples will be used as the test set, and 30% will be added to the training set stipulated in Section 2.4.1.
Both the training set and the test set have been run in the ‘Training Samples Manager’ tool in ArcGIS Pro. In this process, the training sample classifiers will assign the pixel values or objects using the proposed classification schema. This classification schema indicates the labels of classes (yi) in the Support Vector Machine process, such as terraced and non-terraced regions. Premises considered, both sets will train the computer to learn to identify the portions of the study area where terraces are not occupied by any structure, plantation, vegetation cover, or forest trees. The testing set training sample output, as well as the training set training sample output, will be used in the image classification process using the Support Vector Machine learning.
2.6. Machine Learning Approach
Terrace Classification Through SVM
The training and test sets output, obtained from a previous training process (as mentioned in Section 3.2), are used as input training samples for the support vector machine process. The Support Vector Machine (SVM) classifier is accessed through the “Train Support Vector Machine Classifier” tool available in the Image Analyst module of the GIS software. The input data for this process consists of the orthophoto (high-resolution aerial image) and the Digital Elevation Model (LiDAR-based DEM) of the site under analysis. Each feature class, such as terraced and non-terraced areas, is set to a maximum of 1000 samples to ensure balanced representation during training. A total of 500 trees are performed in this process.
Once the SVM model is generated using these training samples, it undergoes careful review to identify and correct any potential errors or inaccuracies. This manual checking ensures the model’s accuracy, leveraging information from Remote Sensing data and partially from the validation data. If it is determined that further refinement is necessary before validation, the learning process can be repeated. In such cases, the primary focus should be on correcting the training samples and addressing any issues or inaccuracies identified during the manual checking stage.
The resulting model obtained by running the training samples through the SVM classification represents the semi-automatically detected terrace model for the site (terrace model). This model indicates the areas classified as terraces based on the SVM algorithm. In the evaluation of the accuracy of the terrace model, it must undergo validation. The validation process involves using the resulting model (referred to as the validation model) obtained from the SVM classification for the test sample. This validation model serves as a benchmark to assess the accuracy and reliability of the terrace model generated by the SVM.
Both the validation model and the terrace model are transformed into a binary classification scheme. In this scheme, terraced pixels are assigned a value of 1, while non-terraced pixels are assigned a value of 0. This binary classification is used to construct a confusion matrix, which enables an accurate assessment of the model’s accuracy. True positives (TPs) indicate a correct classification of terrace platforms, true negatives (TNs) indicate a correct classification of non-terrace platforms, false positives (FPs) signify an incorrect classification of non-terrace surfaces as terrace platforms, and false negatives (FNs) which denotes incorrect classification of terrace platforms as not being terrace platforms, are among the metrics included in the confusion matrix.
Although the original training dataset had an unequal number of samples across classes (e.g., 43 terraced vs. 82 non-terraced in Saorge), care was taken to reduce the effects of this imbalance during training. The maximum number of samples per class was limited to 1000, and class contributions were equalized by adjusting sampling settings in the SVM training tool. While explicit oversampling or class weighting was not applied, the model was reviewed for overfitting tendencies and adjusted accordingly.
2.7. Accuracy Assessment
Prior to the conduct of the accuracy assessment, certain representative regions were chosen within the study area. These regions were carefully selected based on actual conditions observable in the aerial photos, Digital Elevation Model (DEM), and during fieldwork. The selection ensured that the chosen areas accurately represented the diversity and characteristics of the study area. To delineate these regions, a polygon feature was created, outlining the specific areas of interest identified for accuracy assessment.
Once the polygons were defined, a specific number of stratified random points were distributed within each polygon. The purpose of stratified random sampling was to ensure a proportional distribution of points across different subregions or land cover types within the polygons, helping to capture spatial variability. The “Create Random Points” tool was employed to generate these random points independently from the training data, ensuring that the validation points were not influenced by or spatially overlapping with the data used for model training, thereby avoiding any potential bias in the assessment process.
For Saorge, a total of 1500 stratified random points were distributed within their respective polygons. For La Brigue, the total number of stratified random points was increased to 4000 to account for its larger spatial extent and to ensure comprehensive sampling coverage. Subsequently, the values derived from both the validation model and the terrace model were extracted and incorporated into the attributes of the randomly generated points using the “Extract Multi-values to Points” tool. This procedure retrieved cell values from each given input raster (i.e., classification outputs) for the point features and entered them into the attribute table. At this stage, the randomly placed points included the binary classification data from both the validation model and the terrace model (e.g., terraces that are cultivated with plantations). These data then underwent accuracy evaluation using a confusion matrix to assess classification performance.
The effectiveness of the terrace model was assessed by analyzing the confusion matrix, which enabled the determination of classification reliability. Four indices were selected to measure accuracy: user accuracy (UA), true positive rate (TPR), false positive rate (FPR), and overall accuracy (OA). These indices are widely recognized as effective metrics for evaluating classification performance, as supported by previous studies [19,27,41]. By referencing the attribute table of the random points containing the binary values for both the terrace and validation models, the classification categories—true positives (TP), false positives (FP), false negatives (FN), and true negatives (TN)—were calculated using the “Calculate Field” tool.
The following formulas were applied using the “Summary Statistics” tool to compute the respective metrics:
UA = TP/(TP + FP)
TPR = TP/(TP + FN)
FPR = FP/(FP + TN)
QP = TP/(TP + FP + FN).
These formulas provide quantitative measures to assess the performance of the terrace extraction process based on the number of TP, FP, FN, and TN obtained from the analysis.
3. Results
3.1. Semi-Automatically Detected Candidate Terraced Features
The experimental findings denote that the identified candidate terraced features through Remote Sensing and GIS processing of terrain data for Saorge exhibit slope gradients near the wall ranging from 84° to 89° while La Brigue has 86° to 89.5°, although some terrace platforms in the higher relief sections can dive a gradient range of 29° to 52° specifically the olive tree plantation slopes. Moreover, the mean slope elevation raster values where terraces persist are 130 to 136 and 78 to 89 for Saorge and La Brigue, respectively. These observations were obvious in numerous sites that were validated during the fieldwork.
Additionally, field validation also indicates that terraces are mostly situated in a higher relief region. In most of the study areas, the slope gradient is significantly modified into a moderate inclination because of the terraces. The terrace walls in this region range from 0.7 m to 1 m in height, and the steps have a measured width between 2.85 m and 3 m. The walls of the terraces are composed of riprap limestone boulders. The plateau at the top portion of this terraced landscape is occupied by residential structures. Based on the generated slope curvature model, the walls of the terraces exhibit negative curvature values, while the platforms show positive values, as indicated in Table 5.
Table 5.
Summary of terrain properties in each village as identified through geoprocessing of terrain information. Slope gradient range values indicate the threshold properties near the wall of the terraces.
The combination of slope gradient and mean elevation (applied in Equation (21)) also shows a significant footprint in mapping terraced areas (appears red hue bounded by yellow edges in the slope/elevation model). The resulting binary raster made it easier to distinguish terrace wall features from their platform. In the said raster map, the binary classification shows that values within the specified gradient and mean elevation range pertaining to the platform of the terrace have the value of 1, otherwise 0.
3.2. SVM Terrace Classification Models
The SVM analysis in Saorge indicates a significant result in detecting the terrace platform (red) and outlining the edges (yellow) that signify terrace walls. Figure 7 shows numerous areas in red and yellow that highlight such surfaces in Saorge. Features such as the forests, the roads, and even the building structures were classified as part of the non-terraced surfaces.

Figure 7.
The terrace model of Saorge. Scale: 1:20,000. Red indicates the terraces platform while yellow indicates the terraces edges.
However, most of the plantation terraced features face southwest to south, while barren and fruit plantation terraces face south to southeast. A closer look at the representative terraces for Saorge (Figure 8) shows a portion of the village center of the village where one SSW and SSE facing slopes have been highly terraced for centuries.

Figure 8.
Focusing on the three representative terraced regions for Saorge (Top). Red indicates the terraces platform while yellow indicates the terraces edges. Representative site for Saorge. (a) The aerial photograph of the landscape (b), the terrace model classified it as a terrace slope (red as the platform, black are non-terraces objects) (c), the combined slope elevation and gradient values signifying a terrace, and (d) the slope curvature of the terrace. The general view of the focused landscape is shown in the orthophoto (Figure 8a). The combined values of slope gradient and elevation are shown in Figure 8b, while the slope curvature is presented in Figure 8c, where red indicates the platform and yellow signifies the border or edges. The red color in Figure 8d represents the terrace platform bounded by walls and sharp drop edges in yellow. Moreover, other features that are incoherent with the goal of the classification process will serve as the background (black). The scale of the Saorge area in this analysis is 1:20,000.
Figure 8a shows the 1.8-hectare representative site that is detected as a highly cultivated terraced slope. This result is also coherent with the positive curvature (in red) for the said slope (Figure 8d). Moreover, terraced slopes that are also cultivated with fruits and minimal crops near the built area are also detected, but structures in the slope (terrace walls, greenhouses, etc.) are also evident as they appear black in the model (Figure 8b).
Large, distinguishable areas exhibiting linear stair-like patterns are easily detected by the machine as terraces, especially those without any objects positioned within their vicinity. Zooming into representative area 1(red outline) shows a 5.1-hectare piece of terraced land, which is evident in the model (Figure 8).
Generally, the detected terraces are mostly situated on slopes facing the southern aspect, which can be related to their intended purposes. Field validation also indicates that the walls of the terraces in Saorge are usually between 1 m to 2 m, and the platform size of around 3 m.
Moreover, the situation in La Brigue is different from Saorge as terraces are situated either on highly vegetated or high gradient slopes, as shown in the wide perspective view (Figure 9). In this area, terraces are mainly situated away from structures such as residential areas and roads. Terraces observed in the village center are maintained through crop cultivation.
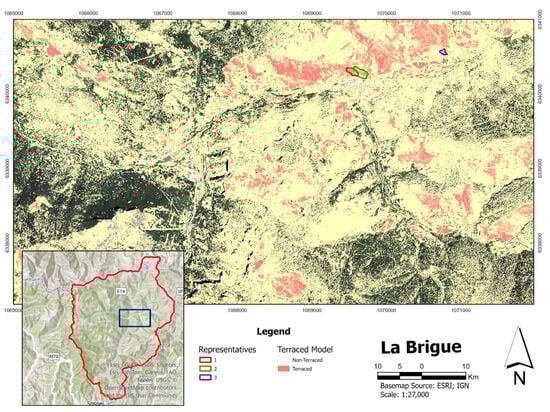
Figure 9.
The terrace model of La Brigue (site in blue on the inset map). Scale 1: 27,000. Red indicates the terraces platform while yellow indicates the terraces edges.
In addition, a focused perspective shows that terraces visible in the orthophoto imply that part of them is grassland or barren land located on extremely steep zones that typically measure between 72.1° and 86°. Although these terraces appear densely overgrown with thick vegetation in the orthophoto (Figure 10a) and even in satellite imagery such as Landsat 8 and Google Earth, field validation confirms that the area is actively maintained by local residents through regular cultivation and cropping.

Figure 10.
Representatives 1 and 2 of La Brigue, (a) The aerial photograph of the landscape, (b) the terrace model of the site, orange-red are terraces platforms; (c) the combined slope elevation and gradient values signifying a terrace property, and (d) the slope curvature of the terrace.
This has also been corroborated by the SVM terraced model of the site, indicating significant surface areas in the terrace’s platform that would be suitable for construction or use in agriculture (Figure 10b).
Although the slope and elevation factor model presents the outline of the terraces in the slope (Figure 10c), the slope curvature created the most obvious indication of the existence of the terrace, as the platform depicts positive curvature even though the width is less in comparison to that in Saorge (Figure 10d).
The SVM classification was performed using the Radial Basis Function (RBF) kernel, which is the default configuration within the ArcGIS Pro classification tool. This kernel was selected for its strong ability to handle non-linear class boundaries and effectively model complex spatial patterns, particularly in heterogeneous terrains such as mountainous Mediterranean environments. Preliminary trials comparing RBF with a linear kernel showed a noticeable drop in classification accuracy, particularly in areas with rugged topography and dense vegetative cover. Consequently, the RBF kernel was deemed the most suitable for accurately delineating terrace platforms under these conditions.
3.3. Model Accuracy
The representative sites for each village that were presented in the previous section, that was used in the accuracy testing, represent the actual terraces situation of the terraces in the village of study. These terraces were either barren or in “rest mode”, a fruit plantation, or a combination of both. Other features in the area, such as structures, water, trees, and even grassland (apart from grass-covered terraces), were classified by the model as non-terrace features and hence appear as black in the binary classification scheme. The Support Vector Machine learning-based terrace extraction approach has high generalization capabilities for the extraction of terraces under various complicated contexts and can quickly identify terrace platform areas that might be readily available for cultivation.
Table 6 illustrates the accuracy ratings of the terraces in the Support Vector Machine learning approach. The said approach yielded proper terrace area proportions that, in Saorge and La Brigue, respectively, account for 97% and 74% of the real terraced areas. The overall accuracy of the two communities’ models ranges from 72% to 90%. However, the indices show only slight differences between the models for each hamlet, suggesting that the SVM approach is well-suited for the study area.
Table 6.
Performance of the machine learning-based approach based on the Support Vector Classification.
Finally, the user’s Accuracy (UA), also known as Precision, indicates the probability that a pixel classified as a terrace is indeed a terrace in the reference data. It is calculated by dividing the number of true positives by the sum of true and false positives.
4. Discussion
4.1. Terraces Models
The methodology developed and applied for the selected villages in the Roya Valley area has demonstrated efficiency in different environments (e.g., vegetated and steep slopes). It enables to identification and location of terrace platforms that could potentially be utilized for agricultural purposes.
Results confirmed that the SVM excels at accurately classifying data, even when the data is complicated and noisy and there is only limited training data available. Consequently, the terrace model we created for the selected villages in the Roya Valley region closely resembles the actual situation on the ground. The precision rates for Saorge and La Brigue terrace models are 97% and 74%, respectively. This method surprisingly detected terraced slopes regardless of the dimensions, such as the terrace wall height and as well as the presence of vegetation covers (explicit to the orthophoto), as compared to the methods used by [12] where a specific method, as mentioned in Section 2, can only be applied under certain geomorphological setting. However, it is also important to note that this method might also be classified as a non-terraced slope due to overfitting during the simulation, especially if the resolution of the images and DEM is high enough that it captures noise and details that do not generalize to unseen information [42]. Hence, improvement of the model accuracy, especially the feature selection, scaling, choice of kernel, and even multiple cross-validations must be frequently carried out to develop the best presentation of the terraced slopes model.
Consequently, the study area’s geological complexity, consisting of limestone and metamorphic rocks, explains why the detected terraces that are typically found near villages are usually on high-gradient terrains. Cultivating steep slopes near these villages is more accessible for farmers. Additionally, the LiDAR-based DEM data supports our findings by indicating a scarcity of terraced slopes in areas with dense vegetation, such as forests.
Table 7 provides a summary of the information regarding the detected terraces in Saorge and La Brigue. Most of the identified terrace platforms have an area smaller than 1 hectare. However, there are eighteen terraces identified as having an area exceeding 1 hectare, which includes the slopes that have the potential to be utilized for agricultural purposes.
Table 7.
The summary of terrace information at selected Roya Valley villages.
These terraces collectively cover an area of 15.99 hectares, with an average size of 1.93 hectares. The detection terrace model employed in our study is capable of sophisticatedly identifying surface features or objects that are not part of the actual terrace platform. These features can include houses, roads, and even trees that surround or are located within the terraces.
The eastern slopes of Saorge village center are primarily occupied by terraces that have been utilized for cultivating fruits and crops. Figure 8 provides a visual representation of a terraced slope that is divided by a road structure. The sections of the terrace walls adjacent to the road have experienced collapse, mainly due to inadequate maintenance, as depicted in Figure 8a. Moreover, the downslope area of the terrace, situated below the road, currently lacks any cultivation activities, as shown in Figure 8b. In contrast, the neighboring slope consists of terraces dedicated to fruit plantations, as depicted in Figure 8c.
Furthermore, the town center of La Brigue is in a sharply carved river valley, resulting in many of its agricultural terraces being located along the mid-slopes close to the village. These terraces clearly show indications of farming activities carried out by the local inhabitants (Figure 9). An estimated 5.03 km2 or 503 hectares of the 31.98 km2 total modeled area are designated as terraces, according to the La Brigue terrace model. Thirty-five of these terraces have a surface area of more than one hectare, totaling 172.61 hectares with an average area of 4.93 hectares.
Additionally, the detected terraces in La Brigue share similarities with those found in Saorge villages in terms of slope aspect. Many of the identified terraces face southeast, towards the river channel. This aspect might be influenced by the amount of annual precipitation received by the slope. The distinct characteristics and distribution patterns of terraces in La Brigue, including their proximity to the village center and the prevalence of southeast-facing slopes, contribute to a unique landscape that reflects the local agricultural practices and environmental conditions.
Furthermore, the disparity in classification accuracy between Saorge and La Brigue can be attributed not only to differences in mapping scale but also to distinct geomorphological and environmental factors. La Brigue exhibits a more intricate terrain morphology characterized by steeper slopes, sharper valley incisions, and more rugged mid-slopes compared to Saorge. Additionally, denser vegetation cover in certain areas of La Brigue likely obscured terrace features, complicating their identification in both orthophotos and LiDAR data. These site-specific geomorphological complexities, combined with subtle differences in data acquisition conditions, such as shadowing and seasonal canopy variations, contributed to increased misclassification rates and explain the comparatively lower accuracy observed in La Brigue.
4.2. Accuracy Validation of the Terrace Model
The evaluation of terrace detection accuracy frequently uses the visual interpretation of high-resolution photos as reference data [29,36,43,44]. Terraces are visible in high-resolution photos, allowing for adequate recognition in field surveys. As a result, considering the results of terrace identification obtained from visual interpretation using high-precision images and aligning them with the terrace distribution observed during field surveys ensures a reliable reference dataset [29,38,43].
The accuracy testing of terrace detection using Support Vector Machine (SVM) data yielded the following results, offering important insights into how well the classification system performs in the selected locations: Saorge and La Brigue. The likelihood that a pixel labeled as a terrace is indeed a terrace is given by the User’s Accuracy (UA) measure. Saorge showed a higher precision of 97%, indicating superior accuracy in identifying terraces. La Brigue, in comparison, showed a UA of 72%, showing less accuracy in recognizing terraces than the other places. Moreover, the percentage of terraces that are correctly identified as terraces is known as the True Positive Rate (TPR). A significant TPR value of 86% was seen in Saorge, while La Brigue’s terraced model has a TPR of 77%, demonstrating an acceptable degree of effectiveness in capturing terraced regions in the dataset. The proportion of non-terrace pixels that are incorrectly categorized as terraces is shown by the False Positive Rate (FPR). The FPR for Saorge showed a 12% FPR, which suggests a superior capacity for avoiding false positives. Moreover, with an FPR of 34%, La Brigue had the highest rate of misclassification in comparison to the other locations. To further assess potential overfitting and the generalizability of the SVM classification models, a 5-fold cross-validation was conducted on the training datasets for both villages. The cross-validation results yielded average accuracies of 84.6% (±2.1) for Saorge and 70.3% (±3.4) for La Brigue. These findings align closely with the original accuracy assessments, suggesting that while slight overfitting may occur, particularly in Saorge due to the higher resolution capturing minor features, the classification models remain acceptably robust. These results reinforce the model’s applicability in similar Mediterranean mountainous environments, though future validation using independent datasets from neighboring areas (e.g., Fontan, Breil-sur-Roya) is recommended to further evaluate generalizability.
Finally, a thorough evaluation of the performance of the classification method is provided by the Overall Accuracy (OA). Saorge SVM terrace model has an OA of 87%, indicating a somewhat remarkable performance, while La Brigue SVM terrace model demonstrated a 72% accuracy across the board, indicating a slightly lower accuracy in identifying terraces in the dataset.
4.3. Scale Versus Accuracy
The information on the performance of the classification algorithm at Saorge and La Brigue is provided by the results of the accuracy testing of terrace detection using Support Vector Machine (SVM) information. Saorge and La Brigue had the best scales for the data utilized for the analysis, with a scale of 1:20,000 and 1:27,000, respectively. The precision and resolution of terrace detection may be impacted by the scale disparity. Terraced regions can typically be better defined and identified on a finer scale.
The accuracy of the SVM model, however, may have been impacted by a few factors, such as the spatial variability of the observed topographical features (e.g., terraces). The lower accuracy may have resulted from the loss of fine-grained characteristics brought on by a too-wide area or the coarse resolution of the provided data (i.e., La Brigue). On the other hand, if the scale is too small or the data resolution is too high, too much noise or unimportant information may have been recorded, leading to overfitting and reduced accuracy (i.e., Saorge). Furthermore, the other factors to consider are the object size and the context of the training data. The size and contextual information of the objects to be identified might have also been impacted by the area’s scale. For instance, if the scope is too small, it may be difficult to distinguish between individual terrace segments, which could result in incorrect classification or the merger of adjacent terraces (as such, the case for La Brigue). On the other hand, smaller or fragmented terraces may be disregarded or categorized as other land cover types if the scale is too big.
Finally, the availability and processing of the input training data may have been affected by the scale of the area that SVM modeling covers, as it is extremely taxing and expensive to process high-resolution data for broad areas. Additional issues with data acquisition and preprocessing, such as variations in sensor qualities, delays in data capture, and constraints on data consistency, may emerge when working with large-scale datasets.
4.4. Limitations and Prospects
While the methodology developed in this study proved effective for identifying terraced areas in the Roya Valley, a few limitations are worth noting. First, the analysis used datasets acquired in different years: LiDAR HD data from IGN was collected between 2021 and 2023, while the orthophotos were from 2020. This temporal discrepancy may have led to the exclusion of terraces constructed after the acquisition of the orthophotos or LiDAR data. Given that land use in mountainous areas such as Saorge and La Brigue may change relatively quickly due to natural processes or human interventions (e.g., restoration, abandonment, or conversion), this may have introduced inconsistencies during the mapping and classification process. In future studies, synchronized multi-source data acquisition is recommended to ensure temporal consistency and reduce this potential source of error.
Another limitation is the imbalance in class samples during the training phase, which may affect the model’s ability to generalize, especially in regions with fewer terraced features. While basic sample balancing settings were applied, future work could benefit from synthetic oversampling methods (e.g., SMOTE) or integrating cost-sensitive SVMs to enhance the classification of underrepresented classes.
Moreover, the limited scope of field validation is another limitation that focuses mostly on accessible areas near villages. Broader ground-truthing across more remote slopes would strengthen the model’s reliability. The SVM classifier also showed signs of overfitting in some cases, especially where high-resolution data captured noise or small features not relevant to terrace detection. Fine-tuning the model, including feature selection and kernel adjustment, will be essential for improving future accuracy. Looking ahead, combining LiDAR and orthophoto data from multiple years could help track terrace changes over time. Adding vegetation indices such as NDVI from multispectral images may also improve the distinction between cultivated and abandoned terraces. Finally, exploring hybrid models that combine machine learning and deep learning approaches could boost detection in complex landscapes. Overall, while there are areas for improvement, this study lays a strong foundation for scalable terrace mapping in other mountainous or Mediterranean regions.
5. Conclusions
This research developed a semi-automatic method for detecting and mapping terrace areas in the Roya Valley region of Southeast France using LiDAR, orthophotos, and machine learning techniques. It aimed to enhance our understanding of terrace dispersion and estimate its extent. While various terrace detection methods exist, few utilize robust tools capable of handling complex and noisy data. This study applied a Support Vector Machine (SVM) to recognize terrace platforms in the Roya Valley, specifically in Saorge and La Brigue. Accuracy tests showed that the terrace model for Saorge outperformed that of La Brigue, demonstrating the effectiveness of the SVM algorithm. These results highlight the importance of considering scale, kernel selection, and site-specific characteristics to optimize classification accuracy. To further improve terrace detection across diverse geographic settings, refining the SVM technique and integrating sensitivity analysis for scale selection are essential. Careful evaluation of terrain characteristics, data availability, and processing resources will enhance model precision. In conclusion, this study introduced a semi-automatic detection approach that effectively identifies and maps terrace sites for agricultural purposes. The findings underscore the significance of scale and site-specific factors in terrace detection and emphasize the need for ongoing improvements to the SVM methodology. Future research should refine the approach to ensure adaptability across varying landscapes, ultimately enhancing terrace classification accuracy. Furthermore, this study underscores the utility of SVM-based terrace detection models for mountainous Mediterranean landscapes, achieving promising accuracy levels. Future research should prioritize cross-validation against independent datasets, integration of multispectral and temporal data for vegetation analysis, and experimentation with hybrid machine learning models. These efforts would enhance model transferability and support landscape restoration, sustainable agriculture, and hazard risk management initiatives.
6. Patents
This section is not mandatory but may be added if there are patents resulting from the work reported in this manuscript.
Author Contributions
Conceptualization, M.V.T. and S.B.; Methodology, M.V.T.; Software, M.V.T., S.B. and K.E.; Validation, M.V.T., S.B. and K.E.; Formal analysis, M.V.T., S.B. and K.E.; Investigation, M.V.T.; Resources, S.B. and K.E.; Data curation, M.V.T., S.B. and K.E.; Writing—original draft preparation, M.V.T.; Writing—review and editing, M.V.T., S.B. and K.E.; Visualization, M.V.T.; Supervision, S.B.; Project administration, S.B. and K.E.; Funding acquisition, K.E. All authors have read and agreed to the published version of the manuscript.
Funding
The authors declare that this research was partially funded by the Fondation de France through the project Cultures en terrases (https://www.terrassesroya.eu).
Institutional Review Board Statement
Not applicable. This study did not involve humans or animals in its methodology and therefore did not require approval by an Institutional Review Board or ethics committee.
Informed Consent Statement
This study did not involve human participants, human data, or human tissue. Therefore, informed consent was not required.
Data Availability Statement
The data supporting the findings of this study are available from the principal and corresponding authors upon reasonable request.
Acknowledgments
The authors would like to express their sincere gratitude to Dennis Fox, Director of the Risk program at Université Côte d’Azur, for his invaluable support throughout this internship research. They also extend their appreciation to UMR-ESPACE CNRS-OTECCA for providing the necessary funding that made this study possible. Additionally, I am grateful to Sofiya Letyago for her invaluable assistance during the fieldwork, which greatly contributed to the success of this research.
Conflicts of Interest
The authors declare that there are no known competing financial or non-financial interests or personal relationships that could have appeared to influence the work reported in this manuscript. Furthermore, the research was conducted independently, and no external funding agencies, commercial entities, or personal affiliations have influenced the study’s design, data collection, analysis, or interpretation of results. Any potential conflicts of interest that may arise in the future will be disclosed accordingly. Should there be any undisclosed conflicts, the authors affirm their commitment to addressing them in accordance with the journal’s ethical guidelines.
Abbreviations
The following abbreviations are used in this manuscript:
| CNN | Convolutional Neural Network |
| DEM | Digital Elevation Model |
| DSM | Digital Surface Model |
| GIS | Geographic Information System |
| IGN | Institut National de l’Information Géographique et Forestière |
| LiDAR | Light Detection and Ranging |
| RS | Remote Sensing |
| SVM | Support Vector Machine |
| TLS | Terrestrial Laser Scanner |
References
- Kanevski, M.; Pozdnoukhov, A.; Timonin, V. Machine Learning Algorithms for Geospatial Data. Theory, Applications, and Software Tools. In Proceedings of the 4th International Congress on Environmental Modelling and Software, Barcelona, Spain, 7–10 July 2018. [Google Scholar]
- Dorren, L.; Rey, F. A Review of the Effect of Terracing on Erosion. Soil Conservation and Protection for Europe. Available online: https://www.ecorisq.org/docs/Dorren_Rey.pdf (accessed on 9 April 2023).
- Spanò, A.; Sammartano, G.; Calcagno Tunin, F.; Cerise, S.; Possi, G. GIS-based detection of terraced landscape heritage: Comparative tests using regional DEMs and UAV data. Appl. Geomat. 2018, 10, 77–97. [Google Scholar] [CrossRef]
- Khan, S.; Shabbir, R.; Iqbal, M.S. Historical terraces: A sustainable land management practice for enhancing agricultural productivity in mountainous areas. Sustainability 2019, 11, 6184. [Google Scholar]
- Pascual, C.; García-Mollá, M.; Alcaraz-Segura, D. Hyperspectral image classification using support vector machine: A spectral-spatial feature-based approach. Evol. Intell. 2017, 15, 1809–1823. [Google Scholar]
- Sergieieva, K. Terrace Farming Purpose, Benefits, And Common Types. Agricultural Practices—EOS Data Analytics 2021. Available online: https://eos.com/blog/terrace-farming/ (accessed on 30 May 2023).
- Gardner, R.A.M.; Gerrard, A.J. Runoff and soil erosion on cultivated rainfed terraces in the Middle Hills of Nepal. Appl. Geogr. 2003, 23, 23–45. [Google Scholar] [CrossRef]
- Dumbrovský, M.; Sobotková, V.; Šarapatka, B.; Chlubna, L.; Váchalová, R. Cost-effectiveness evaluation of model design variants of broad-base terrace in soil erosion control. Ecol. Eng. 2014, 68, 260–269. [Google Scholar] [CrossRef]
- Godone, D.; Giordan, D.; Baldo, M. Rapid mapping application of vegetated terraces based on high resolution airborne LiDAR. Geomatics. Nat. Hazards Risk 2018, 9, 970–985. [Google Scholar] [CrossRef]
- Henry, B.K.; Murphy, B.W.; Cowie, A. Sustainable Land Management for Environmental Benefits and Food Security. In A Synthesis Report for the GEF; GEF: Washington DC, USA, 2019. [Google Scholar] [CrossRef]
- Trischitta, D. Il Paesaggio Terrazzato. Un Patrimonio Geografico, Antropologico, Architettonico, Agrario, Ambientale; Città del Sole Edizioni: Reggio Calabria, Italy, 2005; p. 248. ISBN 88-7351-063-9. [Google Scholar]
- Sofia, G.; Bailly, J.S.; Chehata, N.; Tarolli, P.; Levavasseur, F. Comparison of Pleiades and LiDAR Digital Elevation Models for Terraces Detection in Farmlands. IEEE J. Sel. Top. Appl. Earth Obs. Remote Sens. 2016, 9, 1567–1576. [Google Scholar] [CrossRef]
- Stanchi, S.; Freppaz, M.; Agnelli, A.; Reinsch, T.; Zanini, E. Properties, best management practices and conservation of terraced soils in Southern Europe (from Mediterranean areas to the Alps): A review. Quat. Int. 2012, 265, 90–100. [Google Scholar] [CrossRef]
- Malassis, L. Les systèmes alimentaires. Écon. Rural. 1994, 222, 6–14. [Google Scholar]
- Parc Naturel Régional Queyras. Paysages de Terrasses Quel(s) Avenir(s)? 2014. Available online: https://www.pnr-queyras.fr/ecmedias/2019/02/2014-12-pochetteterrasses.pdf (accessed on 15 April 2023).
- Concertation sur L’avenir des Vallées (Préfecture des Alpes Maritimes). Diagnostic Territorial des Vallées de la Roya, de la Vésubie, de la Tinée et du Moyen Var. 2022. Available online: https://www.alpes-maritimes.gouv.fr/actualites/concertation-citoyenne-pour-l-avenir-des-vallees (accessed on 12 April 2023).
- ADEME. Diagnostic du Système Alimentaire de la Région Provence-Alpes-Côte d’Azur, de sa Durabilité et de sa Résilience. 2022. Available online: https://librairie.ademe.fr/changement-climatique/5411-diagnostic-du-systeme-alimentaire-de-la-region-provence-alpes-cote-d-azur-de-sa-durabilite-et-de-sa-resilience.html (accessed on 1 June 2023).
- Pérez-Alberti, A. Cartography of the Terraces (socalcos) in Galicia (Northwest Spain): An Original Approach. J. Terraced Landsc. 2022, 1, 8–33. [Google Scholar] [CrossRef]
- Morgan, K.; Sonnino, R. The urban foodscape: World cities and the new food equation. Camb. J. Reg. Econ. Soc. 2010, 3, 209–224. [Google Scholar] [CrossRef]
- Rocha, C.; Lessa, I. Urban Governance for Food Security: The Alternative Food System in Belo Horizonte, Brazil. Int. Plan. Stud. 2009, 4, 389–400. [Google Scholar] [CrossRef]
- Morgan, K. Nourishing the city: The rise of the urban food question in the Global North. Urban Stud. 2015, 52, 1379–1394. [Google Scholar] [CrossRef]
- Zhao, F.; Xiong, L.Y.; Wang, C.; Wang, H.R.; Wei, H.; Tang, G.A. Terraces mapping by using deep learning approach from remote sensing images and digital elevation models. Trans. GIS 2021, 25, 2438–2454. [Google Scholar] [CrossRef]
- ALPTER. Terraced landscapes of the Alps. In ALPTER Project 2008, 1st ed.; Scaramellini, G., Varotto, M., Eds.; ALPTER: Räni, Estonia, 2008; Volume 10, p. 3. Available online: https://www.alpter.net/ (accessed on 30 April 2023).
- Evans, I.S. An integrated system of terrain analysis and slope mapping. Z. Geomorphol. 1980, 36, 274–295. [Google Scholar]
- Tarolli, P. High-resolution topography for understanding Earth surface processes: Opportunities and challenges. Geomorphology 2014, 216, 295–312. [Google Scholar] [CrossRef]
- Sofia, G.; Pirotti, F.; Tarolli, P. Variations in multiscale curvature distribution and signatures of LiDAR DTM errors. Earth Surf. Process. Landf. 2013, 38, 1116–1134. [Google Scholar] [CrossRef]
- Zhang, K.; Wang, J.; Lin, Y.; Lin, W. Terraced Structure Extraction in Hilly Areas Based on Machine Learning. Remote Sens. 2018, 10, 890. [Google Scholar]
- Liu, L.; Li, Z.; Zhang, C.; Li, J. Deep Learning for Automatic Extraction of Terraces from High-Resolution Remote Sensing Imagery. IEEE J. Sel. Top. Appl. Earth Obs. Remote Sens. 2020, 13, 5893–5905. [Google Scholar]
- Cardoso-Fernandes, J.; Teodoro, A.C.; Lima, A.; Roda-Robles, E. Semi-automatization of support vector machines to map lithium (Li) bearing pegmatites. Remote Sens. 2020, 12, 2319. [Google Scholar] [CrossRef]
- Mjolsness, E.; DeCoste, D. Machine Learning for Science: State of the Art and Future Prospects. Science 2001, 293, 2051–2055. [Google Scholar] [CrossRef] [PubMed]
- Guo, Q.; Kelly, M.; Graham, C.H. Support vector machines for predicting the distribution of Sudden Oak Death in California. Ecol. Model. 2005, 182, 75–90. [Google Scholar] [CrossRef]
- Wu, Y.; Vapnik, V.N. Statistical Learning Theory. Technometrics 1999, 41, 377. [Google Scholar] [CrossRef]
- Dasari, K.; Lokam, A. Exploring the Capability of Compact Polarimetry (Hybrid Pol) C Band RISAT-1 Data for Land Cover Classification. IEEE Access 2018, 6, 57981–57993. [Google Scholar] [CrossRef]
- Xiao, P.; Li, H.; Yang, Y.; Wang, L.; Wang, X. Land-Use Changes in China During the Past 30 Years. In Land-Use Changes in China; World Scientific: London, UK, 2019; pp. 11–49. [Google Scholar] [CrossRef]
- Pathak, D.K.; Kalita, S.K.; Bhattacharya, D.K. Hyperspectral image classification using support vector machine: A spectral spatial feature-based approach. Evol. Intell. 2022, 15, 1809–1823. [Google Scholar] [CrossRef]
- Abe, S. Support Vector Machines for Pattern Classification; Springer: London, UK, 2010. [Google Scholar] [CrossRef]
- Xu, H.; Hu, X.; Guan, H.; Zhang, B.; Wang, M.; Chen, S.; Chen, M. A Remote Sensing Based Method to Detect Soil Erosion in Forests. Remote Sens. 2019, 11, 513. [Google Scholar] [CrossRef]
- Melgani, F.; Bruzzone, L. Classification of hyperspectral remote sensing images with support vector machines. IEEE Trans. Geosci. Remote Sens. 2004, 42, 1778–1790. [Google Scholar] [CrossRef]
- Martz, L.W.; Brown, L.C. Design guidelines for soil erosion prevention channels associated with terraced lands. Soil Sci. Soc. Am. J. 1997, 61, 1843–1850. [Google Scholar]
- Wood, J.D. The Geomorphological Characterisation of Digital Elevation Models; University of Leicester: Leicester, UK, 1996. [Google Scholar]
- Borna, K.; Moore, A.B.; Sirguey, P. An intelligent geospatial processing unit for image classification based on geographic vector agents (GVAs). Trans. GIS 2016, 20, 368–381. [Google Scholar] [CrossRef]
- Brownlee, J. How to Identify Overfitting Machine Learning Models in Scikit-Learn. 2020. Available online: https://MachineLearningMastery.com (accessed on 3 May 2023).
- Martínez-Casasnovas, J.A.; Ramos, M.C.; Cots-Folch, R. Influence of the EU CAP on terrain morphology and vineyard cultivation in the Priorat region of NE Spain. Land Use Policy 2010, 27, 11–21. [Google Scholar] [CrossRef]
- Diaz-Varela, R.A.; Zarco-Tejada, P.J.; Angileri, V.; Loudjani, P. Automatic identification of agricultural terraces through object-oriented analysis of very high resolution DSMs and multispectral imagery obtained from an unmanned aerial vehicle. J. Environ. Manag. 2014, 134, 117–126. [Google Scholar] [CrossRef]
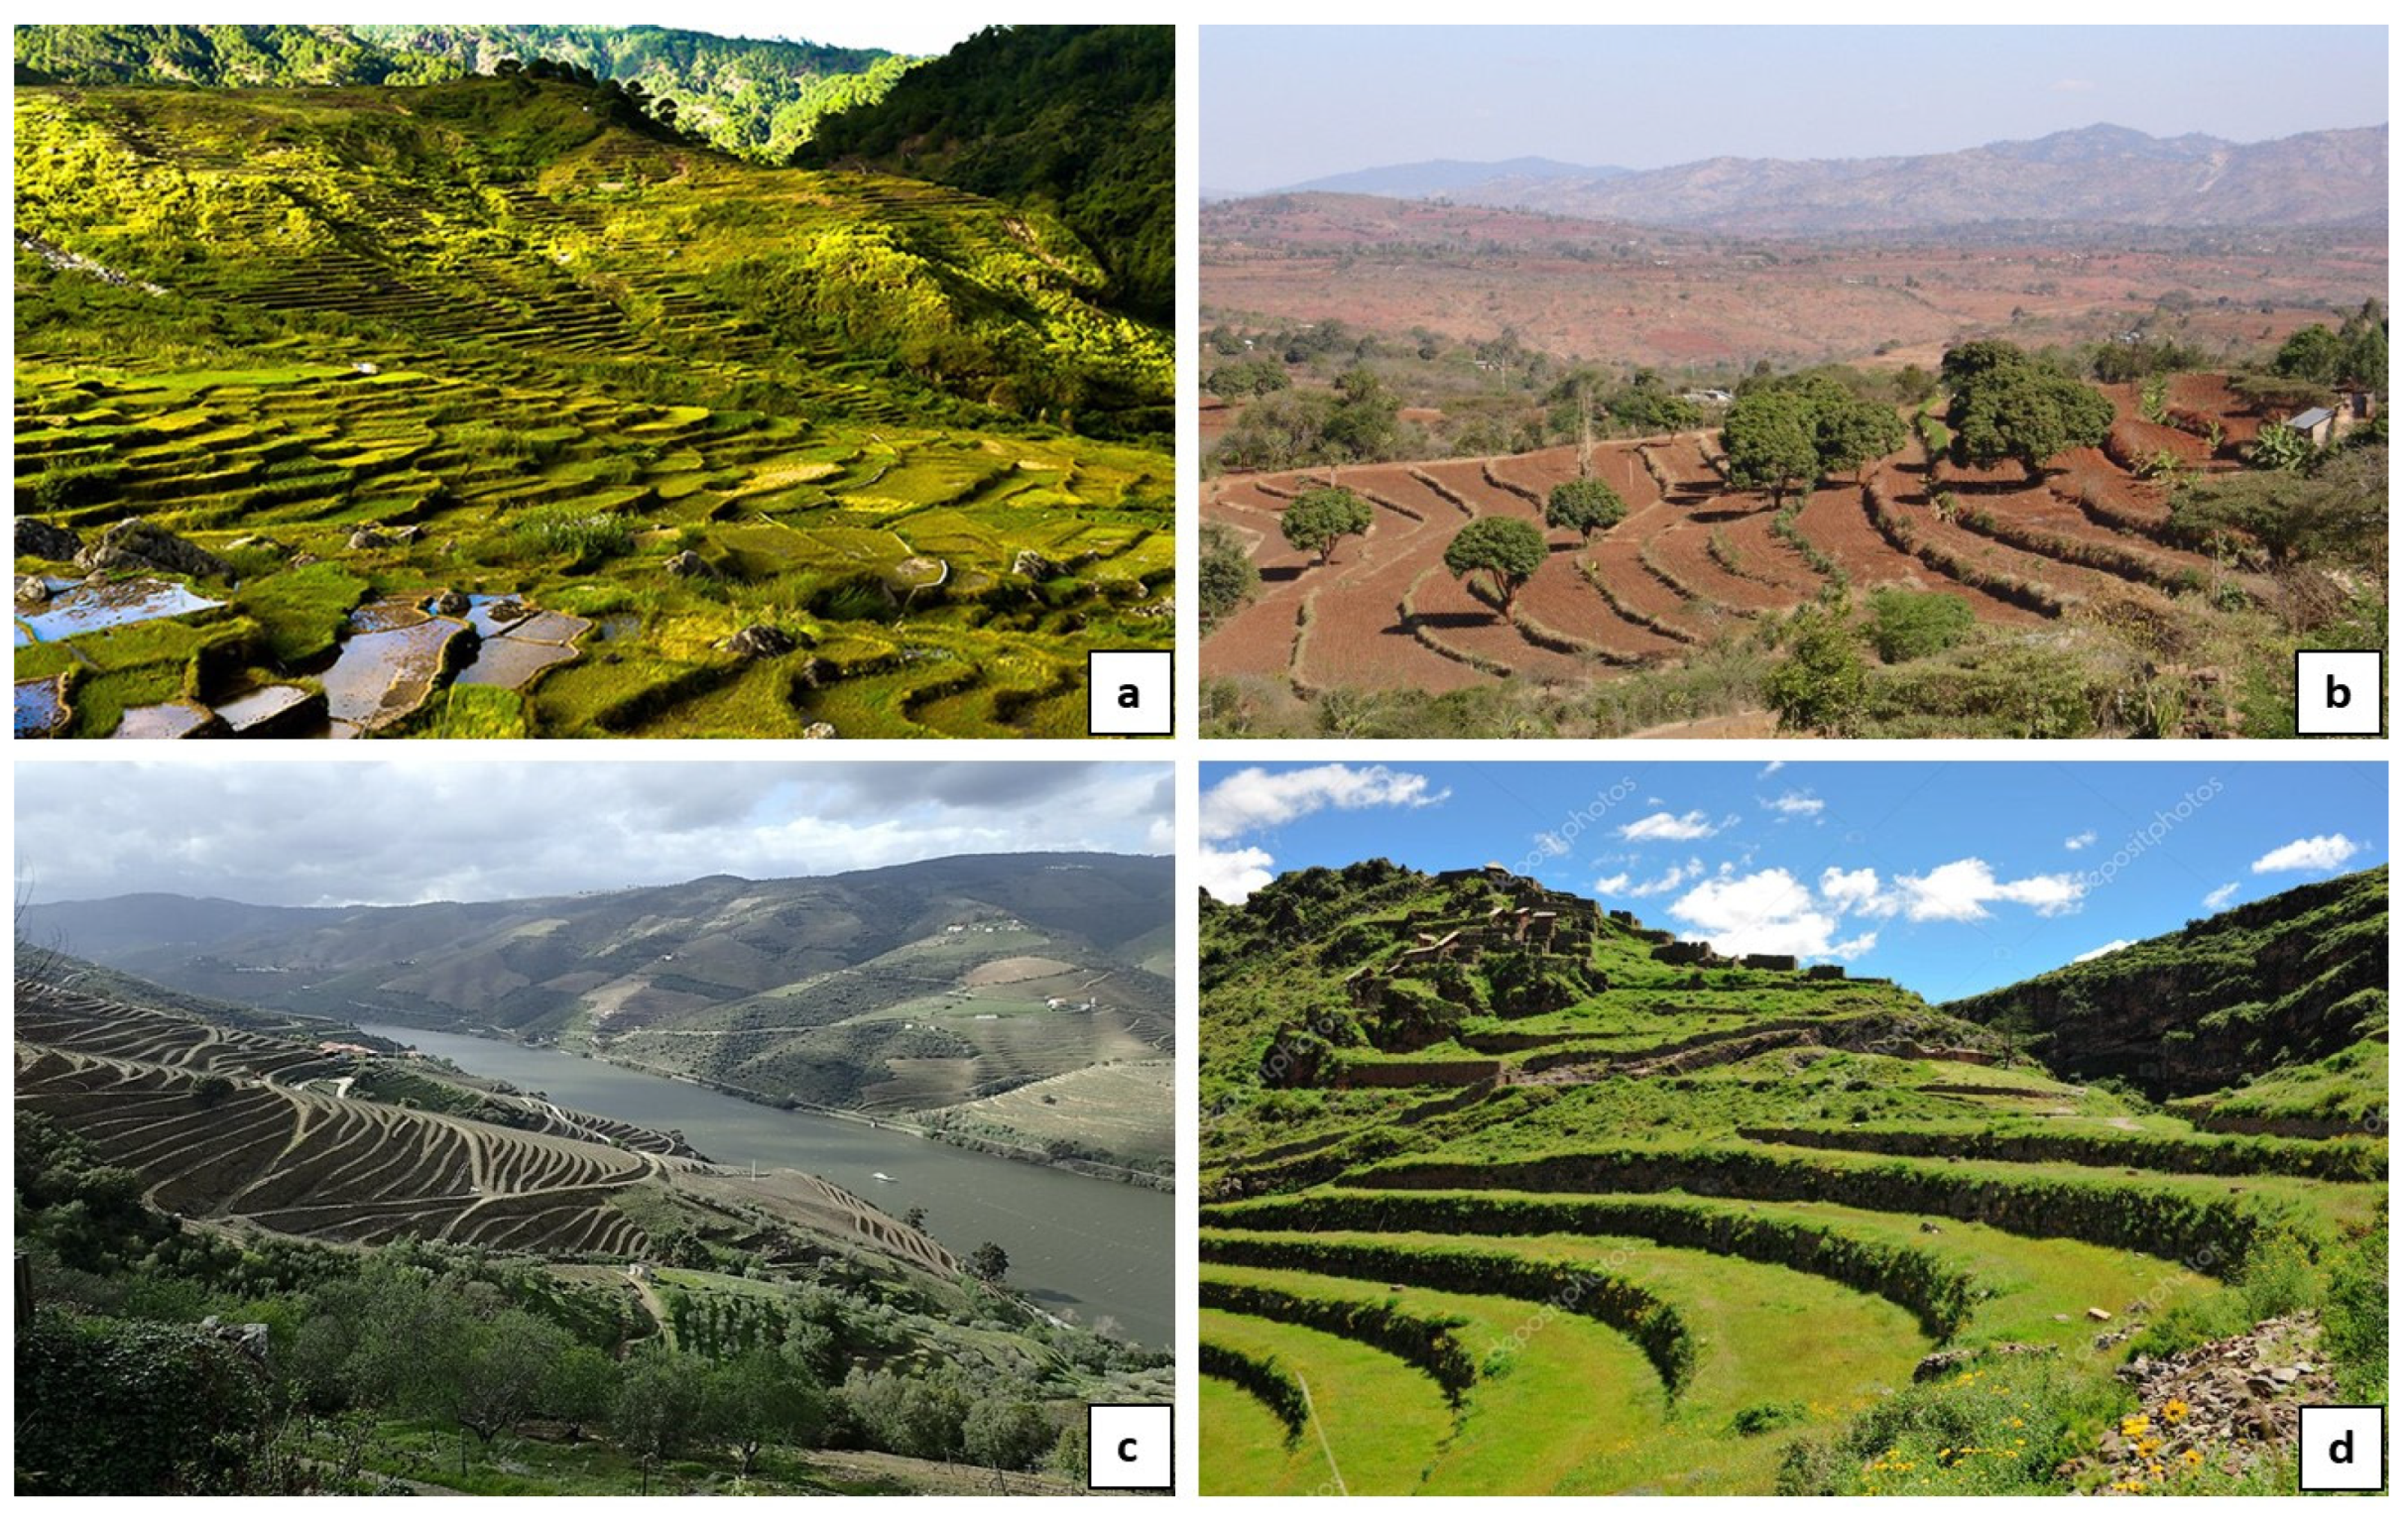
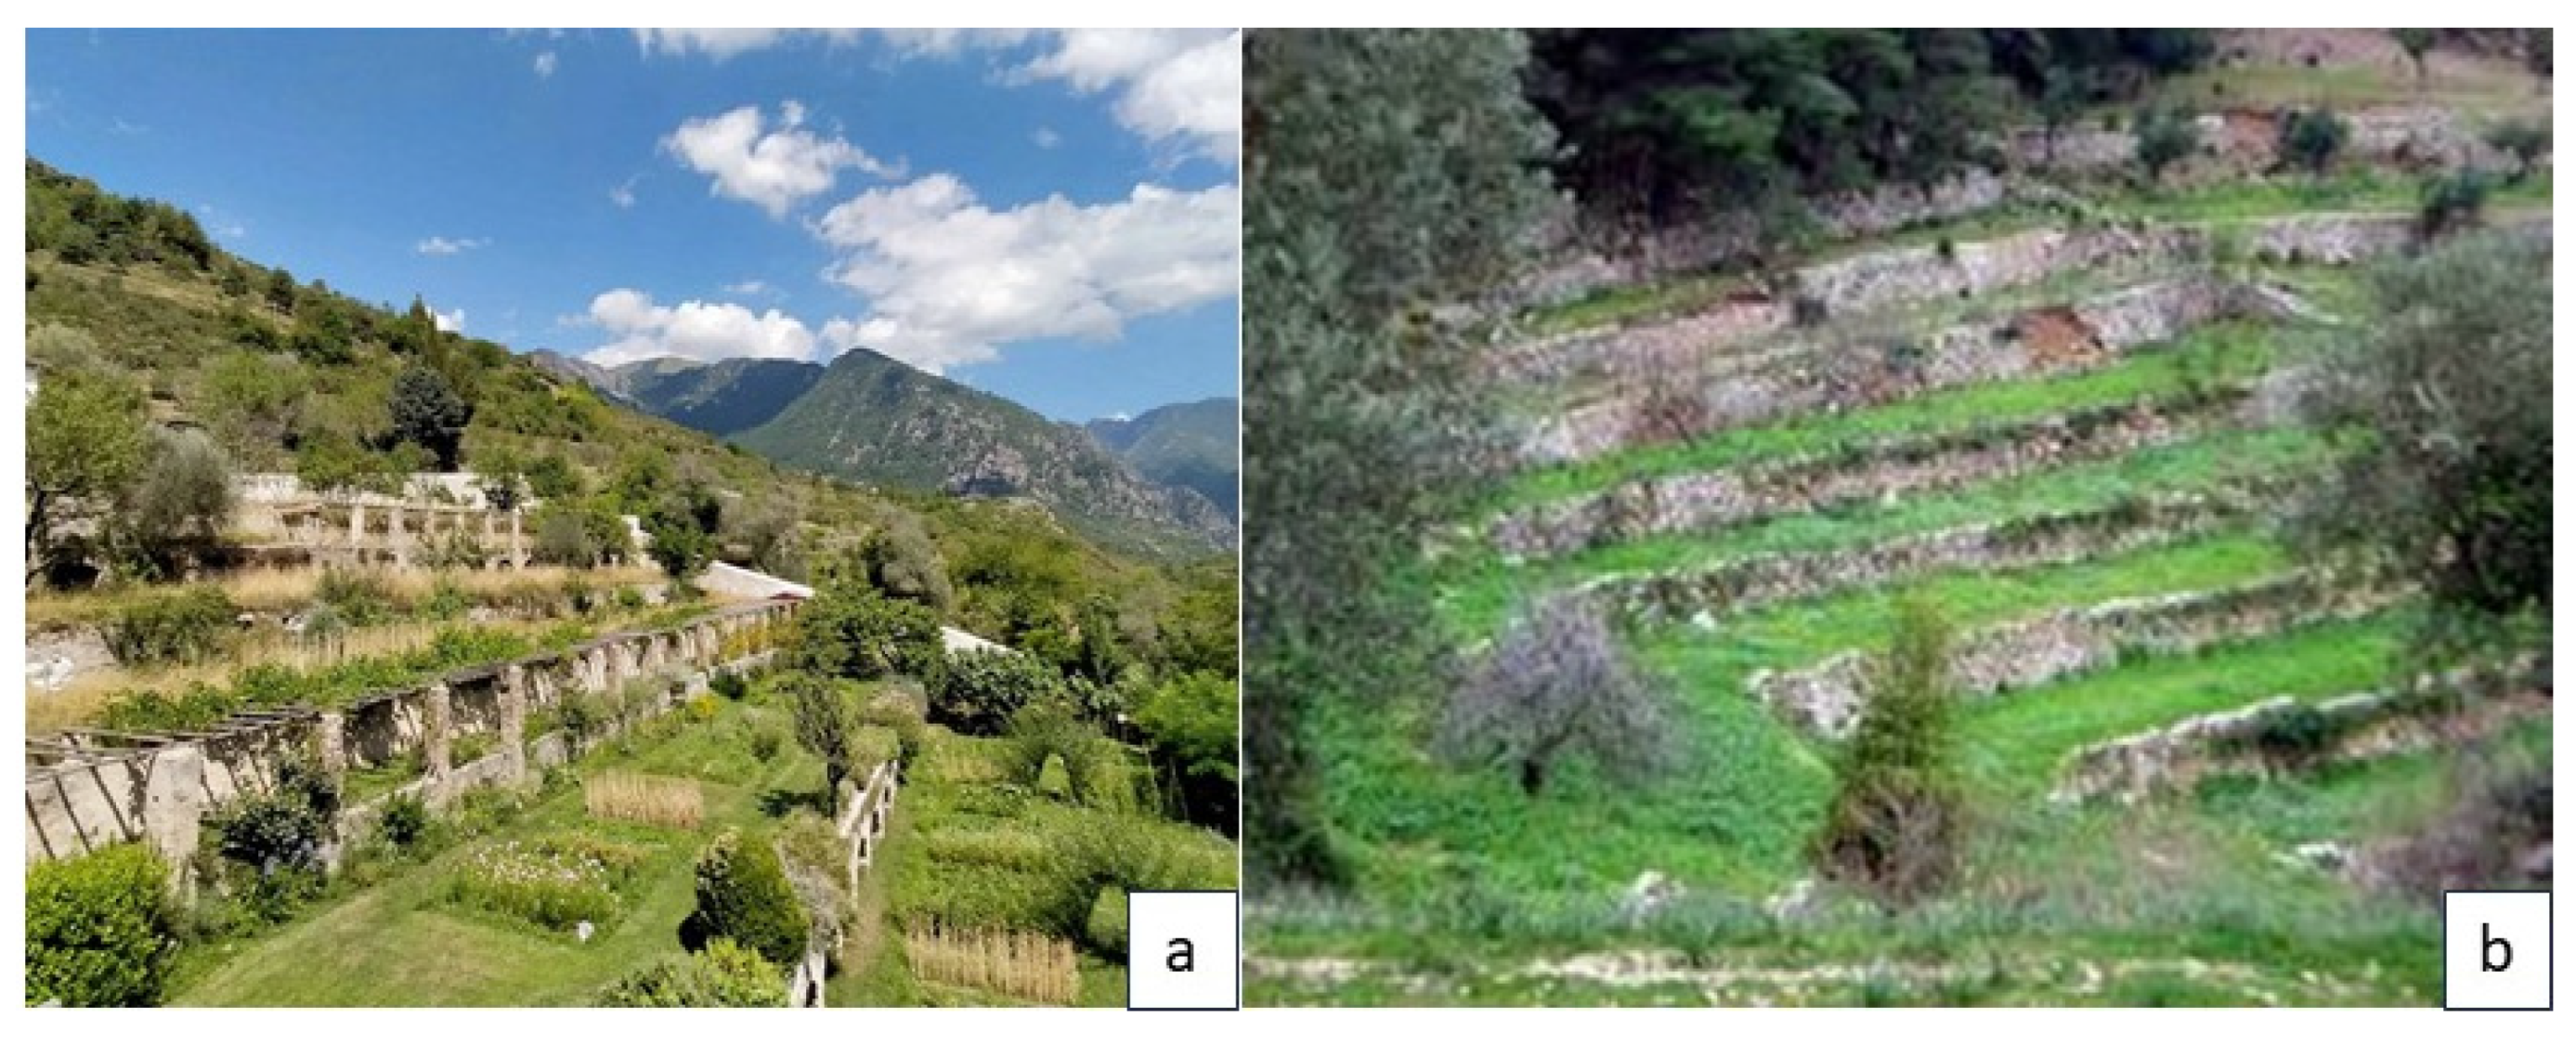
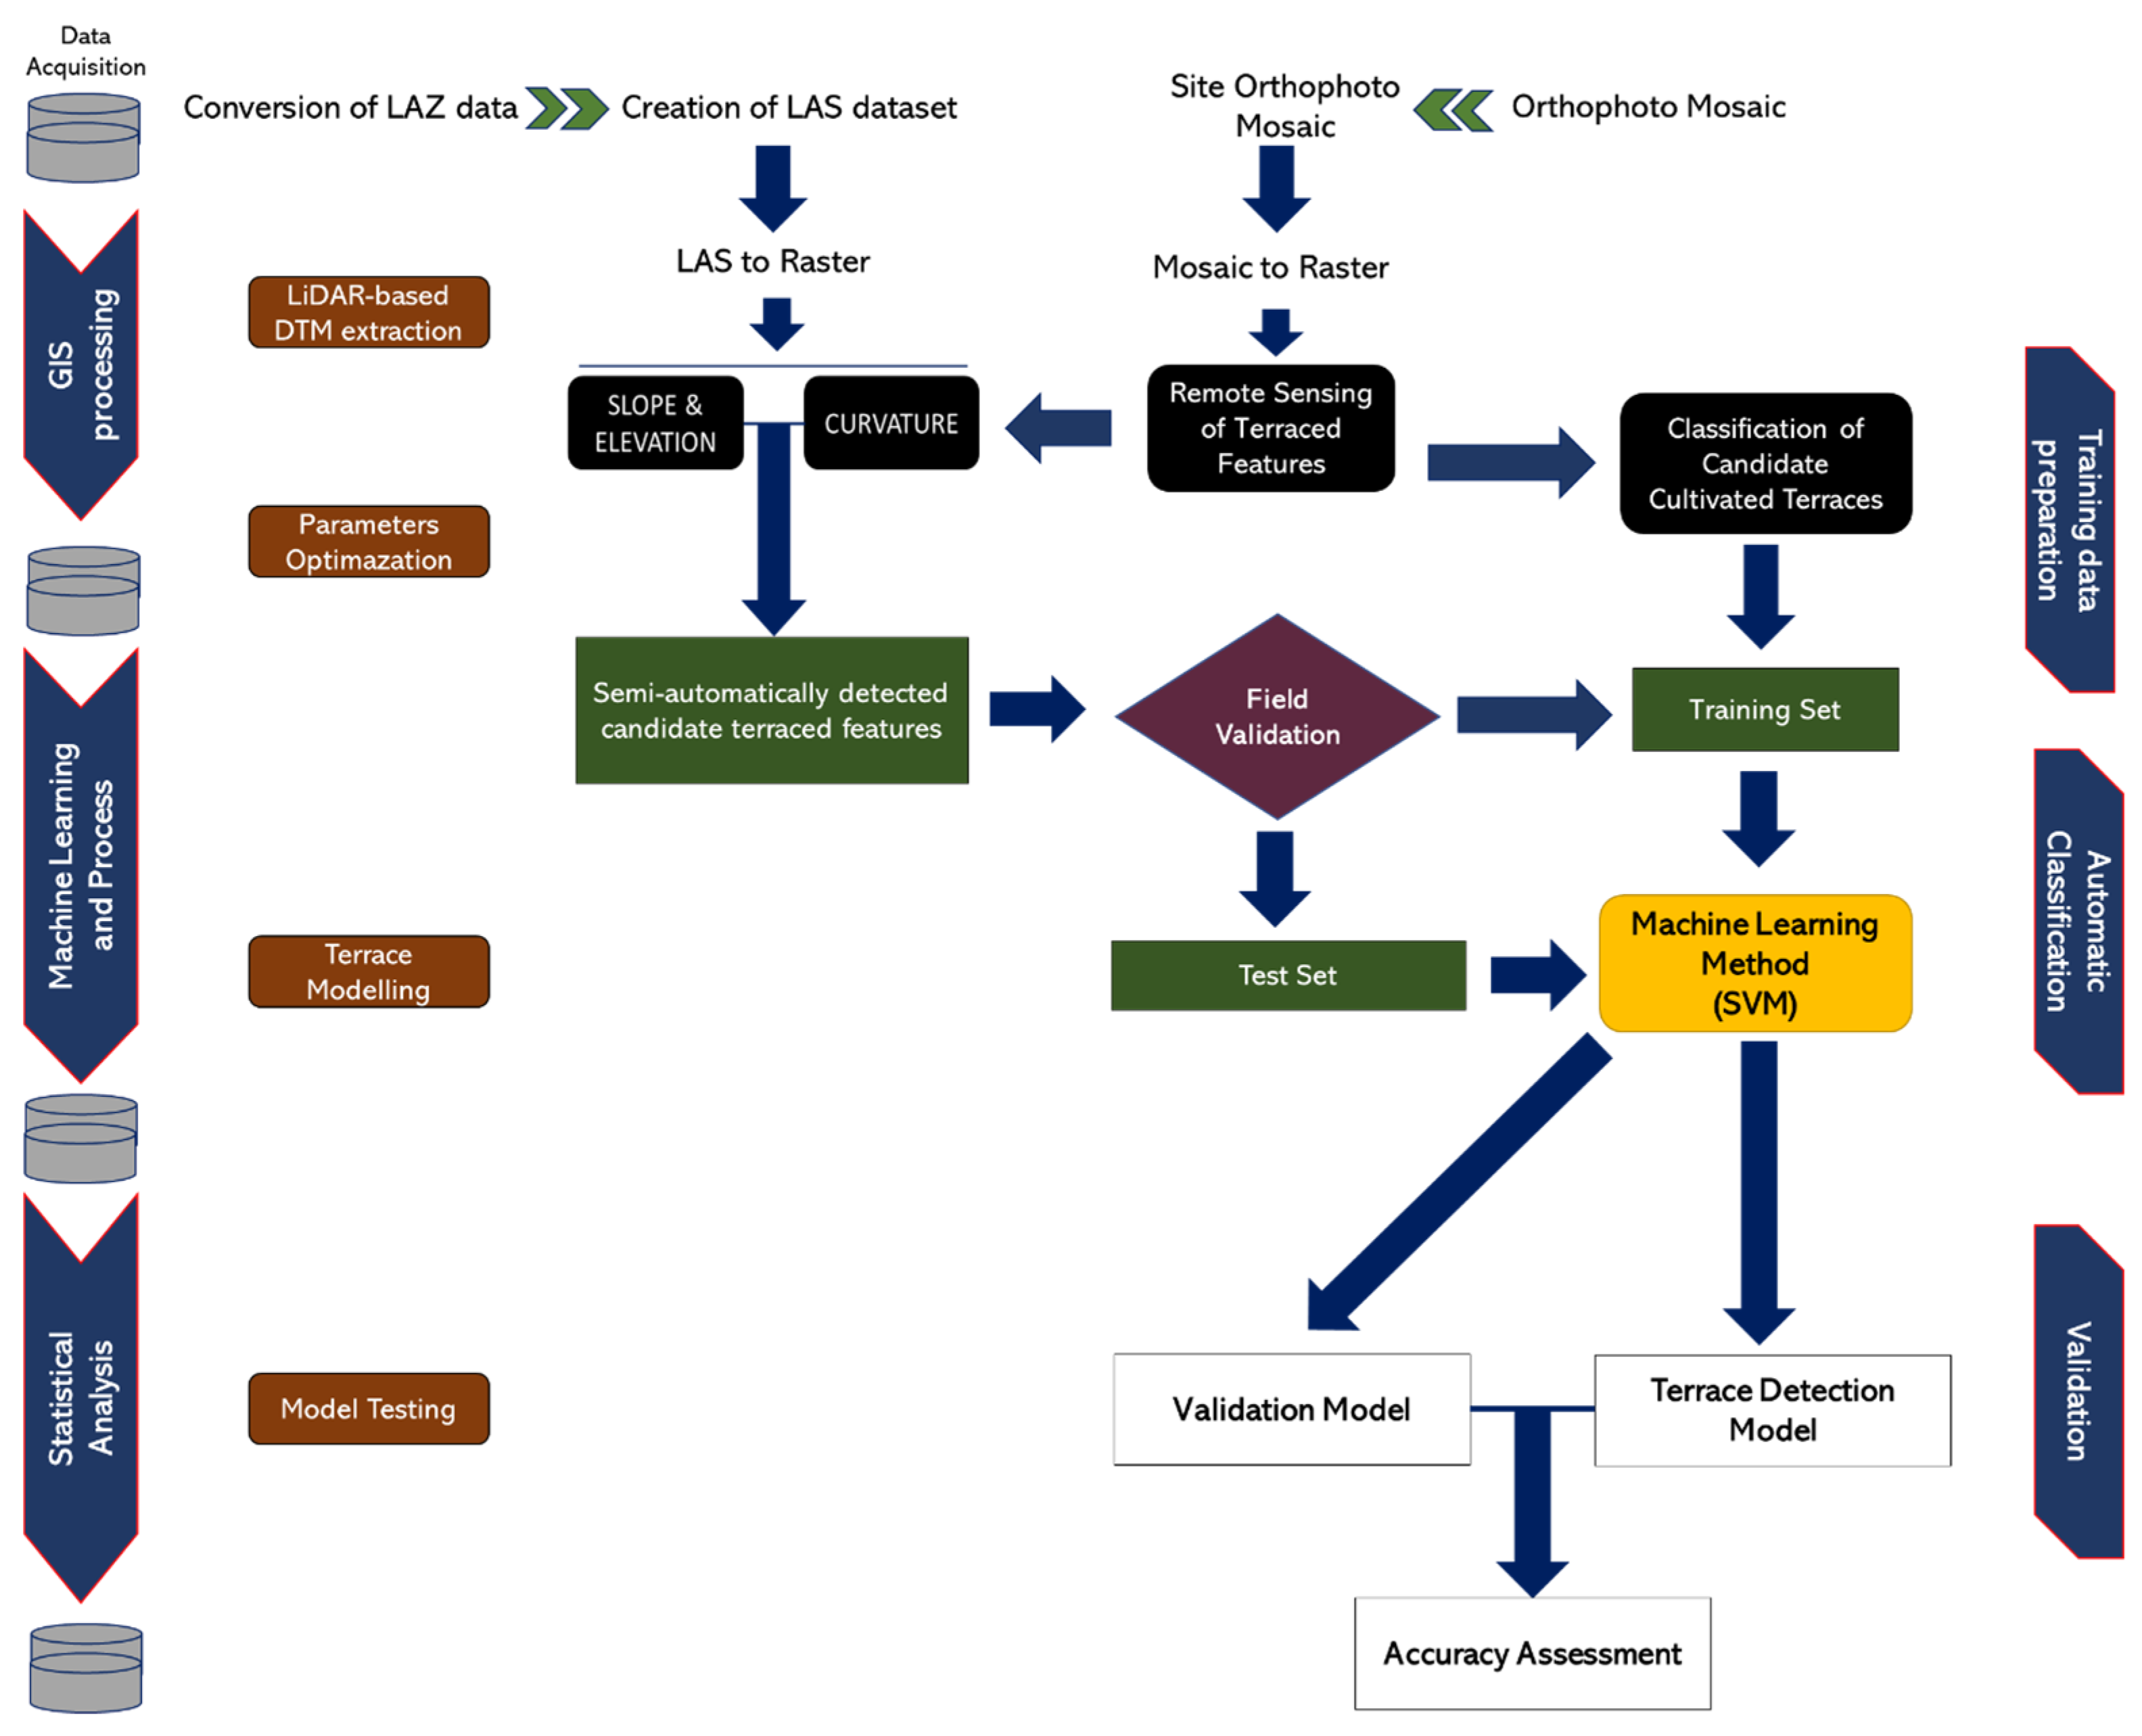
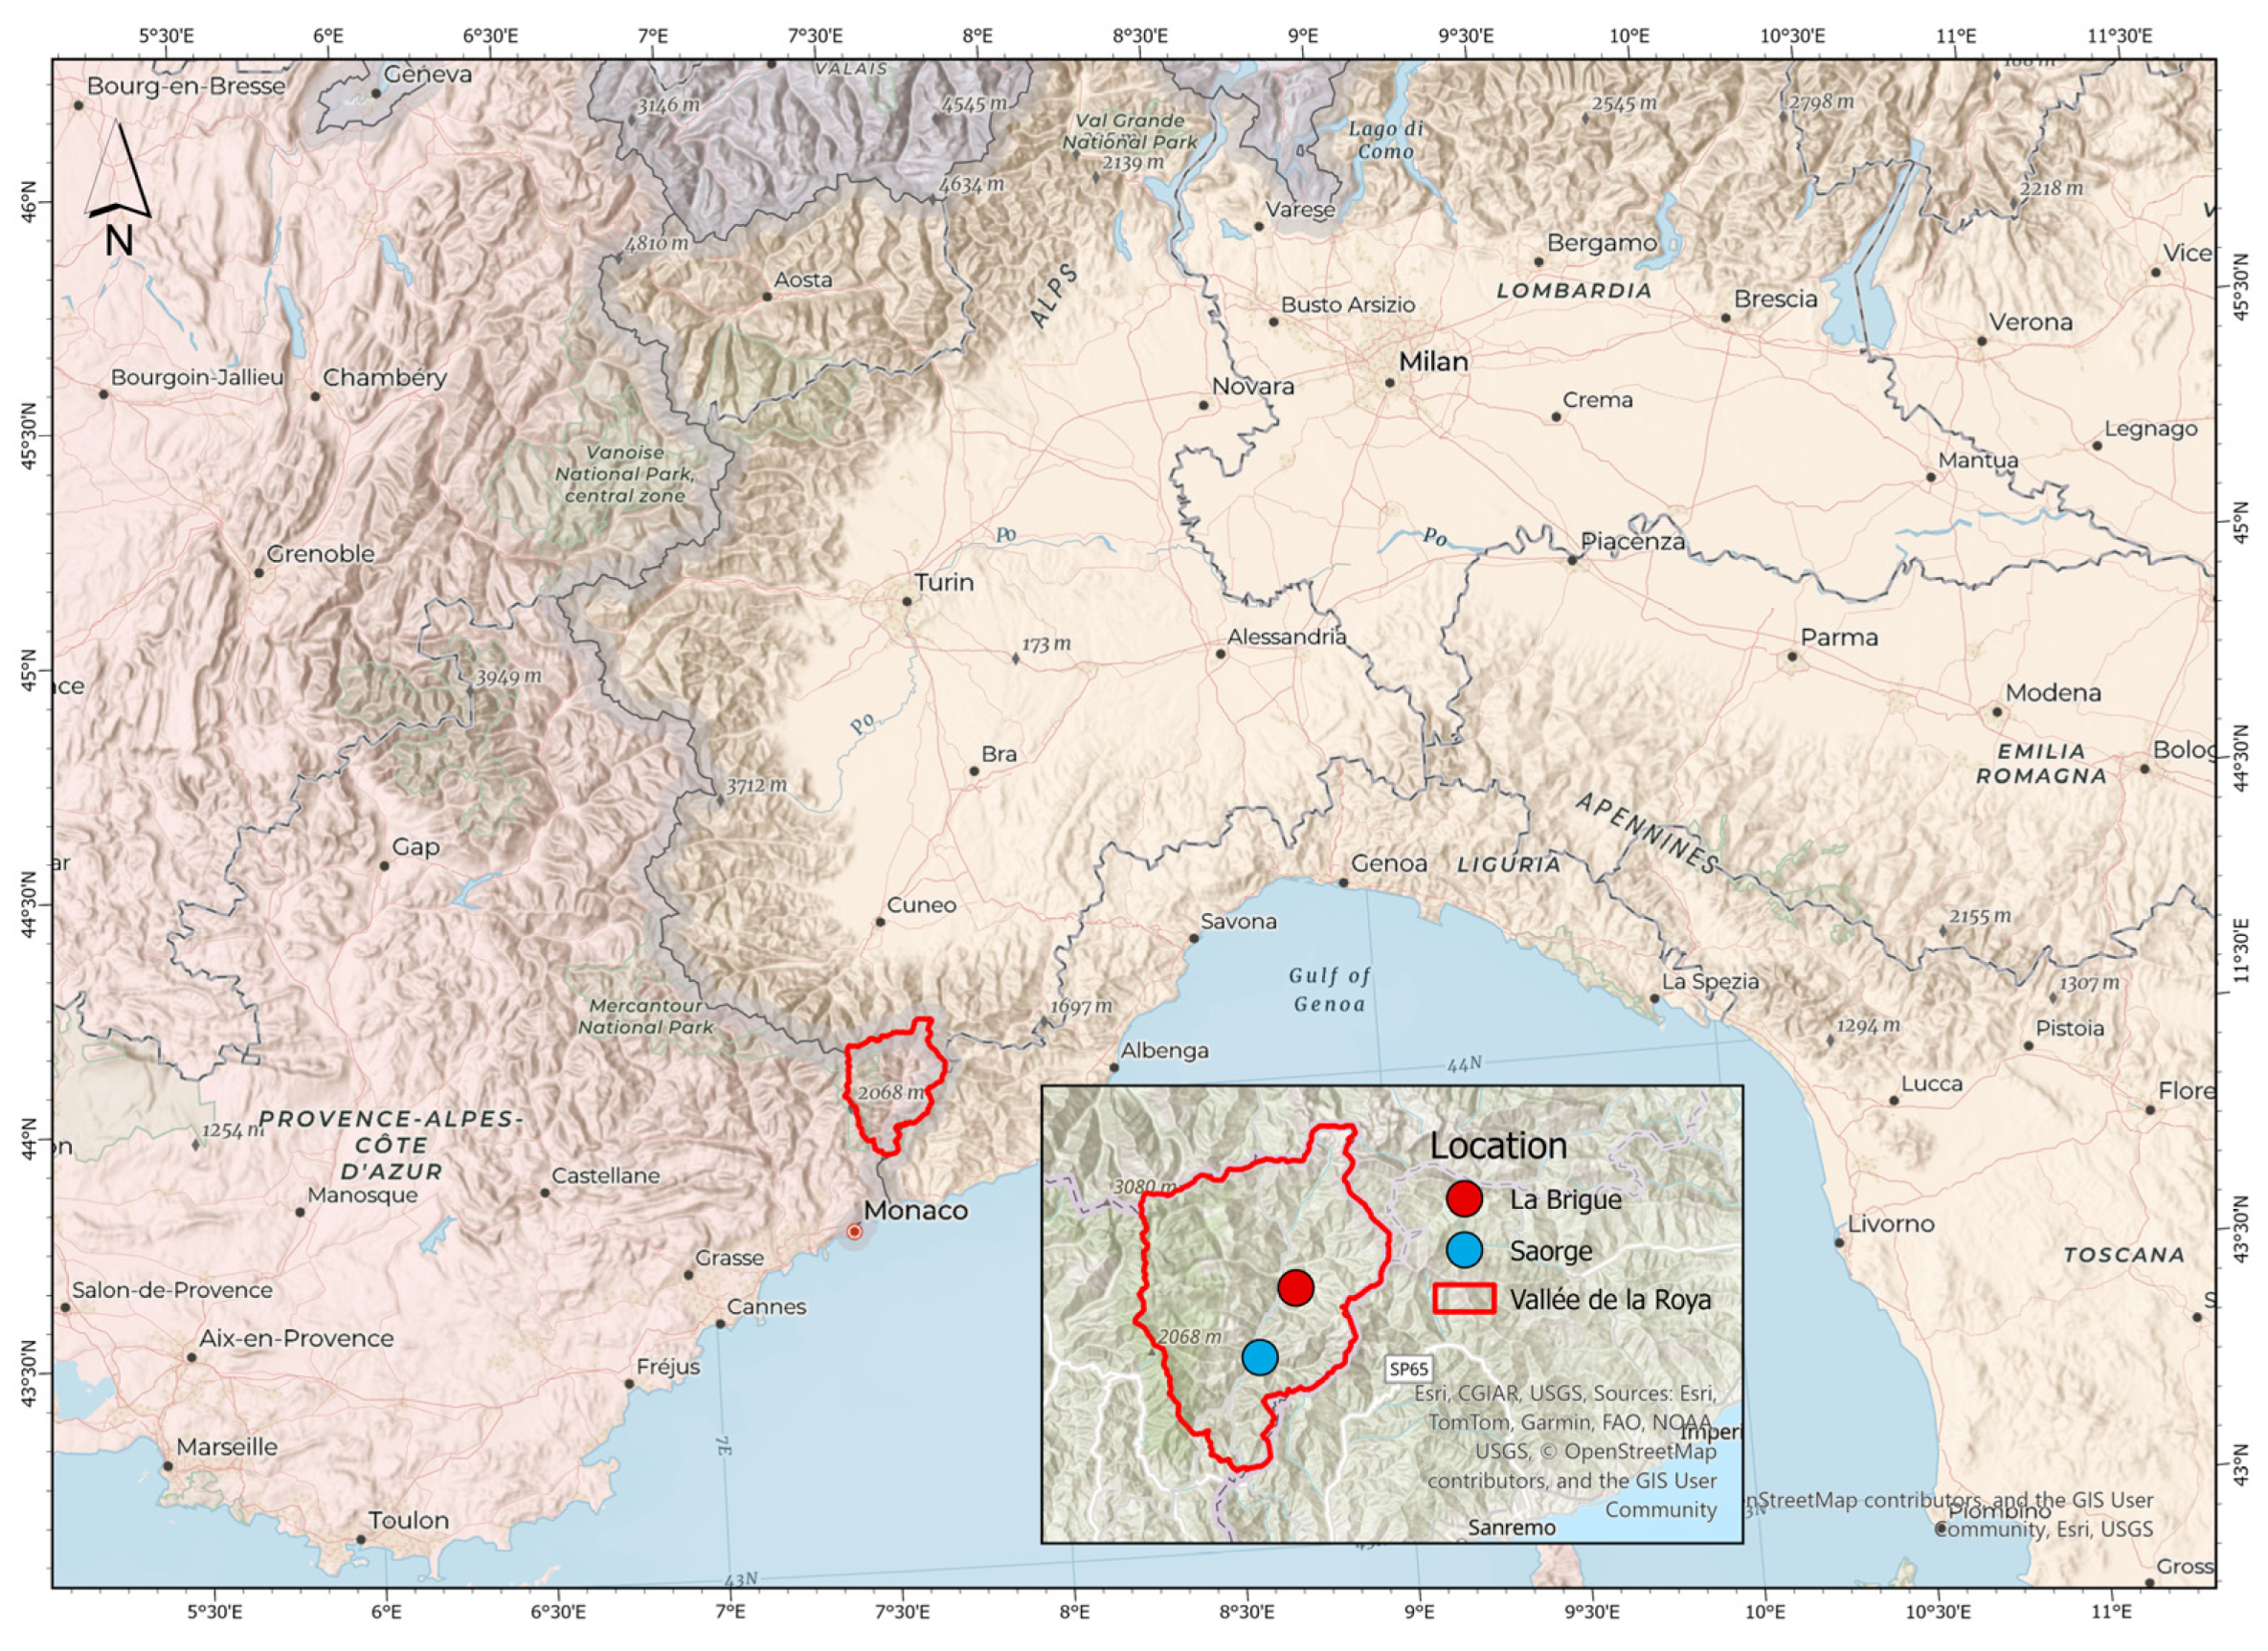

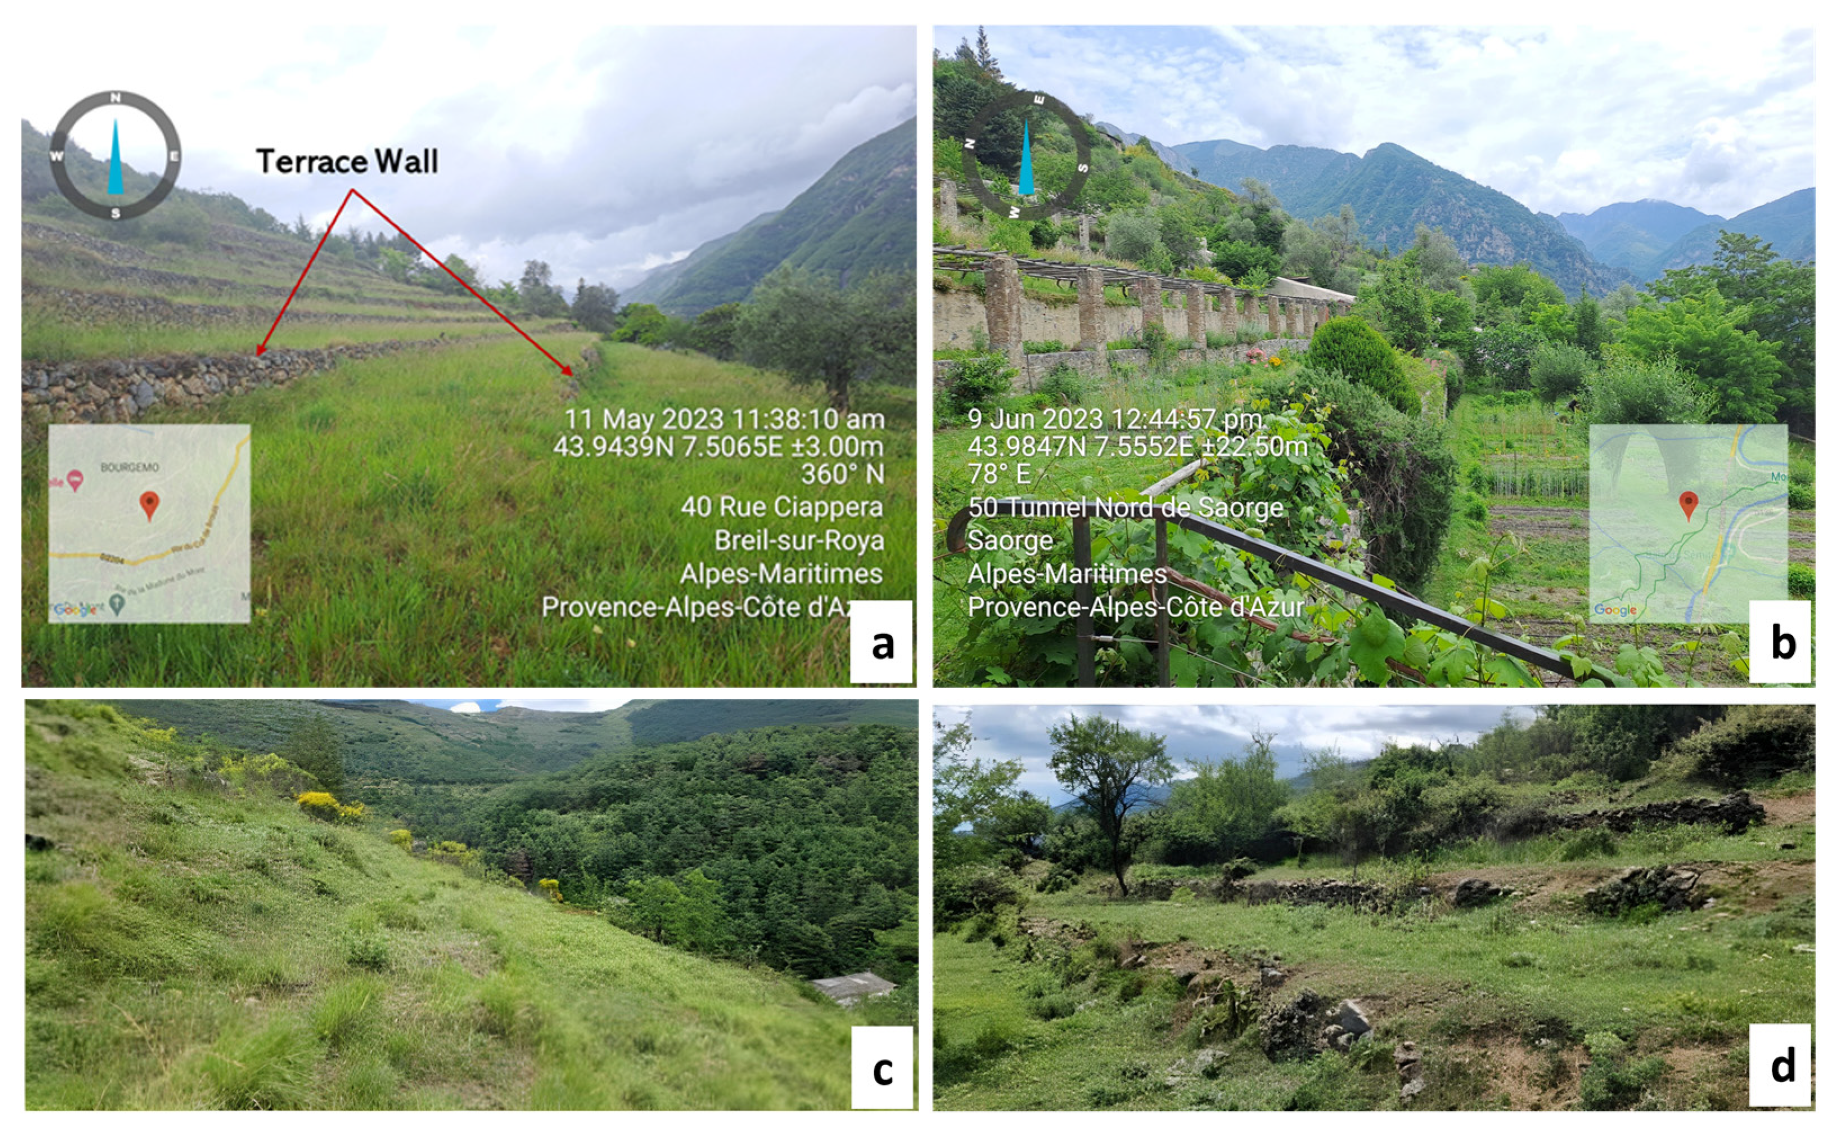
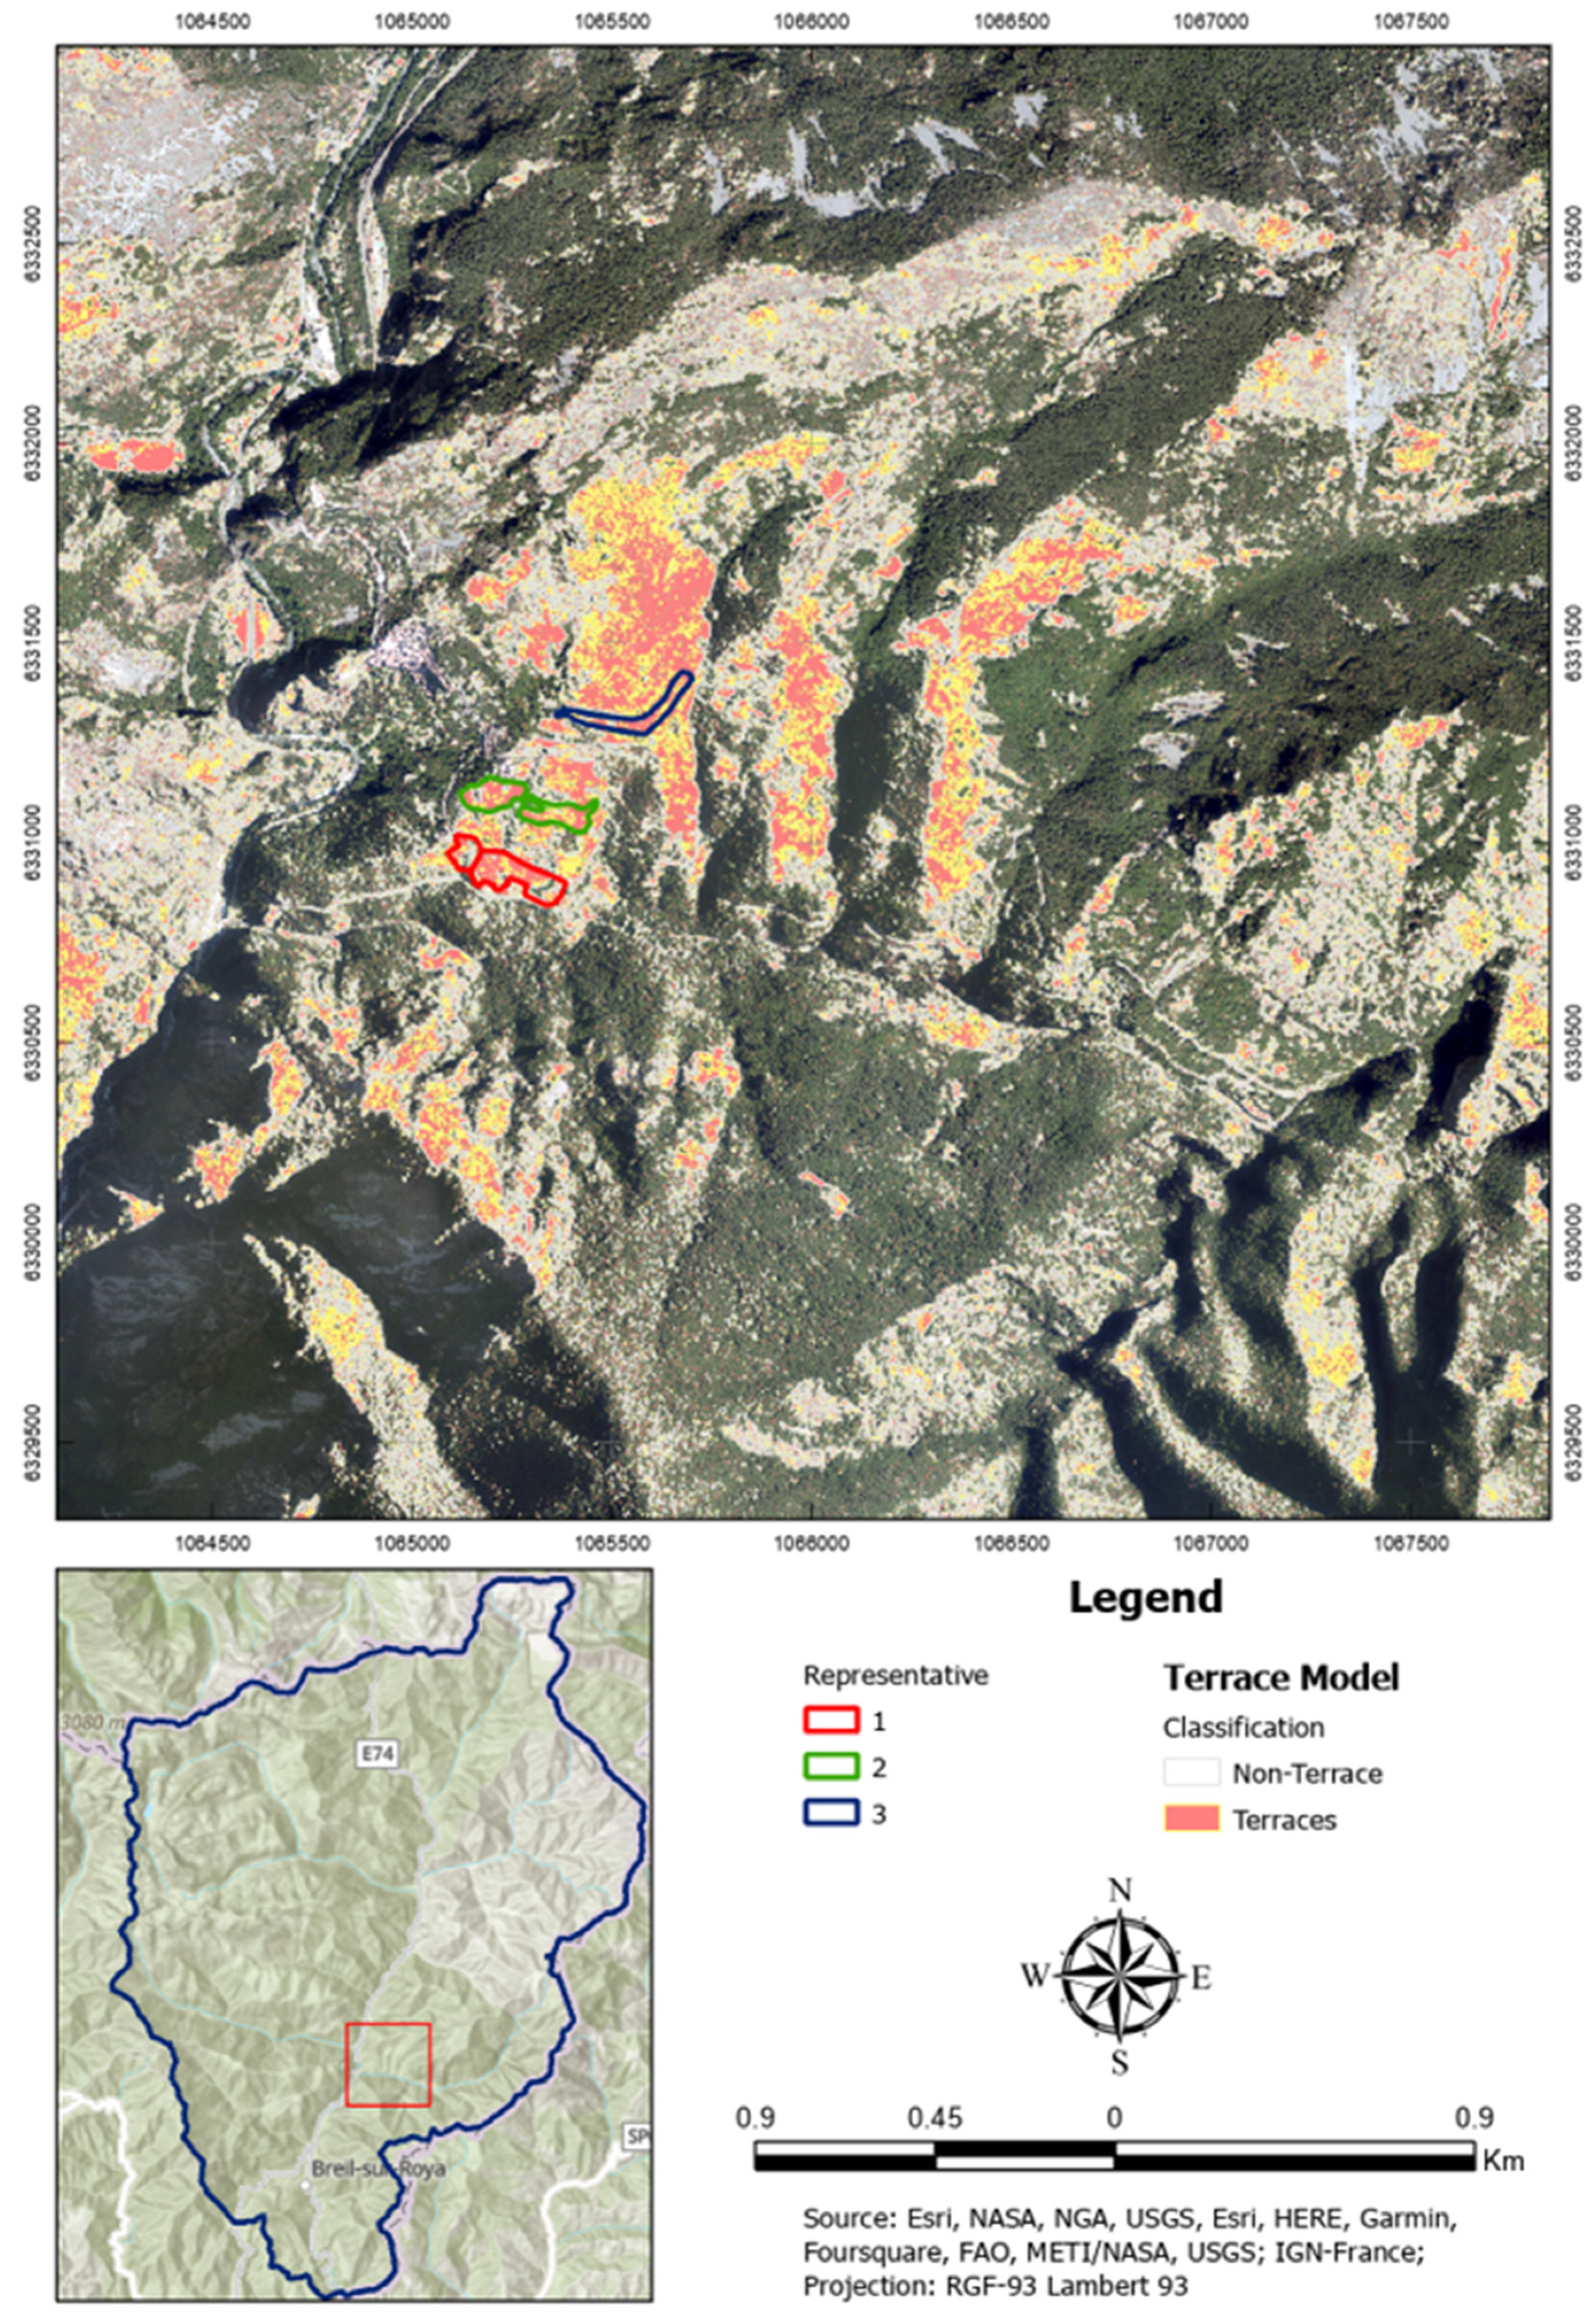
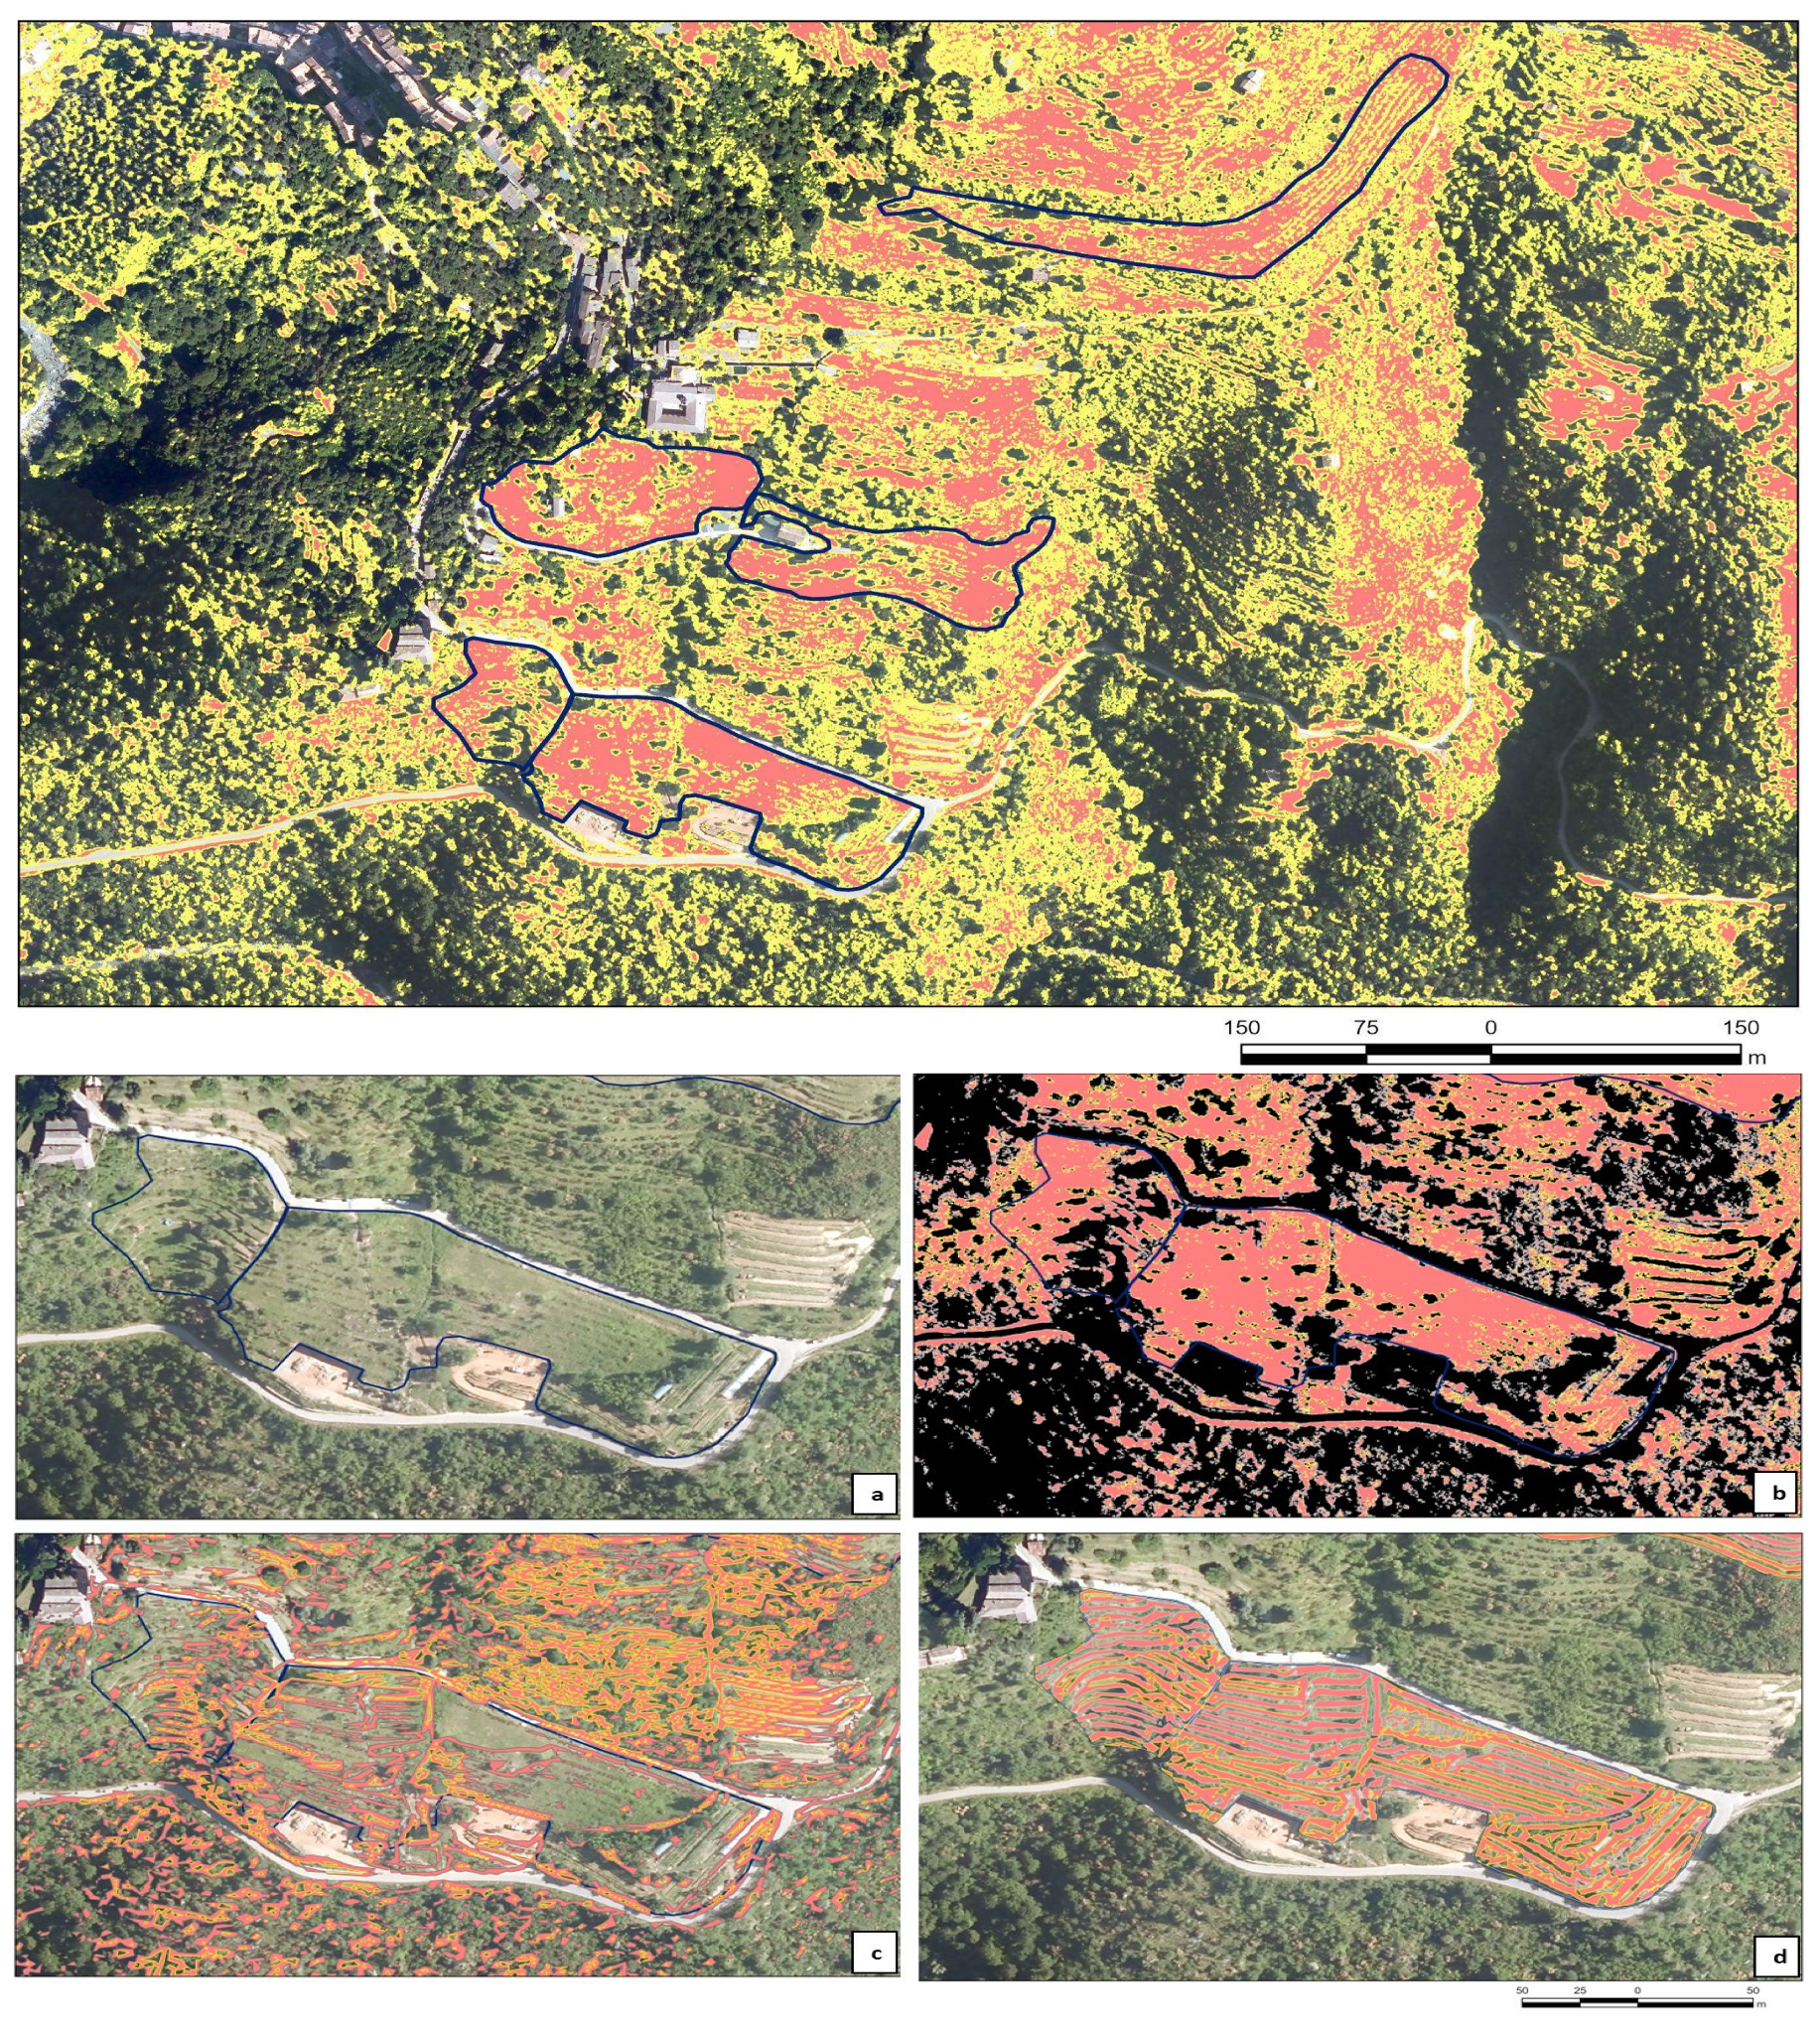
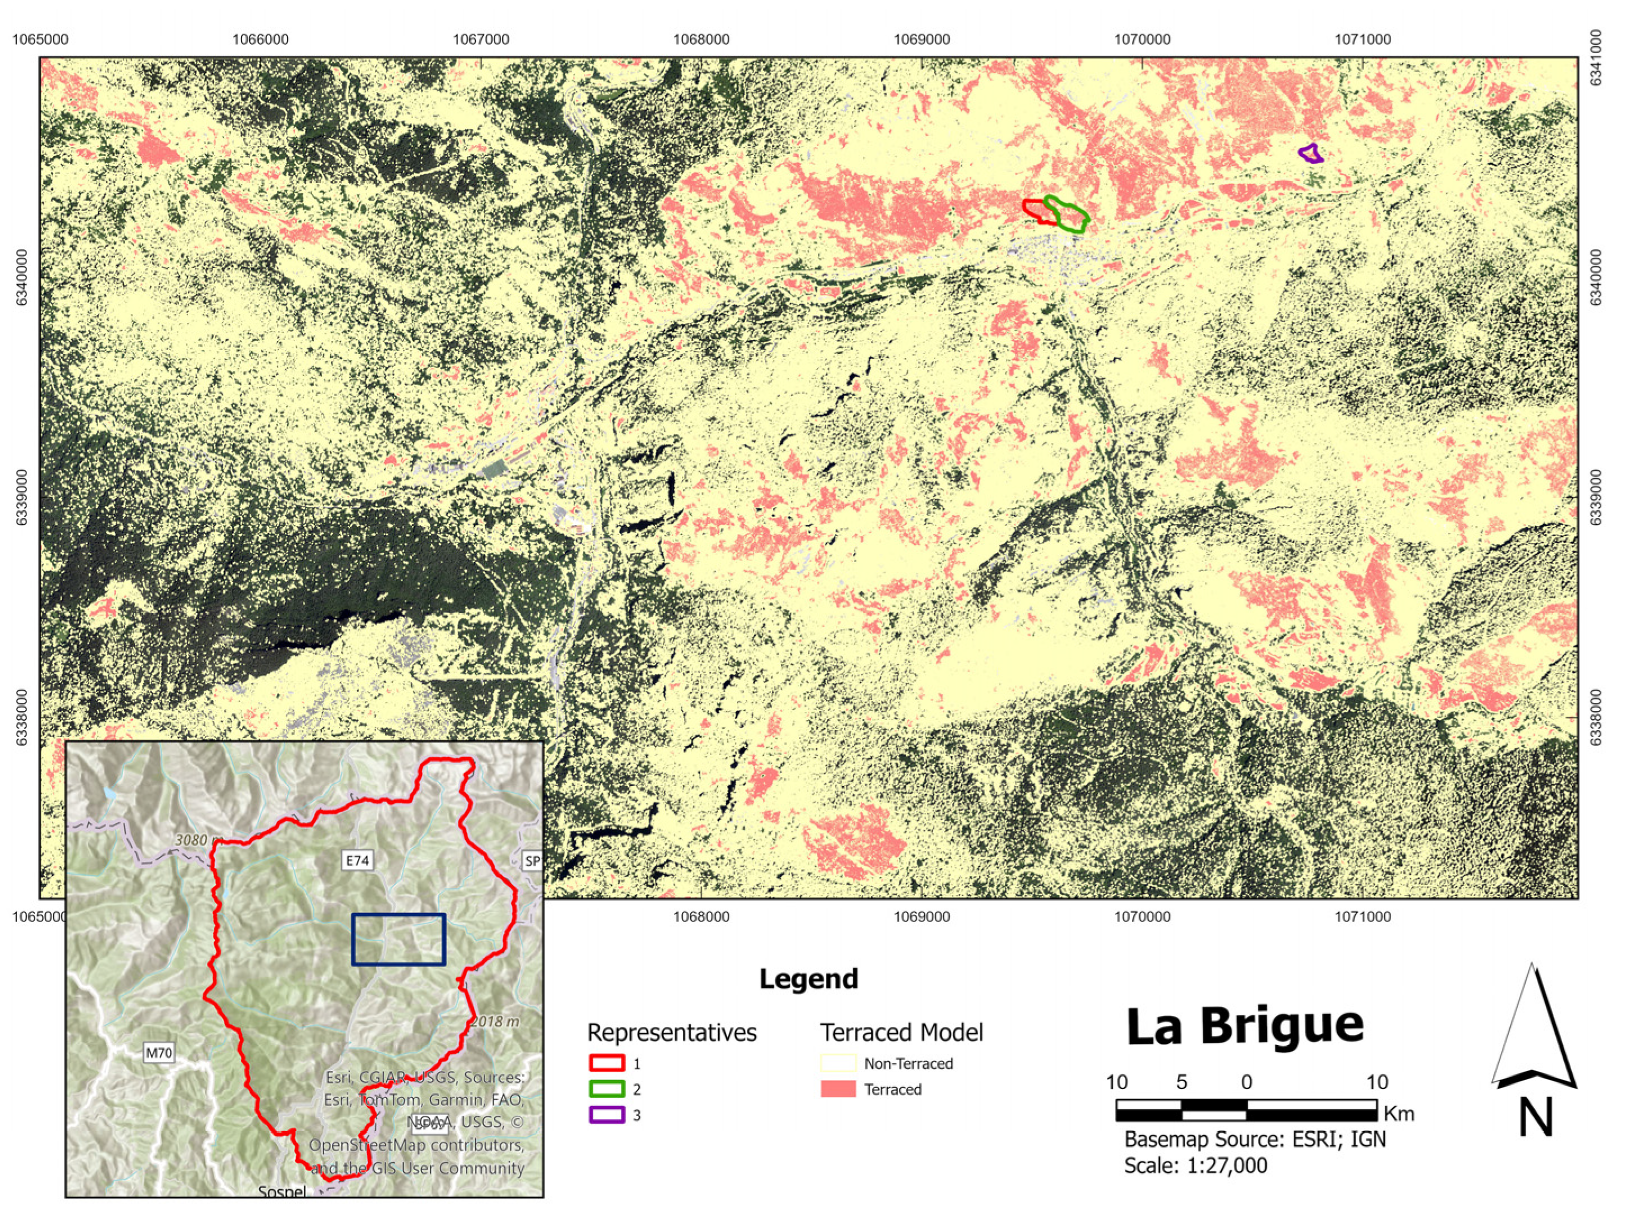
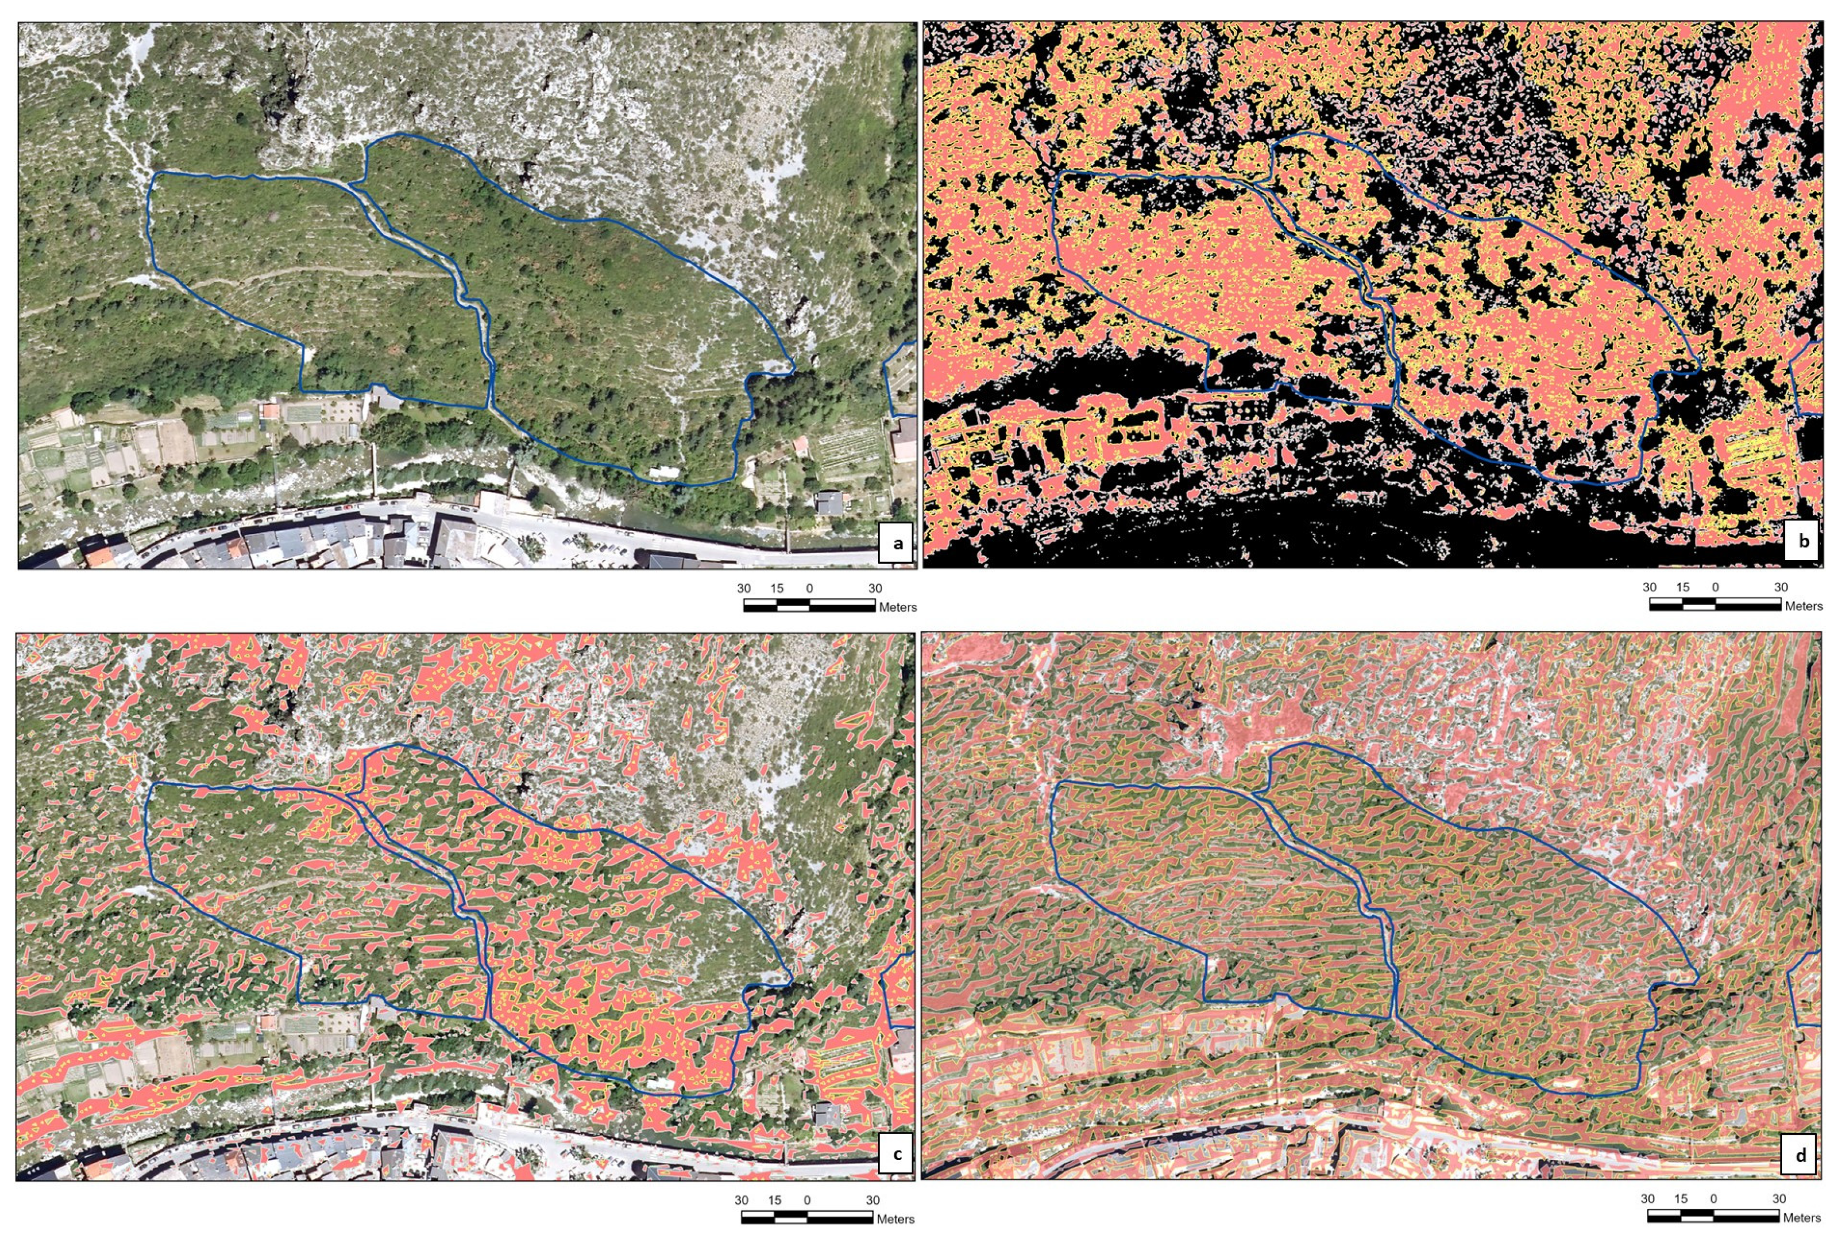
Disclaimer/Publisher’s Note: The statements, opinions and data contained in all publications are solely those of the individual author(s) and contributor(s) and not of MDPI and/or the editor(s). MDPI and/or the editor(s) disclaim responsibility for any injury to people or property resulting from any ideas, methods, instructions or products referred to in the content. |
© 2025 by the authors. Licensee MDPI, Basel, Switzerland. This article is an open access article distributed under the terms and conditions of the Creative Commons Attribution (CC BY) license (https://creativecommons.org/licenses/by/4.0/).