Abstract
Reforestation is widely promoted as a nature-based solution for climate change, yet its unintended consequences, such as deforestation leakage, remain under-investigated. This study provides empirical evidence of reforestation-induced leakage in the Brazilian Amazon, using municipality-level panel data from 2000 to 2023 and spatial Durbin panel models to estimate both the magnitude and spatial reach of agricultural displacement. Despite the positive local effects of reforestation projects, we found a significant displacement of deforestation to the vicinity of municipalities. We estimated a statistically significant deforestation leakage effect of approximately 12% from the reforested area, due to the agricultural displacement of cattle ranching activities. Spatial spillovers are strongest within a 150 km radius and within two years after reforestation onset. Sensitivity tests using alternative spatial weight matrices, including distance decay and land rent-weighted specifications, confirm the robustness of these findings. Livestock intensification, proxied by cattle stocking rates, does not significantly mitigate displacement effects, challenging assumptions about land sparing benefits. These results suggest that current carbon market protocols (e.g., Verra, ART-TREES) may improve their leakage analysis to avoid under- or over-estimating net carbon benefits. Incorporating spatial econometric evidence into offset methodologies and reforestation planning can improve climate policy integrity and reduce unintended environmental trade-offs.
1. Introduction
Reforestation is increasingly recognized as a key nature-based solution for mitigating climate change, as it sequesters carbon, restores ecosystems, and enhances biodiversity [1,2,3,4]. Global efforts to scale up reforestation initiatives are accelerating, particularly in tropical regions such as Brazil, where vast carbon sequestration potential exists [5]. These projects are often integrated into voluntary carbon markets, where companies and governments invest in afforestation and reforestation as a means to offset their emissions. However, while reforestation contributes to climate change mitigation, it may also trigger unintended consequences, notably deforestation leakage, i.e., the displacement of agricultural activities to other areas, leading to new deforestation elsewhere [6]. Thus, the efforts to increase carbon sequestration in one place may cause increased carbon emissions in another place. This phenomenon challenges the net climate benefits of reforestation and raises fundamental questions about the effectiveness of carbon market-based reforestation strategies.
Deforestation leakage has been widely studied in the context of REDD+ (Reducing Emissions from Deforestation and Forest Degradation) programs, where conservation initiatives may push land-use pressures into unprotected areas [7]. However, there is limited empirical evidence on whether reforestation projects aimed at expanding forest cover for commercial forestry or ecological restoration lead to similar displacement effects. This knowledge gap is particularly concerning as global tree-planting commitments continue to accelerate under initiatives like the Bonn Challenge, the New York Declaration on Forests, and Initiative 20 × 20 [4]. Unlike REDD+, which primarily targets standing forests, reforestation projects repurpose land previously used for agriculture, thereby introducing direct land-use competition with farming and livestock activities [8,9]. This fundamental difference suggests that distinct mechanisms may drive leakage effects from reforestation, particularly related to land rents and agricultural productivity differentials across regions [10,11]. Moreover, the increasing reliance on carbon market standards such as Verra and ART-TREES, which use simplified leakage factors or spatial buffers, raises concerns about underestimating displacement risks in afforestation-based offset projects [12,13]. These methodological shortcomings in carbon accounting protocols could significantly undermine the climate benefits of nature-based solutions if leakage effects remain insufficiently addressed [13,14].
The land spillovers caused by large-scale reforestation, e.g., deforestation leakage, remain an open debate. One hypothesis suggests that livestock intensification, i.e., a process of increasing productivity per hectare, could mitigate leakage by reducing the total land required for agricultural production [15]. Proponents argue that if farmers increase stocking rates and improve pasture management, they can maintain or even enhance output without expanding into new forested areas. However, others contend that intensification can induce a rebound effect, whereby higher productivity and profitability incentivize further agricultural expansion, exacerbating deforestation elsewhere [16,17]. Understanding whether intensification serves as a leakage mitigation strategy or an unintended accelerator of land displacement is critical for designing effective reforestation policies. Similarly, strategies to reduce competition with agriculture and livestock activities include land-use planning, by prioritizing reforestation in degraded and low-productivity areas [18].
These risks are especially salient in developing countries, such as Brazil, where reforestation is promoted through both public programs (e.g., the rural credit and Brazil’s Nationally Determined Contributions) and private sector initiatives. In Brazil, national legal frameworks such as the Forest Code and the rural environmental registry (also known as CAR) regulate and monitor land use and compliance obligations but lack instruments to account for deforestation leakage risks. This lack of instruments may harm the recent climate and conservation policies targeting carbon markets, such as the Brazilian Greenhouse Gas Emissions Trading System (Law 15.042 of 2024). Furthermore, despite these evolving rules and opportunities, there is incipient research with robust spatial evidences on whether reforestation in one location leads to compensatory deforestation elsewhere; this potentially undermines the climate integrity of carbon sequestration commitments. Addressing this evidence gap is essential to ensure that reforestation contributes to net climate mitigation rather than the spatial redistribution of emissions.
In this study, we provide the empirical quantification of reforestation-induced deforestation leakage in Brazilian Amazon, where large-scale reforestation efforts are underway as part of global carbon offset initiatives. We applied spatial econometric models to assess whether reforestation leads to the displacement of deforestation and how this leakage propagates across space. Specifically, we pose two hypotheses: () the expansion of forest plantations induces statistically significant deforestation leakage in surrounding municipalities and () livestock intensification moderates leakage effects by reducing the land required for production. This study aims to (i) quantify the magnitude of deforestation leakage from reforestation efforts in the Brazilian Amazon; (ii) examine how far and how persistently leakage effects propagate across space (i.e., does agricultural displacement occur locally, or does it propagate across distant regions?); and (iii) assess whether productivity gains in livestock systems mitigate or exacerbate these spillovers. Since the fundamental mechanism driving leakage is agricultural displacement, we use forest plantation land cover as a proxy to estimate reforestation-induced spillovers. Therefore, in this study, we use the terms “reforestation” and “forest plantation” interchangeably to refer to the conversion of agricultural land into tree-based cover, whether for ecological restoration or commercial forestry.
Our analysis did not consider natural regeneration processes and focused on the displacement effects of reducing agricultural land to planted forests. Using a spatial Durbin panel model (SDM), we analyzed land spillovers caused by forest plantation across multiple years and municipalities. By providing a robust, data-driven assessment of deforestation leakage caused by forest plantation, this study bridges a critical knowledge gap and offers actionable insights for policymakers, land managers, and carbon market stakeholders. In doing so, it contributes to the broader discussion on how to design reforestation projects that maximize carbon sequestration without inadvertently shifting environmental burdens elsewhere.
2. Background and Conceptual Framework
2.1. Policy Context
Brazil is the sixth largest emitter of GHGs, and its primary source of emissions is deforestation [19], mainly in the Amazon biome. For this reason, conserving and restoring forest cover remains one of the most critical factors for climate mitigation in this biome, being essential as carbon sinks, particularly in the context of nature-based solutions. In Brazil, reforestation and afforestation efforts are shaped by a combination of legal mandates and incentive-based programs. The Forest Code (Law 12.651/2012) requires rural landowners to maintain or restore a percentage of native vegetation, ranging from 20% to 80% depending on the biome. In parallel, the government’s Low-Carbon Agriculture Plan (Plano ABC) supports reforestation through credit lines and technical assistance. These domestic policies are embedded within international climate commitments, particularly Brazil’s Nationally Determined Contributions (NDCs) under the Paris Agreement, which pledge to reforest 12 million hectares by 2030. Furthermore, the Brazilian government recently approved a Greenhouse Gas Emissions Trading System (Law 15.042 of 2024), which has incentivized multiple projects of carbon sequestration in agribusinesses and forest conservation. A few forestry companies in Brazil have benefited from carbon credits, e.g., Suzano, and there are emerging reforestation startups (e.g., Mombak, ReGreen, Biomas). Thus, voluntary carbon markets (e.g., Verra, ART-TREES) have become a growing source of finance for reforestation, even though their approaches to leakage accounting remain underdeveloped [12].
Current policy debate to mitigate leakage in conservation projects includes integrated land-use planning (e.g., zoning areas to specific agricultural activities) and jurisdictional approaches to conservation and enforcement activities [20]. In the private sector, the soy moratorium and monitoring of beef suppliers also attempt to avoid leakage caused by the restriction of land change and agricultural activities [21,22], however, with limited success. For reforestation efforts, implementing land zoning regulations to avoid high-deforestation-risk areas, could mitigate unintended expansion into sensitive biomes, but this regulation does not exist. Additionally, voluntary markets have been discussing the improvement of monitoring frameworks with high-resolution remote sensing data and new protocols to enhance leakage detection and accountability in carbon offset programs [23].
The presence of leakage has significant implications for carbon market integrity, as well as the efficacy of NDCs and other large-scale reforestation efforts. Many voluntary carbon crediting standards, such as Verra and ART-TREES, rely on simplified methodologies that may not fully account for spatial spillovers and land-use feedback loops [24]. As a result, the net sequestration potential of reforestation projects may be overestimated, leading to inflated carbon offset claims. Several studies call for more rigorous spatial econometric approaches to better quantify leakage effects and improve the credibility of carbon finance mechanisms [12,25].
Area of Study: Brazilian Amazon
The Brazilian Amazon, home to the world’s largest tropical rainforest, is a key region for both carbon sequestration and agricultural expansion. While conservation efforts have sought to curb deforestation, land-use pressures persist, particularly due to cattle ranching, which accounts for nearly 80% of deforested land [26]. With over 60 million hectares of pastureland in the region (MapBiomas Project [27]), any reduction in available land due to reforestation projects risks displacing ranching activities elsewhere, potentially causing deforestation leakage. Forest plantations are 630 thousand hectares within the states of the Brazilian Amazon (Figure 1), and 8 million hectares in the other Brazilian states.
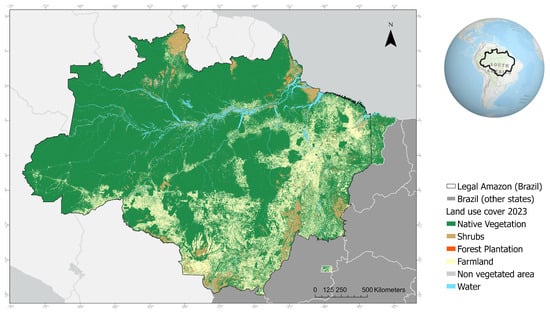
Figure 1.
Legal Brazilian Amazon.
Pastureland is the dominant land-use category affected by reforestation because cattle ranching is highly mobile and responsive to land competition. Unlike mechanized agriculture, which requires specific soil and infrastructure, ranching can shift rapidly into newly cleared forested areas, making it a major driver of indirect land-use change (ILUC) [11]. This pattern is evident in Pará, Mato Grosso, and Rondônia, which together accounted for over 70% of new deforestation in the Brazilian Amazon in 2021 [26]. Focusing on pastureland displacement provides critical insights into the economic and spatial spillovers of reforestation policies. Given that voluntary carbon markets often overlook cattle displacement effects, understanding where and how ranching activities relocate when land is reforested is essential for ensuring the integrity of carbon offset projects and preventing unintended deforestation elsewhere [24].
2.2. Conceptualizing Agricultural Displacement and Deforestation Leakage
Reforestation and afforestation are widely promoted as nature-based solutions for mitigating climate change, with global initiatives increasingly integrating them into carbon offset markets [1,28]. Reforestation refers to the restoration of tree cover on land that was previously forested but has been cleared or degraded, whereas afforestation involves establishing tree cover on land that was not historically forested. While both processes contribute to increasing forest area, they differ in ecological and policy implications, particularly in carbon markets where additionality and land-use history play critical roles [4]. This study focuses on both types under the common mechanism of reducing agricultural land for tree-based land uses—whether for commercial or ecological purposes.
Reforestation strategies aim to enhance carbon sequestration, restore ecosystems, and contribute to biodiversity conservation [29]. However, while these interventions yield environmental benefits, they can also trigger unintended land-use changes, particularly through deforestation leakage, which displaces agricultural expansion and land clearing elsewhere [30]. Understanding the drivers and mechanisms of this process is critical to assessing the net environmental impact of reforestation programs and ensuring that climate mitigation efforts do not exacerbate land scarcity, food insecurity, or global deforestation. Structured reforestation efforts, whether for commercial forestry or ecological restoration, alter land availability and create economic incentives that may displace agricultural activities. Unlike passive regeneration or land abandonment, which may occur without direct investment, forest plantations require capital inputs, infrastructure, and land conversion decisions, all of which can amplify leakage risks.
The concept of deforestation leakage has been extensively studied in the context of REDD+ (Reducing Emissions from Deforestation and Forest Degradation) and agricultural land-use change [20,31]. The core concern is that restricting deforestation or expanding forest cover in one location does not eliminate the underlying pressures driving land conversion. Instead, these pressures often shift spatially as land users adapt to new constraints, leading to agricultural displacement and continued deforestation elsewhere [6,8]. Leakage can occur through multiple mechanisms, each driven by distinct economic and ecological forces. First is the direct displacement: when reforestation projects are established on previously agricultural land, farmers and ranchers may relocate their activities, clearing new forested areas to maintain production. This is particularly relevant in regions where land-use competition is high, such as the Brazilian Amazon, where pastureland often serves as the primary expansion frontier for both crops and livestock [32,33]. However, the Amazon also contains vast areas of degraded, low-productivity lands that are no longer suitable for commercial agriculture or extensive cattle ranching. Estimates suggest that over 15–20 million hectares of degraded land exist in the region, with low economic returns making them unlikely candidates for future agricultural expansion [34].
Second, market forces can mediate the agricultural displacement. For instance, large-scale reforestation may reduce available agricultural land, then increase land scarcity, and raise local commodity prices (e.g., beef or calf supply), incentivizing expansion into other forested regions. This effect is often amplified in globalized markets where demand for agricultural commodities, such as soy, beef, and palm oil, drives extensive land-use change [14,35]. Economic modeling studies on indirect land-use change (ILUC) demonstrate that even marginal shifts in land supply can trigger widespread deforestation across different regions or countries [36]. For instance, we consider leakage in this study the subnational spatial displacement of land-use activities, particularly when forest plantations displace cattle ranching or farming into neighboring areas.
Finally, land-use displacement can also occur across national borders through “telecoupling” effects, where reforestation reduces local production and increases reliance on imports—potentially driving deforestation abroad [37,38]. While these leakage pathways pose challenges to the effectiveness of reforestation policies, the extent and intensity of displacement vary depending on land-use governance, economic incentives, and agricultural productivity trends. Some studies argue that intensification strategies, such as improved livestock management or higher crop yields, can mitigate leakage effects by maintaining production on smaller land footprints [16,17]. However, others caution that intensification can create rebound effects, where higher-productivity fuels further expansion rather than reduce total land demand [33,39]. This underscores the importance of integrating spatially explicit leakage assessments into reforestation initiatives, rather than relying solely on economic or sectoral averages.
2.3. Modeling the Leakage Rationale
Prior studies have employed causal inference approaches to assess deforestation leakage effects, each with distinct strengths and limitations. Difference-in-Difference (DiD) approaches [40] offer strong causal inference but typically fail to capture spatial interdependencies crucial for leakage estimation. Propensity Score Matching (PSM) techniques [10] address selection bias in conservation program placement but cannot account for unobservable factors driving leakage. Fixed effects panel models [41] control for time-invariant heterogeneity but often neglect spatial interactions. Recent analyses by Moffette and Gibbs [21] employed instrumental variable approaches to examine agricultural displacement and deforestation leakage, while Richards et al. [11] utilized input–output economic models to capture indirect land-use effects—both adding valuable methodological diversity but facing challenges in quantifying spatial spillover dynamics. Spatial lag and error models [42] incorporate some spatial relationships but are more restrictive than the SDM, lacking the comprehensive decomposition of spatial effects. Synthetic control methods [43] offer an alternative for aggregate-level analysis but become unwieldy with multiple treated units. While these approaches have contributed valuable insights to deforestation displacement analysis, they generally suffer from an inability to simultaneously model both direct and indirect effects across space and time, which the SDM panel approach specifically addresses [44,45].
Following the literature, the Spatial Durbin Panel Model (SDM) is the best option for estimating reforestation-induced deforestation leakage due to its superior capacity to decompose spatial spillover effects into direct and indirect components [44]. Unlike conventional panel approaches, which fail to capture spatial interactions, or simpler spatial models that only account for spatially lagged dependent variables, the SDM incorporates both endogenous and exogenous spatial interactions, providing comprehensive estimation of displacement effects [45]. This feature is particularly critical for accurately quantifying leakage, as it allows for tracking how conservation policies in one location may displace deforestation activities to neighboring areas [46]. Furthermore, the combination of the SDM with panel data addresses potential omitted variable bias that could arise from spatially correlated variables influencing both reforestation decisions and subsequent deforestation patterns [47], thereby generating more reliable estimates of the true environmental impact of conservation interventions.
3. Materials and Methods
3.1. Dataset
We employed a municipality-level panel data analysis for the period of 2000–2023 to assess deforestation leakage caused by forest plantation, its geographic sensitivity, and the role of livestock intensification in mitigating spillovers. The panel data approach allowed for the estimation of both temporal persistence in deforestation and spatial spillover effects. The dataset integrates land-use, economic, climatic, and spatial data, enabling a rigorous econometric analysis of deforestation leakage and the role of livestock intensification. Following the literature in Land System Science and land change modeling [48,49], we included multiple independent variables to capture the drivers of vegetation loss, from proximate direct causes to underlying contextual controlling variables. This controls for confounding factors, including infrastructure expansion (proxy: population density), commodity price shocks (agricultural GDP and beef price deflated), and environmental enforcement (embargoed area due to illegal deforestation). By incorporating these controls, we isolate the specific contribution of reforestation to land-use displacement while accounting for broader economic and policy influences. See summary of variables in Table 1.

Table 1.
Description of variables.
Each variable included in the model is grounded in theoretical and empirical relevance to land-use change and deforestation dynamics [11,48,49]. Vegetation loss and forest plantation area are the main land-use indicators central to measuring leakage effects. The stocking rate is a proxy for livestock intensification, hypothesized to influence land demand and displacement pressure. Agricultural GDP and land rent capture the economic drivers of land conversion and opportunity cost. Population density reflects demographic pressure, while enforcement via embargo area represents institutional capacity to constrain illegal clearing. Finally, climate variables (precipitation, temperature) account for environmental suitability and biophysical variation, which are known to shape both deforestation and reforestation patterns.
We used land cover data from the MapBiomas Project [27], which provides annual classifications derived from Landsat imagery at 30 m resolution for Brazil and other regions of Latin America since 1985. The dataset, based on over 80,000 reference samples, reports classification accuracy between 73% and 95% across South American biomes. For this study, we reclassified the original 17 land cover types into five broader categories: native vegetation, pasture, crops, water, and other (including urban, mangrove, mining, and unclassified areas). “Native vegetation” combines forest and non-forest natural cover; “pasture” includes pasture, grassland, and agricultural mosaics—mostly natural pasture per MapBiomas validation. All spatial analyses were conducted using ArcGIS and R, with the SIRGAS 2000 coordinate reference system. Administrative boundaries for municipalities and the legal Amazon region were sourced from the Brazilian Institute of Geography and Statistics (IBGE).
To facilitate the interpretation of model estimators and address skewness in the data, Inverse Hyperbolic Sine (IHS) transformations are applied to the variables in the modeling, including land use (e.g., forest loss, forest plantation, pasture area), agricultural, and economic indicators (e.g., livestock, GDP), population density, law enforcement, and environmental factors (e.g., temperature, rainfall). This approach ensures interpretability akin to a logarithmic transformation while accommodating zero and negative values [56,57,58]. The IHS is calculated as
3.2. Empirical Modeling Approaches
For deforestation leakage caused by forest plantation (our proxy for reforestation) and land-use change dynamics, we implemented panel data regressions with spatial weights to capture the land spillovers. The variations in the dependent variable (vegetation loss) across municipalities and time are modeled using pooled OLS as a baseline, then fixed effects (FE) and first-difference (FD) models. The panel structure of the dataset allows for controlling time-invariant unobserved heterogeneity at the municipal level, for instance, persistent regional characteristics such as soil quality and institutional factors that may influence deforestation. This approach ensures that the estimated effect of reforestation on deforestation leakage is not confounded by historical land-use patterns or persistent regional characteristics. Following the literature [44], we specify the Spatial Durbin Model with panel data:
where is the vegetation loss rate in municipality i at time t, calculated as the ratio of annual vegetation loss relative to the 2000 baseline. We used the total area of native vegetation as an alternative specification to the first-difference panel model, which accounts for annual variations in native vegetation area. represents the municipality fixed effects, and , control for time-invariant characteristics such as topography and soil quality. Lagged captures the persistence of deforestation over time, while is the spatial lag of , capturing the influence of vegetation loss in neighboring, local municipalities. is the forest plantation (proxy of reforestation). represents a vector with the controlling variables, such as GDP per capita, population density, law enforcement, rainfall, and temperature. is a vector of coefficients for , is the coefficient of spatial lagged Y, and is the error term. In this study, we are particularly interested in , which estimates deforestation leakage effects of forestry expansion on the neighboring municipality. We are also interested in , accounting for possible livestock intensification mitigation effects. W is a spatial weight matrix based on distance between municipalities, explicitly accounting for spatial interactions between municipalities, and measuring both neighboring effects. The construction of W and sensitivity tests are described in the following sections.
The preferred model to present the results is the FE model, selected by several statistical tests and because it controls for these unobserved characteristics, ensuring that the estimated relationships reflect within-municipality variations over time rather than cross-sectional differences. The Hausman test was conducted to determine whether fixed effects or random effects provide more consistent estimates. The Breusch–Pagan Lagrange multiplier test assessed whether a random effects model is preferable over a pooled OLS model.
Spatial Weight Matrix Construction and Sensitivity Tests
A key component of this study involves modeling spatial dependencies using a spatial weight matrix (W). We constructed W as a distance-based weight matrix using the inverse distance metric between the centroids of municipalities’ agricultural land. The final matrix had 648,025 elements in 805 × 805 municipalities within Brazilian Amazon states (Figure 1). The spatial influence between municipalities i and j is defined as if km, else, 0. is a circle distance between municipalities i and j, with a threshold of 300 km. Self-links are set to zero (i.e., ), and row standardization ensures comparability across observations. We defined 300 km as the threshold because this distance aligns with the average supply radius of slaughterhouses seeking cattle for processing, as reported by studies on beef supply chains in the Amazon [59,60]. This assumption reflects the spatial scale at which livestock markets operate, reinforcing the economic rationale behind land-use spillovers in response to reforestation initiatives.
Given the importance of spatial dependence assumptions, sensitivity tests are conducted by varying the distance decay parameter in the inverse-distance weight matrix. Instead of uniform decay, we introduce a distance-decay function weighted by municipality-level land rent. This modification incorporates the principle that land-use decisions are shaped not only by proximity but by relative profitability, as suggested by spatial land rent theory [48]. Following the literature [11,45], our spatial weight was defined as
where is the distance sensitiveness factor, with values ranging from 50 km to 300 km, and is the annual average gains with agricultural activities (productivity (kg/ha) multiplied by commodity price, according to the IBGE dataset). This approach assumes that deforestation spillover follows economic returns rather than just physical proximity, and incorporates the economic theory that dictates land use will be (re)allocated where land generates higher returns [11]. The annual land rent by municipality expanded the spatial weight matrix to over 40 million elements. The impact of these modifications on spatial dependence estimates () was evaluated and reported.
The estimated coefficients from our spatial panel model are interpreted as semi-elasticities due to the IHS transformation applied to the variables. Unlike standard linear regressions, where coefficients directly represent absolute changes, the IHS transformation means that the effect of reforestation on deforestation leakage varies depending on the existing level of forestry in a municipality. Therefore, to estimate the impact of a new reforestation project, we must compute the marginal effects based on the estimated coefficients [44]. These effects account for both direct impacts within the municipality and indirect spillovers to neighboring areas. The marginal effects (MEs) of the spillover are derived as
where represents the reforestation area. Similarly, the direct marginal effect of forest plantation (Within-Municipality Impact) is calculated without including W in the equation above. This ensures that the estimated impact reflects realistic changes in deforestation leakage considering the nonlinear nature of the IHS transformation. By computing these marginal effects, we provide a policy-relevant measure of how much deforestation leakage could result from reforestation expansion under carbon market mechanisms.
Figure 2 outlines the main stages of our methodological framework applied in this study.
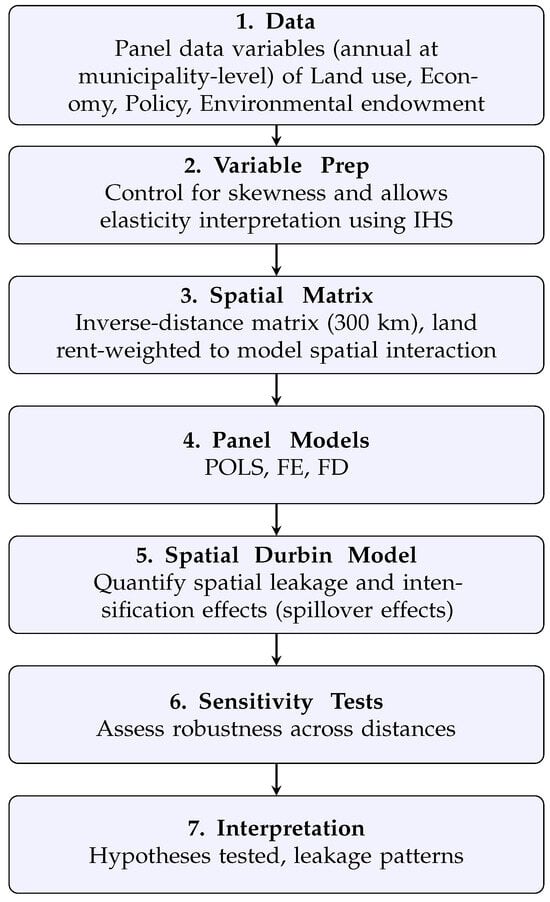
Figure 2.
Overview of methodological steps for estimating spatial leakage from afforestation in the Brazilian Amazon.
4. Results
Our empirical findings reveal strong path dependency in vegetation loss, with reforestation projects contributing to deforestation leakage through spatial spillovers. These effects depend on economic factors, regional land-use dynamics, and the extent of livestock intensification. The results indicate strong persistence, with an auto-regressive coefficient of 0.56 in the fixed effects model (Table 2). This suggests that once deforestation occurs, it is likely to continue rather than reversing back to forest cover. The implications are critical: reforestation efforts must account for historical land-use patterns, as degraded areas rarely transition back to natural vegetation without active restoration measures [61].
Table 2.
Results of the spatial panel regression estimating the impact of forest plantation expansion on vegetation loss.
4.1. The Extension of Leakage Caused by Forest Plantation
Reforestation projects induce spillovers, increasing deforestation in adjacent areas. In the fixed effects model, local forestry area is negatively associated with vegetation loss (Table 2), indicating that reforestation reduces vegetation loss within the reforested municipality. However, the spatially weighted forestry variable has a significant positive coefficient, meaning that reforestation in the Amazon indirectly drives forest loss elsewhere (see FE and FD in Table 2). The estimated marginal effect is 2% both for the FE and FD models, i.e., deforestation leakage for a new area of reforestation. These findings confirm that leakage is a fundamental challenge for carbon crediting schemes. While localized reforestation may appear beneficial, the failure to account for spatial spillovers can lead to an overestimation of net carbon sequestration.
To evaluate how far leakage extends, we conducted sensitivity analysis by varying the spatial weight matrix from 50 km to 300 km. The results show that forestry-related deforestation displacement remains significant up to 150 km (Table 3). This highlights the need for broader landscape planning strategies to mitigate unintended land-use displacement. We also tested for the temporal extent of reforestation-induced leakage, incorporating lagged proximity effects in panel models. The results indicate that deforestation displacement does not occur instantaneously but unfolds over approximately two years. The second lag proximity term exhibits the strongest positive coefficient (Table 4), suggesting that land-use displacement effects intensify after two years. However, this does not necessarily indicate that leakage is limited to short-term dynamics. Instead, it reflects the time required for agricultural expansion decisions to materialize after reforestation reduces available land.
Table 3.
Sensitivity analysis of spatial spillovers across different distances.
Table 4.
Panel model for time persistence.
4.2. Livestock Intensification Fails to Offset Displacement Effects
If increasing cattle stocking rates reduces land-use expansion pressure, we would expect it to be negatively associated with deforestation. However, our models reveal no significant mitigation effect: the coefficient on the cattle stocking rate is small and statistically insignificant across all specifications (Table 2). Furthermore, the spatially weighted cattle variable for the stocking rate does not show meaningful spillover effects, contradicting claims that livestock intensification can offset reforestation-induced displacement. Instead, extensive cattle production persists despite productivity gains, suggesting that incentives for intensification alone are insufficient to curb deforestation.
4.3. Economic Drivers of Deforestation Leakage
The economic context plays a crucial role in mediating the extent of deforestation leakage. Higher agricultural GDP per capita is correlated with increased deforestation (Table 2), suggesting that economic expansion amplifies land-use pressures. While local cattle densities do not directly influence deforestation, the indirect effect of agricultural profitability is significant. This aligns with theories of land market feedback loops, where higher land rents in productive regions push deforestation into less profitable areas. Addressing leakage will require policies that integrate economic incentives with land-use zoning rather than relying solely on reforestation as a mitigation strategy.
To visualize the spatial dynamics underlying our econometric results, we mapped the average land-use changes and modeled leakage intensities across municipalities in the Brazilian Amazon (Figure 3). Figure 3A presents the forest plantation expansion (ha) and vegetation loss (%), revealing distinct zones where reforestation and deforestation co-occur. Figure 3B shows the estimated indirect effect of reforestation on neighboring vegetation loss, calculated as from the Spatial Durbin Model. The results highlight specific leakage corridors, mostly within the Mato Grosso state, where reforestation in one municipality is associated with elevated forest loss in adjacent areas. Still, in Figure 3A, areas where forest plantation expansion overlaps with high vegetation loss may be interpreted as zones of elevated leakage risk.
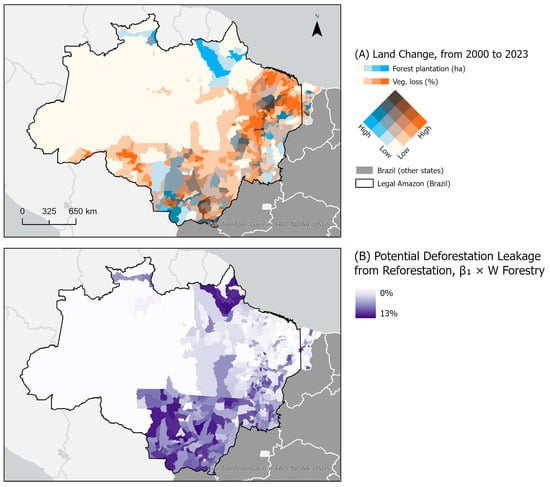
Figure 3.
Spatial patterns of land-use change and modeled deforestation leakage in the Brazilian Amazon (2000–2023). In Panel (A), forest plantation areas are classified in four intervals: 0 to 100, 100 to 1500, 1500 to 5000, and 5000 to 58,000 hectares. In Panel (B), the breaks in the color legend for vegetation loss percentages are grouped into 0 to 25%, 25 to 50%, 50 to 75%, and 75 to 100%.
5. Discussion
5.1. The Extension of Leakage Caused by Reforestation
Our findings confirm the presence of reforestation-induced deforestation leakage in the Brazilian Amazon, with spatial spillovers concentrated within a 150 km radius and manifesting primarily over a two-year window. The estimated marginal displacement is roughly 12% of the reforested area, and it is consistent across both fixed effects and first-difference estimators, reinforcing its robustness. These findings provide empirical weight to longstanding concerns about the indirect land-use change (ILUC) risks associated with reforestation, which are frequently discussed in theoretical or simulation-based contexts [62,63]. The policy implication is clear: even when reforestation succeeds in reducing deforestation locally, spatial externalities can undermine the net environmental benefit unless spatial planning accompanies project deployment. Verra and ART-TREES, among others, currently rely on uniform leakage factors or static buffer zones, which are insufficient to capture this spatial variability [12,13].
Comparatively, our leakage estimates are lower than the global ILUC factors used in lifecycle assessments of biofuels, which often assume displacement rates exceeding 30% or more [14,64]. However, they are higher than the typical discount factors applied in voluntary carbon markets, such as Verra’s default deduction for leakage in avoided deforestation or afforestation projects [12,24]. Indeed, most of Verra’s projects for Brazil have been exempt or have not disclosed how leakage is quantified, often arguing that the project does not displace prior land use, that any displacement is minimal and absorbed locally, or that the affected area is too small to influence regional supply chains. For instance, the public carbon credit project from Suzano company, ReGreen, and Mombak are not clear on their calculation or claims zero leakage on the grounds that the reforested land was previously unproductive and its conversion does not trigger indirect land-use change—we checked the main ARR projects listed on Verra’s registry as of March 2025. This suggests that the spatial displacement from reforestation projects is being systematically underestimated by current offset methodologies, particularly when implemented at scale.
Unlike previous econometric studies that analyzed leakage from REDD+ conservation efforts (e.g., [10,32]), our analysis focuses on land competition from forest plantation expansion, rather than legal restrictions on deforestation. This distinction matters: whereas REDD+ leakage is often a result of regulatory exclusion zones pushing activity elsewhere, reforestation projects actively repurpose productive land, thereby creating direct displacement pressures. Our spatial panel estimates indicate that this form of leakage is not merely a by-product of ineffective enforcement but is structurally embedded in land market dynamics. Furthermore, our use of the Spatial Durbin Model (SDM) allows for a decomposition of spillover effects that many prior models do not capture [11]. For instance, while the authors of [21,65] used input–output or instrumental variable models to examine ILUC in cattle or crop systems, these models often lack the spatial interdependence component to detect where and when the displacement occurs. In contrast, our model captures both the geographic reach and temporal lag of deforestation leakage, showing that spillovers are localized and peak two years after reforestation onset—suggesting a structured economic adjustment process.
Our findings support recent calls to move toward spatially explicit, project- and region-specific leakage accounting in carbon offset programs [25]. Additionally, the distance decay observed (approximately 150 km) aligns with empirical observations on livestock market behavior, where deforestation pressure is known to migrate within regional commodity supply zones [59,60]. These findings reinforce the importance of regional governance scales—rather than project-level boundaries—as the appropriate unit for leakage monitoring and mitigation.
5.2. Drivers of Deforestation Leakage
Our findings suggest that leakage is not a random by-product of land scarcity but reflects structured economic and spatial dynamics. First, we confirm the role of regional economic conditions in shaping leakage intensity. Higher agricultural GDP per capita is significantly associated with vegetation loss, both directly and through spatial spillovers. This indicates that in high-value agricultural regions, reforestation is more likely to displace activities into surrounding areas, consistent with spatial equilibrium models of land rent and land-use competition [8,10]. This also reflects the opportunity cost of land and level of capital availability for landowners with higher land rent, i.e., the sale of a land parcel for reforestation might signal the transition of capital and reinvestment to another region. This flow of capital leading to ILUC has been studied recently [11,33,65]. This economic logic is reinforced by the results signaling a positive association between reforestation and vegetation loss in neighboring municipalities. The magnitude of agricultural displacement in the vicinity of reforestation is partly caused by differences in the land rents and law enforcement, i.e., lower land value and weaker enforcement attract agricultural expansion. This pattern parallels findings in [32,33], which note that frontier expansion often follows spatial gradients of opportunity cost and institutional presence.
Moreover, the temporal dynamics uncovered highlight that leakage may happen two years after reforestation land change. This suggests that actors respond to land-use change not only through migration but also through economic adjustment processes, such as reorganizing herds, investing in new land, or reallocating labor. These temporal lags are rarely captured in static leakage models or protocols of afforestation projects, yet they have material implications for carbon accounting accuracy [9,61]. Importantly, our results focus on reforestation displacing ranching instead of crops. This is supported by the mobility of pasture-based systems and lower biophysical constraints for extensive cattle expansion, as observed in [34,60]. This asymmetry implies that leakage, in general, requires tailored strategies, such as stricter pasture zoning or cattle traceability enforcement. Taken together, these mechanisms show that reforestation-induced leakage is not incidental—it is driven by land market signals, delayed behavioral responses, and sectoral dynamics, all of which must be explicitly integrated into policy frameworks and carbon market methodologies.
5.3. The Failure of Livestock Intensification to Offset Displacement
Livestock intensification is often promoted as a win–win strategy to reconcile agricultural productivity with forest conservation. In theory, increasing cattle stocking rates should reduce pressure on land by allowing more output per hectare, thereby mitigating deforestation or leakage risks [15]. However, our findings show no significant relationship between stocking rates and reductions in deforestation, neither directly nor through spatial spillovers. This result aligns with emerging empirical critiques of the so-called “sustainable intensification” hypothesis in frontier contexts [17,33].
The lack of mitigation effect may reflect a rebound dynamic, where higher productivity leads to increased profitability and reinvestment in expansion, rather than sparing land. This is particularly plausible in Brazil, where rising beef prices and flexible land markets create incentives to expand production even after intensifying. Similar dynamics were observed in [16], which found that pasture intensification in Mato Grosso was associated with increased, not decreased, deforestation. We argue that, in the absence of land-use planning or enforceable land sparing rules, productivity gains in cattle systems do not translate into conservation outcomes. This supports the broader literature arguing that intensification, without accompanying institutions, often fails to deliver environmental co-benefits [8,39].
The spatial lag effect of the stocking rate (i.e., intensification in neighboring municipalities) showed no significant spillover effects, suggesting that intensification is a localized strategy with weak systemic impact. In other words, even if one municipality intensifies, neighboring areas are not insulated from displacement pressures. This undermines policy narratives that promote isolated technological interventions as scalable climate solutions. In summary, livestock intensification alone cannot be relied upon to offset reforestation-induced leakage. Without spatially explicit governance mechanisms—such as cattle ranching zoning, environmental conditionality in credit, or traceability of beef production—productivity gains risk reinforcing expansion dynamics rather than replacing them.
5.4. Toward Better Leakage Accounting: Implications for Carbon Market and Large Scale Reforestation
Voluntary standards such as Verra and ART-TREES apply simplified assumptions—typically fixed leakage discount rates or buffer zones—that are not designed to capture the spatial heterogeneity and lagged dynamics of agricultural displacement uncovered in our analysis [12,24]. However, our results show that reforestation displaces deforestation primarily within 150 km and over a two-year horizon, suggesting that leakage is not diffuse but predictable and measurable under specific land-use and economic conditions. These insights support recent critiques that current offset protocols systematically overestimate net carbon gains by ignoring indirect land-use change (ILUC) [13,14]. For instance, if reforestation is credited without adjusting for downstream displacement, the resulting carbon benefit may be inflated and undermine the environmental integrity of emission reduction claims. While some protocols allow for leakage monitoring, few require spatial econometric or landscape-scale assessments, and most rely on default values derived from case studies with limited transferability.
Rather than penalizing all projects with conservative leakage deductions, a more credible and equitable approach would involve context-specific leakage accounting. We argue that project-level estimates can be improved by integrating (i) spatial interaction modeling at the municipal or regional scale; (ii) economic contextualization, especially land rents and commodity prices; and (iii) sectoral differentiation, acknowledging that ranching and cropping have different displacement patterns. Such refinements would allow crediting frameworks to better distinguish between high- and low-risk projects. For example, smallholder agroforestry projects in degraded areas may pose minimal leakage risk, while large-scale commercial forest plantations in active ranching zones may require stricter buffers or alternative crediting rules. Uniform leakage discounts risk penalizing the former unfairly while underestimating the risks posed by the latter. Additionally, project developers and regulators should consider reinvesting a portion of carbon credit revenues into leakage mitigation measures, such as land-use zoning, support for sustainable livelihoods in neighboring areas, or integration with jurisdictional REDD+ initiatives. By shifting from a project-by-project logic to a jurisdictional and landscape governance approach, leakage risks can be internalized without undermining financial viability [20,25].
Ultimately, improving leakage accounting is not just a technical refinement—it is essential for maintaining the credibility of carbon markets and ensuring that climate mitigation efforts do not shift environmental burdens to other communities or ecosystems.
5.5. Limitations and Future Research
While this study provides one of the first spatial econometric assessments of reforestation-induced leakage in the Brazilian Amazon, it is not without limitations. First, our analysis relies on secondary land cover data from MapBiomas, which, although validated and widely adopted, does not include direct measures of forest plantation survival or carbon stock accumulation. Field-based verification to set aside ecological reforestation and biomass would enhance the precision of net sequestration estimates. Indeed, our use of forest plantation area as a proxy for reforestation does not differentiate between commercial and ecological reforestation, or between planted and naturally regenerating forests. While this is methodologically necessary due to data limitations, it leaves open the question of whether displacement patterns differ across reforestation types. Future studies should disaggregate these categories, potentially using high-resolution satellite imagery or project-specific documentation.
Second, while our spatial panel model captures local and spillover effects, it does not include commodity price feedbacks, such as changes in beef or soy prices following land scarcity from reforestation. Prior ILUC models suggest that even marginal reductions in land availability can trigger market-mediated deforestation elsewhere [62,64]. Integrating partial equilibrium or agent-based models with spatial econometric frameworks could better simulate how price signals and actor responses evolve in tandem.
Third, the spatial scale of analysis, i.e., municipalities, limits the ability to capture finer-grained displacement dynamics, such as land speculation, parcel-level migration of cattle, or intra-municipal nuances. Micro-level studies with property-level data could help uncover more subtle feedback, including interactions between land tenure, enforcement capacity, and land-use change decisions.
Finally, we acknowledge that leakage may target secondary vegetation or areas under forest regeneration rather than primary forests. Some studies suggest that regrowth forests are particularly vulnerable to displacement due to their ambiguous legal status and lower economic value [66,67]. Assessing whether leakage disproportionately affects these transitional ecosystems would refine our understanding of long-term carbon and biodiversity trade-offs in restoration policies.
Despite these limitations, the core contribution of this study remains: spatial leakage from reforestation is real, measurable, and policy-relevant. Closing the remaining knowledge gaps will require interdisciplinary approaches that integrate spatial analysis, economics, field ecology, and governance diagnostics to support more credible and equitable reforestation strategies.
6. Conclusions
This study provides empirical evidence that reforestation in the Brazilian Amazon generates measurable deforestation leakage through localized land-use displacement. Using a spatial Durbin panel model, we show that while forest plantations reduce vegetation loss within targeted municipalities, they induce spillover effects within a 150 km radius—displacing approximately 12% of the reforested area into surrounding regions. These findings confirm our first hypothesis (), demonstrating that reforestation can unintentionally shift agricultural pressures rather than eliminate them.
Contrary to the common assumption that livestock intensification mitigates land expansion, our results do not support the second hypothesis (). Stocking rate increases do not significantly reduce deforestation, suggesting that rebound effects or weak institutional safeguards offset the land sparing potential of intensification. This challenges prevailing narratives in climate policy that promote productivity gains as standalone solutions to land-use conflict.
Our analysis contributes a novel empirical foundation to the debate on carbon offset integrity. By combining spatial econometrics with a landscape-scale framing, we demonstrate that leakage is not diffuse or unpredictable, but instead follows identifiable economic and geographic patterns. This has direct implications for voluntary carbon markets such as Verra and ART-TREES, whose current methodologies apply uniform or static leakage assumptions that risk overestimating net climate benefits. Incorporating spatially explicit leakage accounting—based on project scale, land-use context, and regional dynamics—would enhance the credibility and environmental effectiveness of reforestation-based offsets.
Rather than impose blanket financial penalties, a more effective strategy is to integrate leakage mitigation into project design and regional governance. This includes spatial zoning to steer reforestation away from high-risk frontier zones, the reinvestment of carbon credit revenues into sustainable livelihoods and tenure security, and alignment with jurisdictional approaches to conservation planning.
Limitations of this study include the reliance on secondary land cover data, lack of differentiation between reforestation types, and exclusion of commodity price feedbacks. Nonetheless, the results offer a robust baseline from which further integrated modeling and field-based verification can be realized. Future research should investigate how leakage varies across ecological restoration versus commercial forestry, and whether it disproportionately affects secondary vegetation and regenerating landscapes.
Reforestation remains a vital climate mitigation strategy. However, its effectiveness depends on whether it reduces global emissions—or merely redistributes them across space. This study underscores the need to move beyond project-level accounting and toward integrated, spatially informed land-use policy frameworks that prevent unintended environmental trade-offs while advancing sustainable development goals.
Author Contributions
Conceptualization, data curation, methodology, and original draft preparation, D.S.S.; formal analysis, D.S.S.; writing—review and editing, D.S.S. and S.N.; visualization, D.S.S. All authors have read and agreed to the published version of the manuscript.
Funding
This research received no external funding.
Data Availability Statement
The data presented in this study are available from the Harvard Dataverse at https://doi.org/10.7910/DVN/A05ACN. These data were derived from the following resources in the public domain, as described in the Methods section: IBGE, INPE, Mapbiomas, and others.
Conflicts of Interest
The authors declare no conflicts of interest.
References
- Griscom, B.W.; Adams, J.; Ellis, P.W.; Houghton, R.A.; Lomax, G.; Miteva, D.A.; Schlesinger, W.H.; Shoch, D.; Siikamäki, J.V.; Smith, P.; et al. Natural climate solutions. Proc. Natl. Acad. Sci. USA 2017, 114, 11645–11650. [Google Scholar] [CrossRef] [PubMed]
- Mitchard, E.T. The tropical forest carbon cycle and climate change. Nature 2018, 559, 527–534. [Google Scholar] [CrossRef] [PubMed]
- Pugh, T.A.; Lindeskog, M.; Smith, B.; Poulter, B.; Arneth, A.; Haverd, V.; Calle, L. Role of forest regrowth in global carbon sink dynamics. Proc. Natl. Acad. Sci. USA 2019, 116, 4382–4387. [Google Scholar] [CrossRef] [PubMed]
- Lewis, S.L.; Wheeler, C.E.; Mitchard, E.T.; Koch, A. Restoring natural forests is the best way to remove atmospheric carbon. Nature 2019, 568, 25–28. [Google Scholar] [CrossRef]
- Barros, F.d.V.; Lewis, K.; Robertson, A.D.; Pennington, R.T.; Hill, T.C.; Matthews, C.; Lira-Martins, D.; Mazzochini, G.G.; Oliveira, R.S.; Rowland, L. Cost-effective restoration for carbon sequestration across Brazil’s biomes. Sci. Total Environ. 2023, 876, 162600. [Google Scholar] [CrossRef]
- Long, H.; Zhang, Y.; Ma, L.; Tu, S. Land use transitions: Progress, challenges and prospects. Land 2021, 10, 903. [Google Scholar] [CrossRef]
- de Aguiar, A.P.D.; Câmara, G.; Ribeiro, D.F.M.P.; Sampaio, G.; Aragão, L.E.O.C.; Brondizio, M.; Nobre, C.A.; Rosa, N.S.; Oliveira, M.G.P.; Alencar, R.C.C. Land use change emission scenarios: Anticipating a forest transition process in the Brazilian Amazon. Glob. Change Biol. 2016, 22, 1821–1840. [Google Scholar] [CrossRef]
- Lambin, E.F.; Meyfroidt, P. Global land use change, economic globalization, and the looming land scarcity. Proc. Natl. Acad. Sci. USA 2011, 108, 3465–3472. [Google Scholar] [CrossRef]
- Meyfroidt, P.; Rudel, T.K.; Lambin, E.F. Forest transitions, trade, and the global displacement of land use. Proc. Natl. Acad. Sci. USA 2010, 107, 20917–20921. [Google Scholar] [CrossRef]
- Robalino, J.A.; Pfaff, A. Contagious development: Neighbor interactions in deforestation. J. Dev. Econ. 2012, 97, 427–436. [Google Scholar] [CrossRef]
- Richards, P.D.; Walker, R.T.; Arima, E.Y. Spatially complex land change: The Indirect effect of Brazil’s agricultural sector on land use in Amazonia. Glob. Environ. Change 2014, 29, 1–9. [Google Scholar] [CrossRef] [PubMed]
- Haya, B.K.; Evans, S.; Brown, L.; Bukoski, J.; Butsic, V.; Cabiyo, B.; Jacobson, R.; Kerr, A.; Potts, M.; Sanchez, D.L. Comprehensive review of carbon quantification by improved forest management offset protocols. Front. For. Glob. Change 2023, 6, 958879. [Google Scholar] [CrossRef]
- West, T.A.; Grogan, K.A.; Swisher, M.E.; Caviglia-Harris, J.L.; Sills, E.; Harris, D.; Roberts, D.; Putz, F.E. A hybrid optimization-agent-based model of REDD+ payments to households on an old deforestation frontier in the Brazilian Amazon. Environ. Model. Softw. 2018, 100, 159–174. [Google Scholar] [CrossRef]
- Searchinger, T.D.; Wirsenius, S.; Beringer, T.; Dumas, P. Assessing the efficiency of changes in land use for mitigating climate change. Nature 2018, 564, 249–253. [Google Scholar] [CrossRef]
- Cohn, A.S.; Bowman, M.; Zilberman, D.M.; O’Neill, K. The viability of cattle ranching intensification in Brazil as a strategy to spare land and mitigate greenhouse gas emissions. Clim. Change 2014, 126, 463–485. [Google Scholar]
- Koch, N.; zu Ermgassen, E.K.; Wehkamp, J.; Oliveira Filho, F.J.; Schwerhoff, G. Agricultural productivity and forest conservation: Evidence from the Brazilian Amazon. Am. J. Agric. Econ. 2019, 101, 919–940. [Google Scholar] [CrossRef]
- García, V.R.; Gaspart, F.; Kastner, T.; Meyfroidt, P. Agricultural intensification and land use change: Assessing country-level induced intensification, land sparing and rebound effect. Environ. Res. Lett. 2020, 15, 085007. [Google Scholar] [CrossRef]
- Etter, A.; Andrade, A.; Nelson, C.R.; Cortés, J.; Saavedra, K. Assessing restoration priorities for high-risk ecosystems: An application of the IUCN Red List of Ecosystems. Land Use Policy 2020, 99, 104874. [Google Scholar] [CrossRef]
- Azevedo, T.R.; Costa Junior, C.; Brandão Junior, A.; Cremer, M.d.S.; Piatto, M.; Tsai, D.S.; Barreto, P.; Martins, H.; Sales, M.; Galuchi, T.; et al. SEEG initiative estimates of Brazilian greenhouse gas emissions from 1970 to 2015. Sci. Data 2018, 5, 180045. [Google Scholar] [CrossRef]
- Streck, C. REDD+ and leakage: Debunking myths and promoting integrated solutions. Clim. Policy 2021, 21, 843–852. [Google Scholar] [CrossRef]
- Moffette, F.; Gibbs, H.K. Agricultural Displacement and Deforestation Leakage in the Brazilian Legal Amazon. Land Econ. 2021, 97, 155–179. [Google Scholar] [CrossRef]
- Gibbs, H.K.; Rausch, L.; Munger, J.; Schelly, I.; Morton, D.C.; Noojipady, P.; Soares-Filho, B.; Barreto, P.; Micol, L.; Walker, N.F. Brazil’s Soy Moratorium. Science 2015, 347, 377–378. [Google Scholar] [CrossRef] [PubMed]
- Jiao, Y.; Wang, D.; Yao, X.; Wang, S.; Chi, T.; Meng, Y. Forest emissions reduction assessment using optical satellite imagery and space LiDAR fusion for carbon stock estimation. Remote Sens. 2023, 15, 1410. [Google Scholar] [CrossRef]
- Chagas, T.; Galt, H.; Lee, D.; Neeff, T.; Streck, C. A Close Look at the Quality of REDD+ Carbon Credits. 2020. Available online: https://coilink.org/20.500.12592/wmkwj7 (accessed on 20 November 2024).
- Filewod, B.; McCarney, G. Avoiding carbon leakage from nature-based offsets by design. One Earth 2023, 6, 790–802. [Google Scholar] [CrossRef]
- Instituto Nacional de Pesquisas Espaciais (INPE). Projeto PRODES: Monitoramento da Floresta Amazônica Brasileira por Satélite. 2024. Available online: http://www.obt.inpe.br/OBT/assuntos/programas/amazonia/prodes (accessed on 14 March 2025).
- Souza, C.M., Jr.; Shimbo, J.Z.; Rosa, M.R.; Parente, L.L.; Alencar, A.A.; Rudorff, B.F.; Hasenack, H.; Matsumoto, M.; Ferreira, L.G.; Souza-Filho, P.W.; et al. Reconstructing three decades of land use and land cover changes in brazilian biomes with landsat archive and earth engine. Remote Sens. 2020, 12, 2735. [Google Scholar] [CrossRef]
- Waring, B.; Neumann, M.; Prentice, I.C.; Adams, M.; Smith, P.; Siegert, M. Forests and decarbonization–roles of natural and planted forests. Front. For. Glob. Change 2020, 3, 534891. [Google Scholar] [CrossRef]
- Di Sacco, A.; Hardwick, K.A.; Blakesley, D.; Brancalion, P.H.; Breman, E.; Cecilio Rebola, L.; Chomba, S.; Dixon, K.; Elliott, S.; Ruyonga, G.; et al. Ten golden rules for reforestation to optimize carbon sequestration, biodiversity recovery and livelihood benefits. Glob. Change Biol. 2021, 27, 1328–1348. [Google Scholar] [CrossRef]
- Busch, J.; Ferretti-Gallon, K. What drives and stops deforestation, reforestation, and forest degradation? An updated meta-analysis. Rev. Environ. Econ. Policy 2023, 17, 217–250. [Google Scholar] [CrossRef]
- Henders, S.; Ostwald, M. Forest Carbon Leakage Quantification Methods and Their Suitability for Assessing Leakage in REDD. Forests 2012, 3, 33–58. [Google Scholar] [CrossRef]
- Pfaff, A.; Walker, R. Regional interdependence and forest “transitions”: Substitute deforestation limits the relevance of local reversals. Land Use Policy 2010, 27, 119–129. [Google Scholar] [CrossRef]
- Arima, E.Y.; Richards, P.; Walker, R.; Caldas, M.M. Statistical confirmation of indirect land use change in the Brazilian Amazon. Environ. Res. Lett. 2011, 6, 024010. [Google Scholar] [CrossRef]
- Brandão, A., Jr.; Rausch, L.; Paz Durán, A.; Costa, C., Jr.; Spawn, S.A.; Gibbs, H.K. Estimating the potential for conservation and farming in the Amazon and Cerrado under four policy scenarios. Sustainability 2020, 12, 1277. [Google Scholar] [CrossRef]
- Kastner, T.; Chaudhary, A.; Gingrich, S.; Marques, A.; Persson, U.M.; Bidoglio, G.; Le Provost, G.; Schwarzmüller, F. Global agricultural trade and land system sustainability: Implications for ecosystem carbon storage, biodiversity, and human nutrition. One Earth 2021, 4, 1425–1443. [Google Scholar] [CrossRef]
- Escobar, N.; Valin, H.; Frank, S.; Galperin, D.; Wade, C.M.; Ringwald, L.; Tanner, D.; Hinkel, N.; Havlík, P.; Baker, J.S.; et al. Understanding Uncertainty in Market-Mediated Responses to US Oilseed Biodiesel Demand: Sensitivity of ILUC Emission Estimates to GLOBIOM Parametric Uncertainty. Environ. Sci. Technol. 2024, 59, 302–314. [Google Scholar] [CrossRef]
- Meyfroidt, P.; De Bremond, A.; Ryan, C.M.; Archer, E.; Aspinall, R.; Chhabra, A.; Camara, G.; Corbera, E.; DeFries, R.; Díaz, S.; et al. Ten facts about land systems for sustainability. Proc. Natl. Acad. Sci. USA 2022, 119, e2109217118. [Google Scholar] [CrossRef]
- Leblois, A.; Damette, O.; Wolfersberger, J. What has driven deforestation in developing countries since the 2000s? Evidence from new remote-sensing data. World Dev. 2017, 92, 82–102. [Google Scholar] [CrossRef]
- Merry, F.; Soares-Filho, B. Will intensification of beef production deliver conservation outcomes in the Brazilian Amazon? Elem. Sci. Anth 2017, 5, 24. [Google Scholar] [CrossRef]
- Alix-Garcia, J.M.; Shapiro, E.N.; Sims, K.R. Forest conservation and slippage: Evidence from Mexico’s national payments for ecosystem services program. Land Econ. 2012, 88, 613–638. [Google Scholar] [CrossRef]
- Honey-Rosés, J.; Baylis, K.; Ramirez, M.I. A spatially explicit estimate of avoided forest loss. Conserv. Biol. 2011, 25, 1032–1043. [Google Scholar] [CrossRef]
- Andam, K.S.; Ferraro, P.J.; Pfaff, A.; Sanchez-Azofeifa, G.A.; Robalino, J.A. Measuring the effectiveness of protected area networks in reducing deforestation. Proc. Natl. Acad. Sci. USA 2008, 105, 16089–16094. [Google Scholar] [CrossRef]
- Sills, E.O.; Herrera, D.; Kirkpatrick, A.J.; Brandão, A., Jr.; Dickson, R.; Hall, S.; Pattanayak, S.; Shoch, D.; Vedoveto, M.; Young, L.; et al. Estimating the impacts of local policy innovation: The synthetic control method applied to tropical deforestation. PLoS ONE 2015, 10, e0132590. [Google Scholar] [CrossRef] [PubMed]
- Anselin, L. Spatial Econometrics: Methods and Models; Springer: Santa Barbara, CA, USA, 1988. [Google Scholar] [CrossRef]
- Elhorst, J.P. Applied spatial econometrics: Raising the bar. Spat. Econ. Anal. 2010, 5, 9–28. [Google Scholar] [CrossRef]
- Baylis, K.; Fullerton, D.; Shah, P. What Drives Forest Leakage. Working Paper, Department of Agricultural and Consumer Economics, University of Illinois at Urbana-Champaign. 2016. Available online: https://conference.nber.org/confer/2016/SI2016/EEE/Baylis_Fullerton_Shah.pdf (accessed on 20 November 2024).
- Belotti, F.; Hughes, G.; Mortari, A.P. Spatial panel-data models using Stata. Stata J. 2017, 17, 139–180. [Google Scholar] [CrossRef]
- Research Council, T.N. Advancing Land Change Modeling; The National Academies Press: Washington, DC, USA, 2014. [Google Scholar] [CrossRef]
- Geist, H.J.; Lambin, E.F. Proximate Causes and Underlying Driving Forces of Tropical Deforestation. BioScience 2002, 52, 143–150. [Google Scholar] [CrossRef]
- Instituto Brasileiro de Geografia e Estatística (IBGE). Sistema IBGE de Recuperação Automática (SIDRA). 2023. Available online: https://sidra.ibge.gov.br (accessed on 20 November 2024).
- Instituto Brasileiro de Geografia e Estatística (IBGE). Produto Interno Bruto dos Municípios. 2023; Municipal GDP Dataset. Available online: https://www.ibge.gov.br/estatisticas/economicas/contas-nacionais/9088-produto-interno-bruto-dos-municipios.html (accessed on 20 November 2024).
- Funk, C.; Peterson, P.; Landsfeld, M.; Pedreros, D.; Verdin, J.; Shukla, S.; Husak, G.; Rowland, J.; Harrison, L.; Hoell, A.; et al. The climate hazards infrared precipitation with stations—A new environmental record for monitoring extremes. Sci. Data 2015, 2, 150066. [Google Scholar] [CrossRef]
- Copernicus Climate Change Service (C3S). ERA5: Fifth Generation of ECMWF Atmospheric Reanalyses of the Global Climate; Copernicus Climate Change Service: Bonn, Germany, 2017; Available online: https://cds.climate.copernicus.eu/datasets/reanalysis-era5-single-levels?tab=overview (accessed on 12 January 2024).
- Instituto Brasileiro de Geografia e Estatística (IBGE). Estimativas da População por Município. 2023. Available online: https://www.ibge.gov.br/estatisticas/sociais/populacao/9103-estimativas-de-populacao.html (accessed on 20 November 2024).
- Instituto Brasileiro do Meio Ambiente e dos Recursos Naturais Renováveis (IBAMA). Áreas Embargadas por Desmatamento Ilegal. 2023; IBAMA Open Data Portal. Available online: http://dadosabertos.ibama.gov.br/dataset/termos-de-embargo (accessed on 20 November 2024).
- Aihounton, G.B.; Henningsen, A. Units of measurement and the inverse hyperbolic sine transformation. Econom. J. 2021, 24, 334–351. [Google Scholar] [CrossRef]
- Bellemare, M.F.; Wichman, C.J. Elasticities and the inverse hyperbolic sine transformation. Oxf. Bull. Econ. Stat. 2020, 82, 50–61. [Google Scholar] [CrossRef]
- Norton, E.C. The inverse hyperbolic sine transformation and retransformed marginal effects. Stata J. 2022, 22, 702–712. [Google Scholar] [CrossRef]
- Vale, P.; Gibbs, H.; Vale, R.; Munger, J.; Brandão, A., Jr.; Christie, M.; Florence, E. Mapping the cattle industry in Brazil’s most dynamic cattle-ranching state: Slaughterhouses in Mato Grosso, 1967–2016. PLoS ONE 2019, 14, e0215286. [Google Scholar] [CrossRef]
- Barreto, P.; Pereira, R.; Brandão, A., Jr.; Baima, S. Os Frigoríficos vão Ajudar a Zerar o Desmatamento da Amazônia; Instituto do Homem e Meio Ambiente da Amazônia (Imazon) and Instituto Centro de Vida (ICV): Belém and Cuiabá, Brazil, 2017; Available online: https://imazon.org.br/os-frigorificos-vao-ajudar-a-zerar-o-desmatamento-da-amazonia/ (accessed on 12 January 2024).
- Sloan, S. Reforestation reversals and forest transitions. Land Use Policy 2022, 112, 105800. [Google Scholar] [CrossRef]
- Searchinger, T.; Heimlich, R.; Houghton, R.A.; Dong, F.; Elobeid, A.; Fabiosa, J.; Tokgoz, S.; Hayes, D.; Yu, T.H. Use of US croplands for biofuels increases greenhouse gases through emissions from land-use change. Science 2008, 319, 1238–1240. [Google Scholar] [CrossRef] [PubMed]
- Lapola, D.M.; Schaldach, R.; Alcamo, J.; Bondeau, A.; Koch, J.; Koelking, C.; Priess, J.A. Indirect land-use changes can overcome carbon savings from biofuels in Brazil. Proc. Natl. Acad. Sci. USA 2010, 107, 3388–3393. [Google Scholar] [CrossRef] [PubMed]
- van Zonneveld, M.; Turmel, M.; Hellin, J. Decision-Making to Diversify Farm Systems for Climate Change Adaptation. Front. Sustain. Food Syst. 2020, 4, 32. [Google Scholar] [CrossRef]
- Miranda, J.; Börner, J.; Kalkuhl, M.; Soares-Filho, B. Land speculation and conservation policy leakage in Brazil. Environ. Res. Lett. 2019, 14, 045006. [Google Scholar] [CrossRef]
- Nunes, S.; Oliveira, L.; Siqueira, J.; Morton, D.C.; Souza, C.M. Unmasking secondary vegetation dynamics in the Brazilian Amazon. Environ. Res. Lett. 2020, 15, 034057. [Google Scholar] [CrossRef]
- Lennox, G.D.; Gardner, T.A.; Thomson, J.R.; Ferreira, J.; Berenguer, E.; Lees, A.C.; Mac Nally, R.; Aragão, L.E.; Ferraz, S.F.; Louzada, J.; et al. Second rate or a second chance? Assessing biomass and biodiversity recovery in regenerating Amazonian forests. Glob. Change Biol. 2018, 24, 5680–5694. [Google Scholar] [CrossRef]
Disclaimer/Publisher’s Note: The statements, opinions and data contained in all publications are solely those of the individual author(s) and contributor(s) and not of MDPI and/or the editor(s). MDPI and/or the editor(s) disclaim responsibility for any injury to people or property resulting from any ideas, methods, instructions or products referred to in the content. |
© 2025 by the authors. Licensee MDPI, Basel, Switzerland. This article is an open access article distributed under the terms and conditions of the Creative Commons Attribution (CC BY) license (https://creativecommons.org/licenses/by/4.0/).