
Integrating Machine Learning, SHAP Interpretability, and Deep Learning Approaches in the Study of Environmental and Economic Factors: A Case Study of Residential Segregation in Las Vegas


Abstract
1. Introduction
1.1. Insufficient Research on the Impact of Housing Prices on Residential Segregation
1.2. Influence of Local Environmental Factors on Residential Segregation
1.3. Research Scale and Multiracial Subject Issues in Residential Segregation Studies
1.4. Improve the Accuracy of Residential Segregation Models
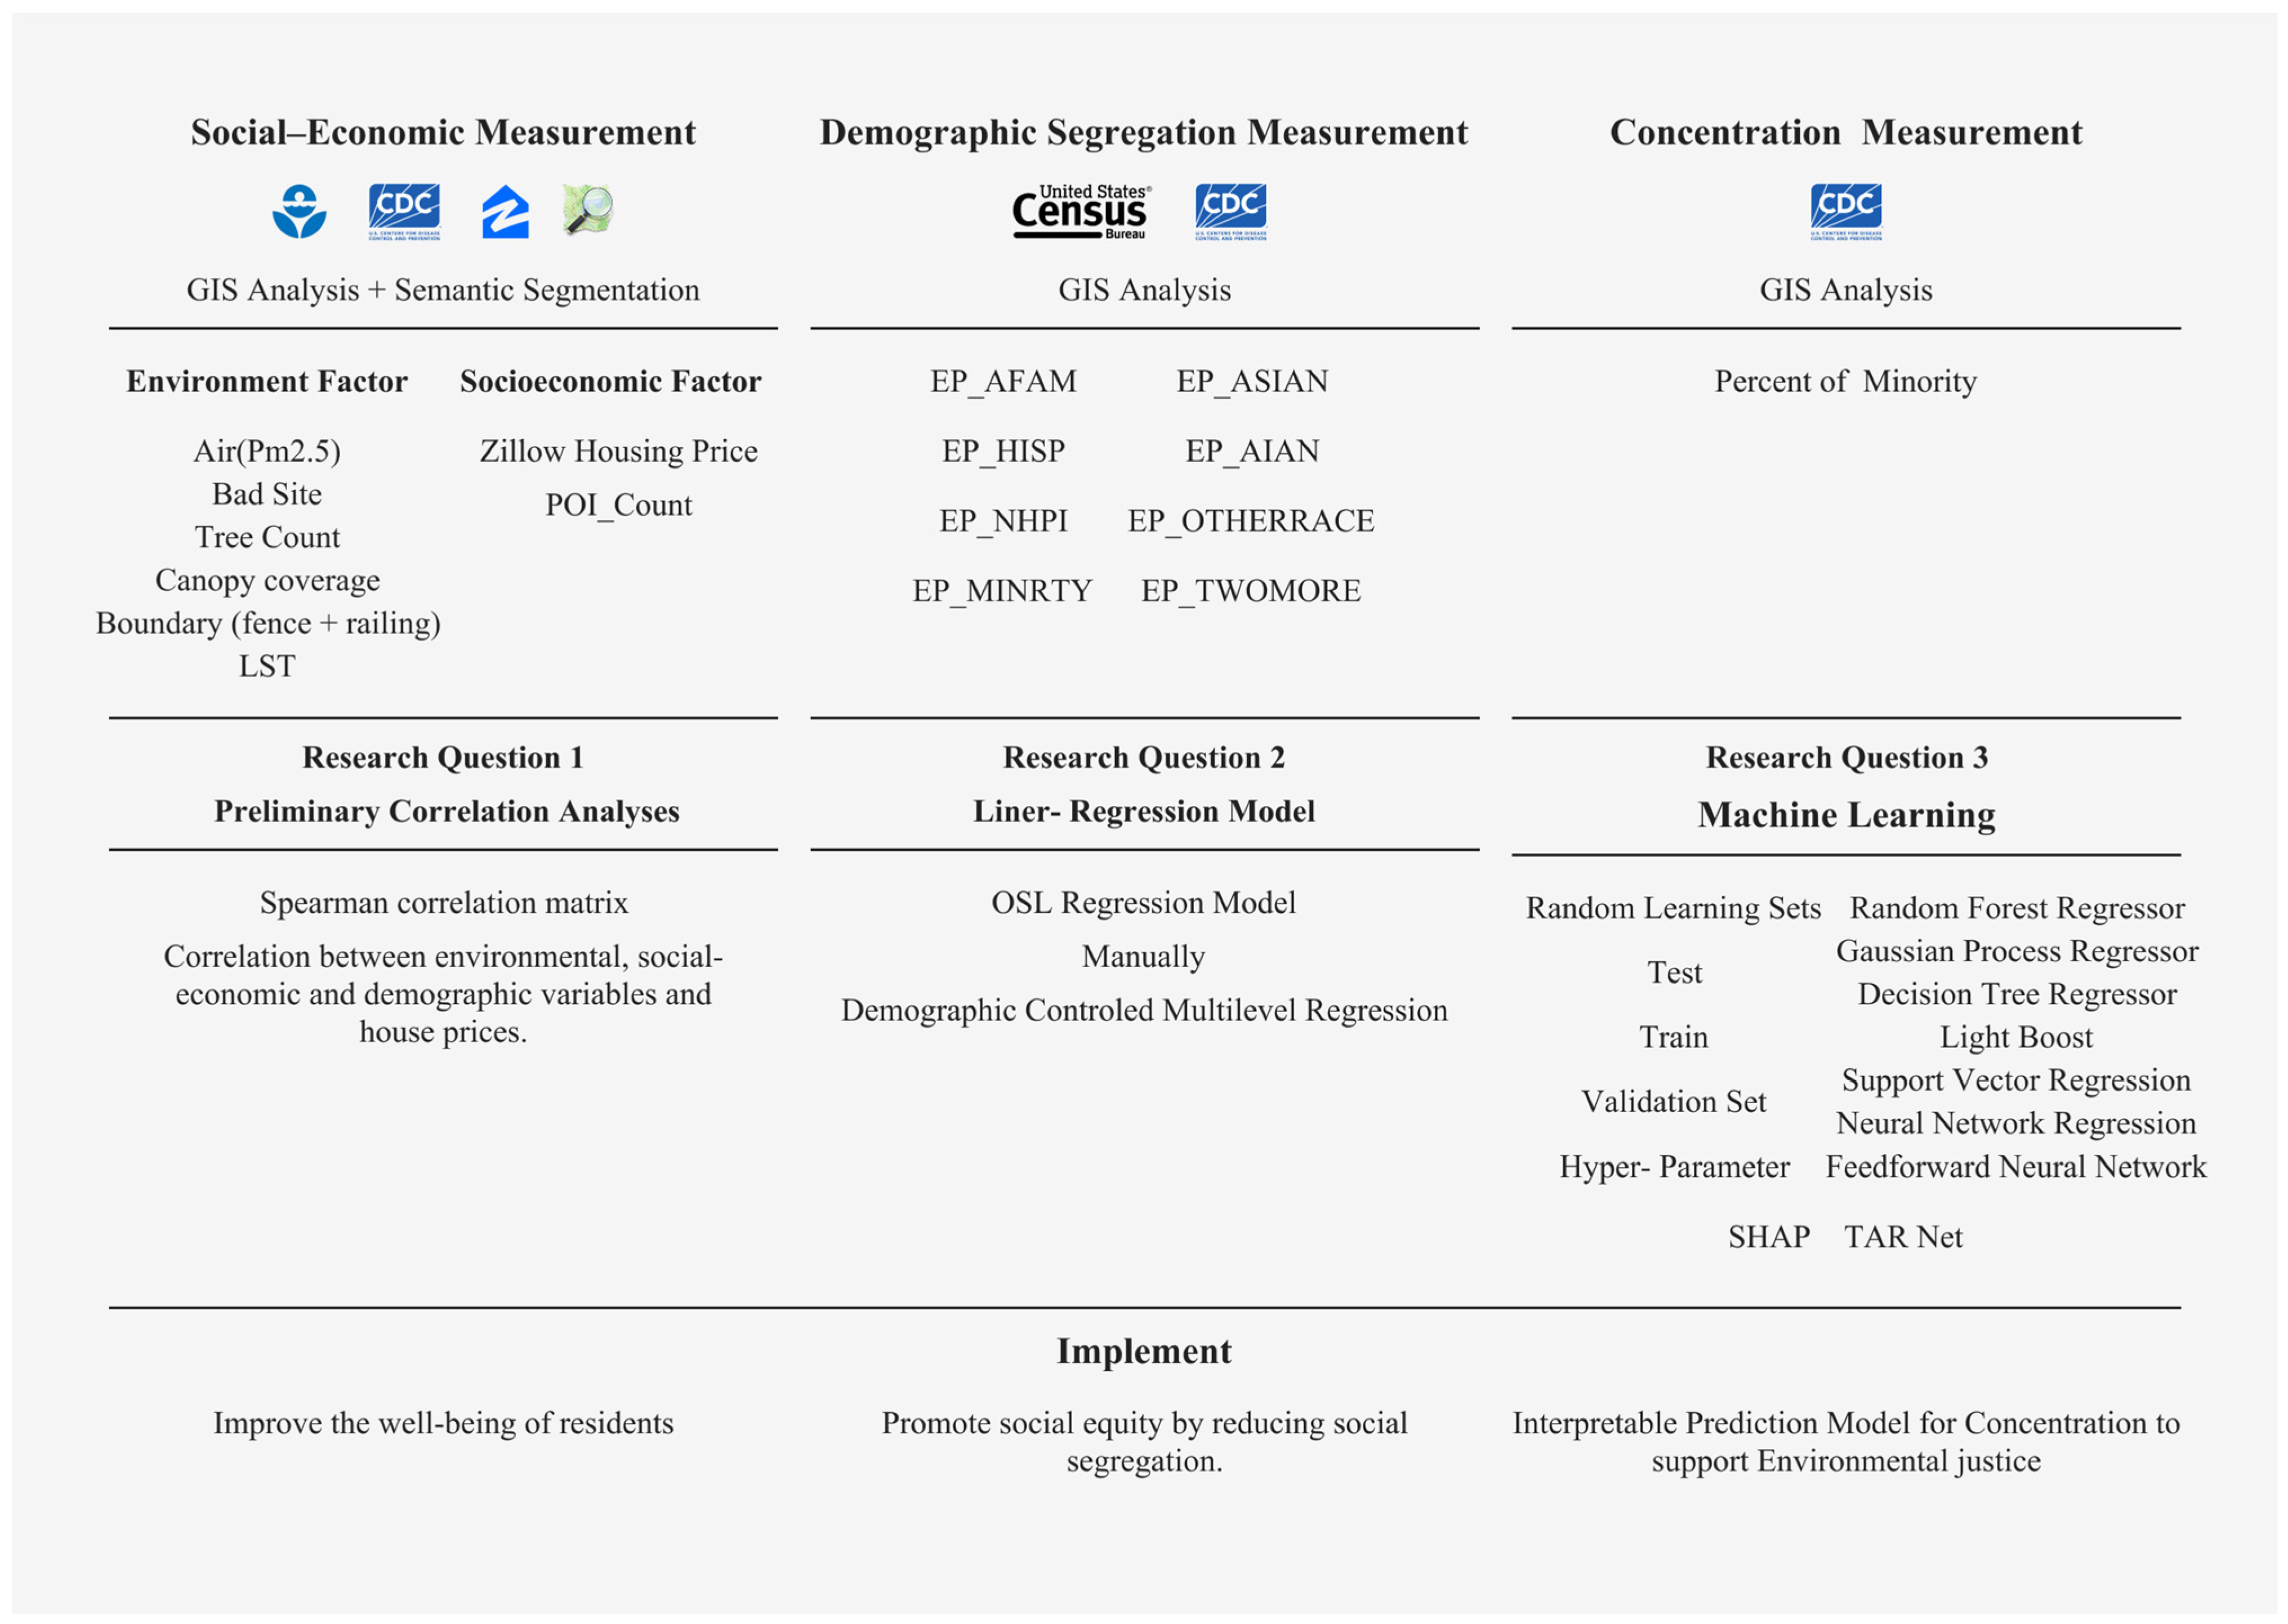
2. Methodology
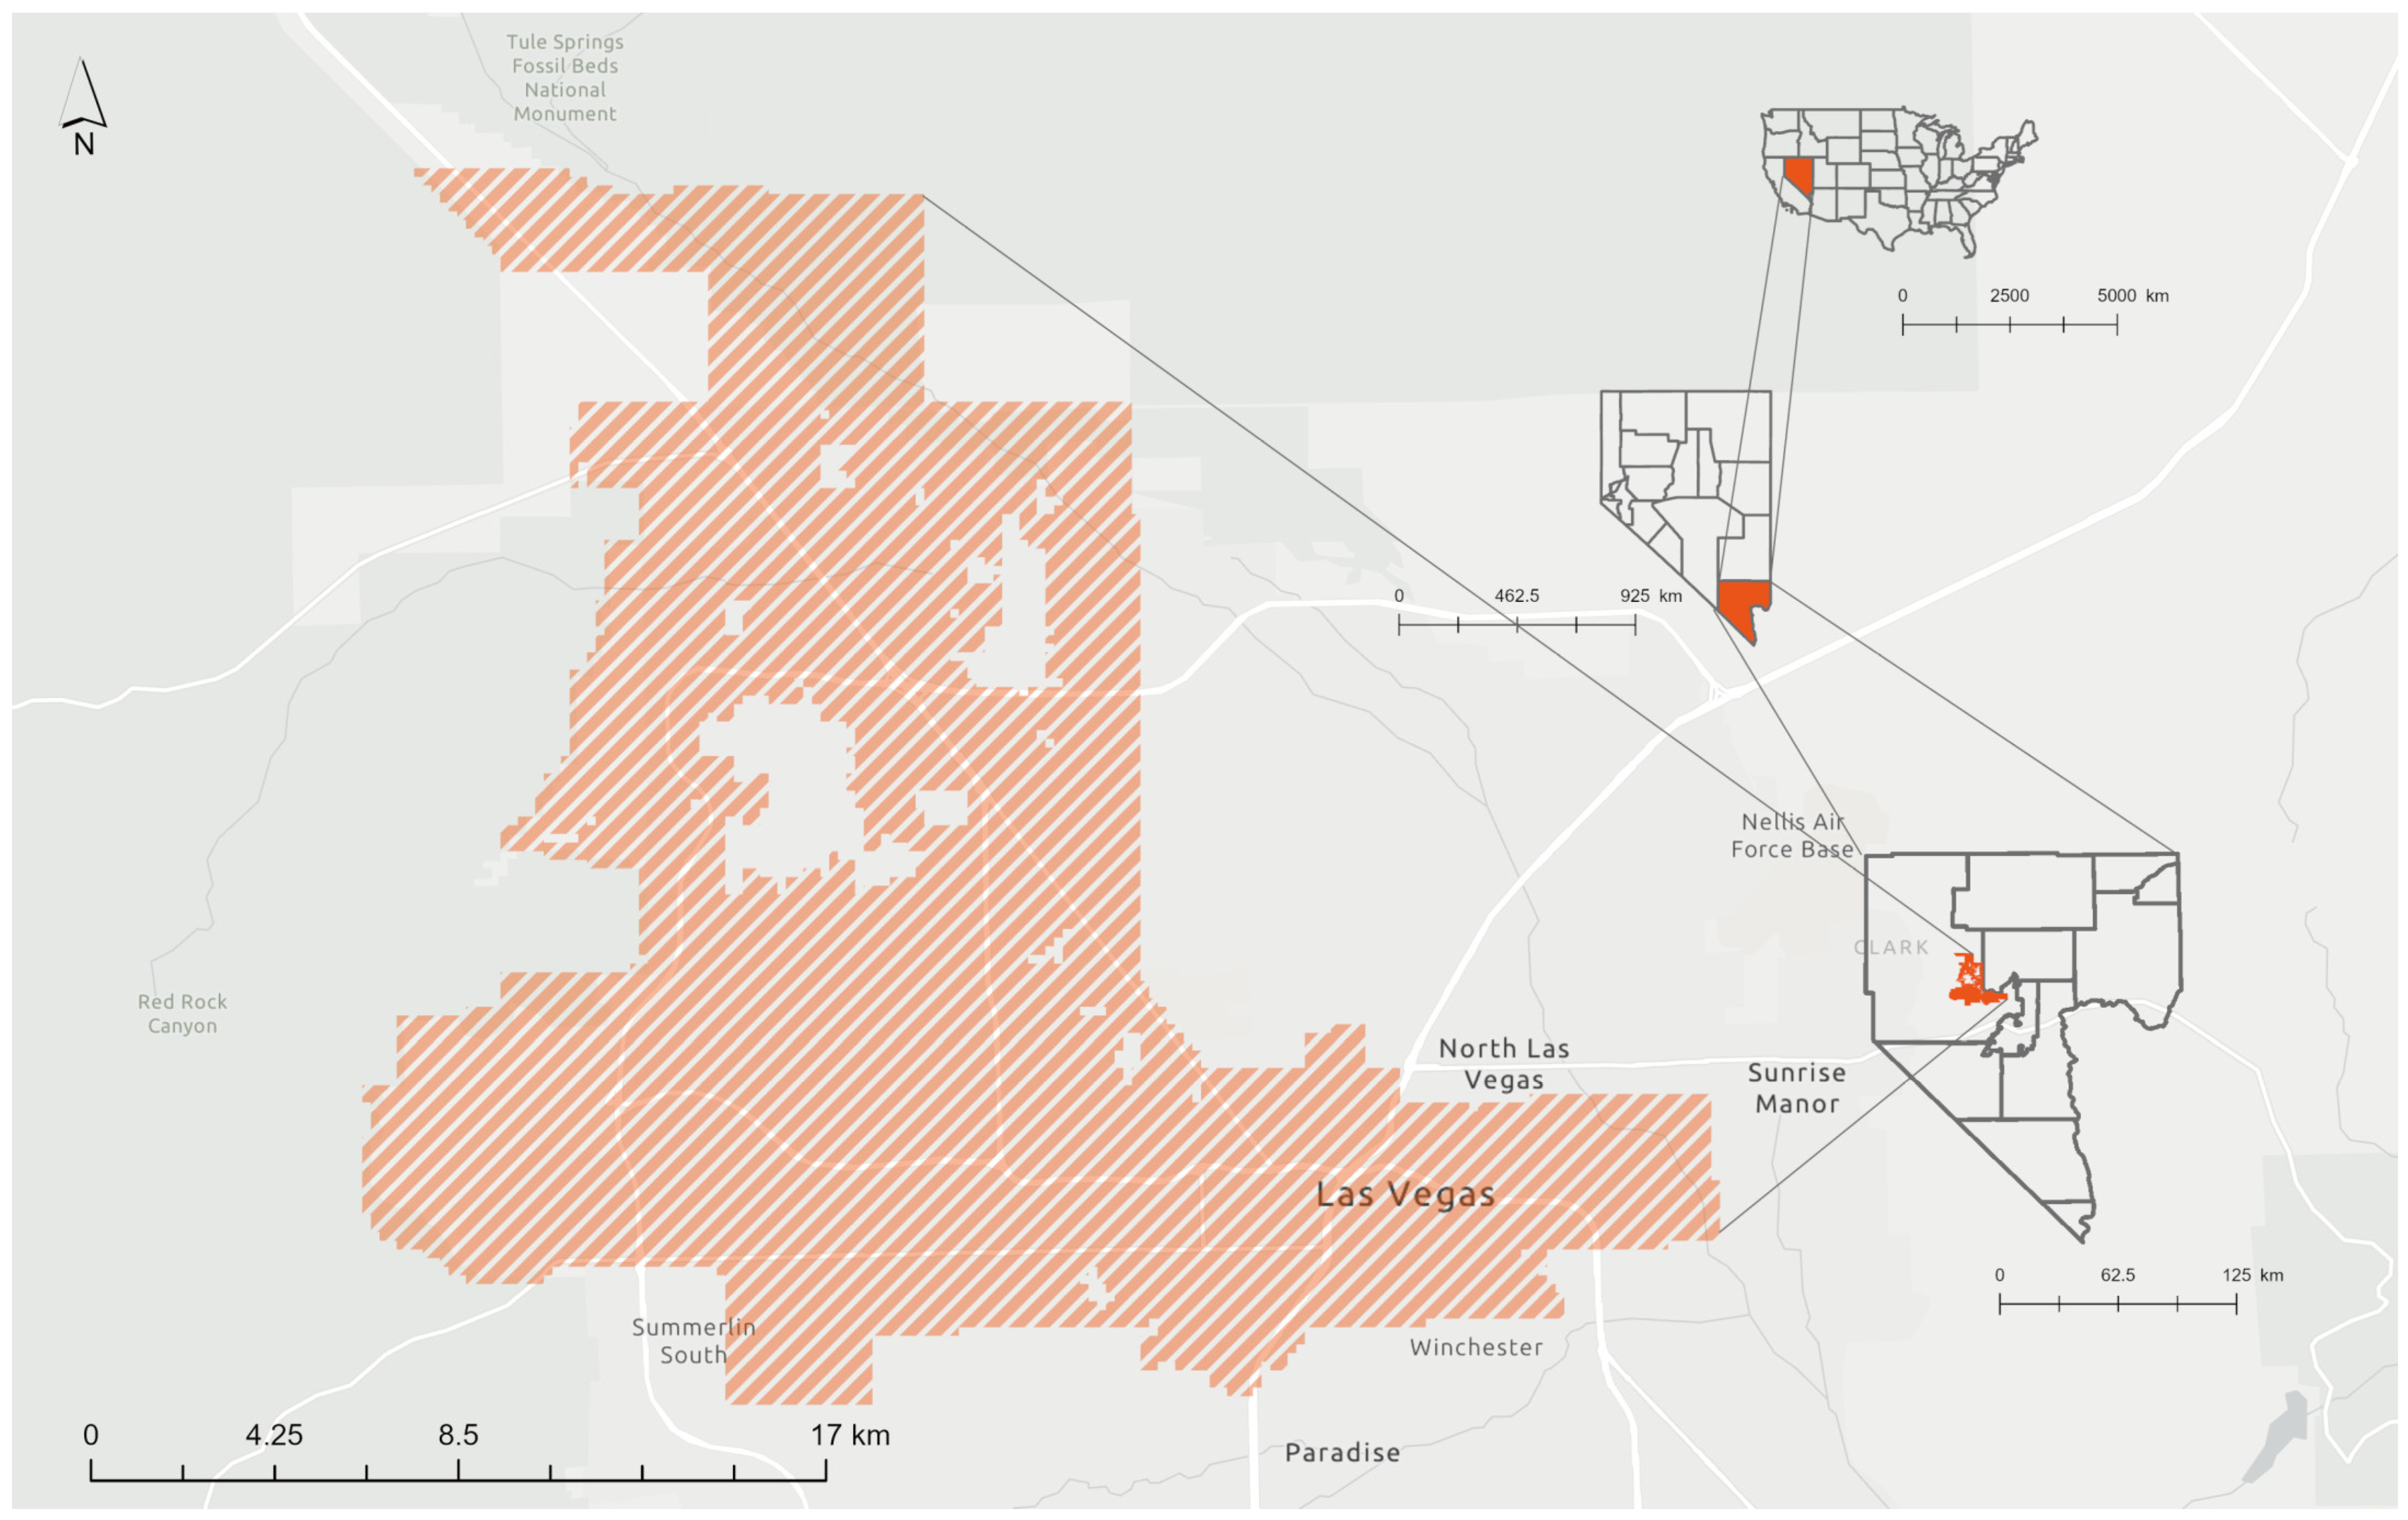
2.1. Study Site
2.2. Framework and Data
2.2.1. Dependent Variable
2.2.2. Independent Variable
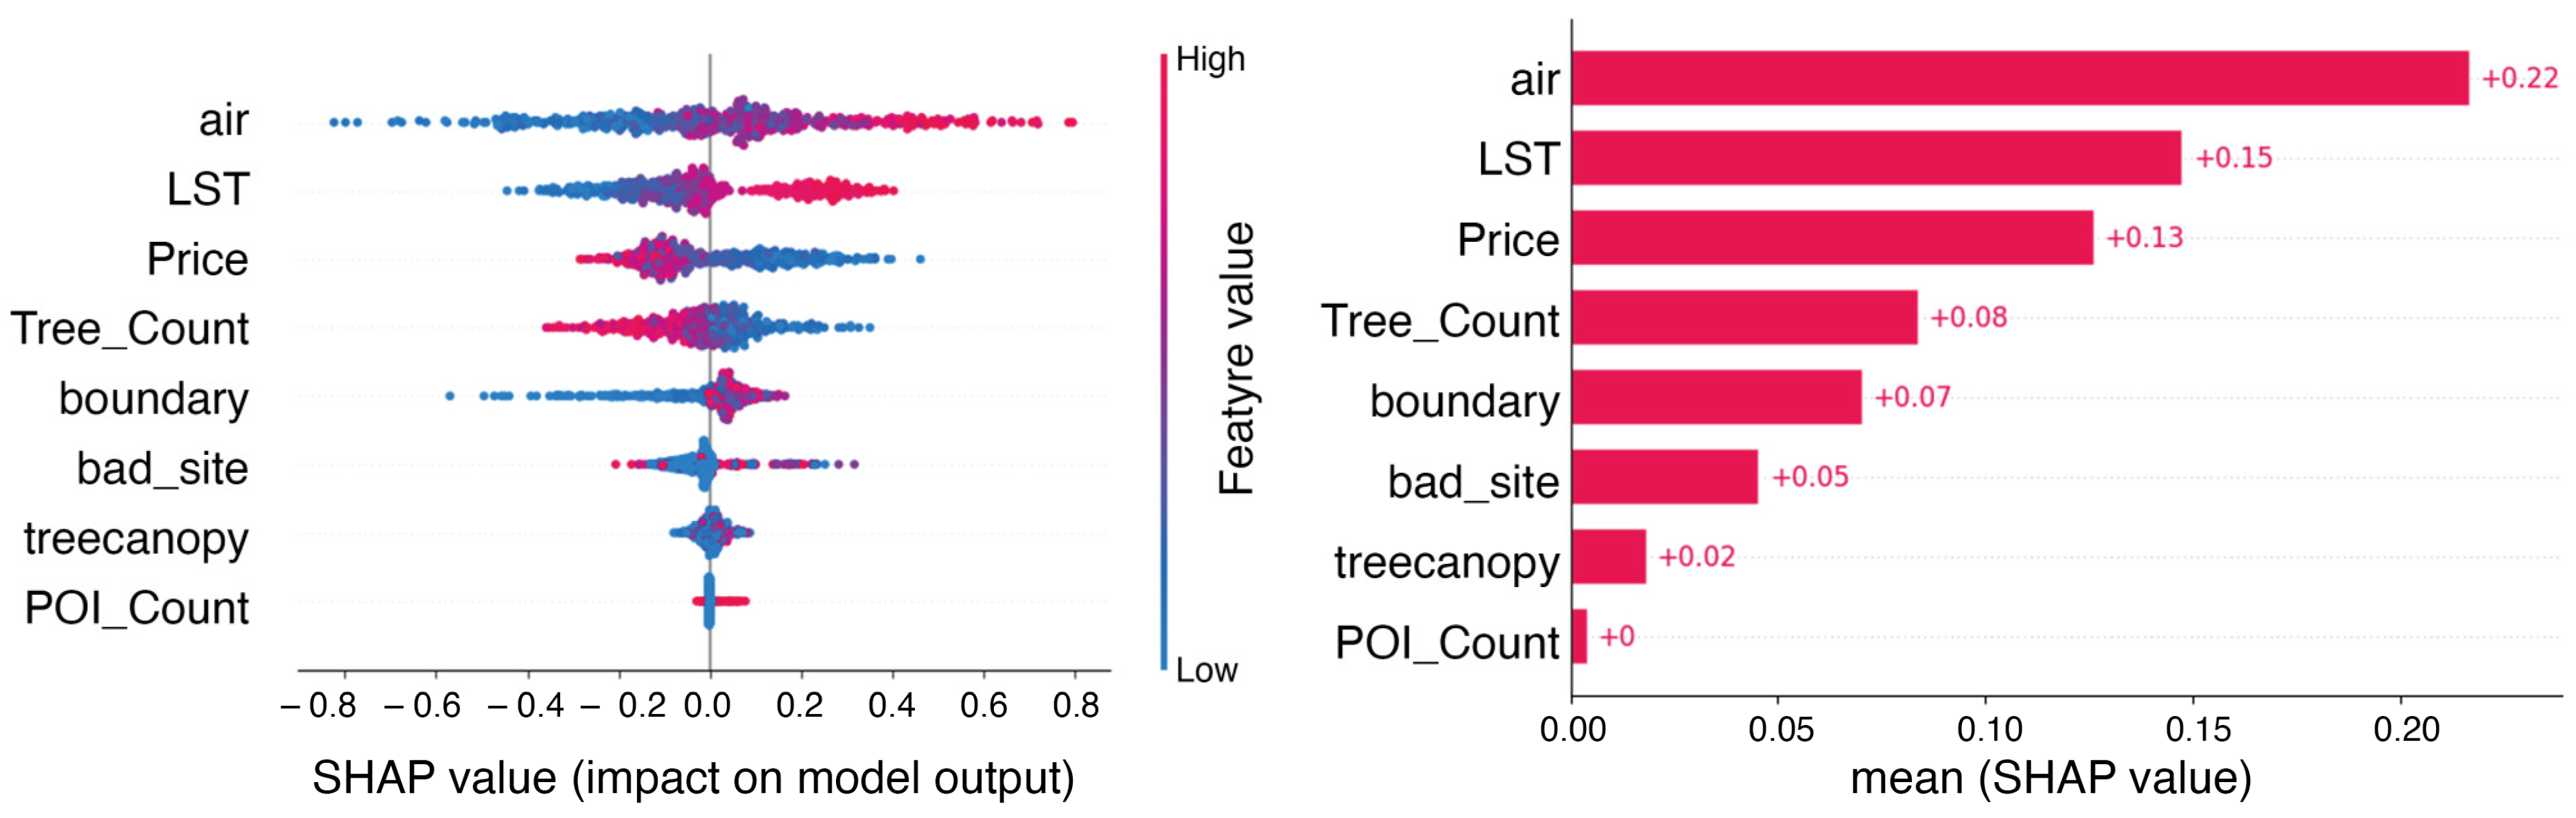
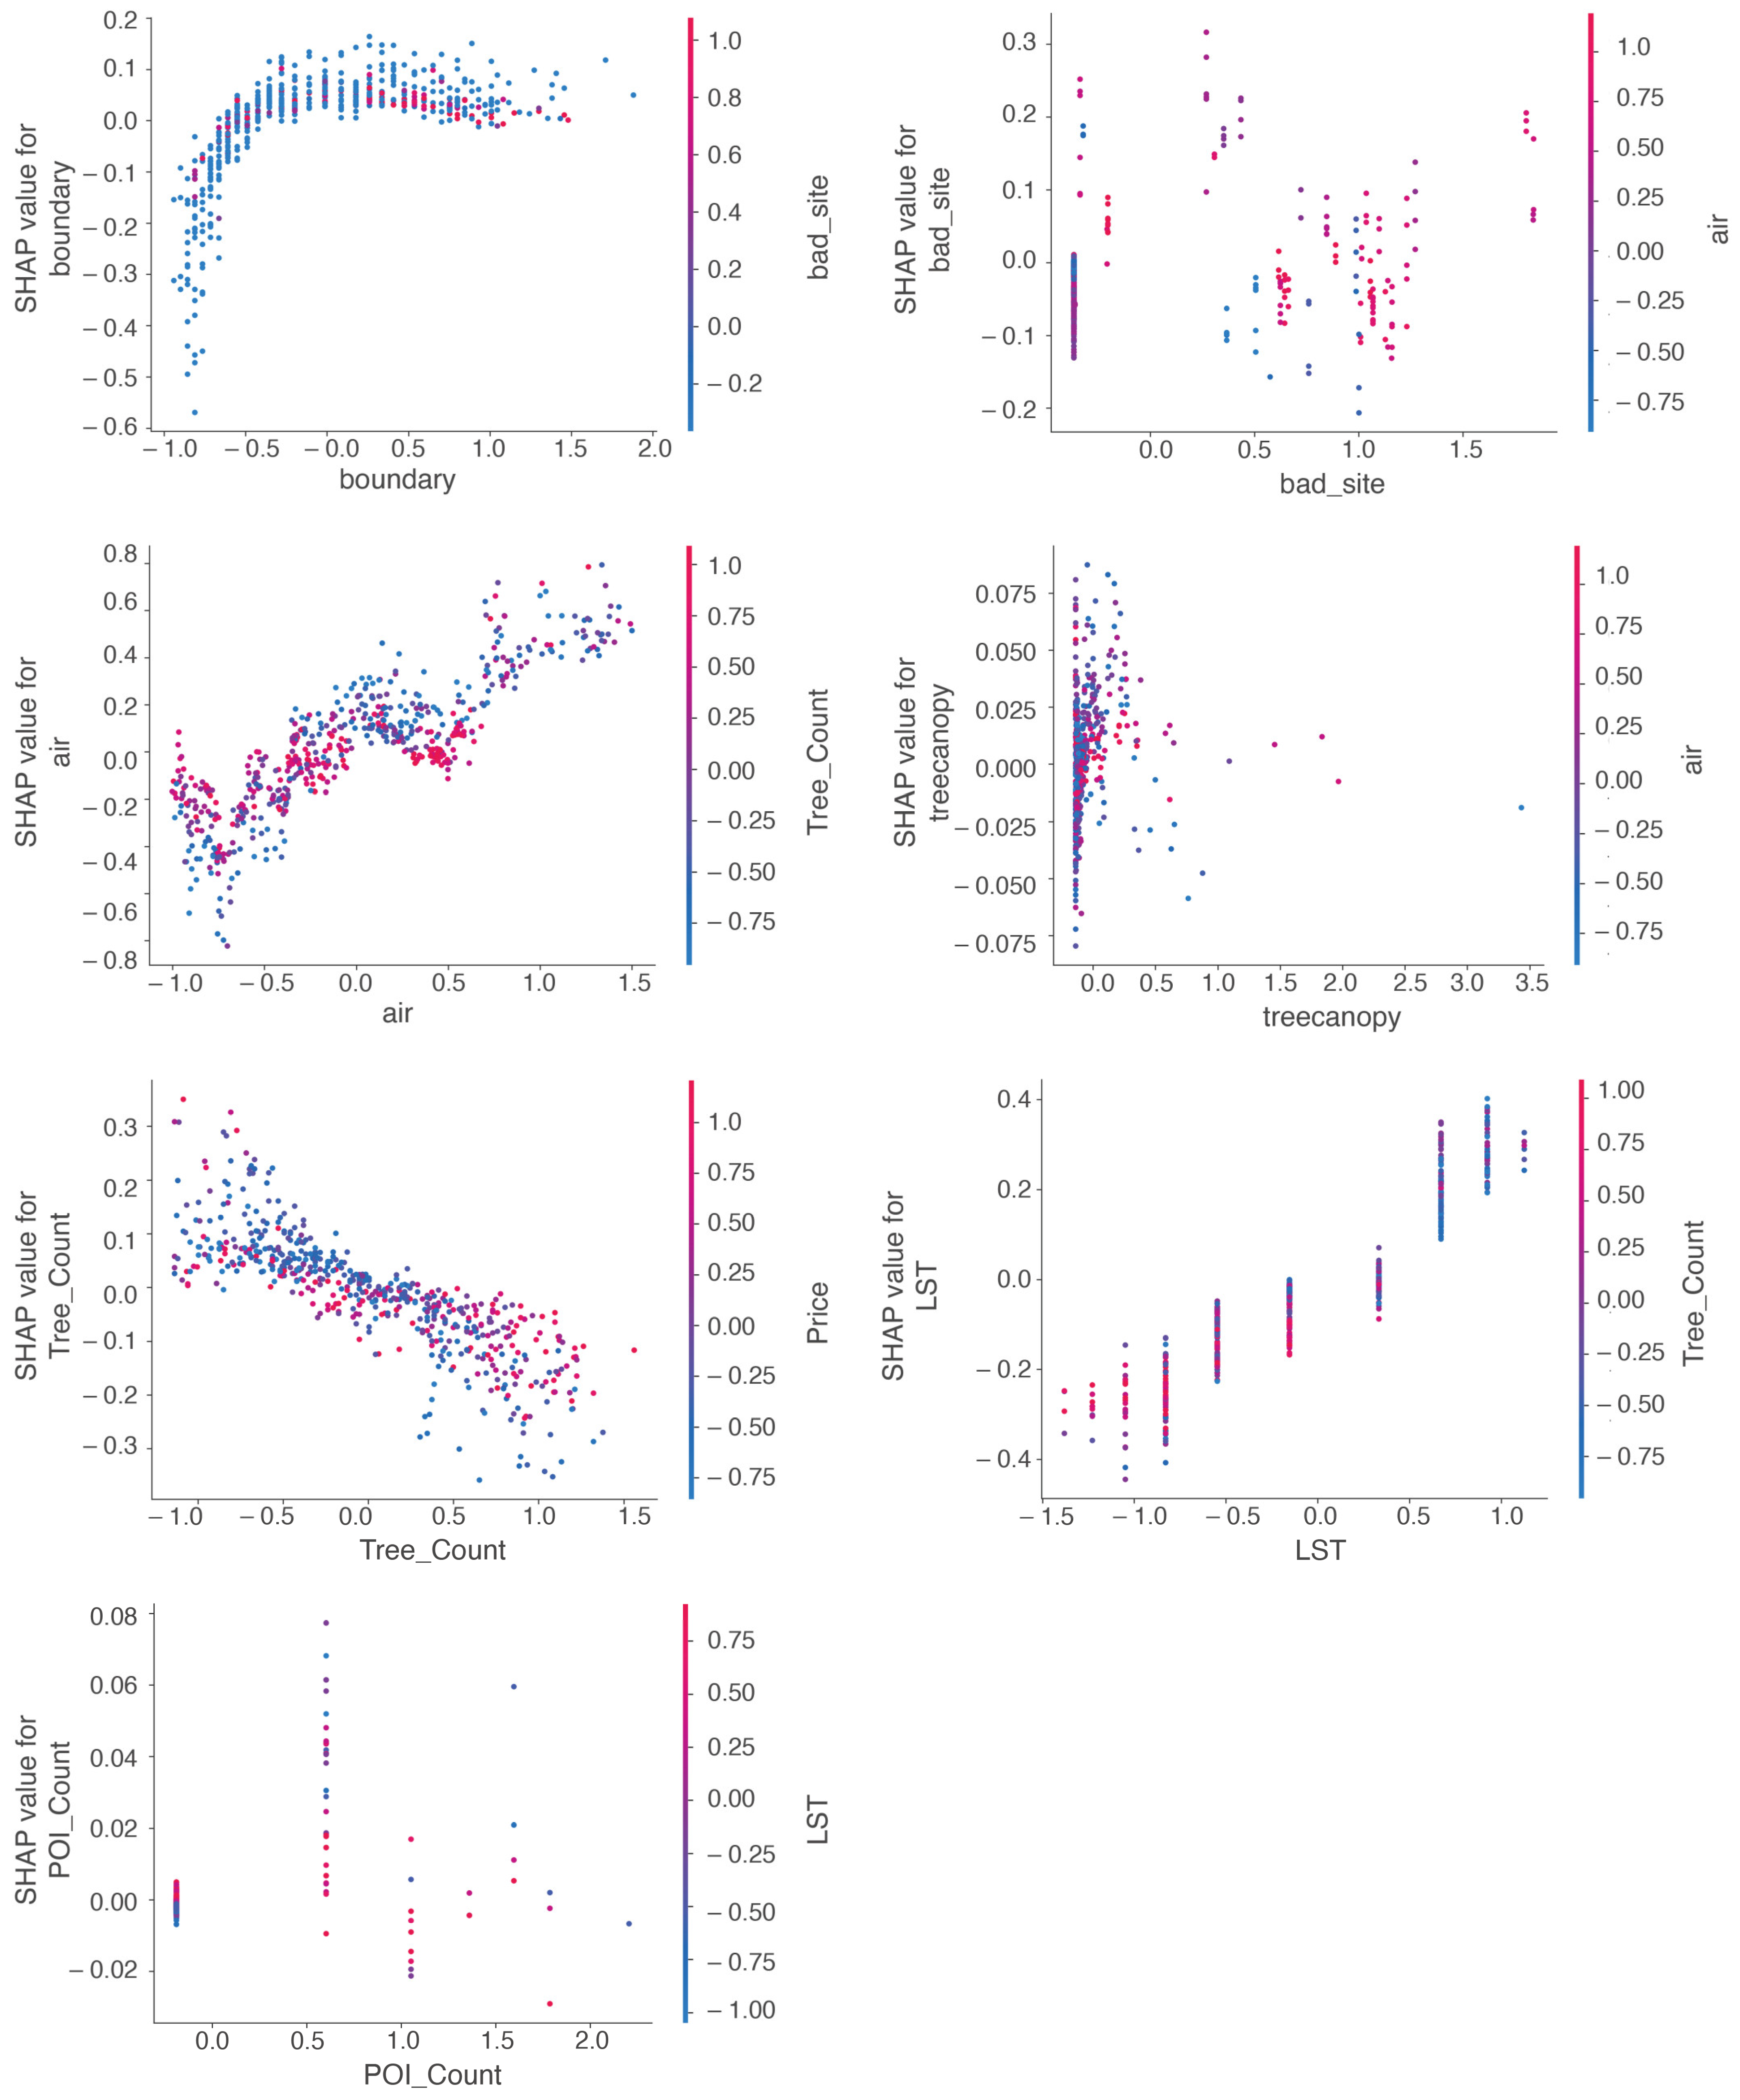
3. Results
3.1. Normality Test
3.2. Correlations
3.3. Ordinary Least Squares
3.4. Causal Relationship Estimation Processing Effect
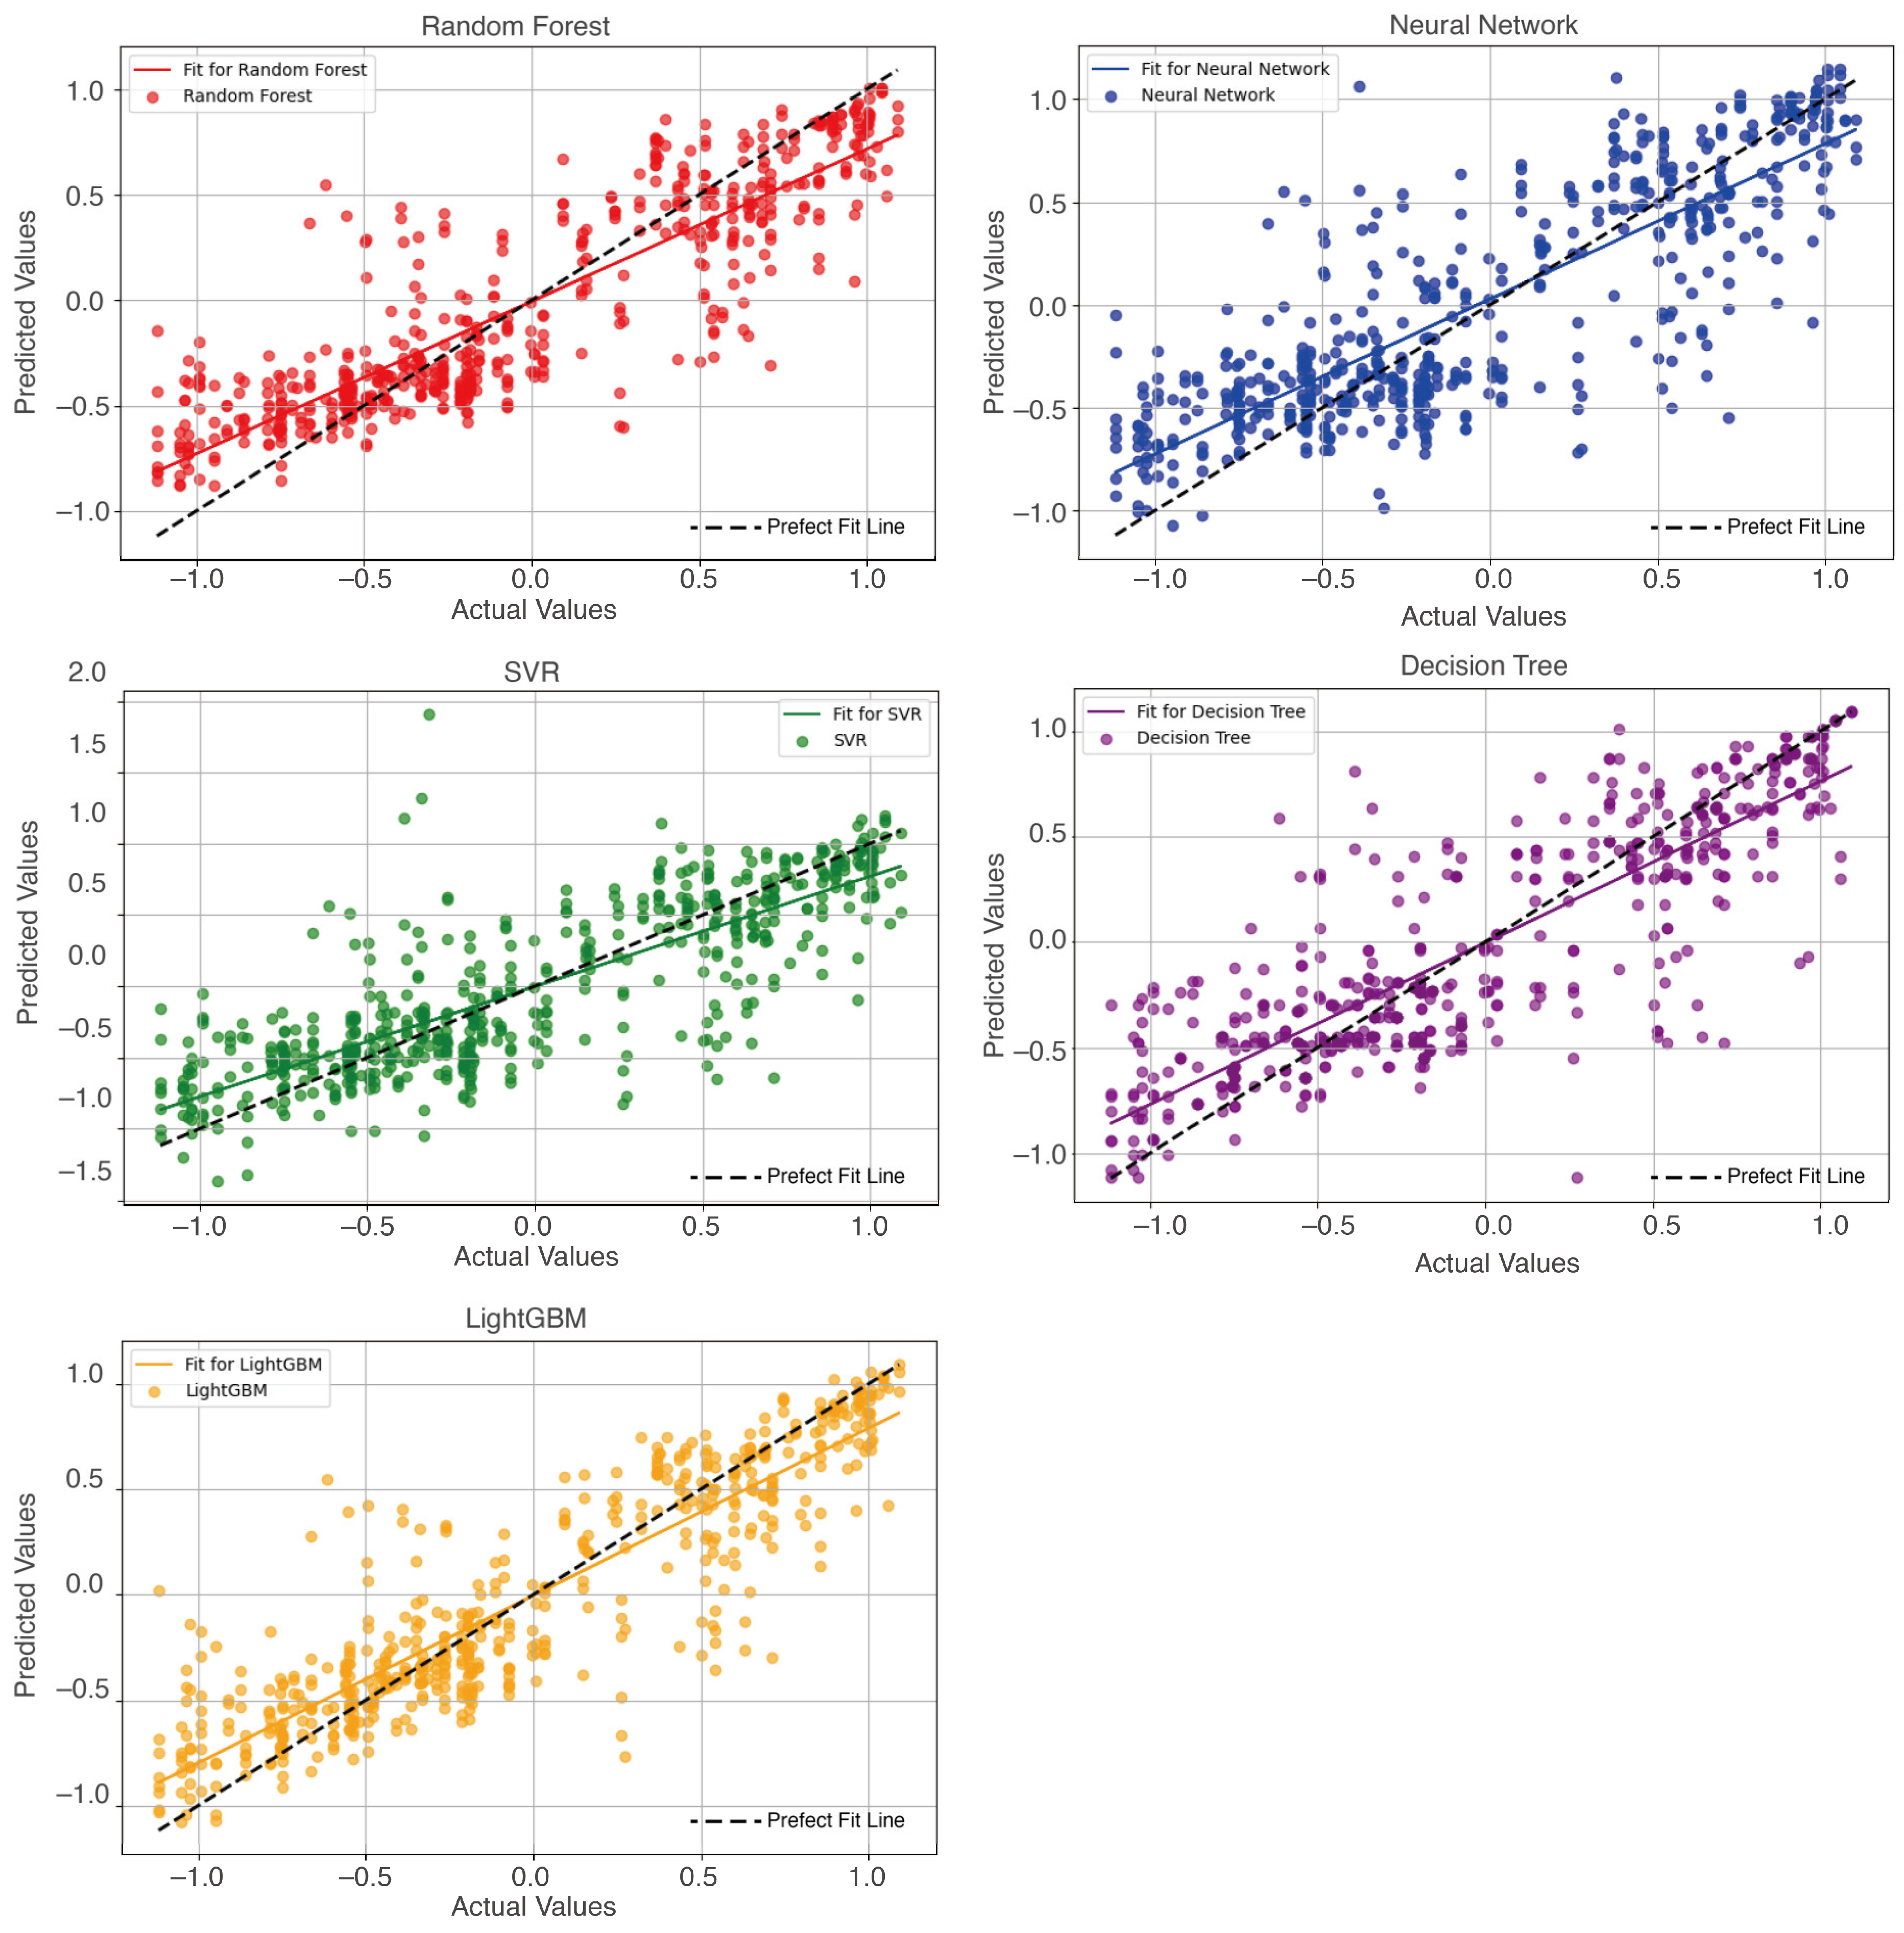
3.5. Prediction Models
3.5.1. Standard Model Performance
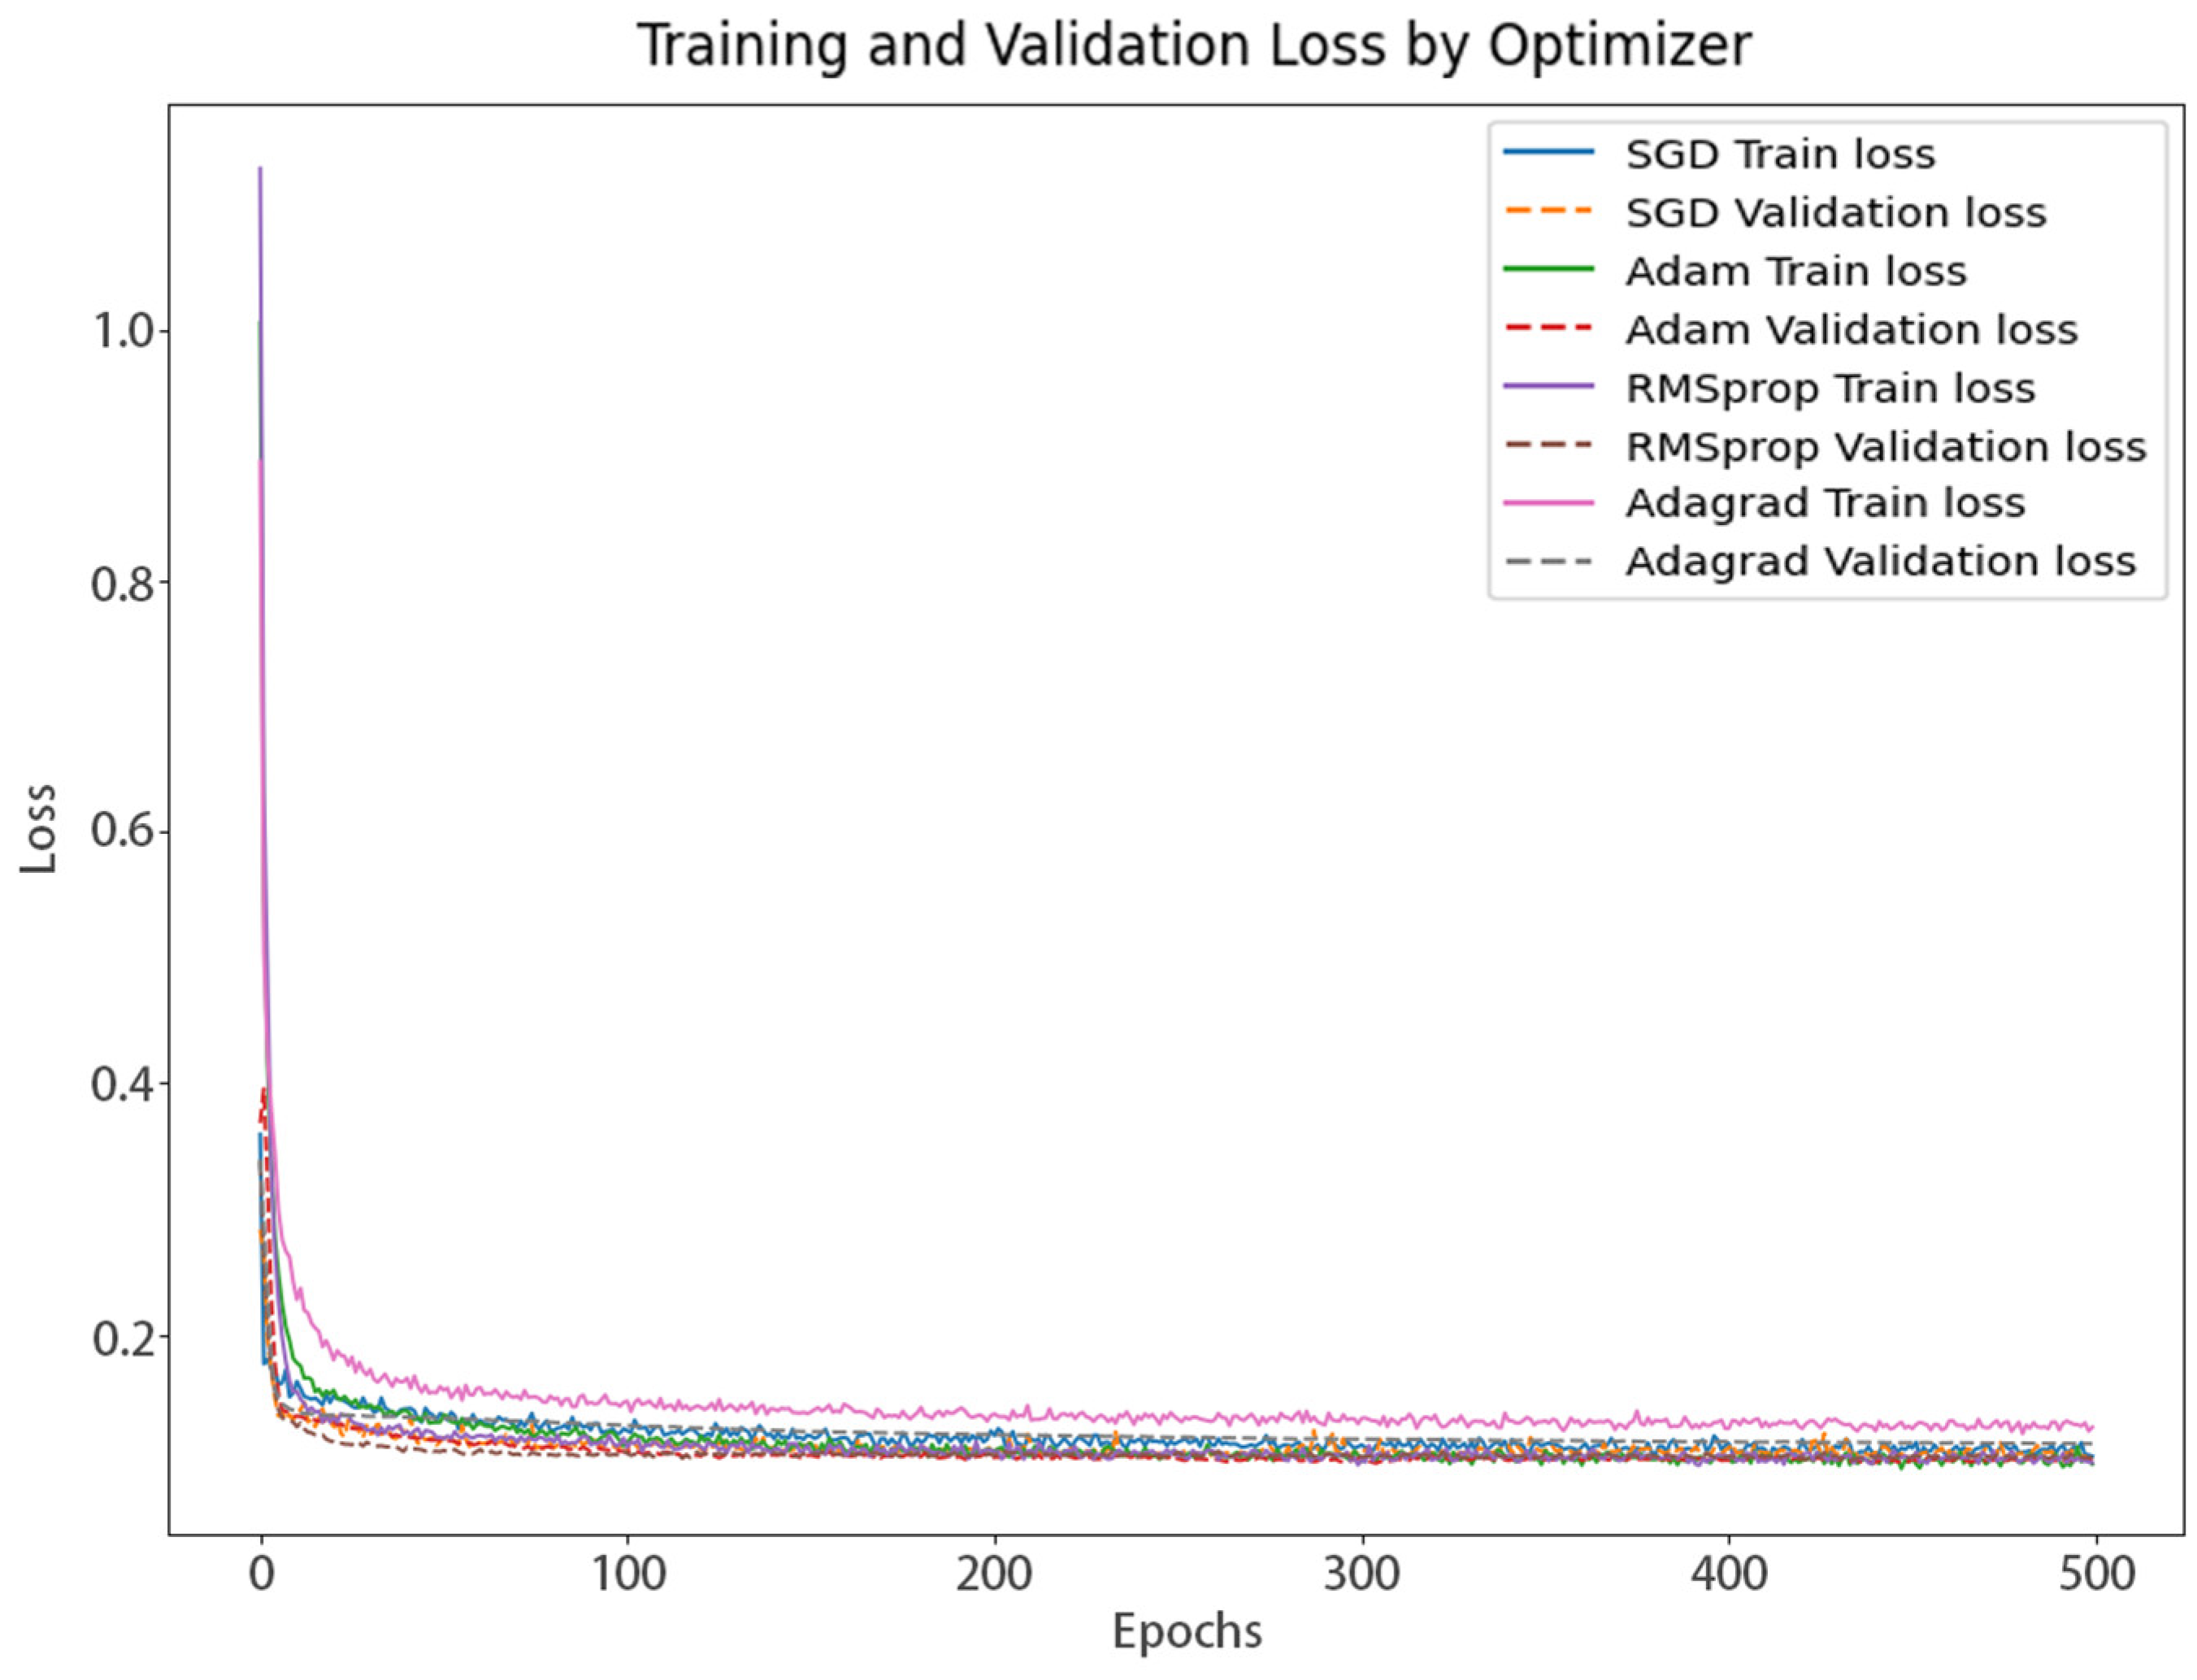
3.5.2. Deep Learning Model
4. Discussion
4.1. Multiple Segregations at the Physical and Economic Levels
4.2. Ethnic Dynamics of Segregation
4.3. Machine Learning Predict Concentration
5. Limitations
6. Conclusions
Author Contributions
Funding
Data Availability Statement
Conflicts of Interest
Appendix A

| Var. Name | Description | Data Source | Mean | S.D. | Max | Min | Count |
|---|---|---|---|---|---|---|---|
| Dependent variable | |||||||
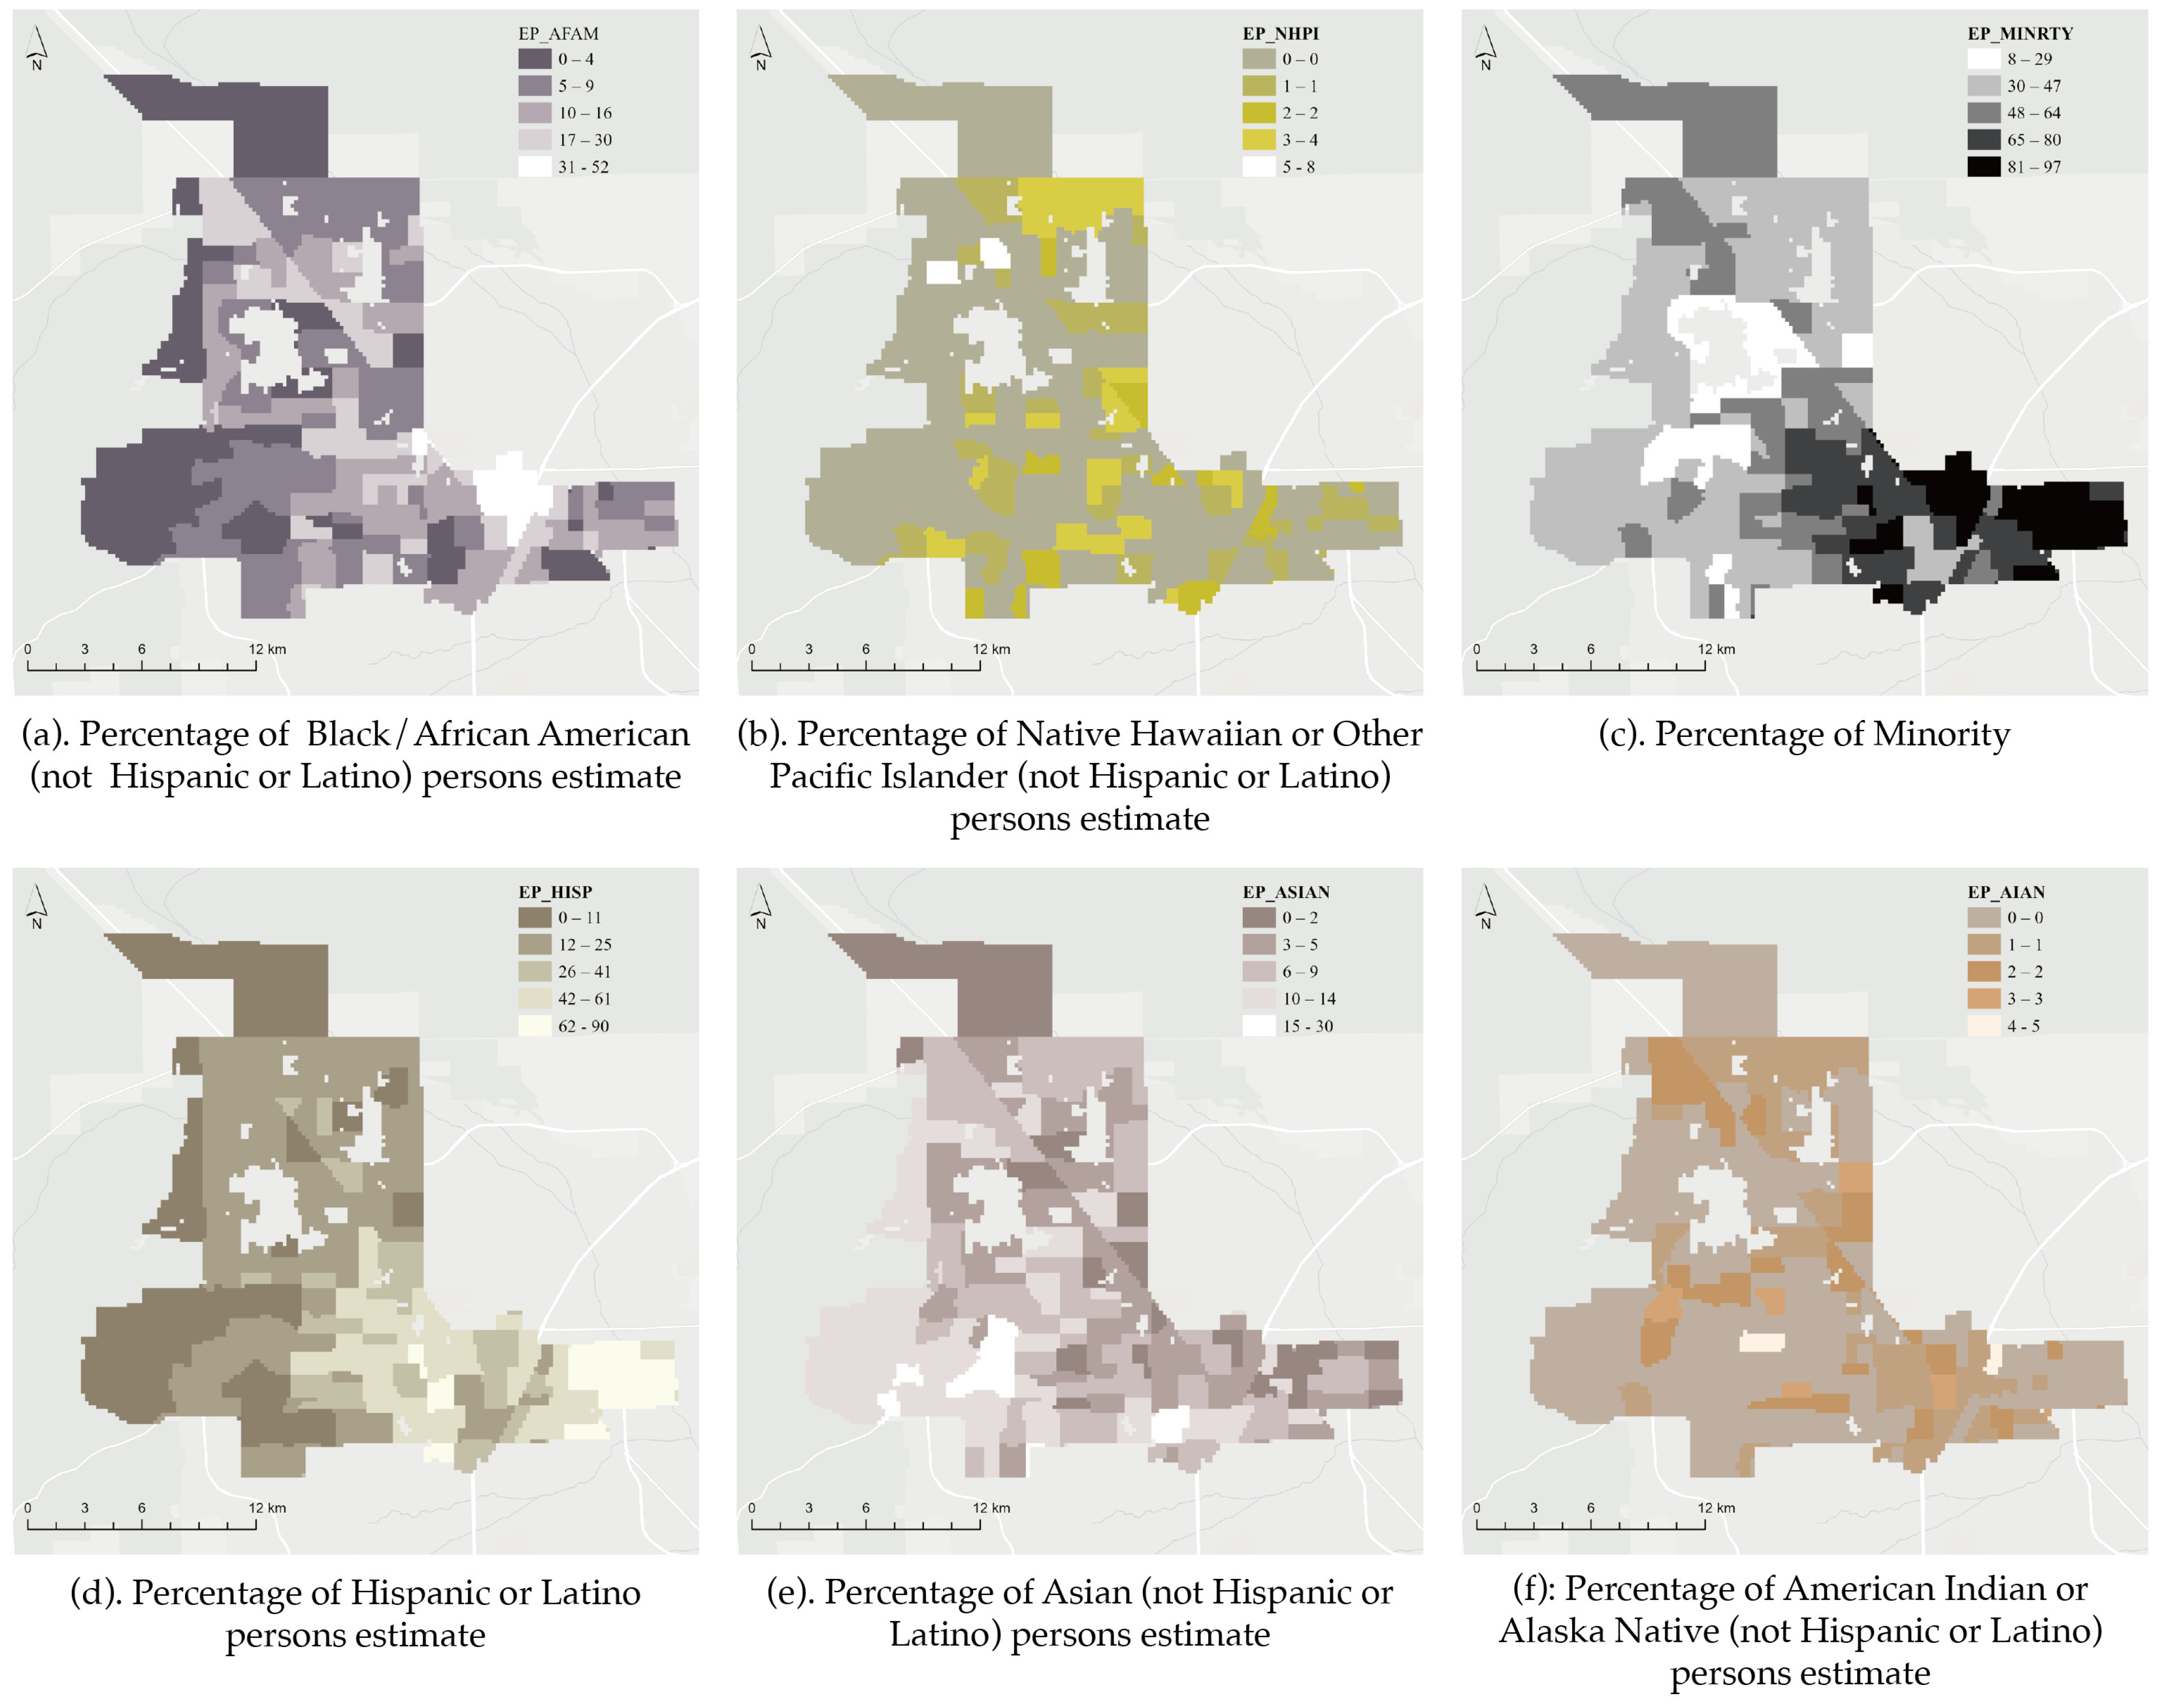
| EP_HISP | Percentage of Hispanic or Latino persons estimate | 2016–2020 ACS | 31.64 | 20.82 | 89.70 | 2.20 | 3832 |
| EP_AFAM | Percentage of Black/African American (not Hispanic or Latino) persons estimate | 2016–2020 ACS | 11.09 | 8.50 | 52.30 | 0.80 | 3832 |
| EP_ASIAN | Percentage of Asian (not Hispanic or Latino) persons estimate | 2016–2020 ACS | 6.40 | 3.91 | 29.40 | 0.00 | 3832 |
| EP AIAN | Percentage of American Indian or Alaska Native (not Hispanic or Latino) persons estimate | 2016–2020 ACS | 0.47 | 0.79 | 5.40 | 0.00 | 3832 |
| EP_NHPI | Percentage of Native Hawaiian or Other Pacific Islander (not Hispanic or Latino) persons estimate | 2016–2020 ACS | 0.65 | 1.23 | 7.80 | 0.00 | 3832 |
| EP_MINRTY | Percentage minority (Hispanic or Latino) of any race; Black and African American (Not Hispanic or Latino); American Indian and Alaska Native, Not Hispanic or Latino; Asian (Not Hispanic or Latino); Native Hawaiian and Other Pacific Islander (Not Hispanic or Latino); Two or More Races (Not Hispanic or Latino); Other Races (Not Hispanicor Latino) estimate | 2016–2020 ACS | 53.31 | 22.28 | 97.40 | 7.50 | 3832 |
| EP_OTHERRACE | All other populations excluding Hispanics | 2016–2020 ACS | 68.36 | 20.82 | 97.80 | 10.30 | 3832 |
| Independent varable | |||||||
| BE | |||||||
| POI Count | Counts points of interest in specified areas. | Openstreet Map | 0.20 | 0.97 | 25.00 | 0.97 | 3832 |
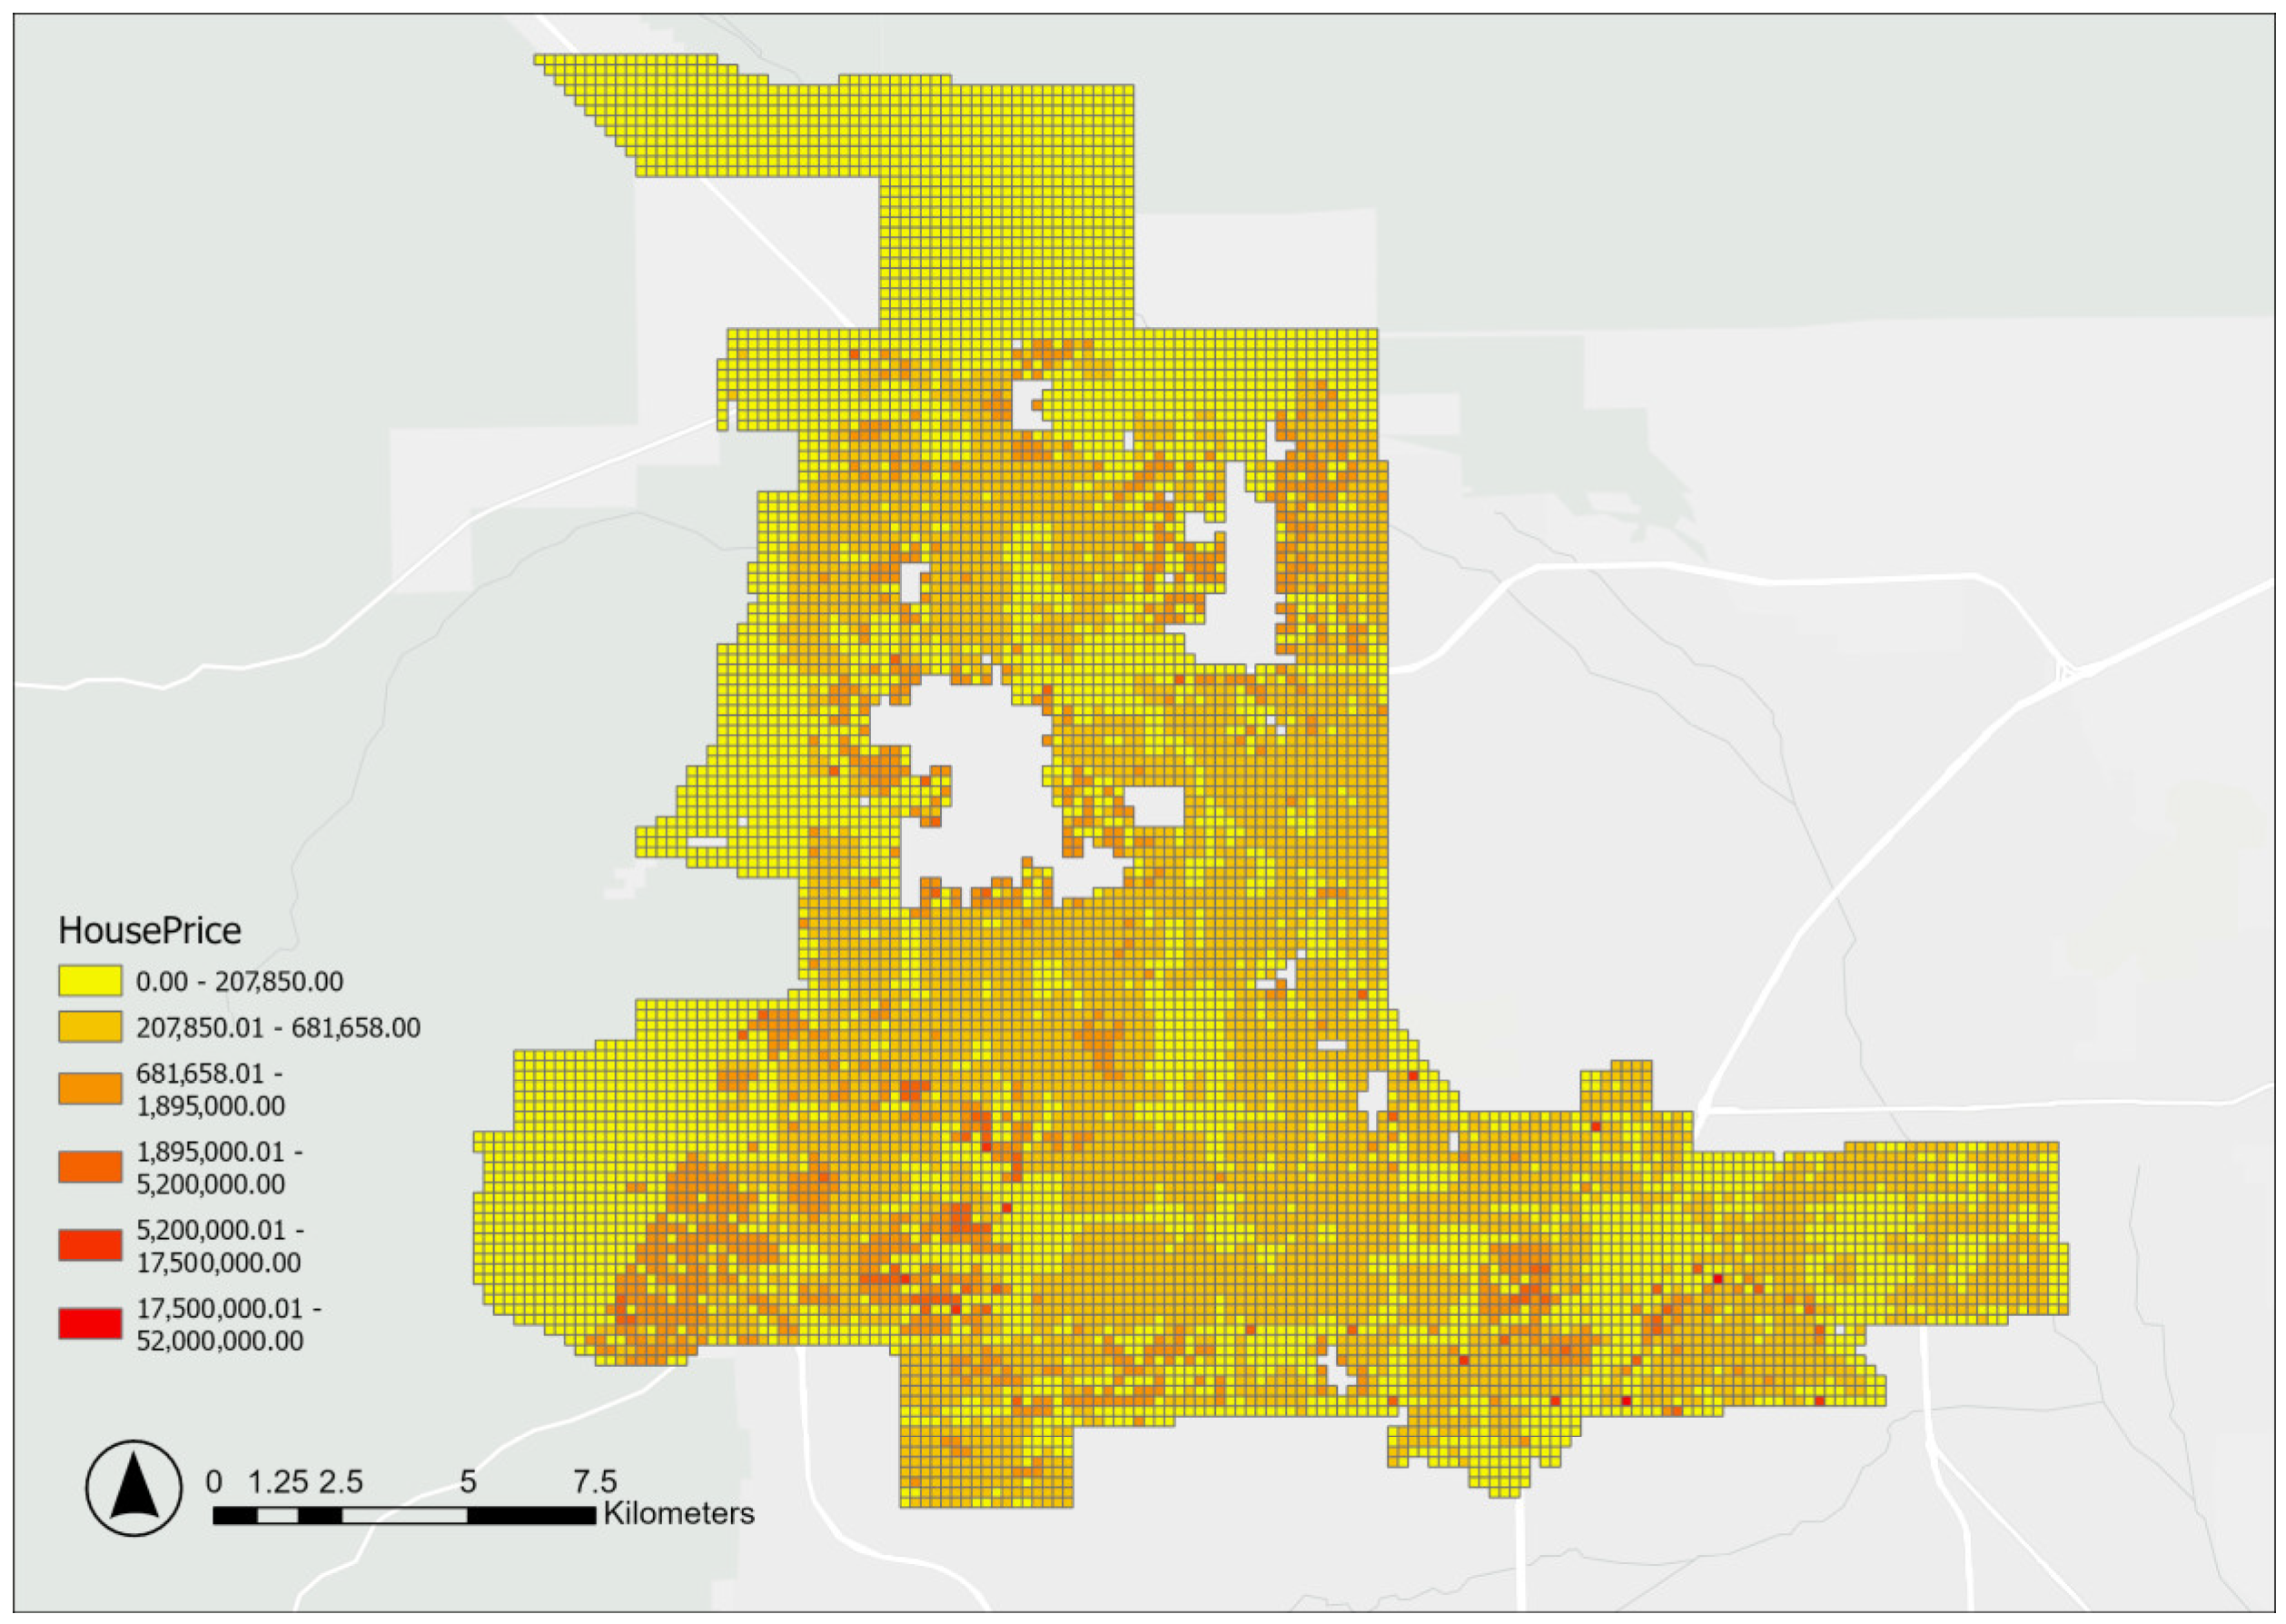
| Zillow Houseing Price | Average house price in a specific area. | Zillow | 403,155.17 | 135,839.99 | 815,000.00 | 50,000.00 | 3832 |
| tree canopy | Percentage of area covered by tree canopy, reflecting urban forestry levels. | Nevada Division of Forestry | 138.63 | 907.68 | 27,357.62 | 907.68 | 3832 |
| air (PM2.5) | Measure of air quality PM2.5. | Air Quality-Amber/Ambee Environmental APIs | 37,741.50 | 207.94 | 38,521.00 | 37,383.00 | 3832 |
| Tree Count | Number of trees in an area. | Earth Defines Tree Locations dataset | 109.76 | 51.34 | 346.00 | 1.00 | 3832 |
| Boundary (fence + railing) | Proportion of an area marked by physical boundaries like fences and railings. | Google Street View | 15.12 | 9.68 | 87.00 | 20.00 | 3832 |
| LST | Land Surface Temperature. | EPA weather station | 83.30 | 1.78 | 88.00 | 77.00 | 3832 |
| bad site | Proximity to high-risk environmental sites, quantifying land coverage within one mile of these sites. | CDC/ATSDR Environmental Justice Index | 15.41 | 34.90 | 200.00 | 0.00 | 3832 |
| 1 | 2 | 3 | 4 | 5 | 6 | 7 | 8 | 9 | 10 | 11 | 12 | 13 | 14 | |
|---|---|---|---|---|---|---|---|---|---|---|---|---|---|---|
| Price (1) | 1 | |||||||||||||
| EP_MINRTY (2) | −0.531 ** | 1 | ||||||||||||
| EP_AFAM (3) | −0.147 ** | 0.426 ** | 1 | |||||||||||
| EP_HISP (4) | −0.509 ** | 0.900 ** | 0.212 ** | 1 | ||||||||||
| EP_ASIAN (5) | 0.278 ** | −0.268 ** | −0.005 | −0.383 ** | 1 | |||||||||
| EP_AIAN (6) | −0.005 | −0.068 ** | −0.106 ** | −0.071 ** | −0.009 | 1 | ||||||||
| EP_NHPI (7) | −0.050 ** | 0.196 ** | 0.022 | 0.195 ** | −0.057 ** | −0.034 * | 1 | |||||||
| air (8) | −0.331 ** | 0.518 ** | −0.056 ** | 0.472 ** | −0.012 | −0.082 ** | −0.030 | 1 | ||||||
| Tree_Count (9) | 0.282 ** | −0.407 ** | −0.181 ** | −0.411 ** | 0.298 ** | −0.057 ** | −0.093 ** | −0.087 ** | 1 | |||||
| boundary (10) | −0.245 ** | 0.391 ** | 0.199 ** | 0.394 ** | −0.214 ** | 0.026 | −0.014 | 0.171 ** | −0.246 ** | 1 | ||||
| LST (11) | −0.414 ** | 0.609 ** | 0.155 ** | 0.612 ** | −0.295 ** | 0.030 | 0.114 ** | 0.386 ** | −0.419 ** | 0.277 ** | 1 | |||
| bad_site (12) | −0.136 ** | 0.343 ** | 0.108 ** | 0.268 ** | −0.035 * | −0.018 | −0.016 | 0.401 ** | −0.147 ** | 0.157 ** | 0.304 ** | 1 | ||
| POI_Count (13) | −0.125 ** | 0.149 ** | 0.081 ** | 0.115 ** | −0.019 | −0.012 | −0.016 | 0.136 ** | −0.175 ** | 0.015 | 0.141 ** | 0.113 ** | 1 | |
| treecanopy (14) | −0.032 | 0.048 ** | 0.018 | 0.058 ** | −0.000 | 0.006 | 0.030 | 0.014 | −0.004 | 0.014 | 0.045 ** | −0.033 * | −0.009 | 1 |
References
- Burgess, E.W. Residential Segregation in American Cities. Ann. Am. Acad. Political Soc. Sci. 1928, 140, 105–115. [Google Scholar] [CrossRef]
- Napierala, J.; Denton, N. Measuring Residential Segregation With the ACS: How the Margin of Error Affects the Dissimilarity Index. Demography 2017, 54, 285–309. [Google Scholar] [CrossRef] [PubMed]
- Clark, W.A.V. Residential segregation in American cities: A review and interpretation. Popul. Res. Policy Rev. 1986, 5, 95–127. [Google Scholar] [CrossRef]
- Hoyt, H. The Structure and Growth of Residential Neighborhoods in American Cities. arXiv 1939. Available online: http://archive.org/details/structuregrowtho00unit (accessed on 10 March 2025).
- Harris, C.D.; Ullman, E.L. The Nature of Cities. Ann. Am. Acad. Political Soc. Sci. 1945, 242, 7–17. [Google Scholar] [CrossRef]
- Liao, K.; Lv, P.; Wei, S.; Fu, T. A Scientometric Review of Residential Segregation Research: A CiteSpace-Based Visualization. Sustainability 2022, 15, 448. [Google Scholar] [CrossRef]
- Massey, D.S.; Denton, N.A. Spatial Assimilation as a Socioeconomic Outcome. Am. Sociol. Rev. 1985, 50, 94–106. [Google Scholar] [CrossRef]
- Alba, R.D.; Logan, J.R. Minority Proximity to Whites in Suburbs: An Individual-Level Analysis of Segregation. Am. J. Sociol. 1993, 98, 1388–1427. [Google Scholar] [CrossRef]
- Charles, C.Z. The Dynamics of Racial Residential Segregation. Annu. Rev. Sociol. 2003, 29, 167–207. [Google Scholar] [CrossRef]
- Menori, M.H.; Utama, N.P. Residential Segregation. In Proceedings of the 2019 International Conference of Advanced Informatics: Concepts, Theory and Applications (ICAICTA), Yogyakarta, Indonesia, 20–21 September 2019; pp. 1–3. [Google Scholar] [CrossRef]
- Schelling, T.C. Dynamic models of segregation. J. Math. Sociol. 1971, 1, 143–186. [Google Scholar] [CrossRef]
- Adelman, R.M. Neighborhood Opportunities, Race, and Class: The Black Middle Class and Residential Segregation. City Community 2004, 3, 43–63. [Google Scholar] [CrossRef]
- Ihlanfeldt, K.R.; Scafidi, B. Black Self-Segregation as a Cause of Housing Segregation: Evidence from the Multi-City Study of Urban Inequality. J. Urban Econ. 2002, 51, 366–390. [Google Scholar] [CrossRef]
- Denton, N.A.; Massey, D.S. Residential Segregation of Blacks, Hispanics, and Asians by Socioeconomic Status and Generation. Soc. Sci. Q. 1988, 69, 797–817. [Google Scholar]
- Galster, G.C.; Keeney, W.M. Race, Residence, Discrimination, and Economic Opportunity: Modeling the Nexus of Urban Racial Phenomena. Urban Aff. Q. 1988, 24, 87–117. [Google Scholar] [CrossRef]
- Akbar, P.A.; Hickly, S.L.; Shertzer, A.; Walsh, R.P. Racial Segregation in Housing Markets and the Erosion of Black Wealth. Rev. Econ. Stat. 2022, 107, 1–45. [Google Scholar] [CrossRef]
- Dawkins, C.J. Recent Evidence on the Continuing Causes of Black-White Residential Segregation. J. Urban Aff. 2004, 26, 379–400. [Google Scholar] [CrossRef]
- Massey, D.S. American Apartheid: Segregation and the Making of the Underclass. Am. J. Sociol. 1990, 96, 329–357. [Google Scholar] [CrossRef]
- Kraler, K. CityCenter, Las Vegas: ‘De-Theming’ in the Neoliberal City. Media Theory 2018, 2, 266–280. Available online: https://www.semanticscholar.org/paper/CityCenter%2C-Las-Vegas%3A-%E2%80%98De-Theming%E2%80%99-in-the-City-Kraler/b165bded2059f38dd1f8283ccdd5b11a0d47b542 (accessed on 12 February 2025). [CrossRef]
- Wysong, E.; Gottdiener, M.; Collins, C.C.; Dickens, D.R. Las Vegas: The Social Production of an All-American City. Contemp. Sociol. 2001, 30, 172. [Google Scholar] [CrossRef]
- Forletta, F. A Historical Case Study of School Desegregation and Resegregation in Las Vegas, Nevada, 1968–2008. UNLV Thesis, University of Nevada, Las Vegas, NV, USA, 12 January 2012. [Google Scholar] [CrossRef]
- Horsford, S.D.; Sampson, C.; Forletta, F. School Resegregation in the Mississippi of the West: Community Counternarratives on the Return to Neighborhood Schools in Las Vegas, 1968–1994. Teach. Coll. Rec. 2013, 115, 1–28. [Google Scholar] [CrossRef]
- Gotham, K.F. Urban Space, Restrictive Covenants and the Origins of Racial Residential Segregation in a US City, 1900–1950. Int. J. Urban Reg. Res. 2000, 24, 616–633. [Google Scholar] [CrossRef]
- Silverman, E. Schelling’s Model: A Success for Simplicity. In Methodological Investigations in Agent-Based Modelling: With Applications for the Social Sciences; Silverman, E., Ed.; Springer International Publishing: Cham, Switzerland, 2018; pp. 125–144. [Google Scholar] [CrossRef]
- Hwang, S. Residential Segregation, Housing Submarkets, and Spatial Analysis: St. Louis and Cincinnati as a Case Study. Hous. Policy Debate 2015, 25, 91–115. [Google Scholar] [CrossRef]
- Galster, G. William Grigsby and the Analysis of Housing Sub-markets and Filtering. Urban Stud. 1996, 33, 1797–1805. [Google Scholar] [CrossRef]
- Bramley, G.; Leishman, C.; Watkins, D. Understanding Neighbourhood Housing Markets: Regional Context, Disequilibrium, Sub-markets and Supply. Hous. Stud. 2008, 23, 179–212. [Google Scholar] [CrossRef]
- Reardon, S.F.; Bischoff, K. Income Inequality and Income Segregation. Am. J. Sociol. 2011, 116, 1092–1153. [Google Scholar] [CrossRef]
- Mikulas, A.; Beck, B.; Besbris, M. Home Price Change and Ethno-racial Residential Segregation: Temporal Relationships at the Metro Level. Socius 2024, 10, 23780231241261606. [Google Scholar] [CrossRef]
- Brasington, D.M.; Hite, D.; Jauregui, A. House price impacts of racial, income, education, and age neighbourhood segregation. J. Reg. Sci. 2015, 55, 442–467. [Google Scholar] [CrossRef]
- Box-Couillard, S.; Christensen, P. Racial Housing Price Differentials and Neighborhood Segregation (August 2024). NBER Working Paper No. w32815. 2024. Available online: https://ssrn.com/abstract=4922845 (accessed on 10 March 2025).
- Singh, R.; Dumas, M.A. Exploring the Spatial Relationship Between Demo-graphic Indicators and the Built Environment of a City. In Driving Scientific and Engineering Discoveries Through the Integration of Experiment, Big Data, and Modeling and Simulation; Nichols, J., Barney Maccabe, A., Nutaro, J., Pophale, S., Devineni, P., Ahearn, T., Verastegui, B., Eds.; Springer International Publishing: Cham, Switzerland, 2022; pp. 442–454. [Google Scholar] [CrossRef]
- Mckenzie, E. Constructing the Pomerium in Las Vegas: A Case Study of Emerging Trends in American Gated Communities. In Gated Communities; Routledge: New York, NY, USA, 2006. [Google Scholar]
- Alvarez, C.H. From Classical to Critical: Addressing Theoretical and Methodological Gaps within Environmental Justice Research. Ph.D. Thesis, University of Oregon, Eugene, OR, USA, 2019. Available online: https://www.proquest.com/docview/2309520885/abstract/5243E9F5C515400CPQ/1 (accessed on 12 February 2025).
- Vesselinov, E.; Le Goix, R. From picket fences to iron gates: Suburbanization and gated communities in Phoenix, Las Vegas and Seattle. GeoJournal 2012, 77, 203–222. [Google Scholar] [CrossRef]
- Yang, Q.; Zhang, B.; Chen, J.; Song, Y.; Shen, X. Integrating crowdsourced data in the built environment studies: A systematic review. J. Environ. Manag. 2025, 373, 123936. [Google Scholar] [CrossRef]
- Chen, M.; Cai, Y.; Guo, S.; Sun, R.; Song, Y.; Shen, X. Evaluating implied urban nature vitality in San Francisco: An interdisciplinary approach combining census data, street view images, and social media analysis. Urban For Urban Green. 2024, 95, 128289. [Google Scholar] [CrossRef]
- Shen, X.; Kong, J.; Song, Y.; Wang, X.; Mosey, G. Optimizing the environmental design and management of public green spaces: Analyzing urban infrastructure and long-term user experience with a focus on streetlight density in the city of Las Vegas, NV. Inf. Fusion 2025, 118, 102914. [Google Scholar] [CrossRef]
- Iceland, J. Beyond Black and White: Metropolitan residential segregation in multi-ethnic America. Soc. Sci. Res. 2004, 33, 248–271. [Google Scholar] [CrossRef]
- Ubarevičienė, R.; van Ham, M.; Tammaru, T. Fifty years after the Schelling’s Models of Segregation: Bibliometric analysis of the legacy of Schelling and the future directions of segregation research. Cities 2024, 147, 104838. [Google Scholar] [CrossRef]
- Iceland, J.; Scopilliti, M. Immigrant Residential Segregation in U.S. Metropolitan Areas, 1990–2000. Demography 2008, 45, 79. [Google Scholar] [CrossRef] [PubMed]
- Cai, Y.; Wei, E.; Cai, X. Empathy and redemption: Exploring the narrative transformation of online support for mental health across communities before and after COVID-19. PLoS ONE 2024, 19, e0307042. [Google Scholar] [CrossRef]
- Wahl, A.-M.G.; Breckenridge, R.S.; Gunkel, S.E. Latinos, residential segregation and spatial assimilation in micropolitan areas: Exploring the American dilemma on a new frontier. Soc. Sci. Res. 2007, 36, 995–1020. [Google Scholar] [CrossRef]
- Martinez, N. The “East Side” of Las Vegas: A Latinx Historical Framework. Spectra Undergrad. Res. J. 2021, 1, 6. [Google Scholar] [CrossRef]
- Reardon, S.F.; Farrell, C.R.; Matthews, S.A.; O’Sullivan, D.; Bischoff, K.; Firebaugh, G. Race and space in the 1990s: Changes in the geographic scale of racial residential segregation, 1990–2000. Soc. Sci. Res. 2009, 38, 55–70. [Google Scholar] [CrossRef]
- Fowler, C.S. Segregation as a multi-scalar phenomenon and its implications for neighborhood-scale research: The case of South Seattle 1990–2010. Urban Geogr. 2016, 37, 1–25. [Google Scholar] [CrossRef]
- Jesdale, B.M.; Morello-Frosch, R.; Cushing, L. The Racial/Ethnic Distribution of Heat Risk–Related Land Cover in Relation to Residential Segregation. Environ. Health Perspect. 2013, 121, 811–817. [Google Scholar] [CrossRef]
- Grannis, R. T-Communities: Pedestrian Street Networks and Residential Segregation in Chicago, Los Angeles, and New York. City Community 2005, 4, 295–321. [Google Scholar] [CrossRef]
- Arcaya, M.C.; Schwartz, G.; Subramanian, S. A multi-level modeling approach to understanding residential segregation in the United States. Environ. Plan. B Urban Anal. City Sci. 2018, 45, 1090–1105. [Google Scholar] [CrossRef]
- Simon, H.A. Spurious Correlation: A Causal Interpretation. J. Am. Stat. Assoc. 1954, 49, 467–479. [Google Scholar] [CrossRef]
- Rubin, D.B. Estimating causal effects of treatments in randomized and nonrandomized studies. J. Educ. Psychol. 1974, 66, 688–701. [Google Scholar] [CrossRef]
- Blalock, H.M. Causal Inferences in Nonexperimental Research; The University of North Carolina Press: Chapel Hill, NC, USA, 1967. [Google Scholar]
- Rohlfing, I.; Zuber, C.I. Check Your Truth Conditions! Clarifying the Relation-ship between Theories of Causation and Social Science Methods for Causal Inference. Sociol. Methods Res. 2021, 50, 1623–1659. [Google Scholar] [CrossRef]
- Shalit, U.; Johansson, F.D.; Sontag, D. Estimating individual treatment effect: Generalization bounds and algorithms. In Proceedings of the 34th International Conference on Machine Learning, Sydney, Australia, 6–11 August 2017; pp. 3076–3085. Available online: https://proceedings.mlr.press/v70/shalit17a.html (accessed on 9 February 2025).
- Torrats-Espinosa, G. Replication Data for Using Machine Learning to Estimate the Effect of Racial Segregation on COVID-19 Mortality in the United States. Harvard Dataverse. Proc. Natl. Acad. Sci. USA 2021, 118, e2015577118. [Google Scholar] [CrossRef]
- Stepinski, T.F.; Dmowska, A. Machine-learning models for spatially-explicit fore-casting of future racial segregation in US cities. Mach. Learn. Appl. 2022, 9, 100359. [Google Scholar] [CrossRef]
- Wang, R.; Shang, W.; Zhang, G. Research on the influence of spontaneous commercial space on the commercial vitality of historical and cultural districts. Sci. Rep. 2025, 15, 10443. [Google Scholar] [CrossRef]
- Ling, Z.; Zheng, X.; Chen, Y.; Qian, Q.; Zheng, Z.; Meng, X.; Kuang, J.; Chen, J.; Yang, N.; Shi, X. The nonlinear relationship and synergistic effects between built environment and urban vitality at the neighborhood scale: A case study of Guangzhou’s central urban area. Remote Sens. 2024, 16, 2826. [Google Scholar] [CrossRef]
- Li, N.; Yao, L. Exploring the vitality of Tianjin’s downtown based on the Light GBM-SHAP model. Comput. Urban Sci. 2024, 4, 48. [Google Scholar] [CrossRef]
- Meng, Y.; Yang, N.; Qian, Z.; Zhang, G. What makes an online review more helpful: An interpretation framework using xgboost and shap values. J. Theor. Appl. Electron. Commer. Res. 2020, 16, 466–490. [Google Scholar] [CrossRef]
- Jargowsky, P.A.; Wheeler, C.A. Economic Segregation in US Metropolitan Areas, 1970–2010. SSRN 2017, 57. [Google Scholar] [CrossRef]
- Massey, D.S.; Denton, N.A. Hypersegregation in U.S. Metropolitan Areas: Black and Hispanic Segregation Along Five Dimensions. Demography 1989, 26, 373–391. [Google Scholar] [CrossRef]
- Gribov, A.; Krivoruchko, K. Empirical Bayesian kriging implementation and usage. Sci. Total Environ. 2020, 722, 137290. [Google Scholar] [CrossRef]
- Curth, A.; van der Schaar, M. Doing Great at Estimating CATE? On the Neglected Assumptions in Benchmark Comparisons of Treatment Effect Estimators. arXiv 2021, arXiv:2107.13346. [Google Scholar]
- Kuppusamy, S.; Thangavel, R. Deep Non-linear and Unbiased Deep Decisive Pooling Learning–Based Opinion Mining of Customer Review. Cogn. Comput. 2023, 15, 765–777. [Google Scholar] [CrossRef]
- Chakraborty, T.; Newman, A.J.; Qian, Y.; Hsu, A.; Sheriff, G. Residential segregation and outdoor urban moist heat stress disparities in the United States. One Earth 2023, 6, 738–750. [Google Scholar] [CrossRef]
- Johnston, R.; Poulsen, M.; Forrest, J. Modern and post-modern cities and ethnic residential segregation: Is Los Angeles different? Geoforum 2006, 37, 318–330. [Google Scholar] [CrossRef]
- Dickinson, D.C.; Hobbs, R.J. Cultural ecosystem services: Characteristics, challenges and lessons for urban green space research. Ecosyst. Serv. 2017, 25, 179–194. [Google Scholar] [CrossRef]
- Herbert, C.E.; Belsky, E.S. The Homeownership Experience of Low-Income and Minority Households: A Review and Synthesis of the Literature. Cityscape 2008, 10, 5–59. [Google Scholar]
- Arbaci, S. Paradoxes of Segregation: Housing Systems, Welfare Regimes and Ethnic Residential Change in Southern European Cities, 1st ed.; Wiley: Hoboken, NJ, USA, 2019. [Google Scholar] [CrossRef]
- Medina, V.; DeRonda, A.; Ross, N.; Curtin, D.; Jia, F. Revisiting Environmental Belief and Behavior Among Ethnic Groups in the U.S. Front. Psychol. 2019, 10, 629. [Google Scholar] [CrossRef]

| Variables | EP_HISP | EP_AFAM | EP_ASIAN | EP_ALAN | EP_NHPI | EP_MINRTY | ||||||||||||
|---|---|---|---|---|---|---|---|---|---|---|---|---|---|---|---|---|---|---|
| Coef. | S.E | t | Coef | S.E. | t | Coef. | S.E. | t | Coef. | S.E. | t | Coef. | S.E. | t | Coef. | S.E. | t | |
| constant | −0.032 ** | 0.007 | −4.49 | −0.028 ** | −0.028 | −3.023 | −0.011 | 0.01 | −1.101 | −0.078 ** | 0.009 | −8.236 | −0.094 ** | 0.009 | −10.306 | −1423.357 ** | 53.838 | −26.438 |
| Price | −0.213 ** | 0.012 | −17.502 | −0.098 ** | −0.098 | −6.132 | 0.1788 ** | 0.017 | 10.408 | −0.023 | 0.016 | −1.42 | −0.054 ** | 0.016 | −3.414 | 0.000 ** | 0.000 | −11.674 |
| bad_site | −0.055 ** | 0.014 | −4.049 | 0.226 ** | 0.226 | 12.682 | −0.0888 ** | 0.019 | −4.651 | 0.032 | 0.018 | 1.776 | 0.03 | 0.018 | 1.715 | 0.060 ** | 0.008 | 7.444 |
| treecanopy | 0.009 | 0.028 | 0.332 | 0.001 | 0.001 | 0.014 | 0.048 | 0.039 | 1.249 | 0.004 | 0.037 | 0.11 | 0.064 | 0.036 | 1.776 | 0.000 | 0.000 | −0.374 |
| POI_Count | −0.046 * | 0.019 | −2.496 | 0.098 ** | 0.098 | 4.033 | 0.1058 ** | 0.026 | 4.05 | 0.016 | 0.025 | 0.645 | −0.058 * | 0.024 | −2.423 | −0.300 | 0.279 | −1.075 |
| air | 0.379 ** | 0.013 | 29.025 | −0.229 ** | −0.229 | −13.399 | 0.1528 ** | 0.018 | 8.336 | −0.136 ** | 0.017 | −7.813 | −0.098 ** | 0.017 | −5.795 | 0.032 | 0.001 | 21.636 |
| Tree_Count | −0.177 ** | 0.012 | −14.568 | −0.111 ** | −0.111 | −6.97 | 0.1868 ** | 0.017 | 10.943 | 0.015 | 0.016 | 0.95 | −0.019 | 0.016 | −1.208 | −0.048 ** | 0.006 | −8.056 |
| boundary | 0.14 ** | 0.011 | 12.154 | 0.117 ** | 0.117 | 7.796 | −0.0988 ** | 0.016 | −6.103 | −0.018 | 0.015 | −1.201 | −0.074 ** | 0.015 | −4.956 | 0.257 ** | 0.029 | 8.964 |
| LST | 0.302 ** | 0.013 | 22.986 | 0.077 ** | 0.077 | 4.467 | −0.1538 ** | 0.018 | −8.337 | 0.005 | 0.018 | 0.276 | 0.094 ** | 0.017 | 5.549 | 3.218 ** | 0.190 | 16.942 |
| R 2 | −0.032 | 0.143 | 0.173 | 0.019 | 0.026 | 0.594 | ||||||||||||
| Adjusted R 2 | −0.213 | 0.141 | 0.171 | 0.017 | 0.024 | 0.591 | ||||||||||||
| Metric | Value |
|---|---|
| ATE | −0.8348584 |
| CATE | −0.8348584 |
| Standard Deviation of CATE | 0.74378604 |
| Total Model Parameters | 83,202 |
| R2 | MSE | RMSE | MAE | MAPE | |
|---|---|---|---|---|---|
| Decision Tree Regressor | 0.722 | 0.114 | 0.338 | 0.232 | 1.336 |
| Random Forest Regressor | 0.775 | 0.092 | 0.304 | 0.230 | 1.450 |
| MLP Regressor | 0.712 | 0.117 | 0.343 | 0.259 | 1.665 |
| SVR | 0.675 | 0.133 | 0.365 | 0.267 | 1.667 |
| LGBM Regressor | 0.798 | 0.082 | 0.288 | 0.203 | 1.287 |
| Gaussian Process Regressor | −0.001 | 0.411 | 0.641 | 0.563 | 1.0 |
| Deep Learning Results | |||||
|---|---|---|---|---|---|
| R2 | MSE | RMSE | MAE | MAPE | |
| SGD | 0.717 | 0.113 | 0.336 | 0.252 | 1.510 |
| Adam | 0.735 | 0.106 | 0.325 | 0.244 | 1.500 |
| RMSprop | 0.729 | 0.108 | 0.328 | 0.242 | 1.789 |
| Adagrad | 0.719 | 0.249 | 0.499 | 0.364 | 1.720 |
Disclaimer/Publisher’s Note: The statements, opinions and data contained in all publications are solely those of the individual author(s) and contributor(s) and not of MDPI and/or the editor(s). MDPI and/or the editor(s) disclaim responsibility for any injury to people or property resulting from any ideas, methods, instructions or products referred to in the content. |
© 2025 by the authors. Licensee MDPI, Basel, Switzerland. This article is an open access article distributed under the terms and conditions of the Creative Commons Attribution (CC BY) license (https://creativecommons.org/licenses/by/4.0/).
Share and Cite
Liu, J.; Cai, Y.; Shen, X. Integrating Machine Learning, SHAP Interpretability, and Deep Learning Approaches in the Study of Environmental and Economic Factors: A Case Study of Residential Segregation in Las Vegas. Land 2025, 14, 957. https://doi.org/10.3390/land14050957
Liu J, Cai Y, Shen X. Integrating Machine Learning, SHAP Interpretability, and Deep Learning Approaches in the Study of Environmental and Economic Factors: A Case Study of Residential Segregation in Las Vegas. Land. 2025; 14(5):957. https://doi.org/10.3390/land14050957
Chicago/Turabian StyleLiu, Jingyi, Yuxuan Cai, and Xiwei Shen. 2025. "Integrating Machine Learning, SHAP Interpretability, and Deep Learning Approaches in the Study of Environmental and Economic Factors: A Case Study of Residential Segregation in Las Vegas" Land 14, no. 5: 957. https://doi.org/10.3390/land14050957
APA StyleLiu, J., Cai, Y., & Shen, X. (2025). Integrating Machine Learning, SHAP Interpretability, and Deep Learning Approaches in the Study of Environmental and Economic Factors: A Case Study of Residential Segregation in Las Vegas. Land, 14(5), 957. https://doi.org/10.3390/land14050957