Article

Development of an Index for Sustainable Use Assessment—A Case Study from Mesic Grasslands with Economic Potential in North Serbia (Vojvodina)

1
Department of Biology and Ecology, Faculty of Sciences, University of Novi Sad, 21000 Novi Sad, Serbia
2
Research Centre of the Slovenian Academy of Sciences and Arts, Jovan Hadži Institute of Biology, Novi trg 2, 1000 Ljubljana, Slovenia
3
School for Viticulture and Enology, University of Nova Gorica, Vipavska 13, 5000 Nova Gorica, Slovenia
4
Faculty of Forestry and Wood Technology, University of Zagreb, 10000 Zagreb, Croatia
5
Independent Researcher, 11000 Belgrade, Serbia
*
Author to whom correspondence should be addressed.
Land 2025, 14(5), 1082; https://doi.org/10.3390/land14051082
Submission received: 31 March 2025 / Revised: 7 May 2025 / Accepted: 12 May 2025 / Published: 16 May 2025

Abstract

:
The mesic grasslands of the Molinio-Arrhenatheretea Tx. 1937 in Vojvodina could play a crucial role in biodiversity conservation, but also in local economies, providing essential ecosystem services, such as habitats for diverse species and resources for agricultural and pastoral activities. However, they face growing threats from unsustainable land use, urbanization and climate change. In this study, a database comprising 716 relevés and 636 plant species was created. All meadow plots were classified into seven habitat types and evaluated for their sustainable use potential using the index developed in this study, based on economically notable species, their status of protection and total cover. Through this index, moist or wet mesotrophic to eutrophic pasture demonstrates the highest potential, whereas temperate and boreal moist or wet oligotrophic grassland shows the lowest. This index offers a decision-support tool, optimizing economic benefits while minimizing environmental impact and offering guidelines for sustainable grassland management and policy recommendations tailored to local conditions. It also serves as a framework for other regions facing similar challenges, contributing to the advancement of grassland ecosystem service valuation and its preservation.

1. Introduction

The majority of current European grasslands are of secondary origin and began to appear much later due to human influence. Semi-natural grasslands belonging to the Molinio-Arrhenatheretea phytocoenological class include managed pastures, tall-herb meadow fringes and meadows that develop on relatively fertile, deep soils. This type of vegetation is widespread across the cultural landscapes of adjacent regions of Asia and temperate Europe [1,2,3,4]. These semi-natural grasslands thrive across diverse climates and soils, shaped by management practices like mowing, grazing, and fertilization, which drive plant diversity and vegetation differentiation, and are further classified into alliances based on ecological and environmental factors [5]. Formed through forest clearing, they support biodiversity and provide vital ecological functions such as water regulation, soil fertility and ecosystem stabilization, making them a conservation priority [6].
Serbia hosts 1399 plant communities, encompassing 39% of Europe’s flora [7]. These communities contain many of Europe’s 6000 endemic species, of which 18.1% inhabit grasslands in comparison to forest ecosystems (10.7%) [8]. Many of these species thrive in the grasslands, which are assigned Molinio-Arrhenatheretea meadows [9]. Despite their ecological and economic significance, these grasslands are inadequately managed. The region’s landscape is predominantly agricultural, with approximately 1,499,521 hectares dedicated to farming [10], while grasslands account for only about 38,000 hectares and pastures account for about 89,000 hectares [9] of this agricultural land. Sustainable management and adherence to biodiversity conventions are crucial for their preservation.
Biodiversity loss, driven by human activities, threatens countless species essential for ecosystem stability. The European Red List of Habitats [11] has systematically assessed the extent, quality and risk of collapse for all terrestrial and freshwater habitats across the EU and adjacent regions for the first time. The results show that 31% of habitats in the EU and EU-adjacent regions are currently threatened. Threatened habitats can be Critically Endangered (under 2%), Endangered (10%) or Vulnerable (20%), with an additional 12% of European habitats considered Near Threatened. Threat levels vary by habitat type, with different proportions classified as threatened, as follows: mires and bogs (54%), followed by grasslands (49%), coastal habitats (43%), freshwater habitats (38%), forests (24%), heathlands and scrub (15%) and sparsely vegetated areas (10%) [11].
Meadow degradation, caused by land-use changes, abandonment, agricultural intensification and artificial fertilizers [12,13], is exacerbated by economic pressures from rising food demand and climate change, which reduces agricultural yields [14]. This leads to visible ecosystem service losses totaling €3.5–18.5 trillion annually between 1997 and 2011, with land degradation alone accounting for €5.5–10.5 billion in losses per year [15]. In Serbia, meadow degradation worsens due to urban migration, improper land use and climate change [16]. Moreover, by 2041–2060, 42% of Serbia’s land will face high degradation risk, with 25% experiencing irreversible damage and only 6% remaining resilient [17].
The floristic composition of plant communities, influenced by soil type and climate, can serve as an indicator of biomass quality and the economic value of grassland vegetation [9,18,19]. Sustainable natural resource use, effective water management and climate change mitigation require a comprehensive evaluation of ecosystems from economic, ecological and social perspectives. In accordance with that, this paper aims to provide a comprehensive understanding of the plant species we will reference by highlighting their ecological and economic significance. In this context, the term ecosystem services broadly refers to the benefits that ecosystems provide to both themselves and their surroundings, or specifically to the advantages humans derive from natural ecosystems and their constituent species [20]. Ecosystem services are commonly grouped into four categories: supporting, provisioning, regulating and cultural services [21], while some papers, like Zhao and others [22], categorized the grasslands ecosystem services into provisioning, regulating and cultural services.
Provisioning Services of Grasslands: Empirical studies confirm that the biodiversity of semi-natural grasslands positively affects livestock production [23]. Grasslands also play a crucial role in bioenergy production, serving as a source of raw materials for synthetic biofuels, synthetic natural gas and bioethanol [24]. Additionally, they support the availability of genetic resources for economically valuable plant species, including medicinal plants and plants that produce natural fibers, which is becoming increasingly critical with the rising number of endangered species [23,25,26].
Regulating Services of Grasslands: These provide essential ecosystem services, including carbon sequestration, climate and water regulation, soil stabilization and pest control. They store an estimated 412–820 million tons of carbon globally, about one-third of terrestrial carbon stocks [27]. Though less dense than forests, their vast distribution makes them crucial for carbon storage [28]. Grasslands also reduce erosion, enhance water infiltration and improve water quality. Their biodiversity supports natural pest control, benefiting agriculture [29]. Additionally, semi-grassland habitats with 75% vegetation cover capture airborne particles 2.1 times more effectively than barren land, improving air quality [30].
Cultural Services of Grasslands: These offer valuable non-material ecosystem services, including recreation and cultural heritage preservation, and scientific and educational benefits [31]. They serve as key sites for eco-tourism, supporting local economies, particularly in protected areas. Their rich biodiversity, along with the presence of rare plant and animal species, enhances their significance for scientific research and environmental education [22].
Consequently, preserving meadow ecosystem services is crucial for long-term environmental and socio-economic stability. The Millennium Ecosystem Assessment [28] provides a framework for understanding these services [32], recognizing grasslands as vital for biodiversity, carbon storage and desertification prevention while emphasizing their vulnerability to climate change and agricultural expansion [28].
In this paper, we aim to provide a comprehensive understanding of the plant species of grassland ecosystems and sustainable management of grassland vegetation in Vojvodina by evaluating its diversity and ecosystem services. The primary objective is to develop an index that supports the sustainable utilization of these ecosystems while identifying critical knowledge gaps in their potential applications. An index designed in this way can be adaptable for use with other ecosystems beyond grasslands in the future.
Specifically, this research seeks to document the diversity of grassland flora and vegetation in Vojvodina, analyze the ecosystem services provided by grassland vegetation and their role in sustainable development, assess the potential of grassland vegetation in delivering ecosystem services and develop a comprehensive overview of sustainable ecosystem service potential as a decision-making tool. By bridging the gap between ecological benefits and practical applications, this study contributes to the long-term conservation and responsible utilization of grassland ecosystems in Vojvodina.

2. Materials and Methods

2.1. Study Area

Vojvodina is an autonomous province in North Serbia that lies within the Great Pannonian Plain, bordered by the Danube and Sava rivers. This predominantly flat and low-lying region spans 21,533 km2, with the majority of it at elevations ranging from 70 to 200 m above sea level. While the landscape is largely composed of lowlands, it also features occasional hills and a few mountains, as is shown in Figure 1. The province’s fertile black soil (chernozem) makes it one of Europe’s most productive agricultural regions [33,34]. Vojvodina has a moderate continental climate, characterized by cold winters and hot, humid summers. The average annual precipitation in 2023. was 732.1 mm. In the same period, the region’s mean annual temperature was 14 °C, with maximum and minimum averages of 19.7 °C and 8.8 °C, respectively [34].

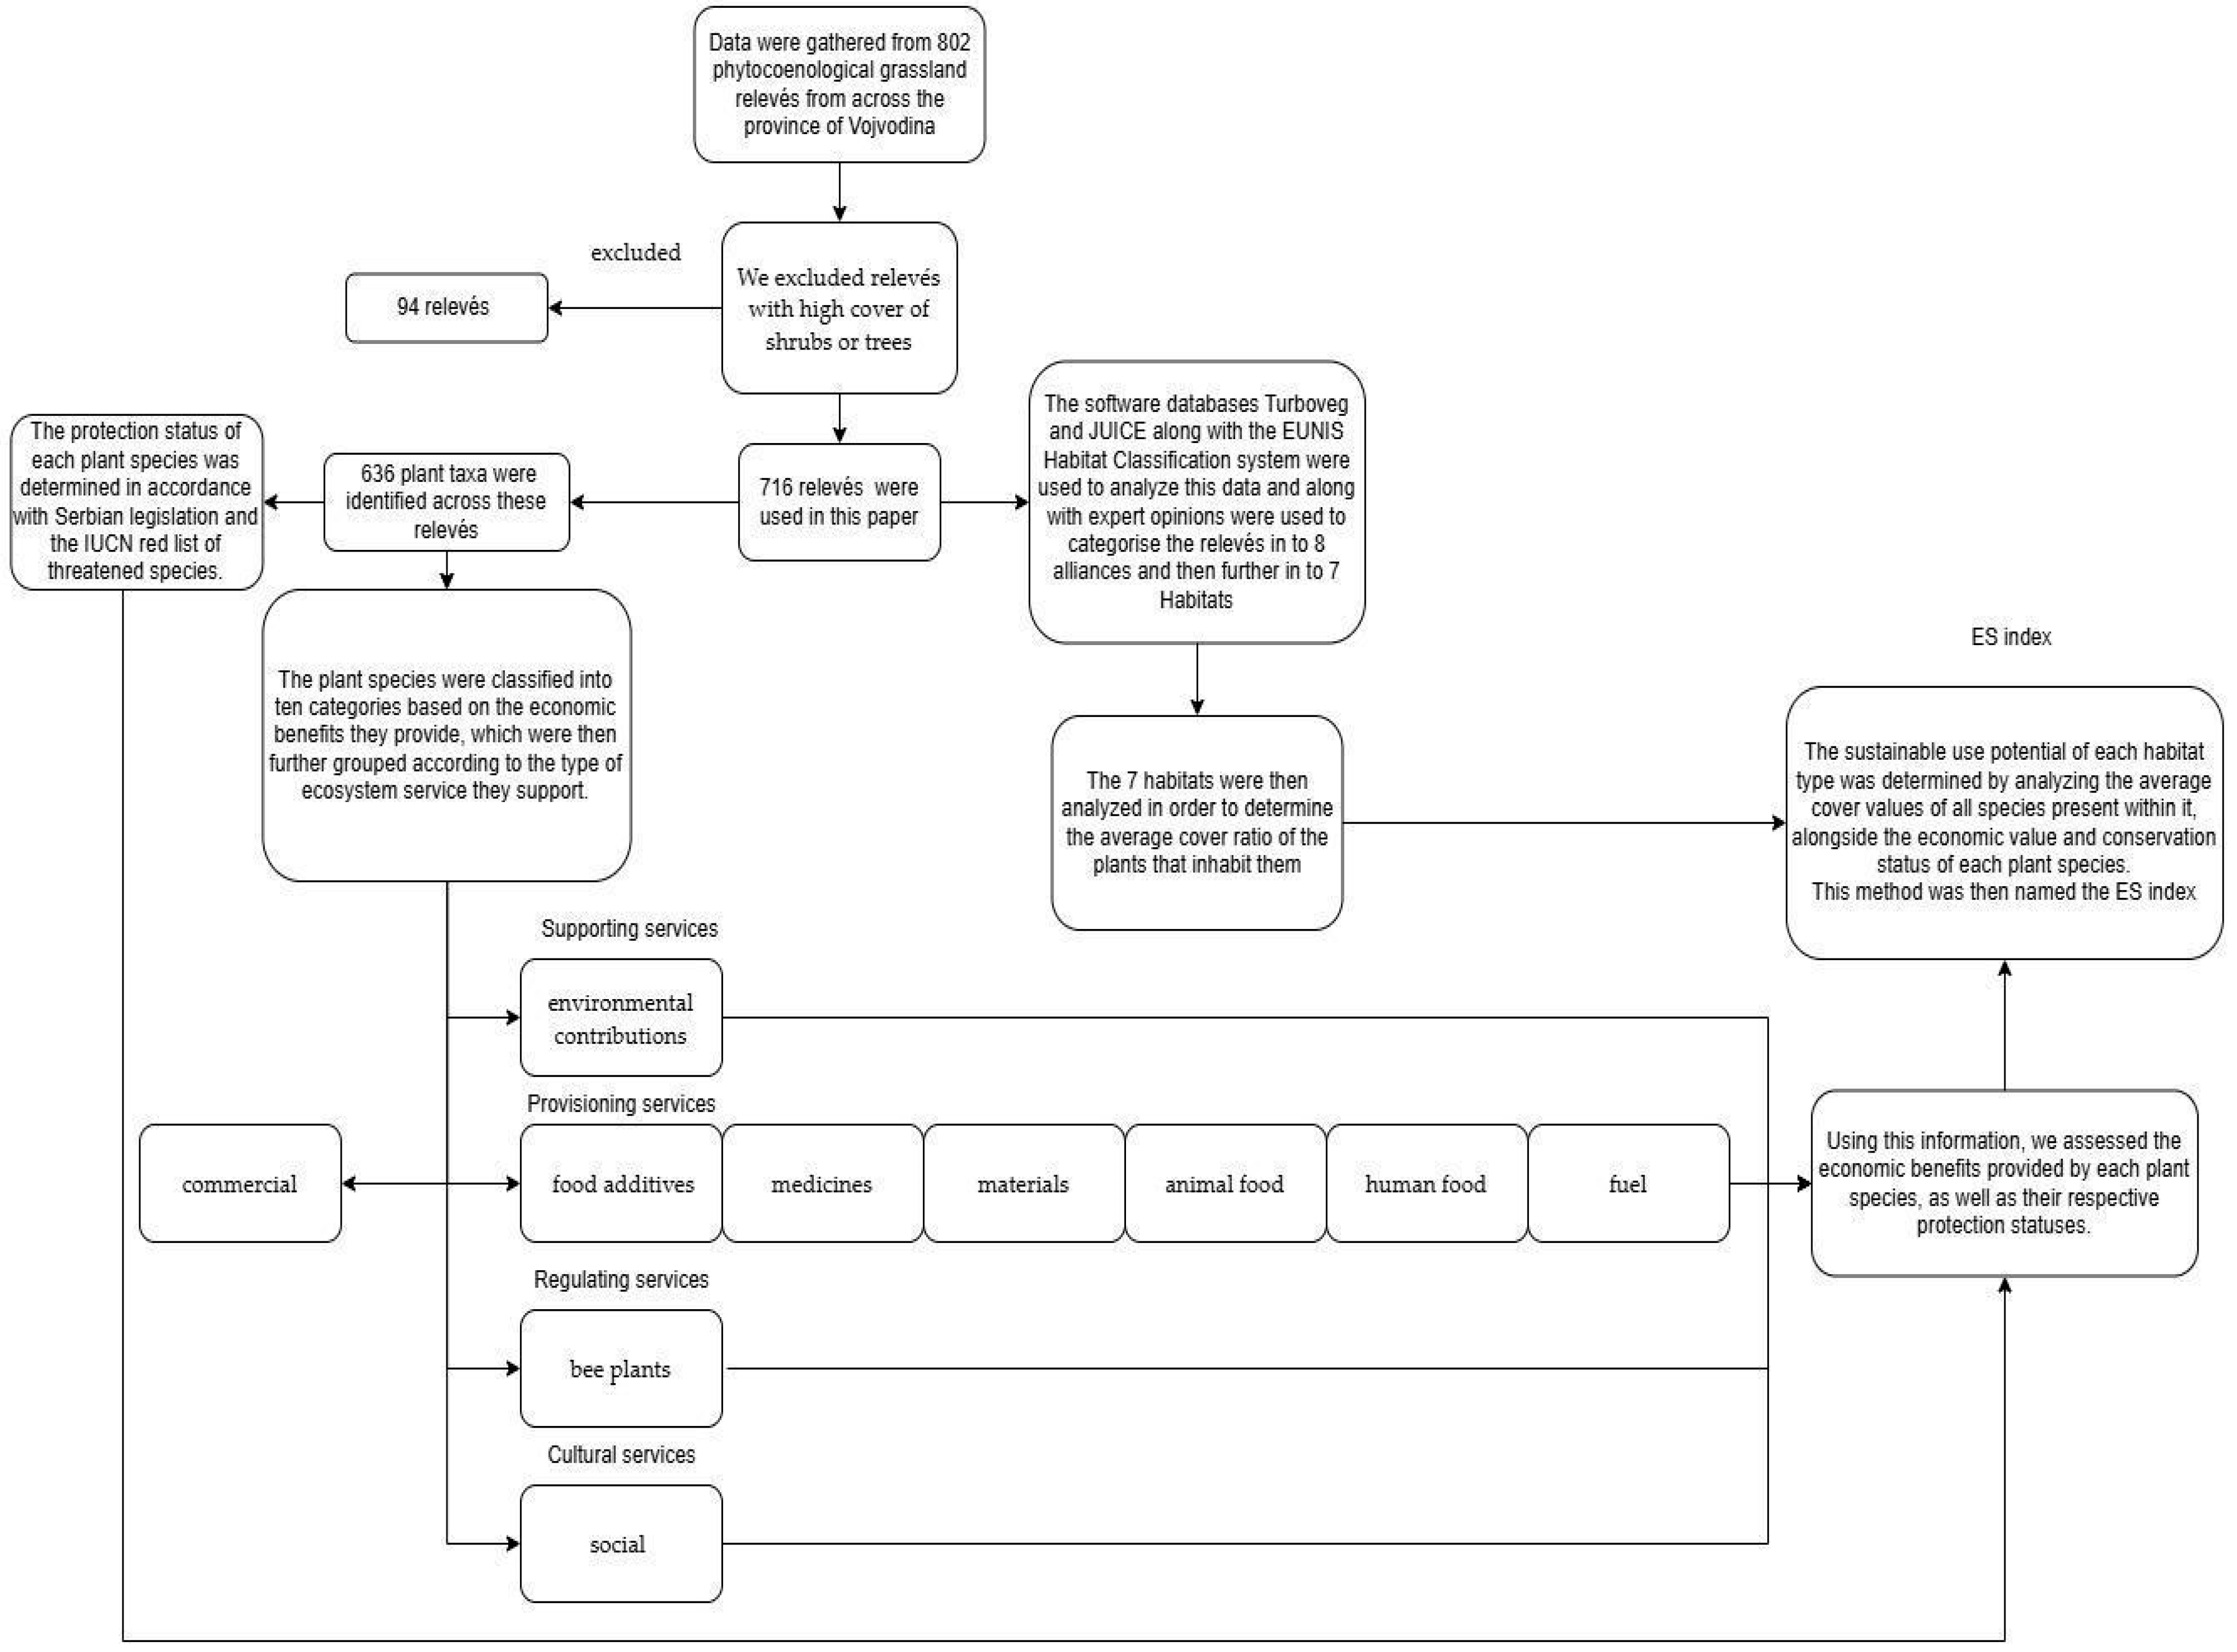
2.2. Data Collection and Data Classification

This study analyzed 802 phytocoenological relevés from Vojvodina. These included 704 plots from literary sources, which are originally described as Molinio-Arrhenatheretea, and 98 plots from our own field surveys. We used data from the database registered as EU-RS-004 Vegetation Database of Northern Part of Serbia (AP Vojvodina) in the European Vegetation Archive (EVA) [35].
The dataset, comprising both literature-based and field-collected vegetational relevés, was gathered using classical phytocoenological methods, as outlined by Braun-Blanquet [36]. Each plot is georeferenced and documented with basic data (altitude, slope, aspect, description of locality and habitat, total cover). We used Laboratory for Higher Plant Systematics and Phytogeography for species determination at the Department of Biology and Ecology, Faculty of Sciences, University of Novi Sad.
All collected plots were deposited into the digital database of vegetation data in the software Turboveg for Windows ver. 2.101 [37]. For the purpose of further analyses, the data were processed on the software platform JUICE ver. 7.0.197 [38]. The taxonomic nomenclature follows Euro+Med PlantBase standards.
Due to differentiations in classification, vegetation and types of habitats, no-meadows habitat types are removed from further analyses. After cleaning the dataset (excluding relevés with high cover of shrubs or trees (>20%), non-target vegetation class or habitat types), finally, 716 relevés were analyzed in this paper. A total of 636 plant taxa were identified across these plots.
These 716 relevés belong to the class Molinio-Arrhenatheretea and eight alliances appearing in Vojvodina: Salvio nemorosae-Arrhenatherion, Trifolio-Ranunculion pedati, Trifolion pallidi, Potentillion anserinae, Molinion caeruleae, Mentho longifoliae-Juncion inflexi, Deschampsion cespitosae and Cynosuriom cristati. These relevés were further grouped into seven habitat types using the expert system of the EUNIS Habitat Classification system [39,40]. The expert system automatically classified 214 plots into habitat types according to EUNIS, while 502 plots were classified into the R habitat group (meadows) without lower specification. A total of 404 of these plots were classified into one of the habitat types, considering their belonging to a certain association and alliance and based on the results of the study by Škvorc et al. [5], while the latest collected relevés (98) were classified according to their characteristic species [5].

2.3. Methodology

The compiled dataset, following cleaning, editing and classification, was subsequently used due to the valuable information it contains on plant taxa and their abundance within each surveyed plot (expressed as cover values according to the Braun-Blanquet scale and converted to percentages). In combination with data on the potential uses of plant species and their protection status, this database served as the foundation for developing and testing the index for the sustainable use of grasslands (ES), as was presented in Figure 2.

2.4. Categorization of Species

To identify economically significant species among the 636 analyzed species, we used data from the Flora Croatica Database Useful Plants [41] and the World Economic Plants reference [42] in order to assess the economic significance provided by individual plant species.
To identify the status of species, we used the bylaw in force in Serbia [43] and the IUCN Red List of Threatened Species [44].
Among the examined species, several currently analyzed protected species emerged as having remarkable potential for sustainable commercial use; for them, we named a category as commercial species. For these species, collection in nature is permitted in accordance with the bylaw in Serbia [45]. These species are named in our analyses as commercial due to the fact that their overexploitation could have a negative impact on their status in nature, yet they are allowed to be collected in nature.
Finally, we defined the economic significance of species by using 10 categories: environmental contributions, food additives, medicines, materials, animal food, human food, fuel, bee plants, social, and commercial. We also connected these categories with ecosystem services. Information gathered from 10 categories about their economic significance was the baseline for the development of an index for the sustainable use of assessment mesic grasslands with economic potential in Vojvodina, including information about the status of species.

2.5. Ecological Analyses

In addition to the economic significance of each species, we employed the Ellenberg Ecological Indices and analyzed plant–environment relationships [46]. Also, we used the trait-based approach to analyze behavioral types, life strategies, life forms and invasiveness by using one of the regional data sources: PADAPT 1.0—Pannonian Dataset of Plant Traits [47]. Moreover, we analyzed diversity using the Pielou Evenness Index with the Shannon–Wiener Diversity Index [48,49,50], degree of naturalness in different habitat types of grasslands [51] and the level of disturbance using Disturbance Indices [52]. All analyzed data were used to identify the factors most strongly correlated with the index for the sustainable use of grasslands (ES) and to predict their relative influence.

2.6. Statistical Analyses

To assess the relationships between habitat characteristics and the values of the newly calculated index for sustainable use of grasslands (ES), different combinations of variables were tested: weighted by species cover (w) vs. unweighted (unw) and percentage cover (pc) vs. percentage cover ratio (pcr). We used the following 26 variables: Disturbance_frequency, Disturbance_severity, Mowing_frequency, perennial cover ratio of protected species, Pileou_Evenness, Shannon–Weiner, PCR_Chamaephyte, PCR_Competitor, PCR_Generalists, PCR_Geophytae, PCR_Hemicriptophytae, PCR_Invasive species, PCR_parasite.hemi.parasite, PCR_Phanerophytae, PCR_Rare.Unique.species, PCR_Specialists, PCR_Therophytae, Borhidis.naturalness_w, Grazing_pressure_w, Light_w, Moisture_w, Nutrients_w, Reaction_w, Salinity_w, Soil.disturbance_w, Temperature_w.
Various combinations of these variables were evaluated to determine the best-fit index, specifically to identify whether weighted or unweighted variables and percentage cover or percentage cover ratio should be used. Given that the response variable was not normally distributed and contained only positive values, we applied a generalized linear model (GLM) with a gamma distribution and a log link function. The optimal combination of predictors, which included weighted variables and percentage cover ratio values, was selected based on model performance using the Akaike Information Criterion (AIC). Subsequently, the variance inflation factor (VIF) was calculated for all selected variables, and two variables with collinearity issues were excluded from the index.
For the significant variables identified in the GLM, Spearman’s rank correlation was performed to assess relationships between predictors. To compare individual variable values across habitat types, we conducted a Kruskal–Wallis test, followed by Dunn’s post hoc test with Benjamini–Hochberg p-value adjustment, as exploratory data analysis indicated that the data did not meet the assumptions for normality (assessed using the Kolmogorov–Smirnov test) or homogeneity of variances (evaluated using Levene’s test).
All statistical analyses were performed in R (v. 4.3.2) [53], with the significance level (α) set at 0.05 for all applied tests.

3. Results

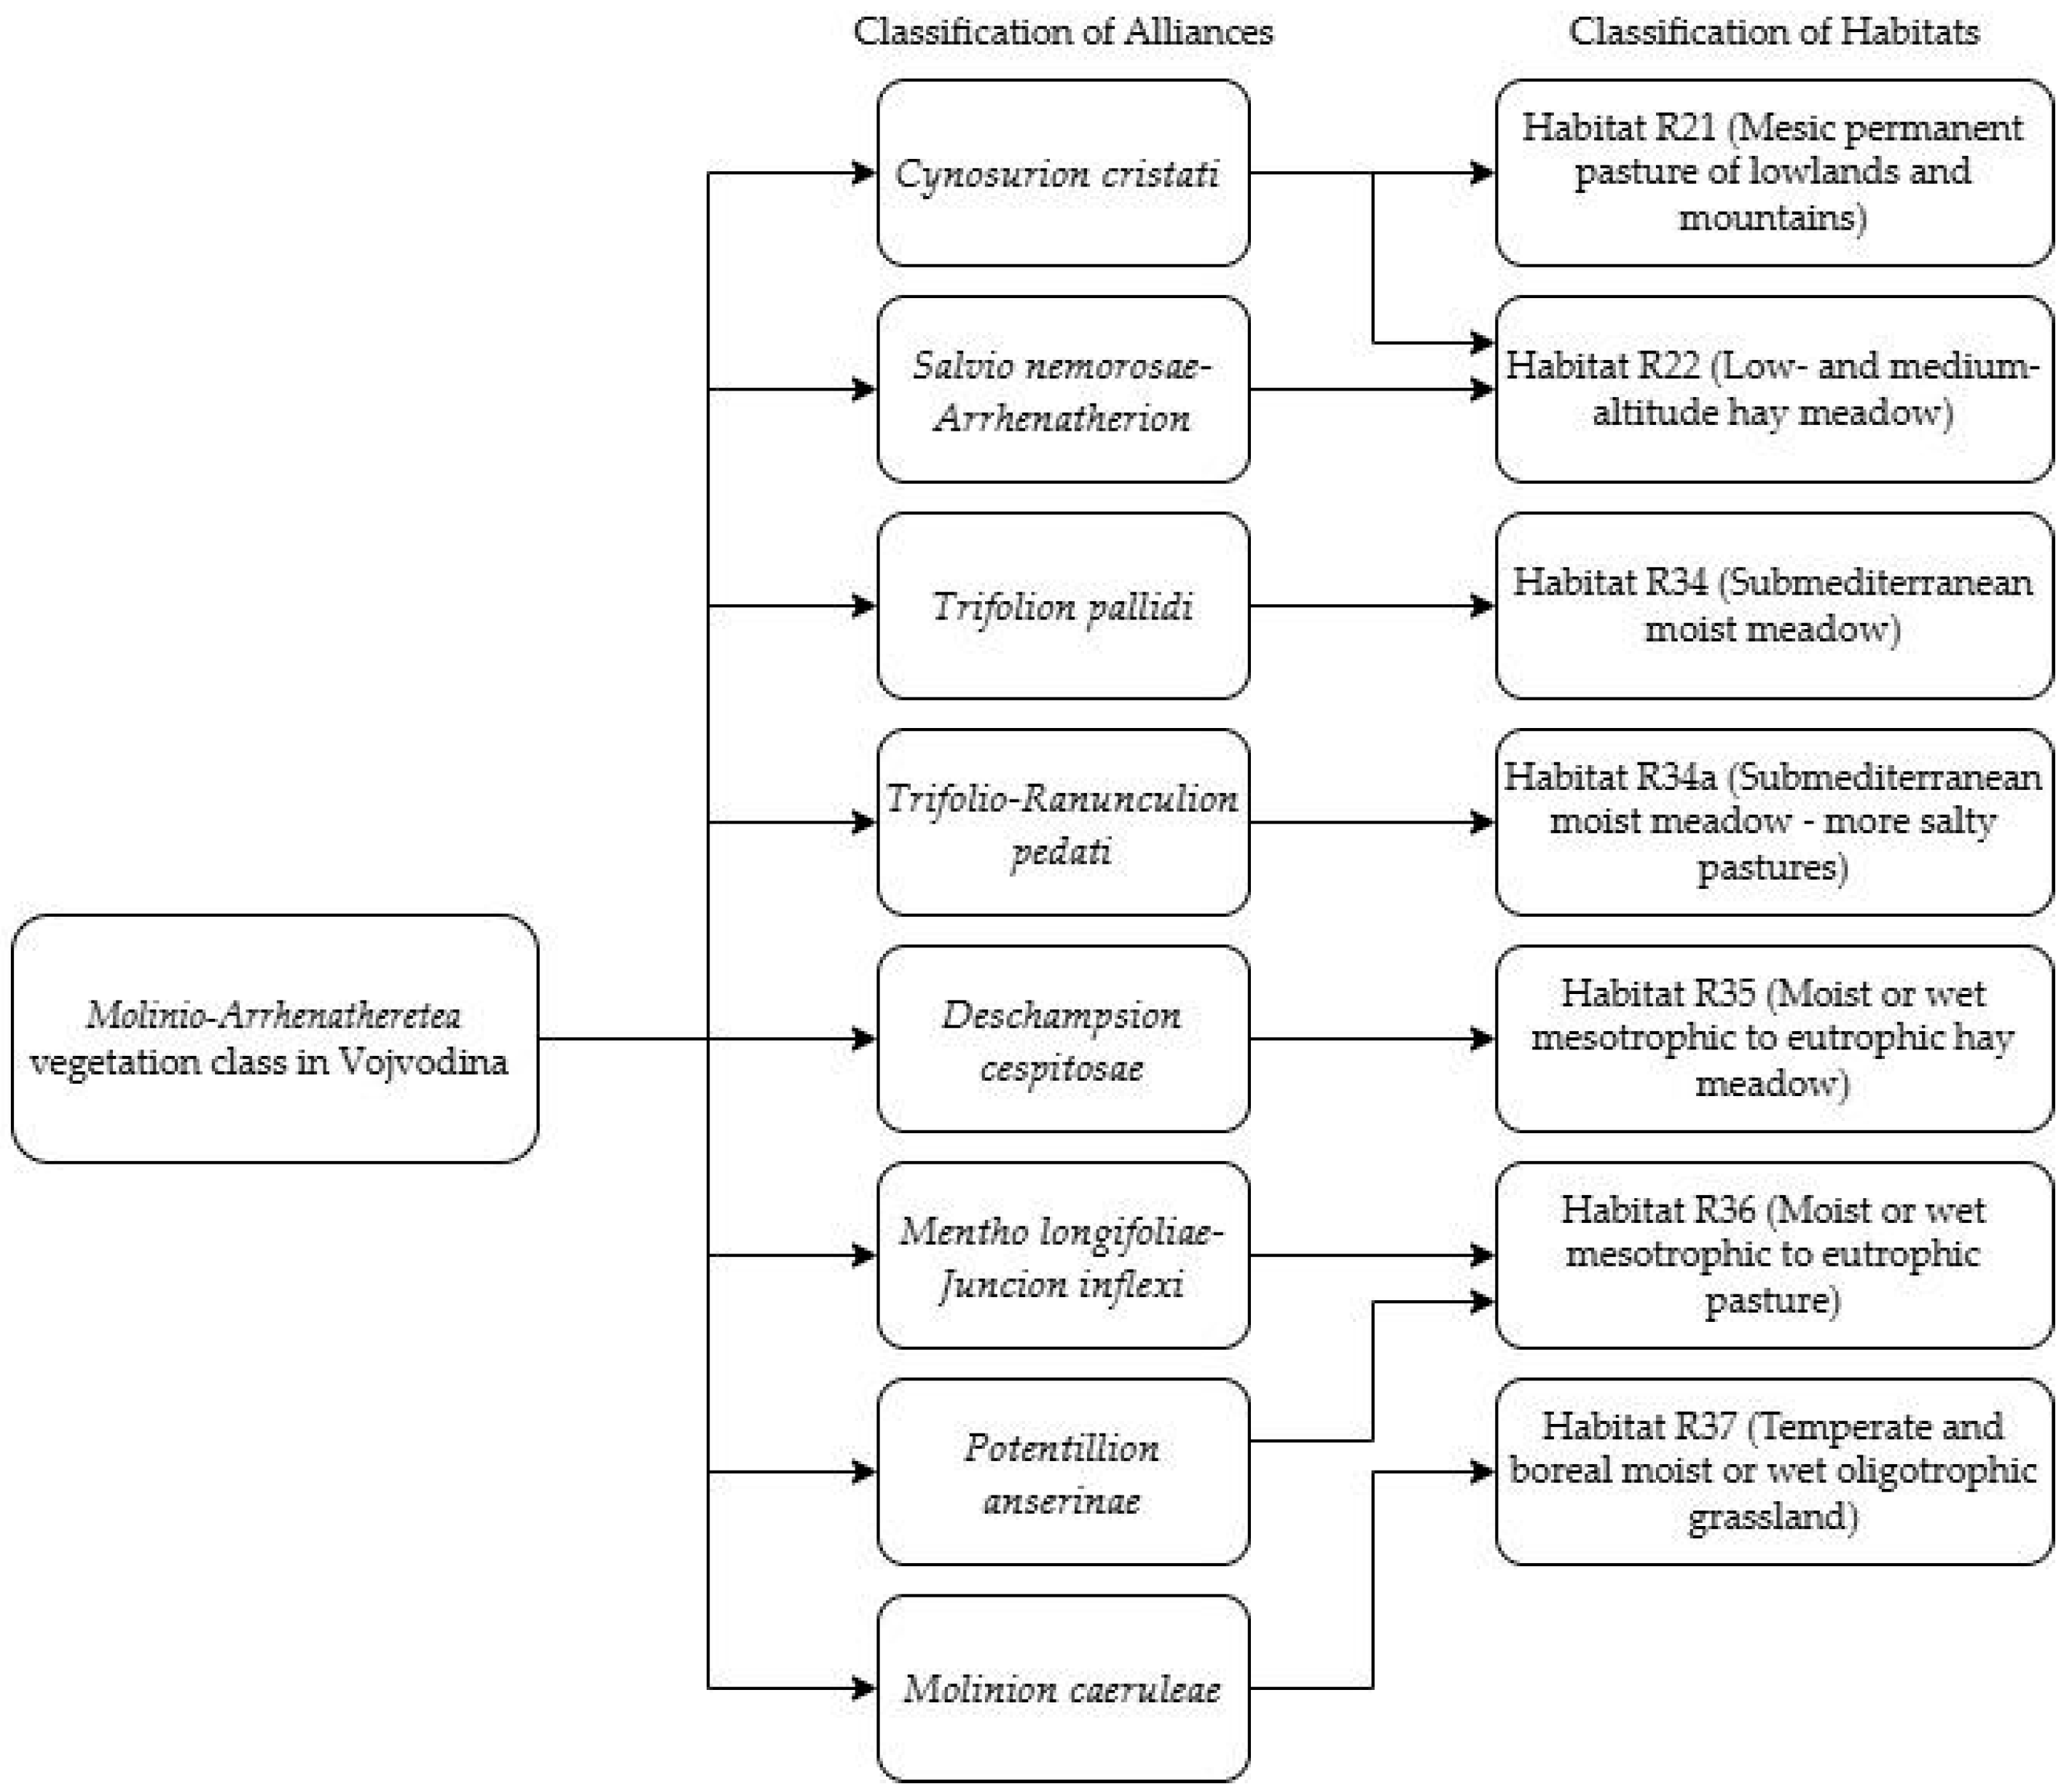
3.1. Classification of Habitat Types

We identified seven different grassland habitat types in Vojvodina, as presented in Table 1 and Figure 3.
Habitat types correspond to habitat types according to EUNIS, except in the case of habitat type R34, which is here divided into two separate units. This decision was based on the recognition that R34 encompasses a broad and diverse range of habitats with different species composition, soil characteristics and management type. We created a new habitat type, R34a, which includes the drier and more saline environments typically found within the original R34 habitat category.

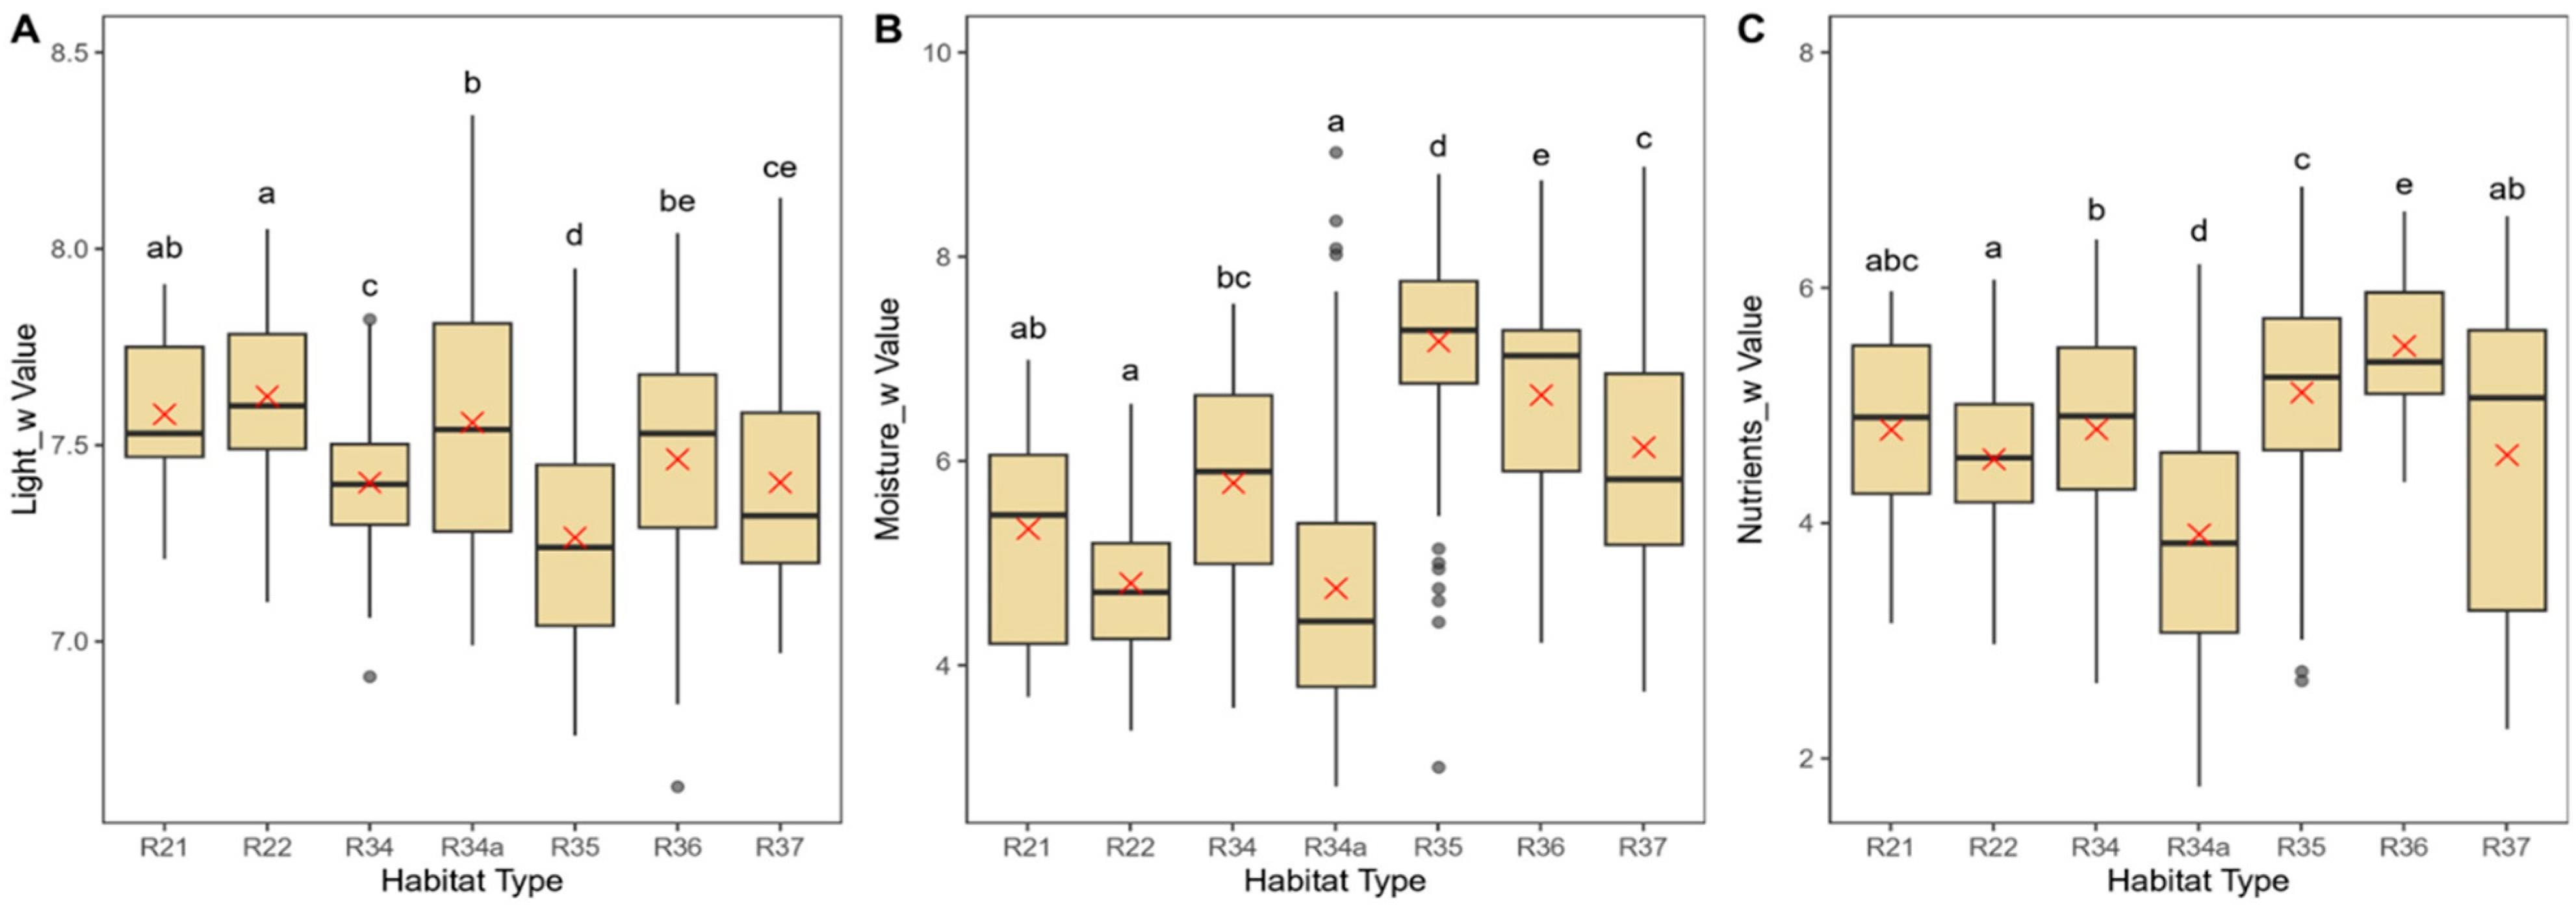
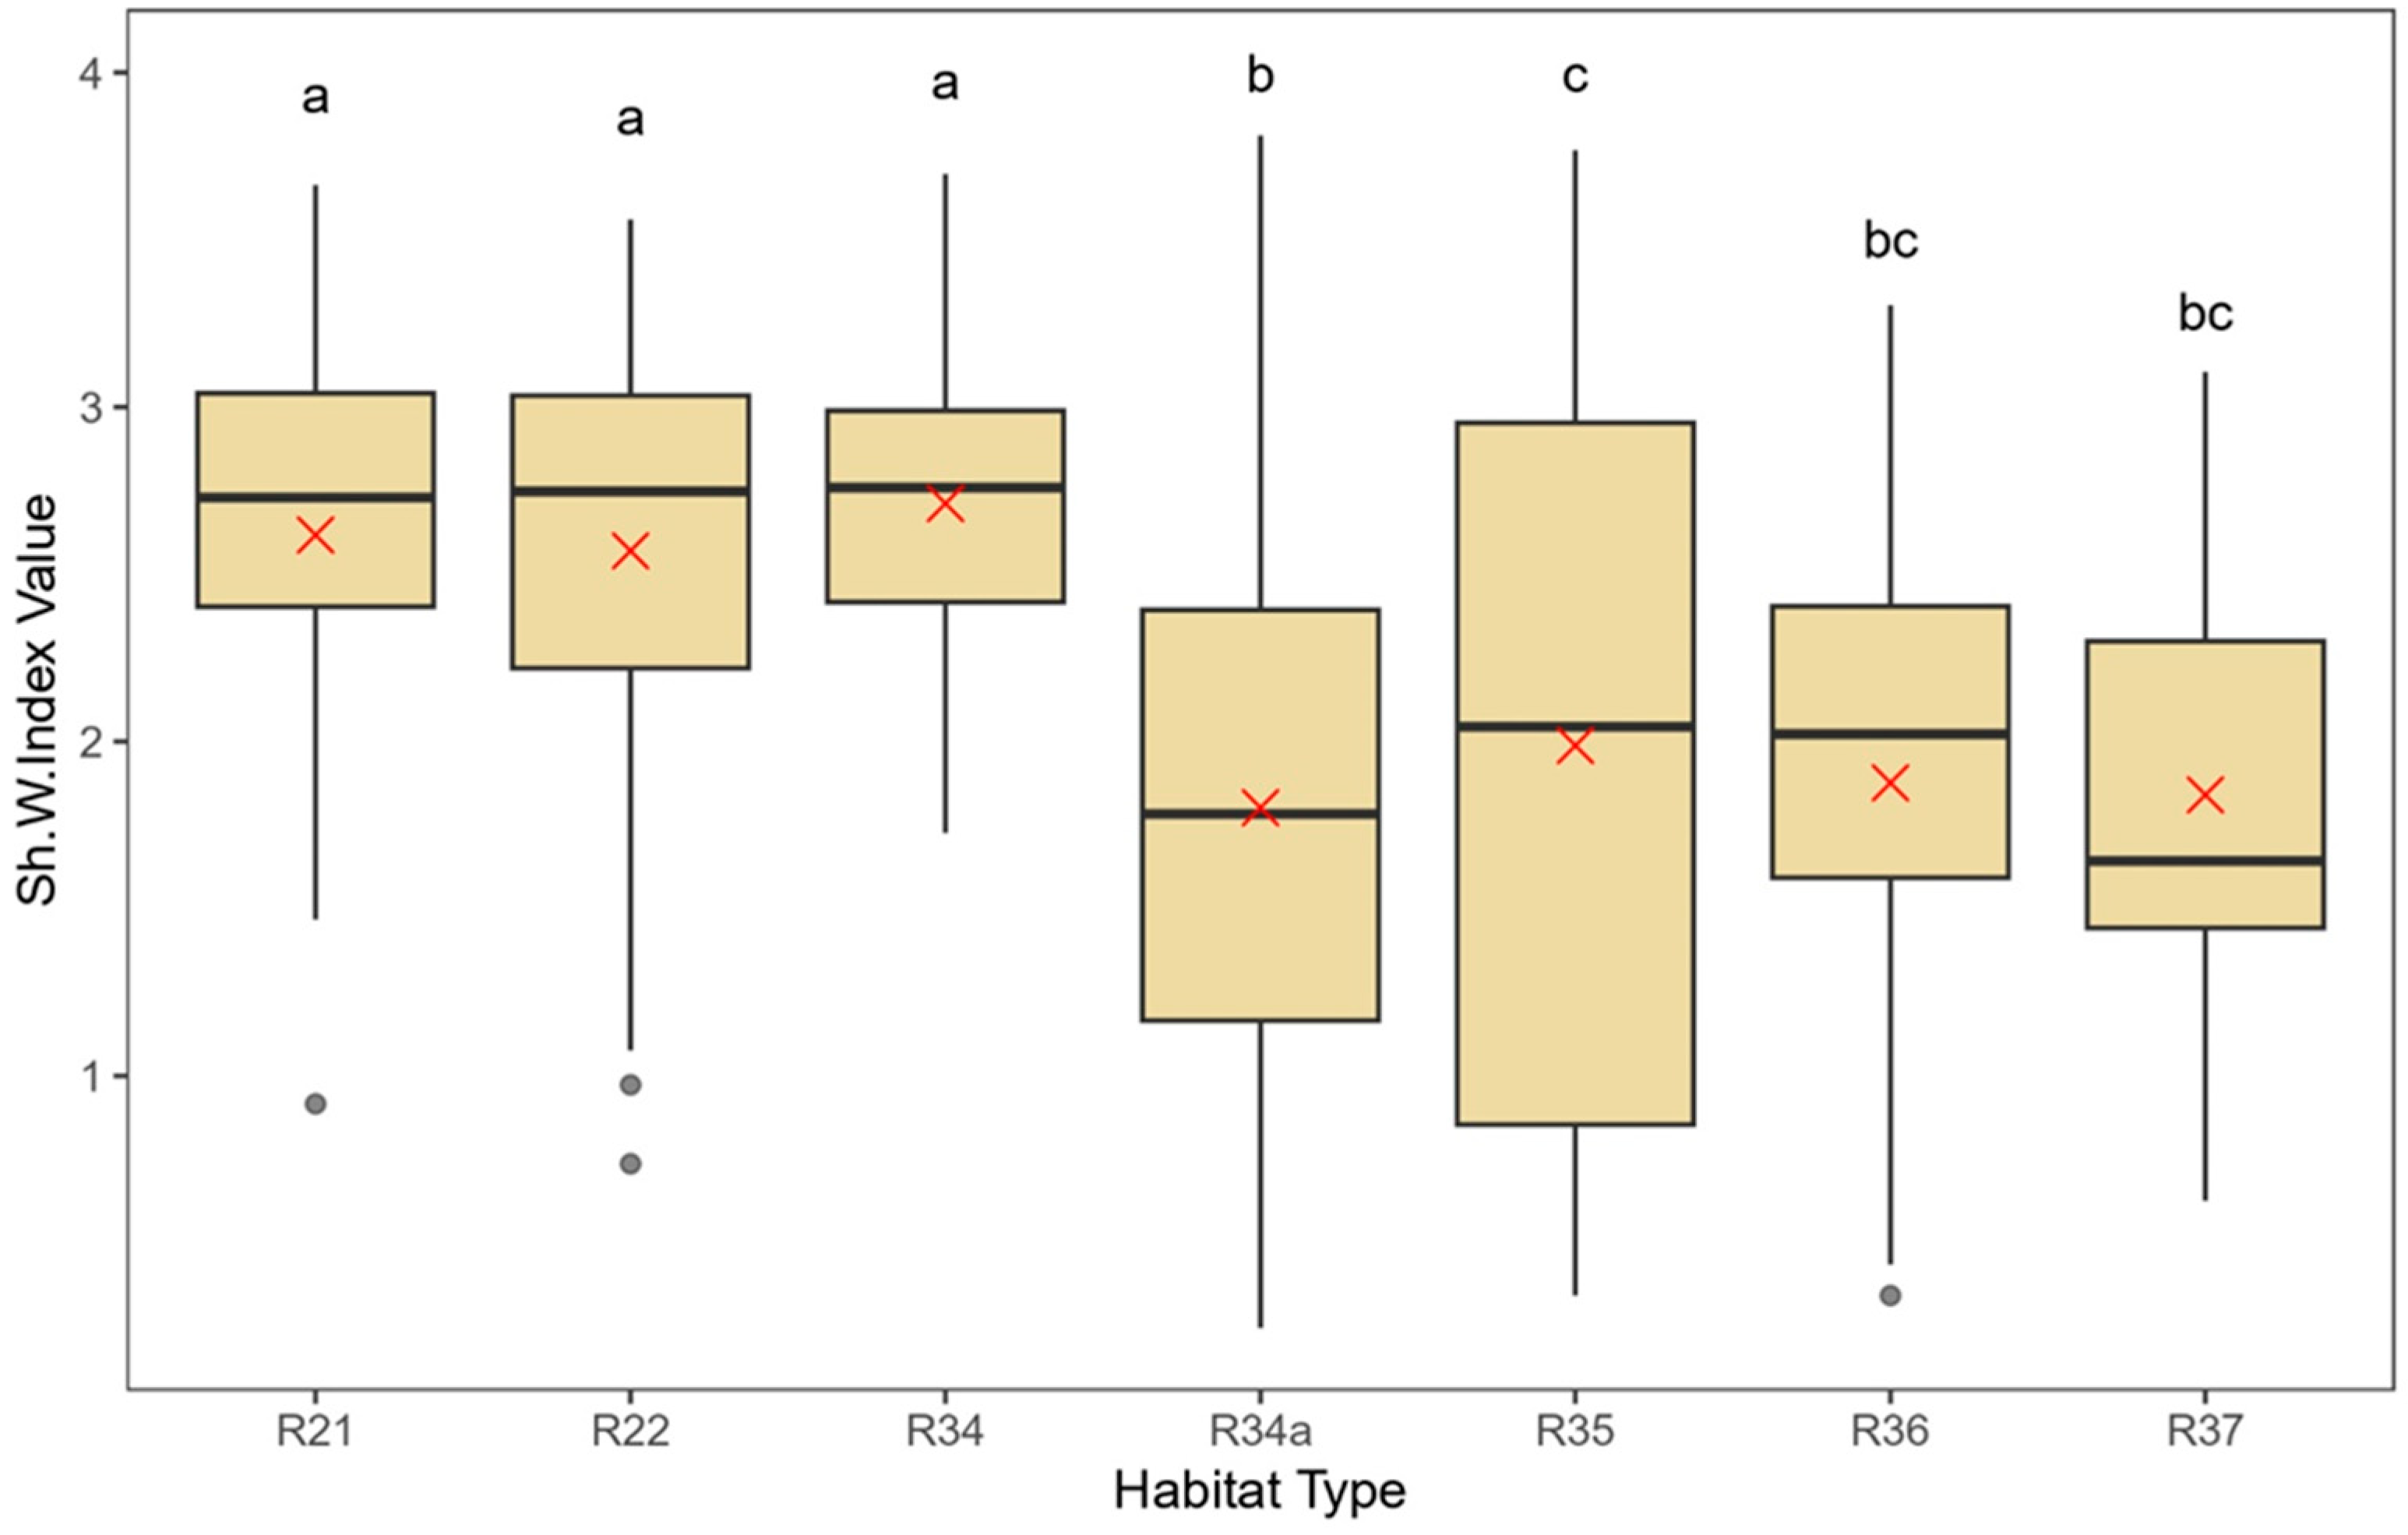
3.2. Ecological Differentiation and Diversity Between the Analyzed Habitat Types

In Figure 4, the highest mean light availability (A) is observed in habitat R22, with R21 and R34a displaying similarly high values. In contrast, habitat R35 has the lowest recorded light availability, suggesting a significantly lower exposure to light compared to the other habitats. This may indicate that R22, R21 and R34a have more open or less obstructed conditions, whereas R35 is likely more shaded, covered by dense vegetation or situated on steep slopes, thereby limiting light availability.
For moisture (B), habitat R35 exhibits the highest mean value, indicating a relatively wetter environment, closely followed by habitat R36. In contrast, habitats such as R22 and R34a show noticeably lower moisture levels, suggesting drier conditions. These variations in moisture availability may be influenced by differences in soil composition, drainage efficiency, or proximity to water sources.
Regarding nutrient availability (C), habitat R36 has the highest mean value, indicating richer soil conditions that may support nutrient-demanding plant species. Conversely, habitat R34a exhibits the lowest nutrient availability, which may suggest relatively poor soil fertility or nutrient depletion.
In Figure 5, habitat R34 exhibits the highest mean value, with R21 and R22 also showing similarly high values. In contrast, habitat R34a has the lowest mean value, with R35, R36 and R37 also displaying relatively low values.
In Figure 6, the highest mean value was observed in habitat R34, followed closely by R21 and R22. In contrast, habitat R34a had the lowest mean value, with similarly low values recorded for R35, R36 and R37. This suggests that R21, R22 and R34 exhibit high biodiversity and a greater number of species, whereas R34a, R35, R36 and R37 support a notably lower biodiversity.
In different habitat types, the sensitivities of plant species to habitat degradation vary—some species thrive in natural or near-natural conditions, while others tolerate or even benefit from degradation [54]. The biomass loss or degradation, as well as soil degradation, are often grouped together and referred to using the term disturbance, and during the analysis of the seven habitats, they were tracked and calculated using a Disturbance Index [52]. At the same time, the naturalness of the habitats shows us the presence of the species characteristic of natural habitats. We assessed the degree of naturalness in the habitats using the naturalness indicator values proposed by Borhidi [52], which positions habitats along a natural-to-degraded gradient filter near natural habitats (with high scores).
In Figure 7A, the highest mean value for disturbance frequency is presented for habitat R34, with high mean values for habitat R36, and on the other side, with the lowest value for habitat R37. The highest mean value for disturbance severity in Figure 7B is highlighted for habitat R22. As for soil disturbance, shown in Figure 7C, and mowing frequency, shown in Figure 7E, the highest mean level is presented for habitat R21. For grazing pressure, shown in Figure 7D, the highest mean value is presented for habitats R36 and R34a. Additionally, naturalness, shown in Figure 7F, shows the highest mean value for habitat R37.

3.3. Ecosystem Services

To present the ecosystem services provided by meadow ecosystems, we categorized the significant economic species used to calculate their economic potential into four distinct ecosystem services groups: supporting, provisioning, regulating and cultural, as shown in Figure 8.

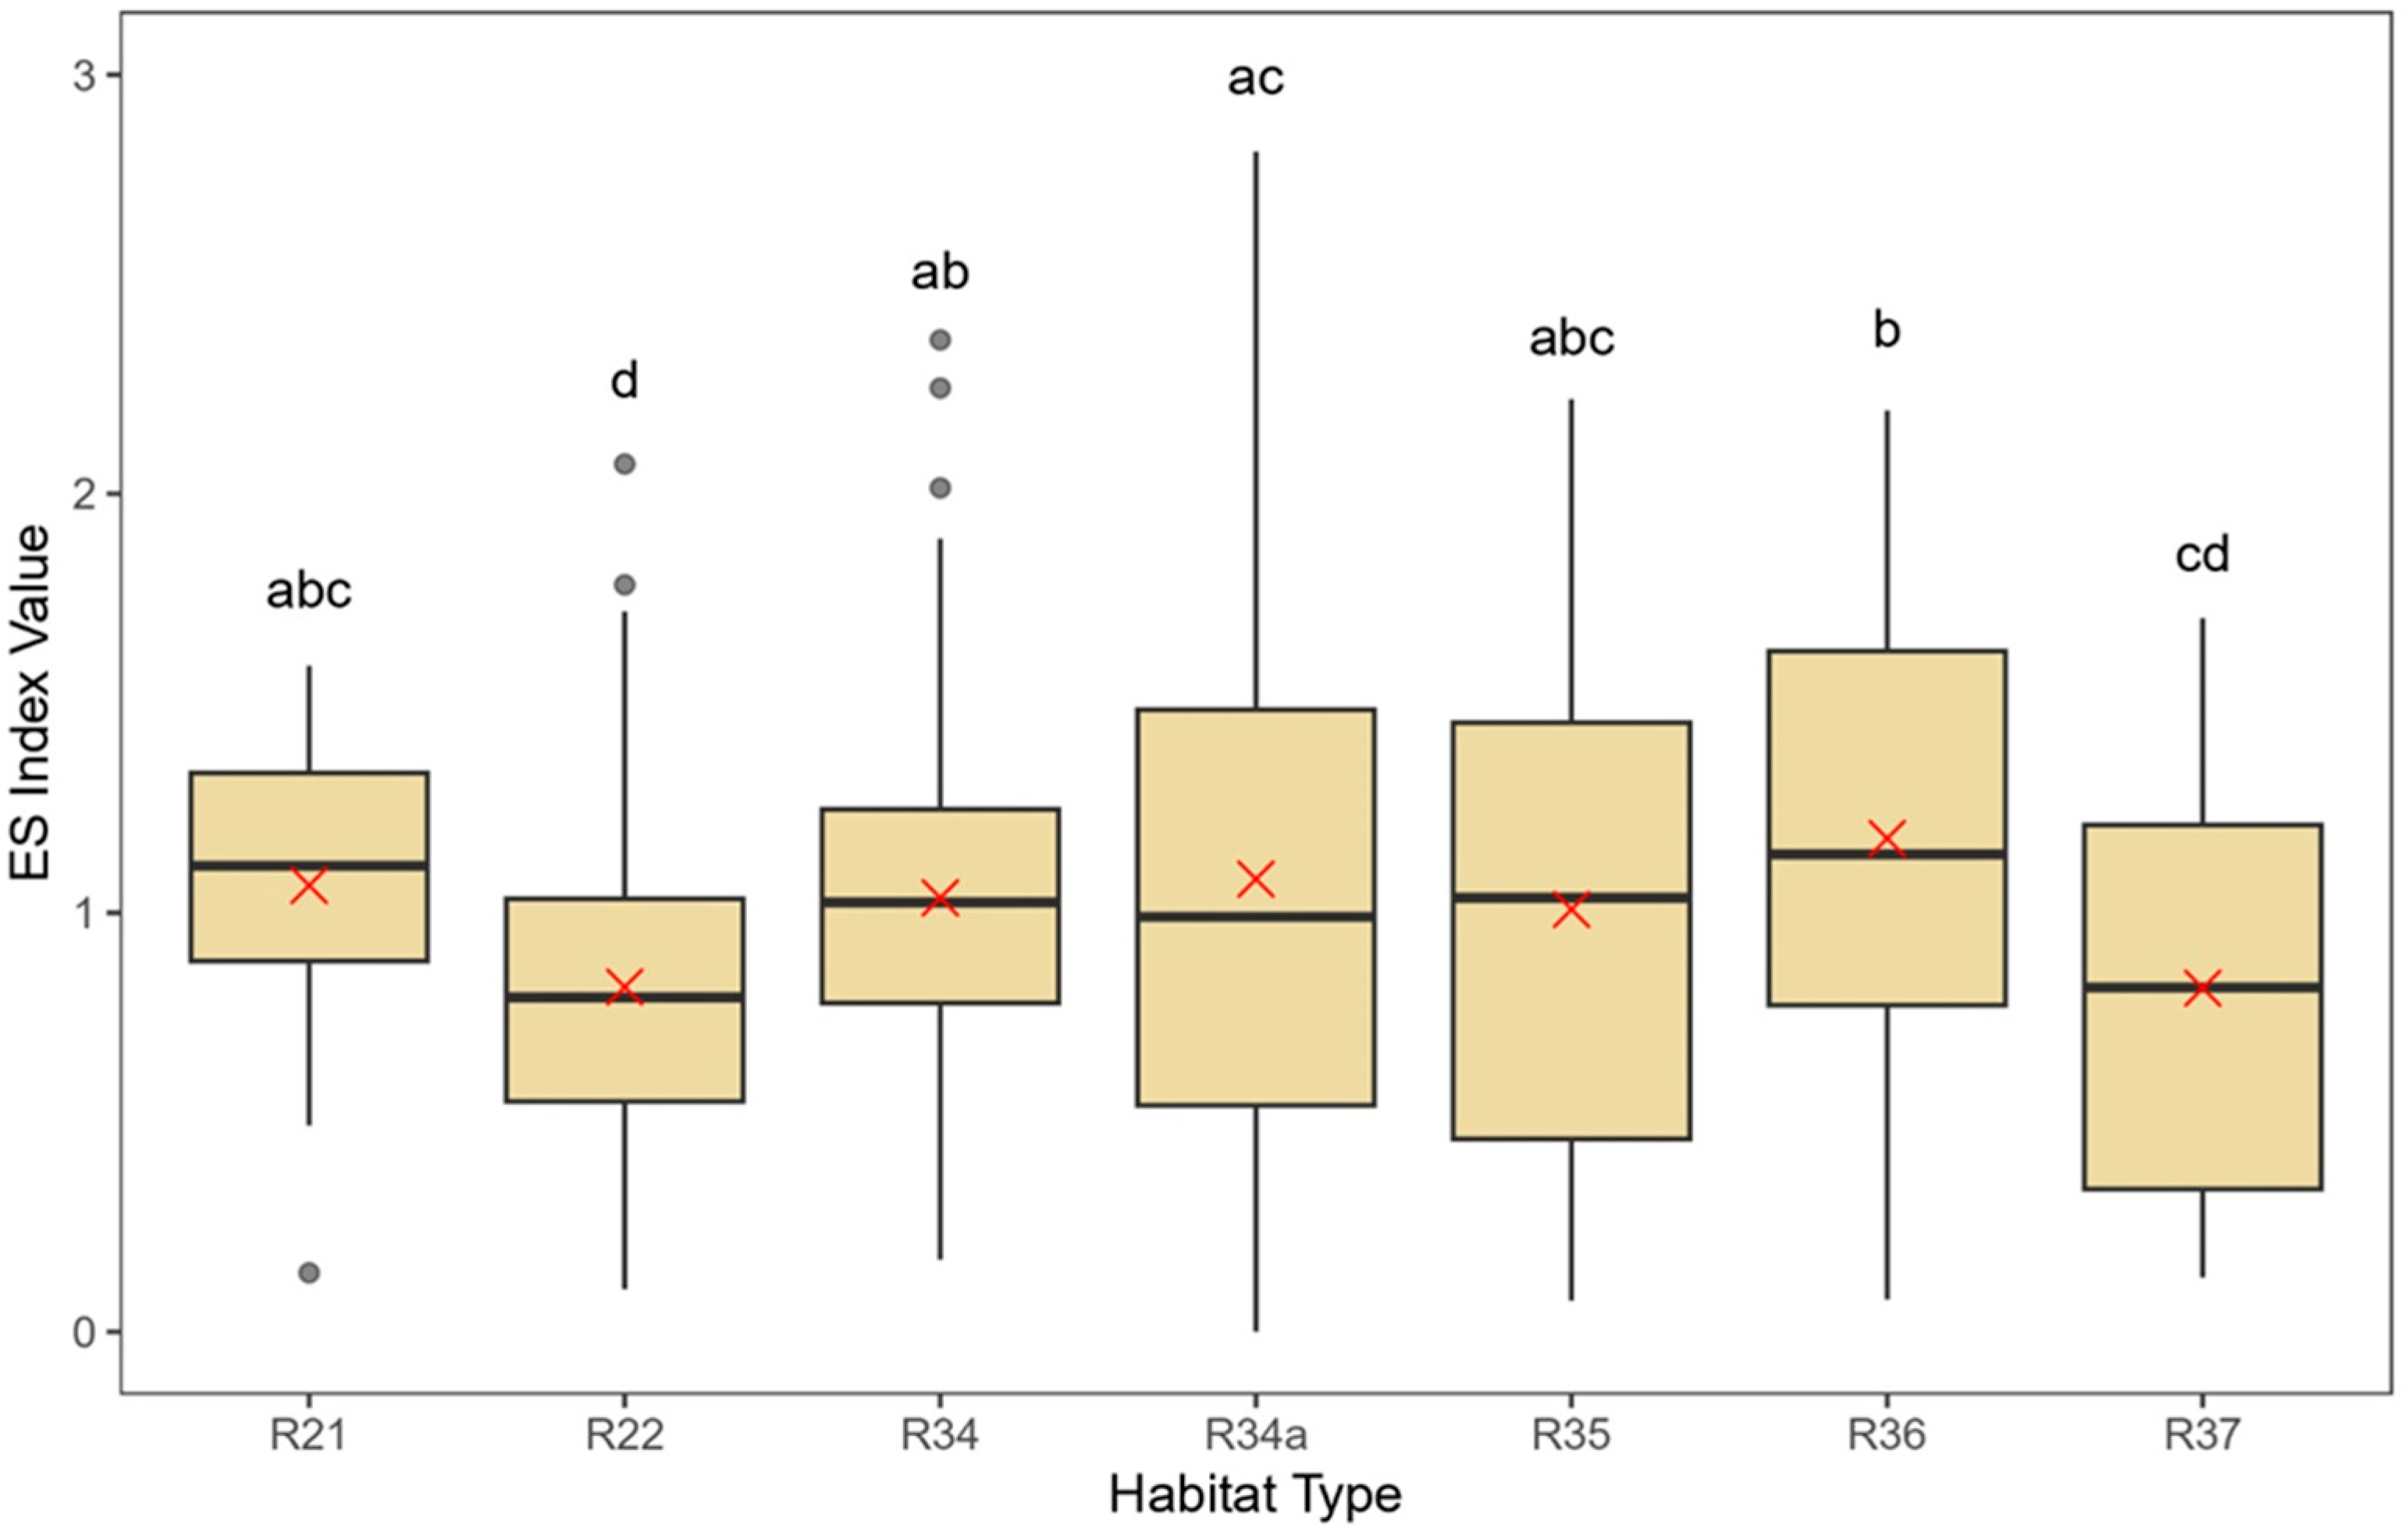
3.4. ES Index (Index for Sustainable Use Assessment)

The entire class of Molinio-Arrhenatheretea Tx. 1937 was analyzed using the index, providing accurately expressed values of the economic significance of plant species and indicating the potential for the sustainable use of grassland in Vojvodina. In this study, we developed a novel index to estimate the potential for the sustainable use of meadows, specifically focusing on the alliances and habitats, and basing it on plant species utilization. The new index unique to this paper is represented by Equation (1):
E S = S e × N e c S p n
where ES represents the sustainable use potential based on the economic importance of flora per relevé, Se is the average coverage value of economically significant species per relevé, Nec is the number of categories of ecosystem services in which an economically significant species appears in relevé, Sp is the average coverage value of protected/strictly protected species and n is the total cover of all species per plot.

3.5. New Estimation Index for Sustainable Use Assessment

Figure 9 presents the results of the index developed to estimate the potential of the sustainable use of grasslands in Vojvodina, with Table 2 presenting the exact mean values, through the analysis of seven different habitats, based on the economic significance of plant species. The highest values were observed for habitat R36, while the lowest value was obtained for habitat R37.
The x-axis represents the seven analysed habitat typesThe y-axis represents the index value, described as the ES index value, which is a measure of sustainable use based on the economic significance of flora.
For analyzed meadows, the ES mean values range from 0.820 to 1.18, indicating varying levels of sustainable use potential across the different habitats, whereas habitat R37 has the lowest ES mean value, representing negative potential for the sustainable use of its meadows, and on the other side, habitat R36 was shown to have the highest ES mean value and the greatest potential for sustainable use.

3.6. Predictors of the ES Index

Sixteen out of the twenty-six variables analyzed in this study were selected as the optimal combination of significant predictors for the ES index (Table 3). These 16 variables could have a statistically significant influence on how sustainably the grasslands are being used.

3.7. Results of the Correlation Model

Figure 10 shows positive correlations and suggests that factors such as grazing, light availability and the presence of specific plant functional groups contribute to higher sustainable use potential ES values in meadow ecosystems. The moderate positive correlation with grazing pressure (0.28) indicates that controlled grazing could help maintain the ecological balance in the meadows by limiting the dominance of certain plant species, leading to sustainable use. However, the relationship is not very strong, so other factors, such as plant diversity and soil quality, are likely influencing the sustainability index as well. The weak correlations of disturbance frequency (0.12) and mowing frequency (0.07) with ES values suggest that while these factors influence ecosystem services, their impact is relatively minor. Similarly, the correlation with naturalness (0.13) implies that undisturbed ecosystems tend to have higher ES values, highlighting the complexity of these interactions.
Conversely, the weak negative correlations of disturbance severity (−0.10) and soil disturbance (−0.02) suggest that excessive stress, whether from soil disturbance or other sources, negatively affects ecosystem resilience, health, biodiversity and sustainable use potential. The weak positive correlation with light availability (0.22) suggests that while variations in light conditions influence ES values, their effect is relatively minor. Increased light availability may support plant diversity and productivity, but other factors likely play a more considerable role. In contrast, the negative correlation with nutrient levels (−0.16) indicates that excessive nutrient enrichment, possibly due to fertilization or runoff, reduces ecosystem service potential. This is likely caused by the overgrowth of competitive species, which decreases plant diversity and accelerates the succession of secondary grasslands into other ecosystem types, such as forests. This finding aligns with ecological principles, suggesting that high nutrient availability leads to species homogenization and a decline in ecosystem resilience.
Additionally, the negative correlations of reaction index (−0.09) and moisture levels (−0.02) with ES values suggest that excessive moisture and high pH levels may reduce ecosystem service availability. The weak positive correlation with the Evenness Index (0.07) indicates that balanced species distribution within the community may contribute to improved sustainable use potential.
The composition of species within these ecosystems also plays a role in their sustainability. Positive correlations were observed with PCR_Competitor (0.17), PCR_Generalists (0.02), PCR_Parasite/hemi-parasites (0.02) and the perennial cover ratio of protected species (0.13), suggesting that a high prevalence of competitors, generalists, parasites and protected species positively impacts habitat quality, stability and ecosystem functionality. Conversely, the strongest negative correlation was observed with PCR_Hemicryptophytes (−0.29), indicating that a high prevalence of hemicryptophytes, species adapted to frequent disturbances, may negatively impact the sustainable use potential of these habitats. Additional significant positive correlations exist between the rest of the parameters.
A strong correlation exists between the Evenness Index and PCR_Generalists (0.54), indicating that as species evenness increases, the proportion of generalist species also tends to rise. In contrast, the Evenness Index shows weaker positive correlations with PCR_parasite.hemi.parasite (0.25), the perennial cover ratio of protected species (0.27) and mowing frequency (0.24).
Mowing frequency exhibits a strong correlation with soil disturbance (0.42) and a slightly weaker correlation with disturbance severity (0.30), disturbance frequency (0.26), PCR_Generalists (0.20), PCR_parasite.hemi.parasite (0.27) and Pielou’s Evenness Index (0.24). While mowing contributes to soil disturbance, the severity of this disturbance depends on additional factors. As expected, disturbance severity strongly correlates with soil disturbance (0.68), emphasizing the impact of land-use practices.
Spearman Rank Order analysis reveals additional significant correlations. Moisture is strongly correlated with nutrients (0.59) and PCR_Competitors (0.36), suggesting its role in ecosystem function. Other factors, such as soil fertility, moisture and biodiversity, may play a more important role in determining ecosystem service potential. Soil disturbance shows a positive correlation with disturbance frequency (0.43) and light availability (0.46), while light availability itself strongly correlates with disturbance frequency (0.40). Grazing pressure also demonstrates strong correlations with both light availability (0.54) and disturbance frequency (0.59), reinforcing its substantial role in shaping meadow ecosystems.
The correlation analysis further highlights a strong relationship between naturalness and PCR_Competitors (0.54). Additionally, reaction correlates with the perennial cover ratio of protected species (0.21) and PCR_parasite.hemi.parasite (0.27). Lastly, PCR_parasite.hemi.parasite shares a moderate correlation with PCR_Generalists (0.32).

4. Discussion

During the classification of habitats, we have categorized seven different habitat types, mostly according to the EUNIS system [40]. Only for the diverse R34 habitat type, we divided it into two distinct subtypes, R34a and R34, based on the notable differences in their usage/management. According to our classification, R34a habitats are primarily used for livestock grazing, while R34 habitats are typically mowed for hay production. This distinction is clearly reflected in several of the environmental indices used in this paper and clearly shapes the sustainable potential of these habitats. This indicates that grasslands that are grazed show more promise for sustainable use, which is also corroborated by our statistical analysis.
Pielou’s Evenness Index suggests that R34, R21 and R22 have a more even distribution of species coverage across the surface area, whereas R34a, R35, R36 and R37 are characterized by a few dominant species occupying most of the available space. Pielou’s Evenness Index is positively correlated with grassland biodiversity, as it measures how evenly individuals are distributed among species in a given habitat. Higher values of this index indicate a more balanced species composition, which is a key characteristic of biodiverse ecosystems [55]. This result is in alignment with our results, which show that the Shannon–Weiner Species Diversity Index does not follow the ES index, where species diversity is not affecting the potential for sustainable use of grasslands.
While analyzing behavioral types, we concluded that competitive species dominate in stable, resource-rich environments. The stronger correlation between competitors and overall community structure suggests that competition is a key factor in grassland composition. The weaker correlation with weeds indicates that disturbance or environmental factors likely play a larger role in determining weed abundance than pure competition alone. This suggests that while competitive species significantly shape meadow ecosystems, weeds follow a somewhat different ecological trajectory, leading to their weaker association with competitive species.
In our case, the naturalness of habitats R36 and R37 is inversely proportional, with the values of the ES index calculated for these habitats, which indicates that the low naturalness of the R36 habitat confirms its status as a secondary phytocoenosis and as the habitat with the highest potential for sustainable use of its meadows. A habitat with high naturalness may initially appear incompatible with sustainable use, and in some respects, this is true. However, sustainable use is defined not by a habitat’s original untouched condition but by how economic benefits can be derived while preserving biodiversity and ecosystem health from the point at which sustainable practices are implemented onwards. Interestingly, habitats that are strongly shaped by human influence, and as such possess low naturalness, often support a wide range of species that thrive under such conditions. This does not equate to low biodiversity, nor does it mean the ecosystem lacks resilience or the potential for sustainable use. With careful and informed management, these environments can sustain diverse, robust ecosystems that continue to deliver essential ecological functions and services.
While small-scale or natural disturbances can sometimes boost the biodiversity of meadows, excessive or frequent disturbances often lead to long-term biodiversity loss and soil degradation [55]. Species diversity tends to peak at moderate levels of disturbance, following the intermediate disturbance hypothesis. At these levels, competition is reduced enough to allow a variety of species to coexist, but disturbance is not so extreme that it eliminates many species. However, as disturbance intensifies beyond this optimal range, diversity declines sharply because only the most resilient species can survive [55,56]. Soil disturbance can reduce biodiversity by disrupting soil microbes, plants and animals, leading to erosion, nutrient loss, and invasive species spread. However, in some cases, it can promote certain species, release nutrients and support ecosystem renewal [57,58].
Overdisturbance, such as intense mowing, grazing or soil degradation, leads to weed dominance, reducing ecosystem stability. Underuse in the form of abandonment or lack of grazing or mowing allows competitive species to dominate, lowering biodiversity. A mosaic landscape approach, such as rotational grazing, patchy mowing and seasonal management, maintains species richness, ecosystem services and sustainable forage production [59,60].
When analyzing the correlation between the newly developed ES index and the selected variables, grazing pressure exhibited the strongest positive correlation with ES. This suggests that higher grazing pressure is associated with an increase in the ES index, potentially due to its role in maintaining plant diversity and ecosystem function. Light availability also showed a high positive correlation, indicating that areas with greater access to sunlight tend to support higher ecosystem service values, possibly through enhanced primary productivity and biodiversity. Mowing frequency, while still displaying a significant positive correlation, had a lower coefficient. This suggests that while mowing may contribute to ecosystem service provision, its effect is less pronounced compared to grazing pressure and light availability.
These findings align with existing research, which highlights the crucial role of moderate grazing and mowing in enhancing grassland biodiversity. By preventing the dominance of aggressive plant species, these practices promote a diverse range of flora and create varied habitats for wildlife [59,60]. When livestock graze in controlled amounts, they help maintain an open landscape, allowing sunlight to reach lower-growing plants that might otherwise be overshadowed. Additionally, their movement disturbs the soil just enough to encourage seed dispersal and germination, fostering a rich mix of grasses, wildflowers and other native vegetation. However, to maximize these benefits, grazing must be carefully managed to prevent overgrazing, which can lead to soil degradation and the loss of plant species [59,60].
The habitat with the highest potential for sustainable use is R36. Primarily grazed by cattle, this habitat is strongly influenced by grazing pressure and elevated nutrient levels, which shape its vegetation. The plant species found here are predominantly adapted to periodic inundation and trampling, with many belonging to the Poaceae family. However, this ecological balance comes with trade-offs. R36 has a relatively low naturalness score, a scarcity of flowering plants and, consequently, supports a limited diversity of invertebrates [61]. These limitations suggest that while R36 is well suited for sustainable grazing, its overall ecological value, particularly in terms of biodiversity and aesthetic appeal, is relatively low. Other habitats with high potential for sustainable use include R34a and R21. Like R36, they experience strong grazing pressure and frequent disturbances. R34a supports species adapted to high temperatures, increased light and higher salinity, indicating a preference for warm, open and saline conditions. It is affected by disturbance frequency and hosts many competitor species. Additionally, its low moisture and nutrient availability favor drought-tolerant plants. R21, in contrast, harbors species that are not competitors; it exhibits high species evenness, meaning no single species dominates the community. Frequent mowing likewise plays a key role in shaping its plant composition, promoting species that tolerate or benefit from biomass removal. This disturbance may enhance biodiversity by preventing competitive exclusion. Despite their ecological differences, all three habitats—R36, R34a and R21—have high potential for sustainable use. However, their long-term viability for grazing or other agricultural purposes depends on the careful management of their unique environmental conditions to maintain ecological health and resilience.
Using the newly established index for sustainable use assessment of grassland habitats in North Serbia, we have provided an understanding of the role of plant species within grassland ecosystems and the possibilities for their sustainable use. With this index (ES), we have identified critical knowledge gaps. An index (ES) designed in this way can be adaptable for use with other ecosystems beyond grasslands in the future.
One of the main motivations for adopting a plant-based perspective is the recognition that many current sustainable land use assessments disproportionately emphasize agricultural land, often overlooking the specific ecological roles and significance of individual plant species within ecosystems [62,63]. These assessments typically consider biodiversity in broad terms, paying limited attention to the composition and functional dynamics of complex plant communities. When individual species are considered, the focus is often on their economic utility, such as medicinal [64] or edible plants [63], and the impact that ecosystem health has on their yields rather than their ecological importance. Even studies that integrate biodiversity with economic value tend to emphasize the current known uses of plants, neglecting their unexplored ecological and economic potential [65]. Moreover, comparative assessments often center on broad habitat types, such as forests versus meadows, without delving into the species-level complexity within those systems [66].
We argue that this perspective arises from the urgency with which sustainable use is being promoted across all human-managed ecosystems. In many cases, the focus has been on documenting the damage caused by current unsustainable practices on biodiversity as a whole, rather than examining the nuanced ecological functions of specific species or communities. While we fully support the promotion of sustainable use, we also recognize that its universal implementation will require time.
As a practical interim step, we advocate for prioritizing ecosystems that demonstrate strong potential for early adoption, both because of their current economic value and their unrealized ecological and economic potential, which may be irreversibly lost if existing land use practices persist. Furthermore, we contend that by demonstrating how economic benefits can be sustainably derived from these ecosystems in the short term, we can help reassure policymakers that the expected reductions in productivity and revenue, often associated with the adoption of sustainable practices, may be less severe than commonly feared.
Considering the limitations of the developed index for assessing the sustainable use of grassland habitats in northern Serbia, its current economic resolution should be interpreted with caution. The economic benefits could potentially be evaluated more accurately with the inclusion of additional data—such as realistic market prices for all potential uses of plant species or their ecosystem services—which would provide a more solid foundation for such assumptions.
However, due to the limited availability of such data in Serbia, particularly in relation to key economic indicators, it is not yet possible to perform a more detailed and reliable economic assessment of the sustainable use potential of the habitats analyzed.
This data gap represents the primary constraint on the current resolution and scope of the proposed index model.

5. Conclusions

Our index provides a robust framework for assessing the sustainable use potential of mesic grasslands and identifying key habitats. By integrating economic significance and species protection status, it offers a balanced approach to sustainable grassland ecosystem management. The index represents a notable advancement in quantifying and optimizing the sustainable use of grassland ecosystems. It translates complex ecological data into practical recommendations, enabling stakeholders to balance economic activities such as grazing and sustainable grassland management, with the imperative to conserve biodiversity and ecosystem functions.
Our analysis confirms that grasslands in Vojvodina are vital both as natural resources with economic potential and for biodiversity conservation. Additionally, it enhances our understanding of grassland ecosystem services and the sustainable use of (secondary) phytocoenosis. Pastures belonging to habitat R36 show the greatest potential for sustainable use in Vojvodina, taking into account their locations on floodplains or on soils that are moist to wet and mesotrophic to eutrophic. Moreover, these areas are typically flooded during winter and spring, indicating the need for more focus on wetlands in Vojvodina, not only in terms of conservation efforts but also in monitoring their status regularly.
Ultimately, by bridging scientific research with practical conservation strategies, this framework offers a tool for policymakers, land managers, managing authorities of protected areas and local communities, especially those close to the flooded areas in Vojvodina. It offers an evidence-based, practical approach to guiding decision-making, ensuring that economic development and grassland biodiversity conservation go hand in hand while promoting ecologically sound and economically viable strategies that encourage broader acceptance and implementation at local and regional levels. As a result, the framework supports the dual goals of preserving ecological integrity while fostering sustainable grassland management.

Author Contributions

Conceptualization, S.P. and M.Ć.; methodology, S.P., M.Ć. and A.Č.; software, M.Ć.; validation, S.P. and M.Ć.; formal analysis, S.P. and M.Ć.; investigation, S.P., M.Ć. and N.D.; resources, S.P., M.Ć., N.D., A.Č. and Ž.Š.; data curation, S.P. and M.Ć.; writing—original draft preparation, S.P. and M.Ć.; writing—review and editing, S.P., M.Ć., N.D., A.Č. and Ž.Š.; visualization, S.P. and N.D.; supervision, M.Ć., A.Č. and Ž.Š.; funding acquisition, S.P. All authors have read and agreed to the published version of the manuscript.

Funding

This research received no external funding.

Data Availability Statement

The original contributions presented in this study are included in the article. Further inquiries can be directed to the corresponding authors.

Conflicts of Interest

The authors declare no conflicts of interest.

References

  1. Rodwell, J.S.; Morgan, V.; Jefferson, R.G.; Moss, D. The European Context of British Lowland Grasslands; Report-Joint Nature Conservation Committee; Communications, JNCC: Peterborough, UK, 2007; p. 394. [Google Scholar]
  2. Hájková, P.; Hájek, M.; Blažková, D.; Kučera, T.; Chytrý, M.; Řezničková, M.; Šumberová, K.; Černý, T.; Novák, J.; Láníková, D. Louky a mezofilni pastviny (Meadows and mesophilous pastures) (Molinio-Arrhenatheretea). In Vegetace Česke Republiky, 1. Travinná a Keříčková Vegetace. 2. Vyd.; Chytrý, M., Ed.; Academia: Prague, Czech Republic, 2010; pp. 165–278. [Google Scholar]
  3. Foucault, B.D.; Catteau, E. Contribution au prodrome des végétations de France (Contribution to the Prodromus of Vegetation in France): Les Agrostietea stoloniferae Oberd. 1983. Le J. De Bot. 2012, 59, 5–131. [Google Scholar]
  4. Mucina, L.; Bültmann, H.; Dierßen, K.; Theurillat, J.P.; Raus, T.; Čarni, A.; Šumberová, K.; Willner, W.; Dengler, J.; García, R.G.; et al. Vegetation of Europe: Hierarchical floristic classification system of vascular plant, bryophyte, lichen, and algal communities. Appl. Veg. Sci. 2016, 19, 3–264. [Google Scholar] [CrossRef]
  5. Škvorc, Ž.; Ćuk, M.; Zelnik, I.; Franjić, J.; Igić, R.; Ilić, M.; Krstonošić, D.; Vukov, D.; Čarni, A. Diversity of wet and mesic grasslands along a climatic gradient on the southern margin of the Pannonian Basin. Appl. Veg. Sci. 2020, 23, 676–697. [Google Scholar] [CrossRef]
  6. Šilc, U.; Aćić, S.; Škvorc, Ž.; Krstonošić, D.; Franjić, J.; Dajić Stevanović, Z. Grassland vegetation of the Molinio-A rrhenatheretea class in the NW Balkan Peninsula. Appl. Veg. Sci. 2014, 17, 591–603. [Google Scholar] [CrossRef]
  7. Lakušic, R. Vegetation of grasslands and pastures at the Bjelasica Mt. God. Biol. Inst. Sarajevu 1966, 19, 25–186. [Google Scholar]
  8. Hobohm, C.; Bruchmann, I. Endemische Gefäßpflanzen und ihre Habitate in Europa–Plädoyer für den Schutz der Grasland-Ökosysteme (Endemic Vascular Plants and Their Habitats in Europe—A Plea for the Protection of Grassland Ecosystems). Berichte Reinhold-Tüxen-Ges. 2009, 21, 142–161. [Google Scholar]
  9. Aćić, S.B. Sinekološka i Fitocenološka Studija Livadske Vegetacije Srbije (Synecological and Phytosociological Study of Grassland Vegetation in Serbia). Ph.D. Thesis, University of Belgrade, Belgrade, Serbia, 2018. [Google Scholar]
  10. Republički Zavod za Statistiku Repubilke Srbije (Statistical Office of the Republic of Serbia). Available online: https://www.stat.gov.rs/en-US/vesti/20240521-popispoljoprivrede2023/?a=0&s=1701 (accessed on 7 March 2025).
  11. Janssen, J.A.; Rodwell, J.S.; García Criado, M.; Gubbay, S.; Haynes, T.; Nieto, A.; Sanders, N.; Landucci, F.; Loidi, J.; Ssymank, A.; et al. European Red List of Habitats Part 2. Terrestrial and Freshwater Habitats 2016; European Union: Luxemburg, 2016; pp. 1–44. [Google Scholar]
  12. Myklestad, Å.; Sætersdal, M. The importance of traditional meadow management techniques for conservation of vascular plant species richness in Norway. Biol. Conserv. 2004, 118, 133–139. [Google Scholar] [CrossRef]
  13. Ruprecht, E.; Enyedi, M.Z.; Eckstein, R.L.; Donath, T.W. Restorative removal of plant litter and vegetation 40 years after abandonment enhances re-emergence of steppe grassland vegetation. Biol. Conserv. 2010, 143, 449–456. [Google Scholar] [CrossRef]
  14. Elliott, J.; Tindale, S.; Outhwaite, S.; Nicholson, F.; Newell-Price, P.; Sari, N.H.; Hunter, E.; Sánchez-Zamora, P.; Jin, S.; Gallardo-Cobos, R.; et al. European permanent grasslands: A systematic review of economic drivers of change, including a detailed analysis of the Czech republic, Spain, Sweden, and UK. Land 2024, 13, 116. [Google Scholar] [CrossRef]
  15. Geraldine, A.N.G. Biodiversity: Finance and the Economic and Business Case for Action; OECD Publishing: Paris, France, 2019. [Google Scholar] [CrossRef]
  16. Lazarević, D.; Stošić, M.; Dajić, Z.; Terzić, D.; Cvetković, M. Productivity and quality of plant mass of meadow ASS: Danthonietum calycinae depending on the fertilization and utilization time. Biotechnol. Anim. Husb. 2009, 25, 133–142. [Google Scholar] [CrossRef]
  17. Životic, L.; Vukovic-Vimic, A.; Soil Degradation and Climate Change in Serbia. Serbia. 2022. Available online: https://www.undp.org/serbia/publications/soil-degradation-and-climate-change-serbi (accessed on 23 March 2025).
  18. Kojić, M.; Mrfat-Vukelić, S.; Vrbničanin, S.; Dajić, Z.; Stojanović, S. Korova Livada i Pašnjaka Srbije; Institut za poljoprivredna istraživanja ‘Srbija’: Belgrade, Serbia, 2001. [Google Scholar]
  19. Šoštarić-Pisačić, K.; Kovačević, J. Grassland Flora and its Agricultural Value; Znanje: Zagreb, Croatia, 1968. [Google Scholar]
  20. Daily, G.C. Introduction: What are Ecosystem Services. Nature’s Services: Societal Dependence on Natural Ecosystems; Yale University Press: London, UK, 1997; Volume 1, pp. 454–464. [Google Scholar]
  21. Lee, H.; Lautenbach, S. A quantitative review of relationships between ecosystem services. Ecol. Indic. 2016, 66, 340–351. [Google Scholar] [CrossRef]
  22. Zhao, Y.; Liu, Z.; Wu, J. Grassland ecosystem services: A systematic review of research advances and future directions. Landsc. Ecol. 2020, 35, 793–814. [Google Scholar] [CrossRef]
  23. Hönigová, I.; Vačkář, D.; Lorencová, E.; Melichar, J.; Götzl, M.; Sonderegger, G.; Oušková, V.; Hošek, M.; Chobot, K. Survey on Grassland Ecosystem Services; Report to the EEA–European topic centre on biological diversity; Nature Conservation Agency of the Czech Republic: Prague, Czech Republic, 2012; p. 78.
  24. Liu, J.; Wu, J.; Liu, F.; Han, X. Quantitative assessment of bioenergy from crop stalk resources in Inner Mongolia, China. Appl. Energy 2012, 93, 305–318. [Google Scholar] [CrossRef]
  25. Lian, Z.; Xu, W.; Yang, W.; Blank, D.; Huang, Y. Effects of livestock grazing on soil seed bank: A review. Pratacult. Sci. 2014, 31, 2301–2307. [Google Scholar]
  26. Enri, S.R.; Probo, M.; Farruggia, A.; Lanore, L.; Blanchetete, A.; Dumont, B. A biodiversity-friendly rotational grazing system enhancing flower-visiting insect assemblages while maintaining animal and grassland productivity. Agric. Ecosyst. Environ. 2017, 241, 1–10. [Google Scholar] [CrossRef]
  27. Wen, L.; Dong, S.; Li, Y.; Li, X.; Shi, J.; Wang, Y.; Liu, D.; Ma, Y. Effect of degradation intensity on grassland ecosystem services in the alpine region of Qinghai-Tibetan Plateau, China. PLoS ONE 2013, 8, e58432. [Google Scholar] [CrossRef]
  28. MEA. Ecosystems and Human Well-Being: Current State and Trends; Millennium Ecosystem Assessment, Global Assessment Reports; Island Press: Washington, DC, USA, 2005.
  29. Lavorel, S.; Grigulis, K.; Leitinger, G.; Kohler, M.; Schirpke, U.; Tappeiner, U. Historical trajectories in land use pattern and grassland ecosystem services in two European alpine landscapes. Reg. Environ. Change 2017, 17, 2251–2264. [Google Scholar] [CrossRef]
  30. Yan, Y.; Xu, X.; Xin, X.; Yang, G.; Wang, X.; Yan, R.; Chen, B. Effect of vegetation coverage on aeolian dust accumulation in a semiarid steppe of northern China. Catena 2011, 87, 351–356. [Google Scholar] [CrossRef]
  31. Pogue, S.J.; Kröbel, R.; Janzen, H.H.; Beauchemin, K.A.; Legesse, G.; de Souza, D.M.; Iravani, M.; Selin, C.; Byrne, J.; McAllister, T.A. Beef production and ecosystem services in Canada’s prairie provinces: A review. Agric. Syst. 2018, 166, 152–172. [Google Scholar] [CrossRef]
  32. Sachs, J.D. The Age of Sustainable Development; Columbia University press: New York, NY, USA, 2015. [Google Scholar]
  33. Tošić, I.; Hrnjak, I.; Gavrilov, M.B.; Unkašević, M.; Marković, S.B.; Lukić, T. Annual and seasonal variability of precipitation in Vojvodina, Serbia. Theor. Appl. Climatol. 2014, 117, 331–341. [Google Scholar] [CrossRef]
  34. Annual Bulletin for Serbia. Republic Hydrometeorological Service of Serbia. 2023. Available online: https://www.hidmet.gov.rs/data/klimatologija/eng/2023.pdf (accessed on 23 March 2025).
  35. Chytrý, M.; Hennekens, S.M.; Jiménez-Alfaro, B.; Knollová, I.; Dengler, J.; Jansen, F.; Landucci, F.; Schaminée, J.H.J.; Aćić, S.; Agrillo, E.; et al. European Vegetation Archive (EVA): An integrated database of European vegetation plots. Appl. Veg. Sci. 2016, 19, 173–180. [Google Scholar] [CrossRef]
  36. Horvat, I.; Horvatić, S.; Gračanin, M.; Tomažić, G.; Em, H.; Maksić, B. Priručnik za Tipološko Istraživanje i Kartiranje Vegetacije; Nakladni zavod Hrvatske: Zagreb, Croatia, 1950. [Google Scholar]
  37. Hennekens, S.M.; Schaminée, J.H. TURBOVEG, a comprehensive data base management system for vegetation data. J. Veg. Sci. 2001, 12, 589–591. [Google Scholar] [CrossRef]
  38. Tichý, L. JUICE, software for vegetation classification. J. Veg. Sci. 2002, 13, 451–453. [Google Scholar] [CrossRef]
  39. Chytrý, M.; Tichý, L.; Hennekens, S.M.; Knollová, I.; Janssen, J.A.M.; Rodwell, J.S.; Peterka, T.; Marcenò, C.; Landucci, F.; Danihelka, J.; et al. EUNIS Habitat Classification: Expert system, characteristic species combinations and distribution maps of European habitats. Appl Veg Sci. 2020, 23, 648–675. [Google Scholar] [CrossRef]
  40. Council Directive 92/43/EEC of 21 May 1992 on the Conservation of Natural Habitats and of Wild Fauna and Flora (OJ L 206, 22 July 1992, p. 7). Available online: https://eur-lex.europa.eu/eli/dir/1992/43/oj/eng (accessed on 23 March 2025).
  41. Flora Croatica Database Useful Plants. Available online: https://hirc.botanic.hr/fcd/KorisnoBilje/Search.aspx (accessed on 9 March 2025).
  42. Wiersema, J.H.; León, B. World Economic Plants: A Standard Reference, 2nd ed.; CRC Press: Boca Raton, FL, USA, 2013. [Google Scholar]
  43. Official Gazette of RS. Rulebook on Declaration and Protection of Strictly Protected and Protected Wild Species of Plants, Animals and Fungi. No. 5/2010, 47/2011, 32/2016 and 98/2016. Available online: https://www.pravno-informacioni-sistem.rs/SlGlasnikPortal/eli/rep/sgrs/ministarstva/pravilnik/2010/5/3/reg (accessed on 29 March 2025).
  44. IUCN. The IUCN Red List of Threatened Species. Version 2024-2. Available online: https://www.iucnredlist.org (accessed on 9 March 2025).
  45. Official Gazette of RS. Regulation on Control of the Use and Trade in Wild Flora and Fauna. No. 31/2005, 45/2005, 22/2007, 38/2008, 9/2009, 69/2011 and 95/2018—State Law. Available online: https://www.pravno-informacioni-sistem.rs/SlGlasnikPortal/eli/rep/sgrs/vlada/uredba/2008/38/1 (accessed on 29 March 2025).
  46. Tichý, L.; Axmanová, I.; Dengler, J.; Guarino, R.; Jansen, F.; Midolo, G.; Nobis, M.P.; Van Meerbeek, K.; Aćić, S.; Attorre, F.; et al. Ellenberg-type indicator values for European vascular plant species. J. Veg. Sci. 2023, 34, e13168. [Google Scholar] [CrossRef]
  47. Sonkoly, J.; Tóth, E.; Balogh, N.; Balogh, L.; Bartha, D.; Csendesné Bata, K.; Bátori, Z.; Békefi, N.; Botta-Dukát, Z.; Bölöni, J.; et al. PADAPT 1.0–the Pannonian dataset of plant traits. Sci. Data 2023, 10, 742. [Google Scholar] [CrossRef]
  48. Pielou, E.C. The measurement of diversity in different types of biological collections. J. Theor. Biol. 1966, 13, 131–144. [Google Scholar] [CrossRef]
  49. Smith, B.; Wilson, J.B. A Consumer’s Guide to Evenness Indices; Oikos, Wiley: Hoboken, NJ, USA, 1996; pp. 70–82. [Google Scholar]
  50. Spellerberg, I.F.; Fedor, P.J. A tribute to Claude Shannon (1916–2001) and a plea for more rigorous use of species richness, species diversity and the ‘Shannon–Wiener’ Index. Glob. Ecol. Biogeogr. 2003, 12, 177–179. [Google Scholar] [CrossRef]
  51. Borhidi, A. Social behaviour types, the naturalness and relative ecological indicator values of the higher plants in the Hungarian Flora. Acta Bot. Hung. 1995, 39, 97–181. [Google Scholar]
  52. Midolo, G.; Herben, T.; Axmanová, I.; Marcenò, C.; Pätsch, R.; Bruelheide, H.; Karger, D.N.; Aćić, S.; Bergamini, A.; Bergmeier, E.; et al. Disturbance indicator values for European plants. Glob. Ecol. Biogeogr. 2023, 32, 24–34. [Google Scholar] [CrossRef]
  53. R Core Team. R: A Language and Environment for Statistical Computing; R Foundation for Statistical Computing: Vienna, Austria, 2023; Available online: https://www.R-project.org/ (accessed on 29 March 2025).
  54. Erdős, L.; Bede-Fazekas, Á.; Bátori, Z.; Berg, C.; Kröel-Dulay, G.; Magnes, M.; Sengl, P.; Tölgyesi, C.; Török, P.; Zinnen, J. Species-based indicators to assess habitat degradation: Comparing the conceptual, methodological, and ecological relationships between hemeroby and naturalness values. Ecol. Indic. 2022, 136, 108707. [Google Scholar] [CrossRef]
  55. Kącki, Z.; Michalska-Hejduk, D. Assessment of biodiversity in Molinia meadows in Kampinoski National Park based on biocenotic indicators. Pol. J. Environ. Stud. 2010, 19, 351–362. [Google Scholar]
  56. Sousa, W.P. The role of disturbance in natural communities. Annu. Rev. Ecol. Syst. 1984, 15, 353–391. [Google Scholar] [CrossRef]
  57. Korzeniak, J. Species richness and diversity related to anthropogenic soil disturbance in abandoned meadows in the Bieszczady Mts. [Eastern Carpathians]. Acta Soc. Bot. Pol. 2005, 74, 65–71. [Google Scholar] [CrossRef]
  58. Müller, J.; Heinze, J.; Joshi, J.; Boch, S.; Klaus, V.H.; Fischer, M.; Prati, D. Influence of experimental soil disturbances on the diversity of plants in agricultural grasslands. J. Plant Ecol. 2014, 7, 509–517. [Google Scholar] [CrossRef]
  59. Mcintyre, S.; Heard, K.M.; Martin, T.G. The relative importance of cattle grazing in subtropical grasslands: Does it reduce or enhance plant biodiversity? J. Appl. Ecol. 2003, 40, 445–457. [Google Scholar] [CrossRef]
  60. Smith, A.L.; Barrett, R.L.; Milner, R.N. Annual mowing maintains plant diversity in threatened temperate grasslands. Appl. Veg. Sci. 2018, 21, 207–218. [Google Scholar] [CrossRef]
  61. Chytrý, M.; Řezníčková, M.; Novotný, P.; Holubová, D.; Preislerová, Z.; Attorre, F.; Biurrun, I.; Blažek, P.; Bonari, G.; Borovyk, D.; et al. FloraVeg.EU—An online database of European vegetation, habitats and flora. Appl. Veg. Sci. 2024, 27, e12798. [Google Scholar] [CrossRef]
  62. Nziguheba, G.; Adewopo, J.; Masso, C.; Nabahungu, N.L.; Six, J.; Sseguya, H.; Taulya, G.; Vanlauwe, B. Assessment of sustainable land use: Linking land management practices to sustainable land use indicators. Int. J. Agric. Sustain. 2022, 20, 265–288. [Google Scholar] [CrossRef]
  63. Ulian, T.; Diazgranados, M.; Pironon, S.; Padulosi, S.; Liu, U.; Davies, L.; Howes, M.J.R.; Borrell, J.S.; Ondo, I.; Pérez-Escobar, O.A.; et al. Unlocking plant resources to support food security and promote sustainable agriculture. Plants People Planet 2020, 2, 421–445. [Google Scholar] [CrossRef]
  64. Chen, S.L.; Yu, H.; Luo, H.M.; Wu, Q.; Li, C.F.; Steinmetz, A. Conservation and sustainable use of medicinal plants: Problems, progress, and prospects. Chin. Med. 2016, 11, 1–10. [Google Scholar] [CrossRef] [PubMed]
  65. Liu, H.; Hou, L.; Kang, N.; Nan, Z.; Huang, J. The economic value of grassland ecosystem services: A global meta-analysis. Grassl. Res. 2022, 1, 63–74. [Google Scholar] [CrossRef]
  66. Fontana, V.; Radtke, A.; Fedrigotti, V.B.; Tappeiner, U.; Tasser, E.; Zerbe, S.; Buchholz, T. Comparing land-use alternatives: Using the ecosystem services concept to define a multi-criteria decision analysis. Ecol. Econ. 2013, 93, 128–136. [Google Scholar] [CrossRef]
Figure 1. Map of the research area. (a) A map of Europe with the territory of Serbia highlighted, (b) the province of Vojvodina highlighted within the territory of Serbia and (c) a satellite image of the province of Vojvodina.
Land 14 01082 g001
Figure 2. Flowchart outlining the methodology used in this study. This illustrates how the dataset is cleaned, edited and classified into eight alliances and seven habitats, as well as how the information on plant species recorded in the plots was categorized and assessed for its economic and environmental significance.
Land 14 01082 g002
Figure 3. Flowchart illustrating how the dataset was cleaned and classified into eight alliances and further into seven habitats.
Land 14 01082 g003
Figure 4. Light (A), moisture (B) and nutrient (C) values for all analyzed habitat types. Black horizontal lines indicate the median, while the boxes range from the first quartile (Q1) to the third quartile (Q3). Whiskers extend to 1.5 × IQR (interquartile range) from the edge of the boxes. Black dots represent observations outside this range, and the red × denotes the mean. Groups that do not share a common letter are statistically significantly different (p < 0.05).
Land 14 01082 g004
Figure 5. Pielou Evenness values for all analyzed habitat types. Black horizontal lines indicate the median, while the boxes range from the first quartile (Q1) to the third quartile (Q3). Whiskers extend to 1.5 × IQR (interquartile range) from the edge of the boxes. Black dots represent observations outside this range, and the red × denotes the mean. Groups that do not share a common letter are statistically significantly different (p < 0.05).
Land 14 01082 g005
Figure 6. The Shannon–Weiner Species Diversity Index values for all analyzed habitat types. Black horizontal lines indicate the median, while the boxes range from the first quartile (Q1) to the third quartile (Q3). Whiskers extend to 1.5 × IQR (interquartile range) from the edge of the boxes. Black dots represent observations outside this range, and the red × denotes the mean. Groups that do not share a common letter are statistically significantly different (p < 0.05).
Land 14 01082 g006
Figure 7. Disturbance frequency (A), disturbance severity (B), soil disturbance (C), grazing pressure (D), mowing frequency (E) and naturalness (F) values for all analyzed habitat types. Black horizontal lines indicate the median, while the boxes range from the first quartile (Q1) to the third quartile (Q3). Whiskers extend to 1.5 × IQR (interquartile range) from the edge of the boxes. Black dots represent observations outside this range, and the red × denotes the mean. Groups that do not share a common letter are statistically significantly different (p < 0.05).
Land 14 01082 g007
Figure 8. (A) The percentage of species that offer ecosystem services and the percentage of species that do not offer them. (B) The estimated ecosystem services potential of all 636 species analyzed in this study, categorizing the individual economic benefits of each species into four ecosystem service categories. Additionally, this highlights the percentage of economically significant species providing each type of service while acknowledging that many species contribute to multiple services simultaneously.
Land 14 01082 g008
Figure 9. Index for sustainable use assessment with ES index values for all analyzed habitat types. Black horizontal lines indicate the median, while the boxes range from the first quartile (Q1) to the third quartile (Q3). Whiskers extend to 1.5 × IQR (interquartile range) from the edge of the boxes. Black dots represent observations outside this range, and the red × denotes the mean. Groups that do not share a common letter are statistically significantly different (p < 0.05).
Land 14 01082 g009
Figure 10. Correlation heatmap of Spearman’s correlation coefficient for significant variables according to the model.
Land 14 01082 g010
Table 1. The habitats and alliances that the relevés used in this study were classified into, as well as the relationships between these two systems.
Habitat Type Habitat NameBelonging Alliance/sCharacteristic Species with Economic Potential
R21Mesic permanent pasture of lowlands and mountainsCynosurion cristatiCynosurus cristatus, Bromus racemosus, Ononis spinosa, Plantago lanceolata, Lotus corniculatus, Anthoxanthum odoratum, Trifolium pratense
R22Low- and medium-altitude hay meadowCynosurion cristati;
Salvio nemorosae-Arrhenatherion
Arrhenatherum elatius, Dactylis glomerata, Pastinaca sativa, Knautia arvensis, Securigera varia, Festuca valesiaca, Daucus carota, Trifolium pratense
R34Submediterranean moist meadowTrifolion pallidiMedicago arabica, Alopecurus pratensis, Filipendula vulgaris, Lathyrus pratensis, Rumex crispus, Trifolium hybridum
R34aSubmediterranean moist meadow—salty pasturesTrifolio-Ranunculion pedatiLimonium gmelinii, Trifolium striatum, Trifolium subterraneum, Peucedanum officinale, Matricaria chamomilla
R35Moist or wet mesotrophic to eutrophic hay meadowDeschampsion cespitosaeLysimachia vulgaris, Deschampsia cespitosa, Caltha palustris, Cardamine pratensis, Calystegia sepium, Equisetum palustre, Myosotis scorpioides
R36Moist or wet mesotrophic to eutrophic pastureMentho longifoliae-Juncion inflexi; Potentillion anserinaeBeckmannia eruciformis, Glyceria fluitans, Cirsium vulgare, Agrostis stolonifera, Ranunculus repens, Trifolium fragiferum, Eleocharis palustris
R37Temperate and boreal moist or wet oligotrophic grasslandMolinion caeruleaeMolinia caerulea, Calamagrostis epigejos, Teucrium chamaedrys, Carlina vulgaris, Asclepias syriaca and Odontarrhena tortuosa
Table 2. The mean ES values for each of the seven habitats.
HabitatR21R22R34R34aR35R36R37
ES mean1.0700.8231.0401.0801.0101.1800.820
Table 3. Summary of the index (ES) output, including the estimated coefficient, standard error, t-value and p-value. Statistically significant p-values are highlighted in bold. Intercept is not a variable—it is a constant in the regression model.
VariableEstimateStd. Errort. Valuep. Value
(Intercept)−2.5741.179−2.1840.029
Disturbance_frequency−1.0590.192−5.5134.99 × 10−8
Disturbance_severity−2.5771.053−2.4460.015
Mowing_frequency1.6990.2935.8029.98 × 10−9
Perennial cover ratio of protected species0.0190.00211.9632 × 10−16
Pileou_Evenness0.7050.3142.2440.025
Shannon–Weiner−0.0040.067−0.0520.959
PCR_Chamaephyte−0.040.06−0.7040.482
PCR_Competitor0.0110.0017.6277.99 × 10−14
PCR_Generalists0.0090.0024.3540.00002
PCR_Geophytae−0.0010.002−0.3880.698
PCR_Hemicriptophytae−0.010.002−5.8846.23 × 10−9
PCR_Invasive species0.0120.0130.8780.381
PCR_parasite.hemi.parasite−0.0210.006−3.7050.0002
PCR_Phanerophytae0.0390.0211.8650.063
PCR_Rare.Unique.species0.0060.0031.8680.062
PCR_Specialists−0.00020.003−0.0860.931
PCR_Therophytae−0.0010.003−0.4070.684
Borhidis.naturalness_w−0.1480.044−3.3610.001
Grazing_pressure_w5.8340.8267.0653.95 × 10−12
Light_w0.4130.1163.5710.0004
Moisture_w0.1030.0333.1190.002
Nutrients_w−0.1150.038−3.0460.002
Reaction_w−0.2020.066−3.0690.002
Salinity_w−0.0440.069−0.6370.525
Soil.disturbance_w2.0120.7972.5240.012
Temperature_w0.0270.0550.490.624
Disclaimer/Publisher’s Note: The statements, opinions and data contained in all publications are solely those of the individual author(s) and contributor(s) and not of MDPI and/or the editor(s). MDPI and/or the editor(s) disclaim responsibility for any injury to people or property resulting from any ideas, methods, instructions or products referred to in the content.

