
Does Construction of High-Standard Farmland Improve Total Factor Productivity of Grain? Evidence from China, 2000–2021


Abstract
1. Introduction
2. Theoretical Analysis and Research Hypothesis
2.1. Background on Construction of High-Standard Farmland (CHSF)
2.2. TFP Theory and TFPG
2.3. Research Hypothesis
3. Variable Description and Model Construction
3.1. Variable Description
3.1.1. Outcome Variable
3.1.2. Variable of Interest
3.1.3. Controls
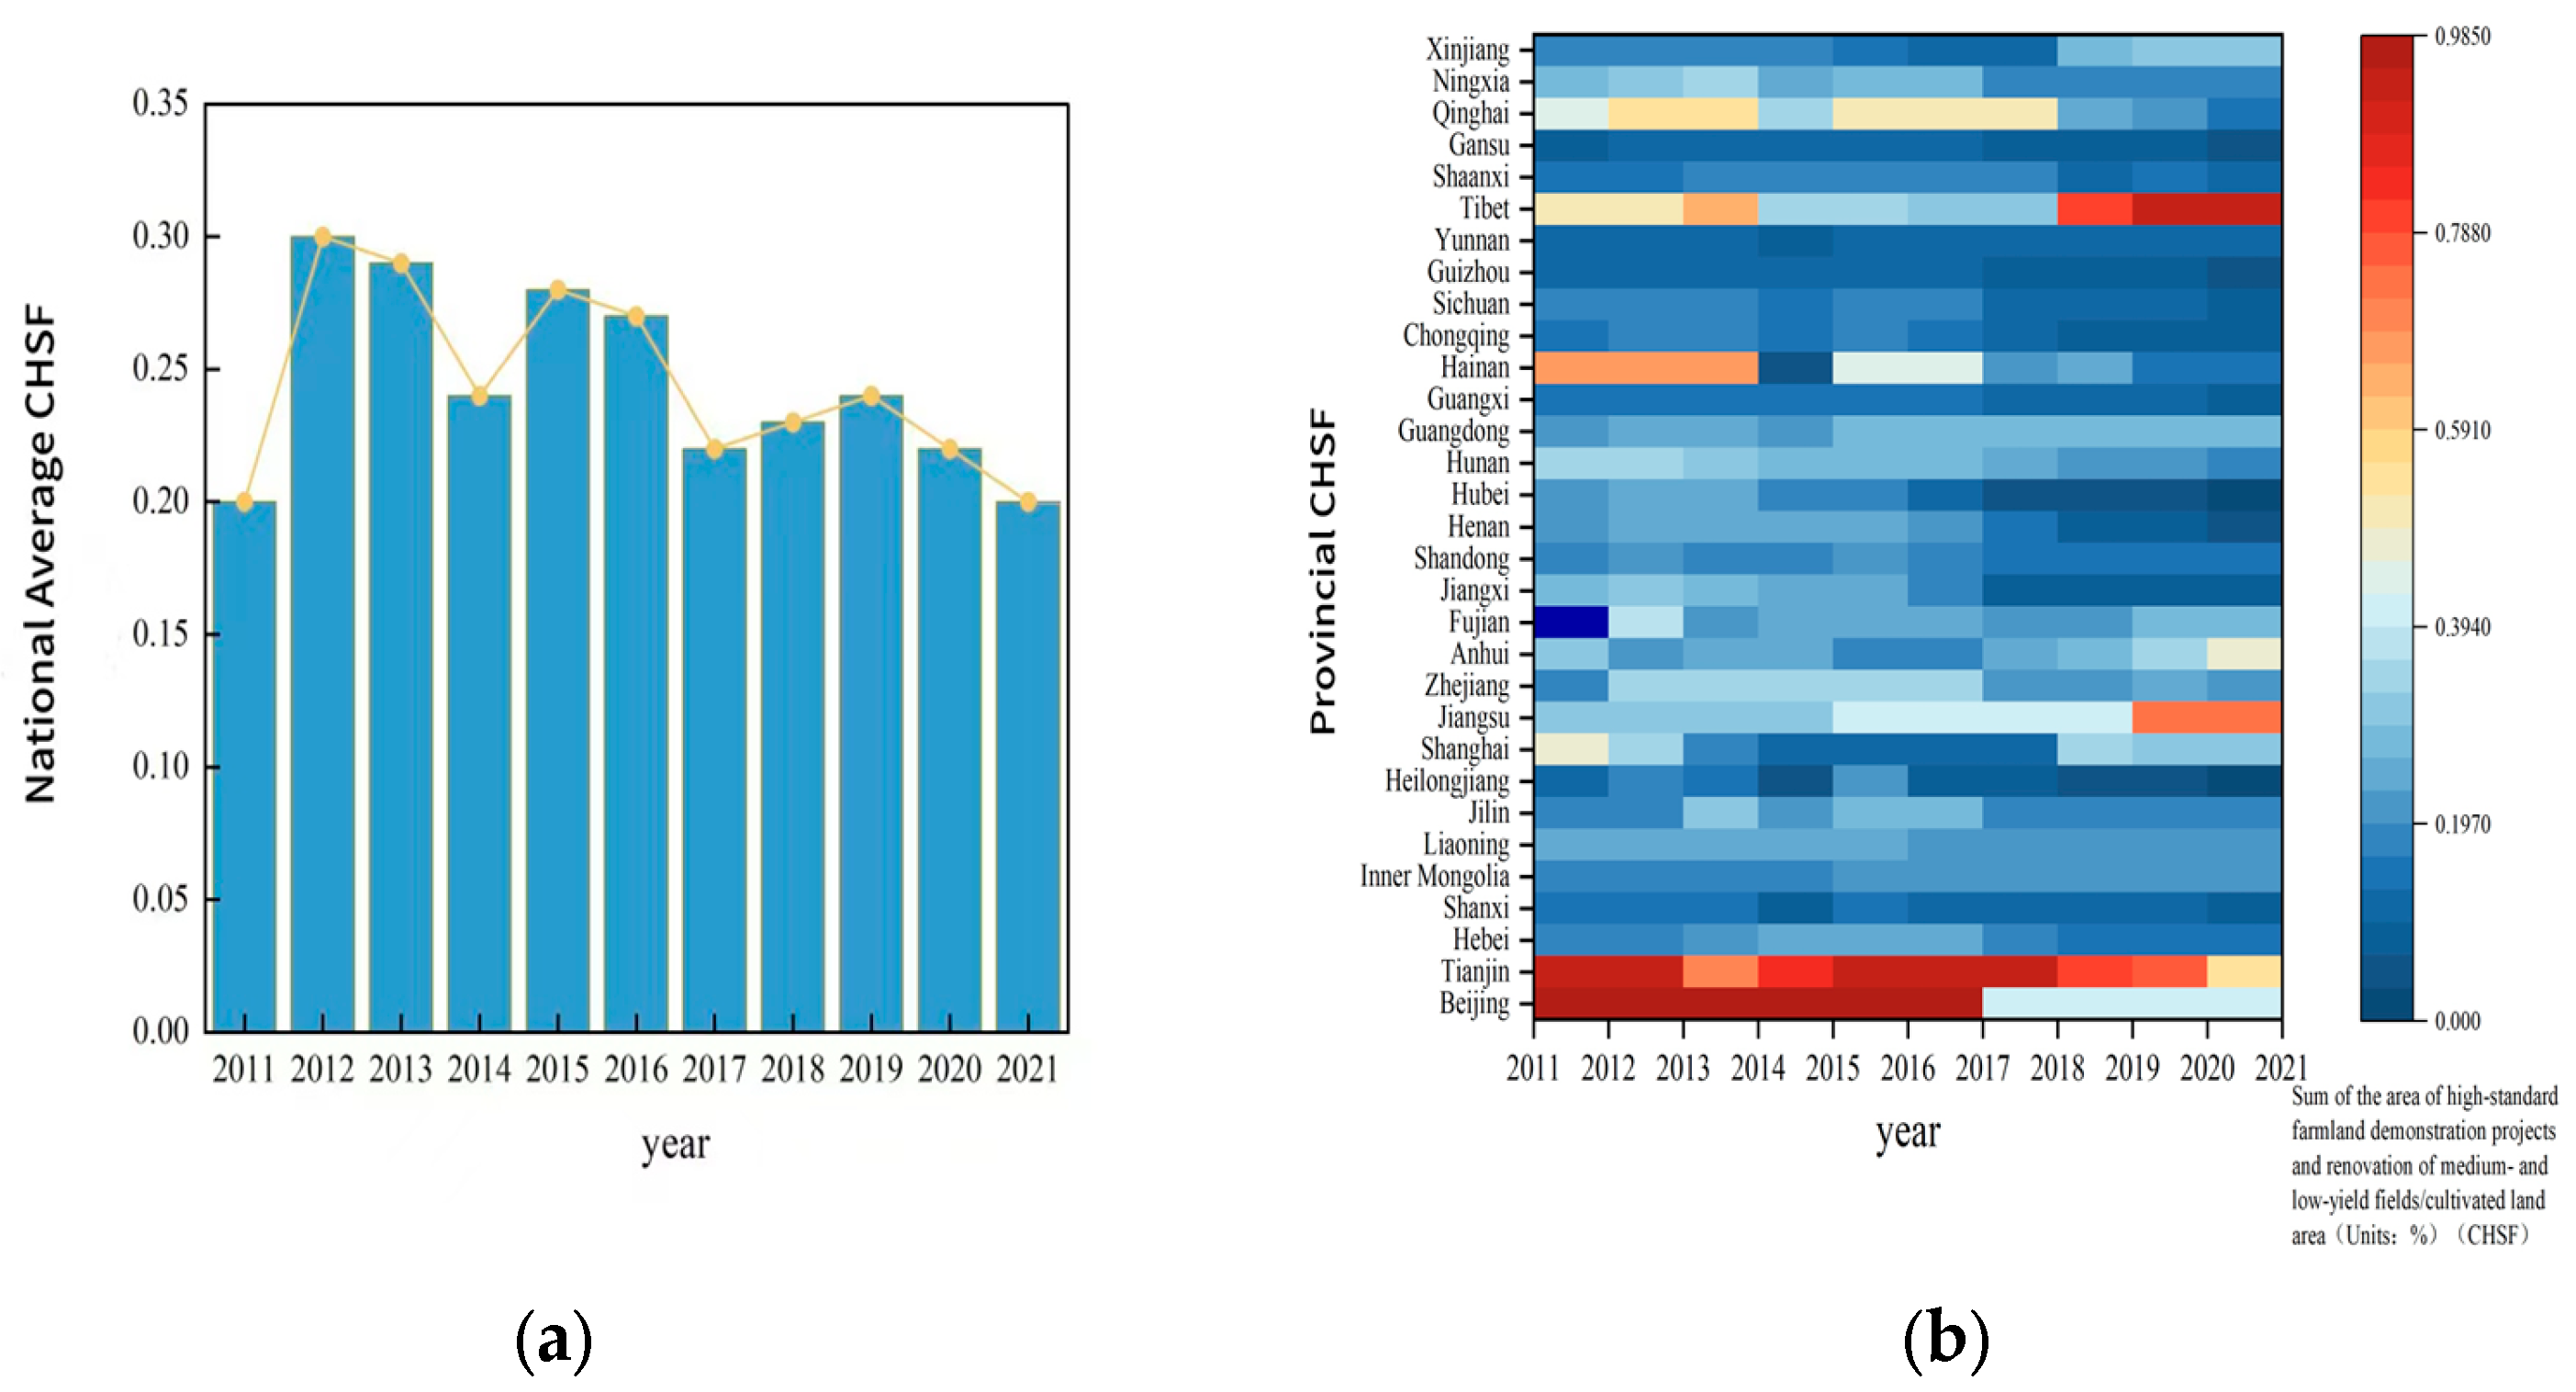
3.1.4. Data Sources and Descriptive Statistics
3.2. Empirical Strategy
3.2.1. Baseline Model
3.2.2. Robustness Test
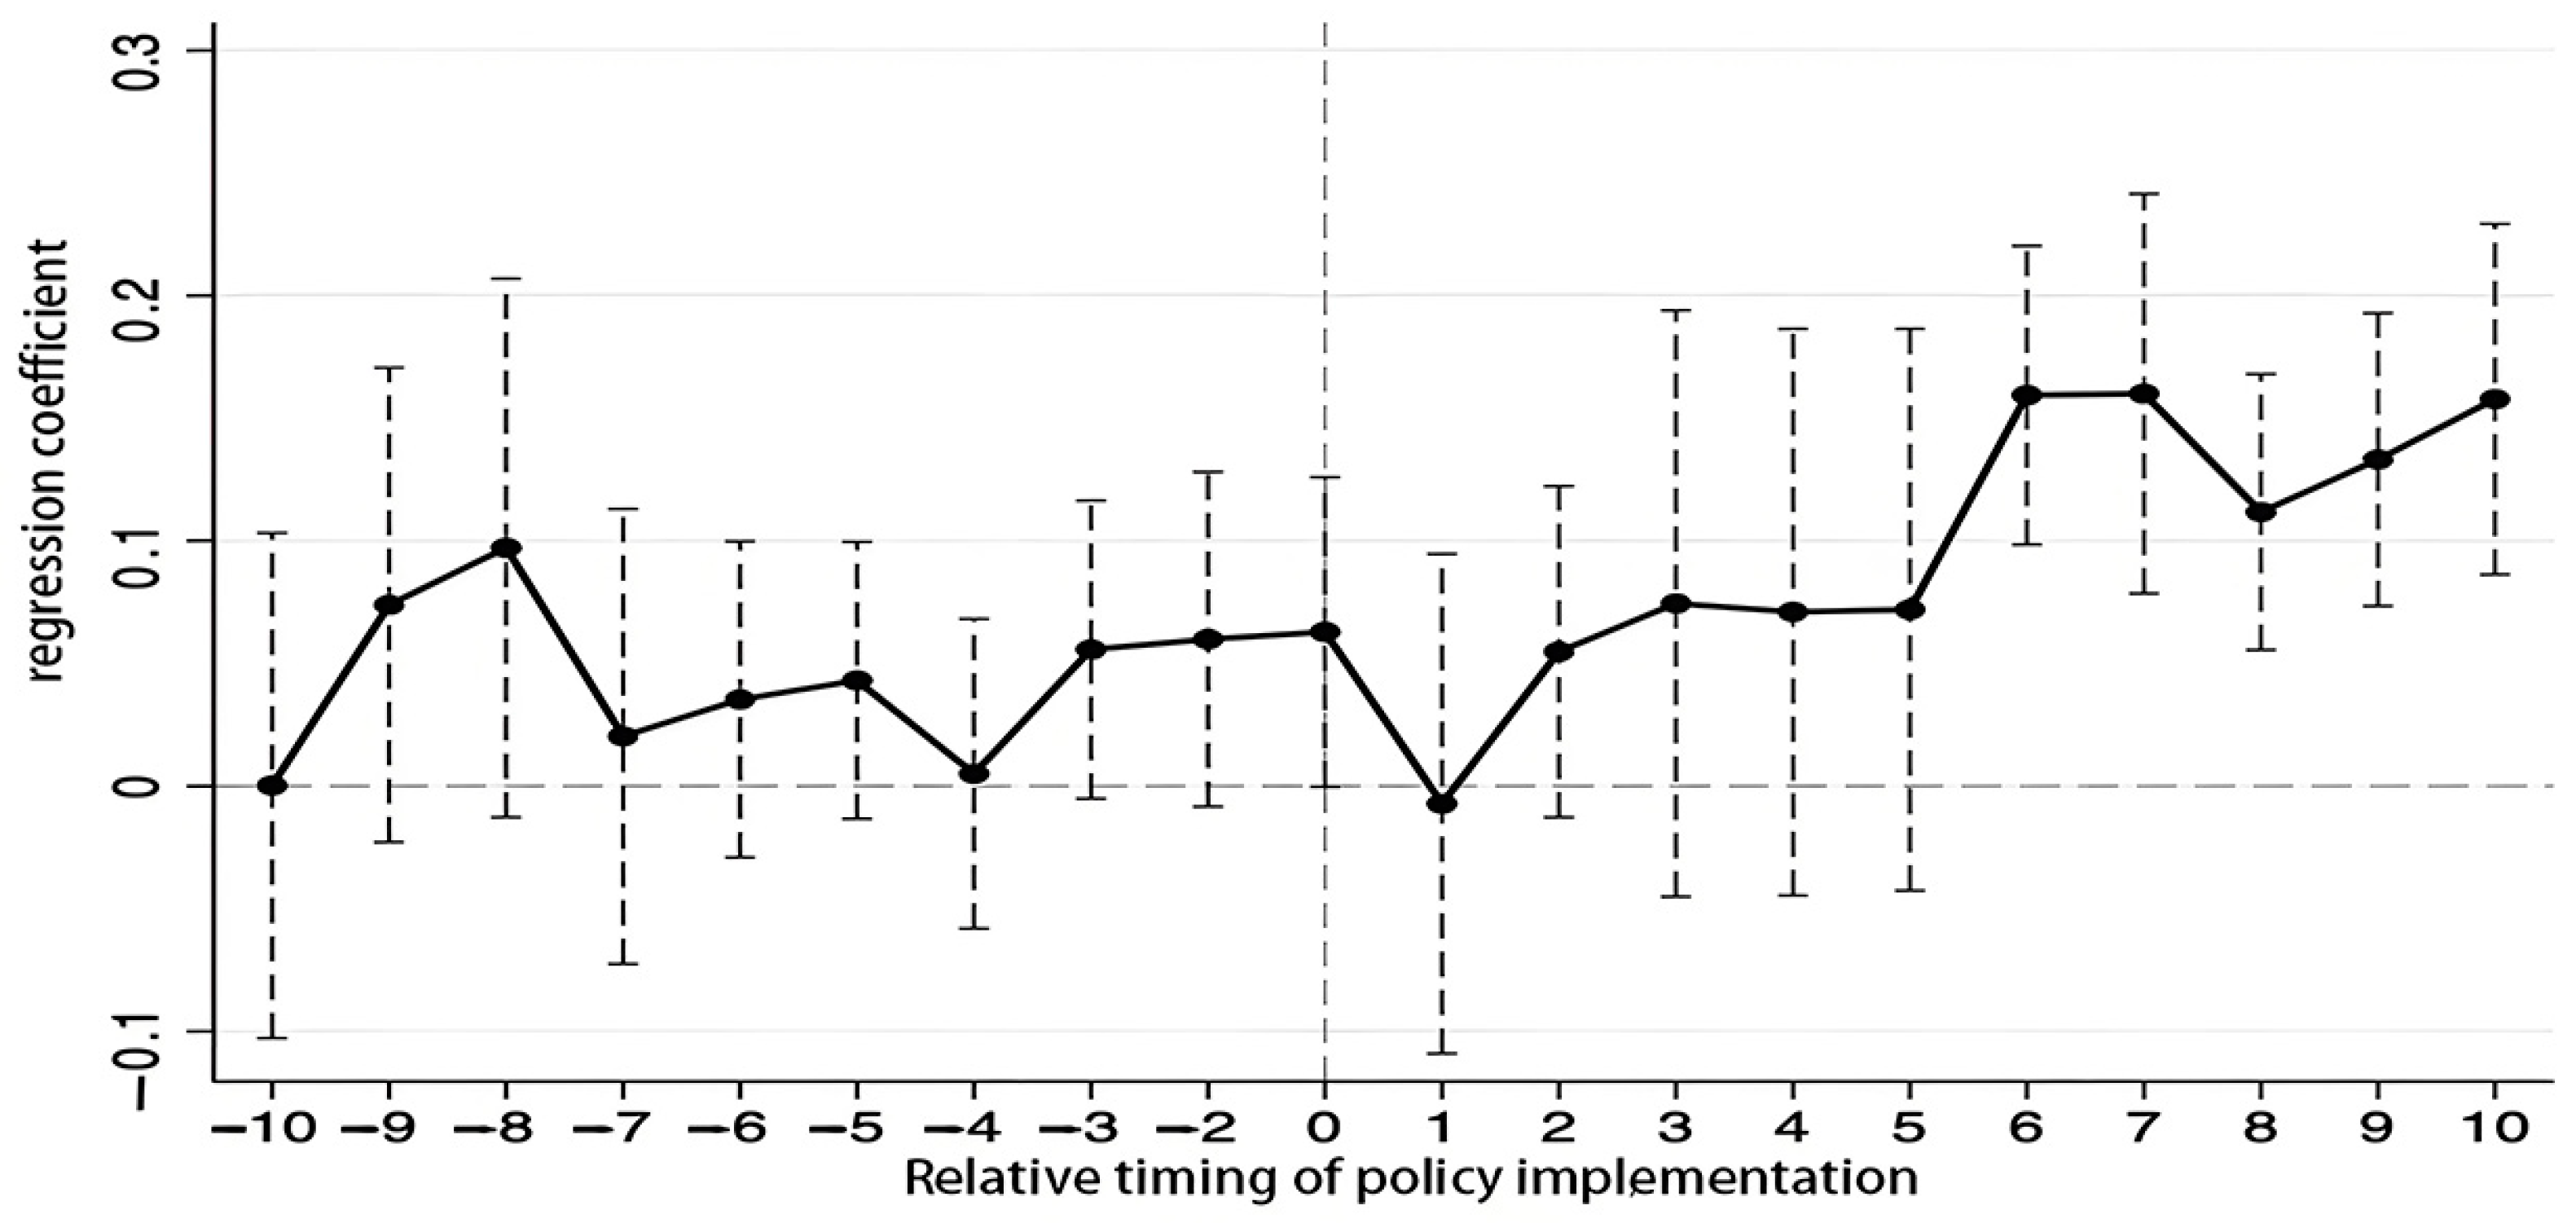
Parallel Trend Test
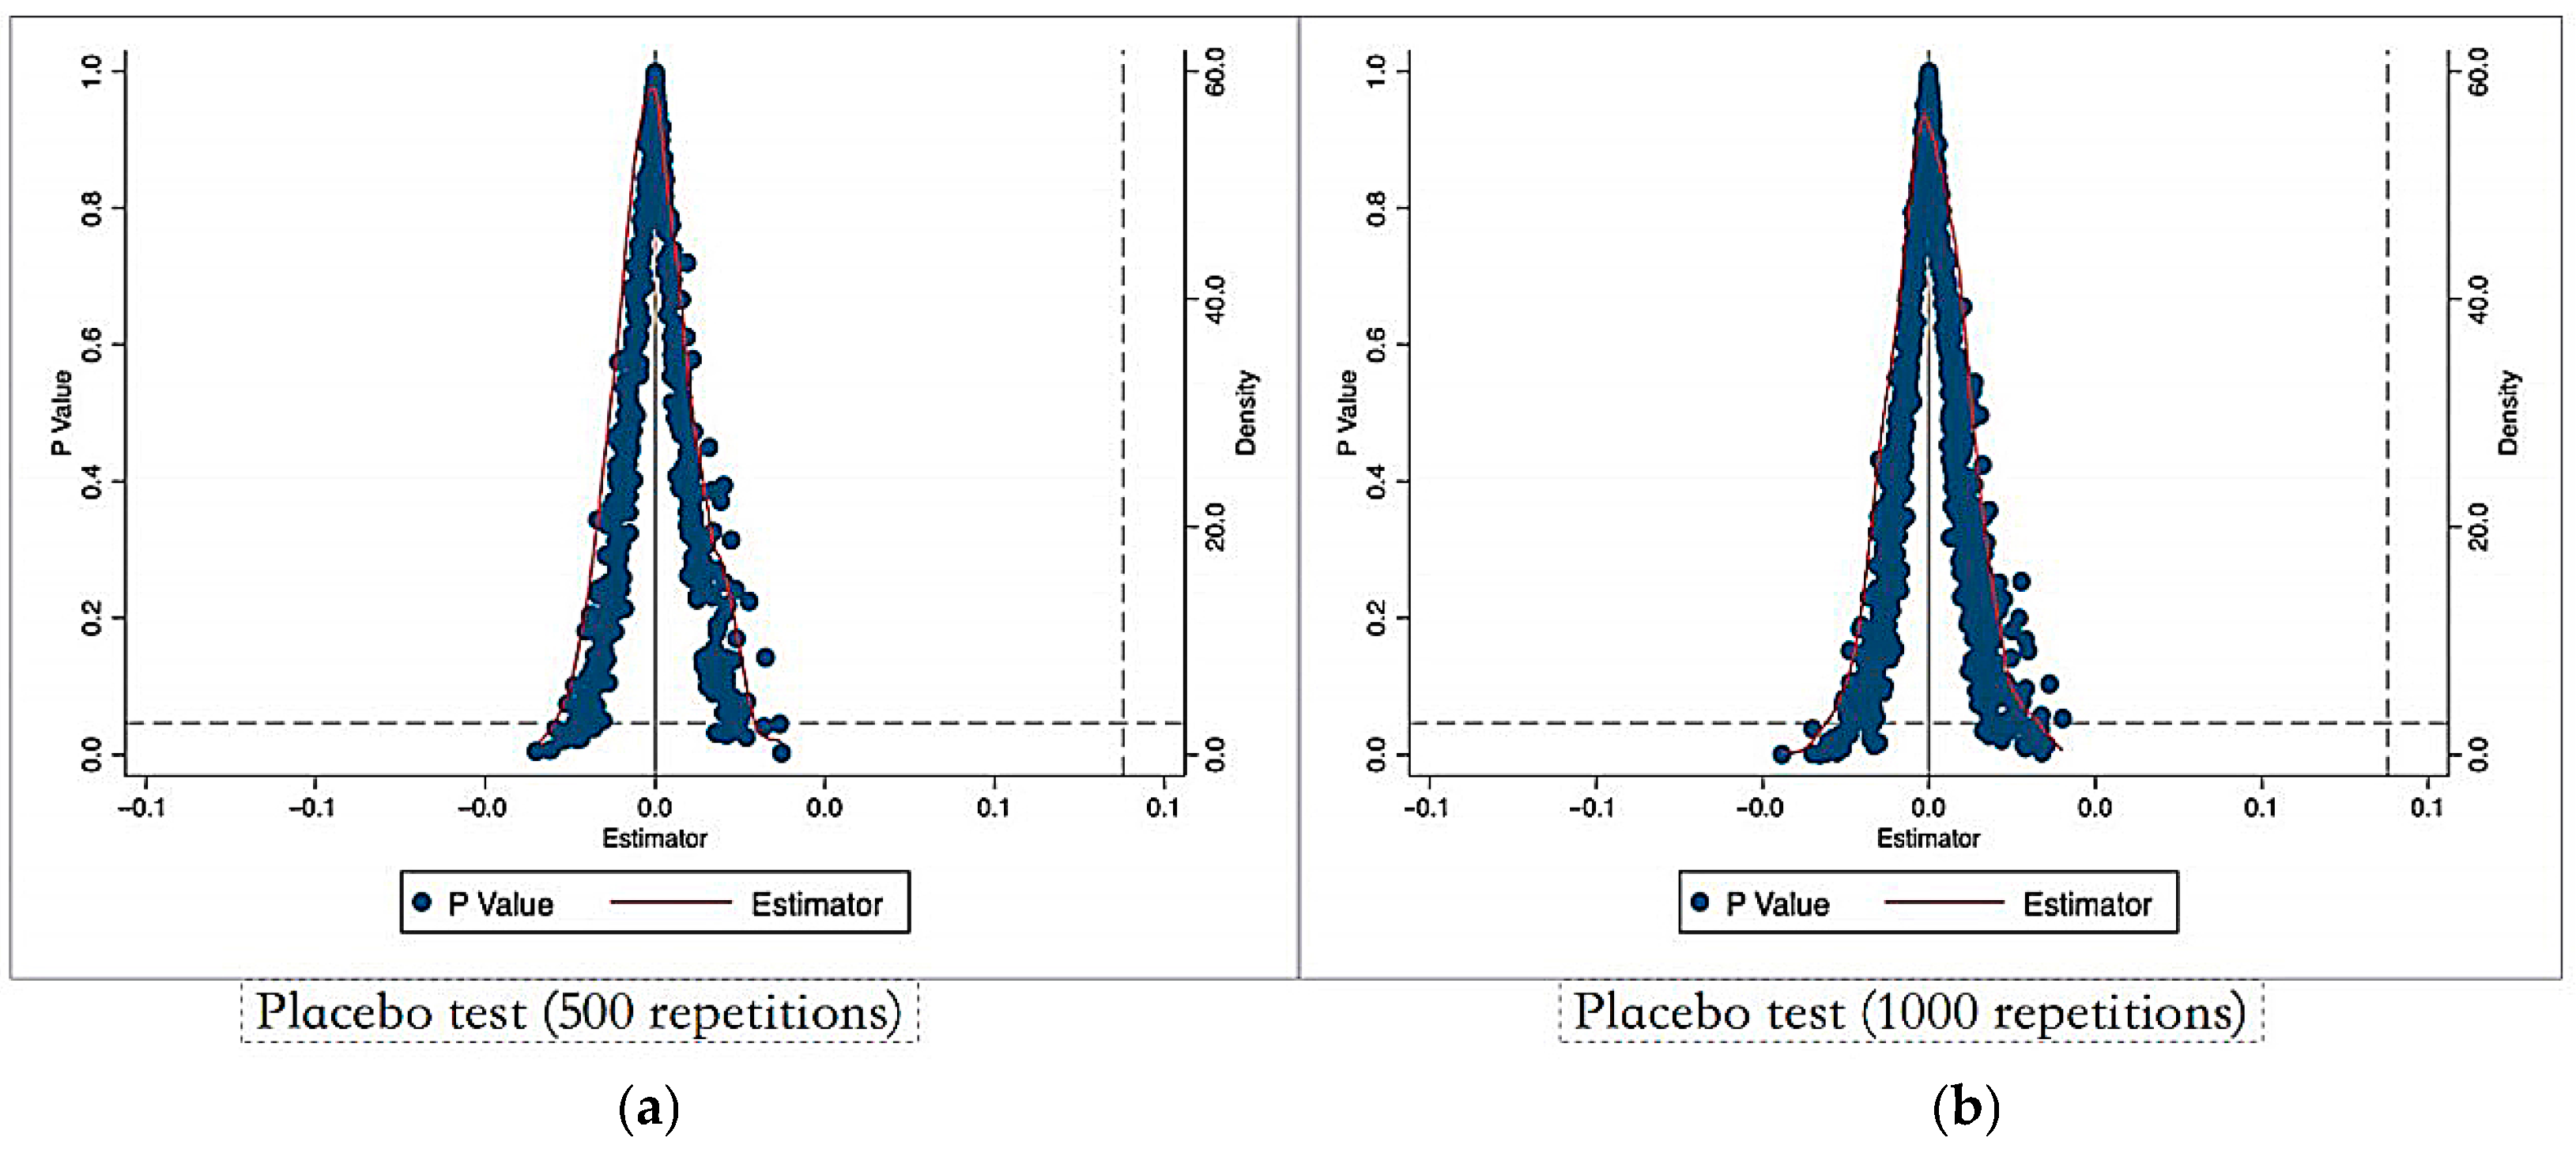
Placebo Test
Other Robustness Tests
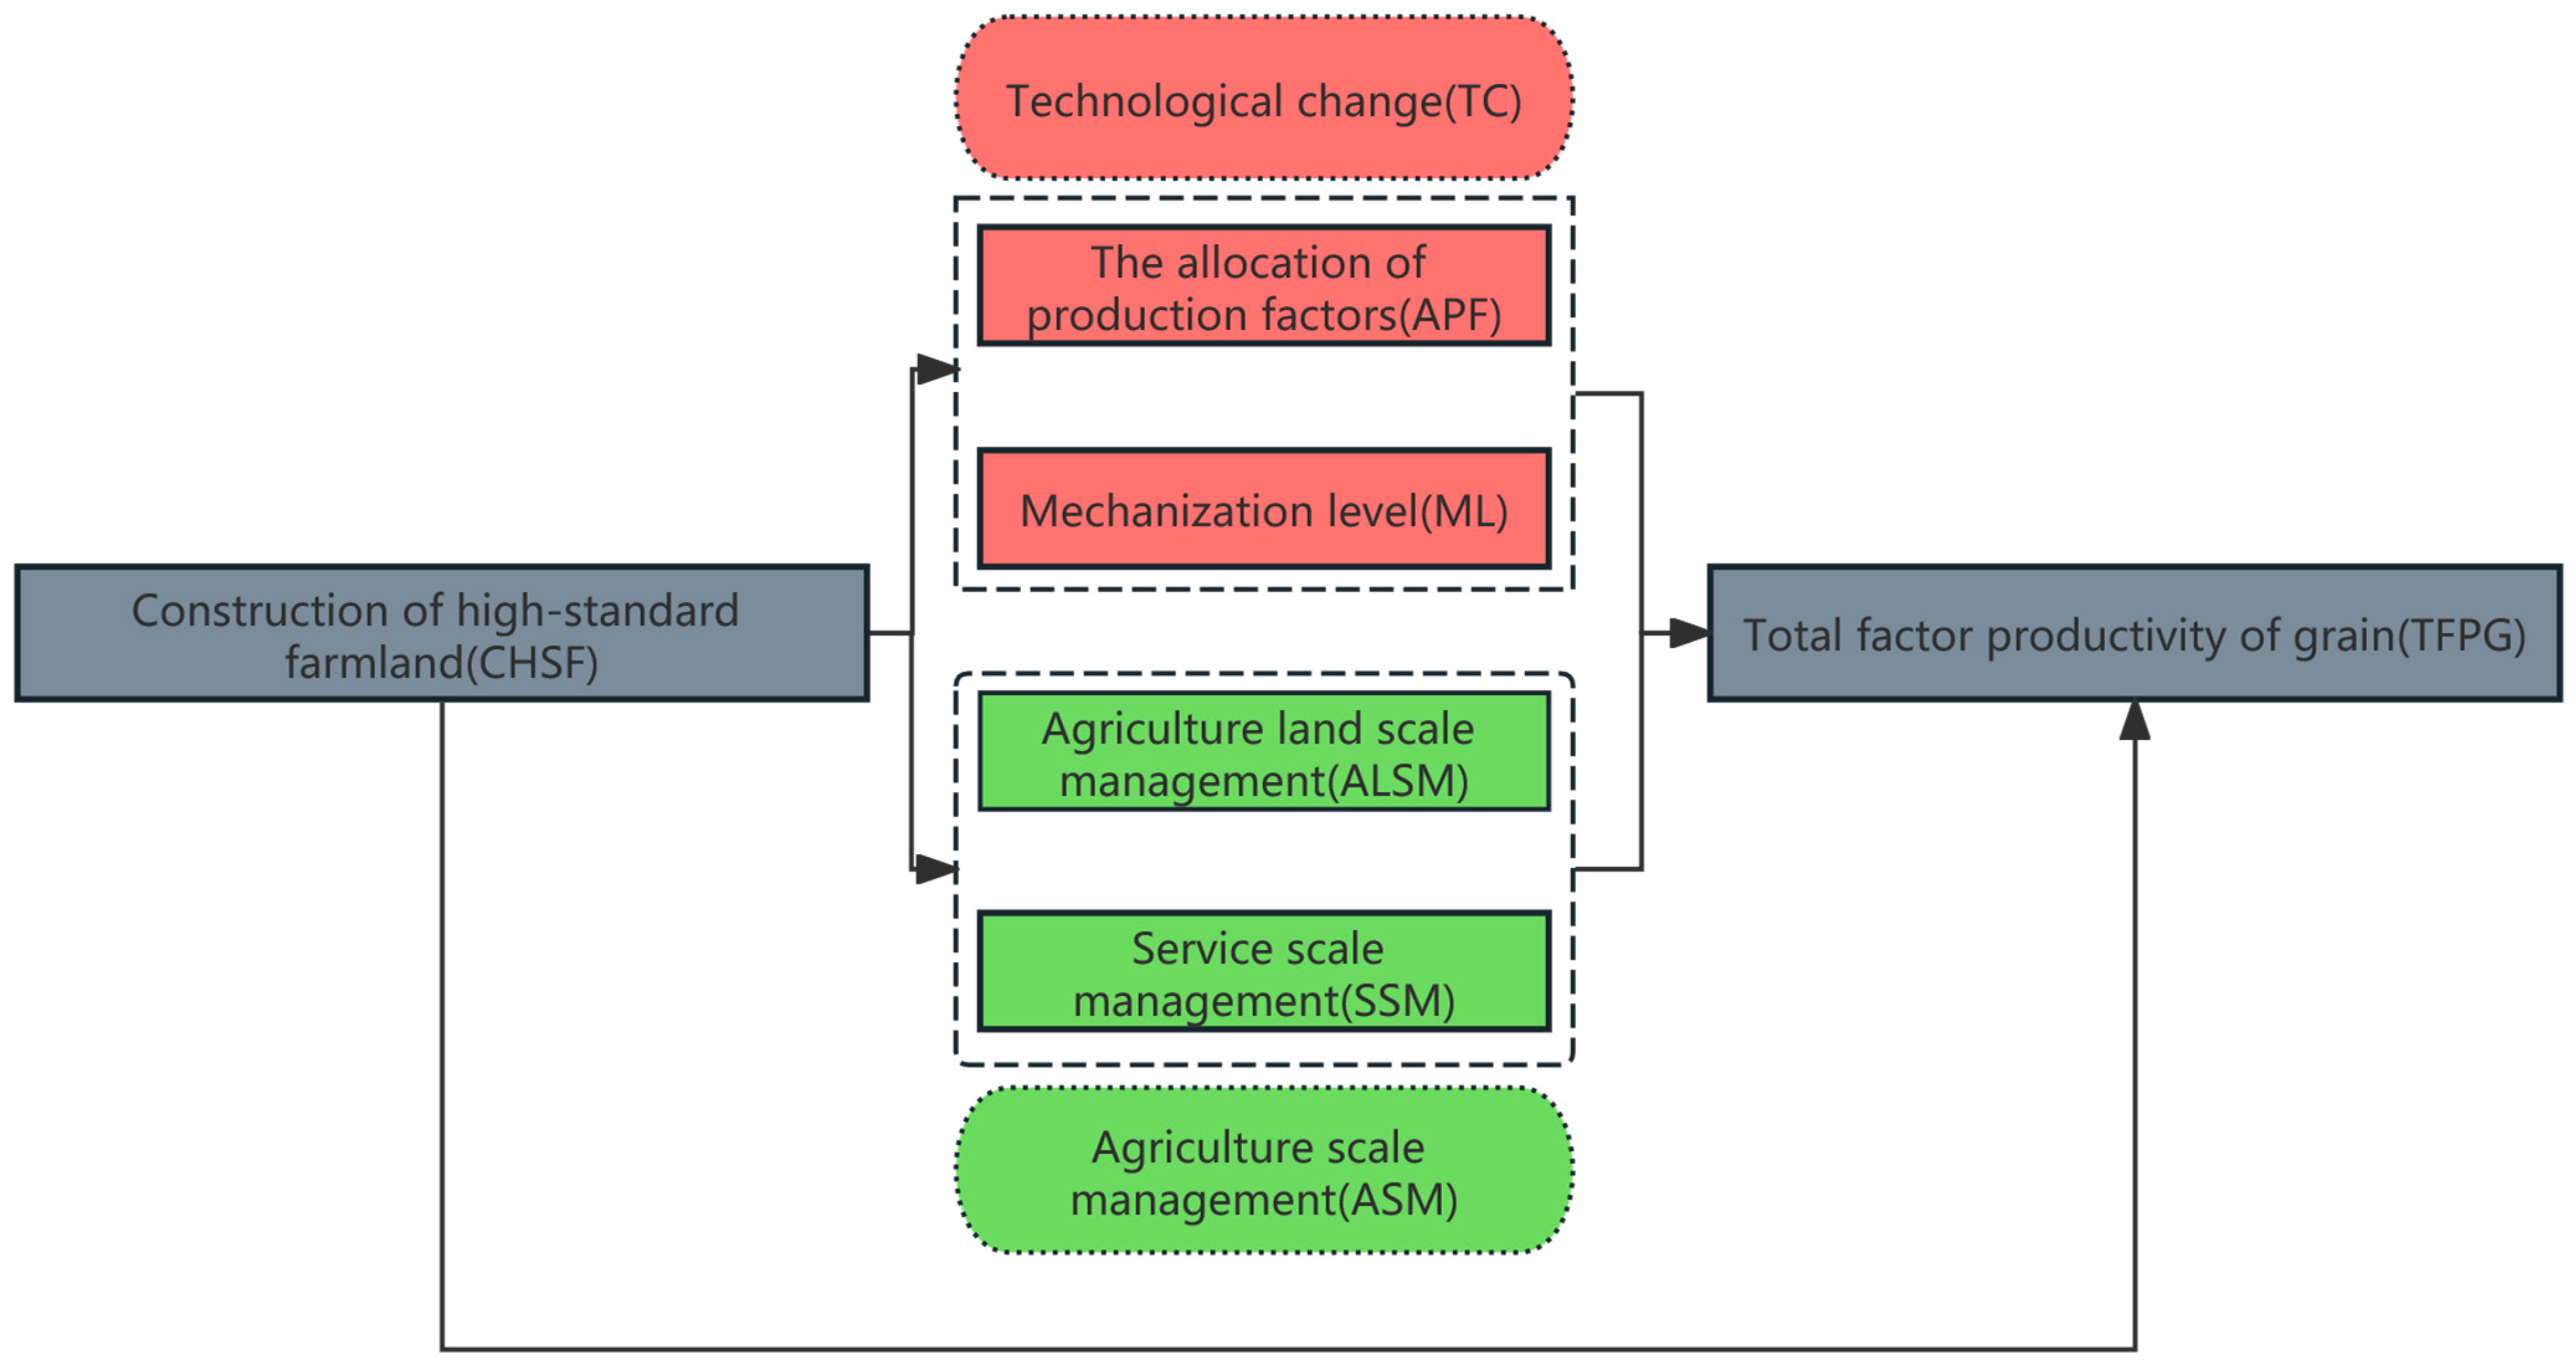
3.2.3. Mechanism Analysis
3.2.4. Heterogeneity Analysis
4. Empirical Analysis
4.1. Baseline Results
4.2. Robustness Test Results
4.2.1. Parallel Trend Test Results
4.2.2. Placebo Test Results
4.2.3. Other Robustness Tests Results
4.3. Mechanism Analysis
4.3.1. Technological Change (TC)
4.3.2. Agricultural Scale Management (ASM)
4.4. Heterogeneity Analysis
4.4.1. Differences in Functional Production Areas
4.4.2. Topographical Differences
5. Discussion
5.1. Discussion of Parallel Trend Test Results
5.2. Discussion on Mechanism Analysis Results
5.3. Discussion on Heterogeneity Analysis Results
5.4. Comparison with Other Studies
5.5. Practical Applications and Institutional Implications
5.6. Limitations
6. Conclusions
- (1)
- At the provincial level, CHSF significantly contributes to TFPG. The paper further validates the findings of the benchmark regression and lagged policy using a parallel trend test.
- (2)
- The robustness of the results was demonstrated through a series of robustness tests: using core variables lagged by one period, adjusting for sample selection, excluding other policy disturbances, and conducting placebo tests.
- (3)
- The results of the mechanism analysis indicated that CHSF could enhance TFPG by increasing the mechanization level (ML), and thus TFPG, contributing to the theoretical framework of China’s rural revitalization policy by linking CHSF to productivity gains through mechanization.
- (4)
- Heterogeneity analysis reveals significant regional variation in the impact of CHSF across regions. The policy contributed more to TFPG in non-major grain-producing and plain areas than in major grain-producing and non-plain areas, suggesting the need for region-specific policy adjustments.
Author Contributions
Funding
Data Availability Statement
Conflicts of Interest
References
- Food and Agriculture Organization (FAO). Global Report on Food Crises 2024. 2024. Available online: https://www.fao.org/newsroom/detail/global-report-on-food-crises---acute-hunger-remains-persistently-high-in-59-countries-with-1-in-5-people-assessed-in-need-of-critical-urgent-action/en (accessed on 4 January 2025).
- Puma, M.J.; Bose, S.; Chon, S.Y.; Cook, B.I. Assessing the evolving fragility of the global food system. Environ. Res. Lett. 2015, 10, 14. [Google Scholar] [CrossRef]
- Krugman, P. Myth of East Asia’s Miracle. Foreign Aff. 1994, 73, 62–68. [Google Scholar] [CrossRef]
- Du, Y.; Zhang, X.Q.; Liang, T.J. National food security and the construction of new agricultural development paradigm. Issues Agric. Econ. 2022, 9, 4–10. [Google Scholar]
- Sun, C.; Yang, H.; Han, D.; Sun, C.; Yang, H.D. Han National high-standard farmland construction status and velopment strategies. China Agric. Sci. Technol. Bull. 2022, 24, 15–22. [Google Scholar]
- Zhao, Y.; Sun, X.T. Does the construction of high-standard farmland help promote the cultivation of new professional farmers: Evidence from villages. Chin. Rural Econ. 2022, 474, 135–144. [Google Scholar]
- Gao, M.; Wei, J.S. The source of the new round of hundred billion catty grain production capacity improvement: The growth and contribution of total factor productivity. J. Huazhong Agric. Univ. (Soc. Sci. Ed.) 2024, 1, 15–24. [Google Scholar]
- Zhang, Y.; Liu, C.; Guo, L. Evaluation of China’s food security status and strategic thinking. China Rural Obs. 2015, 1, 2–14+29+93. [Google Scholar]
- Yin, Z.J.; Li, G.C.; Ge, J.F. Food security, climate change and grain productivity growth based on HP filter and sequential DEA methods. Resour. Sci. 2016, 38, 665–675. [Google Scholar]
- Jia, J.Q.; Sun, Z.L.; Li, X.D. Has the grain price support policy increased the total factor productivity of grain in China?—A case study of the minimum purchase price policy for wheat. Chin. Rural Econ. 2019, 1, 67–72. [Google Scholar]
- Fan, F. The distribution dynamics and trend evolution of China’s grain total factor productivity: An empirical analysis based on provincial panel data from 1978 to 2012. Rural. Econ. 2017, 3, 49–54. [Google Scholar]
- Wang, S.; Yang, Z. Study on the impact of agricultural labor force aging on changes in green total factor productivity of grain. Agric. Mod. Res. 2020, 41, 396–406. [Google Scholar]
- Key, N. Farm size and productivity growth in the United States Corn Belt. Food Policy 2019, 84, 186–195. [Google Scholar] [CrossRef]
- Zheng, Z.H.; Cheng, S.; Henneberry, S.R. Total factor productivity change in China’s grain production sector: 1980–2018. Aust. J. Agric. Resour. Econ. 2023, 67, 38–55. [Google Scholar] [CrossRef]
- Nguyen, T.H.T.; Thai, T.Q.N.; Tran, V.T.; Pham, T.P.; Doan, C.D.; Vu, K.H.; Doan, H.G.; Bui, Q.T. Land consolidation at the household level in the Red River Delta, Vietnam. Land 2020, 9, 196. [Google Scholar] [CrossRef]
- Hendricks, A.; Lisec, A. Land consolidation for large-scale infrastructure projects in Germany. Geod. Vestn. 2014, 58, 46–68. [Google Scholar] [CrossRef]
- Asiama, K.; Bennett, R.; Zevenbergen, J. Land consolidation on Ghana’s rural customary lands: Drawing from The Dutch, Lithuanian and Rwandan experiences. J. Rural. Stud. 2017, 56, 87–99. [Google Scholar] [CrossRef]
- Chi, L.; Han, S.; Huan, M.; Li, Y.; Liu, J. Land fragmentation, technology adoption and chemical fertilizer application: Evidence from China. Int. J. Environ. Res. Public Health 2022, 19, 8147. [Google Scholar] [CrossRef]
- Wu, J.Q.; Fang, S.L.; Li, G.C. The spillover effect of agricultural mechanization on grain output in China: From the perspective of cross-regional mechanization service. Chin. Rural Econ. 2017, 6, 44–57. [Google Scholar]
- Ma, W.; Liu, T.; Li, W.; Yang, H. The role of agricultural machinery in improving green grain productivity in China: Towards trans-regional operation and low-carbon practices. Heliyon 2023, 9, e20279. [Google Scholar] [CrossRef]
- Han, Y.; Chen, Y.; Chen, Z. Progress of high-standard farmland construction in china and suggestions on policy improvement: Comparison of China’s agricultural modernization goals and lessons from the United States, Germany and Japan. Chin. Rural Econ. 2022, 5, 20–29. [Google Scholar]
- Zeng, F. Theoretical framework and model selection for high-standard farmland construction. Huxiang Forum 2014, 27, 61–68. [Google Scholar]
- Peng, J.; Zhao, Z.; Chen, L. The impact of high-standard farmland construction policy on rural poverty in China. Land 2022, 11, 1578. [Google Scholar] [CrossRef]
- Zhang, L.C.; Wang, Y.; Dong, Y.G. The impact of global food production concentration on food systems sustainability. Trans. Chin. Soc. Agric. Eng. 2022, 11, 117–128. [Google Scholar]
- Zhang, Z. Impact of high-standard farmland construction projects on arable land. Int. Core J. Eng. 2022, 8, 89–91. [Google Scholar]
- Solow, R.M. Technical change and the aggregate production function. Rev. Econ. Stat. 1957, 39, 312–320. [Google Scholar] [CrossRef]
- Coelli, T.; Rao, D.S.P. Total factor productivity growth in agriculture: A malmquist index analysis of 93 countries, 1980–2000. Agric. Econ. 2005, 32, 115–134. [Google Scholar] [CrossRef]
- Wang, J.; Huang, J.; Rozelle, S. The evolution of China’s agricultural productivity growth: Evidence from censuses and surveys. J. Product. Anal. 2017, 47, 151–166. [Google Scholar]
- Su, L.L.; Kong, R. The interaction mechanisms between farmers’ financial literacy and the development of rural factors market. China Rural Surv. 2019, 2, 61–77. [Google Scholar] [CrossRef]
- Xu, Q.; Tian, S.C.; Xu, S.C. Agricultural land system, land fragmentation and farmers’ income inequality. Econ. Res. 2008, 2, 83–92+105. [Google Scholar]
- Sun, X.T.; Zhang, L.J.; Wang, Z.H. The impact of well-facilitated farmland construction on agricultural production: From the perspectives of agricultural factor elasticity and agricultural total factor productivity. China Rural Surv. 2023, 89–108. [Google Scholar] [CrossRef]
- Ji, Y.; Gu, T.; Chen, Y.; Xu, Z.; Zhong, F. Agricultural scale operation from the perspective of plot size: Discussion based on the relationship between transfer rent and plot size. Manag. World 2017, 7, 65–73. [Google Scholar]
- Sun, X.; Zhang, L. The impact of high-standard farmland construction on smart agriculture. Mod. Econ. Res. 2025, 3, 111–122+132. [Google Scholar]
- Gong, Y.L.; Zhang, Y.L. Influence of well-facilitated capital farmland construction policy on grain productivity. J. Huazhong Agric. Univ. (Soc. Sci. Ed.) 2023, 4, 175–190. [Google Scholar]
- Zhou, M.; Lv, H.Y.; Ke, N. Spatial correlation and spillover effects of allocation of agricultural production factors and green use efficiency of cultivated land. J. Agro-For. Econ. Manag. 2024, 23, 41–50. [Google Scholar]
- Zhang, Z.Y. Some important problems and measures farmland construction suitable for mechanization in hilly and mountainous areas during the 14th five-year plan period. Chin. Rural Econ. 2020, 11, 13–28. [Google Scholar]
- Liang, Z.H.; Zhang, L.; Zhang, J.B. Land remediation and reduction of chemical fertilizers: Quasi-natural experimental evidence from China’s high standard basic farmland construction policy. Chin. Rural Econ. 2021, 123–144. [Google Scholar]
- Wei, H.K. Major issues of China’s rural development during the 14th five-year plan period. Chin. Rural Econ. 2020, 1, 2–16. [Google Scholar]
- Zhang, L.; Luo, B.L. Economies of scale or division of labor economy? -evidence from household operation performance in agriculture. J. Agrotech. Econ. 2021, 2, 4–17. [Google Scholar] [CrossRef]
- Li, W.M.; Luo, D.; Chen, J. Moderately scaled agriculture: Scale efficiency, output level, and production costs-based on survey data from 1552 rice planters. Chin. Rural Econ. 2015, 4–17+43. [Google Scholar] [CrossRef]
- Meng, M.; Yu, L.; Yu, X. Machinery structure, machinery subsidies, and agricultural productivity: Evidence from China. Agric. Econ. 2024, 55, 223–246. [Google Scholar] [CrossRef]
- Ji, M.F.; Li, L. Agricultural production trusteeship: The main form of scale management of agricultural services. Issues Agric. Econ. 2020, 1, 68–75. [Google Scholar] [CrossRef]
- Zhao, D.D.; Zhou, H. Agricultural production agglomeration: How to improve total factor productivity of grain-a reexamination based on different development paths. J. Agrotech. Econ. 2020, 8, 13–28. [Google Scholar] [CrossRef]
- Färe, R.; Grosskopf, S.; Norris, M.; Zhang, Z. Productivity growth, technical progress and efficiency changes in industrialized countries. Am. Econ. Rev. 1994, 84, 66–83. [Google Scholar]
- Cai, Z.; Zeng, F.S. Effect of agricultural infrastructure investment on grain increase in China: An empirical analysis based on provincial panel data. J. Agrotech. Econ. 2017, 31–40. [Google Scholar] [CrossRef]
- Wang, R.F.; Li, S.; Wang, H.L. Evaluation and realization path of high quality development of China’s grain industry. Stat. Decis. 2019, 36, 93–97. [Google Scholar]
- Ministry of Land and Resources. National Land Consolidation Plan (2011–2015). 2012. Available online: http://law168.com.cn/doc/view?id=163986 (accessed on 30 April 2025).
- Ministry of Land and Resources. Construction Standards for High-standard Basic Farmland (TD/T 1033-2012). 2012. Available online: https://www.codeofchina.com/standard/TDT1033-2012.html (accessed on 30 April 2025).
- National Bureau of Statistics of China. China Statistical Yearbook (2021). 2021. Available online: https://www.stats.gov.cn (accessed on 30 April 2025).
- Ministry of Natural Resources of the People’s Republic of China. China Land and Resources Bulletin (2020). 2021. Available online: http://www.mnr.gov.cn/ (accessed on 30 April 2025).
- Zhong, F.N.; Lu, W.Y.; Xu, Z.G. Is rural labor migration bad for grain production? Analysis of farmers’ factor substitution and planting structure adjustment behavior and constraints. Chin. Rural Econ. 2016, 36–47. [Google Scholar] [CrossRef]
- Fan, S.; Zhang, X. Infrastructure and regional economic development in rural China. China Econ. Rev. 2004, 15, 203–214. [Google Scholar] [CrossRef]
- Gollin, D.; Lagakos, D.; Waugh, M.E. The agricultural productivity gap. Q. J. Econ. 2013, 129, 939–993. [Google Scholar] [CrossRef]
- Deininger, K.; Jin, S.; Nagarajan, H.K. Land reforms, poverty reduction, and economic growth: Evidence from India. J. Dev. Stud. 2009, 45, 496–521. [Google Scholar] [CrossRef]
- Kompas, T.; Che, T.N.; Nyuyen, H.T.M.; Nguyen, H.Q. Productivity, net returns, and efficiency: Land and market reform in vietnamese rice production. Land Econ. 2012, 88, 478–495. [Google Scholar] [CrossRef]


| Category | Indicators | Explanation of Indicators | Units |
|---|---|---|---|
| Output | Grain | Total grain output | 10,000 tons |
| Input | Land input | Grain planting area | Kilo-hectares |
| Labor input | Number of laborers engaged in grain production | 10,000 people | |
| Fertilizer input | Fertilizer use for grain production | 10,000 tons | |
| Machinery input | Total power of machinery used for grain production | 10,000 kw |
| Variables | Variable Names | Variable Definition | Mean | Sd | Min | Max |
|---|---|---|---|---|---|---|
| Total factor productivity of grain | TFPG | Measurement of total factor production index for grain based on DEA | 1.014 | 0.042 | 0.846 | 1.341 |
| Area of high-standard farmland | HIGH | Share of sum of areas of high-standard farmland demonstration projects and renovation of medium- and low-yield fields in total cultivated land area (unit: %) | 0.236 | 0.193 | 0.001 | 0.984 |
| Cultivated land area per capita | CLAP | Cultivated land area per capita in logarithms (unit: kilo-hectares) | 3.435 | 0.485 | 2.046 | 4.250 |
| Planting structure | PS | Share of area sown with grain in total area sown with crops (unit: %) | 0.656 | 0.131 | 0.328 | 0.968 |
| Per capita income from the grain industry | PIGI | Ratio of grain output to agricultural output multiplied by per capita disposable income of farmers (unit: CNY 10,000) | 0.200 | 0.163 | 0.016 | 1.048 |
| Disaster rate | DR | Share of disaster-affected area in area sown with grain (unit: %) | 0.328 | 0.221 | 0.130 | 0.998 |
| Rainfall deviation degree | RDD | Precipitation deviation in logarithms (unit: millimeters) | 2.716 | 0.498 | 0.094 | 3.594 |
| Fiscal expenditure for agriculture | FEA | Share of agriculture, forestry, and water expenditure in public budget expenditure (unit: %) | 0.115 | 0.059 | 0.049 | 0.468 |
| Urbanization rate | UR | Share of urban population out of the total population (unit: %) | 50.852 | 15.720 | 13.885 | 94.152 |
| Industrialization level | IL | Share of industrial value added in the gross regional product (unit: %) | 0.335 | 0.096 | 0.071 | 0.559 |
| Transport infrastructure level | TIL | Share of total road transport in the road mileage (unit: %) | 1.146 | 1.415 | 0.005 | 10.749 |
| Technological change: the allocation of production factors | TC: APF | Average value of the share of input factors such as pesticides, fertilizers, seeds, etc., in the allocation of labor factors in the grain production process (unit: %) | 0.310 | 0.199 | 0.006 | 1.735 |
| Technological change: mechanization level | TC: ML | Number of machines per square hectometer (hm2) of a household (unit: set/hm2) | 26.664 | 34.210 | 0.269 | 276.5127 |
| Agricultural scale management: agricultural land scale management | ASM: ALSM | Number of farm households operating more than 10 acres of arable land (unit: 10,000 households) | 132.135 | 108.488 | 0.199 | 977.461 |
| Agricultural scale management: service scale management | ASM: SSM | HHI: A composite index to measure production concentration | 0.361 | 0.188 | 0.0302 | 0.858 |
| Variables | Explained Variable: TFPG | |
|---|---|---|
| (1) | (2) | |
| Highi × Iitpost | 0.077 * (0.043) | 0.083 ** (0.040) |
| CLAP | 0.026 (0.022) | |
| PS | 0.096 (0.060) | |
| PIGI | −0.145 (0.026) | |
| DR | −0.036 ** (0.015) | |
| RDD | 0.003 (0.003) | |
| FEA | −0.198 ** (0.074) | |
| UR | 0.001 (0.001) | |
| IL | 0.112 (0.067) | |
| TIL | 0.012 ** (0.005) | |
| Province fixed effects | Yes | |
| Year fixed effects | Yes | |
| Number of observations | 682 | 682 |
| R2 | 0.370 | 0.463 |
| Variables | Ordinary Standard Error | Heteroskedasticity–Serial Correlation–Cross-Section Correlation Robust Standard Errors | Core Variables Lagged by One Period | Adjusting the Range of Sample Selection | Removing Other Policy Distractions | |||||
|---|---|---|---|---|---|---|---|---|---|---|
| (1) | (2) | (3) | (4) | (5) | (6) | (7) | (8) | (9) | (10) | |
| Highi × Itpost | 0.077 *** (0.012) | 0.083 *** (0.010) | 0.077 * (0.043) | 0.083 ** (0.040) | 0.061 *** (0.012) | 0.070 *** (0.012) | 0.048 * (0.027) | 0.060 ** (0.030) | 0.055 ** (0.018) | 0.038 ** (0.017) |
| Cons— | 0.989 *** (0.010) | 0.822 *** (0.058) | 1.016 *** (0.007) | 0.832 *** (0.087) | 0.988 *** (0.009) | 0.848 *** (0.058) | 1.007 *** (0.003) | 0.987 *** (0.117) | 0.997 *** (0.011) | 0.951 *** (0.085) |
| Control variables | No | Yes | No | Yes | No | Yes | No | Yes | No | Yes |
| Province fixed effects | Yes | Yes | Yes | Yes | Yes | Yes | Yes | Yes | Yes | Yes |
| Year fixed effects | Yes | Yes | Yes | Yes | Yes | Yes | Yes | Yes | Yes | Yes |
| Number of observations | 682 | 682 | 682 | 682 | 651 | 651 | 594 | 594 | 465 | 465 |
| R2 | 0.370 | 0462 | 0.170 | 0.295 | 0.373 | 0.458 | 0.310 | 0.431 | 0.348 | 0.421 |
| Variables | TC | ASM | ||||||
|---|---|---|---|---|---|---|---|---|
| APF | ML | ALSM: Number of Farm Households Operating More than 10 Acres of Arable Land | SSM: HHI | |||||
| (1) | (2) | (3) | (4) | (5) | (6) | (7) | (8) | |
| Highi × Itpost | 0.036 (0.053) | 0.021 (0.053) | 44.071 *** (7.796) | 33.959 *** (7.299) | −17.855 (20.210) | −21.358 (19.939) | 0.005 (0.018) | −0.003 (0.016) |
| Cons— | 0.613 *** (0.042) | 1.171 *** (0.266) | 6.193 (6.355) | 300.657 *** (36.521) | 37.485 ** (16.476) | 5.473 (99.764) | 0.438 *** (0.014) | 0.326 *** (0.081) |
| Control variables | No | Yes | No | Yes | No | Yes | No | Yes |
| Province fixed effects | Yes | Yes | Yes | Yes | Yes | Yes | Yes | Yes |
| Year fixed effects | Yes | Yes | Yes | Yes | Yes | Yes | Yes | Yes |
| Number of observations | 682 | 682 | 682 | 682 | 682 | 682 | 682 | 682 |
| R2 | 0.455 | 0.488 | 0.596 | 0.672 | 0.730 | 0.757 | 0.931 | 0.946 |
| Variables | TFPG | |||||||
|---|---|---|---|---|---|---|---|---|
| Major Grain-Producing Area | Non-major Grain-Producing Areas | Plains Area | Non-Plain Areas | |||||
| (1) | (2) | (3) | (4) | (5) | (6) | (7) | (8) | |
| Highi × Iitpost | 0.027 (0.020) | 0.050 ** (0.023) | 0.064 *** (0.013) | 0.068 *** (0.014) | 0.118 *** (0.013) | 0.110 *** (0.013) | 0.059 ** (0.027) | 0.068 ** (0.024) |
| Cons— | 1.011 *** (0.011) | 0.911 *** (0.047) | 1.008 *** (0.010) | 0.816 *** (0.042) | 1.024 *** (0.009) | 0.909 *** (0.043) | 1.030 *** (0.009) | 1.067 *** (0.058) |
| Control variables | No | Yes | No | Yes | No | Yes | No | Yes |
| Province fixed effects | Yes | Yes | Yes | Yes | Yes | Yes | Yes | Yes |
| Year fixed effects | Yes | Yes | Yes | Yes | Yes | Yes | Yes | Yes |
| Number of observations | 682 | 682 | 682 | 682 | 682 | 682 | 682 | 682 |
| R2 | 0.027 | 0.654 | 0.064 | 0.535 | 0.302 | 0.417 | 0.031 | 0.620 |
Disclaimer/Publisher’s Note: The statements, opinions and data contained in all publications are solely those of the individual author(s) and contributor(s) and not of MDPI and/or the editor(s). MDPI and/or the editor(s) disclaim responsibility for any injury to people or property resulting from any ideas, methods, instructions or products referred to in the content. |
© 2025 by the authors. Licensee MDPI, Basel, Switzerland. This article is an open access article distributed under the terms and conditions of the Creative Commons Attribution (CC BY) license (https://creativecommons.org/licenses/by/4.0/).
Share and Cite
Zhu, M.; Ge, D.; Wang, M.; Mohamed Massaquoi, S.; Wu, Z. Does Construction of High-Standard Farmland Improve Total Factor Productivity of Grain? Evidence from China, 2000–2021. Land 2025, 14, 1078. https://doi.org/10.3390/land14051078
Zhu M, Ge D, Wang M, Mohamed Massaquoi S, Wu Z. Does Construction of High-Standard Farmland Improve Total Factor Productivity of Grain? Evidence from China, 2000–2021. Land. 2025; 14(5):1078. https://doi.org/10.3390/land14051078
Chicago/Turabian StyleZhu, Mande, Dongdong Ge, Menghan Wang, Saffa Mohamed Massaquoi, and Zhixin Wu. 2025. "Does Construction of High-Standard Farmland Improve Total Factor Productivity of Grain? Evidence from China, 2000–2021" Land 14, no. 5: 1078. https://doi.org/10.3390/land14051078
APA StyleZhu, M., Ge, D., Wang, M., Mohamed Massaquoi, S., & Wu, Z. (2025). Does Construction of High-Standard Farmland Improve Total Factor Productivity of Grain? Evidence from China, 2000–2021. Land, 14(5), 1078. https://doi.org/10.3390/land14051078