Article

Study on the Driving Mechanisms and Regulation Pathways of Rural Construction Land Changes Based on the Decoupling-Potential Linkage Model: A Case Study of a County in Northern China

by
Bing Zhao
1,2,
Weicheng Han
1,* and
Zhiqi Zhang
1
1
College of Architecture and Art, Taiyuan University of Technology, Taiyuan 030024, China
2
Shandong Urban and Rural Planning and Design Institute Co., Ltd., Jinan 250014, China
*
Author to whom correspondence should be addressed.
Land 2025, 14(5), 1079; https://doi.org/10.3390/land14051079
Submission received: 1 April 2025 / Revised: 12 May 2025 / Accepted: 13 May 2025 / Published: 15 May 2025
(This article belongs to the Special Issue Suburban Land Development and Rural-Urban Integration)

Abstract

:
Amidst the backdrop of rural population decline and the inefficient expansion of construction land, traditional land management models are confronted with the dual challenges of supply–demand mismatch and low efficiency. This paper constructs a three-dimensional analytical framework based on decoupling types, development potential, and driving mechanisms. Initially, using Tapio’s decoupling theory, the study identifies the population–land decoupling types among 224 villages in Yanggao County, Shanxi Province, Northern China. It then evaluates the development potential of rural construction land using a comprehensive index system, and a linkage analysis between the two is conducted. Finally, the study employs the Logarithmic Mean Divisia Index (LMDI) method to conduct an in-depth analysis of the mechanisms driving changes in rural construction land. The results indicate the following: (1) Between 2010 and 2020, the study area exhibited a reverse evolution characterized by rural population loss and the expansion of construction land, with a significant “population–land decoupling” phenomenon. (2) The development potential for rural construction land shows a pattern of being high in the north and south, low in the middle, high in mountainous and hilly areas, low in plains, and high in peripheral areas but low in town centers. (3) Villages in Yanggao County are predominantly of the resource reserve type (49.11%), indicating relatively abundant land resource reserves. (4) In different population migration patterns, the reduction in land-use efficiency represents similar proportions (38% and 36%), with villages experiencing net population inflow performing better in improving land-use efficiency compared to those with net population outflow. Drawing on international governance experiences, the study proposes classification and phased implementation pathways. By revealing the dynamic patterns of rural population–land relationships—construction land potential and change mechanisms—the logic of regulatory path adaptation, the article provides a methodological paradigm for constructing a precise and differentiated land resource allocation system, promoting the transition of rural spatial governance from expansion in scale to an improvement in quality.

1. Introduction

With the acceleration of global urbanization, rural population loss and land use changes have become widespread issues across the globe. The allocation of rural land resources faces significant challenges. The restructuring of rural population–land systems is driving innovation in land resource allocation mechanisms. In Japan, the aging and declining rural population are particularly severe, with 51% of Japan’s administrative regions experiencing substantial population loss and diminished vitality [1]. This has led to the abandonment of farms and homes, with forests overtaking villages, posing a severe challenge to the harmonious relationship between humans and nature. In response to the demographic challenges faced by rural Japan, administrative mergers and tax reforms have already been implemented [1,2]. Additionally, in recent years, political debates surrounding economic decline, infrastructure issues, population decrease, and rural abandonment in Germany have resurfaced [3].
Since China’s economic reforms and rapid development, there has been a significant demographic shift: between 1996 and 2016, the urban population increased by 433 million, while the rural population decreased by 275 million [1]. However, despite this rural population decline, rural construction land did not decrease—in fact, it increased by 1.31% during the same period [4]. This expansion of rural construction land has posed a threat to arable land and agricultural production [5]. The phenomenon of rural hollowing out, coupled with the prevalence of multiple dwellings per household, has led to land abandonment and inefficient land use. The large-scale encroachment of construction land onto farmland has become widespread, reducing the availability of arable land and disrupting agricultural production. As a result, land resources are being wasted: newly developed construction areas often remain underutilized, while agricultural land, which could be more productively used, is taken away [6,7].
To address these challenges and prevent further rural decline, the Chinese central government proposed the Rural Revitalization Strategy (RRS) in 2017. The strategy aims to break long-standing bottlenecks in rural development and achieve comprehensive upgrades in agriculture, rural areas, and the overall development of farmers. Following this, the Strategic Plan for Rural Revitalization (2018–2022) was released in September 2018, outlining five major goals for rural revitalization: prosperous life, industrial prosperity, ecological livability, rural civilization, and effective governance [8]. In line with these goals, the “Comprehensive Rural Revitalization Plan (2024–2027)” released in 2024 emphasizes deepening rural land system reforms, standardizing urban–rural land use balance, and prioritizing land for key rural industries.
Against this backdrop, the relationship between population and land in rural areas has become a central issue in the study of urban–rural resource allocation. Land, as a critical natural resource, serves not only as the foundation for economic activities but also as a key space for supporting ecological environments. Therefore, understanding the trends in the quantitative changes of rural population–land relationships, as well as the development potential of construction land, is essential for promoting regional socio-economic development and improving land resource allocation efficiency.
Rural areas serve as the fundamental foundation for rural socio-economic activities. The development of the economy and urbanization has led to a rapid outflow of rural populations, disrupting the originally harmonious relationship between rural populations and land. As a result, the population–land system in rural areas is undergoing significant restructuring and transformation [9]. Research on the relationship between rural populations and land use changes primarily focuses on three areas. (1) The analysis of the decoupling of the rural population–land system. The decoupling model, originating from physics, indicates a lack of corresponding relationships between two or more physical quantities and is now widely applied in agriculture [10,11,12], resources [13,14], and environmental [15] studies. Li et al. (2019) applied a two-dimensional decoupling model in Hebei Province, finding that population growth and construction land expansion were largely uncoordinated, with 75.76% of counties showing weak decoupling. Their findings highlighted the need for targeted land-use zoning to optimize construction land efficiency and promote sustainable development [16]. In the Yellow River Basin, Shi (2021) found a strong negative decoupling between rural population decline and the expansion of residential land from 2010 to 2016. They attributed this imbalance to intensive land utilization and urbanization, stressing the urgency of formulating sustainable rural development strategies to address the shrinking population and expanding residential land [17]. In addition, Zhang et al. (2022) confirmed the negative decoupling trend in China, reinforcing the need for policies to better align land use with rural population trends to support ecological protection and rural revitalization [18]. Together, these studies underscore the growing issue of uncoordinated land expansion and population decline in rural areas, urging integrated strategies to enhance land use efficiency and support sustainable rural development. (2) Dynamic changes in rural construction land. Existing research primarily focuses on the dynamic changes in land expansion and land transformation models, analyzing the driving mechanisms of land use changes. Zhu et al. (2020) explored the urban–rural construction land transition (URCLT) and its relationship with rural-to-urban population flow in the Yangtze River Delta, finding a shift from coupling to weak decoupling of land transitions and population flow between 2000 and 2015. The study emphasizes the need to regulate URCLT to ensure a stable urban–rural transition [4]. Niu et al. (2022) examined the spatiotemporal characteristics of land-use transition in the Yangtze River Delta from 1990 to 2018, identifying key land transitions driven by government policies, industrial restructuring, and urbanization. They highlighted the increasing importance of urban–rural integration since 2010, with the transition from cultivated land to urban construction land being predominant [19]. Yang et al. (2023) analyzed urban–rural land structural conflicts from 2000 to 2020, revealing an inverted U-shaped trend in urban–rural land expansion and emphasizing the decaying impact of socioeconomic factors on rural land expansion. Their study provides insights into achieving deep urban–rural land integration and promoting high-quality development [20]. These studies illustrate the complex interactions between land transitions and population dynamics, underscoring the importance of policy-driven approaches to manage land use and urban–rural integration during ongoing transformations. (3) Rural land use quality and potential. The third area of research focuses on the evaluation of rural land use quality, including land intensification and development potential. Qu et al. (2021) identified various human–land interaction patterns, including the phenomenon of “Population Decline and Land Expansion (PDLE)” in Shandong Province, which posed challenges to intensive land use and eco-friendly development. They emphasized the need for policies that integrate human–land elements to promote sustainable rural development [21]. Xu et al. (2011) highlighted the importance of assessing construction land potential in China to support urbanization and industrialization processes. Their spatial analysis identified unbalanced supply and demand for construction land, suggesting that regions with low land potential but high demand—such as Central and Eastern China—require targeted strategies to optimize land use [22]. Yang et al. (2021) focused on homestead renovation as a crucial aspect of rural land consolidation. Their study demonstrated that homestead renovation potential is strongly influenced by local terrain conditions and spatial factors, suggesting that optimizing homestead use could significantly improve land use efficiency in rural areas [23]. Together, these studies underscore the importance of evaluating land use quality and development potential through integrated models, spatial analysis, and policy interventions to address the inefficiencies and imbalances in rural land use. Additionally, research on changes in rural population–land relationships at different scales has drawn scholars’ attention to rural transformation and development, increasing studies on the transformation and interaction between rural population, land, and industries [24,25], thereby providing direction for rural transformation and revitalization.
Analysis indicates that existing research exhibits diverse perspectives and methodologies. However, the focus has primarily been on macro and meso-level analyses at national, regional, provincial, or municipal scales. There is a significant gap in micro-level quantitative research that examines changes in rural construction land and their driving mechanisms using villages as the basic unit of study. Moreover, studies that integrate the relationship between population–land changes and the potential for land consolidation are notably lacking [26]. The study takes villages as the basic unit and, from the dual perspectives of rural population–land decoupling and construction land development potential, constructs a novel analytical framework and classification model. This model aims to identify villages with surplus construction land and reallocate their excess land to support development-oriented villages and county-level construction projects with land deficits. By deeply analyzing the driving mechanisms behind changes in rural construction land, the study ultimately provides a theoretical framework for optimizing land resource allocation. Specifically, the framework proposes methods for assessing land supply and demand across different regions, identifies factors influencing land use change, and suggests strategies for reallocating land in a way that balances the needs of rural development and agricultural sustainability. This approach helps to ensure a more efficient and equitable use of land resources, promoting sustainable rural development.

2. Materials and Methods

2.1. Study Area and Data Sources

2.1.1. Study Area

Yanggao County, a typical agricultural region in northern China, is also a key county for rural revitalization initiatives in Shanxi province, boasting vast and fertile land resources. With the progression of urbanization, the county’s rural areas face common challenges seen across many rural regions in China, such as population decline and inefficient land resource allocation. According to data from the Third National Land Survey, Yanggao County comprises 12 townships, 278 villages, and communities, with Longquan Town serving as the county’s administrative center, located in the northern part of the county. In recent years, as the urbanization rate has increased, and many villages in Yanggao have experienced population outflow and idle construction land, while other villages and urban construction zones are facing a shortage of construction land. The rural development in Yanggao County exhibits a typical “population–land decoupling” pattern, which makes it an ideal case for addressing the issues of “land surplus” and “land scarcity” in different regions of the study area. The research involves 224 villages in Yanggao County, excluding those located in townships and community centers. In this study, the rural construction land within the research area includes homestead, public service facility land, and commercial land specifically designated for rural use. The location of Yanggao County and the distribution of rural construction land are shown in Figure 1.

2.1.2. Data Sources

The data for this study primarily come from the Yanggao County Bureau of Statistics, the County Public Security Bureau, and the County Natural Resources Bureau. The rural population data, spanning the years 2010 to 2020, were provided by the Yanggao County Bureau of Statistics and the Public Security Bureau. Data on rural construction land for the same period (2010–2020) were sourced from land survey data provided by the Yanggao County Natural Resources Bureau. Additionally, data on arable land patches, rural construction land patches, and road network density were derived from the Third National Land Survey conducted in 2020. Slope and elevation data were sourced from the Geospatial Data Cloud.

2.2. Research Method

2.2.1. Local Getis-Ord G i * Index

The changes in rural population and construction land represent typical geographic events, where population–land dynamics in different villages exhibit spatial clustering or dispersion. Hotspot analysis is a spatial analytical method used to identify and assess the spatial characteristics and trends of population distribution, construction land distribution, and their interactions [27]. In this study, the Getis-Ord G i * statistic, a local statistical model, is applied to quantify the spatial dependence of population–land change relationships and determine the clustering intensity of rural population and construction land changes. The formula is defined as follows:
G i * = j = 1 q W i j d j / ( j = 1 q d j )
Z G i * = j = 1 q W i j d j x ¯ j = 1 q W i j 2 v q j = 1 q W i j 2 j = 1 q W i j 2 q 1
where q represents the number of villages, W i j denotes the weight value representing the spatial relationship between village i and village j , d j is the variable size for village j , x ¯ is the sample mean, and v is the sample variance.
The hotspots and cold spots are identified based on the Z G i * score of the G i * statistic and the corresponding p-values. Specifically, for each village, the z-score is used to represent clustering statistical significance at 90% (p = 0.10), 95% (p = 0.05), and 99% (p = 0.01) confidence levels [28], with corresponding z-scores of ±1.65, ±1.96, and ±2.58, respectively.

2.2.2. Tapio Decoupling Model

The Tapio decoupling model, proposed by Finnish scholar Petri Tapio in 2005, is a method used to analyze the relationship between economic activities and environmental pressures [10]. Building on this concept, this study develops a decoupling model represented by the ratio of the average annual growth rate of rural construction land to the average annual growth rate of the rural resident population, in order to analyze the relationship between changes in rural construction land area and population size from 2010 to 2020. The decoupling coefficient is used to assess whether changes in rural construction land align with the migration patterns of rural resident populations. The formula is as follows:
D F = ( L a n d ( n + 1 ) L a n d n ) / L a n d n ( P o p ( n + 1 ) P o p n ) / P o p n
where DF represents the decoupling coefficient, n is the year, Land(n+1) refers to the rural construction land area in year n + 1, Landn is the rural construction land area in year n, Pop(n+1) is the rural resident population in year n + 1, and Popn is the rural resident population in year n.
Based on the studies by Li [29] and Tapio [30], a decoupling coefficient range of 0.8 to 1.2 is used to classify decoupling states, dividing the evolution of supply and demand for rural construction land into eight categories, as shown in Table 1. The change rates of rural population and construction land area can indicate decoupling, negative decoupling, or coupling relationships. Decoupling is further categorized into three types: strong decoupling (T1), where rural population increases while construction land decreases; weak decoupling (T2), where both rural population and construction land increase, but the growth rate of construction land is lower than that of the population; and decline decoupling (T3), where both rural population and construction land decrease, but the reduction in construction land occurs at a faster rate than the population decline. Similarly, negative decoupling includes three subtypes: expansive negative decoupling (T4), where both rural construction land and population increase, with the growth rate of construction land surpassing that of the population; strong negative decoupling (T5), where rural population decreases while construction land increases; and weak negative decoupling (T6), where both rural population and construction land decrease, but the rate of decline in construction land is slower than that of the population. To avoid over-interpreting minor changes as significant, an elasticity value around 1.0, with a ±20% variation, is still considered coupling. Thus, coupling is defined as an elasticity value between 0.8 and 1.2 (0.8 < DF < 1.2). Coupling is further divided into two types: expansion coupling (T7), where both rural construction land and population increase simultaneously, and decline coupling (T8), where both rural construction land and population decrease at similar rates.

2.2.3. Evaluation Model for the Potential of Rural Construction Land Consolidation

According to relevant scholarly research, numerous factors influence the remediation of hollow villages and the consolidation of idle homesteads. These factors encompass both external environmental elements, such as village planning, geographic location, transportation accessibility, neighboring land use, government subsidies for withdrawal, and village industrial structure [31], as well as internal factors like household demographic structure, income levels, educational attainment of the household head, condition of the housing, per capita living space, and the household head’s willingness to participate [32]. Given that the objective of this study is to quickly and efficiently identify high-potential areas for consolidation within villages on a large, macro scale, enabling cross-regional indicator allocation, the focus is primarily on the theoretical consolidation potential under the influence of external factors [23,33], without delving into specific operational details. The rapid determination and zoning evaluation indicator system for the potential of rural construction land consolidation [23] is presented in Table 2.
Determining the ideal value of per capita construction land area provides a quantitative reference standard for rural planning and homestead allocation, helping to avoid the overdevelopment and wastage of land resources [34]. The ideal per capita construction land area is established based on the “Standard for Planning of Rural Villaged and Town (GB50188-93) [35]” and surveys conducted by relevant researchers, who have established corresponding planning standard ranges [36,37]. These values are listed in Table 3. It is important to note that the standards presented in this table are derived from macro-level data specific to China and may not be applicable universally. When applying the rural construction land consolidation potential evaluation model, it is essential to adjust these data to reflect local conditions accurately.
The directional influence of each indicator on homestead consolidation activities is delineated based on its attributes. Fragstats 4.3 and ArcMap 10.7 software platforms are then utilized for the computation and visualization processes. Values for each evaluation unit are represented as either internal averages or weighted averages derived from zonal statistics of raster data. The entropy weight method is applied to determine indicator weights, while the TOPSIS method is employed to rank the potential levels. Ultimately, the potential levels are categorized into Grade I, II, and III potential villages, arranged in descending order.

2.2.4. Classification Method for the Linkage Model Between Rural Population–Land Decoupling and Construction Land Development Potential

Building on existing classification patterns, this study establishes the relationship between rural population–land decoupling and construction land potential [38]. The three subtypes of decoupling, T1, T2, and T3, are characterized by rural population growth outpacing construction land development, indicating an active expansion of rural areas. These are associated with Grade I and II construction land development potential, forming a “resource allocation” type, while also linking to Grade III development potential to create an “endogenous development” type.
The three subtypes of negative decoupling, T4, T5, and T6, are defined by construction land development surpassing population growth, leading to a population–land separation scenario with idle land. These subtypes are linked with Grade I and II construction land development potential, forming a “resource reserve” type, and with Grade III development potential, creating an “optimized development” type.
For both decline and expansion coupling, these are associated with Grade I construction land development potential, forming a “reserve replenishment” type. They are also linked with Grade II and III development potential, resulting in a “shrinkage control” type, as shown in Table 4.

2.2.5. Research Methods on Driving Mechanism of Rural Construction Land Change

To explore the driving mechanisms behind changes in rural construction land under the backdrop of “population–land separation” from the perspective of population mobility, the study employs the Kaya identity to establish a factor decomposition model. The Logarithmic Mean Divisia Index (LMDI) method is used to quantitatively measure the contribution of each driving factor [39].
  • Kaya Identity
The Kaya Identity is a formula used to analyze the factors contributing to greenhouse gas emissions, particularly carbon dioxide (CO2) emissions. Proposed by Japanese economist Yoichi Kaya, this formula decomposes a country or region’s CO2 emissions into four interconnected factors: population, GDP per capita, energy intensity, and carbon intensity [40]. It has also been applied to study the driving forces behind changes in rural residential land use under the effects of urbanization [17].
Recognizing that not all villages are immune to population loss, the study divides 224 villages into two groups: those with net population inflow and those with net population outflow. It aims to reflect the driving mechanisms of population–land interaction under different population migration scenarios.
By applying the Kaya Identity, the driving factors for changes in rural construction land area are decomposed into land-use efficiency (I), population structure (S), population mobility (F), and total population (P). The formula is as follows [39]:
L a n d = L a n d P o p r × P o p r P o p f × P o p f P o p t × P o p t = I · S · F · P
where L a n d represents the change in construction land area, I ( L a n d / P o p r ) denotes land-use efficiency, S ( P o p r / P o p f ) is the population structure, F ( P o p f / P o p t ) represents the proportion of the floating population, and P ( P o p t ) is the total rural population. Here, L a n d is the construction land area of each village, P o p r is the resident population, P o p f is the floating population, and P o p t is the total rural population.
2.
The Logarithmic Mean Divisia Index (LMDI)
The Logarithmic Mean Divisia Index (LMDI) method is a technique used in energy economics to decompose changes in energy consumption or carbon dioxide emissions. It is considered one of the most accurate decomposition methods because it meets the requirements of consistency, additivity, and theoretical completeness. The LMDI method is widely applied in energy policy analysis and environmental impact assessment [41].
E = E I + E S + E F + E P
E I = L a n d 2020 L a n d 2010 ln L a n d 2020 ln L a n d 2010 × ln ( L a n d 2020 P o p r 2020 / L a n d 2010 P o p r 2010 )
E S = L a n d 2020 L a n d 2010 ln L a n d 2020 ln L a n d 2010 × ln ( P o p r 2020 P o p f 2020 / P o p r 2010 P o p f 2010 )
E F = L a n d 2020 L a n d 2010 ln L a n d 2020 ln L a n d 2010 × ln ( P o p f 2020 P o p t 2020 / P o p f 2010 P o p t 2010 )
E p = L a n d 2020 L a n d 2010 ln L a n d 2020 ln L a n d 2010 × ln ( P o p t 2020 P o p t 2010 )
where E reflects the change in rural construction land area; E I represents the land-use efficiency factor indicating changes in per capita construction land area; E S is the population structure factor reflecting the change in population composition; E F is the population mobility factor indicating the change in the proportion of the floating population; and E P is the total population factor reflecting changes in total population [42]. L a n d 2020 and L a n d 2010 are the construction land areas of villages and towns in 2010 and 2020, respectively. P o p t 2010 and P o p t 2020 represent the resident populations of each village in 2010 and 2020, respectively. P o p r 2010 and P o p r 2020 denote the registered populations of each village in 2010 and 2020, respectively, while P o p f 2010 and P o p f 2020 indicate the floating populations of each village in 2010 and 2020, respectively.
This approach is suitable for our study as it allows for a detailed and systematic analysis of the factors influencing rural construction land changes. By breaking down the complex interactions between population dynamics and land use, the Kaya Identity and LMDI methods provide a robust framework to quantify the specific contributions of various factors, such as population structure and mobility. This level of granularity is essential for accurately capturing the nuanced impacts of population–land separation [43], thereby enhancing the scientific rigor and policy relevance of our findings.

3. Results

3.1. Spatiotemporal Changes in Rural Population and Construction Land in Yanggao County from 2010 to 2020

At the county level, Yanggao County experienced a continuous decline in its rural population from 2010 to 2020. The rural population decreased from 239,300 in 2010 to 189,100 in 2020, representing a total reduction of 50,200 people, with an average annual decrease of 2.10%. The rate of population change varied over different periods. From 2010 to 2015, the population showed a slow decline. However, from 2015 to 2020, due to the introduction of China’s new type of urbanization concept, the rural population in Yanggao County experienced a rapid decline, with an average annual decrease of 4.7%. New-type urbanization is characterized by the coordinated development of urban and rural areas, urban–rural integration, interaction between industry and cities, resource conservation, ecological livability, and harmonious development. This concept plays a significant and positive role in promoting the high-quality development of urbanization in China.
During the same period, the area of rural construction land in Yanggao County consistently increased. The construction land area expanded from 4793.75 hectares in 2010 to 5245.05 hectares in 2020, marking a total increase of 451.30 hectares, with an average annual growth of 50.14 hectares, or 1.05%. Between 2010 and 2016, the growth in construction land area was relatively slow, with an average annual increase of 0.37%. However, from 2016 to 2020, the growth rate accelerated significantly, with an average annual increase of 2.34%, as shown in Figure 2.
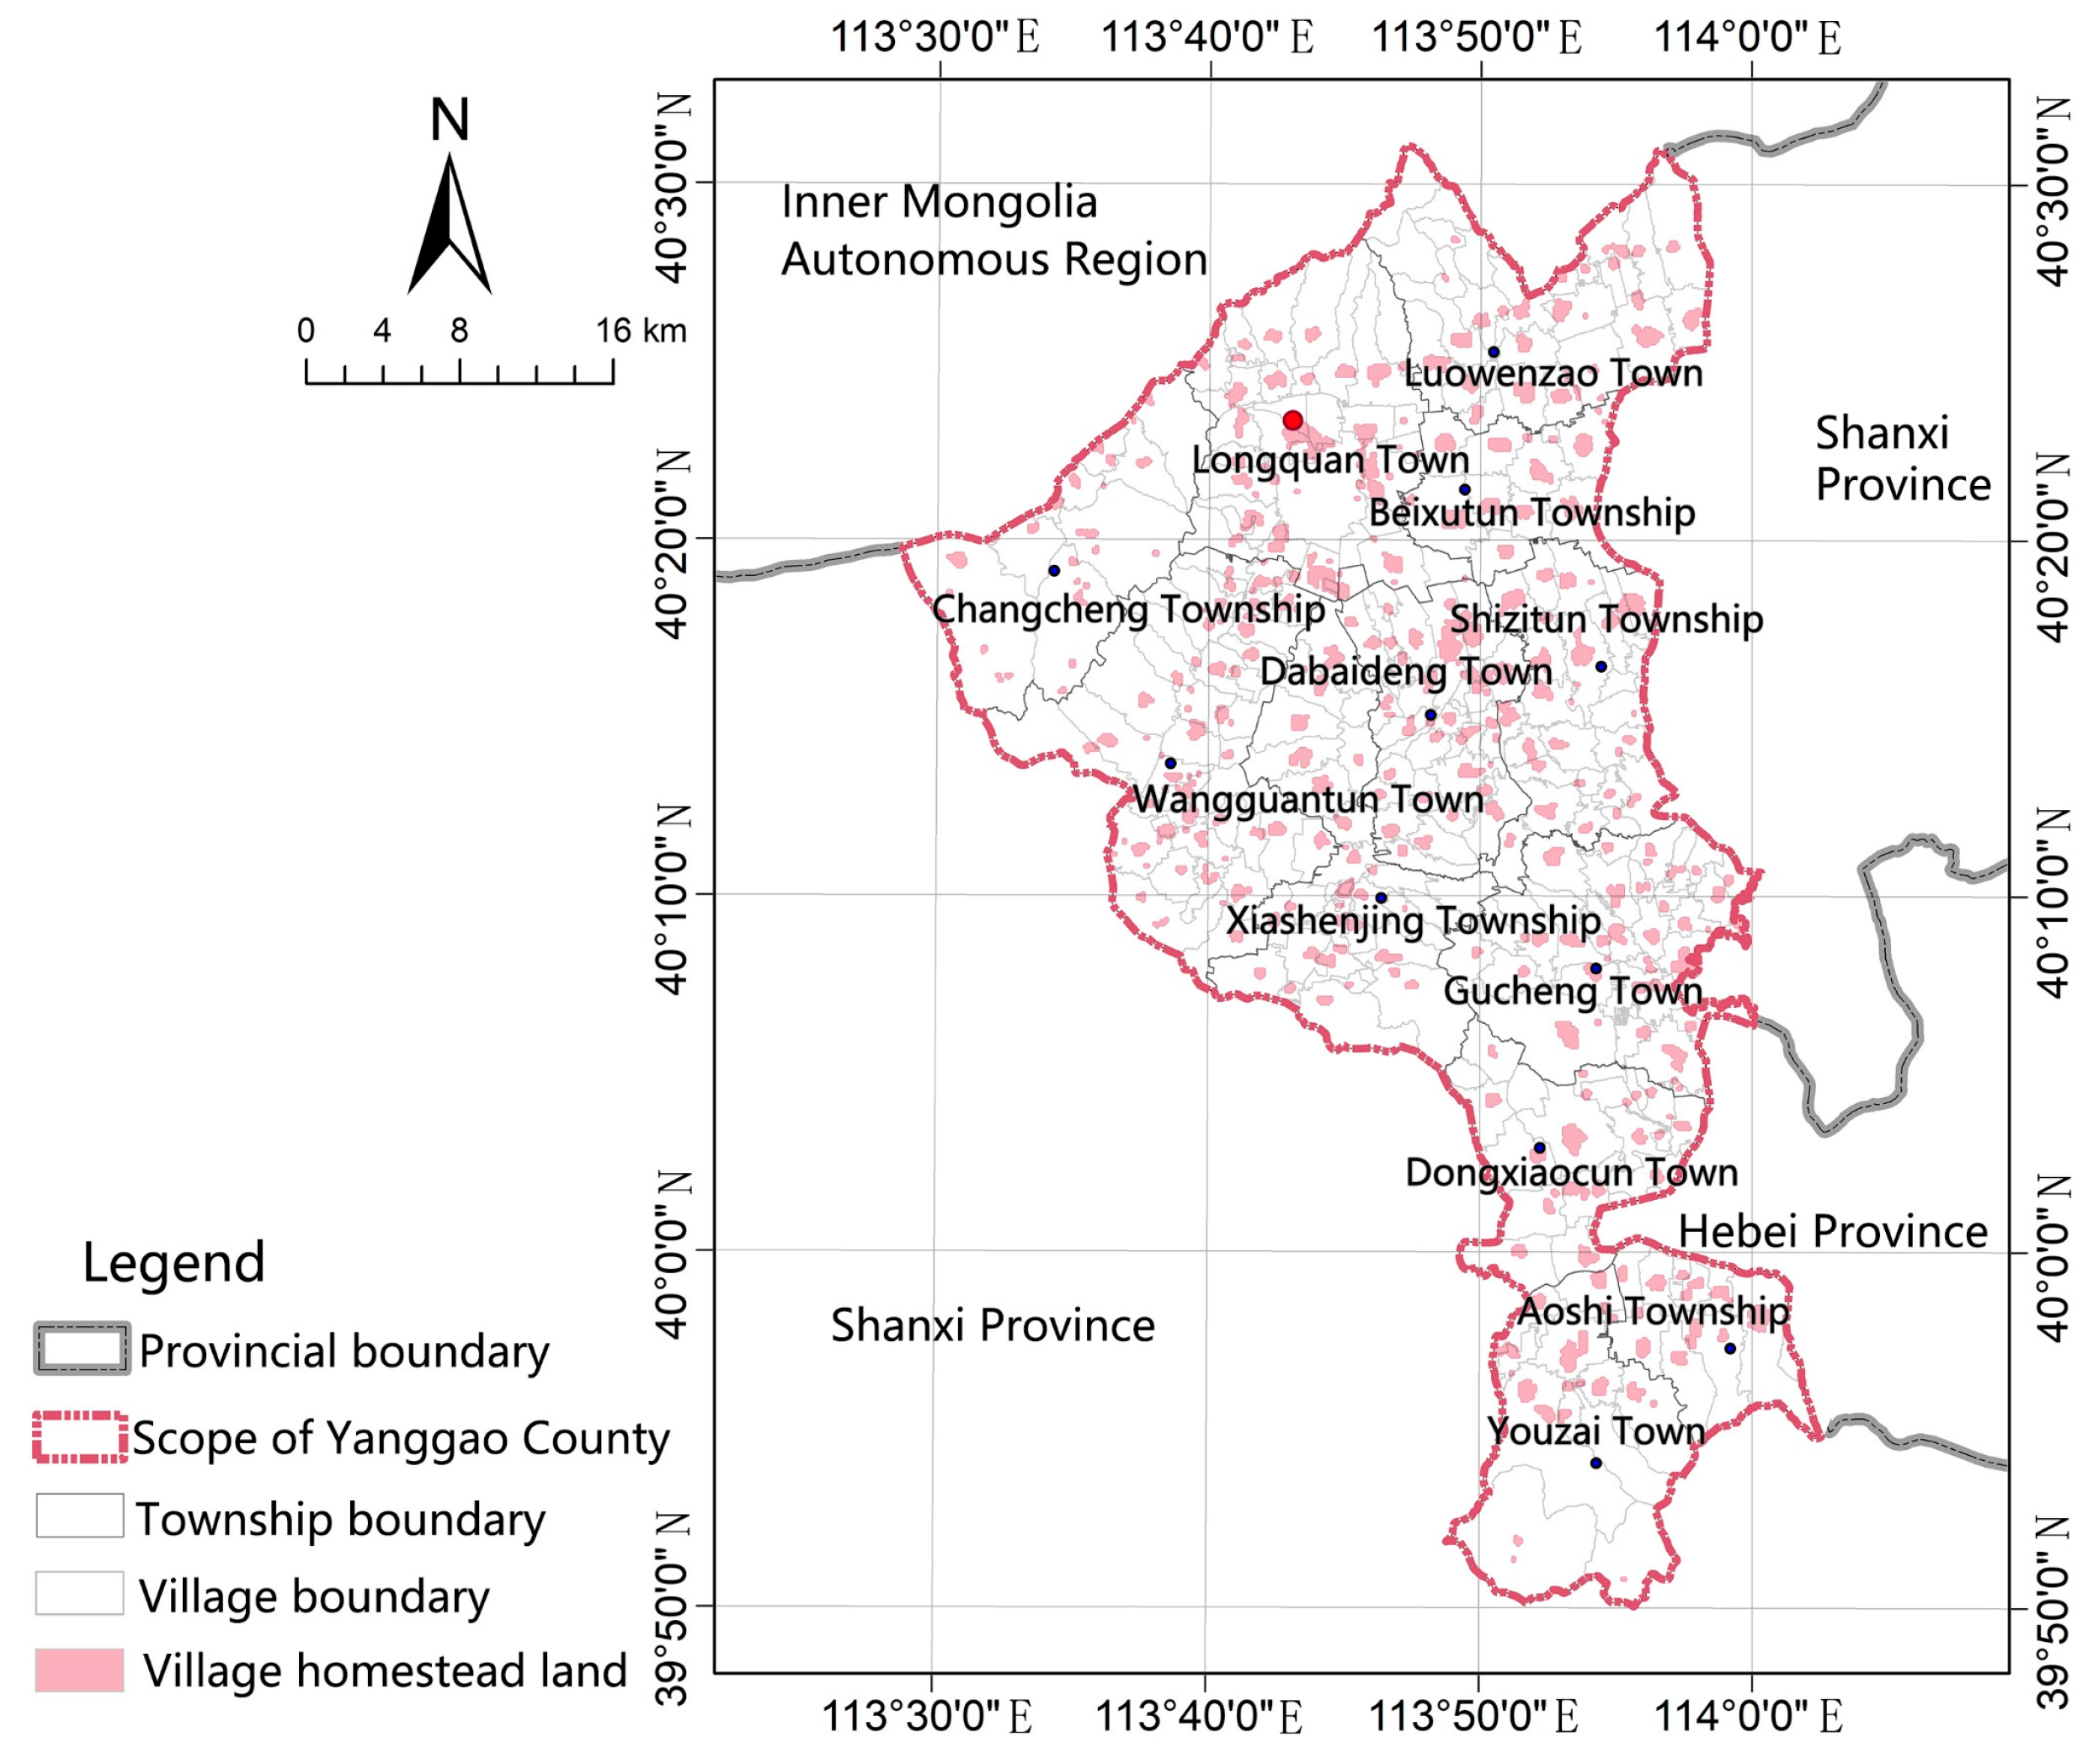
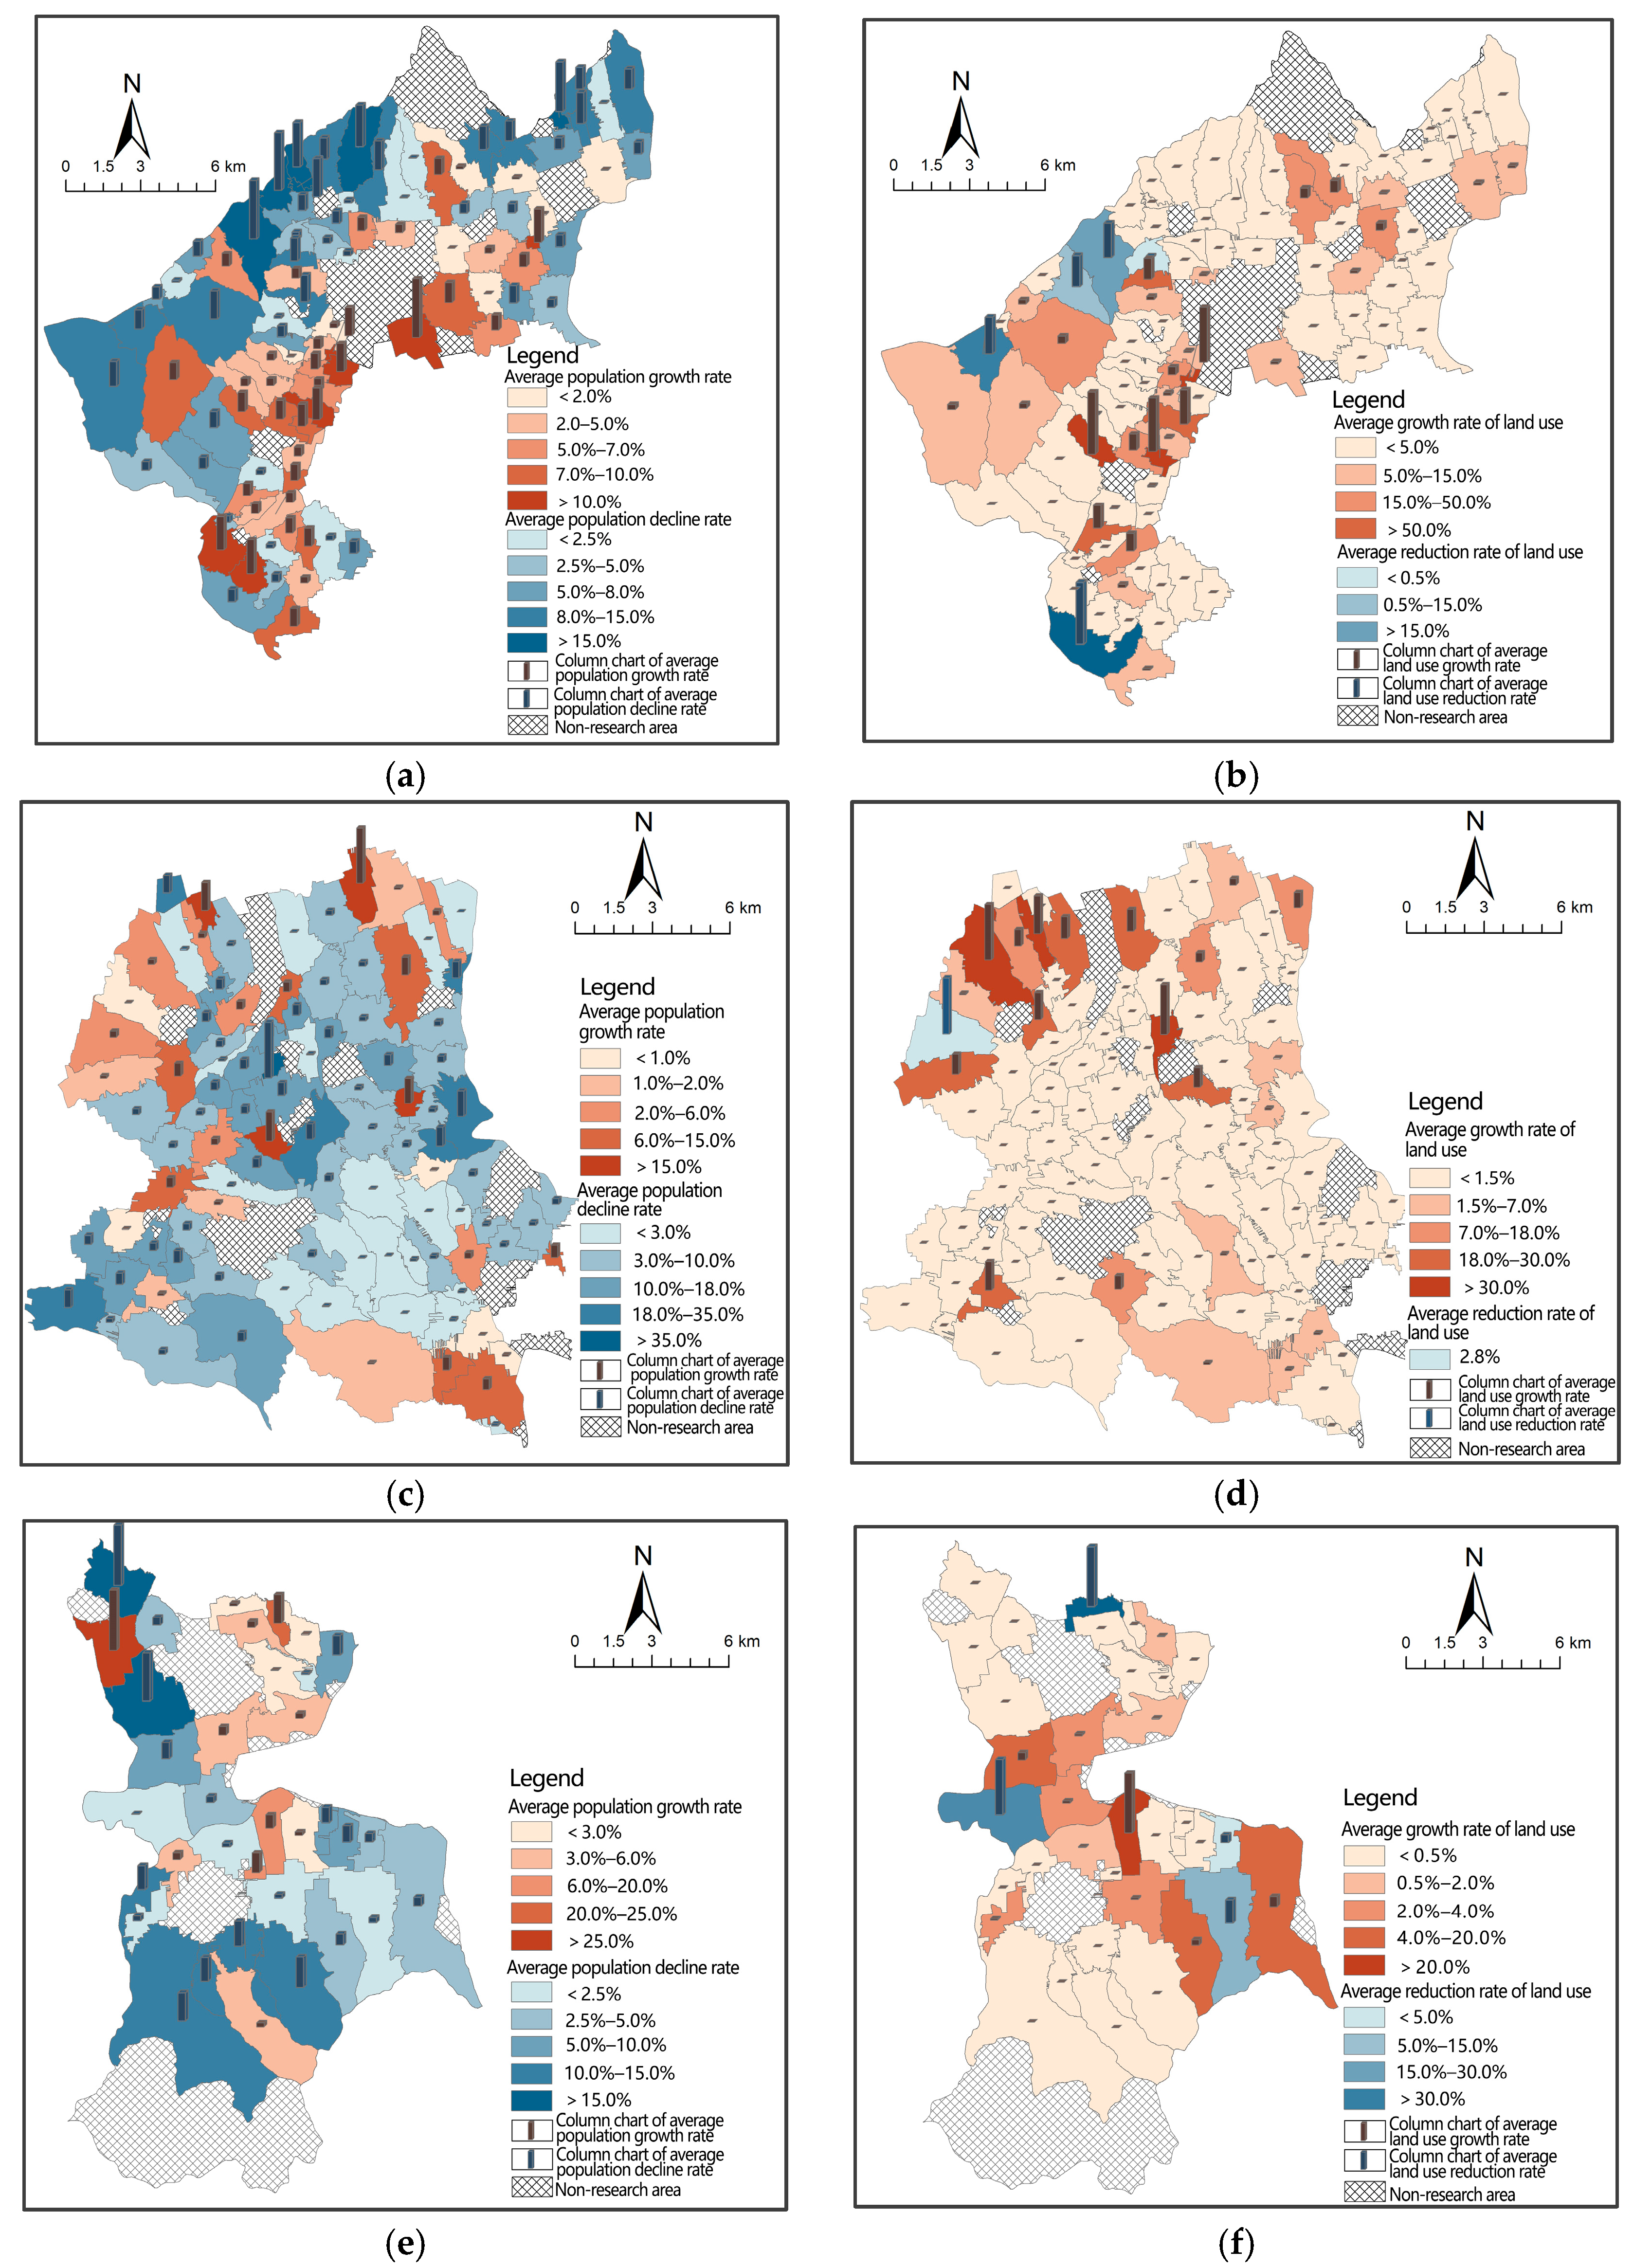
At the rural scale, the study divides Yanggao County into three regions: northern, central, and southern, as illustrated in Figure 3. Overall, from 2010 to 2020, 140 (62.5%) villages experienced a population decline, while 214 (95.54%) villages saw an increase in construction land. In the northern region, which includes Longquan Town, Luowenzao Town, Changcheng Township, Beixutun Township, and Wangguantun Town, there was significant variability in village population changes. The number of villages with population decreases was roughly equal to those with population increases, with four villages showing a marked reduction in construction land. In contrast, Longquan Town experienced substantial growth in rural construction land. The northern towns exhibited pronounced spatial heterogeneity in population–land dynamics. In the central region, which encompasses Xiashenjing Township, Dabaideng Town, Shizitun Township, and Gucheng Town, most villages faced population declines, but construction land generally increased. The closer a village was to Longquan Town, the county seat, the greater the increase in construction land. In the southern region, which includes Youzai Town, Aoshi Township, and Dongxiaocun Town, three villages experienced significant reductions in construction land. The southern part of Yanggao County exhibited a general trend of gradual population decline and minimal increases in construction land. Overall, from 2010 to 2020, Yanggao County’s rural population consistently decreased while construction land was inefficiently used, characterized by extensive land utilization.
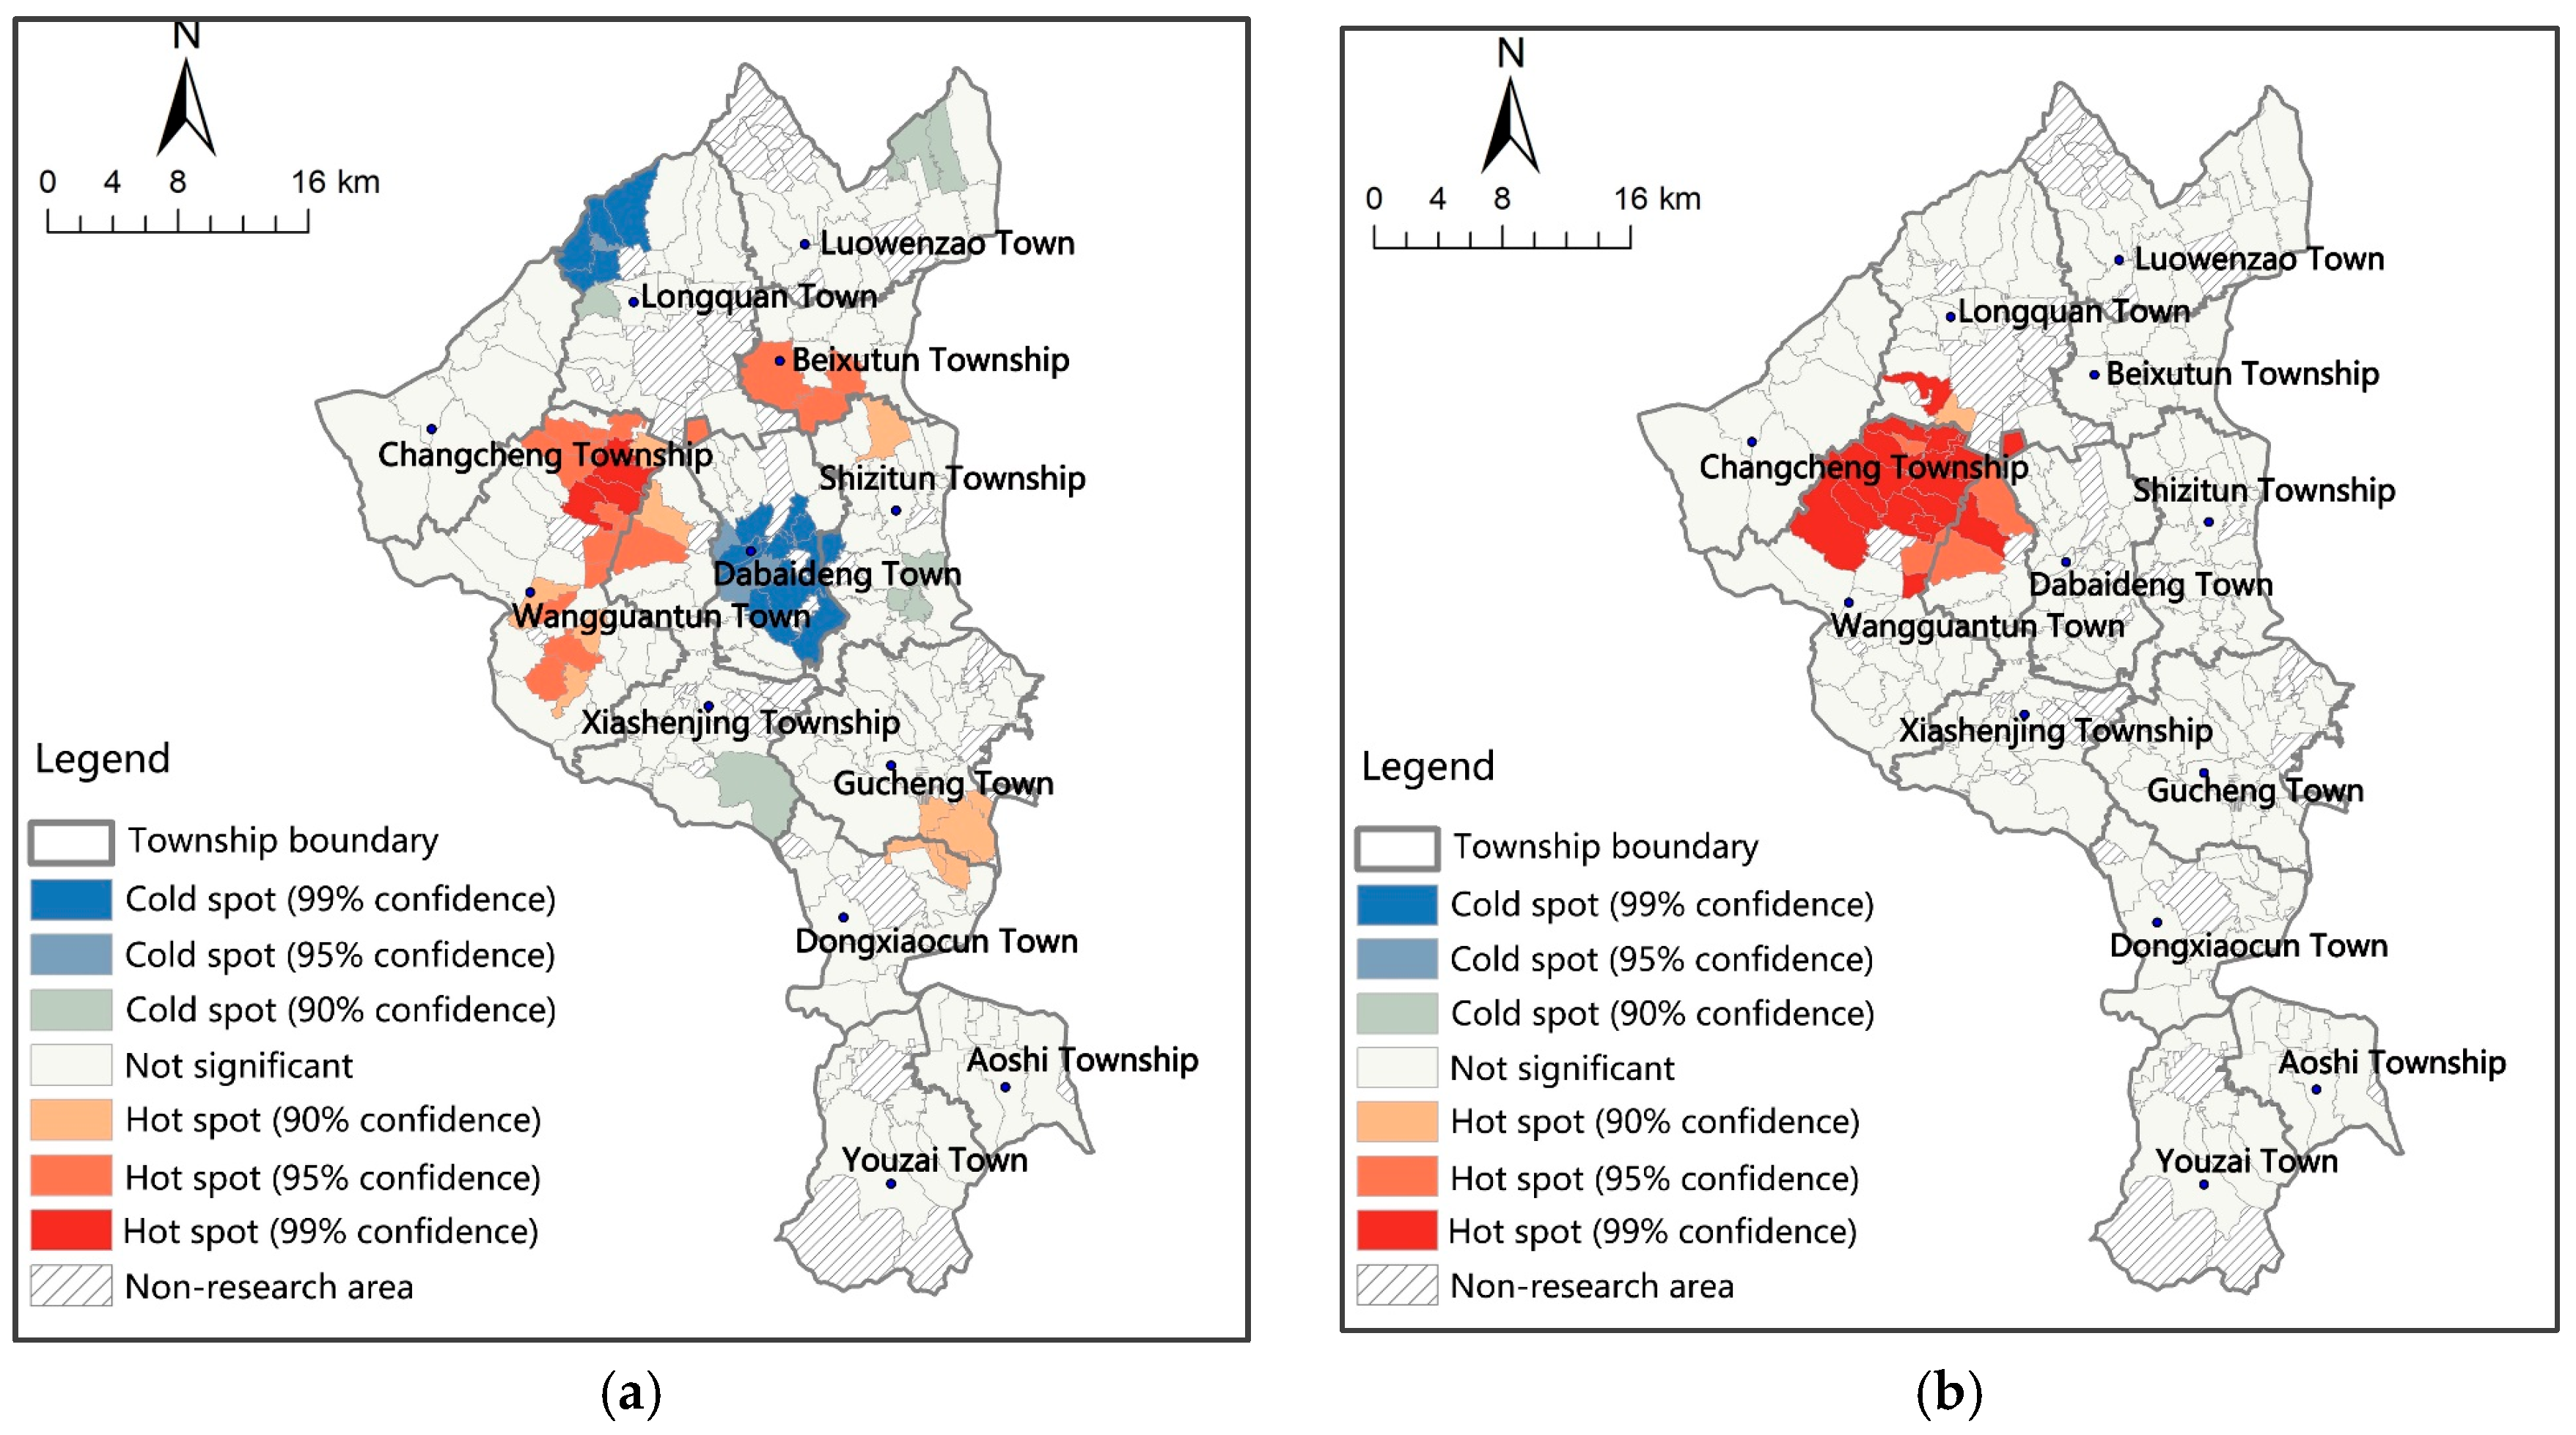
From the spatial analysis of hotspots and coldspots in rural population–land changes in Yanggao County (Figure 4), it is evident that these changes exhibit a typical pattern of high-value and low-value clustering, with noticeable local spatial aggregation effects. For villages excluding town center villages and non-agricultural communities, population change hotspots are primarily located around Longquan Town, in Wangguantun Town, Beixutun Township, and the southern part of Gucheng Town. In these areas, rural populations have increased rather than decreased, indicating a counter-urbanization phenomenon typical in the mid-to-late stages of urban development.
Coldspot areas are concentrated in Dabaideng Town, which is undergoing rapid urbanization, resulting in significant rural population loss. Corresponding to the population change hotspots, the hotspots for changes in rural construction land are also concentrated around Longquan Town, particularly in Wangguantun Town, forming a certain degree of spatial clustering. There are no significant coldspot areas for construction land change, aligning with the overall trend of expansion in rural construction land area in Yanggao County, with only a few areas experiencing reductions.
The evolving patterns of rural population–land relationships in Yanggao County highlight the imbalanced development across different regions during the process of new urbanization. This imbalance is characterized by urban expansion near the city, stagnation in the suburban areas, and degradation at the periphery. Longquan Town in the north, serving as the county seat and regional economic core, attracts rural populations through employment opportunities and public services, leading to unidirectional migration [44]. However, the traditional, one-size-fits-all approach to land management leads to the continued expansion of construction land in areas experiencing population decline. This approach is driven by outdated planning models that fail to account for the current dynamics of population movement, causing a mismatch between land allocation and actual demand. For instance, Luowenzao Town sees an average annual rural population decrease of 2.54%, while rural construction land increases by 3.01% annually, resulting in a “population decline, land expansion” phenomenon [45]. Villages closer to the county seat experience stronger influence from the central town, with construction land expansion driven by infrastructure investments (an annual growth of 0.8%). In contrast, remote villages face ecological constraints, such as limited arable land due to steep terrain, fragile ecosystems prone to erosion, and environmental protection regulations that restrict land development. These factors, combined with a lack of economic vitality, lead to a gradual decline in rural populations and more restrictive land-use policies. This creates a “center-periphery” contraction gradient, where areas closer to the county seat thrive, while more remote areas experience stagnation or decline. The dynamics within Yanggao County’s rural population–land system result from the interplay of three key forces: the push effect of urban siphoning, the pull effect of land inertia, and the resistance due to uniform institutional frameworks [46]. The “push effect of urban siphoning” refers to the migration of rural populations toward urban centers, driven by the availability of better employment opportunities, infrastructure, and public services. This movement is encouraged by the increasing centralization of economic activities and the growth of urban areas. The “pull effect of land inertia” is the tendency for rural areas to continue expanding construction land even when population growth has slowed or reversed. This is a result of outdated land management practices that do not account for shifting demographic patterns, leading to unnecessary land allocation in areas where demand for land has diminished. Finally, “resistance due to uniform institutional frameworks” refers to the rigid, one-size-fits-all institutional policies that govern land use across both urban and rural areas. These policies often fail to adapt to the specific needs of different regions, restricting more flexible and targeted land management approaches that could better address local conditions.

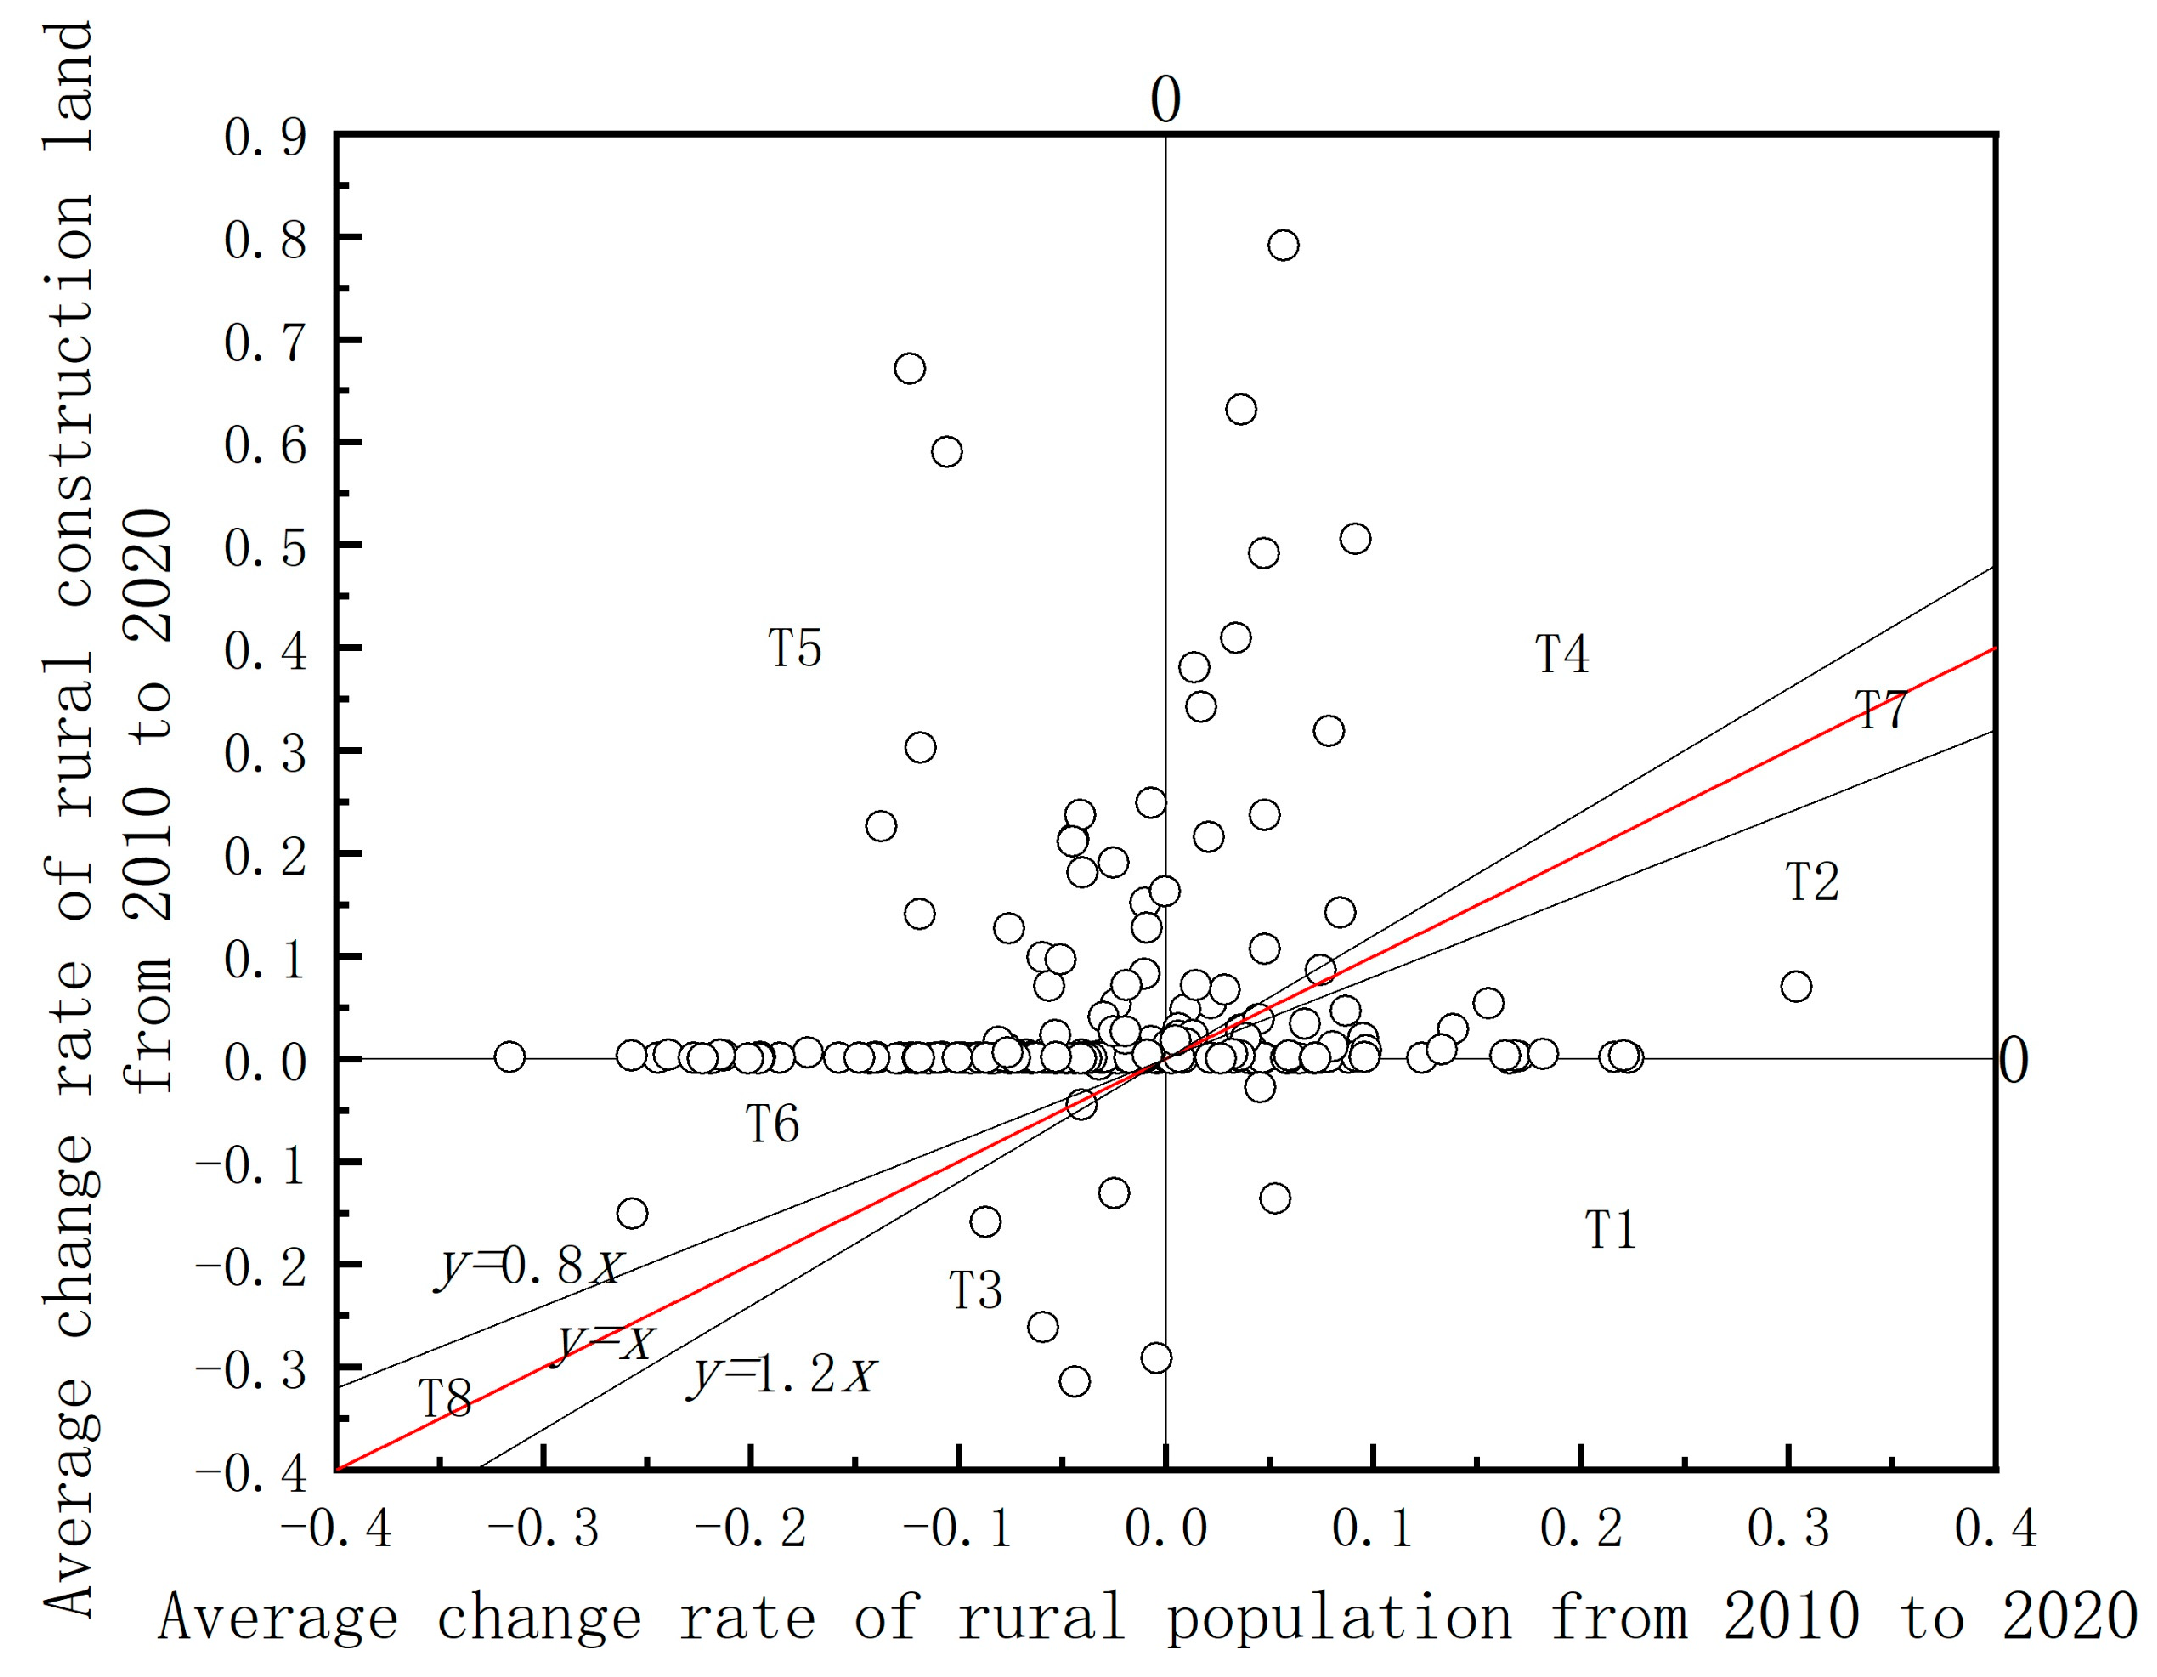
3.2. Rural Population–Land Decoupling Results

To accurately understand the rural population–land relationship, this study calculates the decoupling coefficients and examines the population–land dynamics of 224 villages in Yanggao County. The results, as shown in Table 5, indicate that from 2010 to 2020, the decoupling relationship between rural construction land and rural population in Yanggao County exhibited various types. These include strong decoupling, weak decoupling, decline decoupling, expansive negative decoupling, strong negative decoupling, weak negative decoupling, expansion coupling, and decline coupling. These eight modes reflect the complex and dynamic relationship between rural population and construction land.
Overall, the decoupling coefficient between rural population and construction land in Yanggao County is −2.82, indicating a strong negative decoupling. This suggests that the rural resident population is decreasing at a higher rate than the expansion of construction land, reflecting a significant “population–land separation” phenomenon. The allocation mechanism, which is based on registered household population, is disconnected from the dynamic reality of population migration. This disjunction results in the inability to reclaim idle homesteads and the continued allocation of new construction land, thereby causing a spatial lock-in effect. In other words, the existing land allocation system fails to adapt to the changing population distribution, leading to the inefficient use of land. Moreover, this trend is exacerbated by the reliance on land finance and the lagging management system of homestead land. As a result, areas with declining populations are unable to repurpose or reallocate unused land, while new land continues to be allocated in areas with less demand, reinforcing patterns of underutilized land and limiting spatial flexibility.
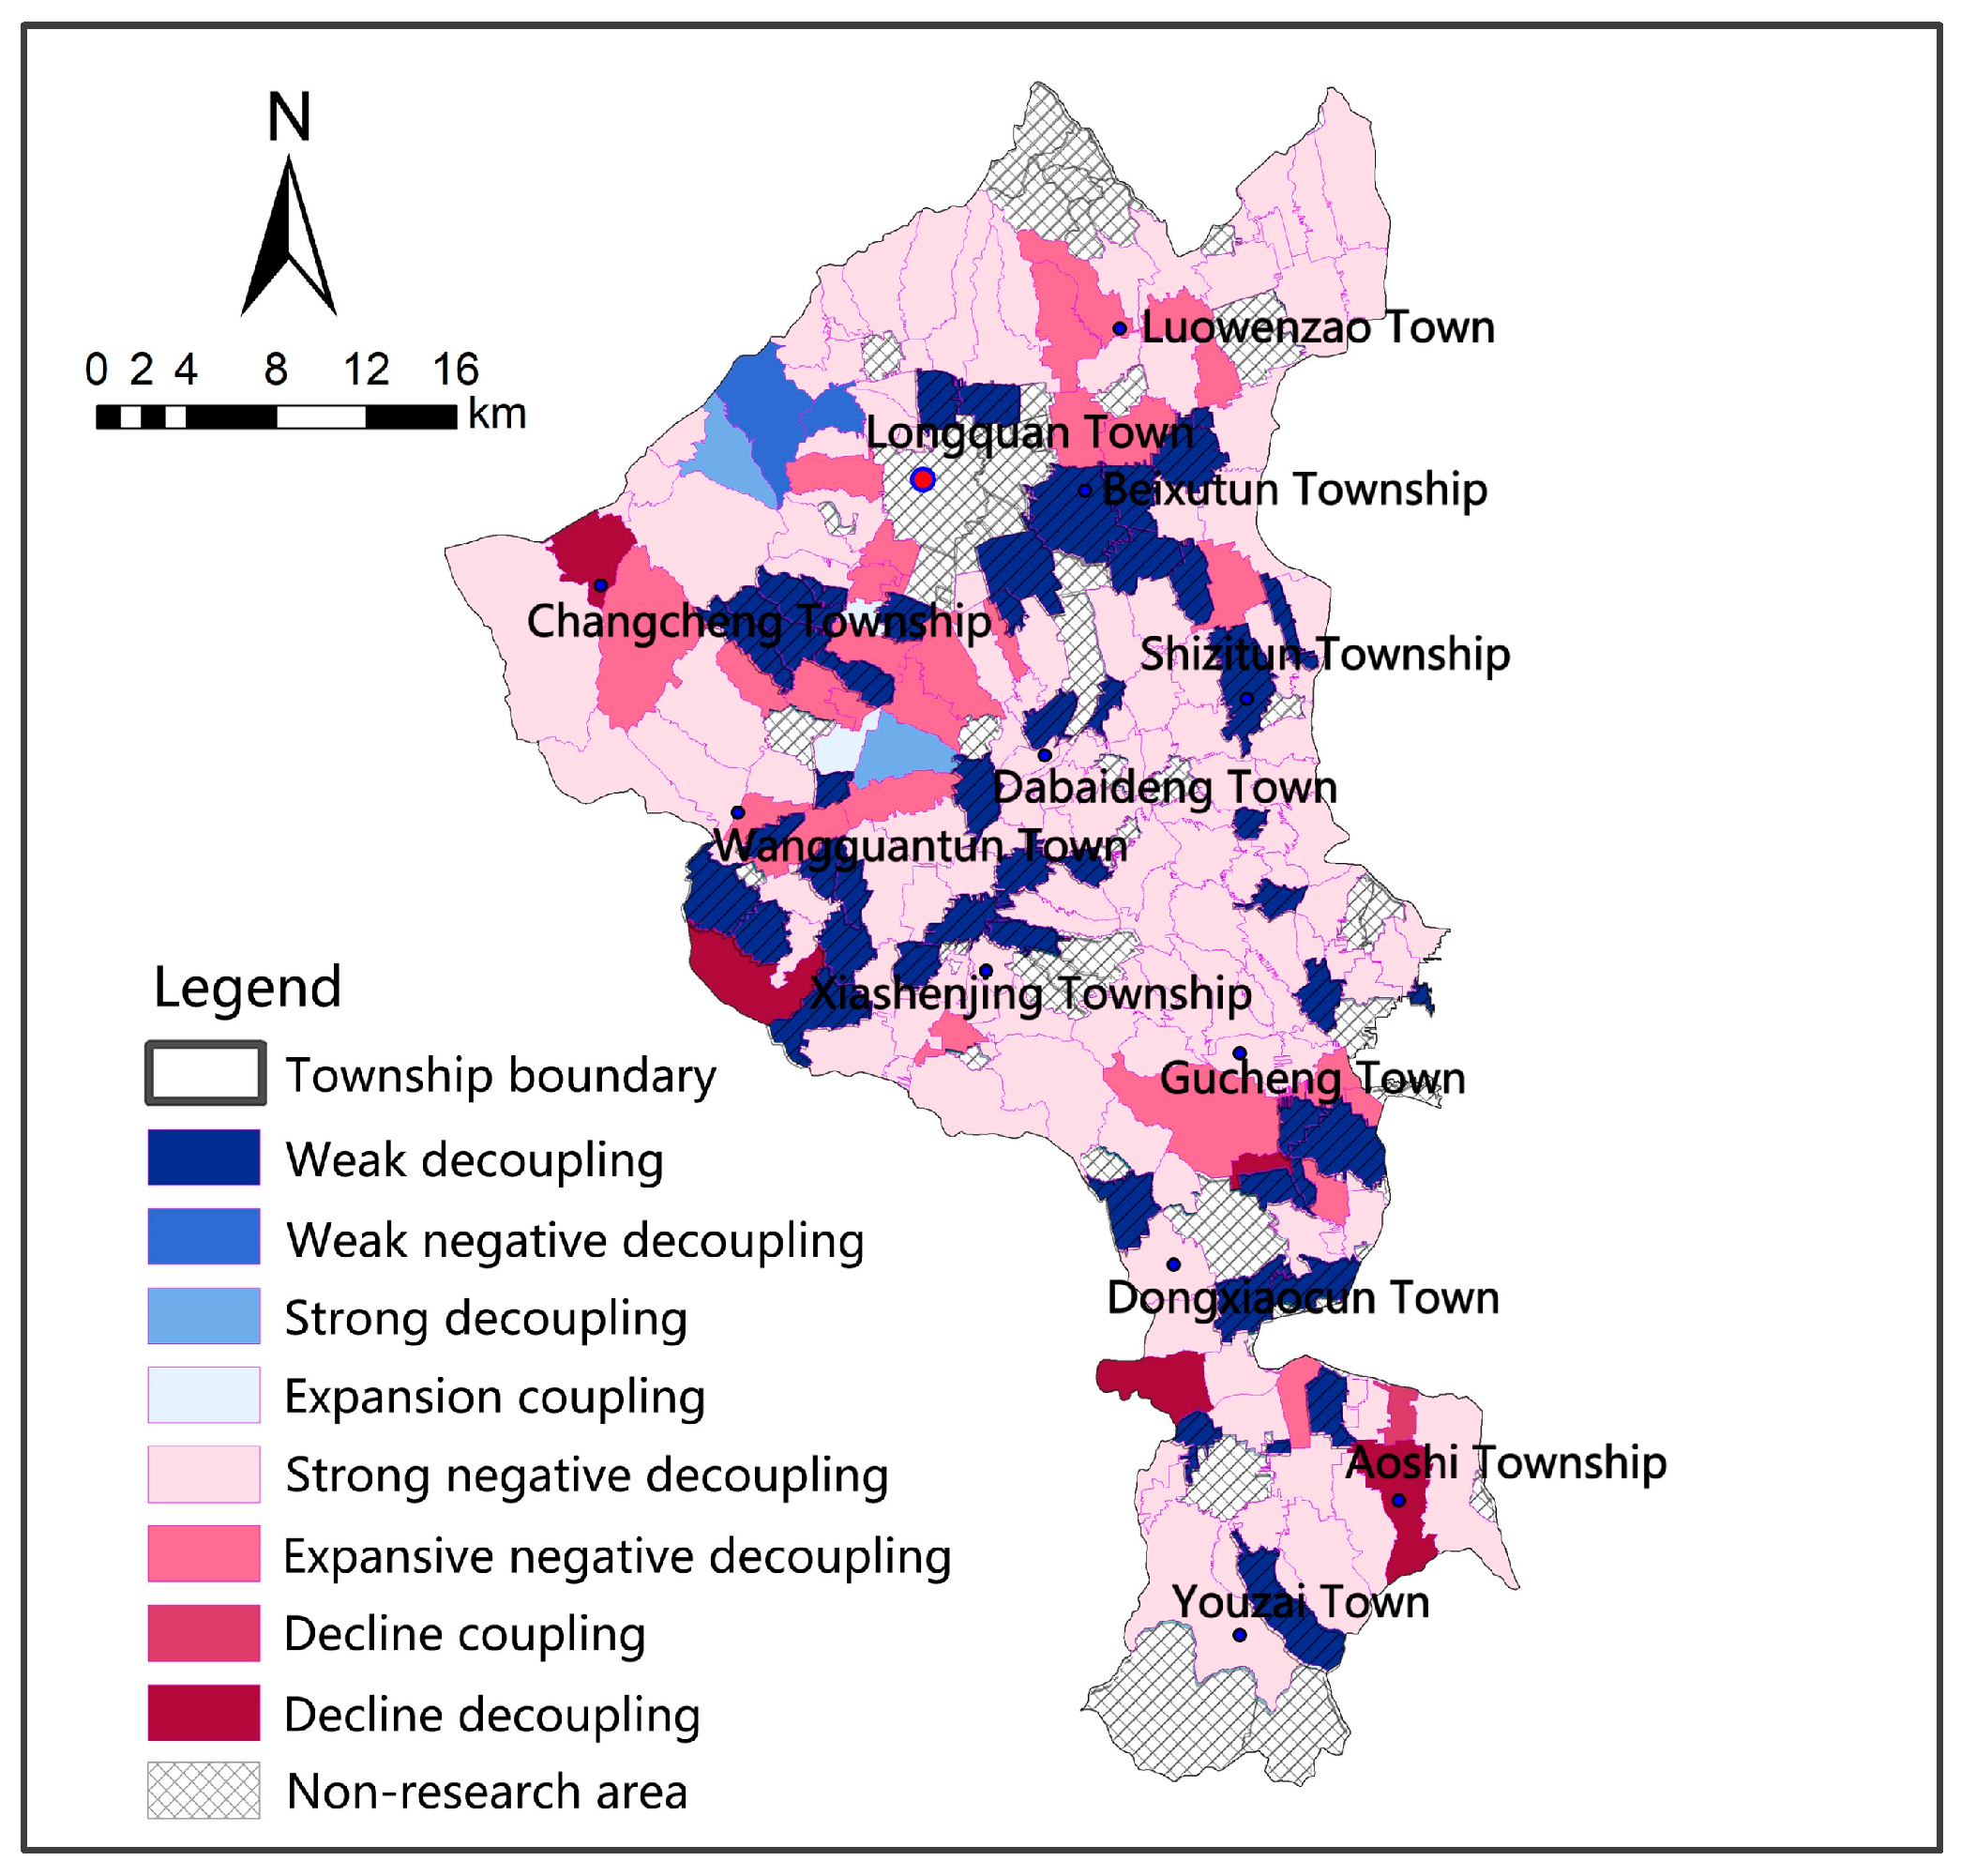
At the village level, as shown in Figure 5 and Figure 6, only two villages exhibit strong decoupling, where population growth is accompanied by a reduction in construction land. Five villages show decline decoupling, characterized by simultaneous decreases in both population and construction land, with construction land decreasing more rapidly. Two villages fall into the weak negative decoupling category, where both population and construction land decrease, but the population decreases faster. Another two villages display expansion coupling, where both population and construction land increase in tandem. Finally, one village demonstrates decline coupling, with concurrent decreases in both population and construction land. Collectively, these five types account for only 5.36% of the total number of villages.
Among the remaining 212 villages, 49 (21.88%) villages fall into the weak decoupling category, where both population and construction land increase, but population growth outpaces land expansion. Expansive negative decoupling accounts for 28 (12.50%) villages, characterized by simultaneous increases in population and construction land, with land expansion occurring more rapidly. These two types of villages are predominantly located within the county seat’s radiating area (Longquan Town). Their land expansion is driven by short-term population return or infrastructure investments. However, the inadequate provision of public services, such as healthcare, education, public transportation, and utilities, undermines the sustainability of this growth pattern. The majority of villages, 135 (60.27%) villages, exhibit strong negative decoupling, where there is a significant population decline alongside a continuous expansion of construction land. This trend is detrimental to the concentrated development of rural construction land. An in-depth analysis reveals that this phenomenon is driven by several key mechanisms. Firstly, the dependence on land finance motivates local governments to prioritize land sales for revenue, leading to continuous construction land expansion despite population decline. Secondly, the lagging management system of homestead land results in inefficient reclamation and repurposing of idle homesteads. Additionally, the lack of effective land-use planning and regulation exacerbates the issue, as current policies may not adequately address the mismatch between land allocation and demographic changes. Lastly, the inadequate infrastructure and services in rural areas can discourage population retention and attract investment, further contributing to the imbalance between population and construction land use. Addressing these root causes through comprehensive land finance reform, improved homestead land management, enhanced land-use planning, and investment in rural infrastructure is crucial for fostering sustainable rural development.

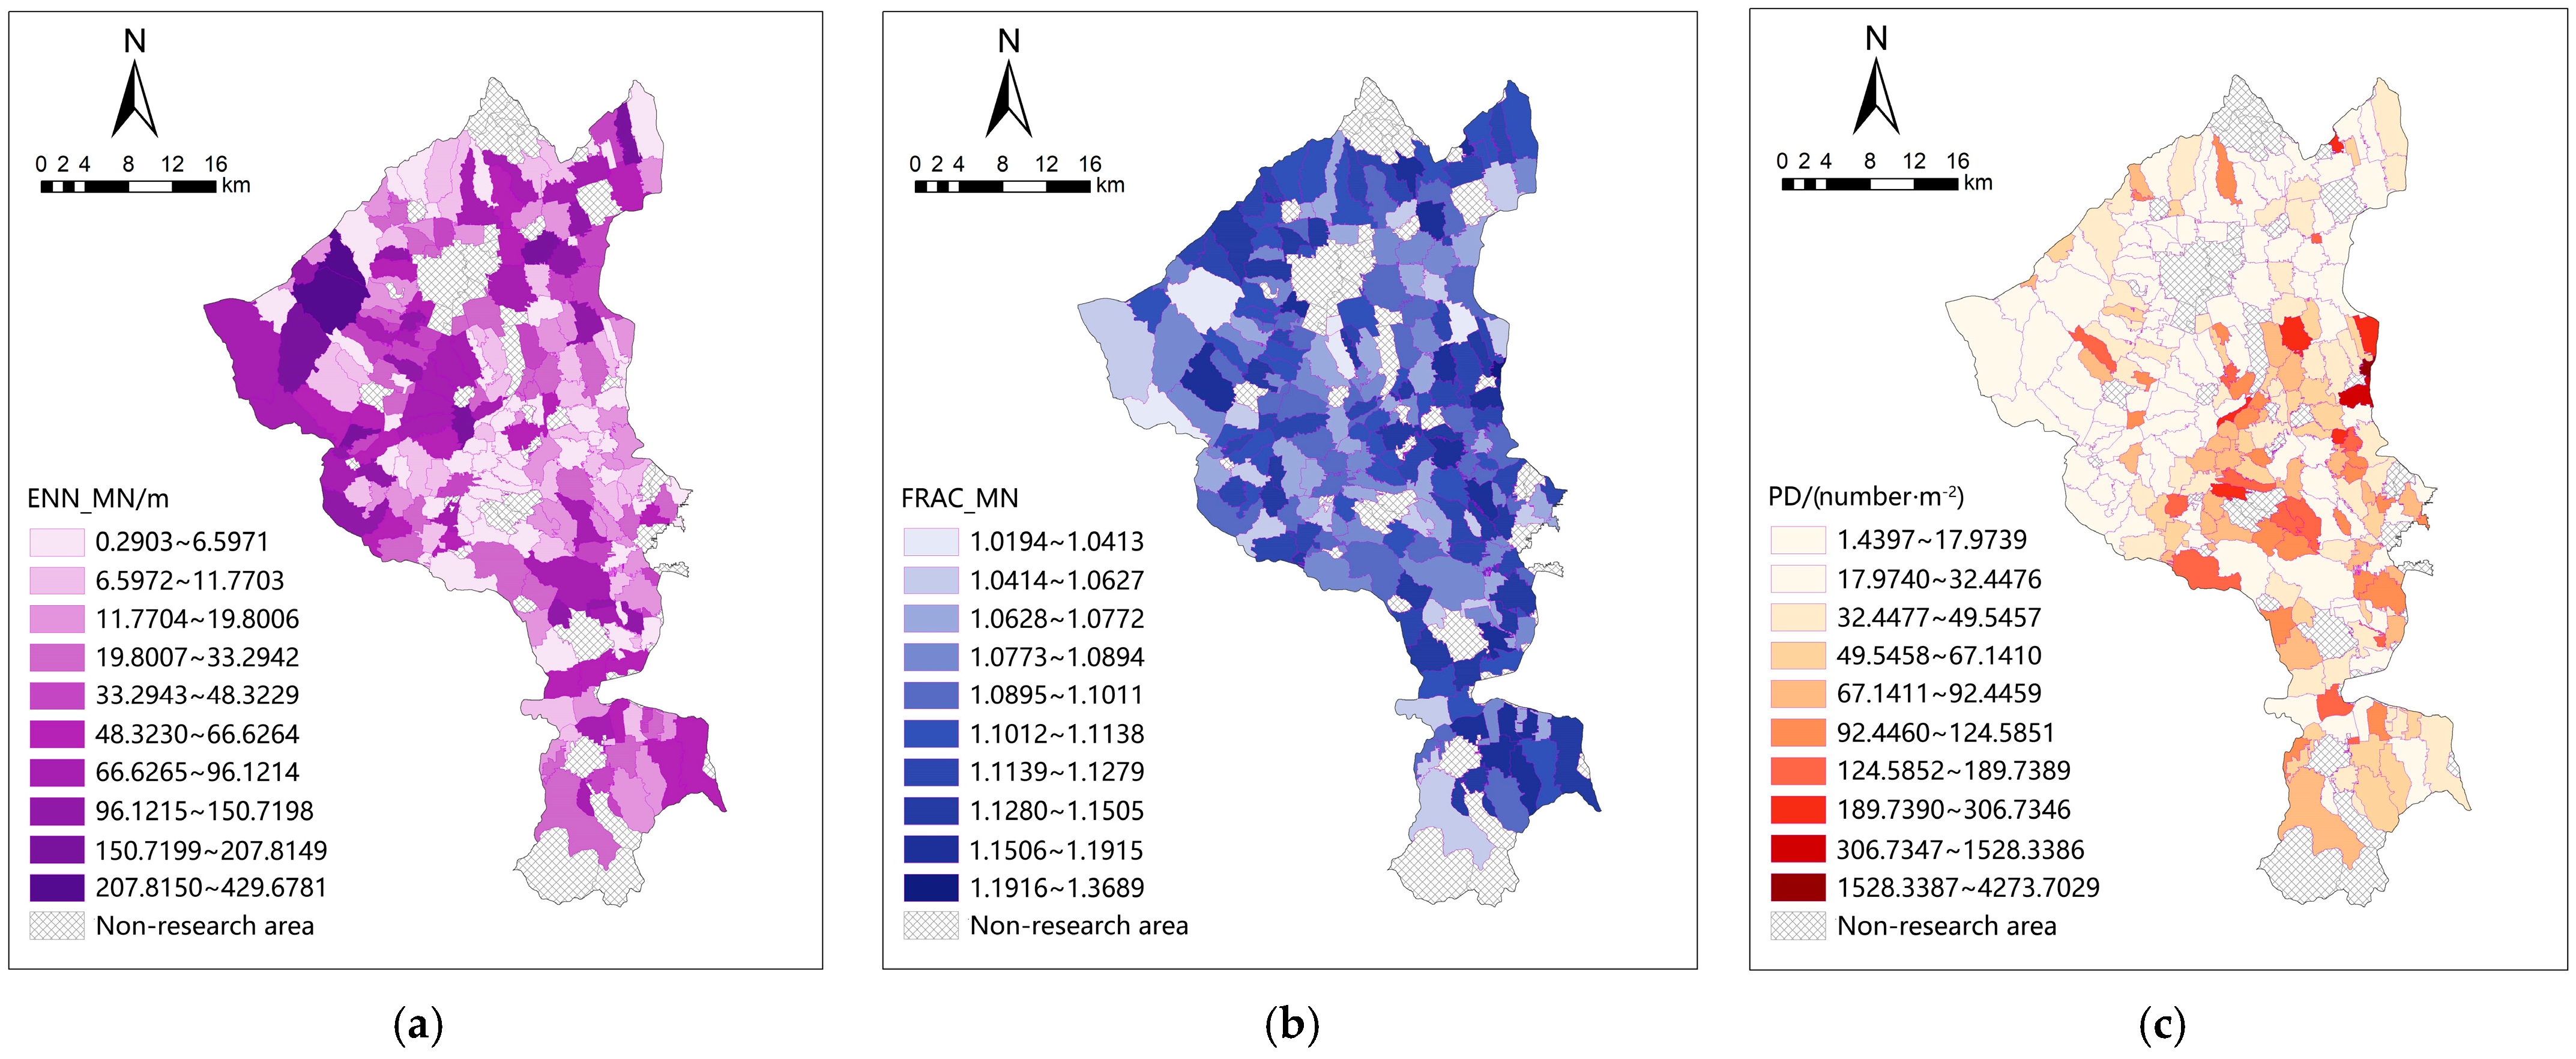
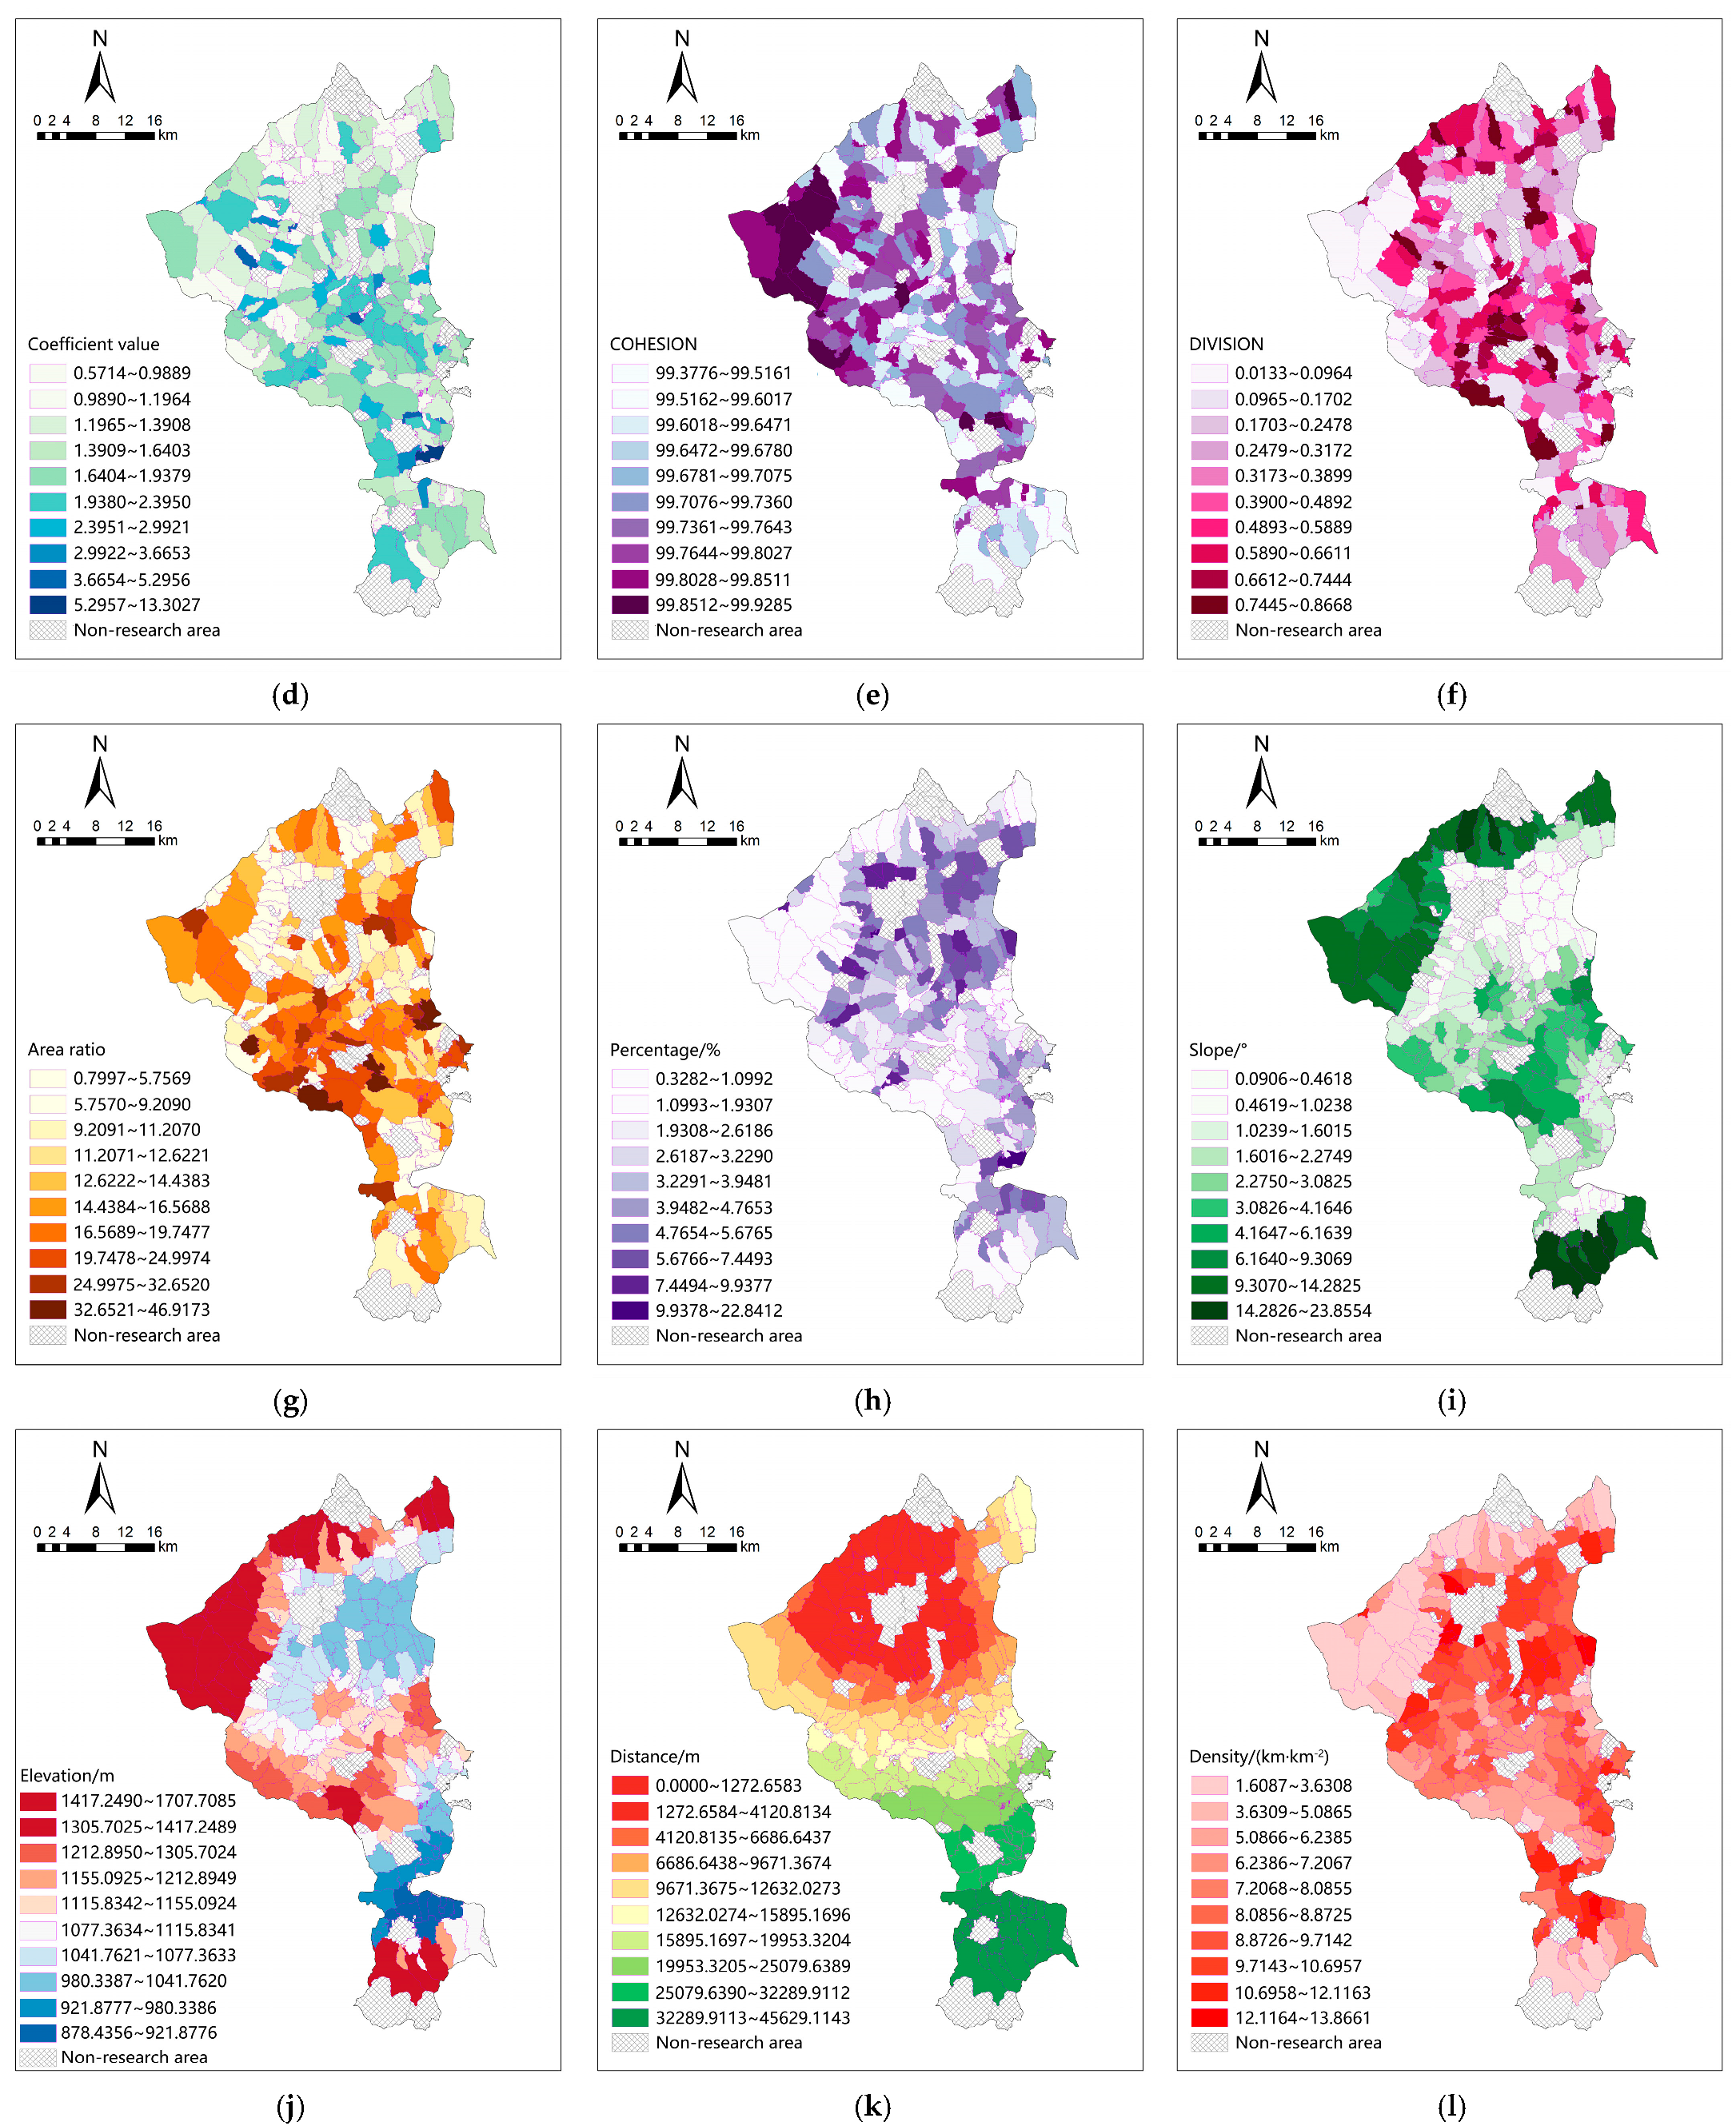
3.3. Evaluation Results of Rural Construction Land Development Potential

Initially, the indicator values for each unit are calculated using the formulas from Table 2, and these values are visualized by categorizing them into 10 levels using the natural break classification method, as illustrated in Figure 7.
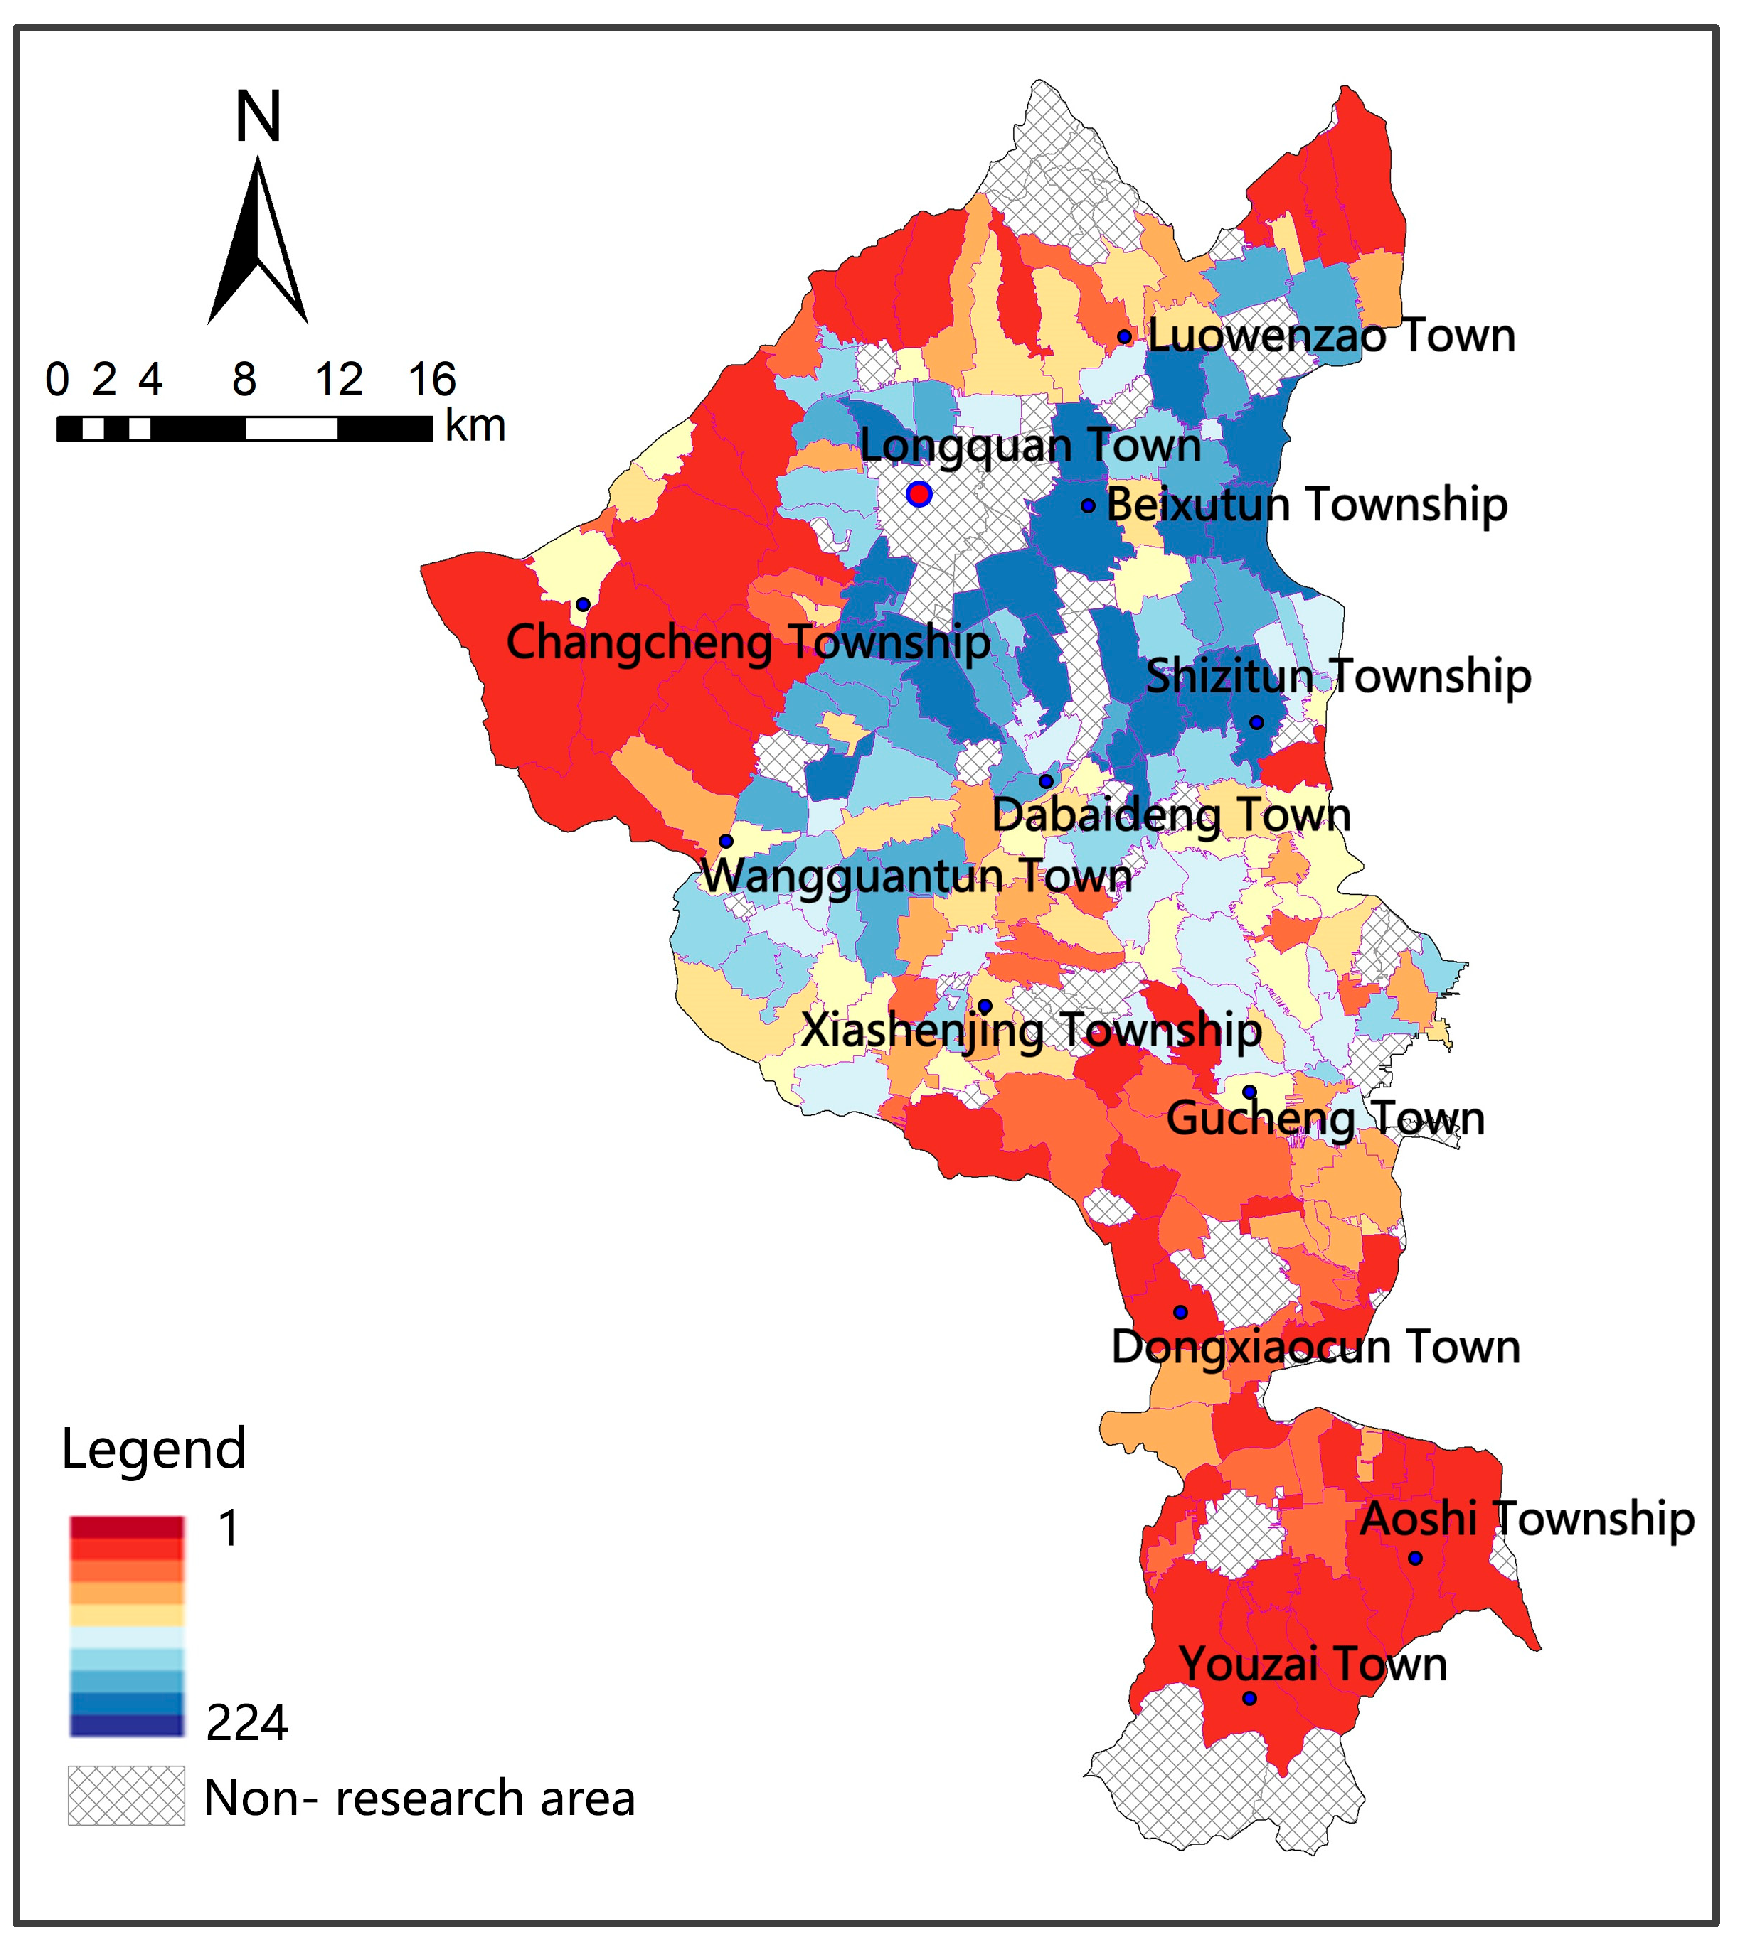
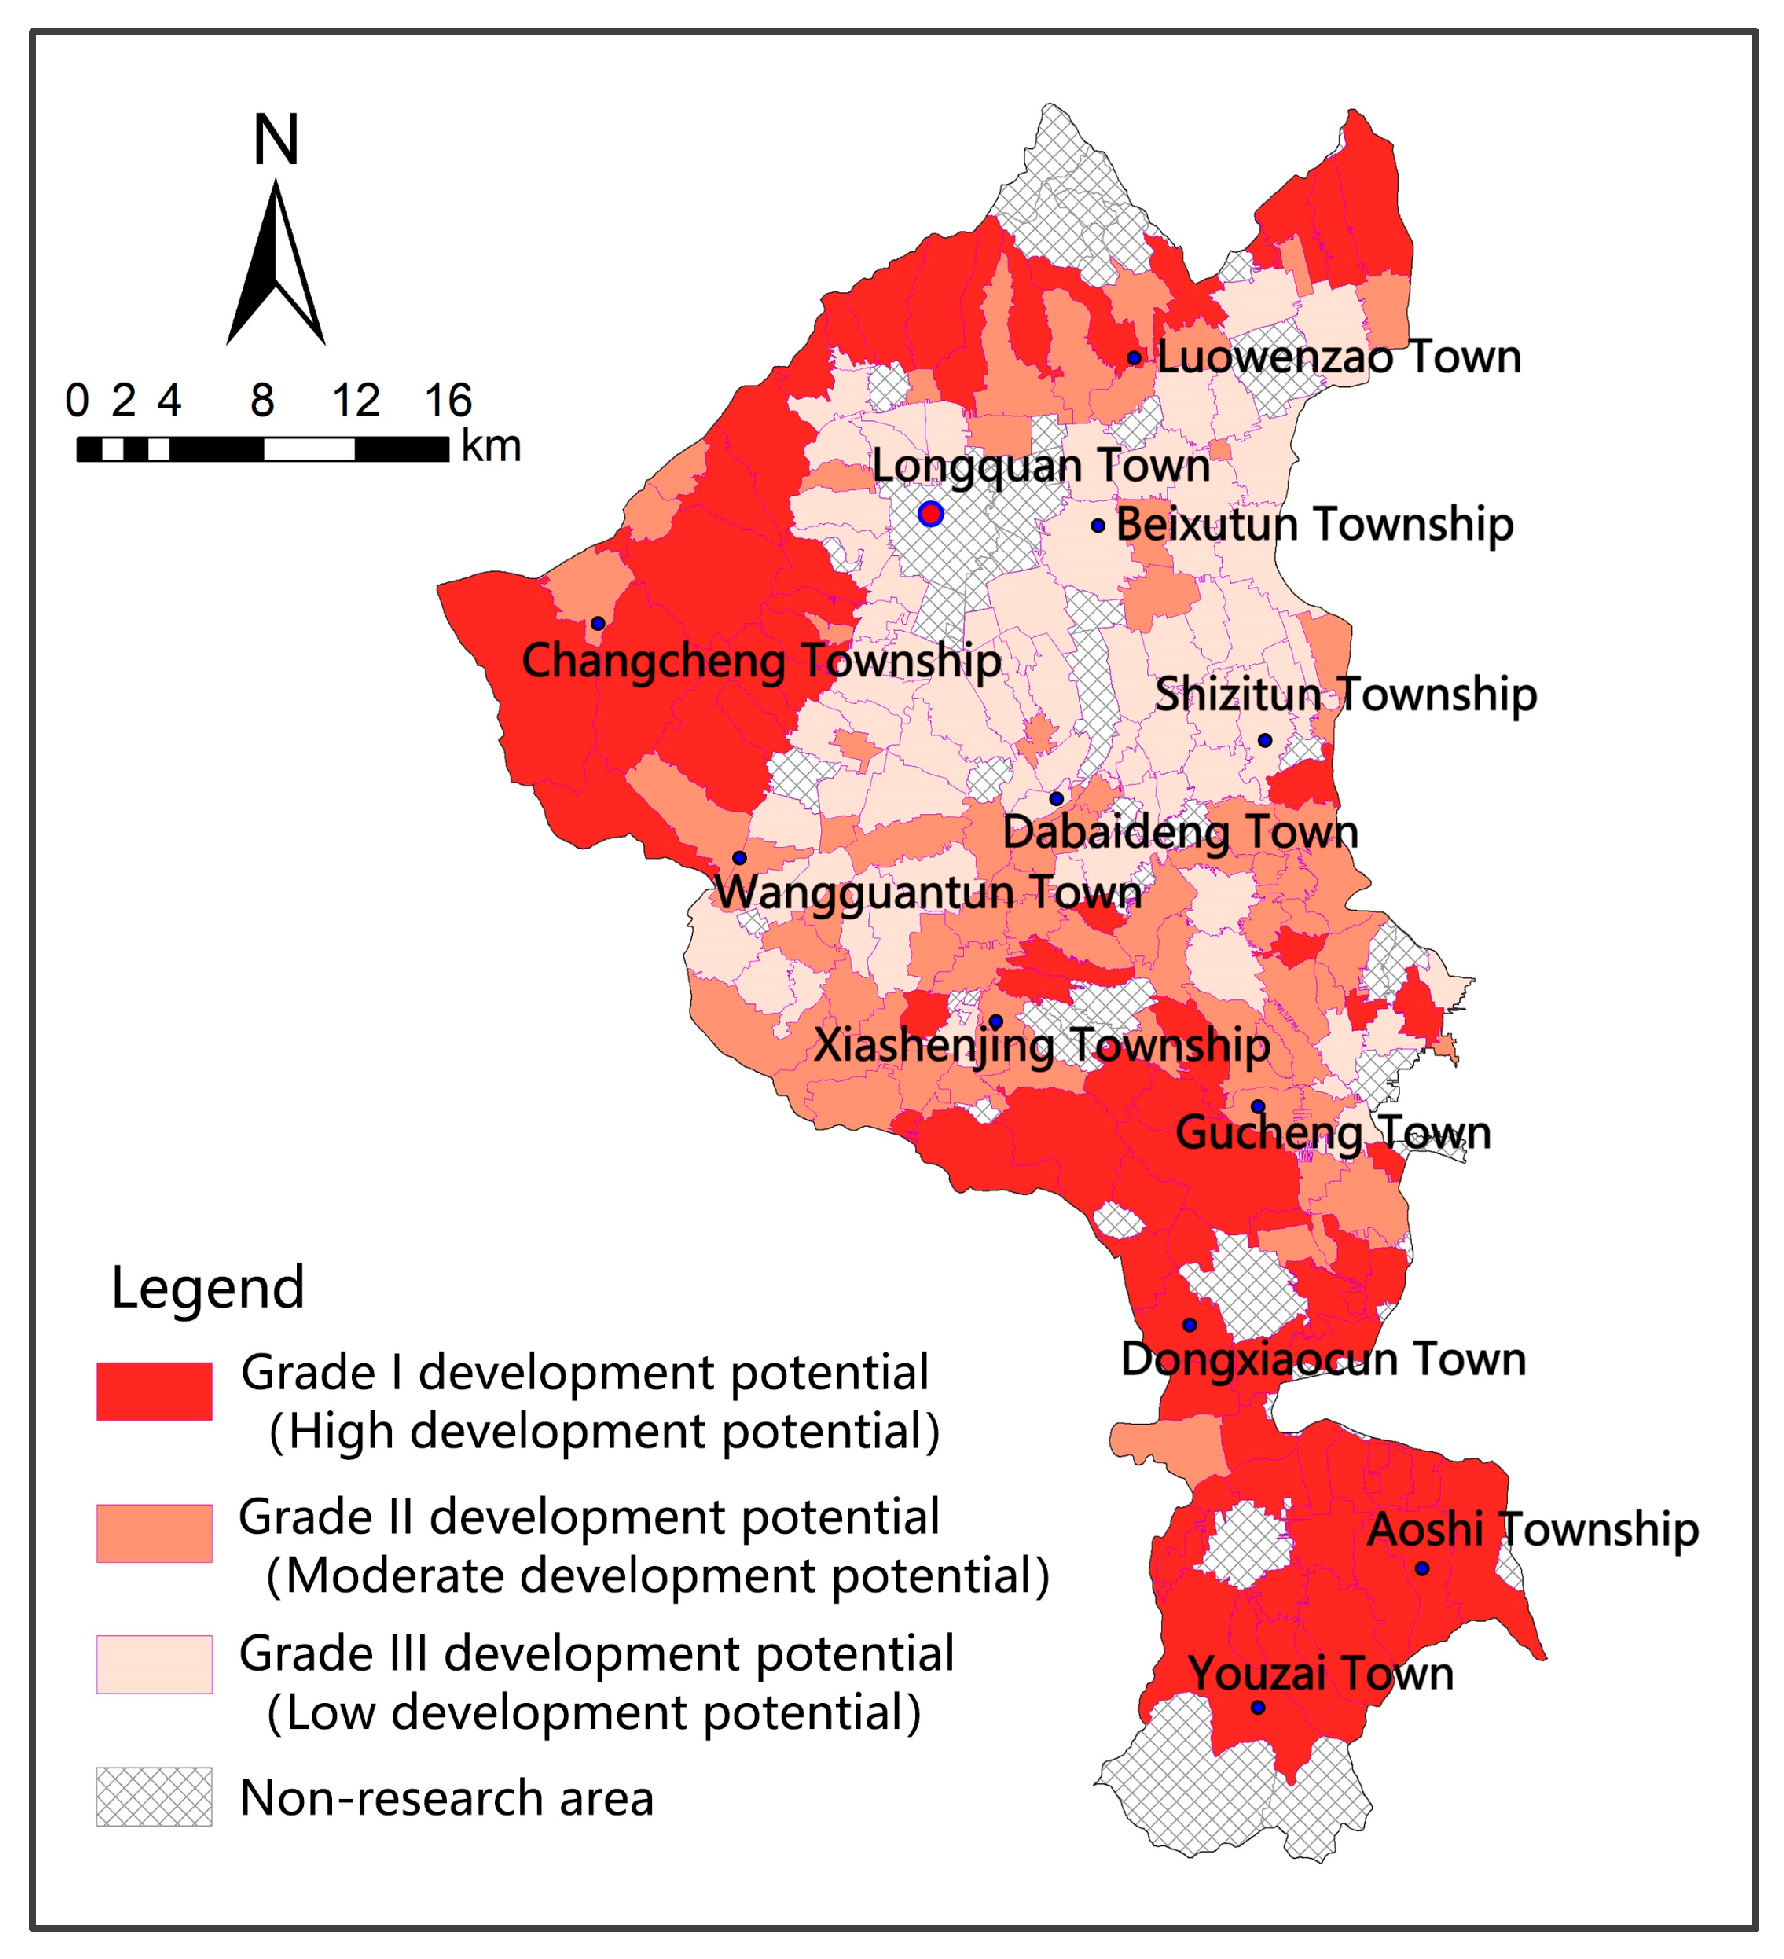
Subsequently, the improved TOPSIS method is employed to rank and visualize the potential for rural construction land consolidation within the study units (Figure 8). The natural breakpoint method is used to divide the development potential of rural construction land in Yanggao County into three categories (Figure 9). The results reveal a spatial pattern of consolidation potential in Yanggao County, characterized by higher potential in the north and south, lower potential in the center, higher potential in mountainous and hilly areas, and lower potential in plains and urban centers. The villages in the mountainous regions of the northwest and southeast exhibit the highest consolidation potential, categorizing them as top-priority areas. In these regions, construction land is primarily distributed intermittently along roads, with many plots scattered within forested valleys. The harsh living conditions and high living costs in these areas make them key targets for homestead reclamation. The central part of Yanggao County also shows significant potential, placing these villages in the second priority tier. This area is influenced by a relatively dense population and convenient transportation, which leads to common spatial displacement of construction land and a higher likelihood of old village abandonment. Villages near the county center have lower potential, categorizing them in the third priority tier. The proximity to the urban center results in more mature land-planning and development models. Under the dual influence of government oversight and market regulation, rural land use in these areas tends to be more orderly, but higher reclamation costs limit the potential for construction land consolidation.

3.4. Linkage Models Between Rural Population–Land Decoupling and Construction Land Development Potential

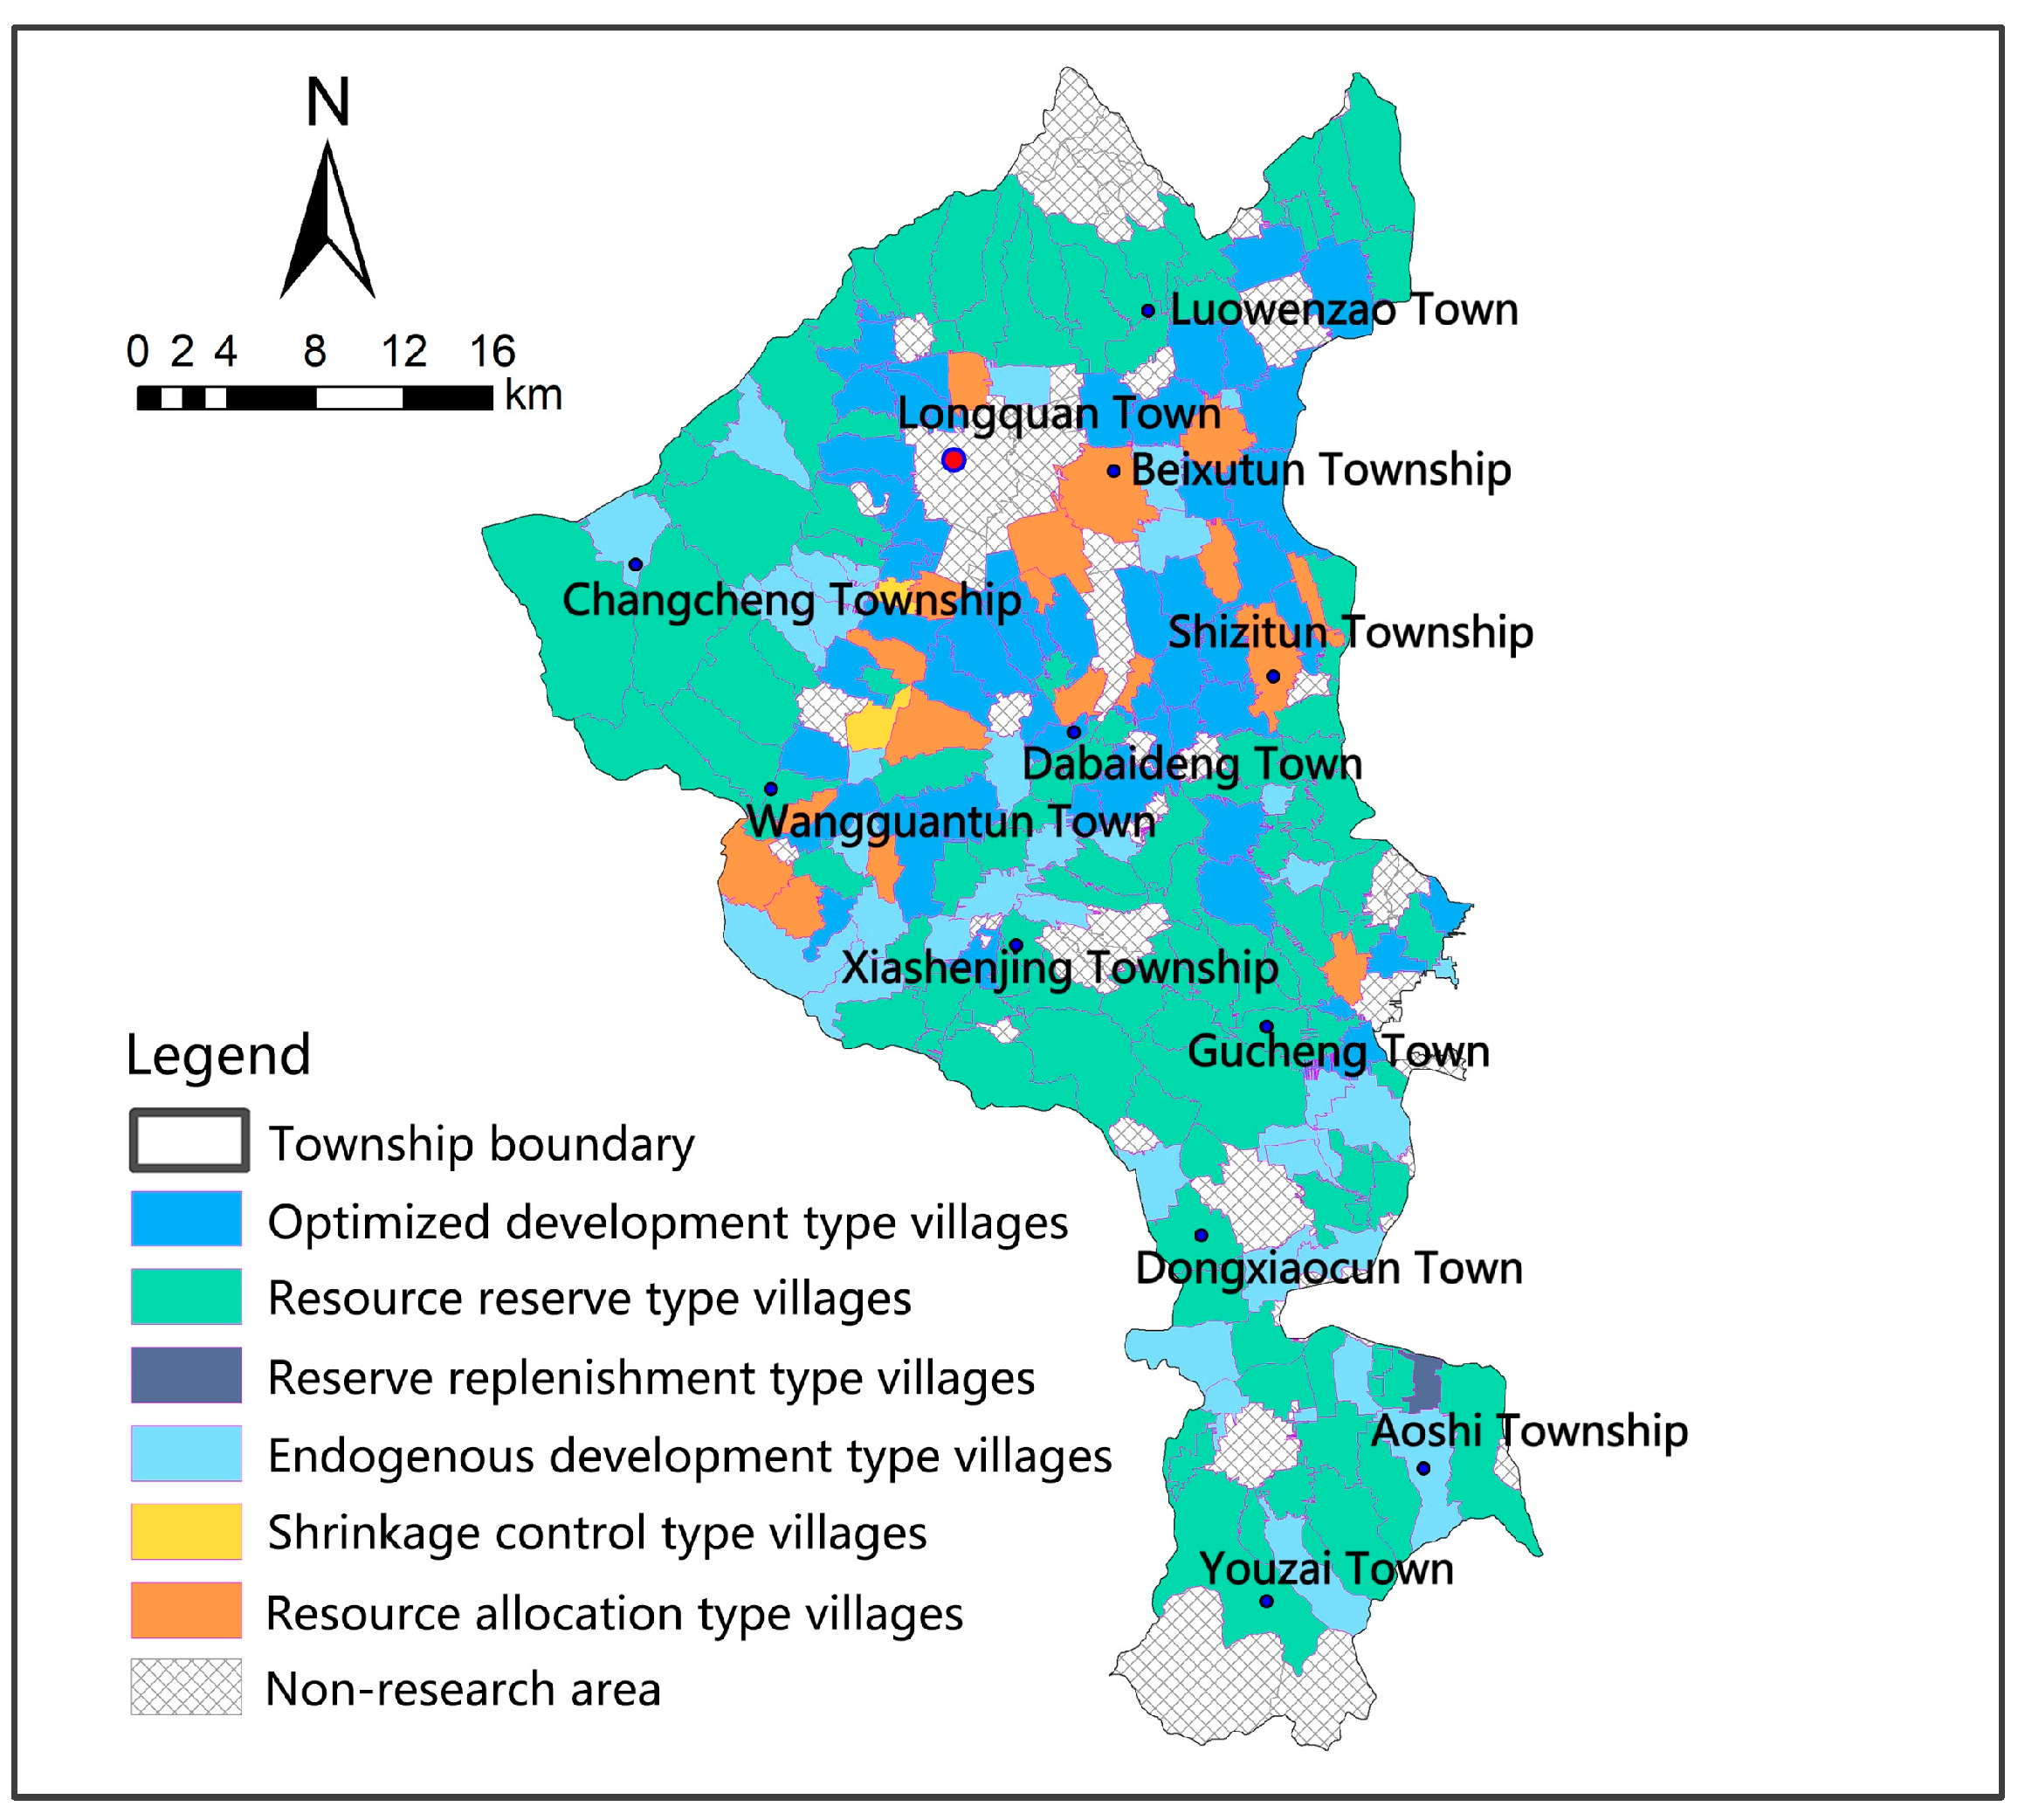
The analysis of the linkage models between rural population–land decoupling and construction land development potential in Yanggao County reveals six distinct rural development types, as shown in Figure 10. The specific results are as follows:
Resource allocation villages: These account for 8.04% (18 villages) and are primarily located around the county seat and surrounding towns. These villages benefit from their peri-urban location, absorbing spillover industries from the county seat, leading to a shortage of construction land indicators and necessitating the import of indicators.
Endogenous development villages: Comprising 16.96% (38 villages), these villages leverage the upgrading of local agricultural industries to achieve growth through the intensive use of land.
Resource reserve villages: The largest group, making up 49.11% (110 villages), these villages are primarily distributed in the northern and southern mountainous areas, as well as in the central and southern townships, which are farther from the county center. These villages face a stark contrast between high development potential and inefficient land use, highlighting the challenge of decoupling in the population–land system. Due to continuous population loss and a monotonous industrial structure, the actual development of these villages is delayed, manifesting a phenomenon of “potential inactivity”. These villages need to activate their reserved land resources through the county-level indicator trading platform to support future regional development.
Optimized development villages: This category accounts for 24.55% (55 villages) and is mainly located in the townships surrounding the county center. Although these villages exhibit lower potential for construction land consolidation, their advantageous location, well-developed transportation infrastructure, and favorable policies contribute to vibrant economic growth and relatively low population loss. Enhancing land efficiency in these areas requires strategies such as “vertical development”, which refers to increasing the use of land by building upwards (e.g., constructing multi-story buildings instead of spreading horizontally), and “functional replacement”, which involves transforming existing land uses to more efficient or appropriate uses based on the area’s development needs (e.g., converting underutilized idle land into industrial or commercial land) [47]. These strategies help maximize land use while respecting ecological and topographical constraints.
Reserve replenishment villages: Yanggao County has only one village of this type. This village exhibits a high potential for construction land consolidation and features a strong human–land coupling development.
Shrinkage control villages: Only two villages belong to this development type. A shrinkage control strategy is necessary [48], focusing on resource integration, service optimization, and infrastructure enhancement to ensure basic living and development conditions. Specifically, “resource integration” refers to effectively combining and utilizing available resources, such as consolidating agricultural land or repurposing unused buildings for new community purposes. “Service optimization” involves improving essential services like healthcare, education, and social welfare to meet the needs of the remaining population, such as offering mobile health clinics or remote education programs. “Infrastructure enhancement” includes upgrading physical infrastructure such as roads, utilities (e.g., water and electricity), and public transportation to improve accessibility and quality of life. These measures are aimed at making these villages more livable and sustainable, even in the face of shrinking populations.

3.5. Results of the Driving Mechanisms of Rural Construction Land Changes

Based on migration patterns, the 224 villages were divided into two groups: 53 villages with net population inflow and 171 villages with net population outflow. For villages with a net increase in construction land area, the key influencing factor was determined by selecting the maximum value among four calculated factors. Conversely, for villages with a net decrease in construction land area, the minimum value among the four factors was chosen as the key influencing factor. The quantitative statistics of these key factors influencing changes in rural construction land are presented in Appendix A and Table A1 and Table A2.
In villages with net population inflow, 35% of those with an increase in construction land area are influenced by the rising proportion of permanent residents, while 32% are affected by overall population growth. These villages are widely distributed, primarily located in the northern and central towns of Yanggao County. Conversely, the proportion of villages with net population inflow experiencing a decrease in construction land area is smaller. Among these, 38% are influenced by land-use efficiency. These villages are fewer in number and mainly situated in the southern part of Yanggao County.
For villages with net population outflow and an increase in construction land area, land-use efficiency and the increasing proportion of outflow population are key influencing factors, affecting 36% and 30% of these villages, respectively. These villages are relatively scattered, primarily concentrated in Gucheng Town and Wangguantun Town, reflecting a lack of rigidity in land-planning policies leading to reverse regulation [49]. In villages with net population outflow and reduced construction land area, the decrease in land use efficiency, the decrease in the proportion of permanent residents, and the decrease in total population have had negative impacts on 33%, 28%, and 28% of villages, respectively. These villages are mainly located in the southern part of Yanggao County. With the vigorous implementation of rural homestead reclamation (which involves converting unused or abandoned homestead land back into productive agricultural land or repurposing it for new development) and relatively stable net population loss ratios, land-use efficiency has significantly improved. By reclaiming idle homesteads and consolidating land use, the remaining construction land is used more efficiently, allowing for better management of land resources even with a declining population. This process not only helps to optimize land utilization but also prevents the further expansion of construction land, ensuring more sustainable land management.

4. Discussion

4.1. Strategies for Adjustment and Optimization of Rural Land Resources

4.1.1. Experience and Enlightenment of International Governance in Rural Land Optimization

Global governance experiences offer valuable insights for optimizing rural land resources [50]. In regions like Germany, rural governance is shaped by progressive ruralism, which emphasizes the importance of stable public funding and democratized municipal decision-making for ensuring social and spatial justice [3]. This approach supports flexible, community-driven land-use planning, with an emphasis on local participation and sustainable development. Similarly, in southern Germany, land management decisions are often influenced by a lack of comprehensive quantitative data, highlighting the need for more informed decision-making frameworks that balance economic, social, and environmental factors [51].
The UK’s rural governance, especially in the post-Brexit context, stresses the integration of sectors beyond agriculture, including infrastructure, social relations, and environmental sustainability. It underscores the necessity of a holistic approach to rural development, where land-use decisions must consider the broader implications for rural communities and the environment [52]. This is particularly relevant for China, which, despite its hierarchical governance structure, has adopted a hybrid approach combining centralized control with quasi-autonomous local governance. For example, Tianjin’s rural redevelopment efforts highlight the complexities of land rights redistribution and the importance of balancing economic growth with social and ecological considerations [53].
These international governance models—spanning Germany’s progressive ruralism, the UK’s comprehensive rural development, and China’s hybrid governance—provide valuable lessons for tailoring land optimization strategies to local contexts. By integrating flexible, participatory approaches with comprehensive data analysis and sustainable land-use practices [8], rural land governance can be more responsive to both development needs and environmental constraints.

4.1.2. Village Classification Governance Strategy

For the study area, which has been categorized into resource allocation, endogenous development, resource reserve, optimized development, and contraction control regions, the paper proposes corresponding optimization pathways [38,54,55].
  • Resource Allocation Type:
Develop a “flexible land supply and targeted allocation” mechanism. Dynamically match land-use quotas based on population inflow trends, prioritizing infrastructure and industrial land in northern population concentration areas [56]. Establish a dynamic “population–land growth linkage” model, requiring the receiving area to provide industrial implementation commitments. Automatically trigger incremental quota allocation when the growth rate of the permanent population exceeds a specified threshold, thus preventing supply–demand imbalances caused by planning delays.
2.
Endogenous Development Type:
Implement a “stock activation and functional replacement” strategy. For secondary potential villages, enhance land-use efficiency through methods such as converting idle homesteads—typically vacant or underused residential properties—into collectively operated construction land. This conversion can be achieved by repurposing these homesteads for shared community purposes, such as constructing public service facilities (e.g., community centers, markets, or local health clinics) or developing small-scale commercial spaces. These projects would be managed collectively by the village or a designated cooperative, ensuring that the land is used efficiently for the benefit of the community [57]. Villages with the highest land development potential focus on a “micro-renewal” model, utilizing data from the third national land survey to identify inefficient land use. By promoting functional integration and increasing floor area ratios, these villages aim to enhance spatial value [4].
3.
Resource Reserve Type:
Implement a “quota trading and cross-regional transfer” model. Establish a county-level construction land quota reserve, allowing high-potential villages (with grade I development potential) to transfer land quotas across regions through land transactions, with proceeds specifically directed towards the construction of village-level public service facilities. These facilities include essential infrastructure and services such as schools, healthcare centers, community halls, recreational areas, and local markets that cater to the daily needs of the village population. For secondary potential villages, implement a “quota pre-allocation + balance of land occupation and compensation” mechanism, prioritizing the land needs for modern agricultural facilities. This mechanism involves the advance allocation of construction land quotas specifically for agricultural infrastructure development, ensuring timely land supply for projects such as smart greenhouses, cold-chain logistics centers, and agricultural product processing workshops. At the same time, it adheres to the principle of the “balance of land occupation and compensation”, meaning that any newly occupied construction land must be offset by reclaiming or restoring equivalent areas of cultivated land elsewhere in the village. For example, if 5 hectares of land are used for building a modern farming park, an equivalent area of low-efficiency land can be rehabilitated into high-quality farmland to maintain overall land balance. This model offers a pragmatic development path tailored to secondary potential villages, distinct from the cross-regional quota trading model suited for villages with the highest development potential.
4.
Optimized Development Type:
Strengthen the “population–land linkage + precise revitalization” approach. Villages under this model exhibit slow population growth but a rapid expansion of construction land, with limited development potential. It is essential to determine the upper limit of construction land based on the resident population, imposing a low-efficiency utilization tax on areas that exceed this limit. It is recommended to establish a “blacklist of idle land” system, mandating the withdrawal of plots that have remained undeveloped for three consecutive years. Priority should be given to repurposing these lands for the construction of new energy facilities, such as solar or wind energy plants, or ecological corridors—green areas designed to connect habitats and support biodiversity. These corridors help mitigate urban sprawl, protect ecosystems, and enhance environmental sustainability.
5.
Shrinkage Control Type:
In this model, the trends of rural construction land and permanent population growth or decline are synchronized, and the development potential is relatively low. These villages should implement a “reduction planning and ecological anchoring” rigid control strategy [58]. Ecological anchoring refers to the establishment of protected areas within the village or surrounding regions, focusing on the conservation of critical ecological zones, such as wetlands, forests, or biodiversity corridors, which help to maintain the ecological balance and prevent environmental degradation. These areas also can act as natural buffers against urban expansion. These villages should establish a strict construction land reduction boundary, prohibiting new non-agricultural projects. Policies such as homestead exit compensation, the balance of arable land occupation and compensation, and revenue incentives should be employed to facilitate the orderly reclamation of land in depopulated southern areas [59], with the reallocated quotas primarily supporting development in the northern regions.
6.
Reserve Replenishment Type:
To address the characteristics of population–land synchronous fluctuations, a “dynamic quota pool” mechanism should be established. The dynamic quota pool refers to a flexible system that adjusts land quotas based on changes in population dynamics. During periods of population growth, the reserved land should be released, with priority given to the development of public service facilities, such as health stations and logistics hubs, to improve the village’s capacity to support its population. For example, if a village experiences a significant population increase, the dynamic quota pool can release additional land for the construction of essential services to accommodate the growing demand. During contraction periods, idle or underutilized land should be converted into ecological land credits, which are then deposited into the county-level trading platform for potential future use.

4.1.3. Implications of the Policy Implementation Strategy

The proposed governance strategies for village classification emphasize a phased implementation pathway to enhance operability and effectiveness. By segmenting the policy into short-term pilot projects, mid-term promotion phases, and long-term optimization strategies, the approach ensures systematic and adaptable progress.
Short-term (Pilot Phase): Initiate pilot projects to test the feasibility of proposed mechanisms in selected areas. For instance, in resource allocation-type villages, a “flexible land supply and targeted allocation” mechanism can be piloted in regions experiencing population growth. This phase aims to gather practical insights, identify potential challenges, and refine the strategies based on real-world outcomes.
Mid-term (Promotion Phase): After the pilot phase, successful strategies should be promoted and scaled up across broader regions. This includes implementing dynamic “population–land growth linkage” models and extending quota trading systems to facilitate balanced development. The promotion phase focuses on adapting and standardizing the approaches based on the pilot results, ensuring they are effective and sustainable.
Long-term (Optimization Phase): In the long term, continuous monitoring and refinement of the strategies are essential. This phase involves optimizing the land supply mechanisms, enhancing the efficiency of resource use, and ensuring environmental sustainability. For instance, developing an elastic coefficient warning system to adjust land quotas dynamically based on population changes will help maintain a balanced and efficient land-use strategy.
By structuring the policy implementation in these phased pathways, the recommendations become more actionable and adaptive, addressing both immediate needs and long-term goals.

4.2. Limitations of the Study

A significant issue with the current methodology for evaluating rural construction land potential is the failure to differentiate between various village functions, such as agricultural, industrial, tourism, ecological protection, traditional settlements, and other possible classifications. This oversight can lead to inaccurate assessments, either overestimating or underestimating the actual potential of specific villages.
Each village type has distinct land-use requirements and development trajectories. Agricultural villages primarily need land for farming and related infrastructure, while industrial villages require extensive areas for factories and production facilities. Tourism villages demand land for attractions, accommodations, and services catering to visitors. Ecological protection villages focus on preserving natural resources and may need land set aside for conservation efforts. Traditional villages, with their historical and cultural significance, have unique preservation and land-use requirements.
The analysis reveals that applying a uniform per capita construction land indicator across these diverse village types often leads to misrepresentations. For instance, in Yanggao County, industrial villages in the north show a substantial need for industrial land, which is not adequately captured by the standard per capita measure, resulting in an underestimation of their potential. Conversely, tourism villages may have potential for growth in visitor services that is not reflected when using a generalized assessment model, leading to an underutilization of their unique potential. Similarly, ecological protection villages might appear to have underutilized land when, in fact, their low development intensity is intentional and necessary for conservation.
To address these discrepancies, it is crucial to refine potential assessment models by incorporating specific functional classifications of villages. This approach should involve developing tailored indicators for each village type and dynamically adjusting these indicators based on evolving village functions.
Moreover, the mechanism for the withdrawal of rural construction land is the result of comprehensive negotiations among multiple stakeholders. It is influenced not only by external objective factors but also by the willingness of farmers to participate in land consolidation and the execution capacity of the government. Therefore, future efforts should incorporate various rural governance tools to promote the sustainable development of land resources through the coordinated allocation of rural land.

4.3. Research Application Potential and Issues Addressed

This study not only offers new perspectives for understanding the driving mechanisms behind land-use changes but also provides a crucial theoretical and methodological foundation for rural land regulation. By focusing on the supply and balance of rural land quotas, it offers a robust basis for assessment and quota calculation. Unlike studies that use provincial, municipal, or county administrative divisions as units of analysis [60,61], this research employs villages as the basic units. This approach more precisely reveals micro-level changes in rural land use and population mobility, delivering more detailed data to deepen our understanding of the population–land relationship.
Furthermore, the article identifies six types of linkage models and proposes targeted deconstruction pathways to adjust land-use and management practices based on specific local conditions. By breaking away from traditional governance logic—such as one-size-fits-all land policies or top-down decision-making—this approach encourages more flexible and tailored strategies for land management. This offers an operational paradigm for the precise adaptation of the “differentiated land supply” provisions outlined in China’s Regulations on the Implementation of the Land Administration Law. Although the study uses Yanggao County, a northern Chinese county, as a case example, the methodology and analytical framework are highly generalizable due to their simplicity and the relatively easy access to data.

5. Conclusions

This study, utilizing a decoupling model and a rural construction land development potential evaluation model, analyzes the driving mechanisms behind changes in rural construction land in Yanggao County. The conclusions are as follows:
  • Decoupling between population and land development: From 2010 to 2020, Yanggao County experienced a decline in its rural population, while construction land continued to expand. Notably, 60.27% of villages showed strong negative decoupling, indicating a significant “population–land separation”. This suggests that rural land development has not effectively adapted to population loss, resulting in land resource waste and contributing to rural hollowing.
  • Spatial patterns and driving mechanisms: The development potential of rural construction land exhibits a spatial pattern with higher potential in the northern and southern hilly areas, and lower potential in the central plains and town centers. The driving forces behind land changes are varied: in areas with population inflow, expansion is driven by incremental demand, reflecting passive planning adaptation; in areas with population outflow, changes are driven by land-use efficiency, with low efficiency being the primary challenge.
  • International governance insights and policy implications: International experiences highlight the importance of systematic legislation and ecological coordination in rural land governance. For instance, Germany’s Land Consolidation Act emphasizes ecological protection, while Japan and the Netherlands have adopted strategies to address land fragmentation and farmland efficiency. However, the sustainability of these models depends on aligning governance mechanisms with local demographic and economic characteristics, avoiding the risks associated with applying a single model to diverse regions.

Author Contributions

All authors contributed to the paper. B.Z. was responsible for writing, data analysis, formal analysis, methodology, and visualization. W.H. was responsible for conceptualization and supervision. Z.Z. was responsible for visualization. All authors have read and agreed to the published version of the manuscript.

Funding

This research was funded by the Shanxi Philosophy and Social Science Planning Project, grant number 2023YJ025 and the General Teaching Reform and Innovation Project of Higher Education Institutions in Shanxi Province, grant number J20230180.

Data Availability Statement

The data presented in this study are available on request from the corresponding author. The data are not publicly available due to concerns regarding the privacy of individual participants and the sensitive nature of the research data. All requests for data will be subject to an ethical review process to ensure that the privacy of participants is maintained and that the use of data is in line with ethical guidelines for research.

Acknowledgments

We would like to express our sincere gratitude to the Yanggao County Natural Resources Bureau for their invaluable support and provision of data, which were crucial for the success of this research.

Conflicts of Interest

Author Bing Zhao was employed by the Shandong Urban and Rural Planning and Design Institute Co., Ltd. Weicheng Han and Zhiqi Zhang declare that the research was conducted in the absence of any commercial or financial relationships that could be construed as a potential conflict of interest.

Abbreviations

The following abbreviations are used in this manuscript:
LMDILogarithmic Mean Divisia Index

Appendix A

Table A1. Statistics on the number of key influencing factors of net population inflow into villages.
Distribution AreaTownship Name△Etotal > 0△Etotal < 0
△EI > 0△ES > 0△EF > 0△EP > 0△EI < 0△ES < 0△EF < 0△EP < 0
Northern Township of Yanggao CountyLongquan Town00000000
Luowenzao Town23000000
Wangguantun Town47060000
Changcheng Township11010000
Beixutun Township00000000
Central Township of Yanggao CountyDabaideng Town24360000
Gucheng Town175100000
Shizitun Township12020000
Xiashenjing Township13240000
Southern Township of Yanggao CountyDongxiaocun Town55222111
Youzai Town03010000
Aoshi Township21211011
Number of Villages193614333122
Proportion19%35%14%32%38%13%25%25%
Table A2. Statistics on the number of key influencing factors for net outflow of population from villages.
Distribution AreaTownship Name△Etotal > 0△Etotal < 0
△EI > 0△ES > 0△EF > 0△EP > 0△EI < 0△ES < 0△EF < 0△EP < 0
Northern Township of Yanggao CountyLongquan Town1861540011
Luowenzao Town134910000
Wangguantun Town19131691010
Changcheng Township52303303
Beixutun Township64630000
Central Township of Yanggao CountyDabaideng Town1351480000
Gucheng Town89690000
Shizitun Township1971310000
Xiashenjing Township97981101
Southern Township of Yanggao CountyDongxiaocun Town63410000
Youzai Town51620000
Aoshi Township23141100
Number of Villages191236410250652
Proportion19%36%19%30%15%33%28%11%

References

  1. Dilley, L.; Gkartzios, M.; Odagiri, T. Developing counterurbanisation: Making sense of rural mobility and governance in Japan. Habitat Int. 2022, 125, 102595. [Google Scholar] [CrossRef]
  2. Kato, H. Declining population and the Revitalization of local regions in Japan. Meiji J. Political Sci. Econ. 2014, 3, 25–35. [Google Scholar]
  3. Kallert, A.; Belina, B.; Miessner, M.; Naumann, M. The cultural political economy of rural governance: Regional development in Hesse (Germany). J. Rural. Stud. 2021, 87, 327–337. [Google Scholar] [CrossRef]
  4. Zhu, C.; Zhang, X.; Wang, K.; Yuan, S.; Yang, L.; Skitmore, M. Urban–rural construction land transition and its coupling relationship with population flow in China’s urban agglomeration region. Cities 2020, 101, 102701. [Google Scholar] [CrossRef]
  5. Zhou, Y.; Zhong, Z.; Cheng, G. Cultivated land loss and construction land expansion in China: Evidence from national land surveys in 1996, 2009 and 2019. Land Use Policy 2023, 125, 106496. [Google Scholar] [CrossRef]
  6. Ma, L.; Liu, S.; Tao, T.; Gong, M.; Bai, J. Spatial reconstruction of rural settlements based on livability and population flow. Habitat Int. 2022, 126, 102614. [Google Scholar] [CrossRef]
  7. Zhou, Y.; Chen, T.; Feng, Z.; Wu, K. Identifying the contradiction between the cultivated land fragmentation and the construction land expansion from the perspective of urban-rural differences. Ecol. Inform. 2022, 71, 101826. [Google Scholar] [CrossRef]
  8. Yin, Q.; Sui, X.; Ye, B.; Zhou, Y.; Li, C.; Zou, M.; Zhou, S. What role does land consolidation play in the multi-dimensional rural revitalization in China? A research synthesis. Land Use Policy 2022, 120, 106261. [Google Scholar] [CrossRef]
  9. Liu, Y.; Zhou, G.; Liu, D.; Yu, H.; Zhu, L.; Zhang, J. The Interaction of Population, Industry and Land in Process of Urbanization in China: A Case Study in Jilin Province. Chin. Geogr. Sci. 2018, 28, 529–542. [Google Scholar] [CrossRef]
  10. Wu, Y.; Yuan, C.; Liu, Z.; Wu, H.; Wei, X. Decoupling relationship between the non-grain production and intensification of cultivated land in China based on Tapio decoupling model. J. Clean. Prod. 2023, 424, 138800. [Google Scholar] [CrossRef]
  11. Zhou, H.; Yan, J.; Lei, K.; Wu, Y.; Sun, L. Labor migration and the decoupling of the crop-livestock system in a rural mountainous area: Evidence from Chongqing, China. Land Use Policy 2020, 99, 105088. [Google Scholar] [CrossRef]
  12. Acs, S.; Hanley, N.; Dallimer, M.; Gaston, K.J.; Robertson, P.; Wilson, P.; Armsworth, P.R. The effect of decoupling on marginal agricultural systems: Implications for farm incomes, land use and upland ecology. Land Use Policy 2010, 27, 550–563. [Google Scholar] [CrossRef]
  13. Chen, X.; Jiaxin, Z.; Mengke, P.; Chenyang, S. Decoupling agricultural resource inputs from agricultural economic development in China: A spatial–temporal analysis (2006–2021). Environ. Dev. Sustain. 2024, 6, 1–25. [Google Scholar] [CrossRef]
  14. Yang, Y.; Jia, J.; Devlin, A.T.; Zhou, Y.; Xie, D.; Ju, M. Decoupling and decomposition analysis of residential energy consumption from economic growth during 2000–2017: A comparative study of urban and rural Guangdong, China. Energies 2020, 13, 4461. [Google Scholar] [CrossRef]
  15. Sun, D.; Wang, X.; Yu, M.; Ouyang, Z.; Liu, G. Dynamic evolution and decoupling analysis of agricultural nonpoint source pollution in Taihu Lake Basin during the urbanization process. Environ. Impact Assess. Rev. 2023, 100, 107048. [Google Scholar] [CrossRef]
  16. Li, M.; Shi, Y.; Duan, W.; Chen, A.; Wang, N.; Hao, J. Spatiotemporal decoupling of population, economy and construction land changes in Hebei province. Sustainability 2019, 11, 6794. [Google Scholar] [CrossRef]
  17. Shi, L.; Wang, Y. Evolution characteristics and driving factors of negative decoupled rural residential land and resident population in the Yellow River Basin. Land Use Policy 2021, 109, 105685. [Google Scholar] [CrossRef]
  18. Zhang, X.; Wang, J.; Song, W.; Wang, F.; Gao, X.; Liu, L.; Dong, K.; Yang, D. Decoupling analysis between rural population change and rural construction land changes in China. Land 2022, 11, 231. [Google Scholar] [CrossRef]
  19. Niu, X.; Liao, F.; Liu, Z.; Wu, G. Spatial–temporal characteristics and driving mechanisms of land–use transition from the perspective of urban–rural transformation development: A case study of the Yangtze River Delta. Land 2022, 11, 631. [Google Scholar] [CrossRef]
  20. Yang, L.; Fang, C.; Chen, W.; Zeng, J. Urban-rural land structural conflicts in China: A land use transition perspective. Habitat Int. 2023, 138, 102877. [Google Scholar] [CrossRef]
  21. Qu, Y.; Zhan, L.; Jiang, G.; Ma, W.; Dong, X. How to Address “Population Decline and Land Expansion (PDLE)” of rural residential areas in the process of Urbanization: A comparative regional analysis of human-land interaction in Shandong Province. Habitat Int. 2021, 117, 102441. [Google Scholar] [CrossRef]
  22. Xu, Y.; Tang, Q.; Fan, J.; Bennett, S.J.; Li, Y. Assessing construction land potential and its spatial pattern in China. Landsc. Urban Plan. 2011, 103, 207–216. [Google Scholar] [CrossRef]
  23. Yang, H.; Lu, X.; Chen, D. Potential zoning and development paths of homestead renovation for rural revitalization in southern Hunan Province of China. Trans. Chin. Soc. Agric. Eng. 2021, 37, 263–272+339. [Google Scholar]
  24. Zou, X.; Wang, Y.; Yin, Y.; Tu, X.; Xu, G. The threshold effect of agricultural population transfer on arable land use efficiency in Jiangxi Province. Resour. Sci. 2019, 41, 1576–1588. [Google Scholar]
  25. Ge, D.; Long, H.; Qiao, W.; Wang, Z.; Sun, D.; Yang, R. Effects of rural–urban migration on agricultural transformation: A case of Yucheng City, China. J. Rural. Stud. 2020, 76, 85–95. [Google Scholar] [CrossRef]
  26. Zhu, C.; Lin, Y.; Zhang, J.; Gan, M.; Xu, H.; Li, W.; Yuan, S.; Wang, K. Exploring the relationship between rural transition and agricultural eco-environment using a coupling analysis: A case study of Zhejiang Province, China. Ecol. Indic. 2021, 127, 107733. [Google Scholar] [CrossRef]
  27. Wang, X.; Zheng, M.; Liu, D.; Wang, P.; Zheng, X.; Yin, M.; Xu, F.; Zhang, X.; Rong, T. Construction of Long-Term Grid-Scale Decoupling Model: A Case Study of Beijing-Tianjin-Hebei Region. Land 2024, 13, 1853. [Google Scholar] [CrossRef]
  28. Chen, W.; Li, J.; Zeng, J.; Ran, D.; Yang, B. Spatial heterogeneity and formation mechanism of ecoenvironmental effect of land use change in China. Geogr. Res. 2019, 38, 2173–2187. (In Chinese) [Google Scholar] [CrossRef]
  29. Sun, Y.; Li, Z. Environment, Analysing on the decoupling relationship between carbon dioxide emissions and economic growth of each province in China. China Popul. Resour. 2011, 21, 87–92. [Google Scholar]
  30. Tapio, P. Towards a theory of decoupling: Degrees of decoupling in the EU and the case of road traffic in Finland between 1970 and 2001. Transp. Policy 2005, 12, 137–151. [Google Scholar] [CrossRef]
  31. Zhang, Z.; Wen, Y.; Wang, R. Impact factors of farmers’ willingness in rural residential land readjustment: Comparing Jiangshan City in Zhejiang Province and Panshan County in Liaoning Province. China Land Sci. 2018, 32, 28–34. [Google Scholar]
  32. Wang, L.; Wu, J. Households’ Participation Intention on Hollow Village Governance Based on IAD Model. Econ. Geogr. 2019, 39, 185–191. [Google Scholar]
  33. Chen, C.; Kong, X.; Zhu, S.; Chen, X. Analysis on Spatiotemporal Correlation Modes of Rural Population, Cultivated Land and Rural Settlements in Hubei Province Based on Decoupling Model. Geogr. Geo-Inf. Sci. 2021, 37, 59–65. (In Chinese) [Google Scholar] [CrossRef]
  34. Tao, Z.; Guanghui, J.; Wenqiu, M.; Ruijuan, Z.; Yingying, T.; Qinglei, Z.; Yaya, T. A framework for identifying the distribution of revitalization potential of idle rural residential land under rural revitalization. Land Use Policy 2024, 136, 106977. [Google Scholar] [CrossRef]
  35. GB50188-93; Standard for Planning of Rural Villaged and Town. Ministry of Housing and Urban-Rural Development of the People’s Republic of China: Beijing, China, 1994.
  36. Liu, Y.; Li, J.; Hou, H.; Liu, Y. Study on urbanization rate of urban-rural construction land and its influencing factors: A case study of Hubei Province. Geogr. Res. 2014, 33, 132–142. [Google Scholar]
  37. Zhou, K.; Tan, R.; Liu, Y.; Kong, X. Assessing of land-saving potential in Hubei province based on per capita constructive land standards. Trans. Chin. Soc. Agric. Eng. 2012, 28, 222–231. (In Chinese) [Google Scholar] [CrossRef]
  38. Zou, Y.; Yi, C.; Rao, Y.; Luo, F.; Lv, C.; Wu, P. Identify optimization type of rural settlements based on “production–living–ecological” functions and vitality: A case study of a town in Northern China. Land 2023, 12, 1905. [Google Scholar] [CrossRef]
  39. Xiang, S.; Zhou, M.; Huang, L.; Shan, L.; Wang, K. Assessing the dynamic land utilization efficiency and relevant driving mechanism in in-situ urbanized rural areas: A case study of 1979 administrative villages in Hangzhou. Environ. Impact Assess. Rev. 2023, 101, 107111. [Google Scholar] [CrossRef]
  40. Kaya, Y. Impact of Carbon Dioxide Emission Control on GNP Growth: Interpretation of Proposed Scenarios; Intergovernmental Panel on Climate Change/Response Strategies Working Group: Geneva, Switzerland, 1989. [Google Scholar]
  41. Wang, W.; Liu, X.; Zhang, M.; Song, X. Using a new generalized LMDI (logarithmic mean Divisia index) method to analyze China’s energy consumption. Energy 2014, 67, 617–622. [Google Scholar] [CrossRef]
  42. Zhao, B.; Han, W. Research on the coupling of rural population-land dynamics and agricultural land use: An efficiency perspective. J. Agric. Resour. Environ. 2024, 13, 1666. (In Chinese) [Google Scholar] [CrossRef]
  43. Liu, S.; YE, Y.; Lin, Y. Evolution characteristics and decomposition of driving factors on rural residential land based on decoupling theory and LMDI model. Trans. Chin. Soc. Agric. Eng. 2019, 35, 272–280. [Google Scholar]
  44. Yu, Z.; Yuan, D.; Zhao, P.; Lyu, D.; Zhao, Z. The role of small towns in rural villagers’ use of public services in China: Evidence from a national-level survey. J. Rural. Stud. 2023, 100, 103011. [Google Scholar] [CrossRef]
  45. Liu, S.; Ma, L.; Yao, Y.; Cui, X. Man-land relationship based on the spatial coupling of population and residential land–A case study of Yuzhong County in Longzhong Loess Hilly Region, China. Land Use Policy 2022, 116, 106059. [Google Scholar] [CrossRef]
  46. Yang, X.; Li, W.; Zhang, P.; Chen, H.; Lai, M.; Zhao, S. The dynamics and driving mechanisms of rural revitalization in western China. Agriculture 2023, 13, 1448. [Google Scholar] [CrossRef]
  47. Peng, Y.; Peng, X.; Li, X.; Lu, M.; Yin, M. Effectiveness in rural governance: Influencing factors and driving pathways—Based on 20 typical cases of rural governance in China. Land 2023, 12, 1452. [Google Scholar] [CrossRef]
  48. Lin, L.; Zhu, Y. Types and determinants of migrants’ settlement intention in China’s new phase of urbanization: A multi-dimensional perspective. Cities 2022, 124, 103622. [Google Scholar] [CrossRef]
  49. Qi, W.; Deng, Y.; Fu, B. Rural attraction: The spatial pattern and driving factors of China’s rural in-migration. J. Rural. Stud. 2022, 93, 461–470. [Google Scholar] [CrossRef]
  50. Cotula, L.; Anseeuw, W.; Baldinelli, G.M. Between promising advances and deepening concerns: A bottom-up review of trends in land governance 2015–2018. Land 2019, 8, 106. [Google Scholar] [CrossRef]
  51. Meyer, M.A.; Lehmann, I.; Seibert, O.; Früh-Müller, A. Spatial indicators to monitor land consumption for local governance in southern Germany. Environ. Manag. 2021, 68, 755–771. [Google Scholar] [CrossRef]
  52. Attorp, A.; Heron, S.; McAreavey, R. Rural Governance in the UK: Towards a Sustainable and Equitable Society; Taylor & Francis: London, UK, 2023. [Google Scholar]
  53. Ma, Y.; Chiu, R.L. Governing rural redevelopment and re-distributing land rights: The case of Tianjin. Land Use Policy 2018, 72, 533–546. [Google Scholar] [CrossRef]
  54. Zhao, S.; Yin, M. Research on rural population/arable land/rural settlements association model and coordinated development path: A case analysis of the Yellow River Basin (Henan section). Int. J. Environ. Res. Public Health 2023, 20, 3833. [Google Scholar] [CrossRef] [PubMed]
  55. Rao, Y.; Zou, Y.; Yi, C.; Luo, F.; Song, Y.; Wu, P. Optimization of rural settlements based on rural revitalization elements and rural residents’ social mobility: A case study of a township in western China. Habitat Int. 2023, 137, 102851. [Google Scholar] [CrossRef]
  56. Wang, Y.; Lei, Y.; Shah, M.H. Coupling and Coordination Analysis of High-Quality Agricultural Development and Rural Revitalization: Spatio-Temporal Evolution, Spatial Disparities, and Convergence. Sustainability 2024, 16, 9007. [Google Scholar] [CrossRef]
  57. Wang, Z.; Wang, C.; Dou, H.; Cheng, G.; Zhang, J.; Lei, X.; Huang, X. A strategy of building a beautiful and harmonious countryside: Reuse of idle rural residential land based on symbiosis theory. Habitat Int. 2025, 155, 103238. [Google Scholar] [CrossRef]
  58. Yuan, L.; Li, R.; Wu, X.; He, W.; Kong, Y.; Ramsey, T.S.; Degefu, D.M. Decoupling of economic growth and resources-environmental pressure in the Yangtze River Economic Belt, China. Ecol. Indic. 2023, 153, 110399. [Google Scholar] [CrossRef]
  59. Liao, G.; He, P.; Gao, X.; Lin, Z.; Huang, C.; Zhou, W.; Deng, O.; Xu, C.; Deng, L. Land use optimization of rural production–living–ecological space at different scales based on the BP–ANN and CLUE–S models. Ecol. Indic. 2022, 137, 108710. [Google Scholar] [CrossRef]
  60. Mu, L.; Jinmin, H.; Li, C.; Tianwei, G.; Qingchun, G.; Aiqi, C. Decoupling of urban and rural construction land and population change in China at the prefectural level. Resour. Sci. 2019, 41, 1897–1910. (In Chinese) [Google Scholar] [CrossRef]
  61. Wang, Z.; Shixuan, E.; Chen, J. Decoupling of rural population and settlement in the Three Gorges Reservoir areas in the past 40 years and its driving effect. Trans. Chin. Soc. Agric. Eng. 2022, 38, 273–284. (In Chinese) [Google Scholar] [CrossRef]
Figure 1. Location analysis map of the study area.
Land 14 01079 g001
Figure 2. Change trend of rural population and construction land in Yanggao County from 2010 to 2020.
Land 14 01079 g002
Figure 3. Visualization of spatial changes in rural population and land quantity in Yanggao County. (a) Population changes in villages in the northern part of Yanggao County. (b) Changes in construction land for villages in the northern part of Yanggao County. (c) Population changes in villages in central Yanggao County. (d) Changes in construction land for villages in central Yanggao County. (e) Population changes in southern villages of Yanggao County. (f) Changes in construction land for villages in southern Yanggao County.
Land 14 01079 g003
Figure 4. Spatial analysis of hotspots and coldspots in rural population and land changes in Yanggao County. (a) Analysis of coldspots and hotspots in rural population. (b) Analysis of coldspots and hotspots in rural construction land.
Land 14 01079 g004
Figure 5. Spatial distribution of decoupling types in rural areas of Yanggao County.
Land 14 01079 g005
Figure 6. Scatter diagram of decoupling of rural population and land changes in Yanggao County.
Land 14 01079 g006
Figure 7. Results of evaluation indicators for the potential of rural construction land consolidation. (a) Average nearest-neighbor distance. (b) Area-weighted mean patch fractal dimension. (c) Patch density. (d) Potential coefficient for per capita construction land area. (e) Connectivity index of rural construction land. (f) Fragmentation index of rural construction land. (g) Cropland to construction land area ratio. (h) Proportion of construction land area. (i) Average slope. (j) Average elevation. (k) Distance to town center. (l) Road network density.
Land 14 01079 g007aLand 14 01079 g007b
Figure 8. Ranking of rural construction land consolidation potential units.
Land 14 01079 g008
Figure 9. Classification of rural construction land consolidation potential units.
Land 14 01079 g009
Figure 10. Linkage pattern spatial distribution map.
Land 14 01079 g010
Table 1. Definition of decoupling type.
Decoupling TypeRural Population Change RateRural Construction Land Change RateDF
DecouplingStrong decoupling (T1)>0<0DF < 0
Weak decoupling (T2)>0>00 < DF < 0.8
Decline decoupling (T3)<0<0>1.2
Negative decouplingExpansive negative decoupling (T4)>0>0>1.2
Strong negative decoupling (T5)<0>0DF < 0
Weak negative decoupling (T6)<0<00 < DF < 0.8
CouplingExpansion coupling (T7)>0>00.8 < DF < 1.2
Decline coupling (T8)<0<00.8 < DF < 1.2
Table 2. Evaluation indicators for the potential of rural construction land consolidation.
Criterion LayerIndex LayerFormula for Calculating Evaluation IndicatorsFormula ExplanationIndex Connotation
Spatial Distribution Pattern (P)P1: Average Nearest-Neighbor Distance (+) 1 n i = 1 n D i Di: distance between the i-th construction land and its nearest neighbor; n: total number of construction areas. This index is represented as ENN_MN.Indicates the dispersion of village construction land distribution.
P2: Area-Weighted Mean Patch Fractal Dimension (−) i = 1 n 2 ln 0.25 P i ln a i a i A Pi: perimeter of the i-th patch; ai:
area of the i-th patch. This indicator is represented as FRAC_MN.
Reflects the complexity of patch boundaries.
P3: Patch Density (−) N / A N: number of construction land patches; A: total area of the unit. This indicator is represented as PD.Indicates the clustering degree of village construction land distribution.
Demand for Rural Construction Land Consolidation (D)D1: Potential Coefficient for Per Capita Construction Land Area (+) R 1 = S h / N h · P C = R 1 / R 2 Sh: total area of construction land in the unit; Nh: number of construction areas in the unit; P: population allocated to village construction land; C: potential coefficient for per capita construction land area; R1: per capita construction land area of the unit; and R2: standard per capita construction land area of the village.Indicates the demand for land potential under the constraints of “one household, one homestead” and ideal per capita construction land area.
D2: Connectivity Index of Rural Construction Land (−) 1 i = 1 m j = 1 n P i j i = 1 m j = 1 n P i j a i j × 1 1 Z 1 × 100 Pij: perimeter of patch ij; aij: area of patch ij; Z: total number of patches. This landscape connectivity index is represented as COHESION.Reflects the demand for constructing landscape corridors within village living spaces.
D3: Fragmentation Index of Rural Construction Land (+) 1 i = 1 m j = 1 n a i j A 2 Z: total number of patches; aij: area of patch ij. This index is represented as DIVISION.Indicates the degree of separation of rural construction land.
External Environment of Construction Land (E)E1: Cropland to Construction Land Area Ratio (−) S f S h × 100 % Sf: area of cropland within the unit; Sh: area of construction land within the unit.The higher the ratio, the more population it can support, and the lower the willingness for consolidation.
E2: Proportion of Construction Land Area (−) C A A × 100 % CA: total area of construction land within the unit.Indicates the degree of residential concentration.
E3: Average Slope (+) S 1 + S 2 + + S m m S: slope value of each grid; m: total number of grids within the unit.The higher the average slope and elevation, the higher the consolidation potential.
E4: Average Elevation (+) H 1 + H 2 + + H m m H: elevation value of each grid.
Cost of Construction Land Consolidation (C)C1: Distance to Town Center (+)Spatial analysis domain.Calculates the distance from the centroid of the evaluation unit to the town center.Indicates the cost of land consolidation projects.
C2: Road Network Density (−) L 1 · W 1 + L 2 · W 2 + + L n · W n / A L: represents various road levels; W: road level weight.Indicates the ease of implementing development projects and subsequent maintenance costs.
Table 3. Ideal value of per capita construction land area in rural areas.
Actual Value≤50(50, 60)(60, 80)(80, 100)(100, 120)(120, 150)>150
Planning standard value[50, 80][50, 80][60, 100][60, 120][80, 120][100, 150]≤150
Ideal value65658090100125150
Table 4. Linkage model classification method.
Population–Land Decoupling TypeDevelopment Potential Grade of Construction LandLinkage ModelModel Characteristics
T1, T2, T3Grade I and II development potentialEndogenous development typePopulation growth is the primary driver, with high land development potential
Grade III development potentialResource allocation typeVillages have high development potential, but low land development potential.
T4, T5, T6Grade I and II development potentialResource reserve typeLand expansion is the primary driver, with high land development potential.
Grade III development potentialOptimized developmentCharacterized by population decline and low land development potential.
T7, T8Grade I development potentialReserve replenishment typeCoupled development of population and land, with high land development potential.
Grade II and III development potentialShrinkage control typeCoupled development of population and land, but low land development potential.
Table 5. Classification results of rural population–land decoupling types in Yanggao County.
Decoupling TypeNumber of VillagesProportionProportion of Total Construction LandProportion of Total Population
Strong decouplingT120.89%0.93%1.07%
Weak decouplingT24921.88%21.79%21.15%
Decline decouplingT352.23%2.10%2.20%
Expansive negative decouplingT42812.50%18.57%16.44%
Strong negative decouplingT513560.27%55.00%57.02%
Weak negative decouplingT620.89%0.57%0.73%
Expansion couplingT720.89%0.61%0.86%
Decline couplingT810.45%0.43%0.53%
Disclaimer/Publisher’s Note: The statements, opinions and data contained in all publications are solely those of the individual author(s) and contributor(s) and not of MDPI and/or the editor(s). MDPI and/or the editor(s) disclaim responsibility for any injury to people or property resulting from any ideas, methods, instructions or products referred to in the content.

