Abstract
Regional comprehensive transportation infrastructures constitute the fundamental basis for the development of inland urban agglomerations. To elucidate the role of comprehensive transportation in shaping the spatial organization and expansion of urban agglomerations, this study takes the Yangtze River Middle Reaches Urban Agglomeration (YRMRUA) as a case example. It examines the spatial relationships between transportation network layout and spatial expansion patterns using fractal dimension based on traffic accessibility, traffic-weighted linear density, and Pearson correlation analysis. The key findings of this study are as follows: (1) The YRMRUA exhibits a partial fractal growth pattern influenced by transportation development, which indicates that the comprehensive transportation has a significant but limited impact on YRMRUA. (2) There is a moderate correlation between traffic-weighted linear density and spatial expansion intensity within YRMRUA. (3) Specific groups such as the Wuhan–Ezhou–Huanggang–Huangshi group, Changsha–Zhuzhou–Xiangtan group, and Nanchang–Yichun group have formed in areas where transportation development and spatial expansion are at the forefront. (4) Different modes of transportation, including waterway transportation, railway transportation, and road transportation, have varying effects on spatial expansion. The integration of these modes forms the fundamental framework of urban agglomerations.
1. Introduction
The 14th Five-Year Plan of China has designated 19 urban agglomerations, some of which have released development planning that clarified the positioning of each urban agglomeration and outlined the development direction for them. The subject of urban agglomerations has been widely discussed, involving urban planning and policy [1,2], human geography [3], regional economics [4,5], transportation system, and other fields [6,7,8]. From the perspective of urban agglomeration formation, certain scholars argue that economic and industrial agglomeration serve as the foundational elements of urban agglomeration [9,10,11], and there are mutual feedback effects between them [12,13,14]. As for the further development and maturity of urban agglomeration, a growing body of scholarly opinion suggests that the evolution of it is influenced by a variety of factors, including geographical conditions, economic foundation, policy context, and more [15,16,17]. Furthermore, as an important support for regional urban areas, some significant advancements have been made in understanding the fundamental role of transportation in regional spatial development [18,19,20]. Researchers are concerned about the mode and degree of transportation construction for regional economic promotion and have conducted a thorough analysis [21,22,23]. This process has generated numerous insightful perspectives, including the enhancement of transportation infrastructure contributing to improved allocation efficiency of regional resources [24,25], and transportation networks fostering the sustainability of urban agglomeration spatial structures [26]. Nevertheless, transportation infrastructure may not always have a positive effect [27,28,29], especially in less developed areas, which leads to the imbalance in the development of urban areas [30,31,32].
At the regional macro level, the relationship between the spatial development of urban agglomerations and the layout of regional comprehensive transportation infrastructure necessitates further exploration [33]. First, the majority of studies endeavor to elucidate the mechanism in all factors for the macro-research object of urban agglomeration. This could lead to ambiguity in conclusions and is not conducive to construction and planning in the urbanization process. Second, studies that solely concentrate on the impact mechanism of regional traffic tend to overlook the exploration of spatial connections and hierarchies within the whole mega-region, while remaining confined to the internal spatial organization of built-up areas. Third, the relationship between individual cities and their internal transportation (such as the relationship between land use and transportation layout, and the impact of transportation infrastructure on urban economic development) has been extensively explored. However, due to the significant scale differences between urban agglomerations and individual cities, these conclusions cannot be directly applied to the spatial level of urban agglomerations. Therefore, the primary objective of this paper is to provide a confirmatory analysis of the link between comprehensive transportation and urban agglomerations from the local space perspective and propose corresponding explanatory mechanisms, complementing prior research on flowing space.
Yangtze River Middle Reaches Urban Agglomeration (YRMRUA), located in the core area of China’s Yangtze River Economic Belt (Figure 1), is at the intersection of three horizontal and two vertical national traffic arteries. YRMRUA’s significance is highlighted in the latest national comprehensive three-dimensional transportation network planning of China, with provincial capitals like Wuhan and Changsha recognized as crucial transportation hubs on a national scale [34,35].
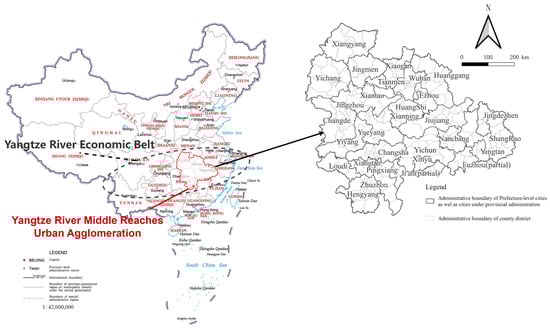
Figure 1.
The research scope and location of YRMRUA.
The importance and research significance of YRMRUA are also reflected in the relevant planning. In 2010, China’s Main Functional Zone Plan designated YRMRUA as one of the key development zones. Unlike the other 14 urban agglomerations in China’s 14th Five-Year Plan [36], YRMRUA is one of the only five national-level urban agglomeration. In the development planning of YRMRUA itself, many development directions have been clarified. The planning requires YRMRUA to rely on key development axes such as Shanghai–Kunming, Beijing–Guangzhou, Beijing–Jiujiang, and others, to form a pattern of reasonable division of labor and coordinated development among large- and medium-sized cities and small towns along the line (Figure 2). These development axes are actually named after inter-regional transportation corridors. Therefore, this determines that, compared with other urban agglomeration, there is a close connection between the development of YRMRUA and comprehensive transportation.
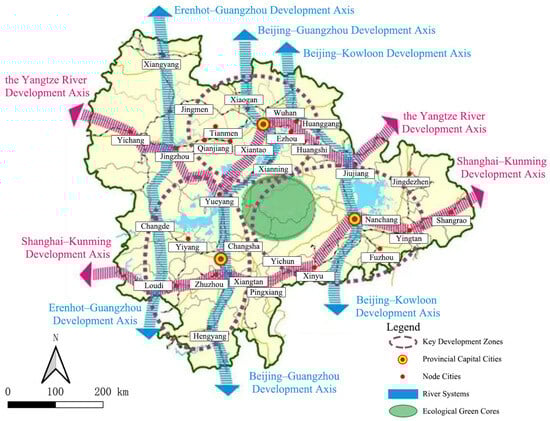
Figure 2.
The strategic guidance of YRMRUA’s development planning.
Consequently, this study utilizes YRMRUA as a case study to investigate the influence of transportation infrastructure development and its spatial expansion on the growth of urban agglomeration’s built-up areas. This includes the extent and manner in which the former affects the latter. The research aims to provide insights for the development of growing urban agglomerations in Central and Western China, as well as for the construction of urban agglomerations in developing countries.
2. Materials and Methods
2.1. Research Framework
This study focuses on measuring the impact of comprehensive transportation on the spatial dynamic evolution of YRMRUA and explaining its mechanism. The research framework is illustrated in Figure 3. The research framework can be divided into three levels. The first level involves data processing and dataset creation, utilizing GEE (Google Earth Engine) and ArcGIS as tools. This process involves a two-step procedure of data pre-screening and confirmation [37]. After obtaining the aforementioned data, the required datasets for this study area are determined based on the defined research period. The second level involves data analysis. This study will sequentially employ methods such as fractal dimension based on traffic accessibility (FDTA), the traffic-weighted linear density (TLD), expansion intensity index (EII), and Pearson correlation coefficient (PCC). Specifically, we will employ the FDTA method to ascertain the fractal characteristics of spatial growth in the YRMRUA, that is, to clarify whether the built-up area’s expansion of the YRMRUA exhibits a self-organizing pattern centered around comprehensive transportation infrastructure. Subsequently, we will comprehensively utilize TLD, EII, and PCC to obtain the results of correlational characteristics and group characteristics. These two types of results will, respectively, elucidate whether there is a correlation between TLD and EII within the YRMRUA at the grid cell level, as well as the clustering nature of their spatial distribution. Based on this, spatial groups of YRMRUA’s spatial expansion and transportation resource clusters can be identified. The third level involves mechanism interpretation. Since the impact of comprehensive transportation on regional spatial expansion is a highly complex process, with its effects on regional scales demonstrably exceeding those on individual urban areas, it is difficult to determine the underlying mechanism solely through quantitative analysis. Therefore, this study endeavors to use graphical representation and illustrative examples in the Discussion section to supplement the explanation of the experimental results. This will contribute to a more in-depth understanding of the complex role that comprehensive transportation plays within the spatial context of urban agglomerations and help clarify the differences between the spatial-shaping effects of comprehensive transportation and those of intra-city transportation.
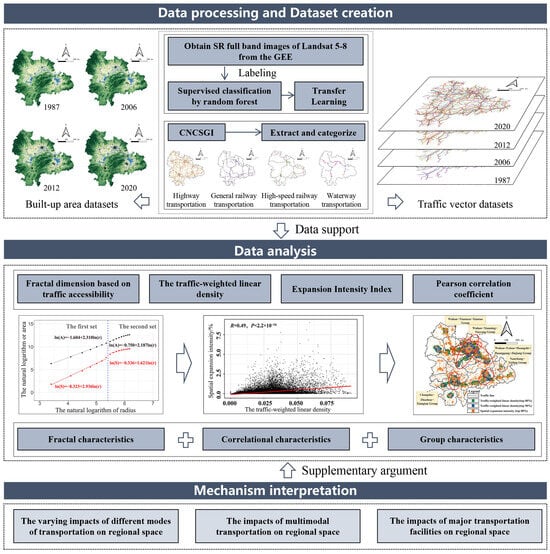
Figure 3.
Research framework.
2.2. Data Sources
The data sources section of the paper includes data on urban built-up areas related to the spatial morphology of urban agglomerations, as well as data on major transportation infrastructure across the administrative area. The original data for built-up areas in this study come from LANDSAT 5 and 8 satellite imagery provided by the GEE (https://earthengine.google.org/ (accessed on 10th March 2024)) platform. The final data were obtained by processing with the random forest algorithm on GEE. These data will be subjected to multiple rounds of filtering and corrected using methods such as spatio-temporal trajectory maps [38,39,40]. The comprehensive transportation (highways, general railways, expressways, and waterways) network data used in this paper comes from China National Catalogue Service for Geographic Information (CNCSGI, https://www.webmap.cn/ (accessed on 10th March 2024)). In addition, regarding the scope of the study period, as 1987, 2006, 2012, and 2020 are crucial time nodes in the formation of the YRMRUA [37], this paper will conduct research in three segments, 1987–2006, 2006–2012, and 2012–2020, with the final year of each segment serving as a significant observation point.
2.3. Methods
2.3.1. Fractal Dimension Based on Traffic Accessibility
From the perspective of spatial fractal theory, the spatial growth of urban agglomerations has a certain tendency of self-organization. To validate whether certain regions of urban agglomerations are propelled by the development of comprehensive transportation infrastructure and network systems, traffic accessibility can be employed as a metric factor within this framework, thereby constructing an associated fractal dimension model [41]. This method helps to identify, at the macro level, whether the spatial expansion of the YRMRUA is unfolding along the layout of comprehensive transportation infrastructure. The construction process of the transportation network dimension constructed according to the fractal dimension is as follows (Equation (1)):
where is the built-up area, is the constant term, is the corresponding agglomeration dimension of the built-up area, and is the scale-invariant of the solution. Take the derivative of this equation with and we obtain the following equation (Equations (2)–(4)):
where is the service area of accessibility distance ; is the constant term; is the agglomeration dimension of the accessibility network, which is calculated in the scale invariant area; and the formula of the built-up areas’ density of accessibility distance is obtained by adjusting the above formula (Equation (5)).
The meanings of the variables in the above equation are consistent with those mentioned in the previous text. In this article, the starting point for calculating the fractal dimension is the tri-provincial border within the YRMRUA. The above model can be considered as an extended form of the Smeed model and judged according to the rules in the following table (Table 1).

Table 1.
The judging standard of FDTA.
2.3.2. The Traffic-Weighted Linear Density
Linear density, along with point density and core density, is one of the measurement tools in ArcGIS. This method calculates based on linear vector elements within a unit area. The weighted density of a transportation network is defined by incorporating traffic-related variables based on linear density [42]. The method facilitates the assessment of the distributional characteristics of the comprehensive transportation development level in the YRMRUA and lays a solid foundation for subsequent correlation analysis and the identification of spatial groups. The definition of transportation network density in this empirical study is as follows (Equation (6)):
where and above are the length of the traffic network falling into the set-radius circle, and are the weight of calculating the density, respectively, is the radius of the circle, and represents the calculated value of TLD.
Based on the empirical research experience, different types and scales of transportation infrastructure generally have a direct impact on land use within a range of 3 to 30 km around them. Therefore, this study takes 30 km as the upper limit of the search radius and divides it into 10 groups, assigning values in a linear gradient from near to far. In addition, as for the weighted calculation, the weights of the railway, road, and water transportation modes are positioned as follows according to the mean value of the normalized passenger and freight turnover results (Table 2).
Table 2.
Weight of linear density of different transportation modes.
2.3.3. Expansion Intensity Index
To provide a quantitative description of the intensity of spatial expansion, the spatial EII can be utilized [43]. This method is capable of effectively abstracting the representation of numerous and tangible spatial expansion patches, with the formula presented as follows (Equation (7)):
In the equation, represents the intensity of growth and expansion of the built-up area within the specified study period, expressed as a percentage value. and represent the areas of the built-up area at the beginning and end of the study period, respectively, with their difference indicating the change in the built-up areas during the study period. denotes the spatial area of the study unit, and represents the time interval of the study period.
2.3.4. Pearson Correlation Coefficient
The Pearson correlation coefficient (PCC) is widely used in the field of social sciences [44,45], which can intuitively show the distribution relationship between the two types of variables, and its formula is as follows (Equation (8)):
where is the calculated value of the correlation coefficient, is the covariance of variables and , and and are the standard deviations of variables and , respectively. In this study, the PCC is utilized to measure the relationship between the EII and the TLD.
3. Results
3.1. Spatial Fractal Characteristics Based on Traffic Network
In the calculation of FDTA, logarithmic operations are performed separately based on the service area formed by the accessibility radius and the built-up area within this service area to obtain the fitting results of and . Concurrently, partitioning is conducted in combination with piecewise functions and R-squared to yield two distinct sets. The results obtained from the figure indicate that the built-up areas within YRMRUA exhibit a certain degree of association and growth characteristics with the transportation network. Furthermore, the construction of ln(A)−ln(r) shows a high goodness of fit with a value exceeding 0.9, indicating that FDTA is applicable to the YRMRUA (Figure 4).
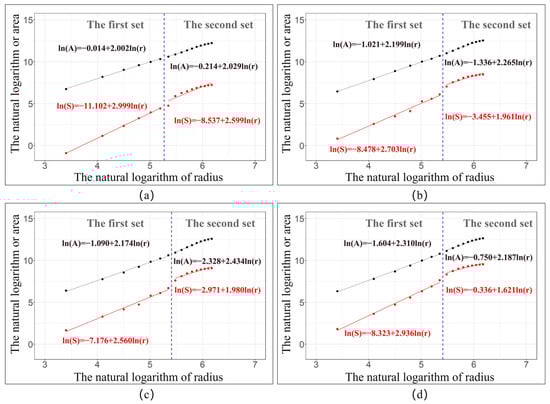
Figure 4.
The calculated process of FDTA: (a) 1987; (b) 2006; (c) 2012; (d) 2020.
After calculating the fractal dimension based on traffic accessibility as shown in the table below (Table 3), the trend of the fractal dimension’s variation becomes further clarified. The results reveal a general downward trend in both sets of dimensions, indicating a gradual shift in the overall morphological pattern of YRMRUA from spatial expansion to agglomeration. The fractal dimension in the first set remains higher than that in the second, with the former being greater than 2 and the latter less than 2, signifying a distinct boundary in growth patterns between the sets. This finding can be interpreted in the following ways: On the one hand, there is a close relationship between the expansion of built-up areas and the accessibility of comprehensive transportation. In particular, within a specific range starting from the provincial administrative boundary intersections, the fractal characteristics of urban built-up areas’ expansion along the transportation network are particularly prominent. On the other hand, the role of comprehensive transportation in promoting the spatial growth of built-up areas is limited and also influenced by various factors such as topographical environment and economic radiation. The driving force of outward diffusion growth does not continue to increase with the extension of accessibility.
Table 3.
The adjusted result of FDTA.
3.2. The Correlation Between TLD and EII
The distributions of TLD at the ends of three stages, namely 2006, 2012, and 2020, as well as the correlational scatter plots of TLD and EII during the corresponding periods, are depicted below (Figure 5). The patches depicted in the figure represent grid cells measuring 30 m in size. In terms of the distribution of TLD, natural breakpoint classification was performed based on 2020 data and mapped onto the results of 2006 and 2012. The high-density areas gradually transformed from non-significant bands to a combined “band + area” pattern. In 2006, the TLD was concentrated along the “Wuhan-Ezhou-Huanggang-Huangshi-Jiujiang”, “Changsha-Zhuzhou-Xiangtan”, “Nanchang-Yichun”, and “Nanchang-Fuzhou” urban zones. The TLD around Wuhan and its surrounding areas was significantly higher than in other regions. This trend was further reinforced by 2012 data, with the “Wuhan-Xianning-Yueyang”, “Wuhan-Yichang”, and the extension of the “Changsha-Zhuzhou-Xiangtan” axis towards “Yueyang-Changde-Yiyang-Loudi-Hengyang” also exhibiting prominent line densities (Figure 5a,b). The areal distribution of linear density became more pronounced in 2020, including urban clusters such as “Wuhan-Ezhou-Huanggang-Huangshi-Xianning” and “Changsha-Zhuzhou-Xiangtan-Pingxiang”. Both relationships passed the significance test at the 0.01 level, with correlation coefficients of 0.47, 0.45, and 0.49 for the three time periods, respectively, indicating a moderate level of correlation. The correlation underwent a slight change, decreasing and then increasing by only 4%. Considering that the overall gridded units numbered over 35,000, this result aligns with statistical expectations and suggests, to some extent, a dependent relationship between TLD and EII (Figure 5d–f).
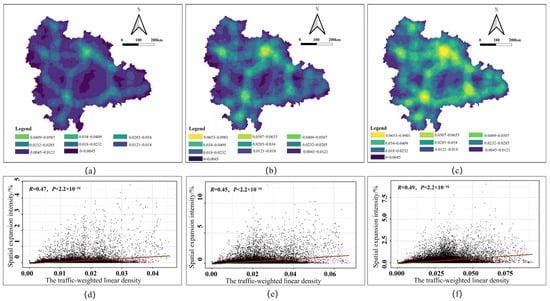
Figure 5.
Distribution of TLD and its correlation with EII of built-up areas: (a) TLD in 2006; (b) TLD in 2012; (c) TLD in 2020; (d) correlation between TLD and EII, 1987–2006; (e) correlation between TLD and EII, 2006–2012; (f) correlation between TLD and EII, 2012–2020.
3.3. The Group Characteristics of Spatial Expansion Guided by Transportation
We selected grid cells with TLD and EII that ranked in the top 80% within their respective domains. Additionally, we segmented the grid cells with TLD in the top 90% to identify the source areas of outward linear density expansion (Figure 6a–c). During the study period, several group structures formed with the support of major transportation networks, such as the Wuhan–Ezhou–Huanggang–Huangshi group, the Changsha–Zhuzhou–Xiangtan group, and the Nanchang–Yichun group. Within the spatial system, key supporting elements included high-speed rail lines like Shanghai–Kunming and Beijing–Guangzhou, as well as major expressways such as Shanghai–Chongqing and Beijing–Hong Kong–Macau.
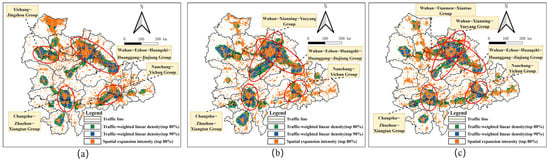
Figure 6.
Cluster groups of TLD and EII: (a) group characteristics in 2006; (b) group characteristics in 2012; (c) group characteristics in 2020.
4. Discussions
4.1. Different Modes of Transportation Exhibit Diversified Spatial Supporting Effects
First and foremost, unlike waterways that merely serve as esthetic features within individual cities, water transportation functions as the fundamental driver of spatial formation in urban agglomerations. Despite the relatively weak overall spatial pattern observed in the YRMRUA region since 1987, the built-up areas of cities and their expansion ratios, while low, have consistently exhibited growth patterns aligned with water transportation routes. This is exemplified by the urban belts along the Yangtze River stretching from Yichang to Jiujiang, the Han River stretching from Xiangyang to Jingmen, and the Xiangjiang River stretching from Yueyang to Hengyang. These urban centers have maintained a profound relationship with water transportation throughout their development, from initial site selection to subsequent expansion (Figure 7). Under the guidance of past urban planning in China, it is noteworthy that the locations of municipal governments in cities are actually also the centers of built-up areas’ expansion. Taking the main navigation channels of the Yangtze River as the central axis and expanding 30 km on either side to form an observation and buffer zone, we have identified the following: within the scope of the Yangtze River’s Middle Reaches Urban Agglomeration, there are 15 prefecture-level urban growth centers along the river (accounting for 50% of the total), and 103 county-level urban growth centers (accounting for 48% of the total).
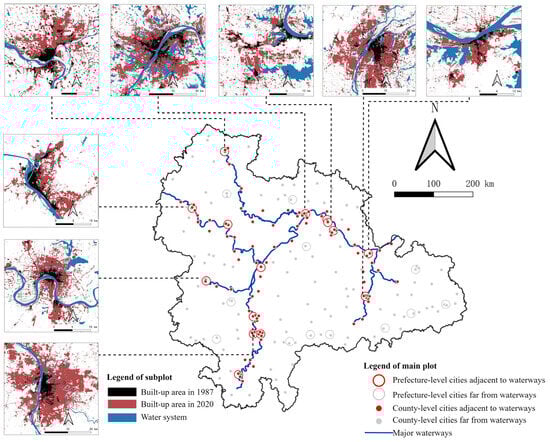
Figure 7.
Urban growth centers along the Yangtze River waterways.
The horizontal extension of towns along riverbanks and the emergence of links between central city clusters, influenced by variations in urban planning, economic aggregate level and scale, have culminated in the formation of a composite belt network structure centered around waterways. From the spatial diagrams, we can gain a better understanding of these relationships (Figure 8). If we consider cities as point structures and transport routes as line structures, the “point—line” relationships in a region will differentiate into three types: ring-shaped form, belt-shaped form, and cone-shaped form. It is this diversity in types that constitutes the characteristics of YRMRUA spatial patterns.
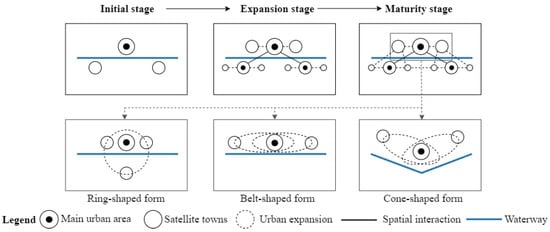
Figure 8.
The correlation between the spatial system of urban agglomerations and waterways.
Secondly, rail transit, particularly in the form of high-speed and intercity railways, has emerged as a pivotal extension of spatial organization for urban agglomerations. Leveraging its advantages of high speed, punctuality, and superior service quality, rail transit has become a new cornerstone for the spatial organization of the YRMRUA within the transportation system. This is evident in cities aligned along the “Wuhan-Xianning-Changsha-Hengyang” corridor of the Beijing–Guangzhou Railway, where the integration of rail transit has facilitated the seamless stitching of spatial structure gaps and the enhancement of the overall spatial system. Since the inauguration of high-speed rail, spatial growth has demonstrated a notable “synchronous attribute”, with the coefficient of variation for built-up area growth decreasing from 0.84 to 0.73, indicating a more consistent and coordinated development pattern. In alignment with the nationwide trend of constructing high-speed rail trunk lines, intercity high-speed rail projects have been incorporated into the key construction initiatives within the urban and land use planning of various regions in the YRMRUA. Cities along other intercity railway lines, such as “Wuhan-Xiaogan”, “Wuhan-Huanggang”, and “Nanchang-Jiujiang” have also exhibited increasing urbanization trends, with corresponding decreases in the coefficients of variation for built-up area growth. This indicates that the launch of high-speed rail within the YRMRUA has accelerated the integration process of cities along the railway lines. During this process, the economic spillover and feedback effects are transmitted through the HSR network, gradually guiding the spatial development of various cities within the YRMRUA.
Lastly, highway traffic serves as the essential supporting framework for spatial development, and together with the railway system, it has promoted the process of sub-urbanization in cities [46]. While rail transit has significantly reduced travel and logistics times, it alone cannot fully address the connectivity needs between central cities and peripheral counties. In this regard, roads offer greater flexibility, particularly in freight transportation, meeting specific time-sensitive delivery requirements and facilitating rapid point-to-point transportation to meet industrial customization needs. Previous studies have confirmed that the development of highway transportation exhibits adaptive characteristics to regional economic and social conditions [47,48]. Specifically, in urban studies, we typically examine the spatial structure formed by urban centers and transportation arteries, as well as how the construction of these transportation arteries shapes the unique characteristics of urban form. However, within the context of urban agglomerations, our focus shifts to the impact exerted by the extended areas along major highways on the entire regional system. Within YRMRUA, the spatial growth areas of the vast majority of cities have already been covered within a 3 km range along the highways (Figure 9). This indicates that the YRMRUA has developed a highly extensive expansion pattern along the highway network.
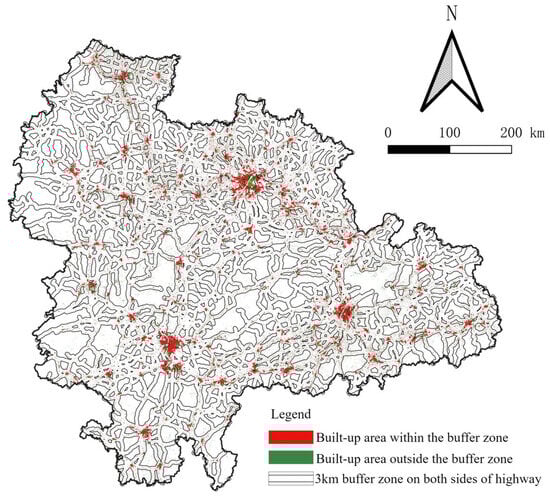
Figure 9.
The urban built-up areas adjacent to highways within YRMRUA.
Furthermore, in regions where high-speed rail is not yet accessible, such as Jingmen and Yiyang, road transportation remains a highly dependent mode of transportation. The high flexibility and adaptability of road transportation make it an effective complement to other modes of transportation, playing a crucial supporting role in the regional transportation system. The formation of a three-tiered network combining “expressways, national highways, and provincial highways” has established a robust framework for city-to-city connectivity, with expressways serving as the backbone for passing through urban areas and gradually expanding to cover most counties and cities. Additionally, expressways function as spatial development boundaries and guides, with pre-delineated city-bypass routes often serving as urban development boundaries, defining multiple exits to direct and orient development, thus forging strong connections between various urban groups. The expansion pattern of cities in the YRMRUA, formed along road transportation routes, appears highly regular (Figure 10). For instance, the master planning of Wuhan and Changsha within the YRMRUA clearly delineated the location and alignment of ring expressways, which not only imposed effective constraints on urban sprawl but also strategically oriented the direction of spatial development. This finding also indicates that the spatial effects of highway transportation on the YRMRUA differ across the two levels of urban agglomerations and individual cities.
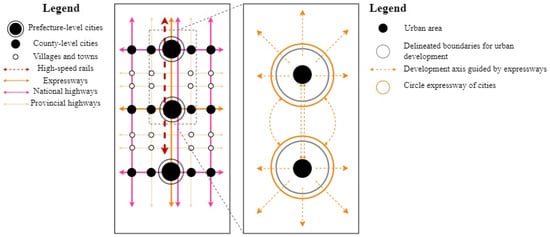
Figure 10.
The supporting role of the highways system.
4.2. Multimodal Transportation Promotes Compact Outward Expansion of Region
In fact, there is a broad two-way interactive relationship between regional development and transportation infrastructure construction [49,50], and the former has also promoted the latter to become more mature. The mutual effects generated among regional transportation facilities can be understood as a form of transportation advantage, providing an explanatory framework for regional spatial structure [51]. Especially since the economic promotion effect of transportation often occurs in the early stages of transportation construction [52], it relies on the mode of comprehensive transportation to provide lasting impetus. The comprehensive transportation infrastructure and the spatial distribution of built-up areas align well with the development planning of the YRMRUA. Multimodal transportation supplements the traditional regional functions, solidifies the spatial configuration of urban agglomerations, and forms a spatial structure with regional characteristics (Figure 11).
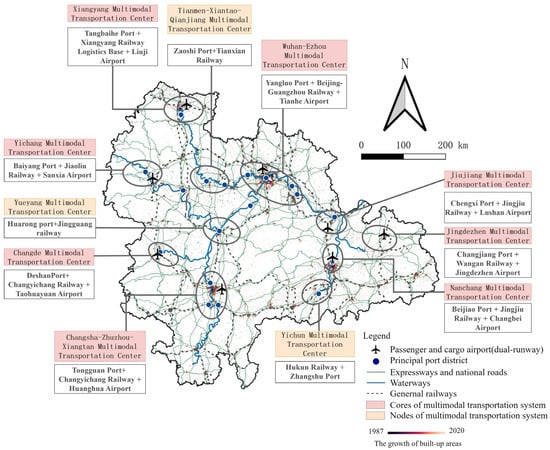
Figure 11.
YRMRUA’s multimodal transportation center distribution.
The combination of roads, railways, waterways, and airports can form a variety of modes of multimodal transportation, which is also one of the characteristics of a modern transportation system. Including but not limited to the combined transportation of rail and water, and the integrated transportation of rail and water, air and water, etc. is essential [53,54]. Different multimodal transportation methods also have their own unique advantages and applicable scopes (Table 4).
Table 4.
Applicable scopes of different modes of multimodal transportation.
Waterway combined transportation is the most common mode of multimodal transportation in YRMRUA and has profoundly shaped the regional space system (Figure 12a). In practical applications, this type of multimodal transportation is generally centered around the land use planning and specialized planning of the port. It guides the formation of a spatial system that relies on a banded and radial pattern along the waterway axis. The resulting reconstruction of the spatial system manifests in the improvement of spaces along both sides of the river and the emergence of distinct characteristics in the extended forms along the port access channels (Figure 12b). The figure reveals a complex “T”—shaped or dual—axis spatial expansion pattern formed by the interaction between towns and comprehensive transport systems. For instance, the Wuhan Yangluo Port has implemented a combined rail–water transportation system, utilizing the Yangtze River waterway, Jiangbei Railway, expressway, and the beltway to form a comprehensive “road-rail-water” logistics channel, resulting in a breakthrough efficiency of over 30% in its demonstration zone. Meanwhile, the Ezhou Sanjiang Port Area has also adopted a dedicated railway line and relies on the Huangxian Expressway to form a combined transportation mode. Similarly, the Huangshi New Port has integrated the Shannan Railway, Xingang Branch Line, and Qijia Expressway to establish its own multimodal transportation system. In this process, certain areas demonstrate the comparative advantages of “water-rail” transportation. For example, in the “Nanchang-Jiujiang” corridor, goods from the Jiujiang Port along the Yangtze River are directly transported to the logistics park in the newly built area of Nanchang via railway, achieving point-to-point delivery compared to the shipping on Ganjiang River. Although tributary regions are constrained by waterway transportation turnover and remain on the fringes of the freight transportation system, they still retain distinct local characteristics. Specifically, the Zhuhui District in Hengyang has formed a combined transportation area centered around the Hongguang and Dongjiang logistics parks, connecting to the Beijing–Hong Kong line via a dedicated railway. This allows the construction materials, equipment manufacturing, and food processing industries along the line to participate in the regional division of labor and guides the urban area to expand towards the southeast and south.
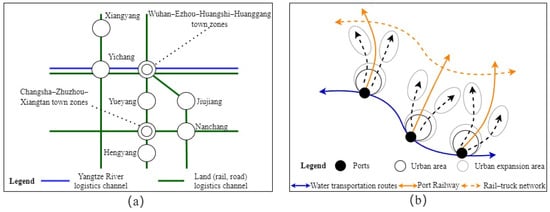
Figure 12.
Multimodal transportation promotes spatial reconstruction: (a) spatial structure of urban system; (b) spatial joint growth structure.
4.3. Major Transportation Facilities Guide the Inward Filling of Regional Space
Transportation hub stations have spearheaded the infill development of the built-up areas in YRMRUA. To better compare the differences in the driving effects of transportation hubs and networks, as well as their overall impact, we take the provincial capital cities of Wuhan, Changsha, and Nanchang as examples (Figure 13). The following diagrams illustrate the growth of built-up areas within the urban boundaries, along with rose diagrams, major transportation hubs, and associated networks. From the diagrams, it is evident that while the networks that play a guiding role at the macro level tend to express more restrictive effects on spatial growth at the micro level, the distribution of various hub stations shows a better correlation with the concentrated areas of spatial morphological growth.
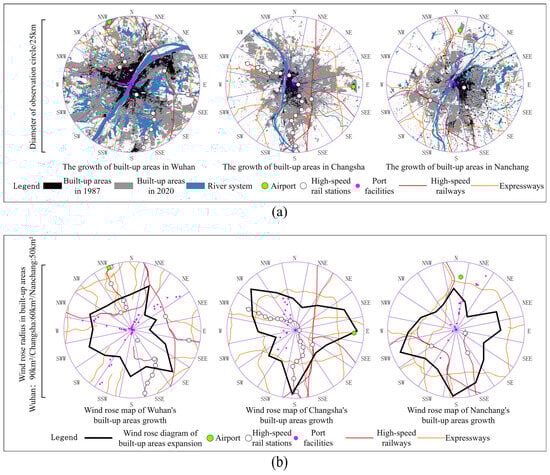
Figure 13.
The correlation between transportation infrastructures and the distribution of built-up areas: (a) from the perspective of spatial form; (b) from the perspective of spatial distribution.
From the perspective of transportation hubs, on one hand, the establishment of these hubs generates a strong aggregating force and integrates organically with the surrounding developed land, thereby enhancing vitality. Transportation infrastructure plays a pivotal role in economic development and cultural exchange [55]. On the other hand, the government often sets high-speed rail new cities, port new cities, and airport new cities as spatial development goals.
Newly built high-speed railway stations are often regarded as important means to guide new economic growth, promote industrial upgrading, and generate integration. In recent years, the impact of high-speed rail on economic development has been gradually expanding [56]. Therefore, in urban master planning, they are usually combined with business districts to form a “high-speed rail city” model for construction. In practice, this directly affects an area of over 1 square kilometer and guides the formation of spatial sequences within 3 km. The resulting effects include, on the one hand, the direct filling effect on idle land around the edge of the urban area, and on the other hand, due to the development of commercial and business functions, it further drives the value of surrounding land to increase and further attracts investment groups. Ultimately, a layered structure of “station core—surrounding commercial and trade service area—outer service area” is formed (Figure 14). Successful cases include the spatial combination of Wuhan High-speed Railway Station and its front business district, with a core construction area exceeding 1 million square meters. The large-scale spatial carrier serving as a landmark on the central axis in front of the station has been completed, and an industrial cluster focusing on “office buildings—hotel apartments” has gradually formed. In addition, after the completion of Changsha South Railway Station, a development axis for the high-speed rail new town running east to west was formed. To the east of the station is an ecological park, and 1 km across the Liuyang River is the Changsha International Convention and Exhibition Center and its conference hall. Two kilometers to the east is a series of commercial and business areas serving the exhibition, while within a range of 0.5 to 1 km to the southwest of the station core area, contiguous residential areas are used as a means of urban renewal. As for Nanchang West Railway Station, it adopts contiguous development as a means of spatial filling, forming a development axis symmetrical to the north–south station square. On both sides of the axis, hotel and shopping mall service clusters are formed in combination with residential areas, automobile passenger transportation, and parking stations, while to the south, contiguous residential development and reserved commercial axes are the main types.
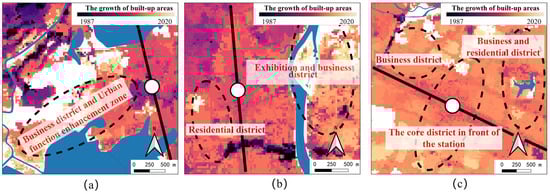
Figure 14.
An illustration of the impact of high-speed rail stations on surrounding built-up areas: (a) Wuhan High-Speed Railway Station; (b) Changsha South High-Speed Railway Station; (c) Nanchang West High-Speed Railway Station.
In a broad sense, a port is a combination of a series of transportation facilities, including but not limited to waterway-level channels, berths, anchorages, as well as onshore facilities such as terminals, distribution yards, and production and storage facilities. Therefore, it is a complete and independent system in itself. The current development strategy of integration planning is to further integrate the dual system of “city-port”, especially focusing on the construction of production space to improve bilateral efficiency and provide service support. In the integrated construction, it is usually guided to form outward concentric circles centered on the port area and facilitate the formation of multiple new urban sectors (Figure 15). Among urban agglomerations, the Wuhan Yangluo Port Area, Yueyang Chenglingji Port Area, and Jiujiang Chengxi Port Area stand out as exemplary cases, sharing a common trait of inward growth along the riverside industrial corridor. Specifically, the Yangluo Port Area fosters industrial linkages with the northwest and due north, extending and integrating a range of industrial development axes. Meanwhile, the eastern side’s “tourism-residence-research-education” service cluster and the southern riverside industrial belt have also undergone renovation and enhancement. The Yueyang Chenglingji Port Area, built upon the foundation of a riverside industrial belt comprising river ports and the grain and oil industry, has subsequently expanded eastward to establish a “bioscience-new materials-building materials” industrial park and belt. As for the Jiujiang Chengxi Port Area, it has formed a horizontal westward expansion amidst the backdrop of port development. North of Jiurui Avenue lies the industrial development axis, centered around equipment manufacturing, new materials, and electrical equipment, giving rise to a segmented development approach.
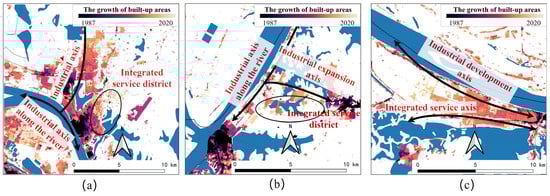
Figure 15.
Illustration of impact of ports on surrounding built-up areas: (a) Wuhan Yangluo Port; (b) Yueyang Chenglingji Port; (c) Jiujiang Chengxi Port.
In addition to the significant impact of the two types of facilities mentioned above on spatial expansion, cities in recent years have also been attempting development planning centered around airports [57]. The surrounding areas of airports possess both “functional restrictions” and “functional radiation” characteristics. As a result, they spatially form a layered and gradually increasing impact from the inside out, effectively filling the spaces in the near-port regions. More specifically, within a 5 km radius of the airport facilities, functions directly related to aviation, such as services, warehousing, and industry, will be arranged. Within a 20 km radius, there are height restrictions, reducing the intensity of development. Beyond this radius lies the economic radiation zone, which is typically developed in a combined form of “business—entertainment—residence” to guide and fill in the vacant areas of urbanized regions (Figure 16).
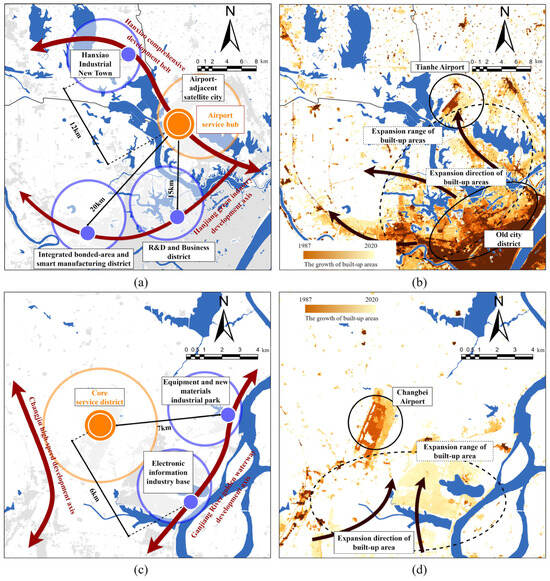
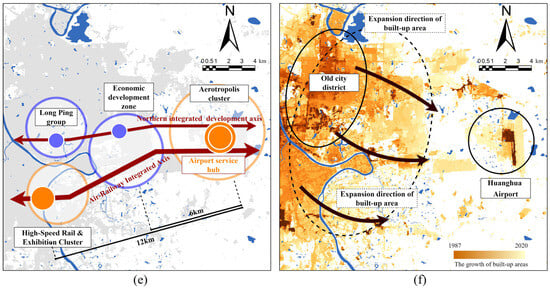
Figure 16.
An illustration of the impact of airports on surrounding built-up areas: (a) the structure of spatial expansion around Tianhe Airport; (b) the pattern of spatial expansion around Tianhe Airport; (c) the structure of spatial expansion around Changbei Airport; (d) the pattern of spatial expansion around Changbei Airport; (e) the structure of spatial expansion around Huanghua Airport; (f) the pattern of spatial expansion around Huanghua Airport.
5. Conclusions
Comprehensive transportation infrastructure can exert a characteristic shaping effect on the growth of built-up areas within urban agglomerations. For YRMRUA, regional transportation facilities not only serve as the fundamental basis for its spatial construction but also provide momentum for the formation of specific spatial expansion patterns at both the macro and micro levels of the urban agglomeration. This shaping effect on the agglomeration’s space is distinct from the role of intra-city transportation in land use, and it is limited rather than determinative. It highlights the complexity of regional development dynamics and provides new insights into understanding spatial patterns at different scales between urban and urban agglomeration.
Through the use of GIS platforms and mathematical statistical analysis, this study observes YRMRUA in typical years and arrives at the following main conclusions:
- (1)
- Constructing the FDTA model outward from the provincial administrative boundary intersections, the fractal dimension at each time node can be significantly divided into two sets. The first set consistently has a value greater than 2, while the second set evolves from being greater than 2 to less than 2. Overall, both sets show a decreasing trend in their dimensions. These results indicate that YRMRUA exhibits a certain fractal growth pattern under the influence of transportation development, with a fractal trend of becoming more cohesive along transportation routes. Nevertheless, the fractal trend of idealized urban built-up area growth exhibiting self-organization characteristics did not materialize.
- (2)
- From the perspective of a 30 m grid cell, the pattern characteristics of YRMRUA’s TLD gradually become clearer over time. High-density areas gradually transition from non-significant bands to a combined “band + area” form. The correlation coefficients between TLD and EII are 0.47, 0.45, and 0.49 at the end of the three time periods, respectively, indicating a moderate level of correlation and suggesting a certain spatial relationship between the two.
- (3)
- By extracting areas with high TLD and EII, specific group structures are formed. These include the Wuhan–Ezhou–Huanggang–Huangshi group, the Changsha–Zhuzhou–Xiangtan group, and the Nanchang–Yichun group. Within these groups, regional transportation arteries such as the Shanghai–Kunming High-Speed Railway, Beijing–Guangzhou High-Speed Railway, and Beijing–Hong Kong–Macau Highway serve as critical supports.
- (4)
- Different modes of transportation have varying effects on spatial expansion. Waterway transportation constitutes the basic form of space generation, railway transportation extends the space, and road transportation supports the space. The combined transportation of different modes enables the YRMRUA to form a more efficient and compact spatial structure.
The future research direction of this article will be to further investigate the interactive relationship between actual traffic volume and spatial expansion, as well as the relationship between factor movements and transportation facilities’ layouts [58], in order to obtain the correlation characteristics from the dual perspectives of flowing space and local space. Additionally, different cities within the YRMRUA will be classified into various types and levels for in-depth discussion. Against the backdrop of big data development, we will propose comprehensive optimization strategies for the planning, construction, and regulation of urban and transportation systems for each type of city, aiming to enhance the universal applicability of our conclusions.
Author Contributions
Conceptualization, Z.F.; writing—original draft preparation, Z.F.; visualization, Z.F. and W.L.; investigation, Z.F. and C.L.; writing—review and editing, M.X.; funding acquisition, M.X. and Z.F. All authors have read and agreed to the published version of the manuscript.
Funding
This research was funded by the Post-Funded Projects of the National Social Science Fund (Grant No. 23FYSB047), the Doctoral Research Start-up Fund Project of Hubei University of Technology (Grant No. XJ2024003201), and the Fundamental Research Funds for the Central Universities (Grant No. 2021yjsCXCY044).
Data Availability Statement
The data presented in this study are available on request from the corresponding author; the data are not publicly available due to project confidentiality.
Conflicts of Interest
Author Weiyang Luo was employed by the CCCC Second Harbor Engineering Company Ltd. The remaining authors declare that the research was conducted in the absence of any commercial or financial relationships that could be construed as a potential conflict of interest.
Abbreviations
The following abbreviations are used in this manuscript:
| EII | Expansion intensity index |
| FDTA | Fractal dimension based on traffic accessibility |
| PCC | Pearson correlation coefficient |
| TLD | Traffic-weighted linear density |
| YRMRUA | Yangtze River Middle Reaches Urban Agglomeration |
References
- Li, L.; Ma, S.; Zheng, Y.; Xiao, X. Integrated Regional Development: Comparison of Urban Agglomeration Policies in China. Land Use Policy 2022, 114, 105939. [Google Scholar] [CrossRef]
- Lu, Y.; Xie, D.; Liu, H.; Zhong, Z. Impact of Urban Agglomeration Development Planning Policy on the Promotion of Efficiency of Urban Economic Development: Empirical Evidence from 283 Cities in China. J. Urban Plan. Dev. 2024, 150, 04024042. [Google Scholar] [CrossRef]
- Shi, S.; Wong, S.K.; Zheng, C. Network Capital and Urban Development: An Inter-Urban Capital Flow Network Analysis. Reg. Stud. 2022, 56, 406–419. [Google Scholar] [CrossRef]
- Maket, I.; Szakálné Kanó, I.; Vas, Z. Urban Agglomeration and Regional Economic Performance Connectedness: Thin Ice in Developing Regions. Res. Glob. 2024, 8, 100211. [Google Scholar] [CrossRef]
- Chen, S.; Du, Y.; Liu, Y. Regional Integration and Urban Green and Low-Carbon Development: A Quasi-Natural Experiment Based on the Expansion of the Yangtze River Delta Urban Agglomeration. Sustainability 2025, 17, 3621. [Google Scholar] [CrossRef]
- Zheng, W.; Du, N.; Wang, X. Understanding the City-Transport System of Urban Agglomeration through Improved Space Syntax Analysis. Int. Reg. Sci. Rev. 2022, 45, 161–187. [Google Scholar] [CrossRef]
- Liu, X.; Huang, J.; Lai, J.; Zhang, J.; Zhao, P. Analysis of Urban Agglomeration Structure through Spatial Network Analysis and Mobile Phone Data. Trans. GIS 2021, 25, 1949–1969. [Google Scholar] [CrossRef]
- Liu, Y.; Zhang, X.; Pan, X.; Ma, X.; Tang, M. The Spatial Integration and Coordinated Industrial Development of Urban Agglomerations in the Yangtze River Economic Belt, China. Cities 2020, 104, 102801. [Google Scholar] [CrossRef]
- He, Y.; Zhou, G.; Tang, C.; Fan, S.; Guo, X. The Spatial Organization Pattern of Urban-Rural Integration in Urban Agglomerations in China: An Agglomeration-Diffusion Analysis of the Population and Firms. Habitat Int. 2019, 87, 54–65. [Google Scholar] [CrossRef]
- Wu, F.; Fang, C.; Zhao, Y. PAF Model of Study on Urban Industrial Agglomeration Dynamic Mechanism and Patterns. Geogr. Res. 2011, 30, 71–82. [Google Scholar] [CrossRef]
- Zhang, Y.; Wang, S.; Zhou, R. Spatial Sorting and Selection within Urban Agglomerations: A Tripartite Evolutionary Game Model Approach. Humanit. Soc. Sci. Commun. 2025, 12, 57. [Google Scholar] [CrossRef]
- Thisse, J.-F. Human Capital and Agglomeration Economies in Urban Development. Dev. Econ. 2018, 56, 117–139. [Google Scholar] [CrossRef]
- Pangarso, R.A.; Suharyadi, R.; Rijanta, R. The Spatial Patterns and Local Economic Determinant of Industrial Agglomeration in Semarang District, Indonesia. Geoplanning J. Geomat. Plan. 2020, 6, 99–112. [Google Scholar] [CrossRef]
- Liu, Y.; Yang, M.; Cui, J. Urbanization, Economic Agglomeration and Economic Growth. Heliyon 2024, 10, e23772. [Google Scholar] [CrossRef]
- Tan, R.; Zhou, K.; He, Q.; Xu, H. Analyzing the Effects of Spatial Interaction among City Clusters on Urban Growth—Case of Wuhan Urban Agglomeration. Sustainability 2016, 8, 759. [Google Scholar] [CrossRef]
- Yeh, G.O.; Chen, Z. From Cities to Super Mega City Regions in China in a New Wave of Urbanisation and Economic Transition: Issues and Challenges. Urban Stud. 2020, 57. [Google Scholar] [CrossRef]
- Cheng, M.; Li, L.; Zhou, Y. Exploring the Urban-Rural Development Differences and Influencing Factors in the Huang-Huai-Hai Plain of China. J. Geogr. Sci. 2020, 30, 1603–1616. [Google Scholar] [CrossRef]
- Pokharel, R.; Bertolini, L.; Brmmelstroet, M.T.; Acharya, S.R. Spatio-Temporal Evolution of Cities and Regional Economic Development in Nepal: Does Transport Infrastructure Matter? J. Transp. Geogr. 2021, 90, 102904. [Google Scholar] [CrossRef]
- Lu, Y.; Xu, X.; Zhu, G.; Peng, Y.; Li, Y.; Zhao, X. Land Space and High-Speed Transportation Coordinated Development Evaluation in the Beijing–Tianjin–Hebei Urban Agglomeration of China. Land 2024, 13, 1693. [Google Scholar] [CrossRef]
- Bojan, V. Space, Agglomeration Economies and Urban Development. Glas. Srp. Geogr. Društva 2019, 99, 79–98. [Google Scholar] [CrossRef]
- Zhou, H.; Gao, H. The Impact of Urban Morphology on Urban Transportation Mode: A Case Study of Tokyo. Case Stud. Transp. Policy 2018, 8, 197–205. [Google Scholar] [CrossRef]
- Chen, Z.; Li, X. Economic Impact of Transportation Infrastructure Investment under the Belt and Road Initiative. Asia Eur. J. 2021, 19, 131–159. [Google Scholar] [CrossRef] [PubMed]
- Ventura, P.; Zazzi, M.; Rossetti, S.; Carra, M. Urban Development and Airports in Northern and Central Italy: Main Trends and a Focus on Parma Giuseppe Verdi Case Study. Transp. Res. Procedia 2020, 45, 914–921. [Google Scholar] [CrossRef]
- Cao, C.; Su, Y. Transportation Infrastructure and Regional Resource Allocation. Cities 2024, 155, 105433. [Google Scholar] [CrossRef]
- Wang, L.; Wu, Z.; Ye, H.; Feng, W. Spatial Effect of Transportation Infrastructure on Regional Circular Economy: Evidence from Guangdong-Hong Kong-Macao Greater Bay Area. Environ. Sci. Pollut. Res. 2023, 30, 50620–50634. [Google Scholar] [CrossRef]
- Sun, X.; Xiang, P.; Ngoduy, D.; Sui, H.; Zhang, B. Can Transportation Networks Contribute to the Sustainable Development of Urban Agglomeration Spatial Structures? Sustain. Cities Soc. 2024, 117, 105983. [Google Scholar] [CrossRef]
- Rokicki, B.; Stpniak, M. Major Transport Infrastructure Investment and Regional Economic Development—An Accessibility-Based Approach. J. Transp. Geogr. 2018, 72, 36–49. [Google Scholar] [CrossRef]
- Chan, H.-Y.; Xu, Y.; Wang, Z.; Chen, A. The Deeper and Wider Social Impacts of Transportation Infrastructure: From Travel Experience to Sense of Place and Academic Performance. Transp. Policy 2024, 158, 51–63. [Google Scholar] [CrossRef]
- Wang, P.; Zhang, Q.; Cai, Y. Spatial Evolution of Water Transportation Industry Based on Multi-Source Data: Understanding the Structural Consolidation and Integration Demand in Coastal Cities. Hum. Ecol. Risk Assess. Int. J. 2023, 29, 817–835. [Google Scholar] [CrossRef]
- Oswald Beiler, M.; Mohammed, M. Exploring Transportation Equity: Development and Application of a Transportation Justice Framework. Transp. Res. Part Transp. Environ. 2016, 47, 285–298. [Google Scholar] [CrossRef]
- Wan, J.; Xie, Q.; Fan, X. The Impact of Transportation and Information Infrastructure on Urban Productivity: Evidence from 256 Cities in China. Struct. Change Econ. Dyn. 2024, 68, 384–392. [Google Scholar] [CrossRef]
- Li, J.; Wang, P.; Ma, S. The Impact of Different Transportation Infrastructures on Urban Carbon Emissions: Evidence from China. Energy 2024, 295, 131041. [Google Scholar] [CrossRef]
- Ren, B.; Tian, Y.; Xiao, X. Spatial Effects of Transportation Infrastructure on the Development of Urban Agglomeration Integration: Evidence from the Yangtze River Economic Belt. J. Transp. Geogr. 2022, 104, 103431. [Google Scholar] [CrossRef]
- Zheng, Z.; Qingyun, H. Spatio-Temporal Evaluation of the Urban Agglomeration Expansion in the Middle Reaches of the Yangtze River and Its Impact on Ecological Lands. Sci. Total Environ. 2021, 790, 148150. [Google Scholar] [CrossRef]
- Luo, Y.; Zhang, M.; Cao, Q.; Wang, L. An Evaluation of the WRF Physical Parameterizations for Extreme Rainfall Simulation in the Yangtze River Middle Reaches Urban Agglomeration. Urban Clim. 2024, 58, 102149. [Google Scholar] [CrossRef]
- Zheng, H.; Hsiao, Y.L.; Ho, H.W.; Ji, C.; Zhang, S. How the Spatial Functional Division of Labor in Urban Clusters Affects Urban Population Size? Evidence from 19 Urban Clusters in China. Humanit. Soc. Sci. Commun. 2024, 11, 1459. [Google Scholar] [CrossRef]
- Fan, Z.; Zhong, Z. Spatial Morphological Characteristics and Evolution of Policy-Oriented Urban Agglomerations—Take the Yangtze River Middle Reaches Urban Agglomeration as an Example. Sustainability 2023, 15, 13736. [Google Scholar] [CrossRef]
- Li, X.; Gong, P.; Liang, L. A 30-Year (1984–2013) Record of Annual Urban Dynamics of Beijing City Derived from Landsat Data. Remote Sens. Environ. 2015, 166, 78–90. [Google Scholar] [CrossRef]
- Zomlot, Z.; Verbeiren, B.; Huysmans, M.; Batelaan, O. Trajectory Analysis of Land Use and Land Cover Maps to Improve Spatial-Temporal Patterns, and Impact Assessment on Groundwater Recharge. J. Hydrol. 2017, 554, 558–569. [Google Scholar] [CrossRef]
- Liu, D.; Chen, N. Satellite Monitoring of Urban Land Change in the Middle Yangtze River Basin Urban Agglomeration, China between 2000 and 2016. Remote Sens. 2017, 9, 1086. [Google Scholar] [CrossRef]
- Zhang, C.; Gao, J.; LI, S.; Gao, S.; Zhao, J. Fractal Dimension Study of Urban Morphology Based on Network Accessibility (In Chinese). Geogr. Res. 2018, 37, 2528–2540. [Google Scholar]
- Zhixin, F.; Yingbiao, C.; Qinglan, Q.; Shuaishuai, W. Relationship between the Structure of Urban Traffic Network and Urban Spatial Expansion: A Case Study of Dongguan City. J. Geo-Inf. Sci. 2014, 16, 79–86. (In Chinese) [Google Scholar]
- Theres, L.; Radhakrishnan, S.; Ogwankwa, F.; Murali, G. Determining Region of Urban Expansion Based on Urban Growth Pattern and Intensity as a Driving Factor Using Regression Modelling Approach in Salem, India. Earth Sci. Inform. 2025, 18, 235. [Google Scholar] [CrossRef]
- Mayoyo, N. Mental Health and Academic Engagement: The Influence of Cyber Dating Abuse Victimization on Undergraduate Students. Open J. Soc. Sci. 2025, 13, 16. [Google Scholar] [CrossRef]
- Sang, H.; Zhang, D.; Zhang, C.; Xi, C.; Fang, K.; Shi, B.; Chang, L. Study on the Spatial Distribution Pattern of Correlation Between Surface Deformation and Reservoir Water Level in the Three Gorges Reservoir Area: Spatial Distribution Pattern of Correlation Study in the Three Gorges Reservoir Area: Sang et Al. Landslides 2025, 22, 77–93. [Google Scholar] [CrossRef]
- Yudhistira, M.H.; Indriyani, W.; Pratama, A.P.; Sofiyandi, Y.; Kurniawan, Y.R. Transportation Network and changes in Urban Structure: Evidence from the Jakarta Metropolitan Area. Res. Transp. Econ. 2019, 74, 52–63. [Google Scholar] [CrossRef]
- Hong, J.; Chu, Z.; Wang, Q. Transport Infrastructure and Regional Economic Growth: Evidence from China. Transp. Infrastruct. Reg. Econ. Growth Evid. China 2011, 38, 737–752. [Google Scholar] [CrossRef]
- Wan, J.; Ma, C.; Jiang, T.; Phillips, A.; Wu, X.; Wang, Y.; Wang, Z.; Cao, Y. A Spatial Econometric Investigation into Road Traffic Accessibility and Economic Growth: Insights from the Chengdu-Chongqing Twin-City Economic Circle. Palgrave Commun. 2024, 11, 1–9. [Google Scholar] [CrossRef]
- Magazzino, C.; Mele, M. On the Relationship between Transportation Infrastructure and Economic Development in China. Res. Transp. Econ. 2021, 88, 100947. [Google Scholar] [CrossRef]
- Maparu, T.S.; Mazumder, T.N. Transport Infrastructure, Economic Development and Urbanization in India (1990–2011): Is There Any Causal Relationship? Transp. Res. Part Policy Pract. 2017, 100, 319–336. [Google Scholar] [CrossRef]
- Wu, X.; Wu, P.; Guo, Z. The Correlations of Transportation with Regional Economy and Demographic Space. J. Intell. Fuzzy Syst. 2021, 41, 4813–4823. [Google Scholar] [CrossRef]
- Komornicki, T.; Goliszek, S. New Transport Infrastructure and Regional Development of Central and Eastern Europe. Sustainability 2023, 15, 5263. [Google Scholar] [CrossRef]
- Cherednichenko, K.; Ivannikova, V.; Sokolova, O.; Yanchuk, M. Model of Transport Safety Assessment in Multimodal Transportation Systems. Transport 2023, 38, 204–213. [Google Scholar] [CrossRef]
- Liu, J.; Xu, H.; Chen, J. The Effects and Conflicts of Co-Opetition in a Rail-Water Multimodal Transport System. Ann. Oper. Res. 2023, 1–46. [Google Scholar] [CrossRef]
- Zhang, C.; Dong, X.; Tseng, C.-Y. From Ancient Silk Road to Contemporary Belt and Road: Different Cognition on Transportation Corridor Driven Regional Development. China City Plan. Rev. 2020, 29, 31–39. [Google Scholar] [CrossRef]
- Shen, P.; Yin, P.; Niu, B. Assessing the Combined Effects of Transportation Infrastructure on Regional Tourism Development in China Using a Spatial Econometric Model (GWPR). Land 2023, 12, 216. [Google Scholar] [CrossRef]
- Tang, K.; Wang, H.; Wang, N. The Relationship between the Airport Economy and Regional Development in China. Emerg. Mark. Financ. Trade 2022, 58, 812–822. [Google Scholar] [CrossRef]
- Li, B.; Gao, S.; Liang, Y.; Kang, Y.; Prestby, T.; Gao, Y.; Xiao, R. Estimation of Regional Economic Development Indicator from Transportation Network Analytics. Sci. Rep. 2020, 10, 2647. [Google Scholar] [CrossRef]
Disclaimer/Publisher’s Note: The statements, opinions and data contained in all publications are solely those of the individual author(s) and contributor(s) and not of MDPI and/or the editor(s). MDPI and/or the editor(s) disclaim responsibility for any injury to people or property resulting from any ideas, methods, instructions or products referred to in the content. |
© 2025 by the authors. Licensee MDPI, Basel, Switzerland. This article is an open access article distributed under the terms and conditions of the Creative Commons Attribution (CC BY) license (https://creativecommons.org/licenses/by/4.0/).