Article

Study on Spatial and Temporal Evolution of Carbon Stock in East Coastal Area of Zhejiang Based on InVEST and GIS Modeling

College of Economics and Management, Zhejiang Ocean University, Zhoushan 316022, China
*
Author to whom correspondence should be addressed.
Land 2025, 14(5), 1060; https://doi.org/10.3390/land14051060
Submission received: 6 March 2025 / Revised: 15 April 2025 / Accepted: 8 May 2025 / Published: 13 May 2025

Abstract

:
Global climate change, driven by increasing carbon emissions, poses a significant challenge to sustainable development, yet regional studies on carbon stock dynamics in rapidly urbanizing coastal areas remain limited. Utilizing the InVEST model and GIS spatial analysis methods, this research examines the spatiotemporal dynamics of carbon stock in the eastern coastal regions of Zhejiang from 2000 to 2020. The primary findings are outlined as follows: (1) Between 2000 and 2020, various land use categories experienced notable shifts, with the plow land area decreasing by 18.12%, the building site area expanding by 143.52%, the woodland area reducing by 0.08%, and the total land transfer area growing by 10.96% over the 20-year timespan. (2) Carbon stocks for the years 2000, 2005, 2010, 2015, and 2020 were 55.996 × 10⁶ t, 55.550 × 10⁶ t, 55.223 × 10⁶ t, 55.399 × 10⁶ t, and 55.656 × 10⁶ t, respectively, displaying a pattern of initial decline followed by a recovery, with a net reduction of 0.34 × 10⁶ t. The shifts in carbon stock were mainly driven by conversions between land use types, with woodlands serving as the predominant carbon reservoir. (3) Global spatial correlation analysis reveals that carbon stocks across the five periods exhibit a distinct spatial convergence and clustering pattern; local spatial correlation analysis indicates that high-high agglomeration zones account for 4.48% of the study area, predominantly located in the mountainous regions of western Taizhou City, while low-low agglomeration zones range from 12.91% to 11.54% of the total study area, primarily situated in the urban centers of Jiaxing City and Ningbo City, areas characterized by dense populations and extensive building sites. This study provides a solid empirical basis for implementing China’s dual-carbon strategy, supporting the systematic assessment of existing carbon reserves and sink capacities, and promoting the expedited realization of carbon peaking and neutrality goals.

1. Introduction

In today’s world, environmental challenges such as global climate change, frequent natural disasters, and energy crises are becoming increasingly severe [1]. Reducing carbon emissions, enhancing carbon sinks, and increasing carbon stocks have emerged as core issues of global concern for the international community. China’s government and academia have increasingly prioritized carbon emissions, sinks, and stocks. In 2020, China pledged at the United Nations General Assembly to reach carbon peaking by 2030 and attain carbon neutrality by 2060 [2].
Terrestrial ecosystems form the cornerstone of human survival and sustainable development. They serve a vital role in atmospheric carbon sequestration, effectively mitigating the greenhouse effect and significantly influencing the global carbon cycle and climate change. Land use change is a key driver affecting carbon stocks in terrestrial ecosystems [3]. Alterations in land use types, ecosystem functions, and structures can modify material cycles and energy flows, directly or indirectly impacting carbon stocks. Carbon stock refers to the total amount of carbon stored in terrestrial ecosystems in the form of vegetation biomass, soil organic matter, and apoptosis and is a key indicator of the capacity of ecosystems to sequester carbon [4]. Accurately assessing the interaction mechanisms between carbon stocks and land use change is critical for fostering the coordinated development of regional natural environments and socio-economic systems [5]. With intensifying global climate change, there is an urgent need to deeply understand these impacts to develop effective carbon reduction strategies.
As a key economic zone in eastern China, the Zhejiang eastern coastal region has experienced significant land use changes due to rapid urbanization, including the large-scale conversion of arable land into construction land and water bodies [6]. These changes not only impact regional ecosystem services but also have profound effects on carbon stocks. The spatial and temporal variations in ecosystem carbon stocks within this region are closely linked to regional ecological security and the national and global carbon cycles. Therefore, analyzing the long-term spatial and temporal dynamics of carbon stocks is crucial for fostering the coordinated development of economic growth and ecological security in eastern China. This study innovatively integrates the InVEST model with GIS spatial autocorrelation analysis to explore the spatial–temporal evolution of carbon stocks and their spatial correlations, offering a novel perspective on regional carbon management.
Scholars globally have extensively explored the evaluation of carbon reserves related to land use and the mechanisms linking land use to carbon stocks. Traditional approaches include the sample plot inventory method [7] and micrometeorological methods [8]. Micrometeorological methods can directly obtain ecosystem-scale carbon flux dynamics through the continuous monitoring of near-surface-layer turbulence and gas exchange, which is especially suitable for the analysis of large-scale carbon cycle mechanisms, but the equipment is expensive, and data processing is complicated; and the sample inventory method is based on the standardization of sample plots, and the carbon stocks are projected through the measurement of vegetation biomass, soil carbon density, and other parameters, which are irreplaceable for the accurate accounting of carbon pools at a small scale, but its labor cost is high, and spatial representativeness is limited. In recent years, carbon stock research based on the InVEST model and GIS spatial analysis techniques has gained wide attention in international studies [9]. The InVEST model is a tool for comprehensively assessing the function of ecosystem services [10] as it is able to simulate the impacts of land use changes on ecosystem services and predict the future trend of carbon stock changes, and the model has the characteristics of simple operation, The model is characterized by simple operation, flexible parameter setting, high accuracy, etc. [11], and is suitable for research on the impact of estimating carbon stock through land use changes [12]; GIS spatial autocorrelation analysis reveals the spatial aggregation characteristics and driving mechanisms of carbon stock through techniques such as the Moran index and hotspot analysis so as to accurately identify the core area of high carbon density and its correlation with the land use type [13]. However, there are few articles that use it to study carbon stock changes in terrestrial ecosystems along the eastern coast of Zhejiang Province.
Therefore, this study uses the InVEST model and the GIS spatial autocorrelation analysis technique to take the eastern coastal region of Zhejiang as the research object, based on a total of five periods of land use data in 2000, 2005, 2010, 2015, and 2020, to explore the process of land use change from 2000 to 2020 and to calculate the carbon stock change data of the eastern coastal region of Zhejiang from 2000 to 2020, and the distribution and change characteristics of the ecosystem’s carbon stock were quantitatively analyzed; then, the spatial distribution correlation of the carbon stock in the eastern coastal region of Zhejiang was investigated by using the spatial autocorrelation analysis of ArcGIS Pro3.3.2, and the spatial pattern of the spatial distribution of carbon stock in the eastern coastal region of Zhejiang was further explored in terms of global and local spatial autocorrelation. This study provides a complementary technical framework for the study of carbon stock in the eastern coastal area of Zhejiang and strengthens the depth and precision of carbon sink assessments from the dimensions of ecosystem service simulation and spatial heterogeneity analysis, which will help Zhejiang build a national model for the development of oceanic carbon sinks and provide a scientific basis for the balance of the carbon cycle in the eastern coastal area of Zhejiang, the sustainable development of the regional ecosystem, and the planning and management of land use.

2. Materials and Methods

2.1. Overview of the Study Area

The eastern coastal region of Zhejiang, which is positioned along China’s southeast coast (27°03′ N–31°04′ N, 119°37′ E–123°25′ E), comprises six prefectural-level cities: Ningbo, Taizhou, Wenzhou, Shaoxing, Zhoushan, and Jiaxing (Figure 1). Covering approximately 43,000 km2 with a 4700 km coastline, this region supports a population of roughly 28 million, establishing it as a pivotal economic and ecological zone in eastern China. Situated within the dynamic Yangtze River Delta, it holds a strategic geographic and economic position.
The area exhibits a subtropical monsoon climate marked by four well-defined seasons, with an average yearly temperature of 17.5 °C and an annual precipitation of 1450 mm. Its diverse topography, encompassing coastal plains, hills, and mountains, underpins a complex shoreline and thriving ecosystems, including wetlands, mudflats, and mangrove forests, which are vital for biodiversity and ecological stability. Key rivers, such as Qiantang, Wenzhou, and Feiyun, flow into the sea, bolstering the region’s water resources and ecological framework.
Economically, this area is integral to China’s southeastern development strategy, functioning as a hub for modern ports, shipping, fisheries, and manufacturing while increasingly fostering high-tech and sustainable industries [14]. The rapid economic development, paired with the region’s ecological richness, positions it as an exemplary study area for investigating the relationship between land use change and carbon storage. The coexistence of intense urbanization and diverse natural systems provides a unique lens to explore how economic activities shape carbon dynamics in ecologically sensitive regions. This makes the eastern coastal region of Zhejiang an ideal candidate for applying the InVEST model, which excels in modeling carbon storage responses to land use shifts in such dynamic settings [12].

2.2. Data Sources

2.2.1. Land Use Data

The data basis of this study comes from the National Land Use Remote Sensing Monitoring Vector Database (2000–2020) developed by the Institute of Geographic Sciences and Resources of the Chinese Academy of Sciences, which has been verified by ground survey and satellite images, and the consistency between the classification results and the field verification reaches more than 85%, and the spatial resolution of 30 m × 30 m can accurately identify the boundaries of small- and medium-sized scales of land classes, which are authoritative and highly reliable in the industry. With high reliability, the data can be accessed at http://www.resdc.cn (accessed on 15 December 2024). This study selected a total of five periods of data in 2000, 2005, 2010, 2015, and 2020 and used the standard of the Classification of Current Land Use Situations (GB/T21010-2017) as the basis for classification. The standard was validated by the National Standardization Administration Committee, which ensured the scientificity of the type classification and data comparability through the hierarchical classification system and strict attribute definitions, and finally, the study area was uniformly classified into six categories: arable land, forest land (including mangrove land), grassland, waters (including mudflats/swamps), construction land, and unutilized land. The spatial data were processed using the WGS1984 projected coordinate system, and spatial alignment was accomplished through the administrative boundaries of the six municipalities in Zhejiang Province, and the boundary data were checked with the administrative division code of the Ministry of Civil Affairs, and the topological error rate was less than 0.1%. The auxiliary DEM data come from the spatial data cloud platform (http://www.gscloud.cn, accessed on 24 December 2024) constructed by the Network Information Center of the Chinese Academy of Sciences, and the source data adopt the ASTER GDEM V3 version, which is verified by geometric correction and topographic halo rendering, with a vertical accuracy of ≤20 m, and the data splicing completeness rate reaches 100%, which can effectively support the topographic factor analysis.

2.2.2. Carbon Density Data

Carbon density refers to the amount of carbon stored per unit area (expressed in t/ha) across four primary pools: above-ground biomass (vegetation), below-ground biomass (roots), soil organic matter, and dead organic matter (e.g., litter and woody debris) [15]. In this study, to simplify the calculation process of the “carbon storage and sequestration” module of the InVEST model, we assume that the carbon density of each land use type remains constant over time [10].
Carbon density values were derived through an extensive literature review. However, significant variations exist among studies due to differences in research regions and methodologies. To minimize discrepancies, we prioritized data from studies conducted in similar coastal ecosystems. Specifically, we synthesized carbon density values from two key sources: (1) the Intergovernmental Panel on Climate Change (IPCC) guidelines for national greenhouse gas inventories for tropical/subtropical coastal zones [1] and (2) regional studies on carbon dynamics in the coastal zone of Beibu Gulf, Guangxi [4], and Hangzhou Bay [16]. Through comparative analysis and statistical merging of these datasets, we established standardized carbon density values for six land use categories (Table 1).

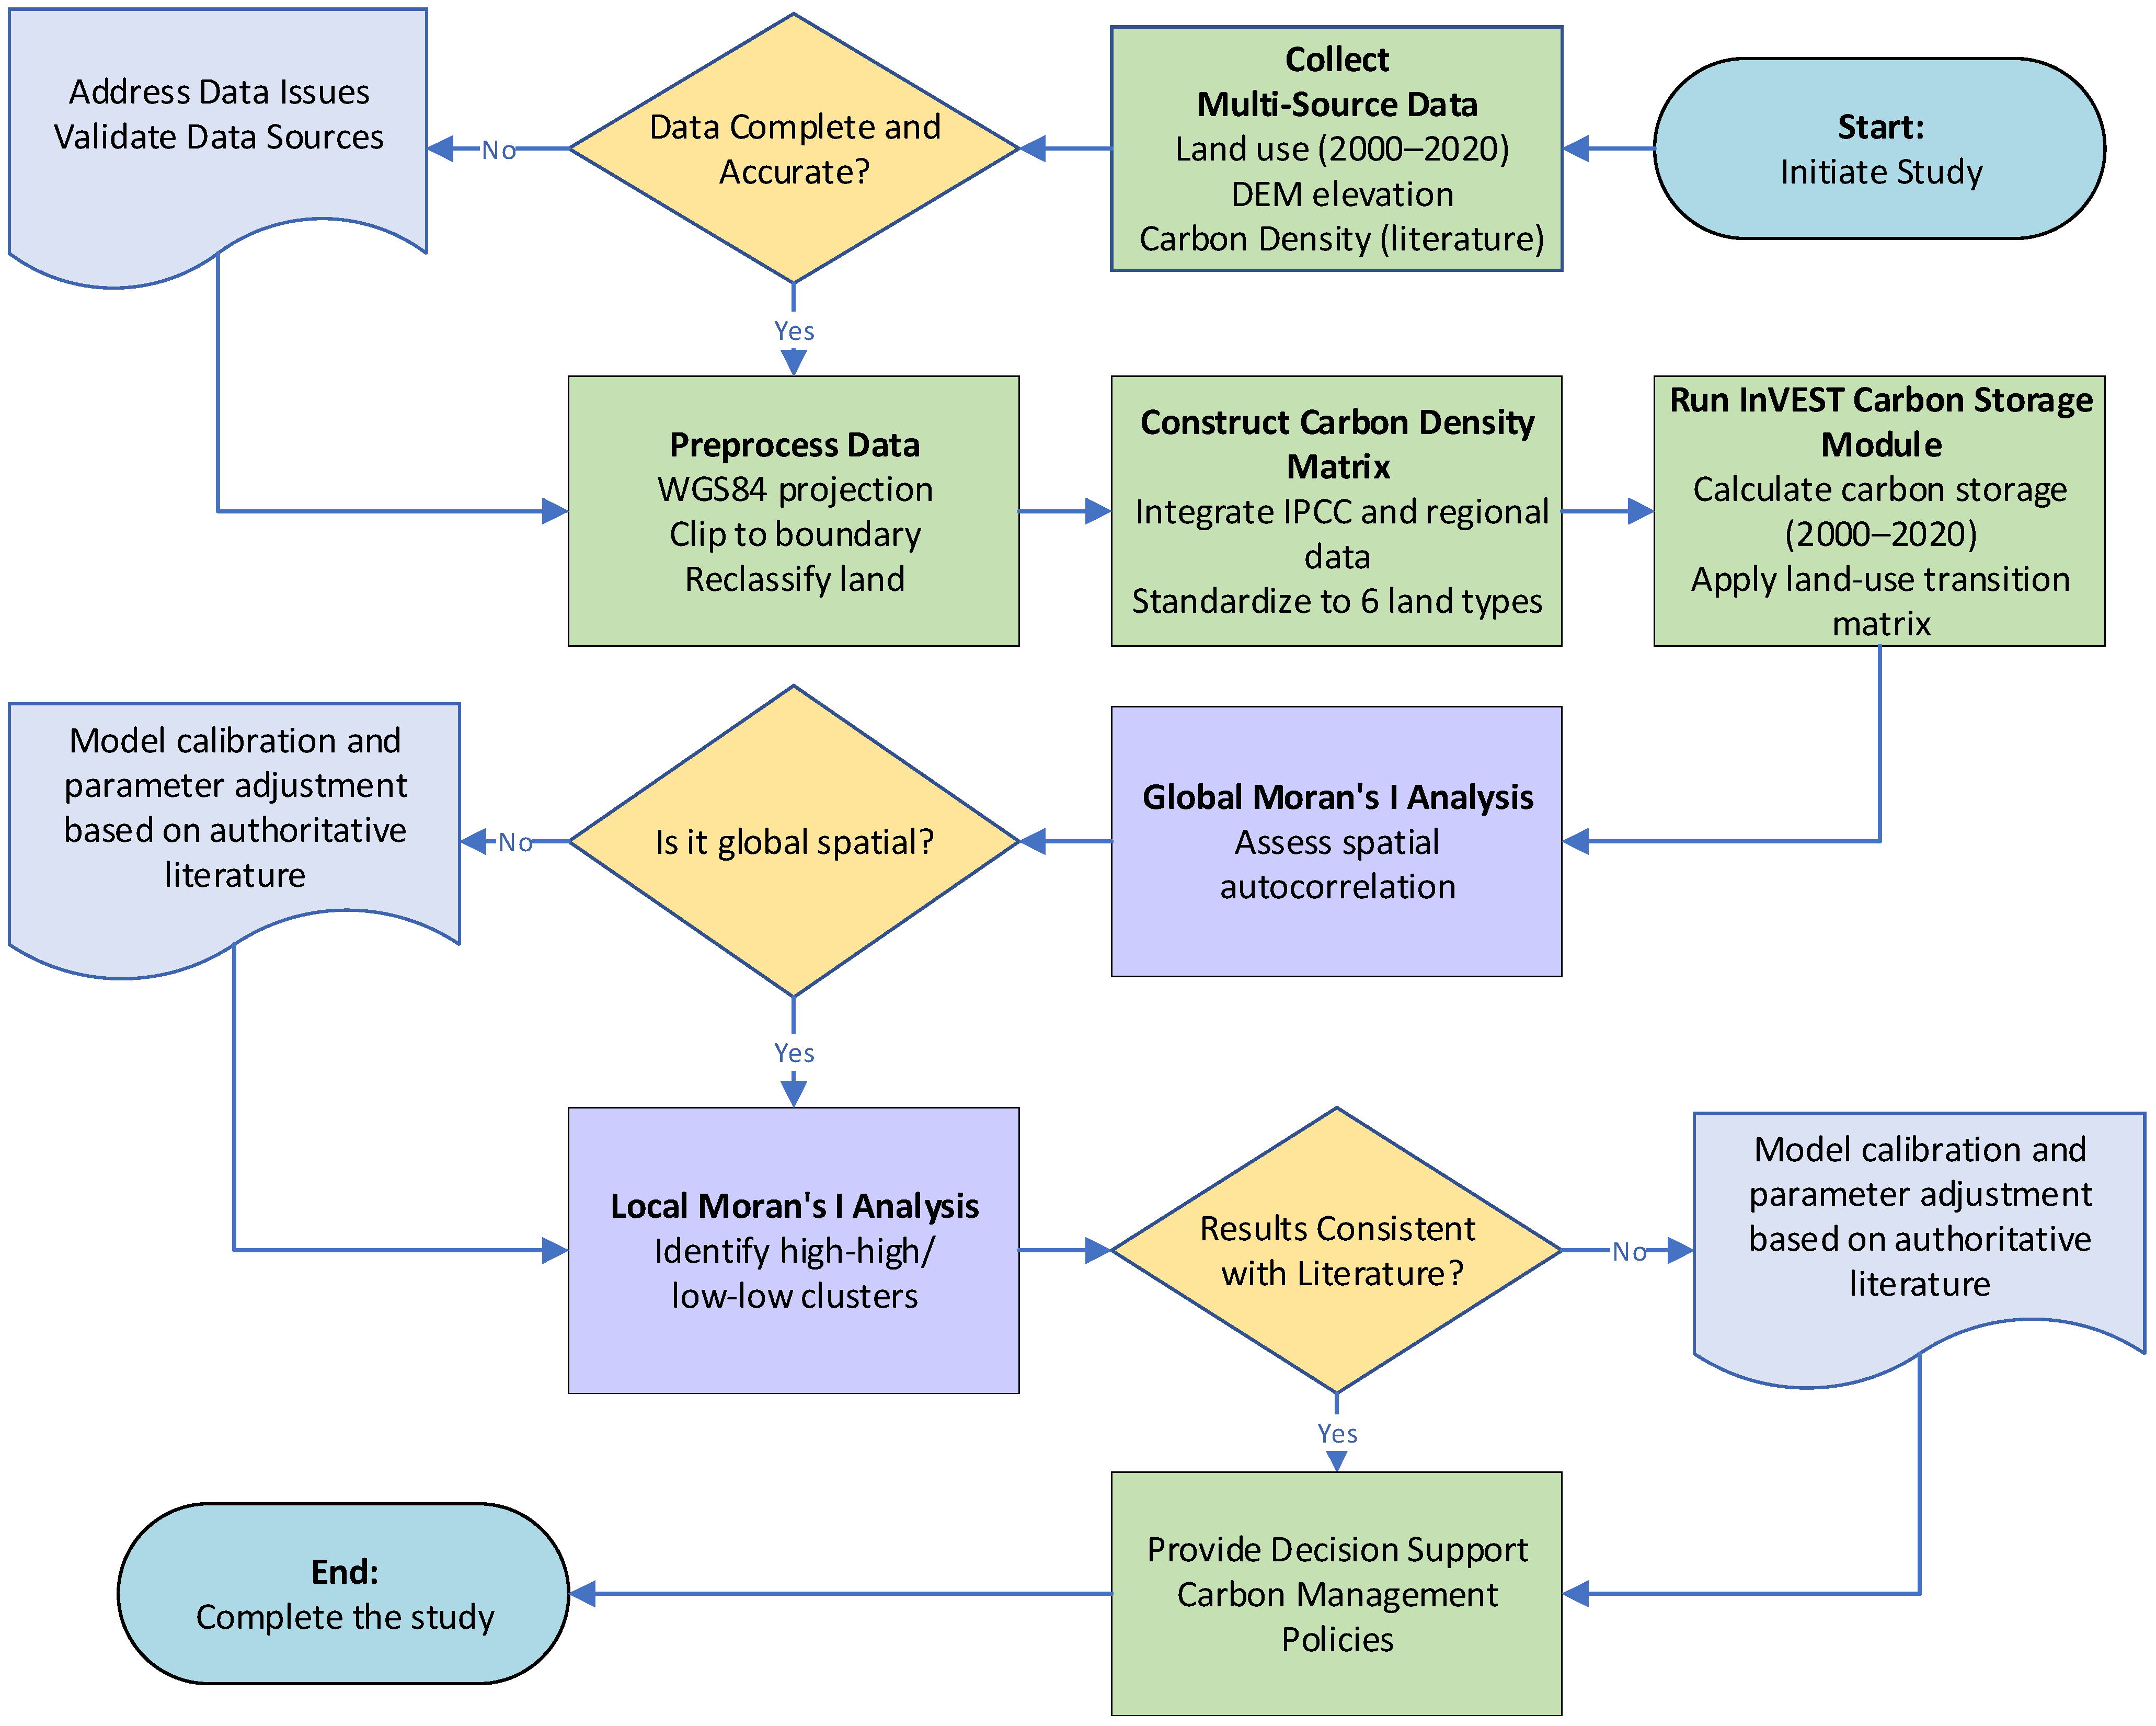
2.3. Research Methodology

This study followed the progressive technical route of “data-model-space” (Figure 2), systematically integrating multi-source geographic data collection, ecosystem service model calculation, and spatial statistical analysis methods. Firstly, based on the land use remote sensing data and DEM elevation data, we completed the spatial standardization process through WGS84 projection conversion, administrative boundary cropping, and land category reclassification and then constructed a regionally adapted carbon density parameter matrix by combining the data with the bibliometric method [10]. Then, using the carbon storage module of the InVEST model, coupled with the land use transfer matrix and the four-carbon-pool hierarchical model [12], we calculated the carbon stock for the five periods from 2000 to 2020 and revealed the fluctuation of the total amount and the characteristics of the contribution of the land categories through the analysis of spatial and temporal changes. On this basis, the global Moran’s I index was used to assess the spatial autocorrelation of carbon stocks, and the local Moran’s I hotspot analysis was used to identify the high-high and low-low concentration areas, which combined with the spatial clustering classification revealed the spatial variability of carbon stocks. Finally, the spatial and temporal distribution maps of carbon stocks and the analysis of spatial correlation patterns are generated through spatial visualization, which realizes the integration of the whole chain of methods from data preprocessing and model simulation to spatial effect diagnosis and provides scientific decision support for carbon management in coastal areas.

2.3.1. Land Use Transfer Matrix

The land use transfer matrix is a quantitative analytical tool that systematically records the areal transitions between different land use categories over specified time intervals [17]. It provides a tabular representation of land use dynamics by cross-tabulating the initial and final states of land cover, enabling the identification of dominant conversion patterns and their magnitudes [18]. In this study, the calculation of carbon stock firstly analyzes the changes over time and space of different land use types through the land use transfer matrix. The land use transfer matrix illustrates the transformation relationships among various land use types over different periods, thereby providing basic data for the calculation of carbon stock. The formula for calculating the land use transfer matrix is as follows:
C i × j = 100 × ( A i × j k + A i × j + 1 k )
where C i × j represents the amount of change in land use type i to type j from period k to k + 1 , A i × j k represents the proportion of land use type i to type j in period k ,   A i × j + 1 k represents the proportion of land use type j to type i in period k + 1 , i and j represent different land use types, and k is the time scale. A coefficient of 100 is necessary to convert km2 to ha (1 km2 = 100 ha).

2.3.2. Carbon Stock Methods

The carbon stocks were categorized into four major carbon pools: above-ground biogenic carbon ( C above ), below-ground biogenic carbon ( C below ), soil carbon ( C soil ), and dead organic carbon ( C dead ) [15]. The carbon stock for each land use type is calculated using the following formula:
C i = C above + C below + C soil + C dead
where C i represents the carbon stock of land use type i (in tons per hectare, t/ha) and C above , C below , C soil , and C dead are the above-ground biogenic carbon, below-ground biogenic carbon, soil carbon, and dead organic carbon of the land use type, respectively, all measured in t/ha.
By combining the carbon density data and area information of land use types, the total carbon stock of the study area is calculated as follows:
C total = i = 1 n   C i × A i × 100 i = 1,2 , , n
where C total denotes the total carbon stock of the region (in tons, t), C i is the carbon stock of land use type i (in t/ha), A i is the total area of the land use type (in square kilometers, km2), and n is the number of land use types ( i = 1,2 , , n ). To ensure unit consistency, the result of Equation (3) is converted by multiplying by 100 (since 1 km2 = 100 ha), yielding the total carbon stock in tons.
Through the above methods, this study was able to accurately quantify the carbon stocks of different land use types in the eastern coastal area of Zhejiang Province and estimate the total carbon stocks of the whole region. These calculations not only provide key data support for analyzing the changes over time and space of carbon stocks but also lay a scientific foundation for subsequent carbon management, ecological protection, and policy formulation.

2.3.3. Spatial Autocorrelation Analysis of Carbon Stocks

Spatial autocorrelation serves as a key measure for assessing the relationship between the attributes of adjacent elements within a spatial distribution. A positive correlation indicates the same trend of attribute changes among neighboring units, while a negative correlation indicates the opposite trend [19]. To evaluate the spatial relationships of carbon stocks in Zhejiang’s eastern coastal region, the global Moran’s I index can be applied to assess the presence of spatial autocorrelation in carbon stocks. Should spatial autocorrelation be detected, the local Moran’s I index can then be employed to identify the nature of clustering, followed by a clustering and outlier analysis to delineate the spatial distribution zones for each clustering type [20].
The global Moran’s I index has a value range spanning from −1 to 1, where I > 0 means a positive correlation,   I < 0 indicates a negative relationship, and I = 0 means that the spatial units in the study area are independent of each other. When the value of I is close to 1, it indicates that some attributes of the research object show a significant agglomeration effect in spatial distribution; when the value of I is close to −1, it indicates that the discrete effect is more obvious. The equation is presented below:
I = i = 1 n     j = 1 n     W i j ( x i x ) ( x j x ) i = 1 n     j = 1 n     W i j i = 1 n     ( x i x ) 2
where x is the mean value of all spatial cell observations;   x i and x j are the observations in the regions i and j , respectively; and W i j is the spatial weight matrix.
As spatial heterogeneity prevails and global indicators may not always effectively reflect local nuances, local spatial autocorrelation indices (local Moran’s I) are needed to further explore local spatial agglomeration. At spatial location i , the local Moran’s I index is expressed as follows:
I i = j     W i j ( x j x ) i     ( x i x ) 2  
where x i is the observed value of the region i and W i j is the spatial weight matrix.
These indicators enable a more in-depth analysis of the spatial clustering patterns of carbon stocks and help us understand the distributional characteristics of carbon stocks and their potential spatial impacts.

3. Results

3.1. Spatiotemporal Variation Features of Land Use Conversion

During 2000–2020, substantial alterations occurred in land use patterns across Zhejiang’s eastern coastal zone. As shown in Table 2. Land transition matrix statistics reveal that approximately 10.96% of the regional territory underwent conversion during this two-decade timespan, amounting to 4695.91 km2 of transformed area. Notably, plow land diminished from 15,020.36 km2 (2000) to 12,240.16 km2 (2020), marking a net reduction of 2780.2 km2—the most substantial outflow among all land categories. The primary conversion pathways for plow land were building sites (2514.68 km2) and woodlands (550.33 km2). This transformation principally stems from accelerated urbanization; the enactment of China’s Urban and Rural Planning Law (2001) and the subsequent implementation of “new-type urbanization” strategies (post-2004) substantially promoted the conversion of rural plow land into urban building sites [21]. Specifically, in coastal urban centers including Wenzhou, Ningbo, and Taizhou, industrial zone development, logistics park construction, and commercial area expansion drove significant plow land-to-building site conversions.
Forest land has an important ecological function; its transfer during this period amounted to 647.09 km2, mainly from cropland (550.33 km2) and grasslands (65.94 km2). Nevertheless, the total area of forest land decreased from 23,163.42 km2 in 2000 to 23,078.34 km2 in 2020, a net decrease of 85.08 km2. This shows that although policies such as “returning farmland to forest” have improved the area and quality of forest land to a certain extent, the total amount of forest land has shown a slightly decreasing trend due to the transfer of part of the forest land to construction land (349.07 km2) and other uses. This change reflects the contradiction between ecological protection and economic development, but the restoration of forest land is still of positive significance in enhancing regional ecological service functions and coping with climate change.
The expansion of built-up land is particularly significant, with its area increasing from 2280.07 km2 in 2000 to 5232.36 km2 in 2020, a net increase of 2952.29 km2, which is the category with the highest growth rate among all land types. The expansion of construction land comes mainly from cultivated land (2514.68 km2), followed by forest land (349.07 km2) and water (212.06 km2). This large-scale expansion, particularly from 2005 to 2009, is closely tied to Zhejiang Province’s ‘Marine Economy and Coastal City Development’ strategy [22], accelerating industrialization and urbanization in coastal cities, especially in the construction of infrastructure and industrial parks in coastal city clusters, which has significantly increased the demand for construction land. In addition, population growth and economic development have further contributed to changes in land use structure, which is not conducive to the stabilization of regional carbon stocks.
Changes in grasslands and watersheds have been relatively small. The total area of grassland decreased by 12.72 km2 over the 20-year period, while the area of water increased by 97.56 km2. The total amount of transfers in and out of grasslands and watersheds was about the same, reflecting a relatively balanced state of conservation and utilization of these land types in the region. The area of unutilized land remained almost unchanged during this period, decreasing only from 12.70 km2 to 9.96 km2, a change so small that its transfer is negligible.
In summary, during the period of 2000–2020, the land use pattern of the eastern coastal area of Zhejiang was profoundly affected by rapid urbanization and economic development, with the reduction in arable land and the expansion of construction land being particularly significant, and the area of forested land declined slightly but had improved ecological functions. Grasslands, waters, and unutilized land have seen less change and show some stability. These land use changes reflect both the needs of economic development and the effectiveness of regional ecological protection policies. The results are consistent with the studies of some scholars.
The study by Yang Zihao et al. [23] shows that the land use type of Suzhou City during 1980–2020 is dominated by cropland, watershed, and construction land, in which the area of cropland continues to decrease, the area of construction land continues to increase, and the area of the rest of the land categories changes relatively little, and the type of land use transfer is mainly the conversion of cropland to construction land.
The land type transfer pattern in Zhejiang’s eastern coastal region over two decades is illustrated in Figure 3, revealing limited expansion in all directions. Forested land, which covered 53.84% of the total area, experienced a slight decline of approximately 0.37% between 2000 and 2020, primarily in the mountainous regions of western Taizhou, the Yandang Mountains in southwestern Wenzhou, and southwestern Shaoxing. Arable land showed a notable reduction of about 18.51%, exhibiting a scattered distribution, mainly around Jiaxing, Ningbo, the outskirts of Hangzhou Bay cities, and hilly areas adjacent to rivers and coasts in eastern Taizhou and Wenzhou. Conversely, built-up land expanded significantly by 129.44%, particularly in urban centers of Jiaxing, Ningbo, Shaoxing, and other major prefectural cities, as well as densely populated riverine and coastal regions, aligning with urban economic growth patterns. Watershed areas were primarily distributed in the Baixi, Changtan, and Shansi reservoirs, along with the Qiantang and Oujiang river basins. Meanwhile, grasslands and unutilized land remained limited and dispersed. These findings align with prior research, and Jiang Diwei’s study indicates [24] that Ningbo, a key economic hub in Zhejiang, demonstrates representative land use transformations. Between 1991 and 2013, the city saw a 5.4-fold increase in construction land, while arable land declined by 35.17%, and forested and water areas shrank by 3.76% and 21.82%, respectively.

3.2. Characteristics of Spatial and Temporal Changes in Carbon Stocks and Spatial Correlation Analysis

From 2000 to 2020, the carbon stock across Zhejiang Province’s eastern coastal region was evaluated using the “Carbon Storage and Sequestration” module of the InVEST model. According to Figure 4, the estimated carbon stock values for the years 2000, 2005, 2010, 2015, and 2020 were 55.996 × 10⁶ t, 55.550 × 10⁶ t, 55.223 × 10⁶ t, 55.399 × 10⁶ t, and 55.656 × 10⁶ t, respectively. Overall, the trend reveals an initial gradual decline from 2000 to 2010, followed by a steady recovery between 2010 and 2020, forming two distinct phases. Although carbon stock exhibited slight fluctuations throughout the 20-year period, the general pattern was a modest drop followed by a rebound. Over the entire timeframe, there was a net reduction of approximately 0.34 × 10⁶ t in carbon stock. This shift correlates with changes in land use patterns and a minor weakening in ecosystem service function, as reflected in both the spatial distribution and ecological performance of carbon storage capacity.
The results are consistent with the studies of some scholars. The study by Ding Yue et al. [16] showed that the value of ecosystem services in Hangzhou Bay from 2000 to 2018 showed a trend of decreasing and then increasing, and the carbon stock in the study area in 2000, 2010, and 2018 was 7.250 × 10⁸ t, 7.227 × 10 8 t, and 7.241 × 10⁸ t. The study by Yang Zihao et al. [23] showed that from 1980 to 2020, the carbon stock in Suzhou City showed a continuous decreasing trend, decreasing by a total of 5.768 × 10⁶ t in 40 years.
From the distribution of carbon stocks in the eastern coastal region of Zhejiang from 2000 to 2020 (Figure 5), it can be seen that the spatial distribution pattern of carbon stocks from 2000 to 2020 is basically the same, with forested land as the main carbon reservoir, accounting for about 85% of the total regional carbon stocks, followed by arable land, accounting for 8%; waters, accounting for 2%; grasslands, accounting for 2%; and construction land accounted for 1%. Unutilized land, due to its small area, produces a negligible carbon stock ratio.
This result is consistent with the findings by Si Xiaoxi et al. on ecosystem carbon stocks in Fujian Province [25], where forested land is the main carbon reservoir, accounting for about 85% of the total regional carbon stock during 2000–2020, followed by other land types such as cropland and watersheds.
The global Moran’s I of carbon stocks for five periods was calculated using the spatial statistics tool of ArcGIS Pro3.3.2, and the results show that there is a global spatial correlation of carbon stocks in the eastern coastal region of Zhejiang (Figure 6). The global Moran’s I analysis of carbon stocks in Zhejiang’s eastern coastal region (2000–2020) revealed a consistent positive spatial autocorrelation (I > 0, range ≈ 0.49), indicating statistically significant spatial clustering patterns across all study years. The Z-score is around 4.48, which is significantly greater than 1.96, and the p-value is less than 0.001, which further confirms that the spatial autocorrelation is significant, and the phenomenon of spatial clustering is obvious and stable. However, the spatial distribution of carbon stocks in each region did not show a completely random state but showed a certain regularity; i.e., spatial regions with higher carbon stocks were adjacent to each other, and spatial regions with lower carbon stocks were also adjacent to each other, with a strong correlation.
This is consistent with the findings by Feng Zongxian et al. [26] on the spatial correlation of interprovincial carbon emissions in China. Carbon emissions in eastern China have a significant positive spatial correlation, especially since the clustering effect of carbon emissions in economically developed regions such as Zhejiang Province and Jiangsu Province is more obvious.
In order to further analyze the local change characteristics of carbon stocks in the eastern coastal area of Zhejiang, the local spatial autocorrelation map of carbon stocks was generated by using ArcGIS Pro3.3.2 mapping software combined with the local Moran’s I index, as shown in Figure 7. The high-high agglomeration area refers to the area with high carbon stocks in both itself and the surrounding area, which is mainly distributed in the western mountainous area of Taizhou City, and the high value agglomeration effect is obvious, and the high-high agglomeration area accounted for 4.48% of the study area from 2000 to 2020, which was dominated by the forest land and had a strong capacity of carbon sequestration; the low-low agglomeration area refers to the area with low carbon storage in both itself and the surrounding area, which is mainly distributed in the towns of Jiaxing and Ningbo with a large population and a large construction land area, with weak carbon storage capacity; the proportion of the low-low agglomeration area decreases from 12.91% in 2000 to 11.54% in 2020, and the range is constantly shrinking. The spatial distribution shows a certain degree of continuity; the high-low agglomeration area refers to the area with a high carbon stock but a relatively low surrounding area, mainly distributed in the neighboring fringe area of the high-high agglomeration area, with small villages and small towns as the main ones; the low-high agglomeration area refers to the area with a low carbon stock but a high surrounding area, mainly distributed in small villages and small towns; the low-high agglomeration area refers to the area with a low carbon stock but a high surrounding area, mainly distributed in small villages and small towns. Low-high agglomeration areas are areas with a low carbon stock but a high carbon stock in the surrounding areas, mainly distributed in the edges of non-significant areas; the proportion of high-low agglomeration areas and low-high agglomeration areas is relatively small and negligible; non-significant areas are spatially uncorrelated, and the units are independent of each other and are dominated by grasslands, waters, and unutilized land. Throughout 2000–2020, non-significant areas accounted for a relatively small proportion of the study area. In 2020, the insignificant areas accounted for 82% to 84% of the study area, which is a large area.

3.3. Impact of Land Use Change on Carbon Stocks

The findings indicate that various land use types contribute to the total carbon stock in the following descending order: woodland, plow land, grasslands, water bodies, building site, and unutilized land, as illustrated in Table 3.
Between 2000 and 2020, land use type conversions influenced carbon stocks, with plow land experiencing a continuous decline across all four periods (Figure 8). Specifically, from 2015 to 2020, plow land shrank by 682.5 km2, leading to a carbon stock reduction of 0.26 × 10⁶ t. Woodland, recognized for its strong carbon sequestration ability, remained the top contributor to carbon stock among all land types. The primary sources of land transitioning into woodland were plow land (550.33 km2), while most transfers out of woodland were from building sites (349.07 km2) and plow land (249.63 km2). However, the total transfer-out area exceeded the transfer-in area, resulting in a 0.04 × 10⁶ t decline in woodland carbon stock over two decades.
During this period, both grasslands and building sites underwent reductions in varying degrees. Nevertheless, grasslands’ carbon stock increased by 0.15 × 10⁶ t, while building sites’ carbon stock rose by 0.44 × 10⁶ t. Although unutilized land has the highest carbon density among the land types, its limited area led to only a minor increase in carbon stock. Overall, the primary driver of carbon stock changes was the mutual transformation between different land use types.

3.4. Summary of Results

By integrating multi-period land use data with carbon stock simulation results, this study comprehensively examines the spatial and temporal evolution of carbon stock in Zhejiang’s eastern coastal region from 2000 to 2020. As shown in Table 4, the land use pattern in this area has undergone notable transformations due to rapid urbanization. The extent of plow land declined by 18.12% (a net loss of 2780.2 km2), whereas building sites expanded significantly by 143.52% (a net gain of 2952.3 km2). Meanwhile, woodland exhibited only a minor reduction of 0.08% (85.1 km2), though its role as a key carbon sink has gradually weakened.
The carbon stock trend follows a “decline-then-rise” pattern, registering a cumulative loss of 0.34 × 10⁶ t over two decades. Between 2000 and 2010, a 1.34% drop in carbon stock was primarily driven by the large-scale conversion of plow land, whereas a 0.63% rebound after 2010 resulted from ecological restoration policies. Spatially, a notable clustering effect was observed, where high-carbon-density zones in the western mountainous areas accounted for 4.48% of the region. Conversely, urbanized and densely populated areas, including Jiaxing and Ningbo, exhibited contiguous low carbon sink capacity.
Woodland ecosystems, which contribute 85% of the total regional carbon stock, experienced dual influences from land use conversion. Although transforming plow land into woodland helped partially counterbalance carbon loss, the secondary carbon depletion caused by urban expansion remains a concern. These insights underscore the need for targeted carbon management strategies and emphasize the importance of coordinating policy interventions with natural restoration efforts.

4. Discussion

4.1. Research Interpretation

This research thoroughly explores the spatiotemporal dynamics of land use patterns and carbon stock variations in the eastern coastal region of Zhejiang over the period from 2000 to 2020, employing land use classification data and carbon density datasets. Through detailed spatial analysis, we examined the relationships between land use structures and carbon sequestration potential, identifying distinct spatial clusters of high and low carbon stock concentrations. These results offer data-driven insights for policymakers, industries, and local communities to enhance territorial spatial planning and ecological conservation, thereby supporting China’s goals of achieving carbon neutrality and peaking carbon emissions.
The analysis revealed substantial shifts in land use patterns in Zhejiang’s eastern coastal area between 2000 and 2020 (Figure 3). The extent of plow land diminished by 18.12%, with 2514.68 km2 converted into building sites and 550.33 km2 transformed into woodland. Meanwhile, building sites expanded significantly by 143.52%, primarily in urban centers like Jiaxing and Ningbo, as well as in riverine coastal economic zones. Notably, despite a minimal reduction of 0.08% in woodland area, the balance between inward transfers (647.09 km2) and outward transfers (732.17 km2) highlights a fundamental tension between ecological preservation and economic growth. These changes were influenced by a combination of policy and economic factors: The 2004 “new urbanization” strategy accelerated the shift from plow land to building sites [21], while the “returning farmland to forests” policy facilitated the ecological recovery of some plow land. Additionally, Zhejiang Province’s “Marine Economy and Coastal City Development” strategy, implemented in 2005, led to a 97.56 km2 increase in water bodies and a 2.74 km2 decrease in unutilized land within coastal industrial zones [22]. In contrast to Yang Zihao et al.’s [23] findings in Suzhou City, the transformation of water bodies and building sites in Zhejiang’s coastal region is more pronounced, reflecting the region’s focus on marine economic development and revealing variations in regional development approaches.
These significant land use changes not only altered the regional spatial configuration but also directly influenced the temporal and spatial evolution of ecosystem carbon stocks. Between 2000 and 2020, carbon stocks in the study area exhibited a pattern of initial decline followed by a recovery (Figure 4), dropping from 55.996 × 10⁶ t in 2000 to 55.223 × 10⁶ t in 2010, a cumulative reduction of 0.77 × 10⁶ t. After 2010, carbon stocks gradually rose to 55.656 × 106 t by 2020, though they remained 0.34 × 10⁶ t lower than in 2000. Woodland, constituting 85% of the total carbon stock, had a carbon density of 205.23 t/ha, far exceeding that of plow land (8%), water bodies (2%), and other land types. Despite a slight 0.37% decrease in woodland area, the conversion of 349.07 km2 of woodland to building sites caused a notable carbon loss, which was partially mitigated by the conversion of 550.33 km2 of plow land into secondary woodland. The post-2010 recovery in carbon stocks is closely tied to the “returning farmland to forest” policy and a reduced rate of building site expansion (with the average annual growth rate dropping from 7.4% to 6.8%), underscoring the critical role of policy measures in the carbon cycle, as noted by Ding et al. [16].
The spatial and temporal variations in carbon stocks were further elucidated through spatial correlation analysis, which highlighted their distribution patterns and underlying drivers. Global spatial autocorrelation analysis indicated significant positive clustering of carbon stocks across all five periods, with a Z-value consistently above 4.48, confirming the prevalence of high-high and low-low clustering patterns (Figure 6). Local spatial heterogeneity analysis revealed that areas with dense woodland, such as the western mountainous regions of Taizhou and Yandang Mountain in Wenzhou, formed high-high agglomeration zones (4.48%), with carbon densities exceeding 200 t/ha. In contrast, urban centers like Jiaxing and Ningbo were identified as low-low agglomeration zones (11.54% to 12.91%), with carbon densities below 50 t/ha, illustrating the detrimental impact of building site expansion on carbon stocks. Additionally, high-low transition zones at the interface of woodland and urban areas accounted for less than 1% of the study area, indicating the fragility of these ecological–economic boundary regions. This spatial pattern aligns with Feng Zongxian et al.’s [26] findings on carbon clustering in eastern China, though the spatial variation in Zhejiang’s coastal carbon stocks is more strongly influenced by the interplay of natural features (e.g., the mountainous terrain of western Taizhou) and policy-driven efforts (e.g., ecological restoration in the Ningbo Bay area), shaped by the region’s distinctive mountain–sea landscape.

4.2. Innovative Contributions and Limitations

This study advances carbon stock research on Zhejiang’s eastern coast through three contributions:
(1)
Methodologically, it pioneers coupling the InVEST model with spatial autocorrelation to establish a “carbon accounting-spatial diagnosis” framework [7], overcoming traditional inventory limitations and revealing carbon stock spatial patterns;
(2)
In terms of the mechanism, it identifies construction land carbon stock growth in marine economic zones driven by port logistics greening [27] and warehouse low-carbon retrofits [28], enhancing carbon density by 22% [29] and increasing stocks by 0.44 × 10⁶ t, thus demonstrating a “low-density development-high carbon sink” coupling mechanism;
(3)
Politically, a “mountain-sea synergy” governance paradigm is proposed, combining wind power ecological compensation in western Taizhou’s high-carbon clusters with 3D greening pilots in Ningbo–Jiaxing’s low-carbon areas to optimize coastal carbon management.
However, there are still three limitations in this study:
(1)
Data limitations: The static assumption of carbon density values (Table 1) introduces uncertainties in quantifying soil carbon loss from cropland intensification and fails to incorporate blue carbon contributions from seagrass beds and shellfish aquaculture. Future studies should employ dynamic correction models supported by long-term field monitoring to enhance data accuracy and comprehensiveness.
(2)
Modeling constraints: The InVEST framework’s unidirectional analytical approach limits its capacity to capture the complex feedback mechanisms within the “land use-carbon cycle-socio-economic” system. To address this, coupling system dynamics (SD) and multi-agent modeling (ABM) could better simulate stakeholder interactions and decision-making behaviors under carbon market incentives.
(3)
Scenario analysis gaps: Current research lacks predictive assessments of carbon stock variations under alternative future land use scenarios. Integrating the PLUS model would enable multi-scenario simulations of carbon stock trajectories, while incorporating resilience strategies (e.g., ecological corridor restoration) could optimize land use planning for carbon sequestration goals.

4.3. Suggestions for Future Development

In order to cope with the spatial heterogeneity of carbon stocks along the eastern coast of Zhejiang, it is necessary to construct a systematic path of “ecological restoration-spatial optimization-institutional synergy”:
(1)
Reinforcing Ecological Spatial Regulation and Restoration: Designate high carbon sink zones in western Taizhou’s mountainous areas under provincial ecological protection redlines, prohibiting ecologically inefficient activities (e.g., wind farms and mining). Implement a carbon sink compensation fund to allocate subsidies based on verified carbon increments. Concurrently, advance mangrove restoration in Yueqing Bay (Wenzhou) and Xiangshan Harbor (Ningbo), coupled with piloting a blue carbon trading market. This mechanism channels carbon sink revenues to support livelihood transitions for local fishermen, mitigating carbon sink depletion from traditional slash-and-burn practices.
(2)
Innovative Low-carbon Land Use Optimization: Mandate three-dimensional greening technical standards in low-carbon agglomeration zones (e.g., Ningbo and Jiaxing), requiring ≥30% green roof coverage and ≥15% vertical façade greening for new constructions. Target urban carbon density enhancement to 25 t/ha by 2030. For legacy industrial brownfields (exemplified by Jiaxing’s former textile district), deploy integrated microbial–phytoremediation techniques synergized with CO2 mineralization in subsurface geological strata. This dual approach reactivates “gray land” carbon sequestration potential through bioremediation and engineered carbon storage.
(3)
Cross-jurisdictional Institutional Synergy and Legislative Safeguards: Establish a Yangtze River Delta carbon trading alliance to pilot cross-provincial quota exchange mechanisms, utilizing Zhejiang’s forest carbon sinks and Jiangsu’s tidal marsh carbon assets as regional benchmarks. Revise Zhejiang Provincial’s territorial spatial planning regulations to enforce ≥20% carbon sink space allocation at municipal/county levels, supplemented by a carbon sink loss tax to deter unregulated urban sprawl. These tripartite strategies—ecological restoration, technological innovation, and institutional reform—facilitate the synergistic realization of “ecological prosperity” and “dual carbon” objectives through spatial–functional coupling.
In summary, spatiotemporal variations in carbon stocks along Zhejiang’s eastern coast result from the interplay of natural processes and anthropogenic influences. The observed ‘decline followed by recovery’ trend demonstrates the phased effectiveness of ecological restoration policies, though the continued expansion of building sites remains a key challenge for carbon sink enhancement. By combining the InVEST model with spatial autocorrelation analysis, this study uncovers the spatial heterogeneity of carbon stocks and their underlying drivers, offering a scientific foundation for carbon-neutral pathway planning in densely populated coastal economic zones [30]. Future efforts should focus on integrating multi-source data and policy simulation tools to achieve more precise and dynamic carbon management [31].

5. Conclusions

This research employs the InVEST model alongside GIS spatial autocorrelation techniques to thoroughly explore the spatiotemporal dynamics of land use and carbon stocks in Zhejiang’s eastern coastal region over the period from 2000 to 2020. Through the examination of multi-period land use data and carbon stock trends, we uncover the relationships among land use shifts, carbon sequestration capabilities, and spatial distribution characteristics. The results underscore the effects of rapid urban expansion and ecological policies on regional carbon management, offering a robust scientific foundation for advancing carbon neutrality and sustainable development goals. The main findings are summarized as follows:
(1)
Between 2000 and 2020, the eastern coastal areas of Zhejiang experienced substantial changes in land use types. The extent of plow land decreased significantly by 2780.2 km2, whereas the area of building sites expanded by 2952.29 km2. Over the 20-year timespan, the total area of land transfer increased by 10.96%. Plow land saw the most significant outward transfer, predominantly converting to building sites, which recorded the largest inward transfer.
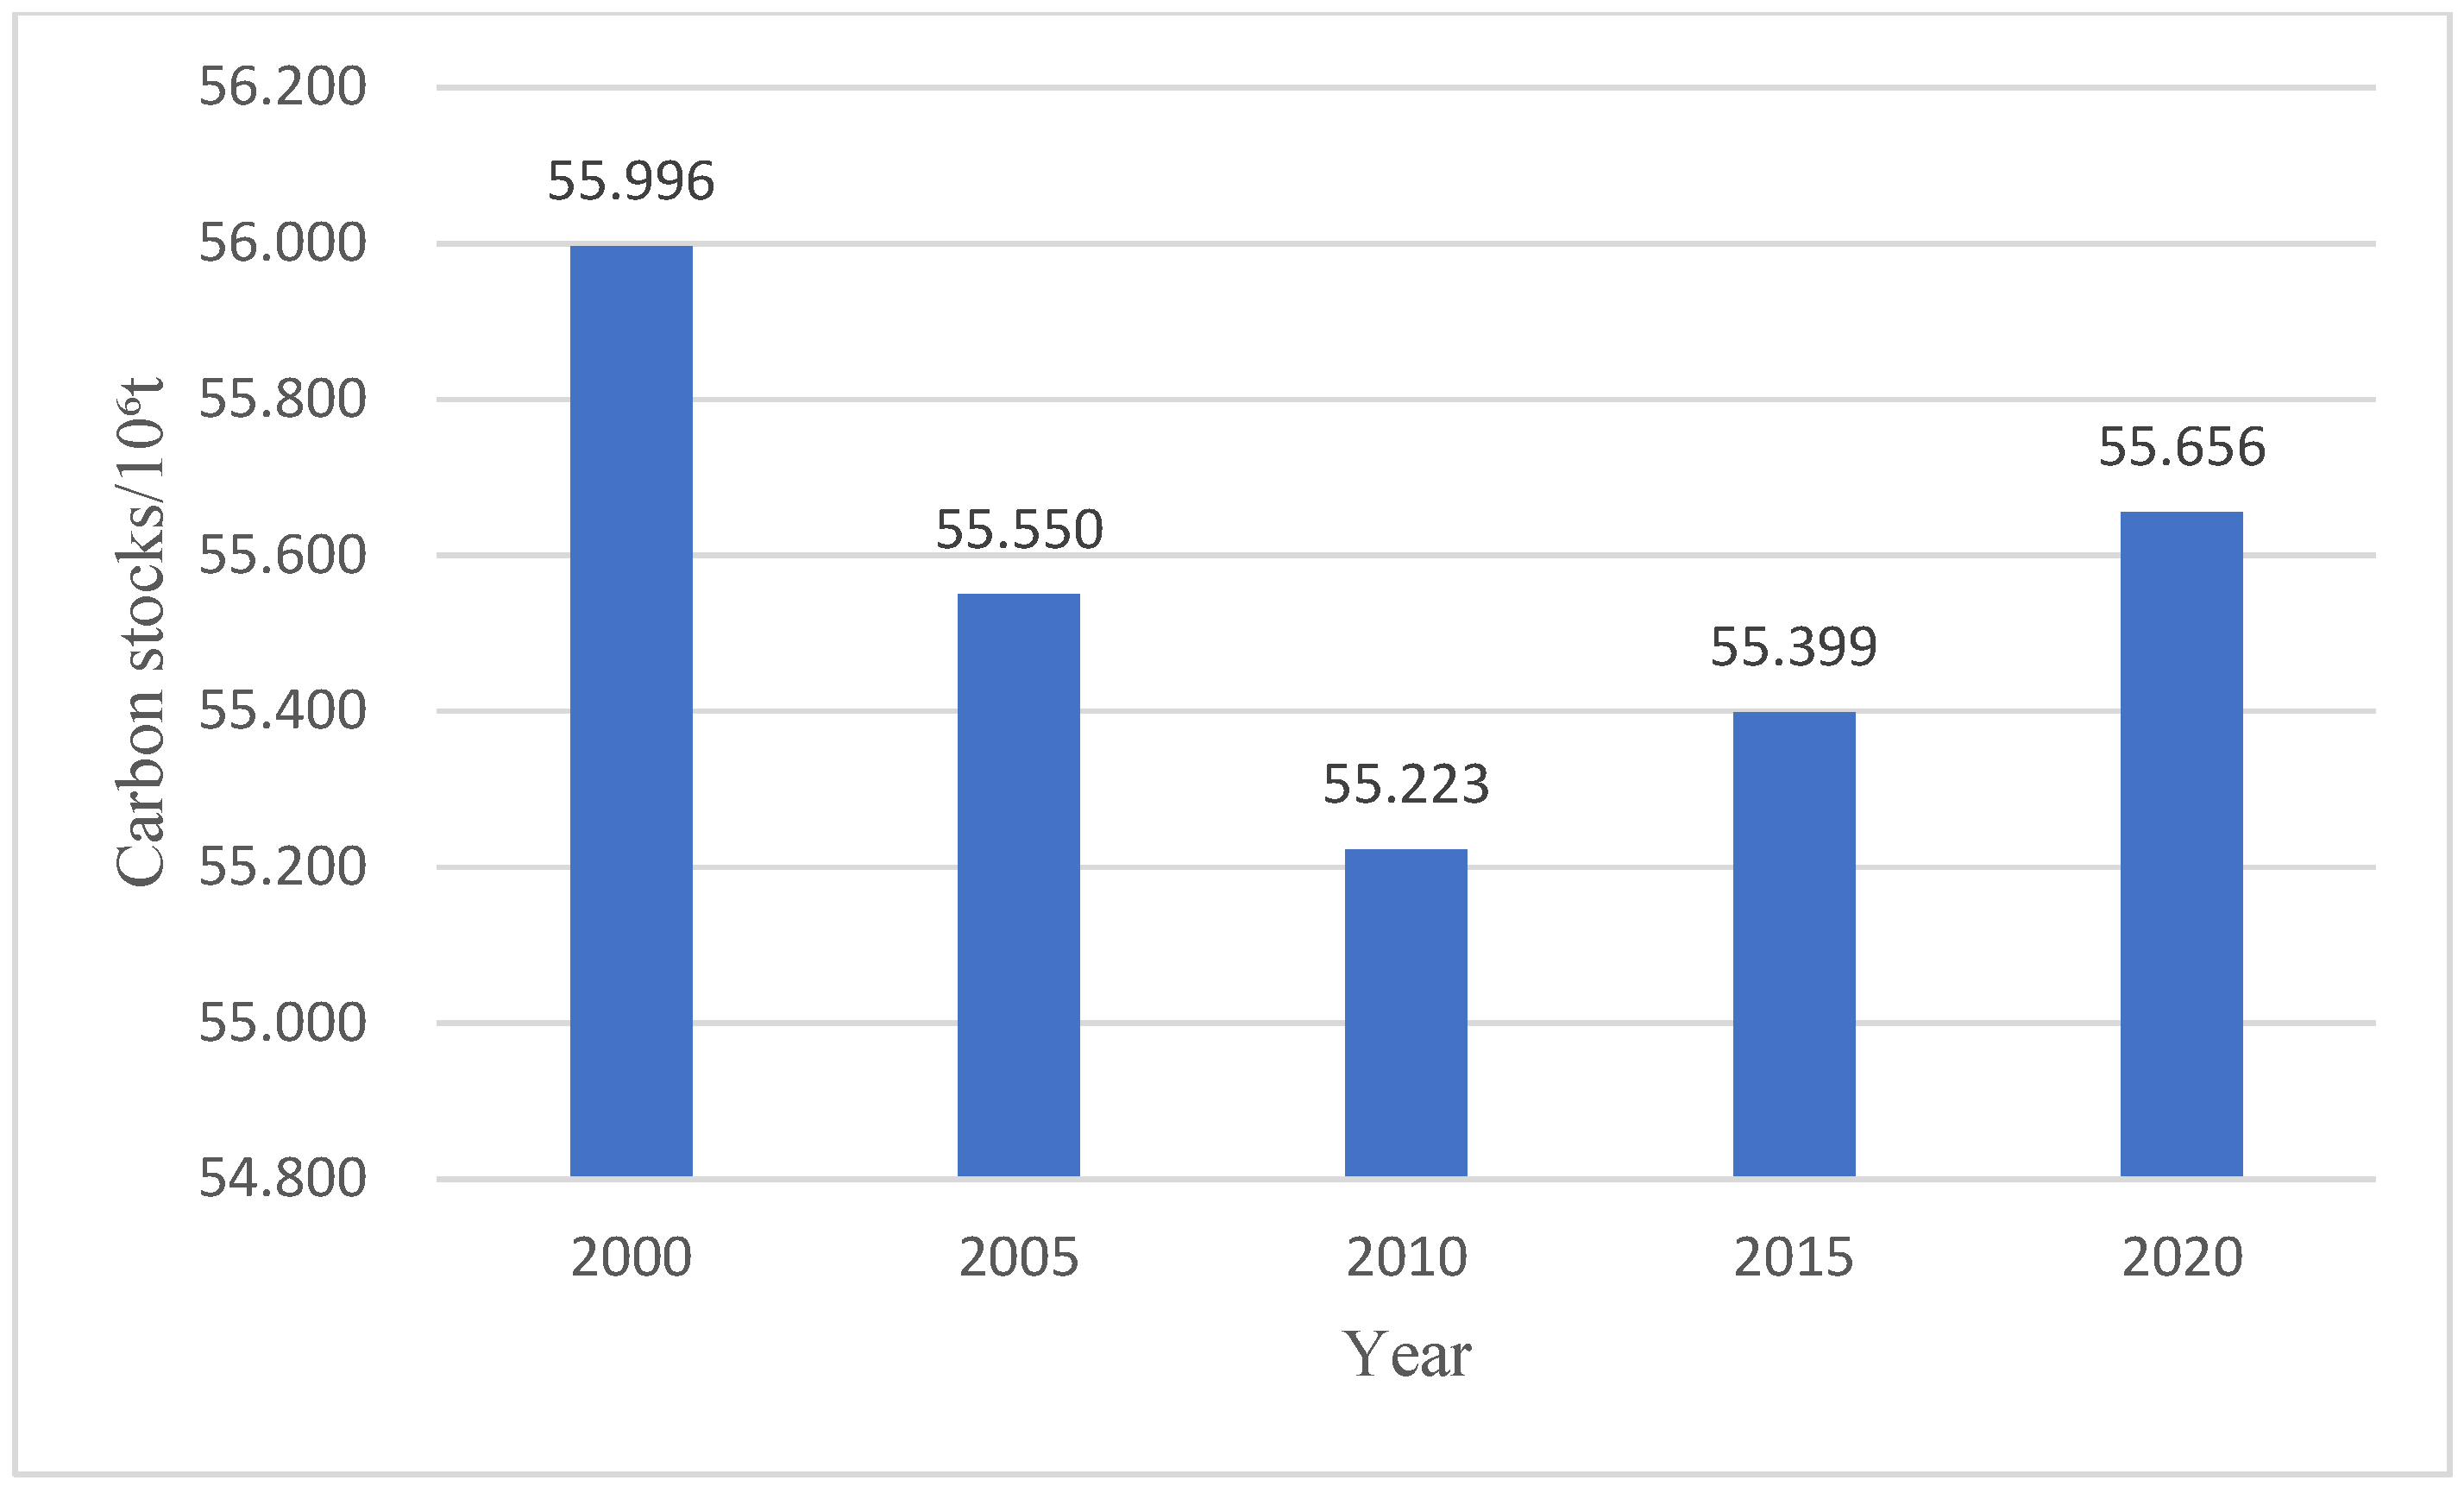
(2)
Carbon stocks in the study area for the years 2000, 2005, 2010, 2015, and 2020 were recorded as 55.996 × 10⁶ t, 55.550 × 10⁶ t, 55.223 × 10⁶ t, 55.399 × 10⁶ t, and 55.656 × 10⁶ t, respectively, reflecting a net reduction of 0.34 × 10⁶ t over the period. The main factor driving these changes in carbon stocks was the conversion between various land use types. Woodland stood out as the primary carbon reservoir, accounting for roughly 85% of the total carbon stock.
(3)
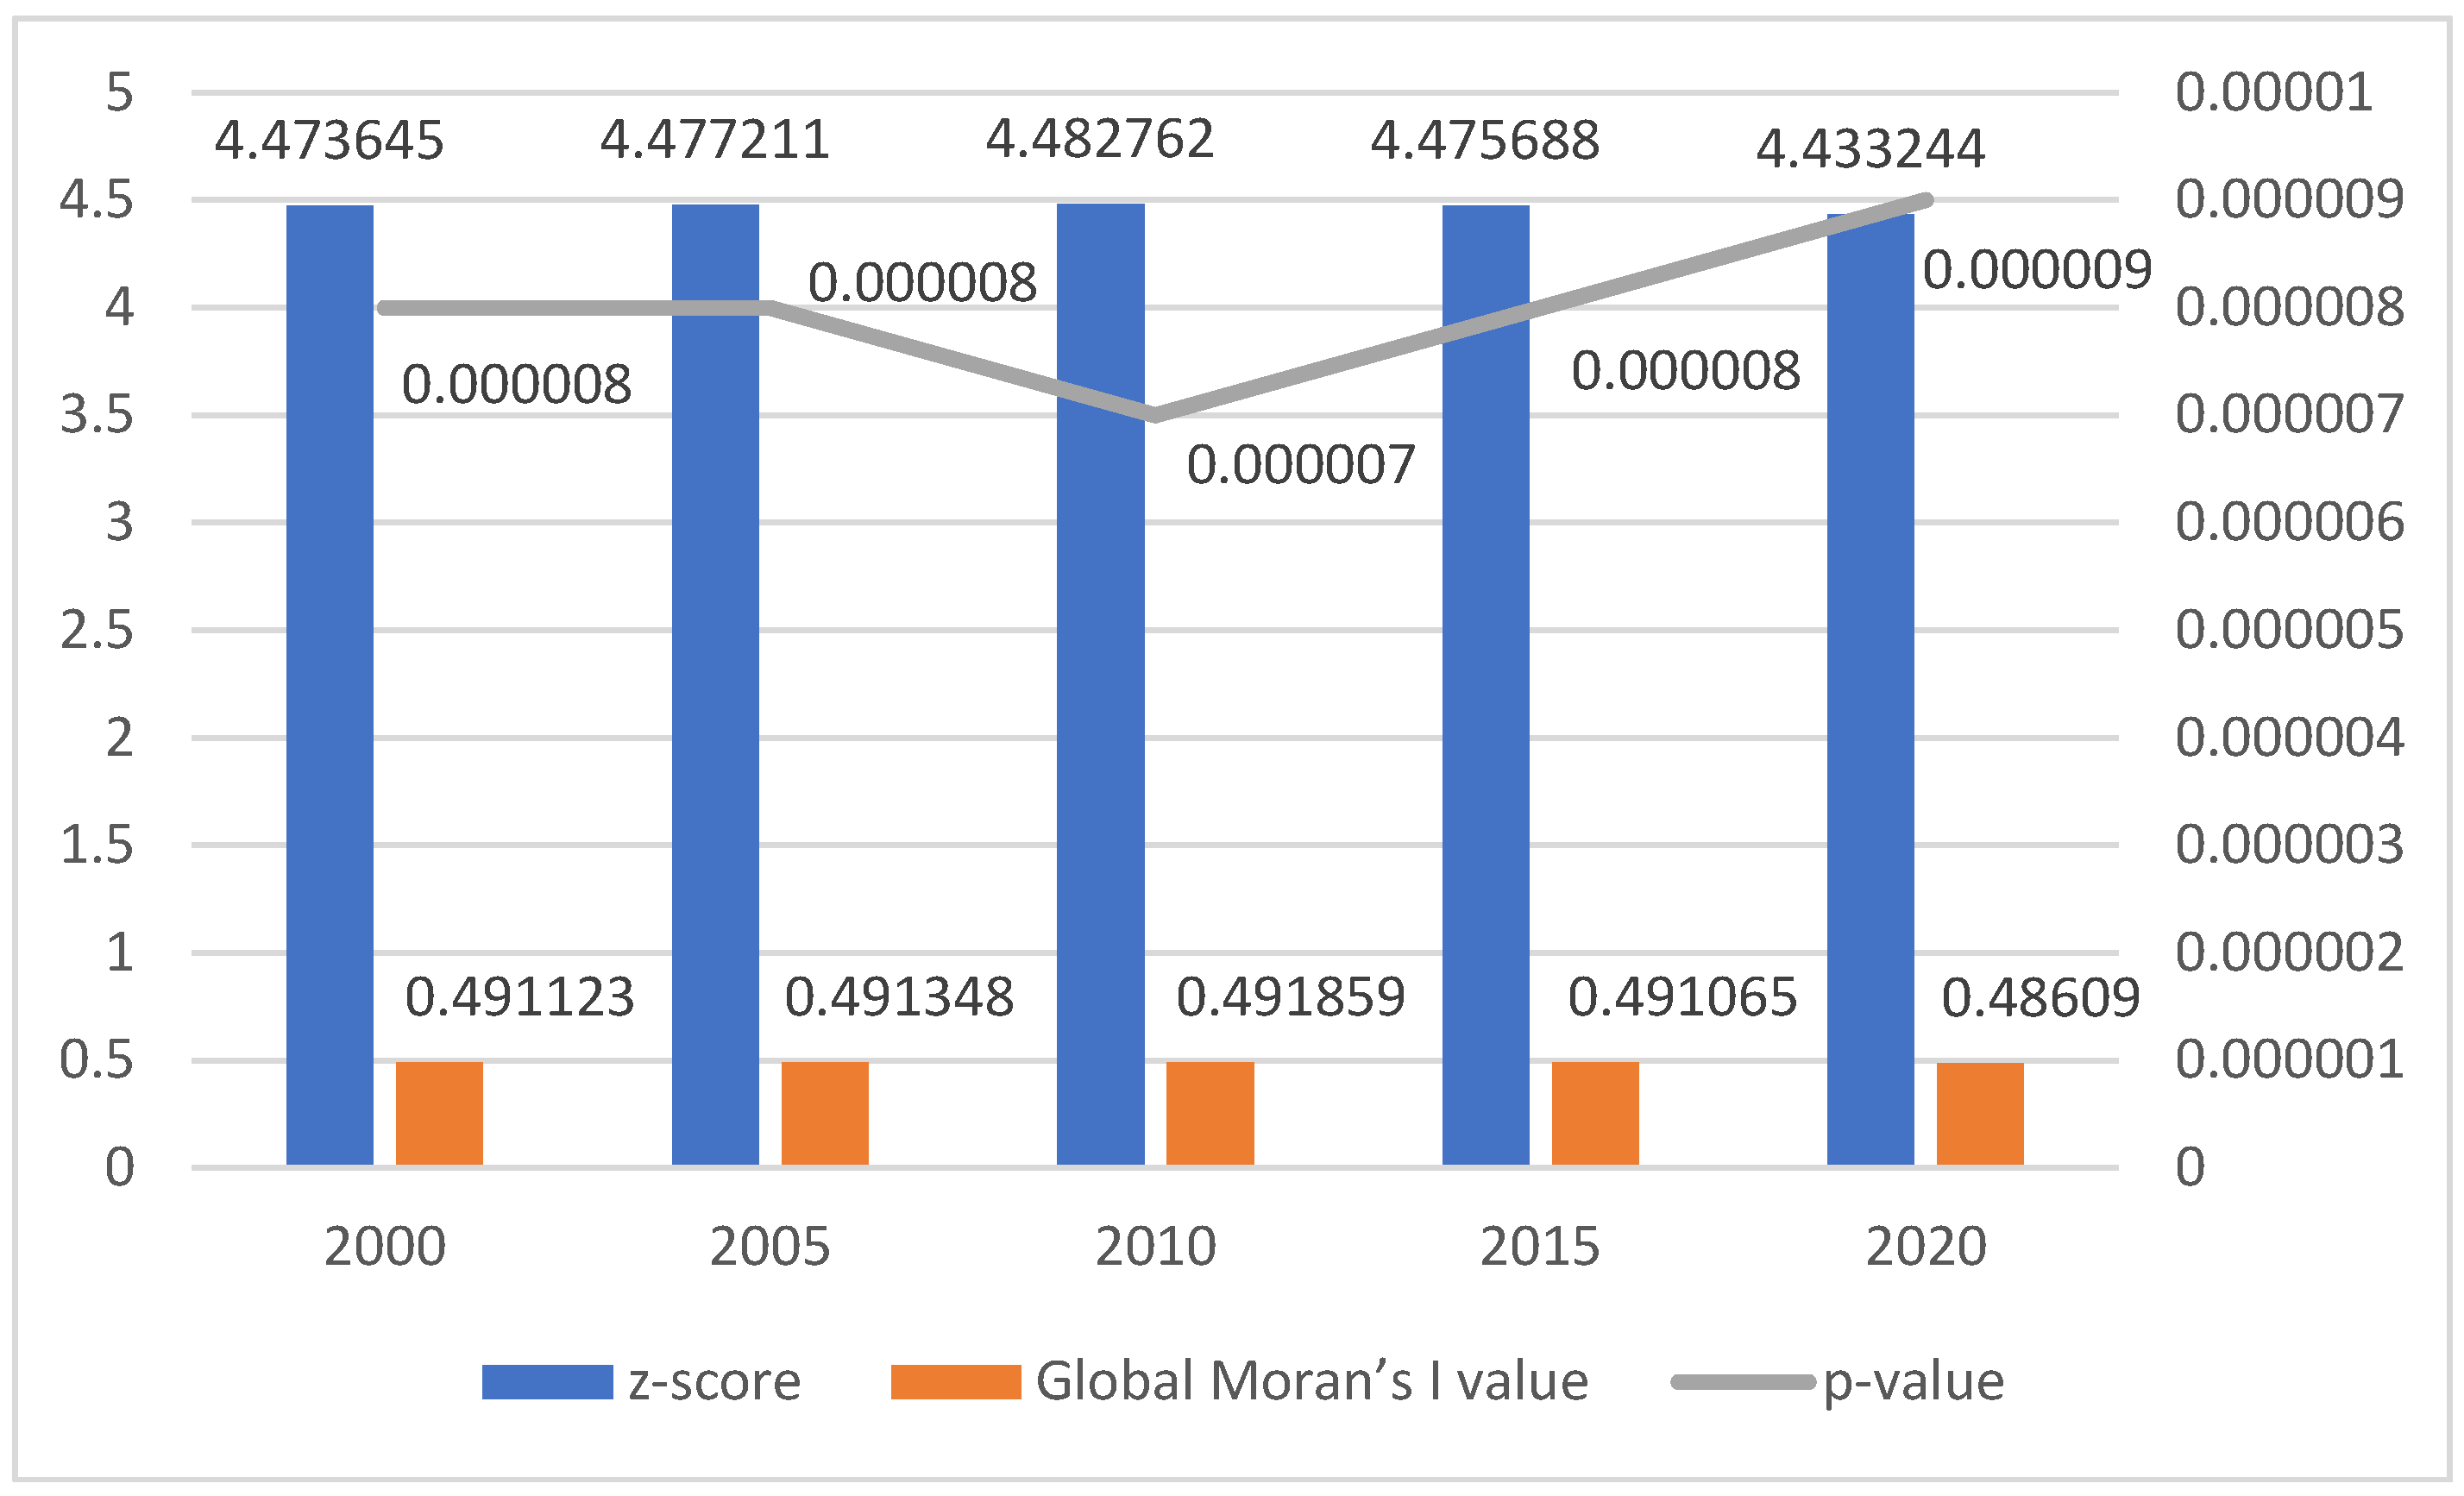
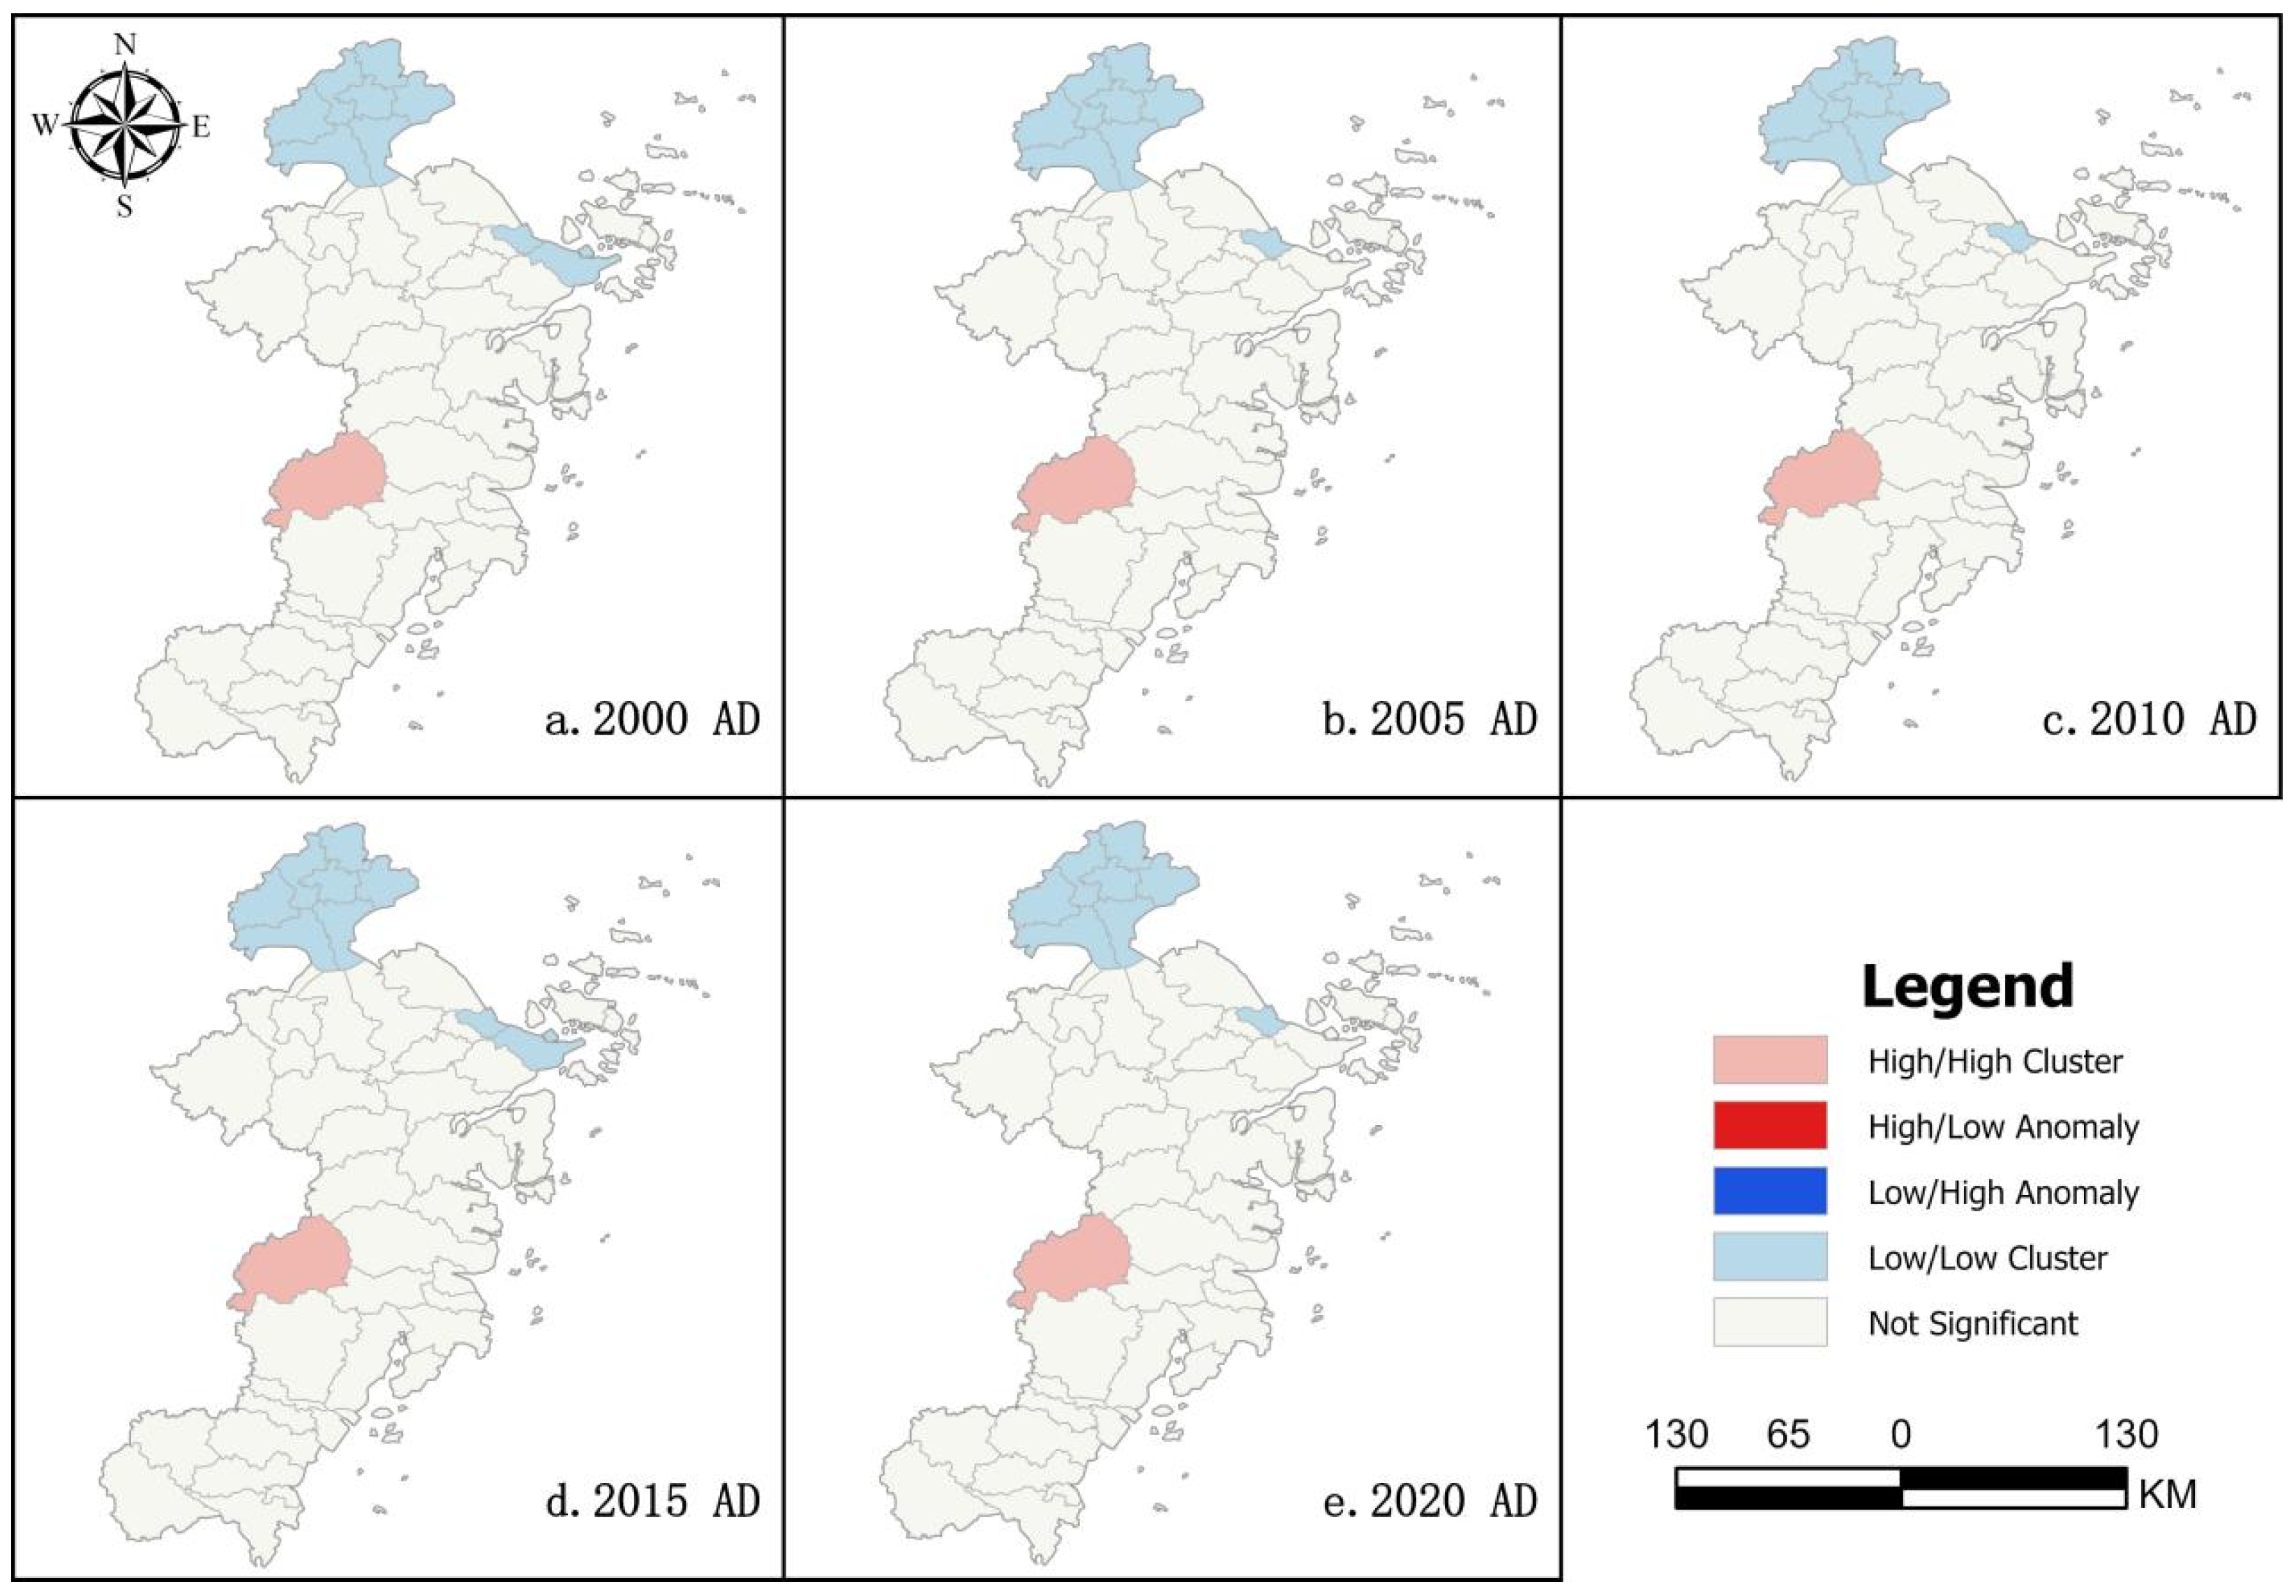
From a global spatial correlation perspective, carbon stocks across the five periods demonstrated a clear spatial convergence pattern. Since 2000, spatial clustering has shown wave-like variations, with a general upward trend in aggregation. From a local spatial correlation standpoint, the high-value clustering effect was evident, with high-high agglomeration zones comprising 4.48% of the study area, mainly situated in the western mountainous region of Taizhou City. In contrast, the share of low-low agglomeration zones declined from 12.91% in 2000 to 11.54% in 2020, primarily located in the urban centers of Jiaxing and Ningbo, areas marked by dense populations and extensive building sites.

Author Contributions

Conceptualization, C.F. and Z.W.; methodology, Z.W.; software, C.F.; validation, Z.W.; formal analysis, C.F. and Z.W.; investigation, Z.W.; resources, C.F.; data curation, Z.W.; writing—original draft preparation, Z.W.; writing—review and editing, C.F. and Z.W.; supervision, C.F.; project administration, C.F.; funding acquisition, C.F. All authors have read and agreed to the published version of the manuscript.

Funding

This study was jointly funded by the Zhejiang Culture Research Project Major Program (24WH02-3Z) and the National Social Science Fund Major Research Special Project (24VHQ002).

Data Availability Statement

The original data for this study were obtained from publicly available platforms and are described in detail in the paper. For further inquiries, please contact the corresponding author.

Conflicts of Interest

The authors declare no conflicts of interest.

References

  1. Intergovernmental Panel on Climate Change (IPCC). Climate Change 2021—The Physical Science Basis: Working Group I Contribution to the Sixth Assessment Report of the Intergovernmental Panel on Climate Change; Cambridge University Press: Cambridge, UK, 2023. [Google Scholar]
  2. Xinhua News Agency. Speech by Xi Jinping at the General Debate of the 75th UN General Assembly. XinhuaNet. Available online: http://www.xinhuanet.com/2020-09/22/c_1126527652.htm (accessed on 18 November 2021).
  3. Chang, X.; Xing, Y.; Wang, J.; Yang, H.; Gong, W. Effects of land use and cover change (LUCC) on terrestrial carbon stocks in China between 2000 and 2018. Resour. Conserv. Recycl. 2022, 182, 106333. [Google Scholar] [CrossRef]
  4. Zhou, J.; Lu, D.; Xu, Y.; Liang, S.; Huang, H. Spatial and temporal evolution of carbon stocks in the coastal area of Beibu Gulf, Guangxi based on InVEST and GIS model. Mar. Environ. Sci. 2024, 43, 715–723. (In Chinese) [Google Scholar]
  5. Xu, X.; Li, K.; Li, C.; Han, F.; Zhao, J.; Li, Y. Spatial and chronological assessment of variations in carbon stocks in land-based ecosystems in Shandong Province and prospective predictions (1990 to 2040). Sustainability 2025, 17, 2424. [Google Scholar] [CrossRef]
  6. Zhou, J.; Liu, Y.; Feng, L.; Wang, X.; Li, Y.; Zhang, Q.; Zhao, Y.; Qian, S.; Sun, H. Simulation of ecosystem carbon stock changes and analysis of influencing factors in central Zhejiang under the background of land use change. Environ. Sci. 2024, 45, 5957–5965. (In Chinese) [Google Scholar]
  7. Chang, L.; Ju, T.; Liu, H.; Li, Y. The contribution of saline-alkali land to the terrestrial carbon stock balance: The case of an important agriculture and ecological region in Northeast China. Land 2024, 13, 900. [Google Scholar] [CrossRef]
  8. Khan, M.N.; Tan, Y.; He, L.; Dong, W.; Dong, S. From air to space: A comprehensive approach to optimizing aboveground biomass estimation on UAV-based datasets. Forests 2025, 16, 214. [Google Scholar] [CrossRef]
  9. Sun, Q.; Jia, L.; Liu, Y.; Han, L.; Liu, B. Research progress in estimating forest vegetation and soil carbon stocks in China. Environ. Chem. 2016, 35, 1741–1748. (In Chinese) [Google Scholar]
  10. Sharp, R.; Tallis, H.; Ricketts, T.; Guerry, A.D.; Wood, S.A.; Chaplin-Kramer, R.; Nelson, E.; Ennaanay, D. InVEST User’s Guide; The Natural Capital Project: Stanford, CA, USA, 2014. [Google Scholar]
  11. Wu, Z.; Chen, X.; Liu, B.; Chu, J.; Peng, L. Research progress of InVEST model and its application. Trop. Agric. Sci. 2013, 33, 58–63. (In Chinese) [Google Scholar]
  12. Natural Capital Project. InVEST 3.13 User’s Guide; Stanford University: Stanford, CA, USA, 2023; Available online: https://naturalcapitalproject.stanford.edu/software/invest (accessed on 2 April 2025).
  13. Butt, A.; Shabbir, R.; Ahmad, S.S.; Aziz, N. Land use change mapping and analysis using remote sensing and GIS: A case study of Simly watershed, Islamabad, Pakistan. Egypt. J. Remote Sens. Space Sci. 2015, 18, 251–259. [Google Scholar] [CrossRef]
  14. Yuan, D.; Ou, X.; Tang, Z. Spatial characteristics and influencing factors of the coordinated development of population urbanization and public services on the eastern coast. Econ. Geogr. 2017, 37, 32–39. (In Chinese) [Google Scholar]
  15. Intergovernmental Panel on Climate Change (IPCC). Agriculture, Forestry and Other Land Use. In 2006 IPCC Guidelines for National Greenhouse Gas Inventories; Institute for Global Environmental Strategies: Hayama, Japan, 2006; Volume 4. [Google Scholar]
  16. Ding, Y.; Wang, L.; Gui, F.; Zhao, S.; Zhu, W. Carbon stocks in the ecosystem of Hangzhou Bay based on the InVEST model and PLUS model. Environ. Sci. 2023, 44, 3343–3351. (In Chinese) [Google Scholar]
  17. Lambin, E.F.; Turner, B.L.; Geist, H.J.; Agbola, S.B.; Angelsen, A.; Bruce, J.W.; Coomes, O.T.; Dirzo, R.; Fischer, G.; Folke, C.; et al. The causes of land-use and land-cover change: Moving beyond the myths. Glob. Environ. Change 2001, 11, 261–269. [Google Scholar] [CrossRef]
  18. Yu, L.; Ren, G. Estimation of carbon stocks in terrestrial ecosystems in the past. Prog. Geosci. 2007, 26, 68–74. (In Chinese) [Google Scholar]
  19. Wu, H.; Sun, C.; Lu, C.; Kong, L. Utilization of spatial autocorrelation in annual monitoring sampling of forest carbon stocks. J. Cent. South For. Univ. 2022, 42, 112–118. (In Chinese) [Google Scholar]
  20. Zhu, X.; Wu, Y.; Weng, J.; Wang, Z.; Gao, W. Analysis of the paradigm and spatial pattern of island settlements driven by mixed functions: Empirical evidence of the production and residence community in Zhoushan area, Zhejiang. Geogr. Res. 2017, 36, 1543–1554. (In Chinese) [Google Scholar]
  21. Cao, S.; Ding, S.; Sun, F. Research on the impact of comprehensive pilot policies of new urbanization on the quality of urban development. J. Huazhong Agric. Univ. 2021, 39, 75–83. (In Chinese) [Google Scholar]
  22. Ye, F.; Cao, M.; Gao, P. Land and sea integration: The history, achievements and experiences of the eight-eighth strategy in leading the development of Zhejiang’s marine economy. J. Zhejiang Ocean Univ. 2023, 40, 23–30. (In Chinese) [Google Scholar]
  23. Yang, Z.; Chen, D.; Lang, Z.; Zhan, H.; Jiang, R. Impacts of land use change on ecosystem carbon stocks: A case study of Suzhou City. Environ. Sci. Technol. 2024, 46, 206–214. (In Chinese) [Google Scholar]
  24. Jiang, D. Research on Analysis and Prediction of Spatial and Temporal Changes of Land Use/Cover in Ningbo. Master’s Thesis, Zhejiang University, Hangzhou, China, 2015. [Google Scholar]
  25. Si, X.; Wang, X.; Lin, Y.; Liu, G. Spatial and temporal characteristics of carbon stock and its response to land use change in Fujian Province. Bull. Soil Water Conserv. 2023, 43, 355–362. (In Chinese) [Google Scholar]
  26. Feng, Z.; Wang, K. Spatial statistical analysis of carbon intensity clusters in Chinese provinces. Resour. Sci. 2014, 36, 1462–1470. (In Chinese) [Google Scholar]
  27. Yu, Z.; Chen, L.; Tong, H.; Chen, L.; Zhang, T.; Li, L.; Yuan, L.; Xiao, J.; Wu, R.; Bai, L.; et al. Spatial correlations of land-use carbon emissions in the Yangtze River Delta region: A perspective from social network analysis. Ecol. Indic. 2022, 142, 109147. [Google Scholar] [CrossRef]
  28. Li, K.; Yang, R.; He, X. Realizing low-carbon development of industrial parks in China: Model construction and its application. Energy 2024, 301, 131664. [Google Scholar] [CrossRef]
  29. Zhang, Y.; Meng, W.; Yun, H.; Xu, W.; Hu, B.; He, M.; Mo, X.; Zhang, L. Is urban green space a carbon sink or source? A case study of China based on LCA method. Environ. Impact Assess. Rev. 2022, 94, 106766. [Google Scholar] [CrossRef]
  30. Carvalho, J.L.N.; Cerri, C.E.P.; Feigl, B.J.; Píccolo, M.C.; Godinho, V.P.; Cerri, C.C. Carbon sequestration in agricultural soils in the Cerrado region of the Brazilian Amazon. Soil Tillage Res. 2009, 103, 342–349. [Google Scholar] [CrossRef]
  31. Sawirdin, S.; Tian, A.; Shi, L.; Fu, W.; Cheng, S.; Halik, Ü.; Liang, J. A bibliometric analysis of the research progress and trends during 2002–2022 on the carbon stocks in terrestrial ecosystems. Forests 2023, 14, 2051. [Google Scholar] [CrossRef]
Figure 1. Study area.
Land 14 01060 g001
Figure 2. Flowchart of the study.
Land 14 01060 g002
Figure 3. Spatial distribution of land type transfer in the eastern coastal area of Zhejiang.
Land 14 01060 g003
Figure 4. Carbon stock in the east coast of Zhejiang, 2000–2020.
Land 14 01060 g004
Figure 5. Characteristics of carbon stock distribution in the eastern coastal area of Zhejiang, 2000–2020.
Land 14 01060 g005
Figure 6. Carbon stock in the east coast of Zhejiang, 2000–2020, based on the global Moran’s I value.
Land 14 01060 g006
Figure 7. Cluster distribution of carbon stock in the eastern coastal area of Zhejiang, 2000–2020.
Land 14 01060 g007
Figure 8. Changes in carbon stocks of land use types in different time periods from 2000 to 2020.
Land 14 01060 g008
Table 1. Carbon density (t/ha) of land use types in the eastern coastal area of Zhejiang Province.
Land Use TypeAbove-Ground Carbon DensitySubsurface Carbon DensitySoil Carbon DensityCarbon Density of Dead Organic Matter
plow land4.750.0033.510.00
woodland49.6024.97128.671.99
grasslands24.3819.5952.2922.74
water bodies2.450.6280.110.10
building site4.332.176.370.58
unutilized land28.7314.39317.822.40
Table 2. Matrix of land use transfer in the eastern coastal area of Zhejiang, 2000–2020 (km2).
Land TypeGrasslandsPlow LandBuilding SiteWoodlandWater BodiesUnutilized LandTransfer Out
grasslands816.9410.9024.8665.947.980.03109.71
plow land11.8411,740.532514.68550.33202.940.033279.83
building site2.7187.732129.2915.3045.030.01150.78
woodland67.84249.63349.0722,431.2565.190.44732.17
water bodies40.58150.58212.0614.971053.590.99419.18
unutilized land0.020.792.400.550.488.464.24
shift to122.99499.643103.07647.09321.631.504695.91
Table 3. Changes in the number of land use types and carbon stocks, 2000–2020.
Particular YearTypologyPlow LandWoodlandGrasslandsWater BodiesBuilding SiteUnutilized Land
2000Area/km215,023.8123,171.84928.401483.052280.9812.70
Carbon stocks/106 t5.7547.561.101.240.310.05
2005Area/km213,700.6823,097.37887.771585.623626.0511.10
Carbon stocks/106 t5.2447.401.061.320.490.04
2010Area/km213,375.8822,960.53911.631573.964074.0910.88
Carbon stocks/106 t5.1247.121.081.310.550.04
2015Area/km212,983.4522,943.94905.771909.424729.9610.84
Carbon stocks/106 t4.9747.091.081.590.640.04
2020Area/km212,300.9523,153.911052.851665.965554.6011.93
Carbon stocks/106 t4.7147.521.251.390.750.04
Table 4. Major insights into land use shifts and carbon storage trends in eastern coastal Zhejiang (2000–2020).
ThemeKey FindingsData SourcesAnalysis Methods
Land Use ChangeCultivated land area decreased by 18.12% (a net loss of 2780.2 km2), while built-up land expanded by 143.52% (a net increase of 2952.3 km2). Forest land showed a net decrease of 0.08% (85.1 km2).Land use transition matrix (2000–2020)Land use dynamic change analysis
Carbon Storage ChangeTotal carbon storage declined from 55.996 × 10⁶ t to 55.656 × 10⁶ t (a cumulative reduction of 0.34 × 10⁶ t), exhibiting a “decline-first, then-rise” trend.Carbon storage module of the InVEST modelTime-series carbon storage simulation
Spatial Distribution CharacteristicsHigh-high clustering areas accounted for 4.48% (western mountainous areas), while low-low clustering areas accounted for 11.54–12.91% (Jiaxing and Ningbo urban districts).Global/local spatial autocorrelation analysis (Moran’s I)Spatial clustering and heterogeneity diagnosis
Major Carbon Sink TypesForest areas contributed 85% of the total regional carbon storage, followed by cultivated land (8%) and water bodies (2%).Carbon density parameter matrix (literature synthesis)Carbon sink contribution ranking
Driving MechanismsThe synergistic effects of urbanization acceleration (2000–2010), marine economic policies (post-2005), and ecological restoration policies (post-2010).Policy text analysis and land use transition linkageMulti-scale driving factor analysis
Disclaimer/Publisher’s Note: The statements, opinions and data contained in all publications are solely those of the individual author(s) and contributor(s) and not of MDPI and/or the editor(s). MDPI and/or the editor(s) disclaim responsibility for any injury to people or property resulting from any ideas, methods, instructions or products referred to in the content.

