Article

Risk-Targets Identification and Source Apportionment Associated with Heavy Metals for Different Agricultural Soils in Sunan Economic Region, China

1
School of Public Administration and Law, Northeast Agricultural University, Harbin 150030, China
2
The Center for Land Engineering and Remote Sensing of Heilongjiang Province, Harbin 150030, China
*
Author to whom correspondence should be addressed.
Land 2025, 14(5), 1058; https://doi.org/10.3390/land14051058
Submission received: 11 April 2025 / Revised: 8 May 2025 / Accepted: 10 May 2025 / Published: 13 May 2025

Abstract

:
Rapid socio-economic transition is often accompanied by intensive anthropogenic activities, leading to a significant build-up of heavy metals within farmland soils. However, this unwanted outcome may not be fully uniform but exhibit spatial variability, particularly involving different land uses. Based on 1839 topsoil samples from China’s Sunan Economic Region, this study estimated the contamination profiles and associated ecological risks posed by five heavy metals (As, Cd, Cr, Pb, and Hg) across cash-crop and cereal-crop soils. Further, we applied a combination of geostatistics and positive matrix factorization (PMF) model to identify the targeted zones, priority pollutants, and their underlying sources to pave the way for formulating detailed and fine-scale risk-mitigation strategies. Our results revealed that heavy metal pollution in Sunan displayed significant spatial variability, predominantly influenced by localized Hg and Cd accumulation, with more severe contamination observed in cash-crop soils compared to cereal-crop soils. The 232,532 ha of agricultural land could be designated as the targeted zones in which excessive Hg and Cd accumulation can be identified as the priority pollutants contributing to potential ecological risk. PMF modeling also suggested that within targeted zones, Cd accumulation was predominantly driven by intensive agrochemical application, whereas multiple sources simultaneously determined Hg accumulation. Our findings offer valuable guidance for optimizing land management strategies aimed at mitigating agricultural soil degradation driven by intensive anthropogenic activities. In addition, the integrated approach highlighted the crucial values in aspects to spatially identify risk-targeted zones and priority pollutants.

1. Introduction

Global societies are facing some huge challenges arising from explosive population growth and increasing food demands [1]. It was estimated that global agricultural production will need to increase by nearly two-fold by 2050 to satisfy the anticipated demands driven by global population growth and improved living conditions [2]. Under these circumstances, ensuring agricultural soil is healthy is particularly crucial because potentially negative effects would not only exacerbate the malnutrition risks faced by the most vulnerable groups worldwide but also lead to environmental unsustainability [3]. Unfortunately, studies revealed that intensive anthropogenic activities, along with urbanization and industrialization, had produced lots of pollutants discharged into agroecosystems, imposing substantial burdens on agricultural soils in the last few decades [4,5,6].
Among various pollutants that may trigger agricultural soil degradation, heavy metal (HM) accumulation is of particular concern due to the highly cumulative toxicity and long residence time [7,8]. Heavy metals are generally defined as elements, including both metals and metalloids, that possess densities exceeding 5 g/cm3 [9]. Excessive HMs accumulation in agricultural soils can deteriorate agricultural productivity [10] and affect ectomycorrhizal fungi [11], raising concerns about the long-term ability to maintain agroecosystem resilience. Currently, agricultural soil pollution from HMs accumulation has become a major obstacle to achieving sustainable development, especially in developing nations facing substantial food security and societal pressures [12]. Previous studies had revealed that excessive HMs accumulation might exacerbate food insecurity (SDG 2) and undermine human health through contaminated food chains (SDG 3) as well as cause irreversible damage to soil biodiversity and terrestrial ecosystems (SDG 15) [13,14,15]. These risks are not confined to isolated regions but have been increasingly observed across a range of global agricultural settings. For instance, total Cd inputs to soils through phosphate fertilizers were assessed to be around 334 t per year in the nations of the European Union [16]. Continuous fertilization and wastewater irrigation to agricultural soils had resulted in the excessive HMs accumulation in Argentina, Mexico, and Kenya [17,18,19], inevitably posing threats to the ecosystem and public health. Despite the widespread recognition, we often failed to avoid and prevent this unwanted outcome because HM pollution exists with significant spatial heterogeneity. Thus, accurately capturing the pollution characteristics and spatial variability has been commonly considered a crucial prerequisite for decision-making related to soil management and environmental risk mitigation [20,21].
Heavy metals primarily originate from natural geological sources linked to parent materials of soils. Due to the low concentrations, they are not easily migrated or absorbed by plants [22]. However, some intensive anthropogenic activities could significantly accelerate HMs accumulation and thus pose great risk to the ecosystem. For instance, the prolonged application of abundant agrochemicals may result in excessive accumulation of Pb, As, and Cd in agricultural soils [23,24]. Geogenic and anthropogenic origins commonly contributed to the accumulation of Cr [25], while mining, smelting, and vehicle emissions should be largely responsible for excessive Hg concentrations [26]. While there had been some knowledge on the major sources, existing studies typically focused on single crop-soil or did not explicitly distinguish agricultural land-uses. In fact, different agricultural land-use practices could significantly alter the patterns and intensities of HMs accumulation. In general, cash-crop cultivation typically involves more frequent agrochemical applications and shorter rotation cycles, potentially leading to elevated Cd and Pb accumulation, whereas cereal-crop systems may exhibit comparatively lower heavy metal residues due to less intensive management practices [27,28]. Such variations underscore the necessity of differentiating agricultural land-use in order to accurately identify pollution sources and assess associated environmental risks.
Over the past few decades, intensive anthropogenic activities have resulted in the continuous agricultural soil degradation in China. The Chinese Soil Contamination Survey revealed that approximately 16% of farmland soil sampling sites had greater HMs concentrations than the Chinese Environmental Quality Standard [29,30]. Major zones of soil pollution were predominantly distributed in areas experiencing intensified human activities, including the Yangtze River Delta. As a key region in the Yangtze River Delta, the Sunan economic region (Sunan) played a crucial role in accelerating socio-economic development. Sunan has historically been recognized as a critical grain-producing region within China’s agricultural development. However, recent studies have highlighted huge concerns regarding heavy metal contamination in this region. For instance, Cd and Hg concentrations in farmland soils exceeded local background levels by 50.2% and 164.3%, respectively, indicating substantial anthropogenic inputs [31]. Another investigation found that 7.14% of soil samples surpassed the Grade II standard for Cd, while 33.32% exceeded the same standard for Hg, reflecting widespread pollution in the area [32]. Therefore, this region could serve as a representative “natural experiment” to advance the understanding of the role of intensive human activities in determining HMs accumulation. Furthermore, as the existence of diversified agricultural practices and cropping systems, this region also provides a valuable case to make comparisons of soil health in different agricultural land-uses.
Despite the universal recognition of serious soil contamination in Sunan, knowledge about the exploration of spatial heterogeneity remains ambiguous. In this study, we utilized the contamination factor (Cf), pollution load index (PLI), along with Hakanson’s ecological risk assessment framework, to evaluate the contamination profiles and associated ecological hazards induced by HMs accumulation based on 1839 agricultural topsoil samples. Based on the estimation, we made attempts to identify the targeted zones and priority pollutants that should be paid special attention in future soil management. To advance the understanding about the impacts of varying agricultural practices on soil health, our research investigated HMs accumulation in soils cultivated with cash-crops and cereal-crops. Finally, the PMF model was applied to distinguish and quantify contributions from various sources for priority pollutants in targeted areas. Our specific research objectives were to: (i) estimate the pollution and potential ecological risk levels of major heavy metals (As, Pb, Cr, Cd, and Hg); (ii) spatially designate the targeted zones and priority pollutants with respect to agricultural soil HMs treatment; and (iii) apportion the contributions of dominant sources for priority pollutants in targeted areas. Our findings could provide valuable guidance for family farmers in adjusting cultivation practices to mitigate soil contamination, assist local land management authorities in developing targeted environmental remediation strategies, and inform food security decision-makers in formulating sustainable agricultural policies.

2. Materials and Methods

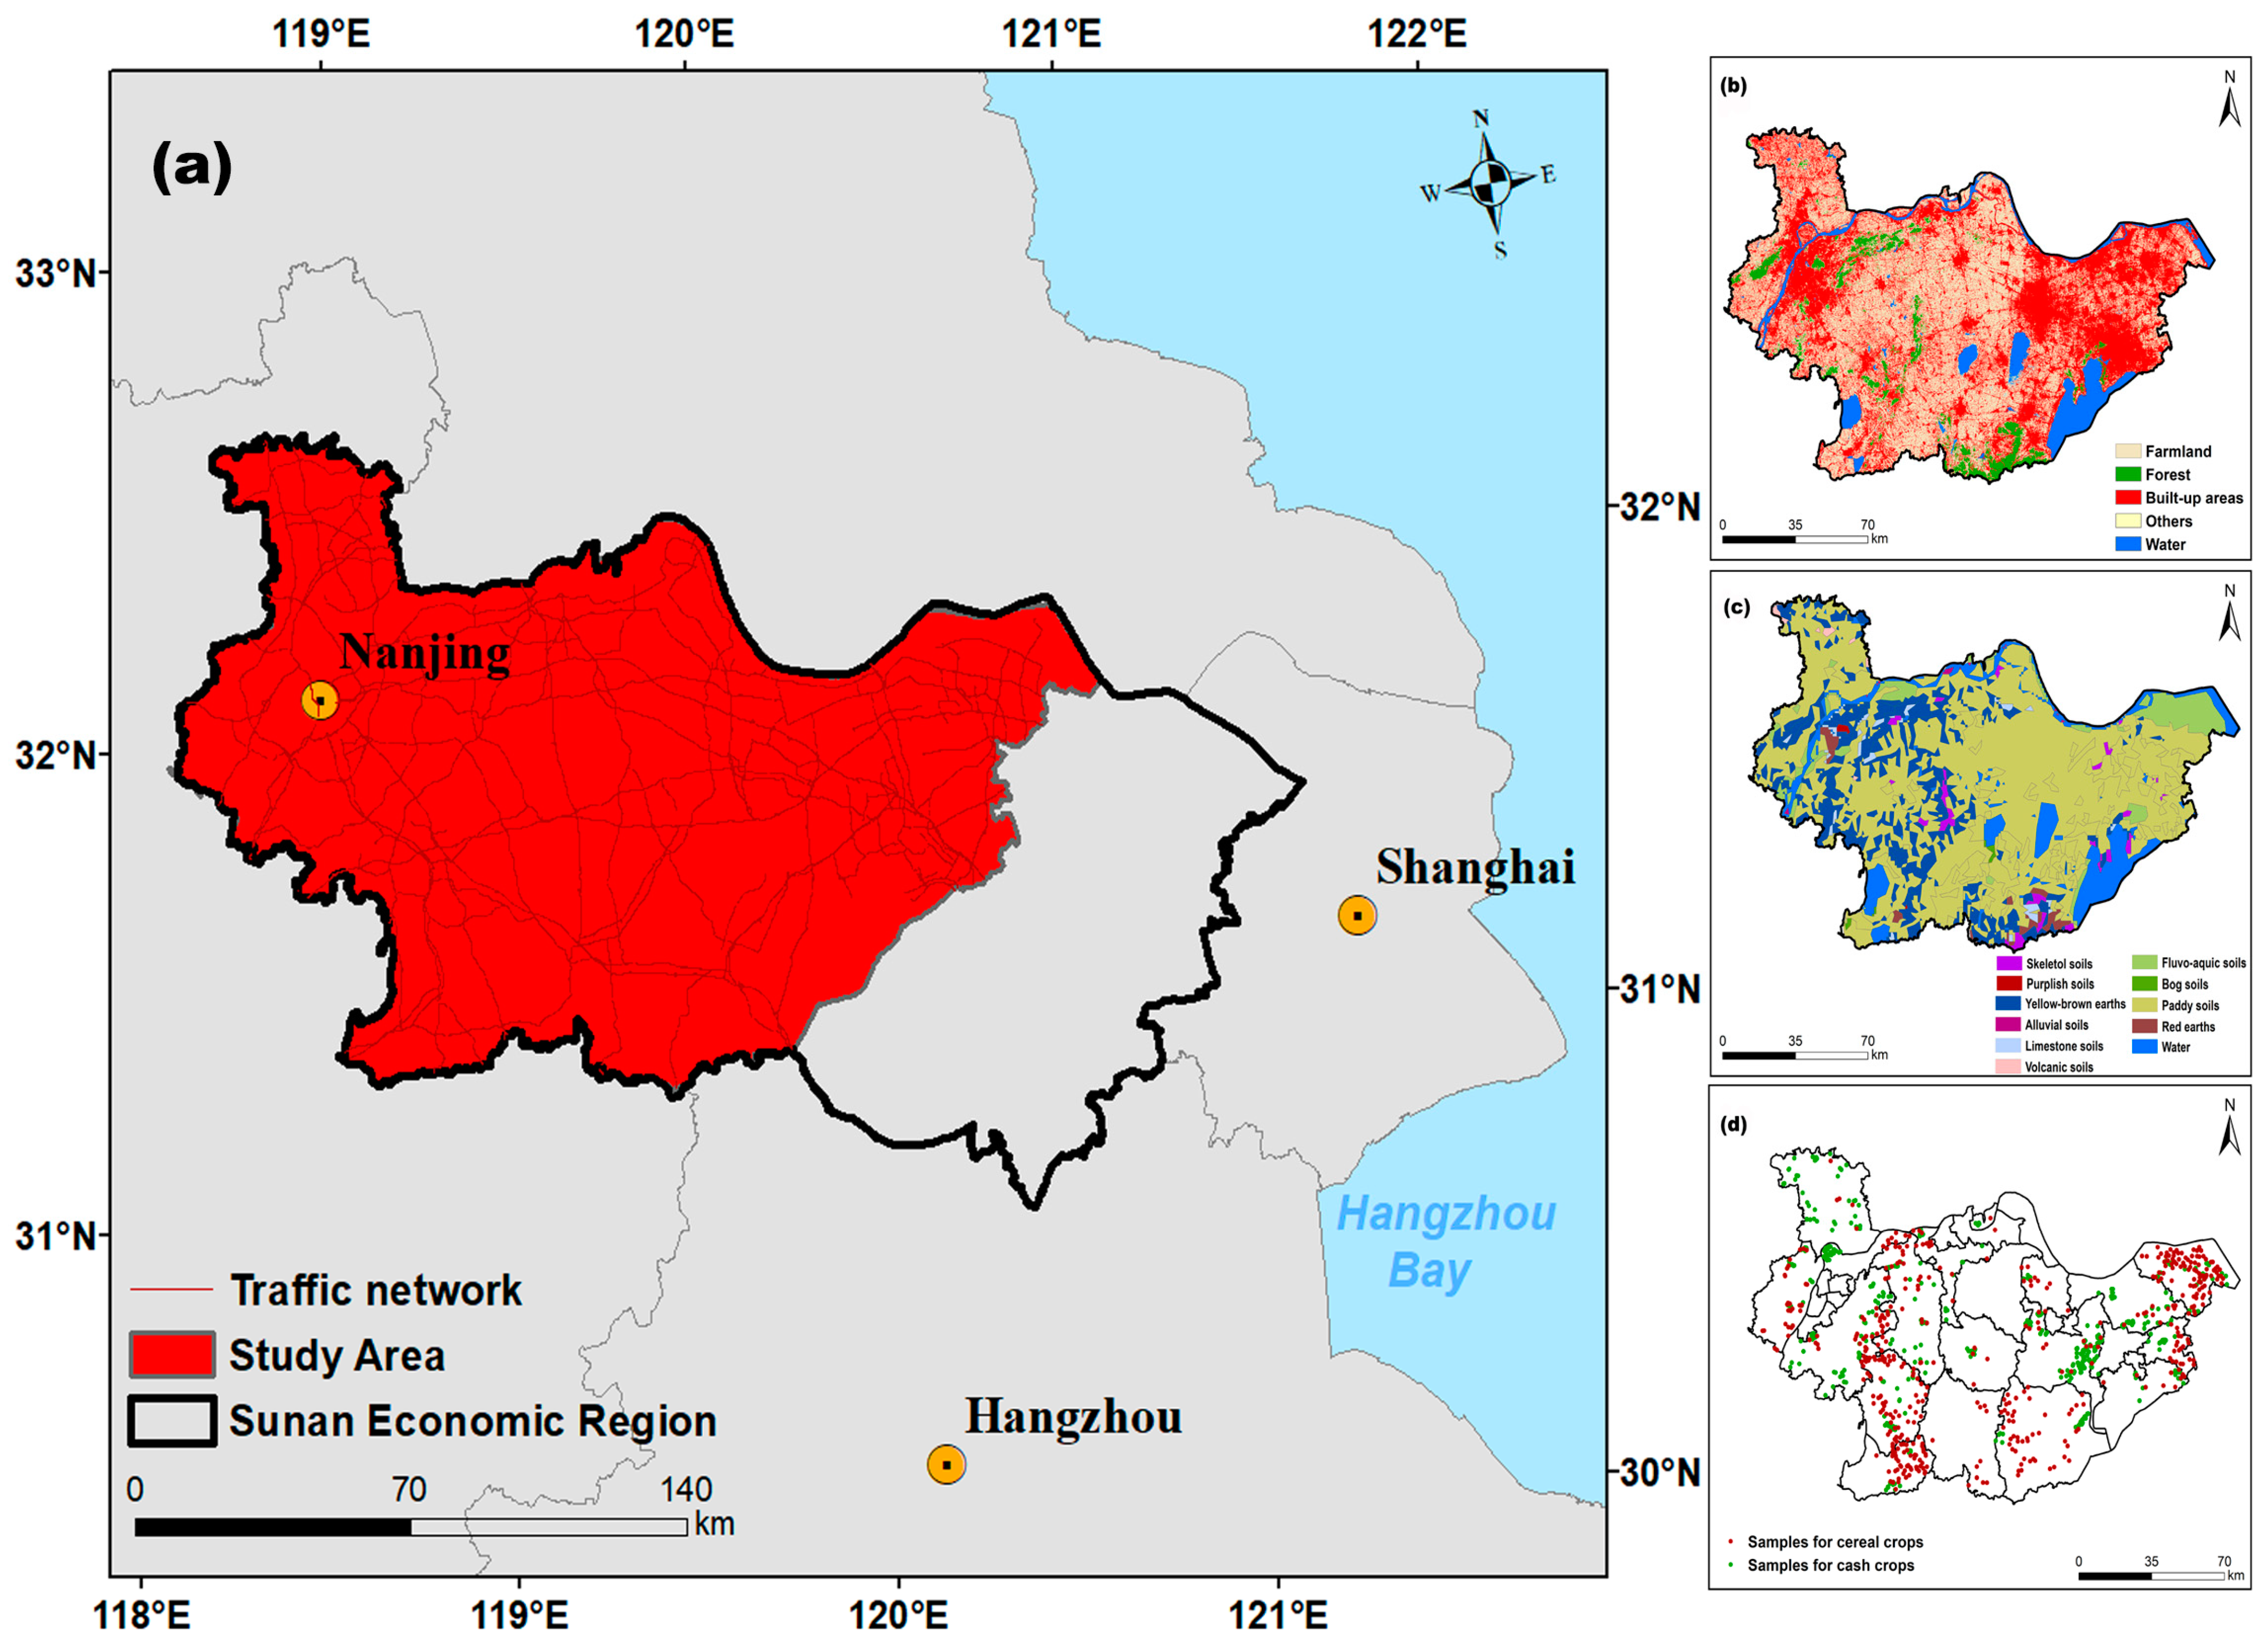
2.1. Study Area and Sample Collections

The Sunan Economic Region (Sunan), situated in the lower reaches of the Yangtze River, is recognized as one of China’s most economically developed areas (Figure 1a). Sunan consists of 38 counties and covers about 27,945 km2. Sunan experiences a subtropical monsoon climate, characterized by an annual average temperature of around 19 °C and a mean annual precipitation of approximately 1267 mm. Dominant wind patterns typically blow from the northwest during winter and from the southeast during summer. This region is well suited for agriculture, in which two crop harvests per agricultural plot can be achieved annually [33]. Specifically, cereal-crops in the region primarily consist of rice, wheat, barley, and maize, whereas cash-crops are mainly composed of fruits, teas, vegetables, and tobaccos. Unlike many traditional agricultural regions in China that are dominated by large corporate farms [34], smallholder cultivation is widespread throughout the Sunan region [35].
From September of 2016 to March of 2018, we collected a total of 1839 agricultural topsoil samples (including 1094 cereal-crop soil samples and 745 cash-crop soil samples) from 30 of 38 counties in Sunan. Due to the cost limitation and significant differences in farming structure, our sampling design was not fully spatial, even though it followed a random tessellation. To make our results comparable and understandable, we divided our soil samples into cereal-crop soils and cash-crop soils based on agricultural practices and vegetation phenological characteristics. In comparison with cereal-crops, specifically, cash-crops had shorter duration and more cropping frequency in given periods. In addition, cash-crops were often cultivated with greater input intensity in smaller agricultural plots.
We collected soil samples at a depth of 20 cm by using stainless steel shovels. Five samples were collected within a radius of 10 m and then mixed into one composite sample to represent the given plot. All soil samples were stored in polyethylene bags and then sent to our laboratory within 24 h following sampling. In addition, we also used a global positioning system receiver to record the geo-referenced coordinates for each site.

2.2. Sample Analysis

All samples were first air-dried for 1 week at room temperature in a storage room and then sieved to 2 mm for removing large stones, residual roots, and other sundries. After digestion with a mixture of nitric acid (HNO3) and perchloric acid (HCLO4), the total concentrations of Pb, Cr, and Cd were determined using inductively coupled plasma mass spectrometry (ICP-MS) [36]. A portion of samples were subjected to treatment with potassium permanganate and oxalic acid solution and subsequently reduced by adding potassium borohydride for reduction. After that, the concentrations of As and Hg were measured using atomic fluorescence spectrometry (AFS). Calibration and blank samples were analyzed every 50 measurements.
During the chemical analysis, certified reference soil materials (GBW07403) were employed for quality assurance and quality control. The recovery rates of Cd, Cr, Hg, Pb, and As were in the range of 95.1~102.5%, 92.3~106.7%, 90.6~109.6%, 94.2~107.3%, and 96.5~103.6%, respectively. Approximately 8% of soil samples were reanalyzed as duplicate samples to ensure data reliability (87 samples for cereal-crop soils and 56 for cash-crop soils) with the relative standard deviation within 4%. In addition, a standard curve was established by preparing five concentration points of a multielement standard solution, based on the actual concentration requirements [37].

2.3. Heavy Metal Contamination Indices

We introduced the contamination factor (Cf) and pollution load index (PLI) to assess the pollution characteristics. Specifically, the contamination factor (Cf) is defined as the ratio of HM concentration in the soil to the local background value:
C f = N i N b
where Ni and Nb are the actual concentrations of HM i and its corresponding local background value (Hg = 0.025 mg/kg, As = 9.4 mg/kg, Cr = 75.6 mg/kg, Cd = 0.085 mg/kg, Pb = 22 mg/kg), respectively [8,38]. We classified this index into four categories based on the intensities: Cf < 1, low pollution; 1 ≤ Cf < 3, moderate pollution; 3 ≤ Cf < 6, considerable pollution; and Cf ≥ 6, very high pollution [39,40,41]. Further, we applied the pollution load index (PLI) to evaluate the integrated pollution status at sampling locations [42].
P L I = C f 1 × C f 2 × C f 3 × × C f n n
where n is the number of HMs. If PLI > 1, soils in the given sampling sites are overall contaminated, whereas PLI ≤ 1 represents overall uncontaminated status [43].

2.4. Potential Ecological Risk Assessment

We applied the index proposed by [44] to assess the potential ecological risk triggered by HMs accumulation as follows:
E i = T r i C i / C 0 i
R I = E i
where Ci is the actual concentration of HM i; C0i is the local background value of HM i; T r i is the toxicity coefficient (Hg = 40, Cd = 30, As = 10, Pb = 5, and Cr = 2); Ei is the potential risk factor of the individual element i and RI is the comprehensive potential ecological risk index at the given sampling sites [44]. According to the Ei values, the potential ecological risk was classified into five risk levels: low (Ei < 40), moderate (40 ≤ Ei < 80), considerable (80 ≤ Ei < 160), high (160 ≤ Ei < 320), and very high (Ei ≥ 320); and very high risk (Ei ≥ 320). In addition, the overall potential ecological risk index (RI) was grouped into four classes: low (RI < 150), moderate (150 ≤ RI < 300), considerable (300 ≤ RI < 600), and very high (RI ≥ 600) [45].

2.5. Source Apportionment—PMF Model

The PMF model utilized both the correlation and covariance matrices to reduce the dimensionality of variables and extract several integrated factors [46]. Specifically, the PMF model decomposed the original matrix into a contribution matrix, source profile, and residual error matrix as the following Equation (5):
X i j = k = 1 P g i k f k j + e i j
where Xij represents the matrix of sample concentrations; gik is the contribution of each factor to a given sample; fkj represents the source profile for HM j in source k; and eij is the residual error matrix for each sample. Furthermore, factor contributions and source profiles can be determined by minimizing the objective function Q under the constraint of non-negative contributions as follows [47,48]:
Q = i = 1 n j = 1 m ( e i j μ i j ) 2
where μij represents the uncertainty in j th HM for i th soil sample. More details about the uncertainty matrix and mathematical algorithms of the PMF model can be found elsewhere [49,50,51].
In this study, the EPA PMF software (version 5.0) was employed to perform source apportionment. The rotational tool was used to minimize oblique rotation and to determine the optimal number of factors based on the minimum and stabilized Q value. To improve the accuracy and applicability, PMF modeling was only conducted for those targeted zones with relatively severe potential ecological risk (40 ≤ Ei or 150 ≤ RI), and only those soil samples concentrated within or on the periphery of targeted zones were selected.

2.6. Geostatistical Analysis and Targets Identification

As a classical geostatistical approach, kriging interpolation has been extensively utilized to characterize the spatial configuration and heterogeneity of HMs accumulation at locations without sampling, owing to its unbiased nature [52,53]. In this study, ordinary kriging interpolation was employed to investigate the spatial distributions of HMs concentrations, pollution profiles, and potential ecological risks. To ensure the estimation accuracy, we first conducted logarithmic transformation for those raw data that did not conform to normal distribution. After that, GS+9.0 statistical software was employed to determine the best-fitted variogram models (such as spherical, Gaussian, and exponential models) as well as related parameters used in kriging interpolation (Please see the semi-variance models and their key parameters in Supplementary Materials). More details about kriging interpolation can be found elsewhere [52,54,55,56].
Based on the interpolated estimation, we extracted those regions with relatively severe potential ecological risk (40 ≤ Ei or RI ≥ 150) as targeted zones where future soil management practices should focus on. Subsequently, priority pollutants that may produce greater potential ecological risk in targeted zones were identified by comparing the scores of potential risk factors (Ei). Agricultural plots often mosaic with some other land-use covers (such as impervious surface and grassland), particularly in the periphery of urbanized areas. These plots may suffer from varying pollutants and thus should be listed as different targeted zones. For this reason, we extracted the spatial extent of agricultural land following visual interpretation of the maps of land-use and land-covers (LULC) with a resolution of 30 m. As a consequence, the prioritized goals for future soil remediation could be more accurately designated to every agricultural plot, combined with the identification of targeted zones, crop soil types, and priority pollutants.

3. Results

3.1. Descriptive Statistics

Basic characteristics for all soil samples were shown in Table 1. For the cereal-crop soil samples, the mean levels of Cr, As, Hg, Cd, and Pb were 64.637, 8.671, 0.016, 0.2, and 20.885 mg/kg, respectively. It was observed that among these five HMs, the mean concentration of Cd was 2.35 times greater than the background level of Jiangsu Province, while the exceeding rates for Cr, As, Hg, and Pb were 27.52%, 33.9%, 11.8%, and 31.94%, respectively. Furthermore, the analysis of variation coefficients showed that Hg, Cd, and Pb exhibited considerable spatial variability with CV values of 94.7%, 85.6%, and 41.9%, respectively. Hg and Cd had greater skewness and kurtosis than the other three HMs, indicating that there might exist more broadly local accumulations (Table 1).
For the cash-crop soil samples, the mean levels of Cr, As, Hg, Cd, and Pb were 70.495, 8.899, 0.023, 0.084, and 21.545 mg/kg, all of which were below the local background values. However, the maximal concentrations of Cr, As, Hg, Cd, and Pb were 1.91, 2.24, 7.88, 28, and 3.21 times greater than the background levels, also suggesting the existence of some local accumulations. Similarly, the coefficients of variation for Hg, Cd, and Pb were greater than that of the other two HMs, while at the same time Hg and Cd had greater skewness and kurtosis.

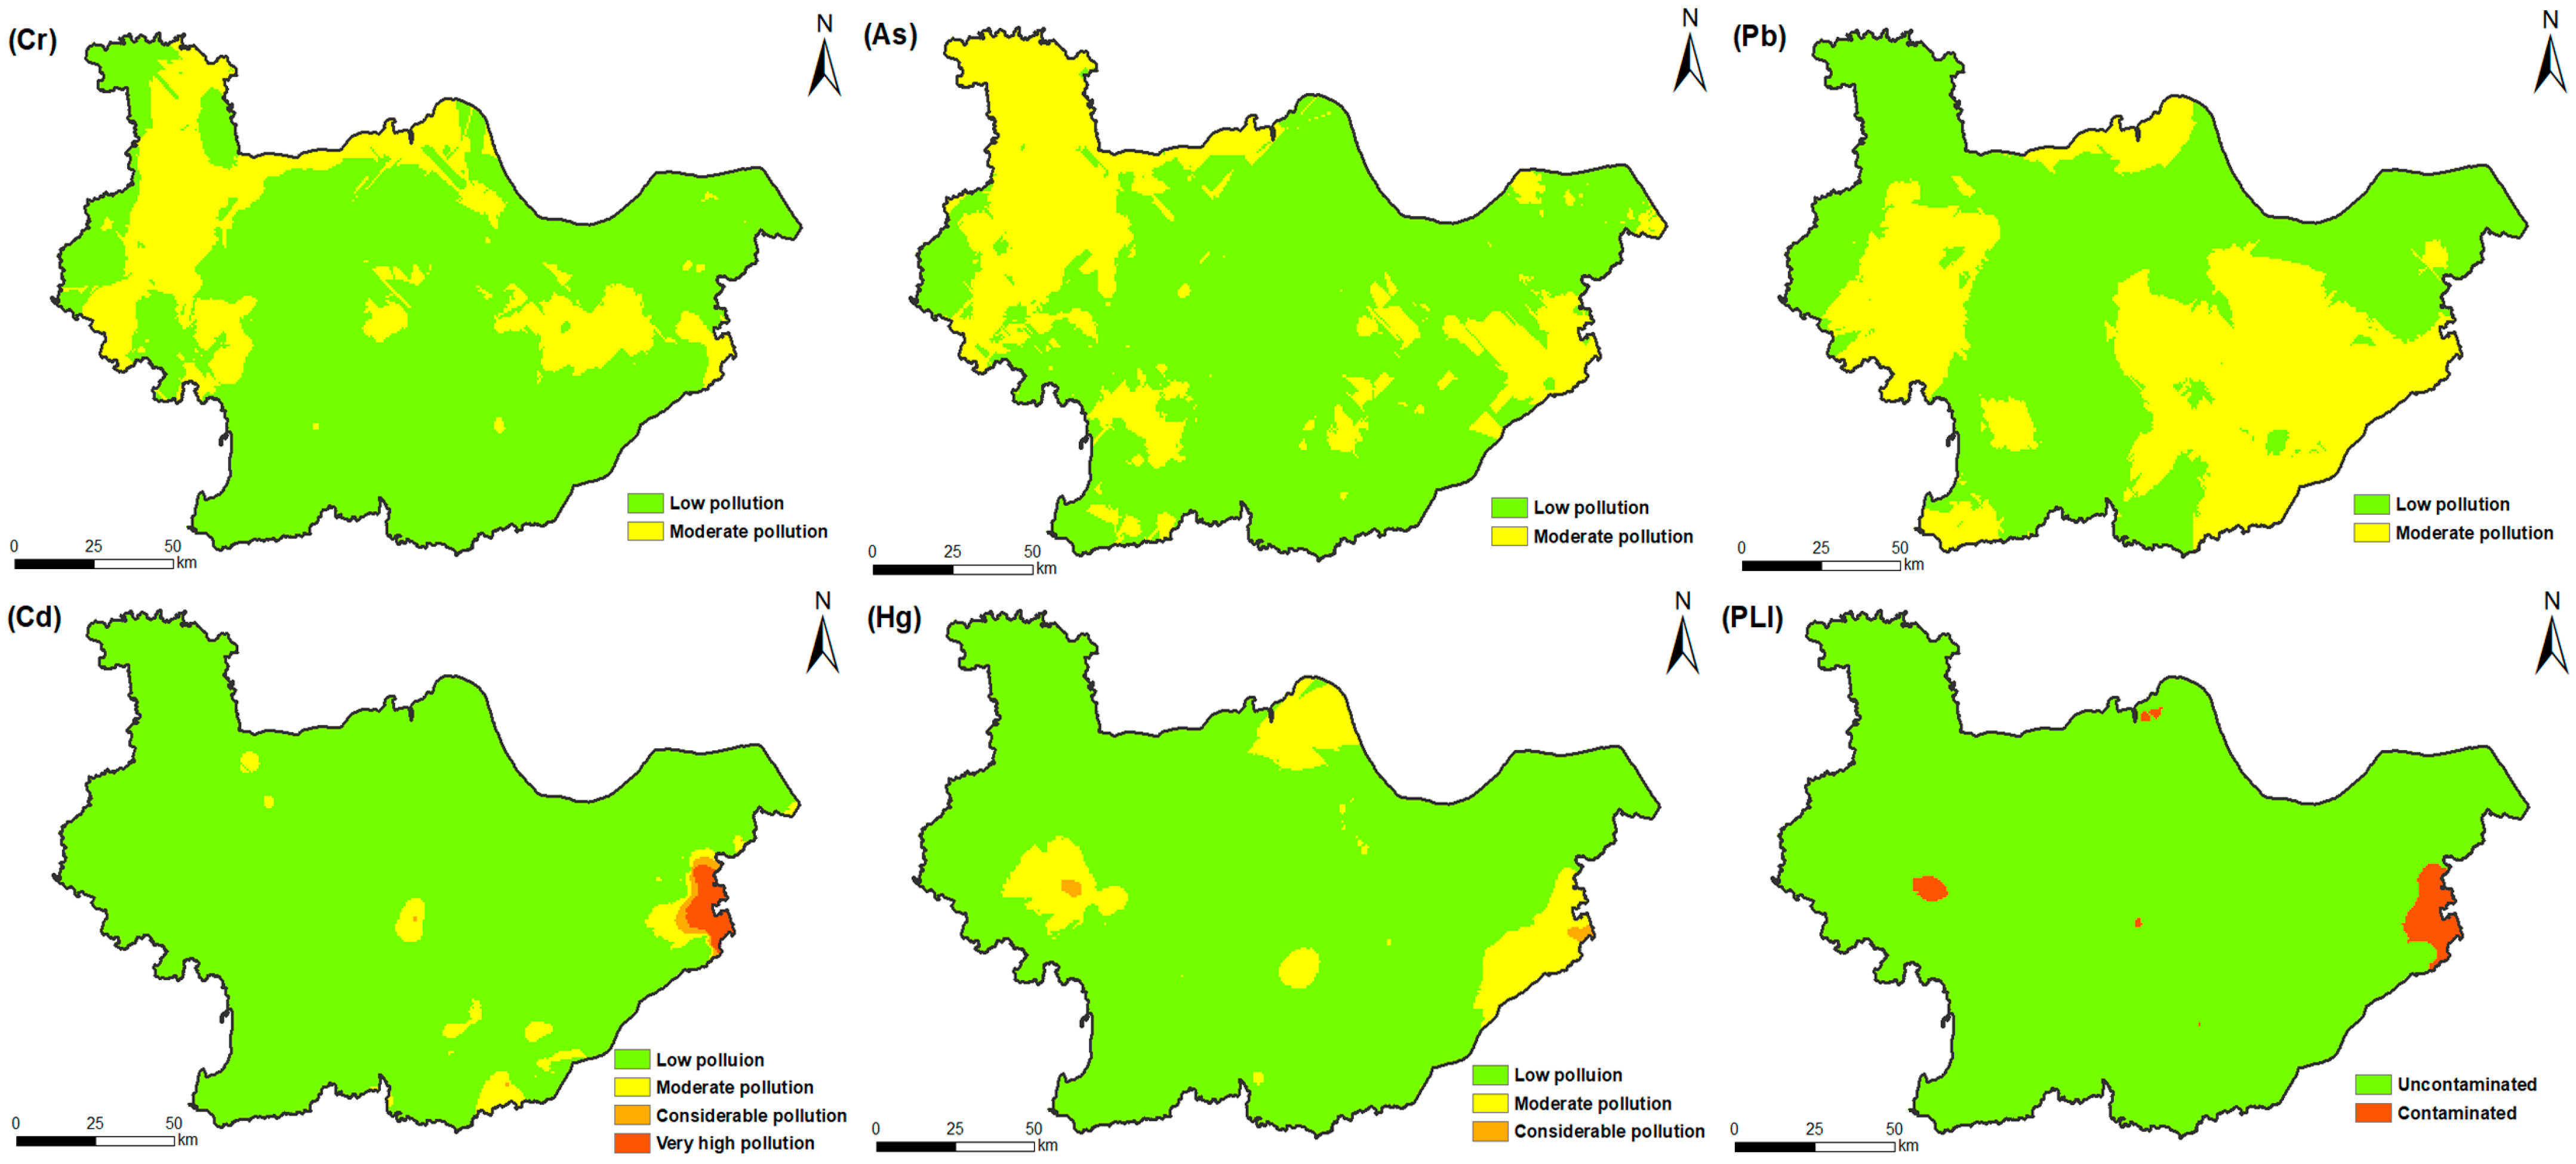
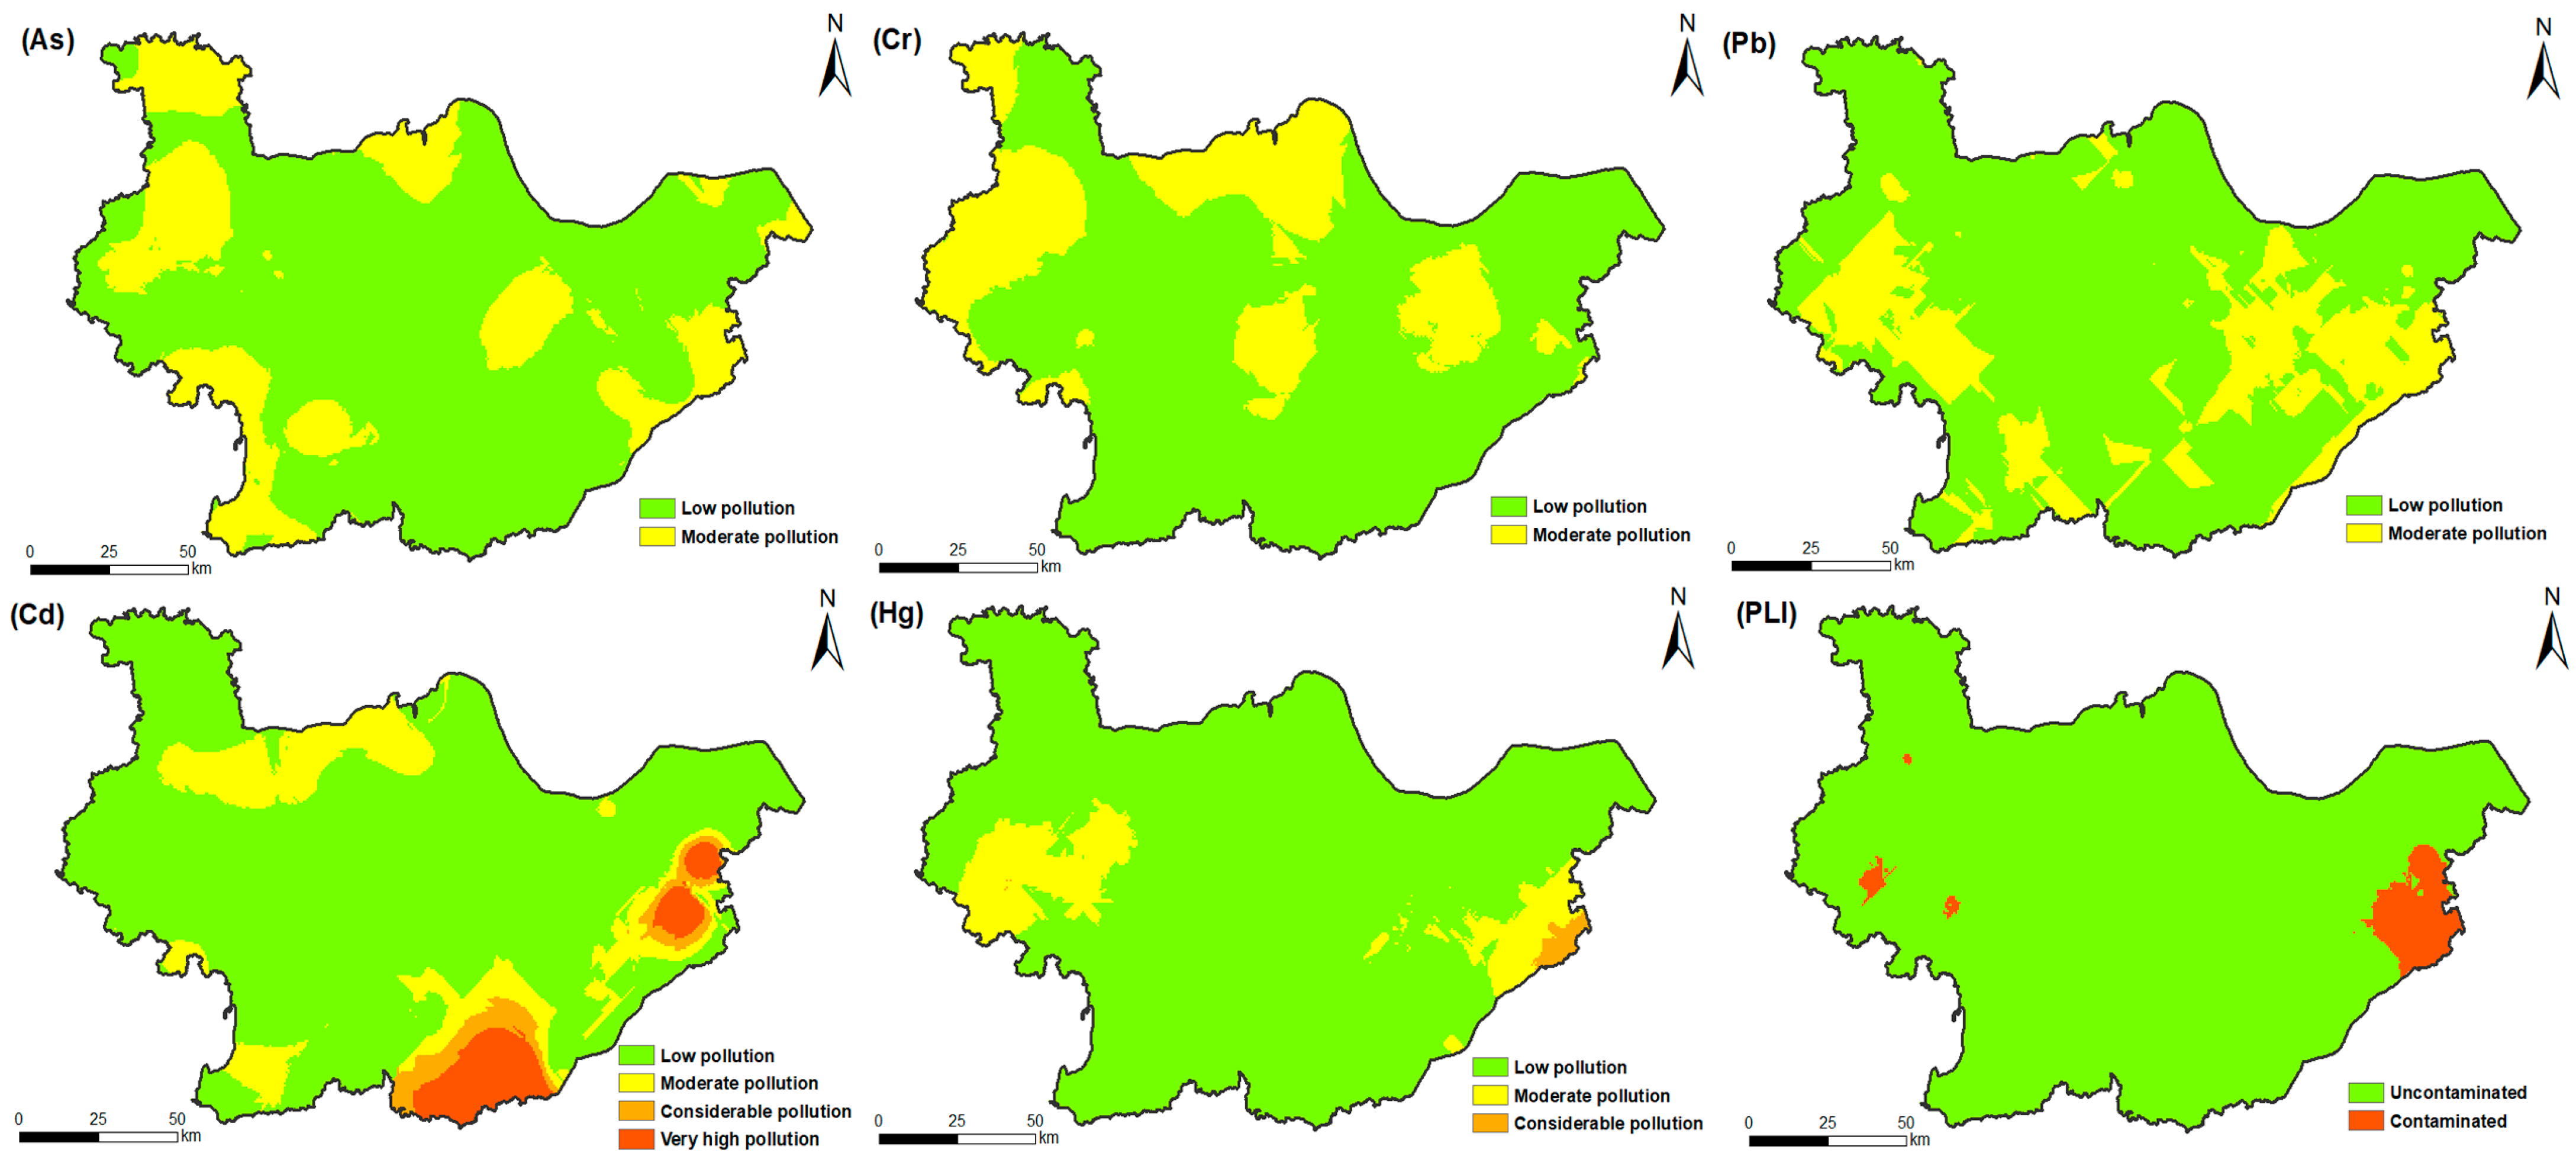
3.2. Soil Heavy Metals Pollution

Our results showed that HMs accumulation generated low or moderate pollution for most regions of Sunan but also resulted in more severe pollution in some sporadic areas. For the cereal-crop soils, the mean PLI value was 0.647 across the entire region, and about 6% of the total samples were overall contaminated (PLI > 1). The contamination factor index (Cf) showed that chromium (Cr) and arsenic (As) in all tested samples belonged to “low” or “moderate” pollution levels, while only 0.83% of tested samples had “considerable” pollution by lead (Pb) (Figure 2). Among the tested samples for cereal-crop soils, the proportion of “considerable” and “very high” pollution for cadmium (Cd) and mercury (Hg) was relatively high, reaching 4.42% and 2.21%, respectively. Furthermore, the mean contamination factors (Cf) for individual HMs ranked as Pb (0.979) > As (0.922) > Cr (0.855) > Hg (0.625) > Cd (0.610), all of which belonged to the “low” pollution level. Based on the above estimation, ordinary kriging interpolation was applied to produce the spatial variability of soil heavy metal concentrations (Figure 3). It was observed that the spatial pattern of comprehensive pollution level (PLI) was primarily controlled by localized cadmium (Cd) and mercury (Hg) accumulation. Specifically, the overall contaminated areas were mainly concentrated in the eastern parts but also dispersed in some areas in the western and northern parts. Correspondingly, cadmium and mercury had also resulted in “considerable” and “very high” pollution levels in these areas. In comparison with cadmium and mercury, the other three elements (Cr, As, and Pb) did not reach a “considerable” pollution level across the entire study area.
For the cash-crop soils, the mean PLI value was 0.806 across the entire region, and approximately 15% of the tested samples were overall contaminated (Figure 2). Despite some existence of “considerable” and “very high” pollution levels for cadmium, mercury, and lead, the mean Cf values of all tested samples followed a descending sequence of Cd (0.991) > Pb (0.979) > As (0.947) > Cr (0.932) > Hg (0.901), indicating “low” pollution levels. Spatially, some sporadic regions with overall contamination (PLI > 1) mainly emerged in the eastern and western parts (Figure 4). Similarly, chromium, arsenic, and lead had no regions beyond the “moderate” pollution level across the entire study area, while cadmium and mercury were the key HMs dominating the overall contaminated patterns. Specifically, the “considerable” and “very high” pollution levels for Cd occurred in the eastern and southeastern parts, while Hg was considerably polluted in sporadic areas of the eastern parts.
In summary, although both agricultural soils generally exhibited an uncontaminated status, heavier pollution induced by HMs accumulation was observed in cash-crop soils compared to cereal-crop soils. Furthermore, the pollution patterns were primarily shaped by localized accumulations of cadmium (Cd) and mercury (Hg).

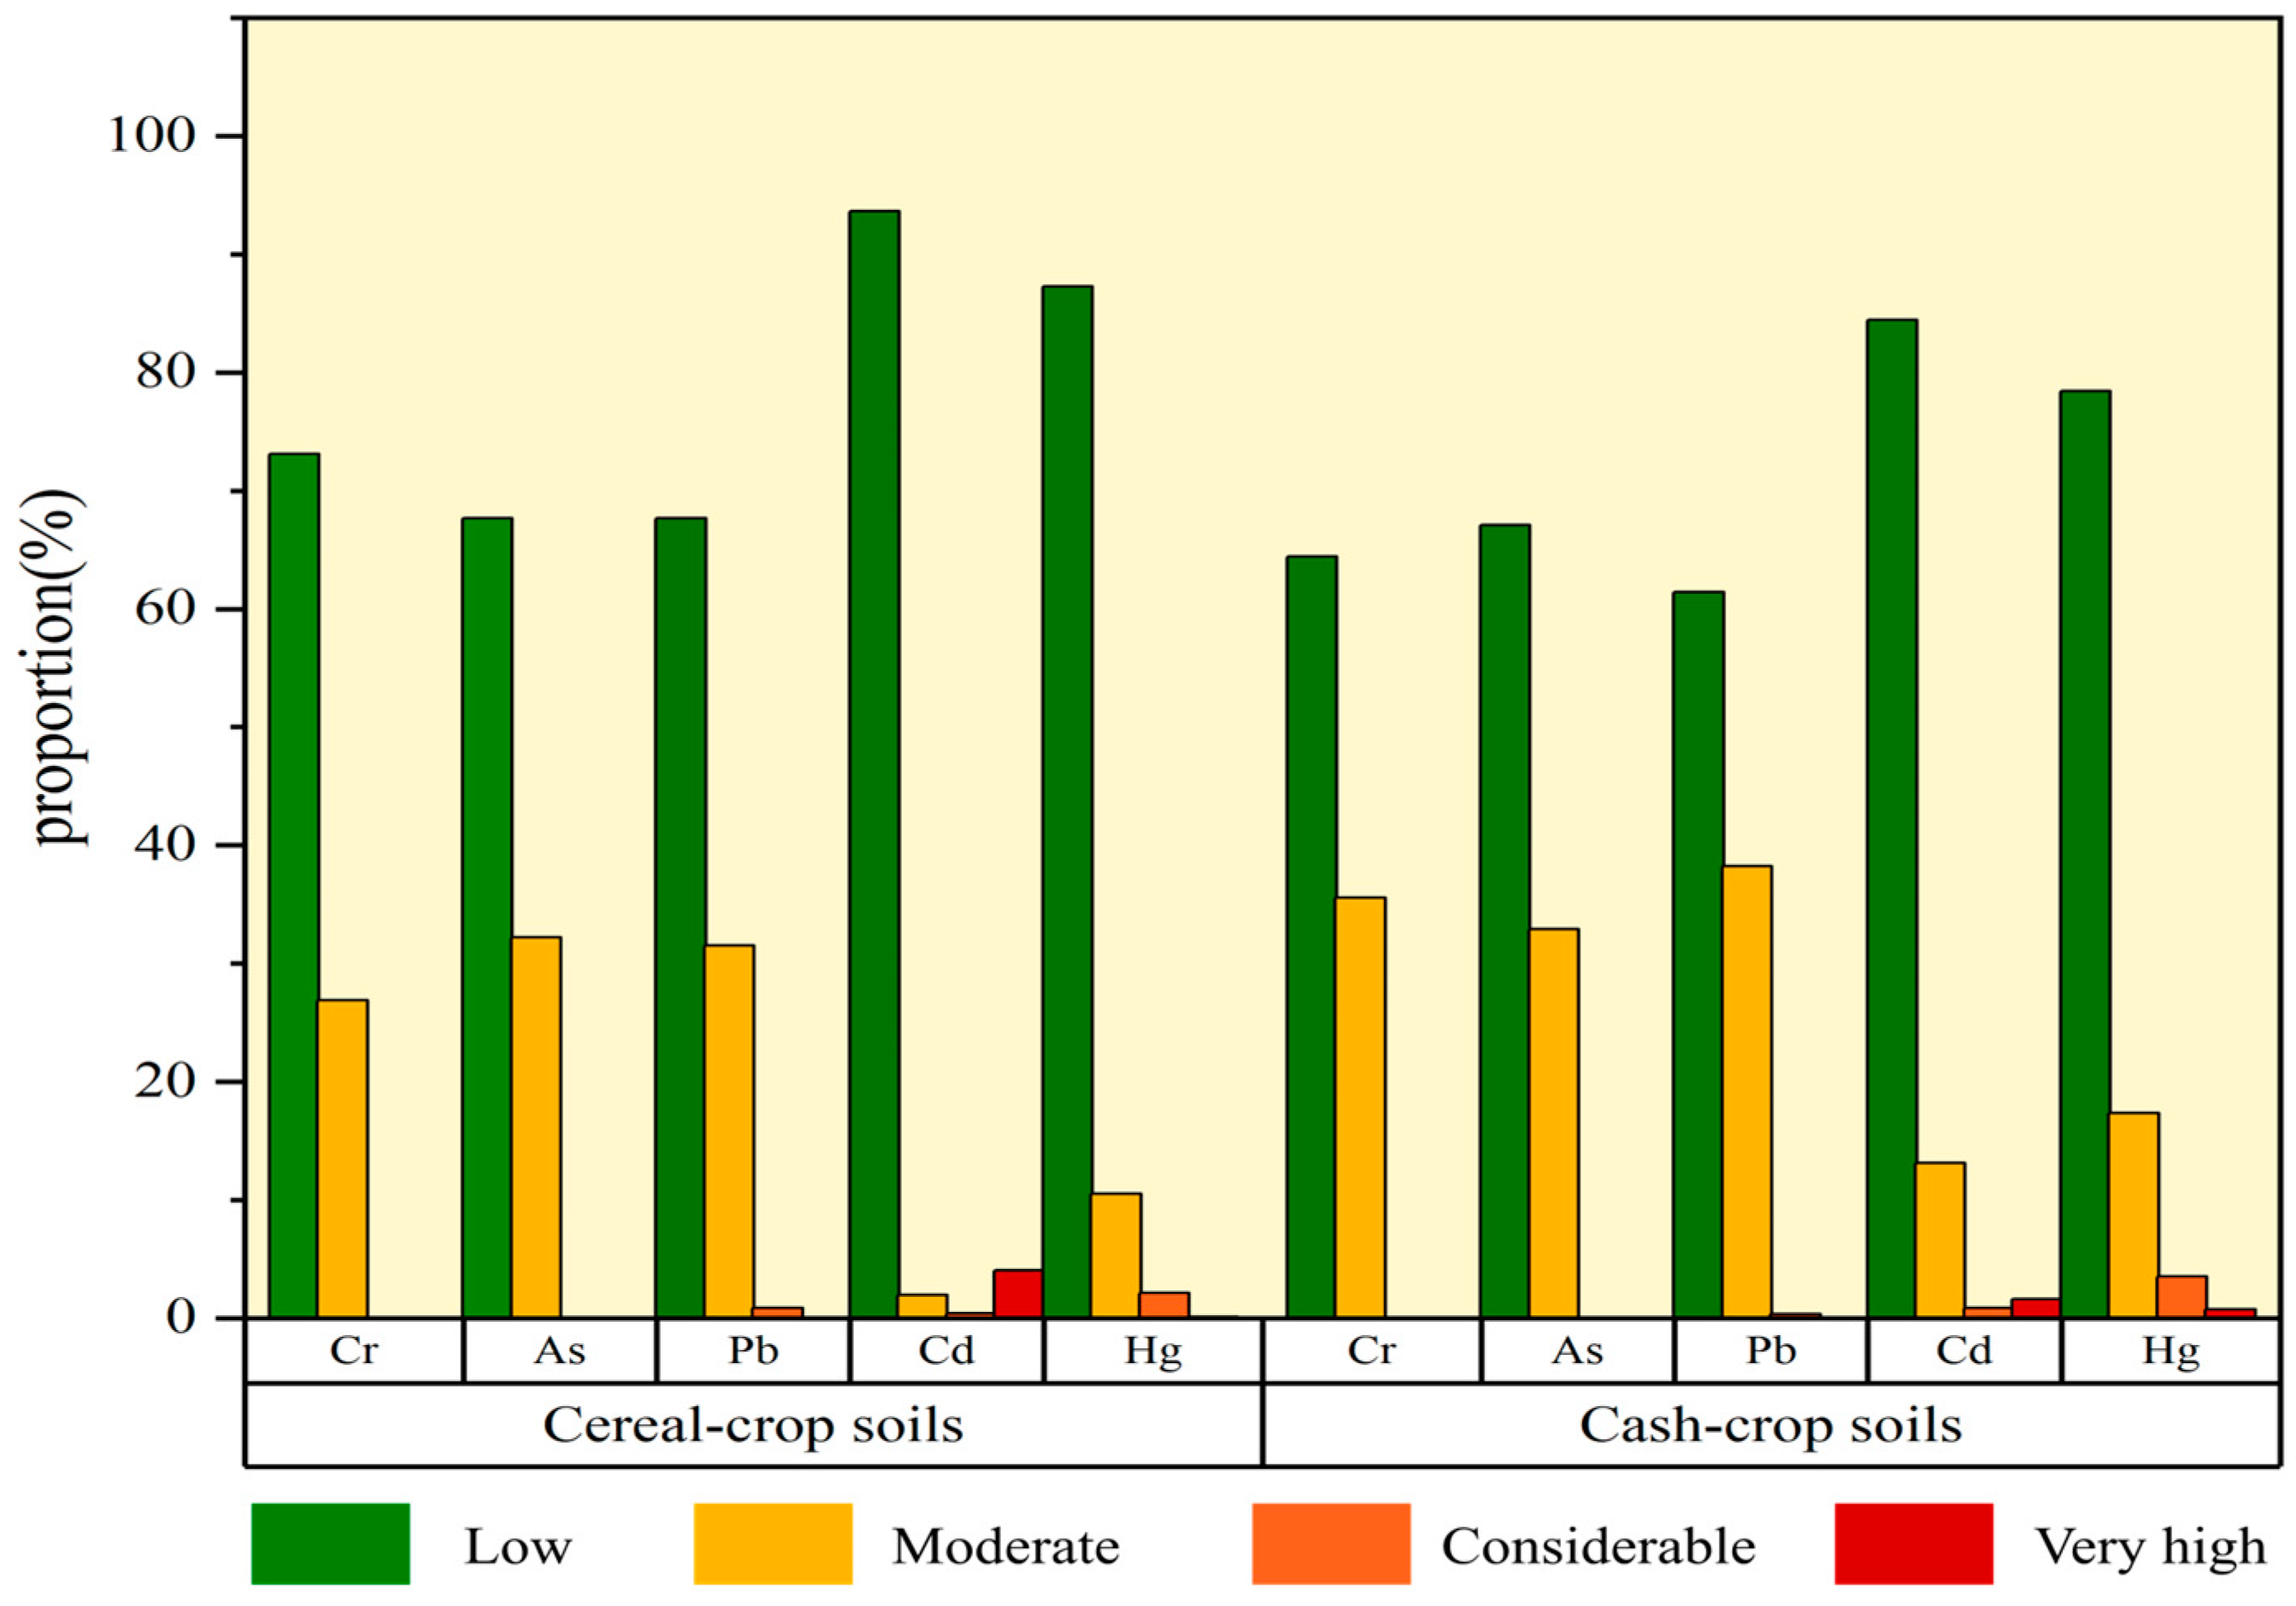
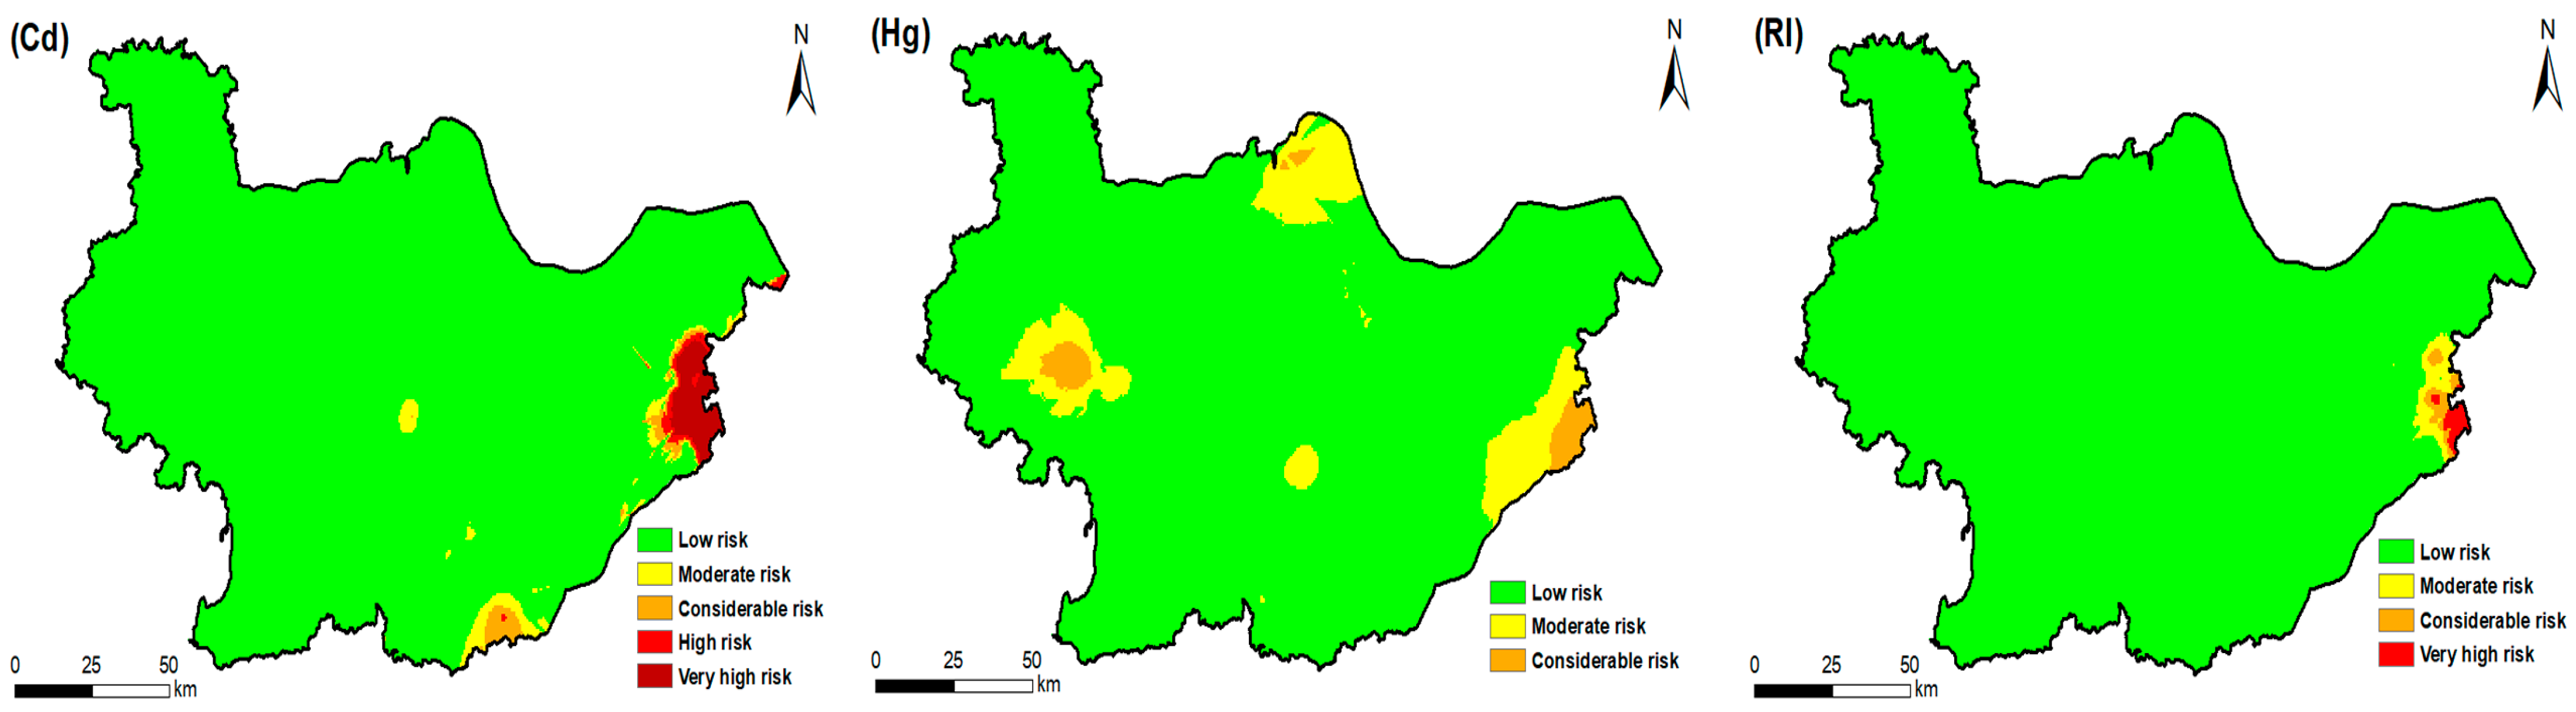
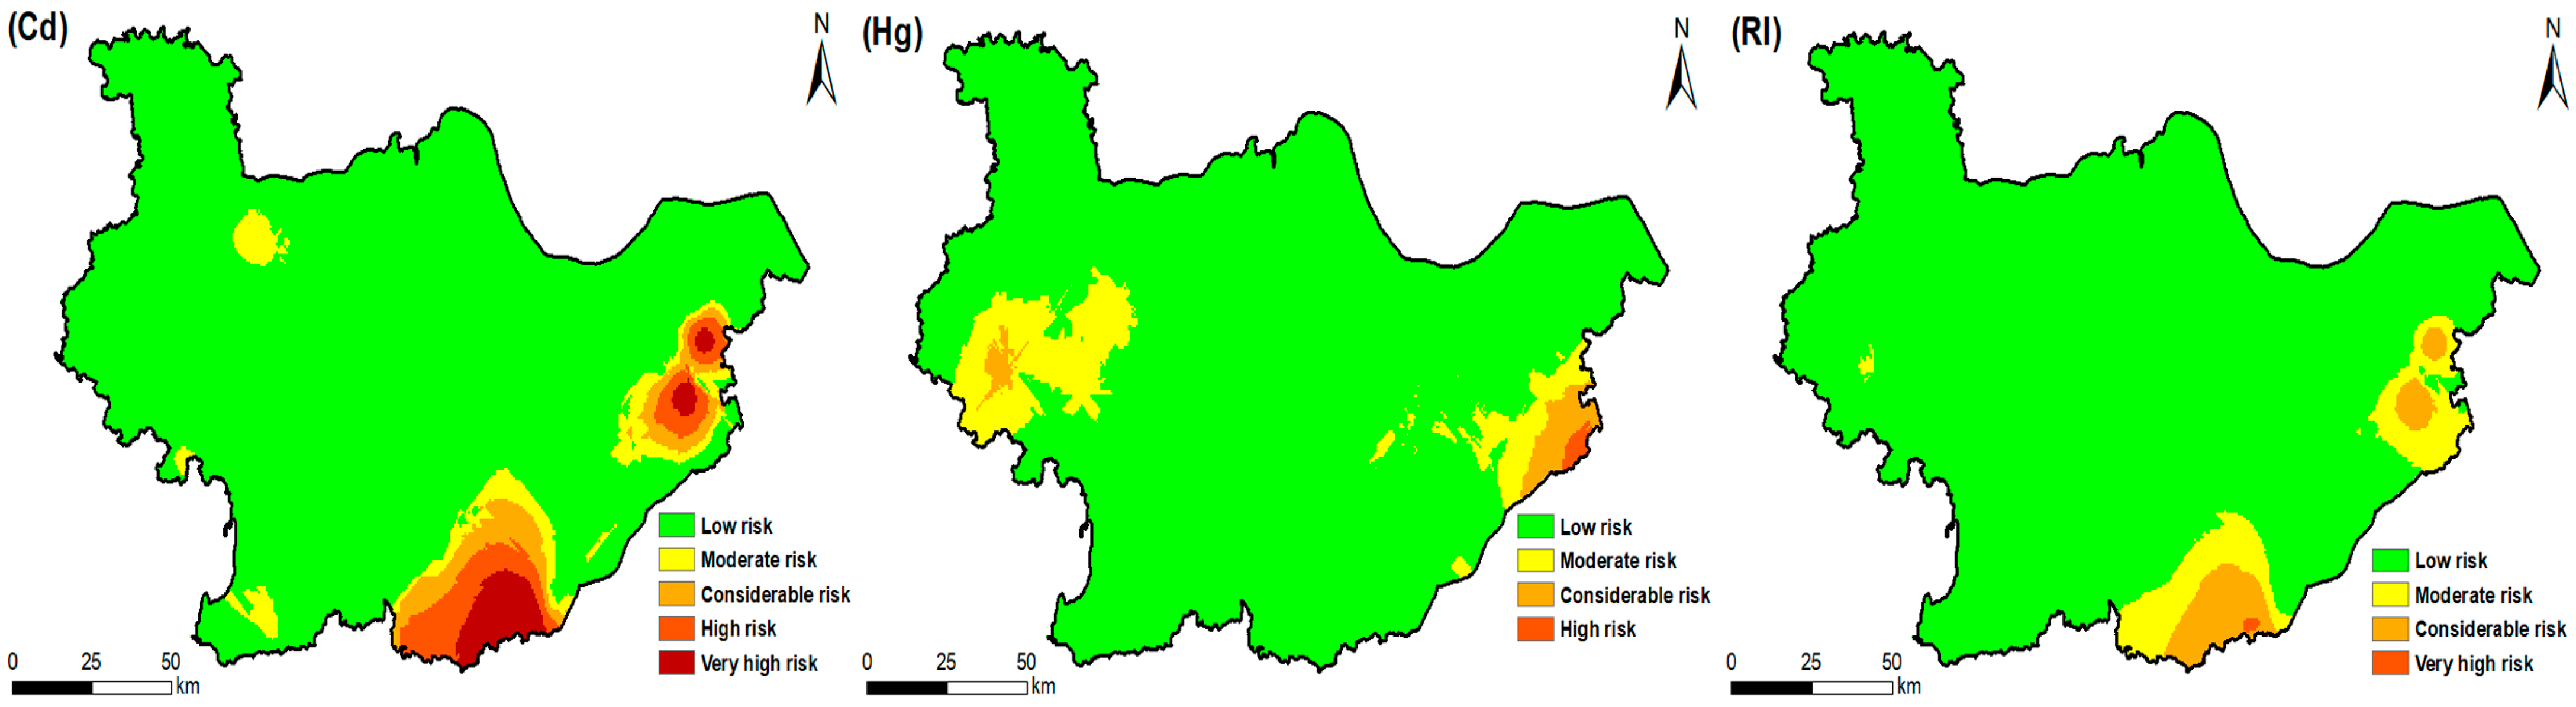
3.3. Potential Ecological Risk

Risk assessment revealed that Cr, As, and Pb exhibited “low” levels of potential ecological risk throughout the entire region, whereas Cd and Hg emerged as the primary contributors to ecological risk within both agricultural soils. To a large extent, this result was consistent with pollution characteristics triggered by HMs accumulation.
For the cereal-crop soils, areas experiencing “moderate”, “considerable”, “high”, and “very high” ecological risks induced by Cd accumulation spanned 824.15 km2, accounting for approximately 4.05% of the whole area. Spatially, these regions were primarily concentrated in the eastern parts, while at the same time scattered in some sporadic areas of the southeastern and central parts (Figure 5). Compared to Cd, Hg accumulation in cereal-crop soils resulted in relatively weak but spatially broader potential ecological risk. Specifically, Hg accumulation did not cause a “high” potential ecological risk, whereas it was concentrated at “moderate” and “considerable” levels. These areas approximately accounted for 9.5% of the whole area (1947 km2), and they were primarily located in the eastern, northern, and western parts, respectively. Overall, cereal-crop soils with “moderate” and above comprehensive risk (RI ≥ 150) covered 517.79 km2, all of which clustered along the eastern border of our study area.
For the cash-crop soils, “moderate” and above risk levels triggered by Cd accumulation occurred in 2711 km2, approximately equal to 13.5% of the total area. Specifically, these areas can mainly be found in the eastern border and southeastern parts (Figure 6). Furthermore, the hotspots with “moderate” and above risk levels driven by Hg accumulation covered an area of 2191 km2 (equaling 10.78% of the total area), which were primarily scattered in the western regions and along the eastern border. On the whole, the regions that had comprehensive risk beyond the “moderate” level (RI ≥ 150) covered a total of 1804.67 km2. To a certain extent, these areas exhibited highly spatial consistencies with those triggered by Cd accumulation.

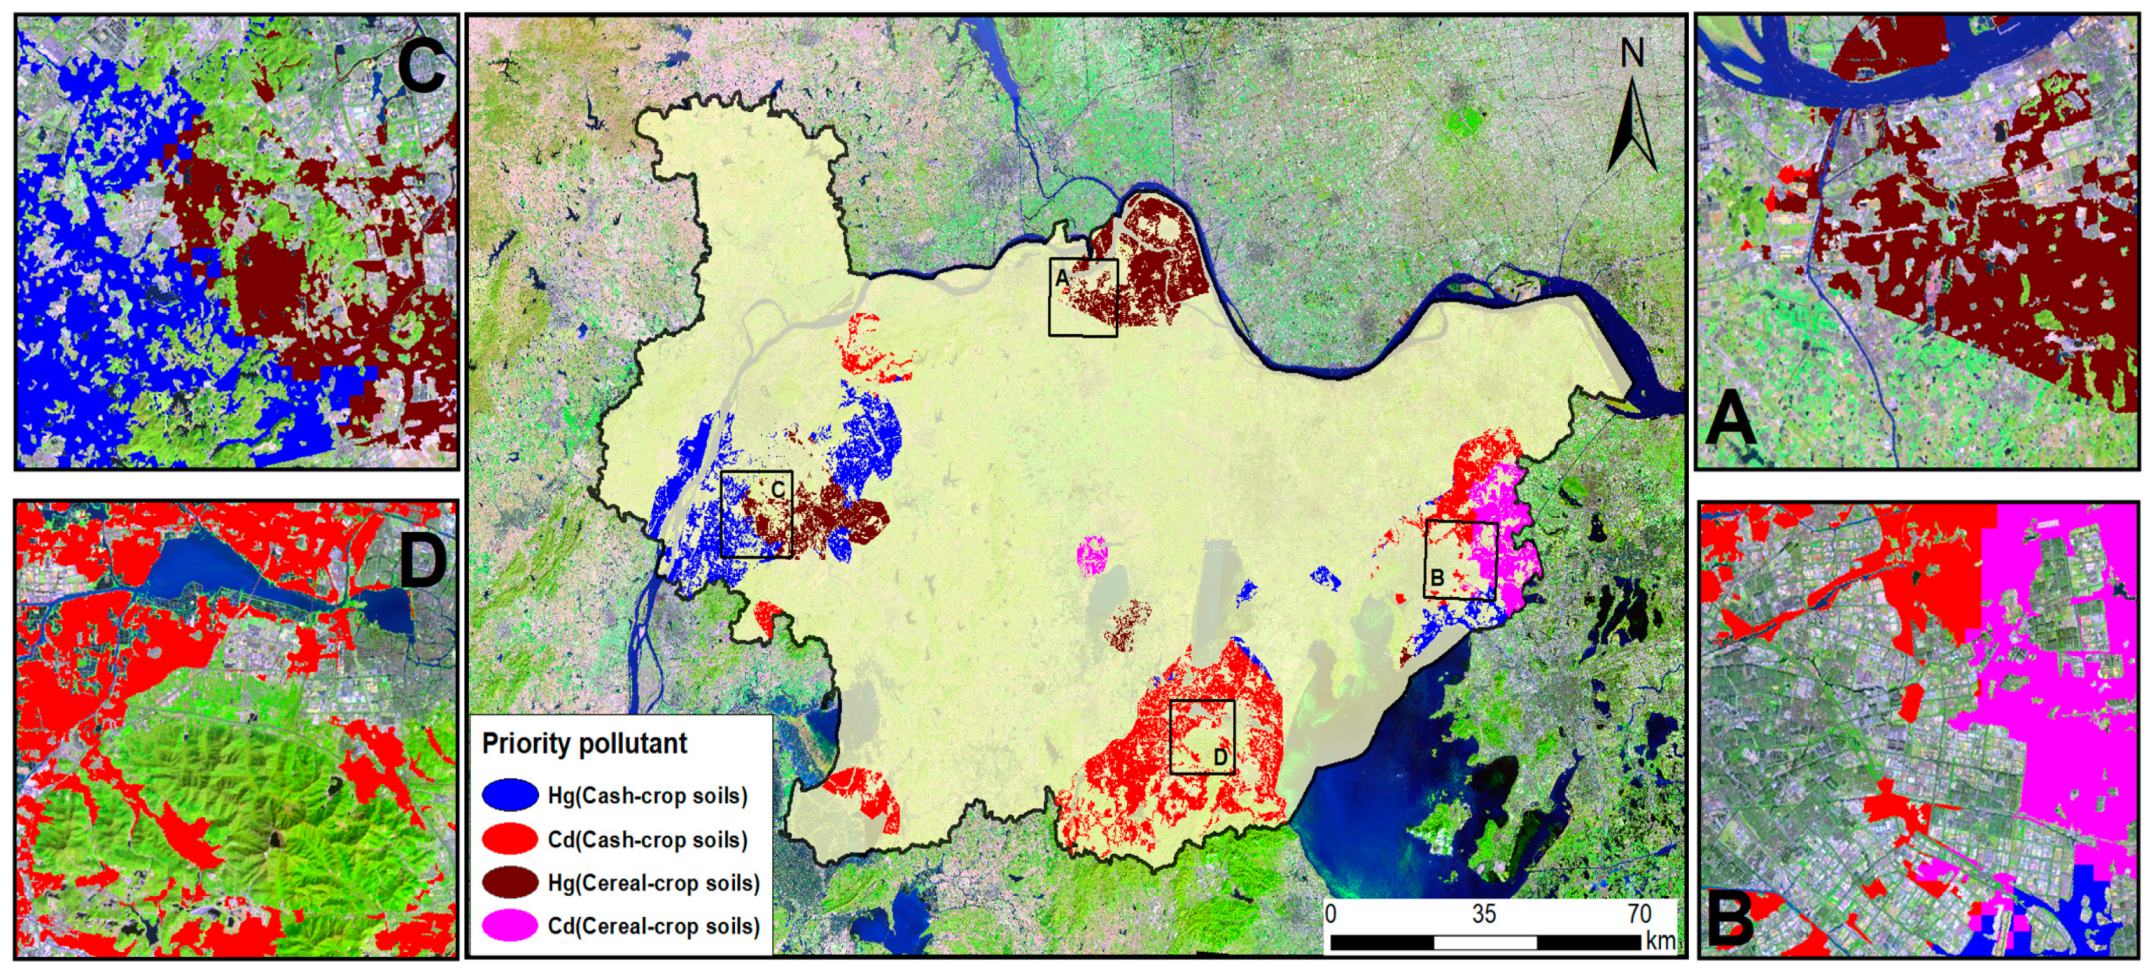
3.4. Targeted Zones and Priority Pollutants

Based on the potential ecological risk assessment, we designated the targeted zones and priority pollutants for different crop soils in our study area. In total, approximately 232,532 ha of agricultural land could be regarded as targeted zones, equaling 8.32% of the total area. Hg and Cd were identified as the two priority pollutants that future soil management practices should pay special attention to. In addition, we also found that agricultural plots in targeted zones exhibited relatively high land fragmentation. This phenomenon may be due, in part, to the diversified cultivation systems but also be triggered by the relatively small operation scale throughout our study area.
In general, the targeted zones and priority pollutants presented concentrated and mosaiced patterns. For the cereal-crop soils, targeted zones suffering from Hg and Cd accumulation accounted for 57,535 ha and 23,540 ha, respectively. Specifically, the Hg-targeted zones primarily clustered in the northern and western regions, while cereal-crops cultivation had led to excessive Cd accumulation in the eastern border (Figure 7).
In comparison with cereal-crop soils, Cd accumulation had resulted in broader and more serious potential ecological risk for cash-crop soils. Specifically, the Cd-targeted zones for cash-crop soils covered 93,656 ha, were clustered in the southeastern parts, and sporadically emerged in the southwestern and northern parts. Moreover, the targeted zones that Hg treatment in cash-crop soils should be listed as the prioritized goals accounted for about 57,800 ha, most of which were concentrated in the western parts while also being found in the eastern border (Figure 7).

3.5. Source Apportionment for Priority Pollutants

We conducted PMF modeling to further determine the sources and their contributions for priority pollutants in targeted zones. To avoid the impacts from spatial heterogeneity, only 229 samples for cereal-crop soils and 309 samples for cash-crop soils concentrated within or on the periphery of targeted zones were selected as input files for the PMF models. Through evaluating the minimal and stable Q values, we found that four distinct factors could be considered as the optimal numbers for both agricultural soils, during which most residuals ranged between −3 and 3. Meanwhile, the fitting coefficient values (R2) ranged from 0.99 to 0.82 for cereal-crop soil samples and from 0.98 to 0.79 for cash-crop soil samples, respectively. In summary, the modeling parameters suggested that our PMF models had relatively strong explanatory power and thus could be suitable for elucidating the potential information embedded within the initial samples.
The PMF modeling delineated that Cd accumulation received quite high loadings in factor 4 (88.67%) for cereal-crop soils and in factor 2 (100%) for cash-crop soils (Table 2). This result indicated that within the targeted zones, Cd accumulations in both agricultural soils were predominantly triggered by individual factors. In comparison with Cd accumulation, Hg accumulations originated from relatively complicated sources. For cash-crop soils, except for agricultural sources (F2), factor 4 exhibited a significant contribution to Hg and Pb accumulation, presenting loading values of 84.69% and 73.77%, respectively (Table 2). Differing from cash-crop soils, Hg accumulation in cereal-crop soils was determined by more diversified sources (Table 2). Specifically, multiple factors contributed in varying degrees to Hg accumulation in cereal-crop soils, suggesting a mixture of pollutant sources rather than a single predominant source.

4. Discussion

4.1. Source Identification and Major Influencing Factors

According to PMF modeling, Cd accumulation in both agricultural soil types was predominantly attributed to individual factors, with notably high factor loadings observed (88.67% for cereal-crop soils in factor 4 and 100% for cash-crop soils in factor 2). These results indicate that agricultural practices, especially intensive and prolonged use of agrochemicals, were primarily responsible for elevated Cd levels. Cadmium is commonly considered an indicator element reflecting agricultural input intensity and potential environmental implications, as excessive Cd accumulation often arises from long-term agrochemical application [57]. Previous studies have highlighted that Cd contamination has become a significant global issue linked to unsustainable agricultural intensification driven by rapid urbanization and industrialization. For example, since the late 1980s, average Cd concentrations in agricultural soils in China have increased by approximately 10–40% [46]. Recognized as one of China’s most economically advanced regions, Sunan has experienced substantial increases in agrochemical inputs (including pesticides, herbicides, and fungicides) for cash-crop cultivation, rising from 13,819 tons in 2001 to 26,863 tons in 2015, inevitably exacerbating Cd accumulation in agricultural soils.
Compared with cereal-crop soils, the contribution of agricultural sources to Cd accumulation was notably higher in cash-crop soils. In Sunan, cash-crops are commonly cultivated in small-scale family farms, characterized by short production cycles, intensive fertilization, and greater economic returns. Such intensive cultivation practices lead to substantial Cd residues, highlighting the significant role of profit-driven agricultural decisions in determining soil environmental quality [33,58]. Farmers and stakeholders typically prefer cultivating crops with higher economic profitability in response to changing comparative advantages driven by rapid socio-economic development, unintentionally intensifying the accumulation of pollutants, including Cd, in agricultural soils.
In contrast to Cd, Hg accumulation presented more complex source profiles, involving contributions from multiple anthropogenic activities. For cash-crop soils, besides agricultural inputs (factor 2), factor 4 substantially contributed to Hg and Pb accumulation (loading values of 84.69% and 73.77%, respectively), likely associated with transportation emissions and industrial activities. Previous studies have confirmed automobile exhaust and coal combustion as major global contributors to Pb emissions [59,60,61], and industrial coal combustion can similarly result in Hg accumulation in soils through atmospheric deposition and runoff [62,63]. Given Sunan’s advanced economy and extensive rural-industrial activities, including bio-pharmaceutical manufacturing, electronics production, textiles, apparel manufacturing, and dyeing industries, heavy metal emissions are inevitably substantial. The rapid industrial growth (with industrial enterprises increasing from 12,082 in 2001 to 24,851 in 2015) and the expansion of transportation networks (increasing approximately 2.5 times over the same period) have further amplified environmental burdens. Despite environmental regulations, coal combustion remains a dominant energy source, continuously contributing to Hg accumulation in local agricultural soils through emissions and solid waste discharge.
Hg accumulation in cereal-crop soils was influenced by more diversified sources compared with cash-crop soils. Existing studies have identified coal combustion (38%) and non-ferrous metal smelting (45%) as the major sources of Hg emissions in China, complemented by minor contributions from other miscellaneous sources such as soil parent materials [64]. Our findings were generally consistent with previous research, emphasizing the need for comprehensive and multifaceted governmental countermeasures to manage Hg pollution effectively in cereal-crop soils in Sunan.

4.2. Implications for Sustainable Soil Management and Policy Recommendations

Accompanying the accelerated social-economic development, intensive anthropogenic activities might impose more potential risks on agricultural soils, ultimately threatening food self-supply and environmental sustainability. Thus, our findings have important policy implications on avoiding continuous deterioration in Sunan. Due to the decreasing comparative advantages, cash-crops were more frequently cultivated in small-scale and fragmented plots. This agricultural mode may decrease agricultural efficiency, which in turn resulted in greater agrochemical application. Correspondingly, we suggest that large-scale corporate farms and agroholdings focusing on cultivating high-value crops should be established by land transfer and acquisition. Moreover, targeted economic incentives, such as subsidies or technical assistance, could be introduced to encourage farmers to reduce phosphate fertilizer use, effectively mitigating Cd accumulation. Concurrently, strengthened regulatory controls should be implemented on industries identified as major Hg emitters, thereby further reducing soil contamination. In parallel, given the serious threats from agricultural sources, some strategies, such as reducing fertilization frequency or decreasing the input share of inorganic fertilizers, might be beneficial to realize sustainable land-uses. However, these strategies should be attempted with caution because they might result in the excessive accumulation of some other HMs, such as Zn and Cu. To address this issue comprehensively, differentiated management strategies tailored to specific crop types should be adopted, taking into account both crop-specific nutrient demands and economic considerations. For instance, promoting low-input practices for cereal-crops and precision fertilization technologies for cash-crops can optimize resource use efficiency, thus securing farm income while safeguarding soil health. Ultimately, integrated management approaches tailored to local ecological conditions and farming systems are essential for achieving sustainable agricultural development in Sunan. Furthermore, it is crucial for effective soil management practices to consider the potential transfer of Cd and Hg to food crops, which can significantly impact local food security. This could pose serious public health risks, particularly in regions with high levels of heavy metal contamination. Therefore, implementing crop-specific practices that mitigate metal accumulation in edible parts is vital for safeguarding both soil health and food safety.

4.3. Limitations and Outlooks

Excessive HMs accumulation has been regarded as a major threat to agricultural soil health worldwide. Nevertheless, previous research on the negative effects of HMs accumulation often considered agricultural soils in given regions as spatially integrated bodies and did not distinguish the environmental outcomes arising from varying agricultural practices. In addition, past findings mainly concentrated at the regional level and thus failed to designate the priority pollutants for each agricultural plot. As such, these unclear knowledges might produce deviations for decision-makers to support effective and detailed mitigation strategies. In comparison with existing research, our major contributions can be summarized in two aspects. Firstly, we separately analyzed pollution features and potential ecological risks triggered in cash-crop soils and cereal-crop soils, and this allowed us to interpret the underlying impacts of varying agricultural practices on agricultural soils [65]. Moreover, we identified the priority pollutants at the patch level and shifted away from spatially rough assessments frequently adopted previously. Such spatially explicit identification allowed us to understand nuanced variations under different cultivation systems and paved the way for formulating targeted and fine-scale management practices.
Our study primarily concentrated on exploring spatial heterogeneity and source apportionment of soil HM contamination across different cultivation systems, and there might indeed exist some uncertainties that warrant increasing investigation in the future. Firstly, transport and accumulation for HMs may exhibit significant variability in different land-covers [66,67,68]. For instance, urbanized areas with a large body of impervious surfaces might accumulate more HMs in the topsoil than farming areas. In this research, although we have extracted agricultural plots from the mosaiced LULC maps, the smoothed extrapolation technique for spatial interpolation cannot absolutely reflect the mechanism of transport and diffusion between different land-covers. To some extent, this limitation might hinder the preservation of the highly variable nature and reduce the assessment accuracy [54]. Another important limitation of this study lies in the exclusive use of total heavy metal concentrations without considering their chemical speciation. Different valence states can lead to dramatically different environmental behaviors and toxicities. For instance, trivalent chromium (Cr+3) is an essential micronutrient for plants, whereas hexavalent chromium (Cr+6) is highly toxic and carcinogenic to both ecosystems and humans [28]. Relying solely on total concentrations may therefore misrepresent the actual ecological risk, especially for elements with multiple oxidation states. Furthermore, the mobility and bioavailability of heavy metals are not only element-specific but also vary with crop types and soil management practices. Certain crops, such as leafy vegetables or shallow-rooted plants, may promote higher metal uptake and translocation, increasing the likelihood of accumulation in edible parts [69]. Future research should thus incorporate chemical speciation analysis and crop-specific metal mobility to more accurately assess soil health risks and guide differentiated remediation strategies.

5. Conclusions

This study provides a detailed spatial assessment of heavy metal (HM) contamination and associated ecological risks within agricultural soils of China’s Sunan Economic Region, revealing significant environmental impacts driven by intensive anthropogenic activities. Our results identified approximately 232,532 hectares (8.32% of total agricultural land) as high-risk targeted zones, with cadmium (Cd) and mercury (Hg) being the primary pollutants. Specifically, Cd contamination exhibited a “moderate” to “very high” ecological risk across 13.5% of cash-crop soils and 4.05% of cereal-crop soils, particularly concentrated in the region’s eastern border. Hg contamination posed “moderate” to “considerable” risks across 10.78% of cash-crop soils and 9.5% of cereal-crop soils, with broader but spatially dispersed impacts. Advanced geostatistical and Positive Matrix Factorization (PMF) modeling demonstrated that Cd accumulation predominantly originated from intensive agrochemical applications, especially in cash-crop cultivation areas, whereas Hg contamination was linked to diverse anthropogenic sources, including industrial emissions, transportation, and coal combustion. Notably, PMF analyses revealed exceptionally high factor loadings for agricultural inputs related to Cd (88.67% in cereal-crop soils and 100% in cash-crop soils), emphasizing the critical role of farming practices in contaminant accumulation. Our research underscores the urgent need for targeted soil management strategies tailored to local practices, advocating for the expansion of large-scale, precision-based agricultural operations to reduce agrochemical inputs effectively. It also highlights the necessity of stronger regulatory measures targeting industrial and transportation emissions to mitigate Hg pollution. Future studies should further integrate chemical speciation and crop-specific metal mobility assessments to refine ecological risk evaluations. Overall, this work significantly advances our understanding of contamination sources and spatial distribution patterns, providing critical scientific guidance for effective soil remediation policies and sustainable agricultural development.

Supplementary Materials

The following supporting information can be downloaded at: https://www.mdpi.com/article/10.3390/land14051058/s1, Figure S1: Point samples for land-use classification (a) and the classified accuracy (b) (Abbreviation: ‘AL’ is agricultural land, ‘FO’ is forest, ‘GA’ is grassland, ‘WA’ is water, ‘BU’ is buil-up land, ‘OT’ is other land-use and ‘OA’ is the overall accuracy); Table S1: Theoretical semi-variogram models and related parameters of soil HMs concentrations; Figure S2: The spatial distribution of the heavy metal concentrations in cereal-crop soils in Sunan; Figure S3: The spatial distribution of the heavy metal concentrations in cash-crop soils in Sunan; Table S2: Theoretical semi-variogram models and related parameters of soil HMs pollution; Table S3: Theoretical semi-variogram models and related parameters of potential ecological risk.

Author Contributions

Conceptualization, D.H. and L.Y.; Methodology, D.H.; Software, H.X.; Resources, D.H. and L.Y.; Data Curation, D.H.; Writing—original draft preparation, D.H. and H.X.; Writing—review and editing, L.Y.; Visualization, D.H. and H.X.; Supervision, L.Y. All authors have read and agreed to the published version of the manuscript.

Funding

This work was financially supported by the National Natural Science Foundation of China (No. 42301316), Natural Science Foundation of Heilongjiang Province of China (Grant No. LH2024D002), Heilongjiang Province Provincial Undergraduate University “Excellent Young Teacher Basic Research Support Plan” (Grant No. YQJH2023214) and the Northeast Agricultural University “Young Talents” Program (Grant No. 22QC25).

Data Availability Statement

The date presented in this study are available on request form the corresponding author. The date is not publicly available due to the ongoing nature of the research.

Acknowledgments

We thank our colleagues for their insightful comments on an earlier version of this manuscript.

Conflicts of Interest

The authors declare no conflicts of interest.

References

  1. Seto, K.C.; Ramankutty, N. Hidden linkages between urbanization and food systems. Science 2016, 352, 943–945. [Google Scholar] [CrossRef] [PubMed]
  2. Tilman, D.; Balzer, C.; Hill, J.; Befort, B.L. Global food demand and the sustainable intensification of agriculture. Proc. Natl. Acad. Sci. USA 2011, 108, 20260–20264. [Google Scholar] [CrossRef] [PubMed]
  3. Hou, D.; O’Connor, D.; Igalavithana, A.D.; Alessi, D.S.; Luo, J.; Tsang, D.C.; Ok, Y.S. Metal contamination and bioremediation of agricultural soils for food safety and sustainability. Nat. Rev. Earth Environ. 2020, 1, 366–381. [Google Scholar] [CrossRef]
  4. Satterthwaite, D.; McGranahan, G.; Tacoli, C. Urbanization and its implications for food and farming. Philos. Trans. R. Soc. B Biol. Sci. 2010, 365, 2809–2820. [Google Scholar] [CrossRef]
  5. Dawson, J.C.; Huggins, D.R.; Jones, S.S. Characterizing nitrogen use efficiency in natural and agricultural ecosystems to improve the performance of cereal crops in low-input and organic agricultural systems. Field Crops Res. 2008, 107, 89–101. [Google Scholar] [CrossRef]
  6. Yun, S.W.; Son, J. Contamination and spatial distribution of metal(loid)s in the stream sediment near the greenhouse. Horticulturae 2024, 10, 312. [Google Scholar] [CrossRef]
  7. Alloway, B.J. Heavy Metals in Soils: Trace Metals and Metalloids in Soils and Their Bioavailability, 3rd ed.; Springer: Dordrecht, The Netherlands, 2013. [Google Scholar]
  8. Jiang, Y.; Chao, S.; Liu, J.; Yang, Y.; Chen, Y.; Zhang, A.; Cao, H. Source apportionment and health risk assessment of heavy metals in soil for a township in Jiangsu Province, China. Chemosphere 2017, 168, 1658–1668. [Google Scholar] [CrossRef]
  9. Oves, M.; Khan, M.S.; Zaidi, A.; Ahmad, E. Soil Contamination, Nutritive Value, and Human Health Risk Assessment of Heavy Metals: An Overview; Springer: Vienna, Austria, 2012. [Google Scholar]
  10. Chileshe, M.N.; Syampungani, S.; Festin, E.S.; Tigabu, M.; Daneshvar, A.; Odén, P.C. Physico-chemical characteristics and heavy metal concentrations of copper mine wastes in Zambia: Implications for pollution risk and restoration. J. For. Res. 2020, 31, 1283–1293. [Google Scholar] [CrossRef]
  11. Yang, B.; He, F.; Zhao, X.; Wang, H.; Xu, X.; He, X.; Zhu, Y. Composition and function of soil fungal community during the establishment of Quercus acutissima (Carruth.) seedlings in a Cd-contaminated soil. J. Environ. Manag. 2019, 246, 150–156. [Google Scholar] [CrossRef]
  12. Zhang, J.; Liu, Y.; Hong, S.; Wen, M.; Zheng, C.; Liu, P. Speciation analysis and pollution assessment of heavy metals in farmland soil of a typical mining area: A case study of Dachang tin polymetallic ore, Guangxi. Appl. Sci. 2023, 13, 708. [Google Scholar] [CrossRef]
  13. Yang, X.; Yun, P.; Zhao, X.; Zhang, Z.; Chen, C.; Zhou, Y.; Shabala, S. Assessing impact of elevated CO2 on heavy metal accumulation in crops: Meta-analysis and implications for food security. Sci. Total Environ. 2024, 952, 175949. [Google Scholar] [CrossRef] [PubMed]
  14. Radfard, M.; Hashemi, H.; Baghapour, M.A.; Samaei, M.R.; Yunesian, M.; Soleimani, H.; Azhdarpoor, A. Prediction of human health risk and disability-adjusted life years induced by heavy metals exposure through drinking water in Fars Province, Iran. Sci. Rep. 2023, 13, 19080. [Google Scholar] [CrossRef] [PubMed]
  15. Bach, E.M.; Ramirez, K.S.; Fraser, T.D.; Wall, D.H. Soil biodiversity integrates solutions for a sustainable future. Sustainability 2020, 12, 2662. [Google Scholar] [CrossRef]
  16. Dharma-Wardana, M.W.C. Fertilizer usage and cadmium in soils, crops and food. Environ. Geochem. Health 2018, 40, 2739–2759. [Google Scholar] [CrossRef]
  17. Carnelo, L.G.L.; de Miguez, S.R.; Marbán, L. Heavy metals input with phosphate fertilizers used in Argentina. Sci. Total Environ. 1997, 204, 245–250. [Google Scholar] [CrossRef]
  18. Flores-Magdaleno, H.; Mancilla-Villa, O.R.; Mejía-Saenz, E.; Olmedo-Bolaños, M.D.C.; Bautista-Olivas, A.L. Heavy metals in agricultural soils and irrigation wastewater of Mixquiahuala, Hidalgo, Mexico. Afr. J. Agric. Res. 2011, 6, 5505–5511. [Google Scholar] [CrossRef]
  19. Mungai, T.M.; Owino, A.A.; Makokha, V.A.; Gao, Y.; Yan, X.; Wang, J. Occurrences and toxicological risk assessment of eight heavy metals in agricultural soils from Kenya, Eastern Africa. Environ. Sci. Pollut. Res. 2016, 23, 18533–18541. [Google Scholar] [CrossRef]
  20. Li, C.; Sun, G.; Wu, Z.; Zhong, H.; Wang, R.; Liu, X.; Cheng, J. Soil physiochemical properties and landscape patterns control trace metal contamination at the urban–rural interface in southern China. Environ. Pollut. 2019, 250, 537–545. [Google Scholar] [CrossRef]
  21. Yuswir, N.S.; Praveena, S.M.; Aris, A.Z.; Syed Ismail, S.N.; De Burbure, C.; Hashim, Z. Heavy metal contamination in urban surface soil of Klang district (Malaysia). Soil Sediment Contam. 2015, 24, 865–881. [Google Scholar] [CrossRef]
  22. Sun, L.; Guo, D.; Liu, K.; Meng, H.; Zheng, Y.; Yuan, F.; Zhu, G. Levels, sources, and spatial distribution of heavy metals in soils from a typical coal industrial city of Tangshan, China. Catena 2019, 175, 101–109. [Google Scholar] [CrossRef]
  23. Baltas, H.; Sirin, M.; Gökbayrak, E.; Ozcelik, A.E. A case study on pollution and a human health risk assessment of heavy metals in agricultural soils around Sinop Province, Turkey. Chemosphere 2020, 241, 125015. [Google Scholar] [CrossRef] [PubMed]
  24. Kelepertzis, E. Accumulation of heavy metals in agricultural soils of Mediterranean: Insights from Argolida Basin, Peloponnese, Greece. Geoderma 2014, 221, 82–90. [Google Scholar] [CrossRef]
  25. Liu, Y.; Xiao, T.; Ning, Z.; Li, H.; Tang, J.; Zhou, G. High cadmium concentration in soil in the Three Gorges region: Geogenic source and potential bioavailability. Appl. Geochem. 2013, 37, 149–156. [Google Scholar] [CrossRef]
  26. Gredilla, A.; de Vallejuelo, S.F.O.; Rodriguez-Iruretagoiena, A.; Gomez, L.; Oliveira, M.L.; Arana, G.; Silva, L.F. Evidence of mercury sequestration by carbon nanotubes and nanominerals present in agricultural soils from a coal-fired power plant exhaust. J. Hazard. Mater. 2019, 378, 120747. [Google Scholar] [CrossRef]
  27. Liu, Z.; Bai, Y.; Gao, J.; Li, J. Driving factors on accumulation of cadmium, lead, copper, and zinc in agricultural soil and products of the North China Plain. Sci. Rep. 2023, 13, 7429. [Google Scholar] [CrossRef]
  28. Rai, P.K.; Lee, S.S.; Zhang, M.; Tsang, Y.F.; Kim, K.H. Heavy metals in food crops: Health risks, fate, mechanisms, and management. Environ. Int. 2019, 125, 365–385. [Google Scholar] [CrossRef] [PubMed]
  29. Qin, G.; Niu, Z.; Yu, J.; Li, Z.; Ma, J.; Xiang, P. Soil heavy metal pollution and food safety in China: Effects, sources, and removing technology. Chemosphere 2021, 267, 129205. [Google Scholar] [CrossRef] [PubMed]
  30. Ministry of Environmental Protection of the People’s Republic of China (MEPPRC); Ministry of Land and Resources of the People’s Republic of China (MLRPRC). Bulletin on National Survey of Soil Contamination; MEPPRC and MLRPRC: Beijing, China, 2014. (In Chinese) [Google Scholar]
  31. Qi, C.; Xu, M.; Liu, J.; Li, C.; Yang, B.; Jin, Z.; Guo, B. Source analysis and contribution estimation of heavy metal contamination in agricultural soils in an industrial town in the Yangtze River Delta, China. Minerals 2024, 14, 279. [Google Scholar] [CrossRef]
  32. Hu, B.; Jia, X.; Hu, J.; Xu, D.; Xia, F.; Li, Y. Assessment of heavy metal pollution and health risks in the soil–plant–human system in the Yangtze River Delta, China. Int. J. Environ. Res. Public Health 2017, 14, 1042. [Google Scholar] [CrossRef]
  33. Hou, D.; Meng, F.; Prishchepov, A.V. How is urbanization shaping agricultural land-use? Unraveling the nexus between farmland abandonment and urbanization in China. Landsc. Urban Plan. 2021, 214, 104170. [Google Scholar] [CrossRef]
  34. Chen, L.; Song, G.; Meadows, M.E.; Zou, C. Spatio-temporal evolution of the early-warning status of cultivated land and its driving factors: A case study of Heilongjiang Province, China. Land Use Policy 2018, 72, 280–292. [Google Scholar] [CrossRef]
  35. Hou, D.; Meng, F.; Ji, C.; Xie, L.; Zhu, W.; Wang, S.; Sun, H. Linking food production and environmental outcomes: An application of a modified relative risk model to prioritize land-management practices. Agric. Syst. 2022, 196, 103342. [Google Scholar] [CrossRef]
  36. Tian, K.; Hu, W.; Xing, Z.; Huang, B.; Jia, M.; Wan, M. Determination and evaluation of heavy metals in soils under two different greenhouse vegetable production systems in eastern China. Chemosphere 2016, 165, 555–563. [Google Scholar] [CrossRef]
  37. Wang, Y.; Guo, G.; Zhang, D.; Lei, M. An integrated method for source apportionment of heavy metal(loid)s in agricultural soils and model uncertainty analysis. Environ. Pollut. 2021, 276, 116666. [Google Scholar] [CrossRef]
  38. Huang, S.S.; Liao, Q.L.; Hua, M.; Wu, X.M.; Bi, K.S.; Yan, C.Y.; Zhang, X.Y. Survey of heavy metal pollution and assessment of agricultural soil in Yangzhong District, Jiangsu Province, China. Chemosphere 2007, 67, 2148–2155. [Google Scholar] [CrossRef]
  39. Foti, L.; Dubs, F.; Gignoux, J.; Lata, J.C.; Lerch, T.Z.; Mathieu, J.; Barot, S. Trace element concentrations along a gradient of urban pressure in forest and lawn soils of the Paris region (France). Sci. Total Environ. 2017, 598, 938–948. [Google Scholar] [CrossRef]
  40. Shaheen, S.M.; Antoniadis, V.; Kwon, E.; Song, H.; Wang, S.L.; Hseu, Z.Y.; Rinklebe, J. Soil contamination by potentially toxic elements and the associated human health risk in geo- and anthropogenic contaminated soils: A case study from the temperate region (Germany) and the arid region (Egypt). Environ. Pollut. 2020, 262, 114312. [Google Scholar] [CrossRef]
  41. Wang, Y.; Duan, X.; Wang, L. Spatial distribution and source analysis of heavy metals in soils influenced by industrial enterprise distribution: A case study in Jiangsu Province. Sci. Total Environ. 2020, 710, 134953. [Google Scholar] [CrossRef] [PubMed]
  42. Jiang, H.H.; Cai, L.M.; Wen, H.H.; Hu, G.C.; Chen, L.G.; Luo, J. An integrated approach to quantifying ecological and human health risks from different sources of soil heavy metals. Sci. Total Environ. 2020, 701, 134466. [Google Scholar] [CrossRef]
  43. Yang, Z.; Yuan, L.; Xie, Z.; Wang, J.; Li, Z.; Tu, L.; Sun, L. Historical records and contamination assessment of potential toxic elements (PTEs) over the past 100 years in Ny-Ålesund, Svalbard. Environ. Pollut. 2020, 266, 115205. [Google Scholar] [CrossRef]
  44. Hakanson, L. An ecological risk index for aquatic pollution control: A sedimentological approach. Water Res. 1980, 14, 975–1001. [Google Scholar] [CrossRef]
  45. Zhao, J.; Wu, E.; Zhang, B.; Bai, X.; Lei, P.; Qiao, X.; Gao, Y. Pollution characteristics and ecological risks associated with heavy metals in the Fuyang River system in North China. Environ. Pollut. 2021, 281, 116994. [Google Scholar] [CrossRef]
  46. Wang, P.; Chen, H.; Kopittke, P.M.; Zhao, F.J. Cadmium contamination in agricultural soils of China and the impact on food safety. Environ. Pollut. 2019, 249, 1038–1048. [Google Scholar] [CrossRef] [PubMed]
  47. Lv, J. Multivariate receptor models and robust geostatistics to estimate source apportionment of heavy metals in soils. Environ. Pollut. 2019, 244, 72–83. [Google Scholar] [CrossRef]
  48. Vaccaro, S.; Sobiecka, E.; Contini, S.; Locoro, G.; Free, G.; Gawlik, B.M. The application of positive matrix factorization in the analysis, characterisation and detection of contaminated soils. Chemosphere 2007, 69, 1055–1063. [Google Scholar] [CrossRef]
  49. Paatero, P. Least squares formulation of robust non-negative factor analysis. Chemom. Intell. Lab. Syst. 1997, 37, 23–35. [Google Scholar] [CrossRef]
  50. Lee, E.; Chan, C.K.; Paatero, P. Application of positive matrix factorization in source apportionment of particulate pollutants in Hong Kong. Atmos. Environ. 1999, 33, 3201–3212. [Google Scholar] [CrossRef]
  51. Paatero, P.; Tapper, U. Positive matrix factorization: A non-negative factor model with optimal utilization of error estimates of data values. Environmetrics 1994, 5, 111–126. [Google Scholar] [CrossRef]
  52. Zhang, P.; Qin, C.; Hong, X.; Kang, G.; Qin, M.; Yang, D.; Dick, R.P. Risk assessment and source analysis of soil heavy metal pollution from lower reaches of Yellow River irrigation in China. Sci. Total Environ. 2018, 633, 1136–1147. [Google Scholar] [CrossRef]
  53. Tavares, M.T.; Sousa, A.J.; Abreu, M.M. Ordinary kriging and indicator kriging in the cartography of trace elements contamination in São Domingos mining site (Alentejo, Portugal). J. Geochem. Explor. 2008, 98, 43–56. [Google Scholar] [CrossRef]
  54. Goovaerts, P. Geostatistics for Natural Resources Evaluation; Oxford University Press: New York, NY, USA, 1997. [Google Scholar]
  55. Webster, R.; Oliver, M.A. Geostatistics for Environmental Scientists, 2nd ed.; John Wiley & Sons: Chichester, UK, 2007. [Google Scholar]
  56. Zhao, K.; Zhang, L.; Dong, J.; Wu, J.; Ye, Z.; Zhao, W.; Fu, W. Risk assessment, spatial patterns and source apportionment of soil heavy metals in a typical Chinese hickory plantation region of southeastern China. Geoderma 2020, 360, 114011. [Google Scholar] [CrossRef]
  57. Nicholson, F.A.; Smith, S.R.; Alloway, B.J.; Carlton-Smith, C.; Chambers, B.J. An inventory of heavy metals inputs to agricultural soils in England and Wales. Sci. Total Environ. 2003, 311, 205–219. [Google Scholar] [CrossRef]
  58. Gellrich, M.; Baur, P.; Koch, B.; Zimmermann, N.E. Agricultural land abandonment and natural forest re-growth in the Swiss mountains: A spatially explicit economic analysis. Agric. Ecosyst. Environ. 2007, 118, 1–4. [Google Scholar] [CrossRef]
  59. Demir, T.; Karakaş, D.; Yenisoy-Karakaş, S. Source identification of exhaust and non-exhaust traffic emissions through the elemental carbon fractions and positive matrix factorization method. Environ. Res. 2022, 204, 112399. [Google Scholar] [CrossRef] [PubMed]
  60. Juda-Rezler, K.; Reizer, M.; Maciejewska, K.; Błaszczak, B.; Klejnowski, K. Characterization of atmospheric PM2.5 sources at a Central European urban background site. Sci. Total Environ. 2020, 713, 136729. [Google Scholar] [CrossRef] [PubMed]
  61. Nawrot, N.; Wojciechowska, E.; Rezania, S.; Walkusz-Miotk, J.; Pazdro, K. The effects of urban vehicle traffic on heavy metal contamination in road sweeping waste and bottom sediments of retention tanks. Sci. Total Environ. 2020, 749, 141511. [Google Scholar] [CrossRef]
  62. Liang, J.; Feng, C.; Zeng, G.; Zhong, M.; Gao, X.; Li, X.; Mo, D. Atmospheric deposition of mercury and cadmium impacts on topsoil in a typical coal mine city, Lianyuan, China. Chemosphere 2017, 189, 198–205. [Google Scholar] [CrossRef]
  63. Xiao, R.; Guo, D.; Ali, A.; Mi, S.; Liu, T.; Ren, C.; Zhang, Z. Accumulation, ecological-health risks assessment, and source apportionment of heavy metals in paddy soils: A case study in Hanzhong, Shaanxi, China. Environ. Pollut. 2019, 248, 349–357. [Google Scholar] [CrossRef]
  64. Streets, D.G.; Hao, J.; Wu, Y.; Jiang, J.; Chan, M.; Tian, H.; Feng, X. Anthropogenic mercury emissions in China. Atmos. Environ. 2005, 39, 7789–7806. [Google Scholar] [CrossRef]
  65. Wang, Z.X.; Yu, Y.J.; Ye, T.T.; Fei, J.C.; Song, X.Y.; Peng, J.W.; Wu, H.H. Distribution characteristics and environmental risk assessment following metal(loid)s pollution incidents at Southwest China mining site. Trans. Nonferrous Met. Soc. China 2022, 32, 4062–4075. [Google Scholar] [CrossRef]
  66. Ayoubi, S.; Jabbari, M.; Khademi, H. Multiple linear modeling between soil properties, magnetic susceptibility and heavy metals in various land uses. Model. Earth Syst. Environ. 2018, 4, 579–589. [Google Scholar] [CrossRef]
  67. Islam, M.S.; Ahmed, M.K.; Al-Mamun, M.H.; Islam, S.M.A. Sources and ecological risks of heavy metals in soils under different land uses in Bangladesh. Pedosphere 2019, 29, 665–675. [Google Scholar] [CrossRef]
  68. Solgi, E.; Oshvandi, Z. Spatial patterns, hotspot, and risk assessment of heavy metals in different land uses of urban soils (case study: Malayer city). Hum. Ecol. Risk Assess. 2018, 24, 256–270. [Google Scholar] [CrossRef]
  69. Xu, D.; Shen, Z.; Dou, C.; Dou, Z.; Li, Y.; Gao, Y.; Sun, Q. Effects of soil properties on heavy metal bioavailability and accumulation in crop grains under different farmland use patterns. Sci. Rep. 2022, 12, 9211. [Google Scholar] [CrossRef] [PubMed]
Figure 1. The location of our study area (a), land use/cover map (b), soil types map (c) and sampling sites (d).
Land 14 01058 g001
Figure 2. The proportion of soil samples for different pollution levels (%).
Land 14 01058 g002
Figure 3. The kriging-interpolated maps of the heavy metal pollution for cereal-crop soils.
Land 14 01058 g003
Figure 4. The kriging-interpolated maps of the heavy metal pollution for cash-crop soils.
Land 14 01058 g004
Figure 5. The maps of interpolated potential ecological risk for Cd and Hg and comprehensive potential ecological risk for cereal-crop soils.
Land 14 01058 g005
Figure 6. The maps of interpolated potential ecological risk for Cd and Hg and comprehensive potential ecological risk for cash-crop soils.
Land 14 01058 g006
Figure 7. Targeted zones and priority pollutants for agricultural soil treatment in our study area.
Land 14 01058 g007
Table 1. Statistical summary of HM concentrations in soil samples.
Cereal-Crop SoilsCash-Crop Soils
CrAsHgCdPbCrAsHgCdPb
Maximum (mg/kg)128.0438.60.1611.589.27144.0021.100.202.3870.67
Minimum (mg/kg)10.000.130.010.010.327.243.250.010.012.40
Mean (mg/kg)64.648.670.020.2020.8970.508.900.020.0821.55
Median (mg/kg)67.408.640.010.0220.0071.648.610.020.0520.33
Standard deviation19.842.710.020.178.7517.622.320.030.077.96
Coefficient of variation (%)30.7031.3094.7085.6041.9024.9926.07100.0987.8436.95
Skewness−0.422.203.656.962.92−0.280.883.747.981.46
Kurtosis0.2319.7317.4447.5314.932.211.8016.7964.255.16
Note: Background value of Jiangsu province (mg/kg): Hg = 0.025, As = 9.4, Cr = 75.6, Cd = 0.085, and Pb = 22.
Table 2. Source factors’ percentage contribution (%) for HMs accumulation derived from PMF.
Heavy MetalsCereal-Crop SoilsCash-Crop Soils
F1F2F3F4F1F2F3F4
Cr12.3625.8958.323.4367.702.280.0230.00
Pb48.9930.6918.591.720.004.3121.9273.77
Cd1.445.414.4888.670.00100.000.000.00
As1.1064.0534.860.0036.484.1459.250.12
Hg26.7112.7137.6122.9812.303.000.0084.69
Total18.1227.7530.7723.3623.3022.7516.2437.72
Disclaimer/Publisher’s Note: The statements, opinions and data contained in all publications are solely those of the individual author(s) and contributor(s) and not of MDPI and/or the editor(s). MDPI and/or the editor(s) disclaim responsibility for any injury to people or property resulting from any ideas, methods, instructions or products referred to in the content.

