Article

The Use of Public Spaces in Traditional Residential Areas After Tourism-Oriented Renovation: A Case Study of Liu Xing Street in Yining, China

1
Edinburgh School of Architecture and Landscape Architecture, University of Edinburgh, Edinburgh EH3 9DF, UK
2
Department of Landscape Architecture, Estonian University of Life Science, 51006 Tartu, Estonia
*
Author to whom correspondence should be addressed.
Land 2025, 14(5), 1041; https://doi.org/10.3390/land14051041 (registering DOI)
Submission received: 16 March 2025 / Revised: 5 May 2025 / Accepted: 5 May 2025 / Published: 10 May 2025

Abstract

:
Public spaces in historical and cultural cities not only provide places for social interaction in people’s daily lives but also help visitors engage with local history and culture. Although extensive research has been conducted on the use of public spaces, little has been conducted on cities in developing countries, such as cities in Xinjiang, China. Therefore, this research selected a public space in a traditional Uyghur residential area in Yining, which is located in the northwest of Xinjiang, to investigate the current usage of public space in the context of the growing tourism industry. We employed behaviour mapping as the primary method for data collection and analysed it using ArcGIS. A total of 3052 data points were collected over a five-day observation period. We found that while a wide range of activities were observed at the study site, only a few took place with high frequency. The influence of the facilities at the study site on users’ behaviour is significant. In terms of spatial distribution, the number and diversity of activities also show a concentrated distribution in a certain sub-area. Therefore, the conclusions suggest that it is important to conduct post-use evaluations to investigate the attitudes and perceptions of local residents.

1. Introduction

Since an increasing number of cities have become destinations for tourists, especially those with historical and cultural features, integrating tourism into their development has become a trend. Although the impacts of overtourism on destinations have already been discussed in many studies [1,2,3], there are still issues regarding the use of public spaces in many destinations. Yining is one of the historical and cultural cities in China, integrating tourism into its development. The traditional residential areas in Yining have become the targets of renovation. While the quality of public spaces in these renovated areas has improved and attracted more users, it is becoming difficult to determine whether these places serve local residents or tourists [4]. As the number of tourists continues to rise, it is inevitable that public spaces will be under growing pressure, leading to potential conflicts between local residents and tourists [5]. Considering the economic benefits and appeal to tourists, the development of commercial zones is often given priority, while the spaces for nearby residents’ daily activities may decrease or even be occupied [6]. As a result, not only have the attitudes and satisfactions of local residents towards the public spaces in these areas changed, but tourists’ experiences might also be less than satisfactory. Due to the different situations in each place, it is necessary to understand the actual usage status in the local areas so that effective improvements can be made. Therefore, this paper attempts to take a traditional residential area in one of the representative cities in northern Xinjiang, China, as a case study to investigate the current usage of its public spaces. The analysis and discussion of this study mainly focus on the three aspects: (1) the primary activities on the study site undertaken by users; (2) the main factors influencing the use of public spaces in such a traditional residential area; and (3) the possible issues associated with renovating public spaces in such a traditional residential area.

2. Literature Review

2.1. Urban Public Spaces and Users

Urban public spaces are places where people can often gather and carry out various activities, to relax and enjoy urban life [7,8,9]. Parks, squares, and streets are the most common types of public spaces, which provide opportunities for people who live and work in the area to interact with each other [10,11]. In urban areas, public spaces are vital components of residential neighbourhoods, serving as important connections for residents in different districts [12]. In other words, public spaces serve as places for people to foster community and belonging, allowing them to learn about local social lives and create shared memories [13,14]. The significance of public space can be reflected in its impact on the lives of individuals, communities and cities [14,15]. The importance of public space has become increasingly prominent with the development of cities and towns, especially in contemporary urban life.
It is undeniable that the physical condition of public spaces has a large impact on how users behave in the space. It is, therefore, the exploration of the physical characteristics of public spaces that has become the main focus of relevant research [16,17,18,19,20]. When people live in a place for a long time, they are likely to have an emotional bond with the local environment [21]. Public spaces are places for daily activities and have a significant influence on individuals’ lives. Studies have explored the impact of different attributes of public spaces on individuals as well as individuals’ preferences for specific public space characteristics [22,23]. In addition, there are many studies on the users’ needs in public spaces, which primarily explore the differences in the use of public space by users from different social backgrounds [24,25]. These studies primarily analyse the correlation between users’ characteristics and the use of public space to distinguish the possible differences when they are using public space. The majority of these studies pointed out in their conclusion that meeting the needs of users is vital to improving the use of public space and highlighted that public space should match the needs of users [18,26,27].
Public spaces in historical and cultural cities are slightly different from regular cities, especially in cities like Yining, which is located in a multi-ethnic region. The difference lies not only in its characteristics but also in its ability to promote social interaction among different ethnic groups [5]. One of the main impacts of overtourism on public spaces is that it may lead to these public spaces becoming places serving tourists rather than local residents [28]. Therefore, studies indicate that it is important to understand local residents’ attitudes and their needs towards public spaces in these areas [29,30].
The needs of people for public spaces can be summarised as follows: comfort and relaxation, safety and security, accessibility, belonging to space and self-realisation, social interaction, discovery and learning [31,32]. Putting aside the basic functions provided by the public space itself, exploring the real demands of urban residents in their daily life and then integrating the satisfaction of these demands into the improvement of the public space would be more conducive to maximising the role of public space in cities [26]. Therefore, this study aims to take Liu Xing Street in Yining as a case study to investigate the issues that might exist in the use of its public spaces.

2.2. Impacts of Tourism on Urban Public Spaces

With the growth of tourism, cities have become tourist destinations, especially historical and cultural cities, because of their unique characteristics, cultural offerings, and liveable atmospheres [5,33]. Integrating tourism into the development of historical and cultural cities and adding tourism functions in public spaces to attract visitors are quite common in many places [1]. As a result, public spaces in these cities need to serve both local residents and the increasing number of tourists.
Since the 1980s, there has been a shift towards the development of modern cities in China [34]. However, after decades of rapid development, the issues in the urbanisation process have become increasingly apparent. The most obvious one is the homogenisation of cities, which has led to the loss of local characteristics [34,35]. In addition, the rise of tourism has promoted the renovation of cultural and historical cities because their unique characteristics offer more value for tourists [36]. However, the development of these historical and cultural cities has also encountered challenges to varying degrees, such as the disconnection between new urban areas and older areas [37]. As one of the National Famous Historical and Cultural Cities, Yining’s traditional residential areas have also become primary targets for renovation, integrating the development of the area with tourism to attract more tourists [38]. While tourism offers numerous advantages for urban development, its negative impacts on the daily lives of local residents are becoming increasingly evident with continuous growth. At present, many studies on public spaces in Yining mainly focus on design strategies and the improvement of basic infrastructures, while few of them focus on the negative impacts caused by tourism [38,39,40,41,42,43,44].
The discussion about the negative impacts of tourism on destinations is not new. Studies have investigated the attitudes and perceptions of local residents towards tourists, as well as the conflicts caused by overtourism [1,2,3,45]. For local residents, what they face is not merely face-to-face communication with tourists but also how to share public spaces [2]. Jaime et al. [3] pointed out that the integration of tourism into historical urban areas would inevitably increase the pressure on their public spaces. This is because more shopping areas, restaurants, coffee shops, hotels and other tourism-oriented leisure businesses would be added to cater to tourists’ needs. Although urban planners and designers may divide public spaces into various zones based on different functions, the invisible division cannot effectively solve the overlapping use between residents and tourists in real life [2]. Ultimately, the serious consequence is that residents living in these historical and cultural blocks may choose to leave because of the decline in their quality of life [3].

3. Methodology

3.1. Overall Background

Xinjiang is located in western China, at the centre of the Eurasian continent and on the ancient Silk Road [46]. There are as many as 56 ethnic groups in Xinjiang, with 13 main ethnic groups, such as Han, Uyghur, Kazakh, and Hui. The Uyghur ethnic group occupies a relatively large proportion compared to the others [47]. Xinjiang not only has many ethnic groups but has also been influenced by various historical cultures and religions, which have coexisted since ancient times [48]. Due to the influence of various cultures and religions as well as local environmental conditions, cities and towns in Xinjiang display a unique style that is distinct from other regions in China. Southern Xinjiang is characterised by many desert areas, while the northern region features extensive grasslands and mountainous forested areas. The architecture and landscape in Xinjiang showcase various styles due to different influences. For instance, in southern Xinjiang, the architecture is primarily influenced by Islamic styles, while northern regions reflect a combination of Central Plain and Russian architectural styles [49,50,51].
Yining is a city in Ili Kazakh Autonomous Prefecture, located northwest of Xinjiang. It has sufficient annual precipitation and four distinct seasons. Ili has experienced many significant events throughout its history, including the introduction of Russian culture in the mid-19th century, which had a profound impact on the traditional Uyghur dwellings, many of which still exist today [51,52]. The representative traditional Uyghur houses in Yining are characterised by white walls and blue windows and are usually decorated with plants and geometric patterns. Front courtyards filled with flowers are a common feature of traditional Uyghur houses. Therefore, the traditional Uyghur houses in Yining are also known as “Garden-style Houses” [42]. The houses are mostly one or two stories high. In 2012, Yining was formally recognised as a National Famous Historical and Cultural City by the State Council [40].
There are four main traditional Uyghur dwelling areas in Yining, with Liu Xing Street being one of them. Here, one can still see Russian churches and graves that have been preserved. Since Yining was recognised as a National Famous Historical and Cultural City, and Liu Xing Street was included in the historical and cultural district, it has been committed to the integrated development of culture and tourism [41,43]. For the location of the study site, please see Figure 1.

3.2. Study Site

This study selected Liu Xing Street as a case study, which is located in the northwest of Yining, and covers a total area of approximately 47 hectares [42,43,53]. The primary focus of this study is the central area of Liu Xing Street, an area of approximately 2.6 hectares. The construction of Liu Xing Street was started in 1934, aiming to address the living needs of factory workers in this area [42,53]. There are various explanations for the origin of its name and design, one of which is that the German engineer who designed this area followed the six major policies of the time [44]. It is necessary to explain that the word “Street” in the name of “Liu Xing Street” does not explicitly refer to a street but the name of the entire Uyghur traditional dwelling area selected in this research.
The overall layout of Liu Xing Street is hexagonal, and divides three main streets into six sections, namely Gong Ren Street, Li Guang Street and Sai Yi La Mu Street (see Figure 2). The centre area of Liu Xing Street was designed as the main public space, including stores, surrounded by residential houses. Since 2009, Liu Xing Street has been regarded as a key project for protective renovation due to its remaining traditional houses and historical sites, and the first phase of renovation was completed by 2014 [42,43,53,54]. Meanwhile, Liu Xing Street was included in the historical and cultural district in 2010 [41]. In 2022, Liu Xing Street of Yining was also rated as a national tourism and leisure area [38,53].
The renovation primarily focused on repairing historical buildings and improving road traffic, green spaces, and public infrastructure [42]. As a tourist attraction, Liu Xing Street has been improved to include more functions than before. For instance, tourist reception areas and parking spaces were added in the southeast of Liu Xing Street. Furthermore, three main streets have become the primary shopping areas, lined with coffee shops, restaurants, and street vendors. In addition, some of the traditional residential houses have been encouraged to transform into homestays for tourists.
The transformation of Liu Xing Street from a residential area to a tourist attraction has caused its public spaces to take on additional functions related to tourism so as to attract more visitors. However, the reality is that the public spaces in this area are limited, no matter how many additional functions are added. As a result, the issue of prioritising needs between local residents versus those of tourists has arisen. For example, during peak seasons, crowded streets, loud street music, and inadequate parking spaces are the common issues faced by residents living in this area. Furthermore, the public spaces that used to be places for residents to take a walk, socialising with their neighbours, and children could play freely, are gradually changing. Therefore, this study attempts to take the central area of Liu Xing Street as a case study to investigate the current usage of public spaces in this area, aiming to gain a better understanding of the existing issues that may have arisen since the renovation.
Specifically, there are several reasons why this research focused on the central area of Liu Xing Street as a study site. Firstly, it is the only relatively large public space within this area, linking the three main streets. Secondly, local residents are more likely to visit this place, especially those living nearby, which also indicates that there is a higher possibility of various activities taking place. Lastly, the overall environment of this area still demonstrates the unique local characteristics despite the renovation.

3.3. Data Collection

Behaviour mapping is an objective observation method for recording the actual use of space without the need to interact with people [55,56]. The use of this method originated from the observation of indoor environments in the 1970s and later developed into the observation of outdoor activities [57]. The main role of this method is to visualise the collected data from people’s behaviour and activities to analyse the study site. This method has been adopted in many studies as it can record the specific behaviour of people [19,58,59].
This study employed behaviour mapping to capture the patterns of everyday use of the public space on Liu Xing Street. Since the BlueHealth Behaviour Assessment Tool provides detailed operational steps from data collection to analysis, we used the method and protocol of this tool with adaptations to reflect locally specific activities encountered [60,61,62]. Specifically, all the information was recorded on PinSurvey (https://pinsurvey.citydnatech.com) through a mobile phone, including data points, attributes, specific geographic locations and on-site photos. There are no specific requirements for devices for using this platform—generally, smartphones, tablets, and laptops are all acceptable. PinSurvey is an online platform where observers can record data, and all the information can be saved and uploaded automatically to the system so that observers can download it in different formats. As many users as possible were recorded during the limited observation time, including their gender, estimated age range, ethnicity, behaviours, and other relevant information such as social context, observation date and time, and weather conditions.
Before starting to collect data, the study site was visited for several days to obtain a general picture of the condition of the site and to observe the daily activities taking place [19,61,63]. The entire study site was divided into six sub-areas according to their layout, and the key areas to be observed were marked so that each sub-area could be observed within a limited time. This is because some parts of the areas do not have spaces for activities. Regarding the order of observation, we took the central square in the south as the first location and scanned each sub-area counterclockwise from it in sequence. Each sub-area was observed for 7 min, with an interval of 3 min to move to the next, therefore taking a total of 60 min to complete one round of observation. In order to record as many data points as possible and to avoid stacking too many data points together, each hour was recorded separately. After completing the observation, all these data points were exported in shapefile format and directly imported into ArcGIS.
In order to avoid the large number of tourists in the area during the summer, the observation was conducted in October 2023. This is because the number of users in this area will decrease significantly, which made it relatively easier for observation. Meanwhile, the weather conditions were still suitable for outdoor activities. To capture the likely different usage patterns on weekdays and weekends, data were collected for five days, including three weekdays and two weekend days, with a total of 3052 behaviours observed. As for the different usage patterns at different times of the day, three time periods were selected, namely, morning 9.00–12.00, lunchtime 12.00–2.00, and afternoon 3.00–5.00, since there are limited daylight hours in October. Figure 3 presents the specific landscape characteristics of the study site and the spatial distribution of all collected data points.

3.4. Database Creation and Analysis Techniques

Before processing observation data, the detailed base map of the study site, including facilities, paths, trees, etc., was created using ArcGIS 10.8 (ESRI). Then, the data from each observation, which was originally recorded on the map of PinSurvey, were imported into the GIS base map. By doing this, a rich database was created that includes the spatial characteristics of each sub-area and observation data along with their attributes. Based on the database, various analyses can be conducted on the collected data. Furthermore, the relationship between the spatial characteristics of each sub-area and the behaviour of users from different segments of the population can be illustrated more visually. For the convenience of comparison, we used a fishnet in ArcGIS to count the number of data points. The analysis of this study mainly involves a descriptive statistical analysis to explore the daily activity patterns and their related influencing factors in each sub-area.

4. Results

The descriptive statistical analysis mainly focuses on the number of users, frequency of activities and types of facilities and their spatial distribution in each sub-area. The results show the observed number of all activities and their proportional relationships among different user groups. Table 1 displays 21 observed primary activities and the number of participants from different user groups who carried out these activities, with a total of 3052 data points. Table 2 lists the photos of each sub-area and descriptions of their main features and activities observed. Composite maps combine data points with the characteristics of the study site to show the daily usage patterns during all observation periods to analyse the relationship among users, activities, and characteristics of the study site. Regarding the composite maps that display the spatial distribution of users and activities, we assigned all data points in a fishnet overlay to count the number of points in each grid and show patterns of density, which makes interpretation easier.

4.1. Activities Observed

Overall, walking/strolling is the most popular activity, accounting for 28.4% of all activities, followed closely by standing at 28.1% and sitting at 27.7%. These three activities have the highest proportion among all primary activities.
More specifically, resting/doing nothing and using a smartphone are the main secondary activities related to sitting, accounting for 9.1% and 7.2% respectively. Taking photos is the most popular secondary activity related to standing, which occupies 18.5% of all activities, while those involving children account for 9.5%. While there are many activities involving children, walking with a child and playing freely are the two with the largest number compared to others. Public square dancing is the most common cultural activity, accounting for 2.56% of all activities. There are a few other cultural activities, such as playing the saxophone and accordion. In addition, although sports activities, such as playing football and badminton, were also observed, they mainly occurred on weekends. As for other types of activities, such as crouching, lying down, and walking a dog, their number is relatively small.

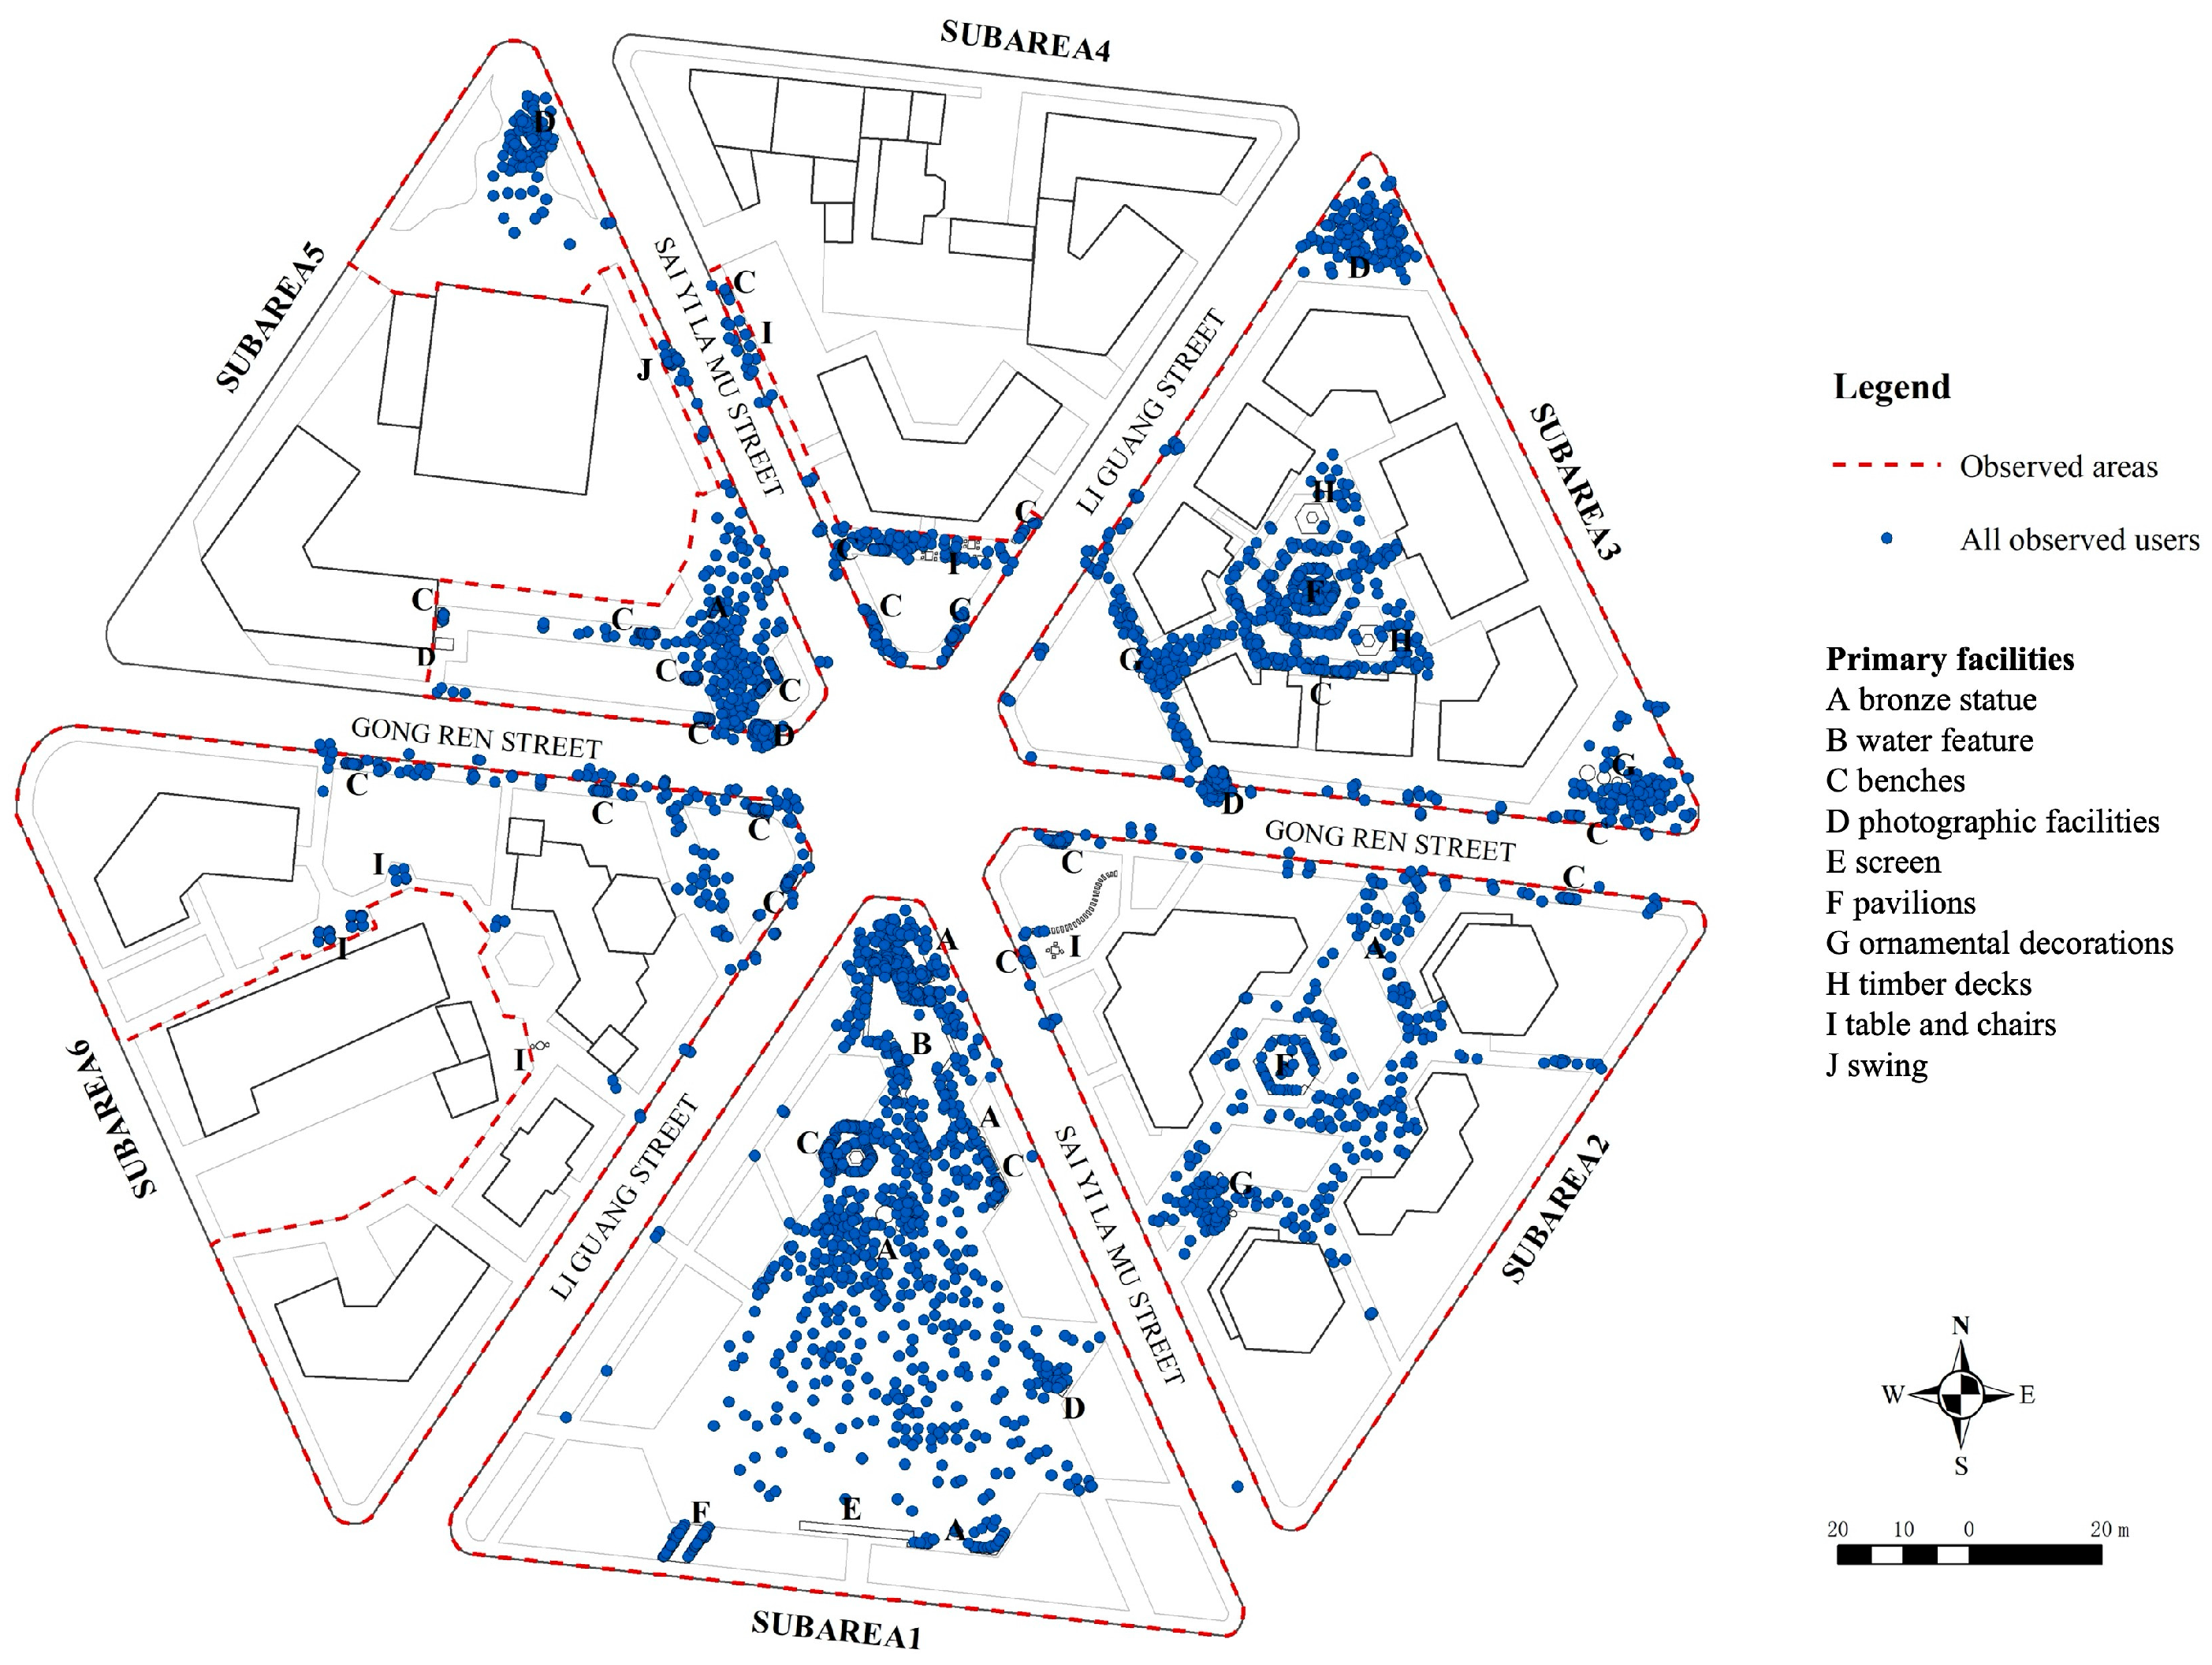
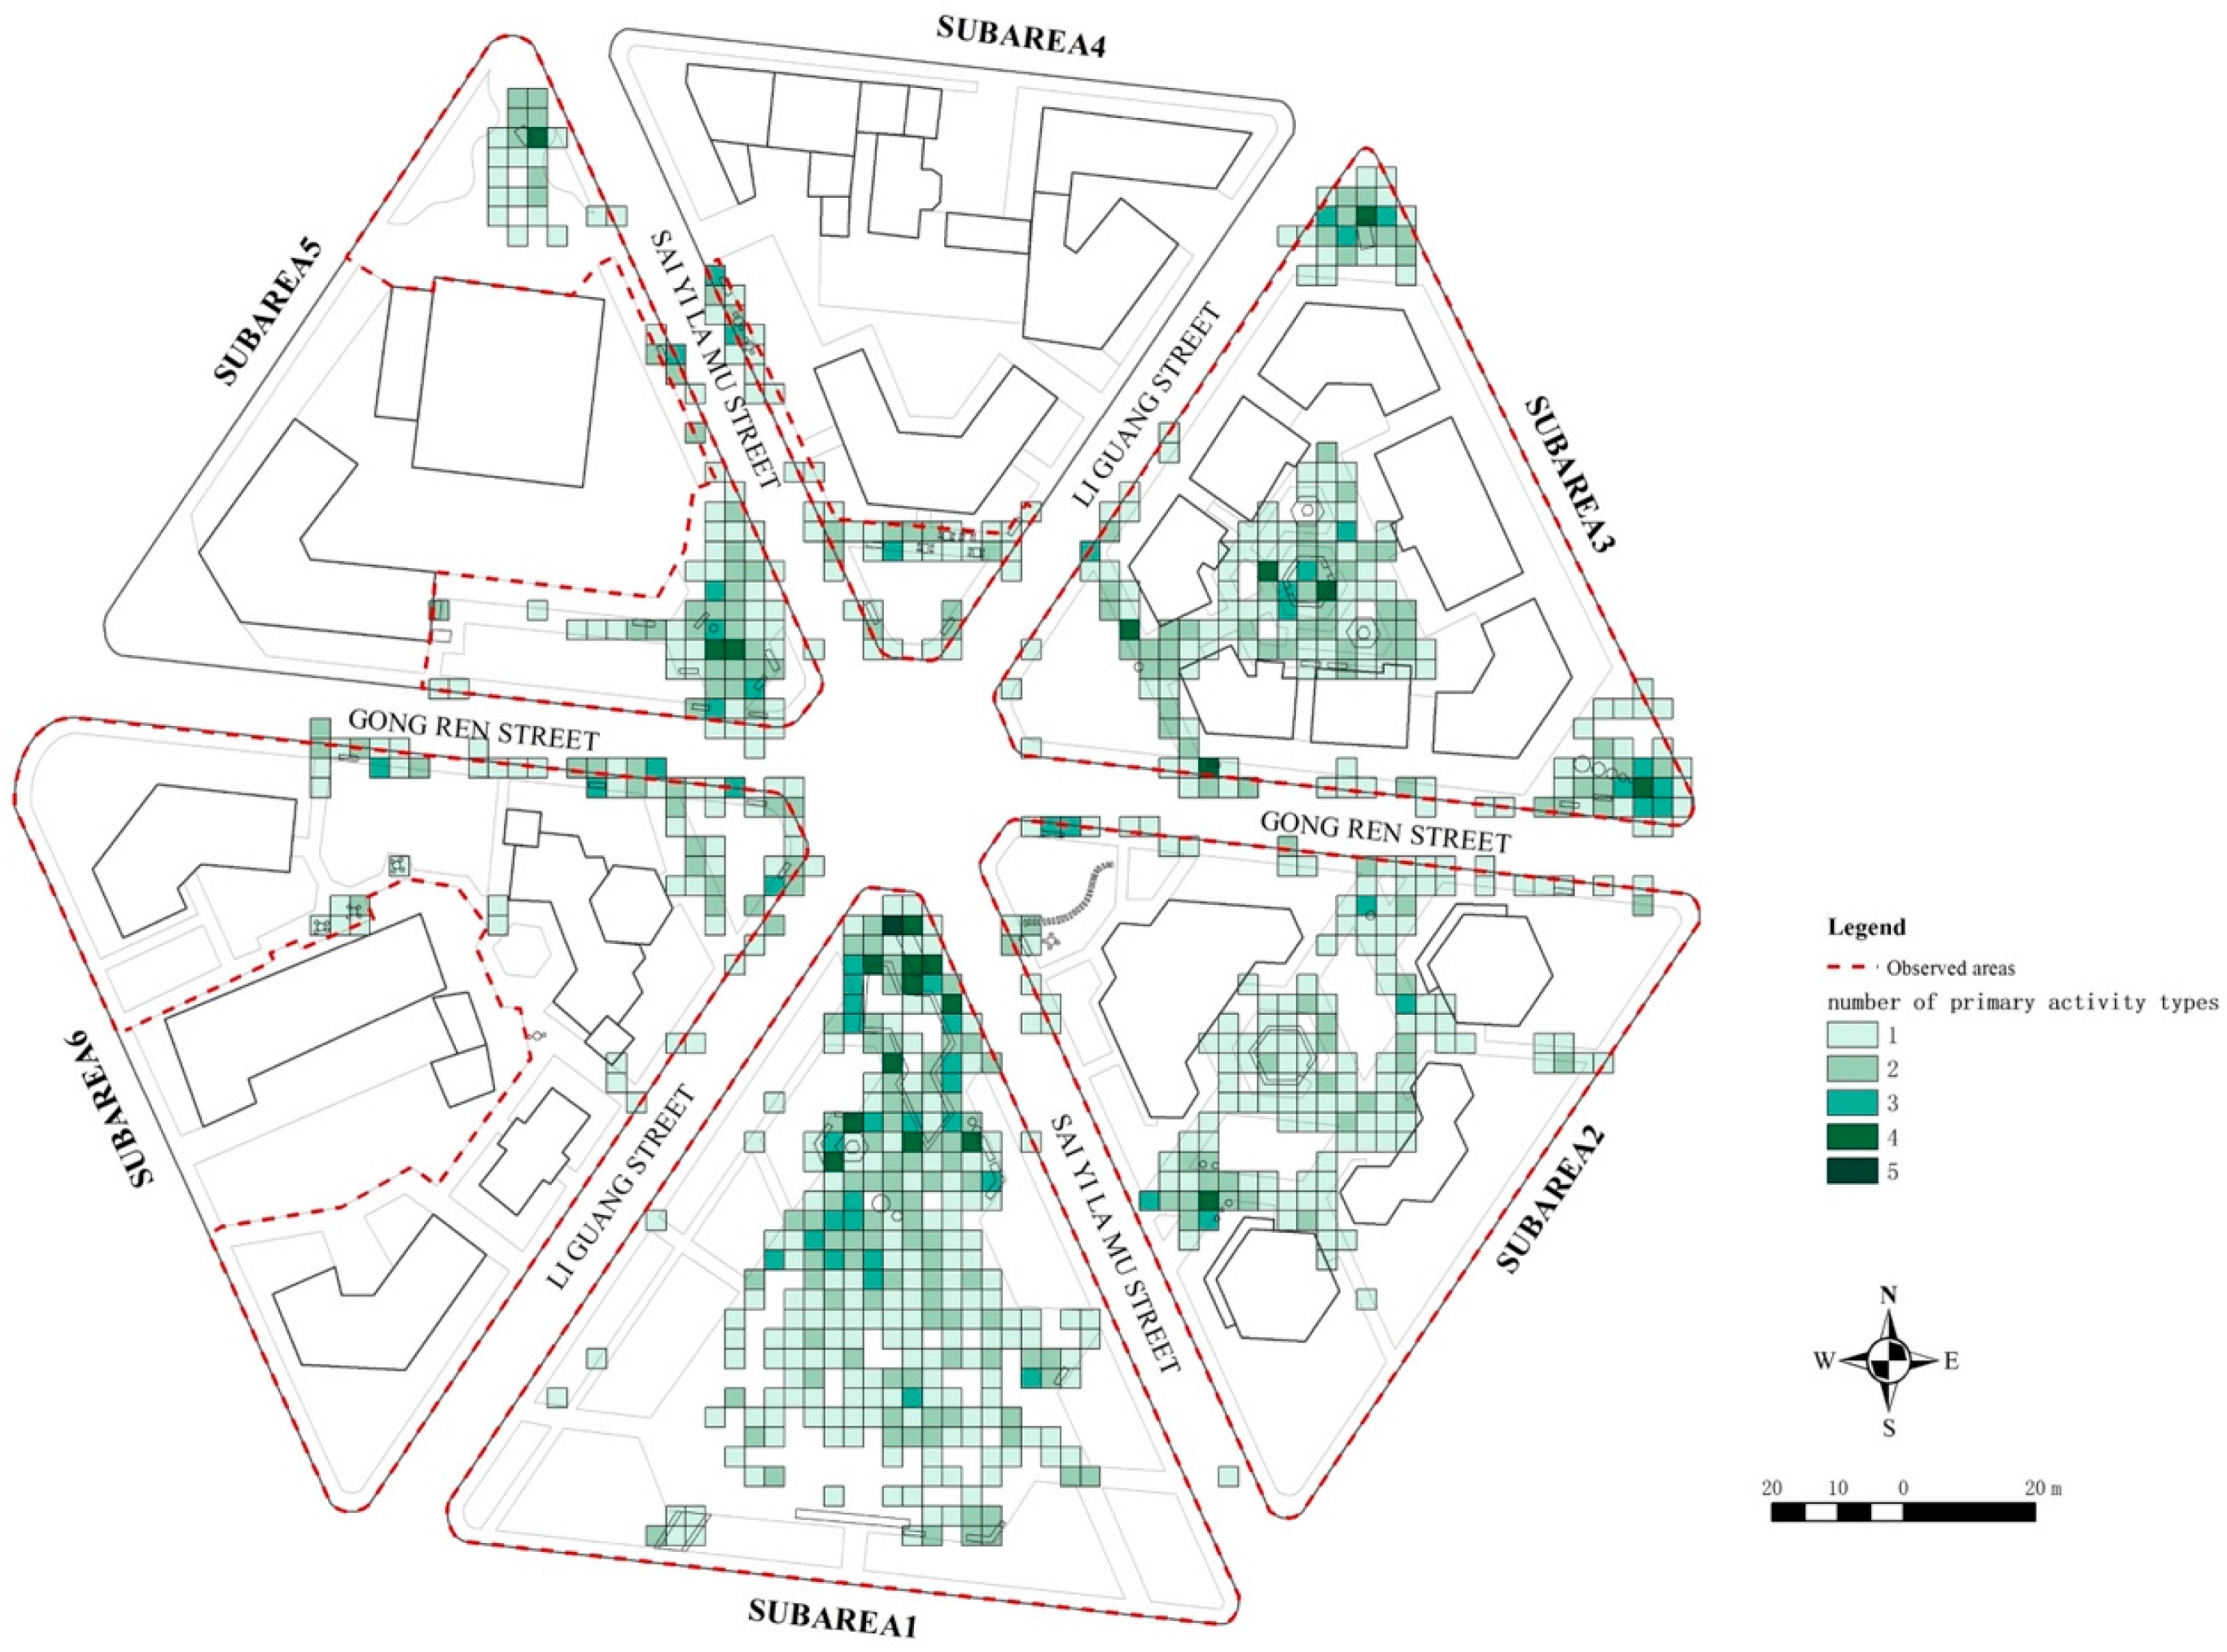
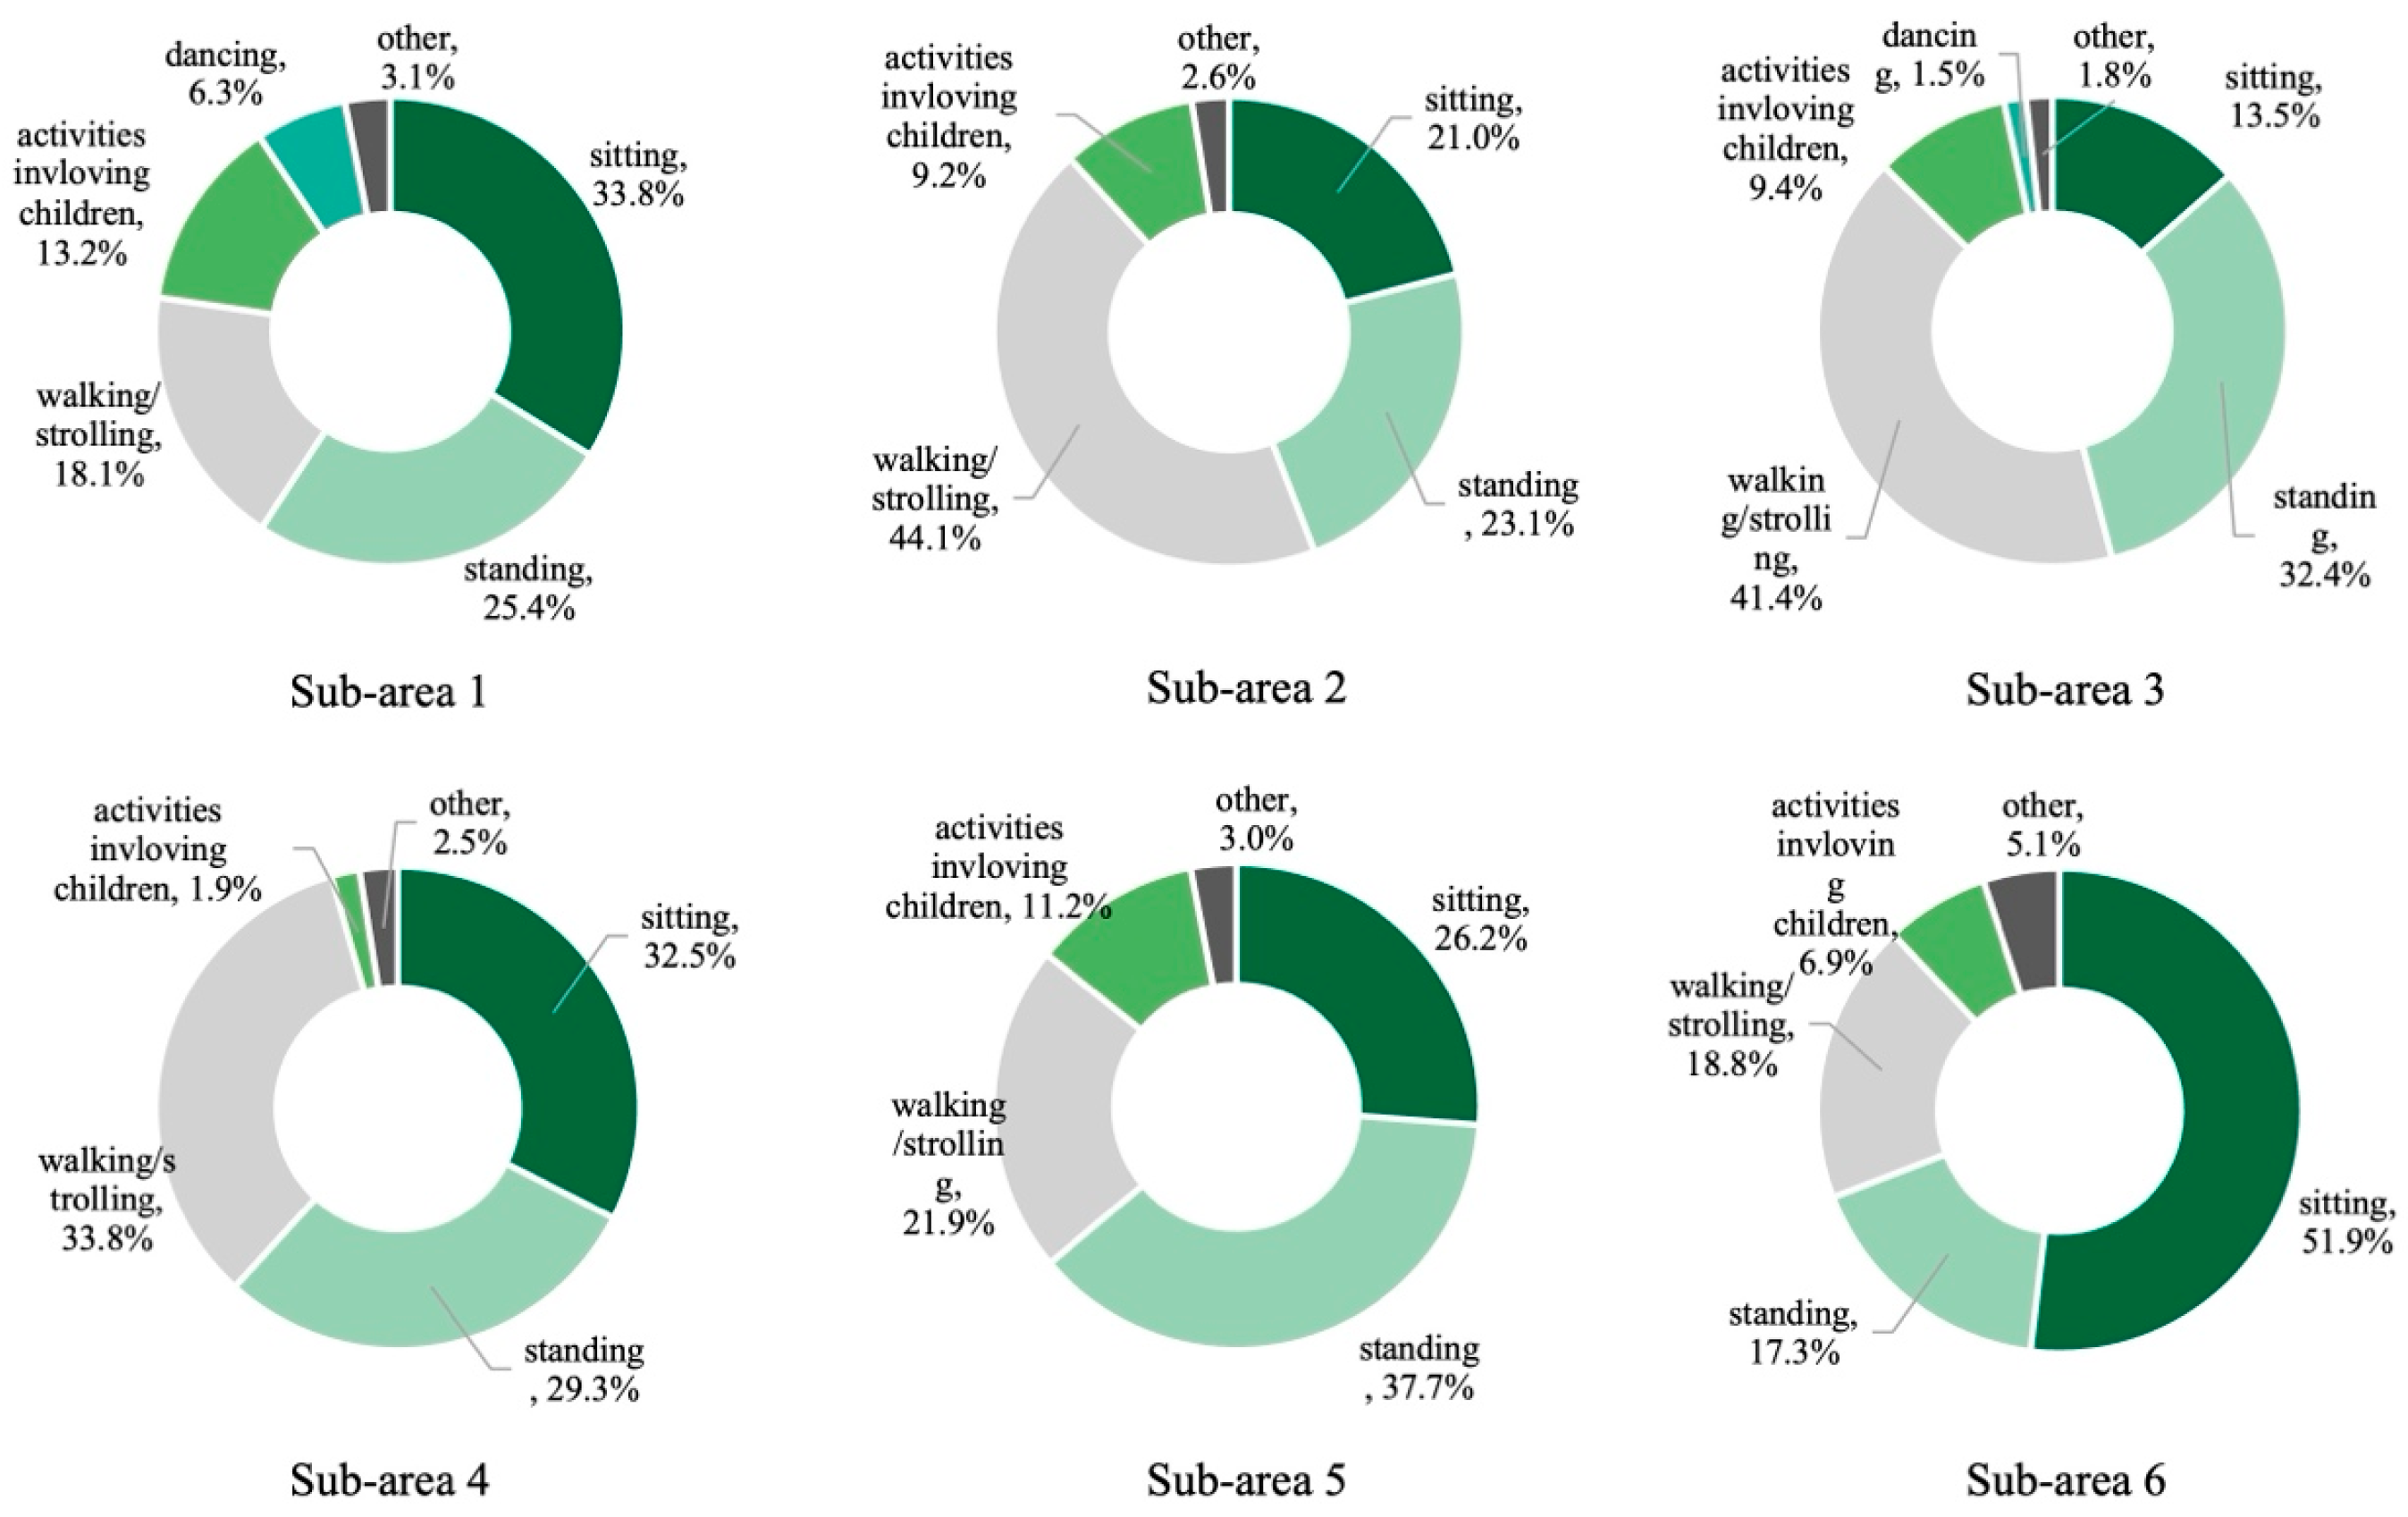
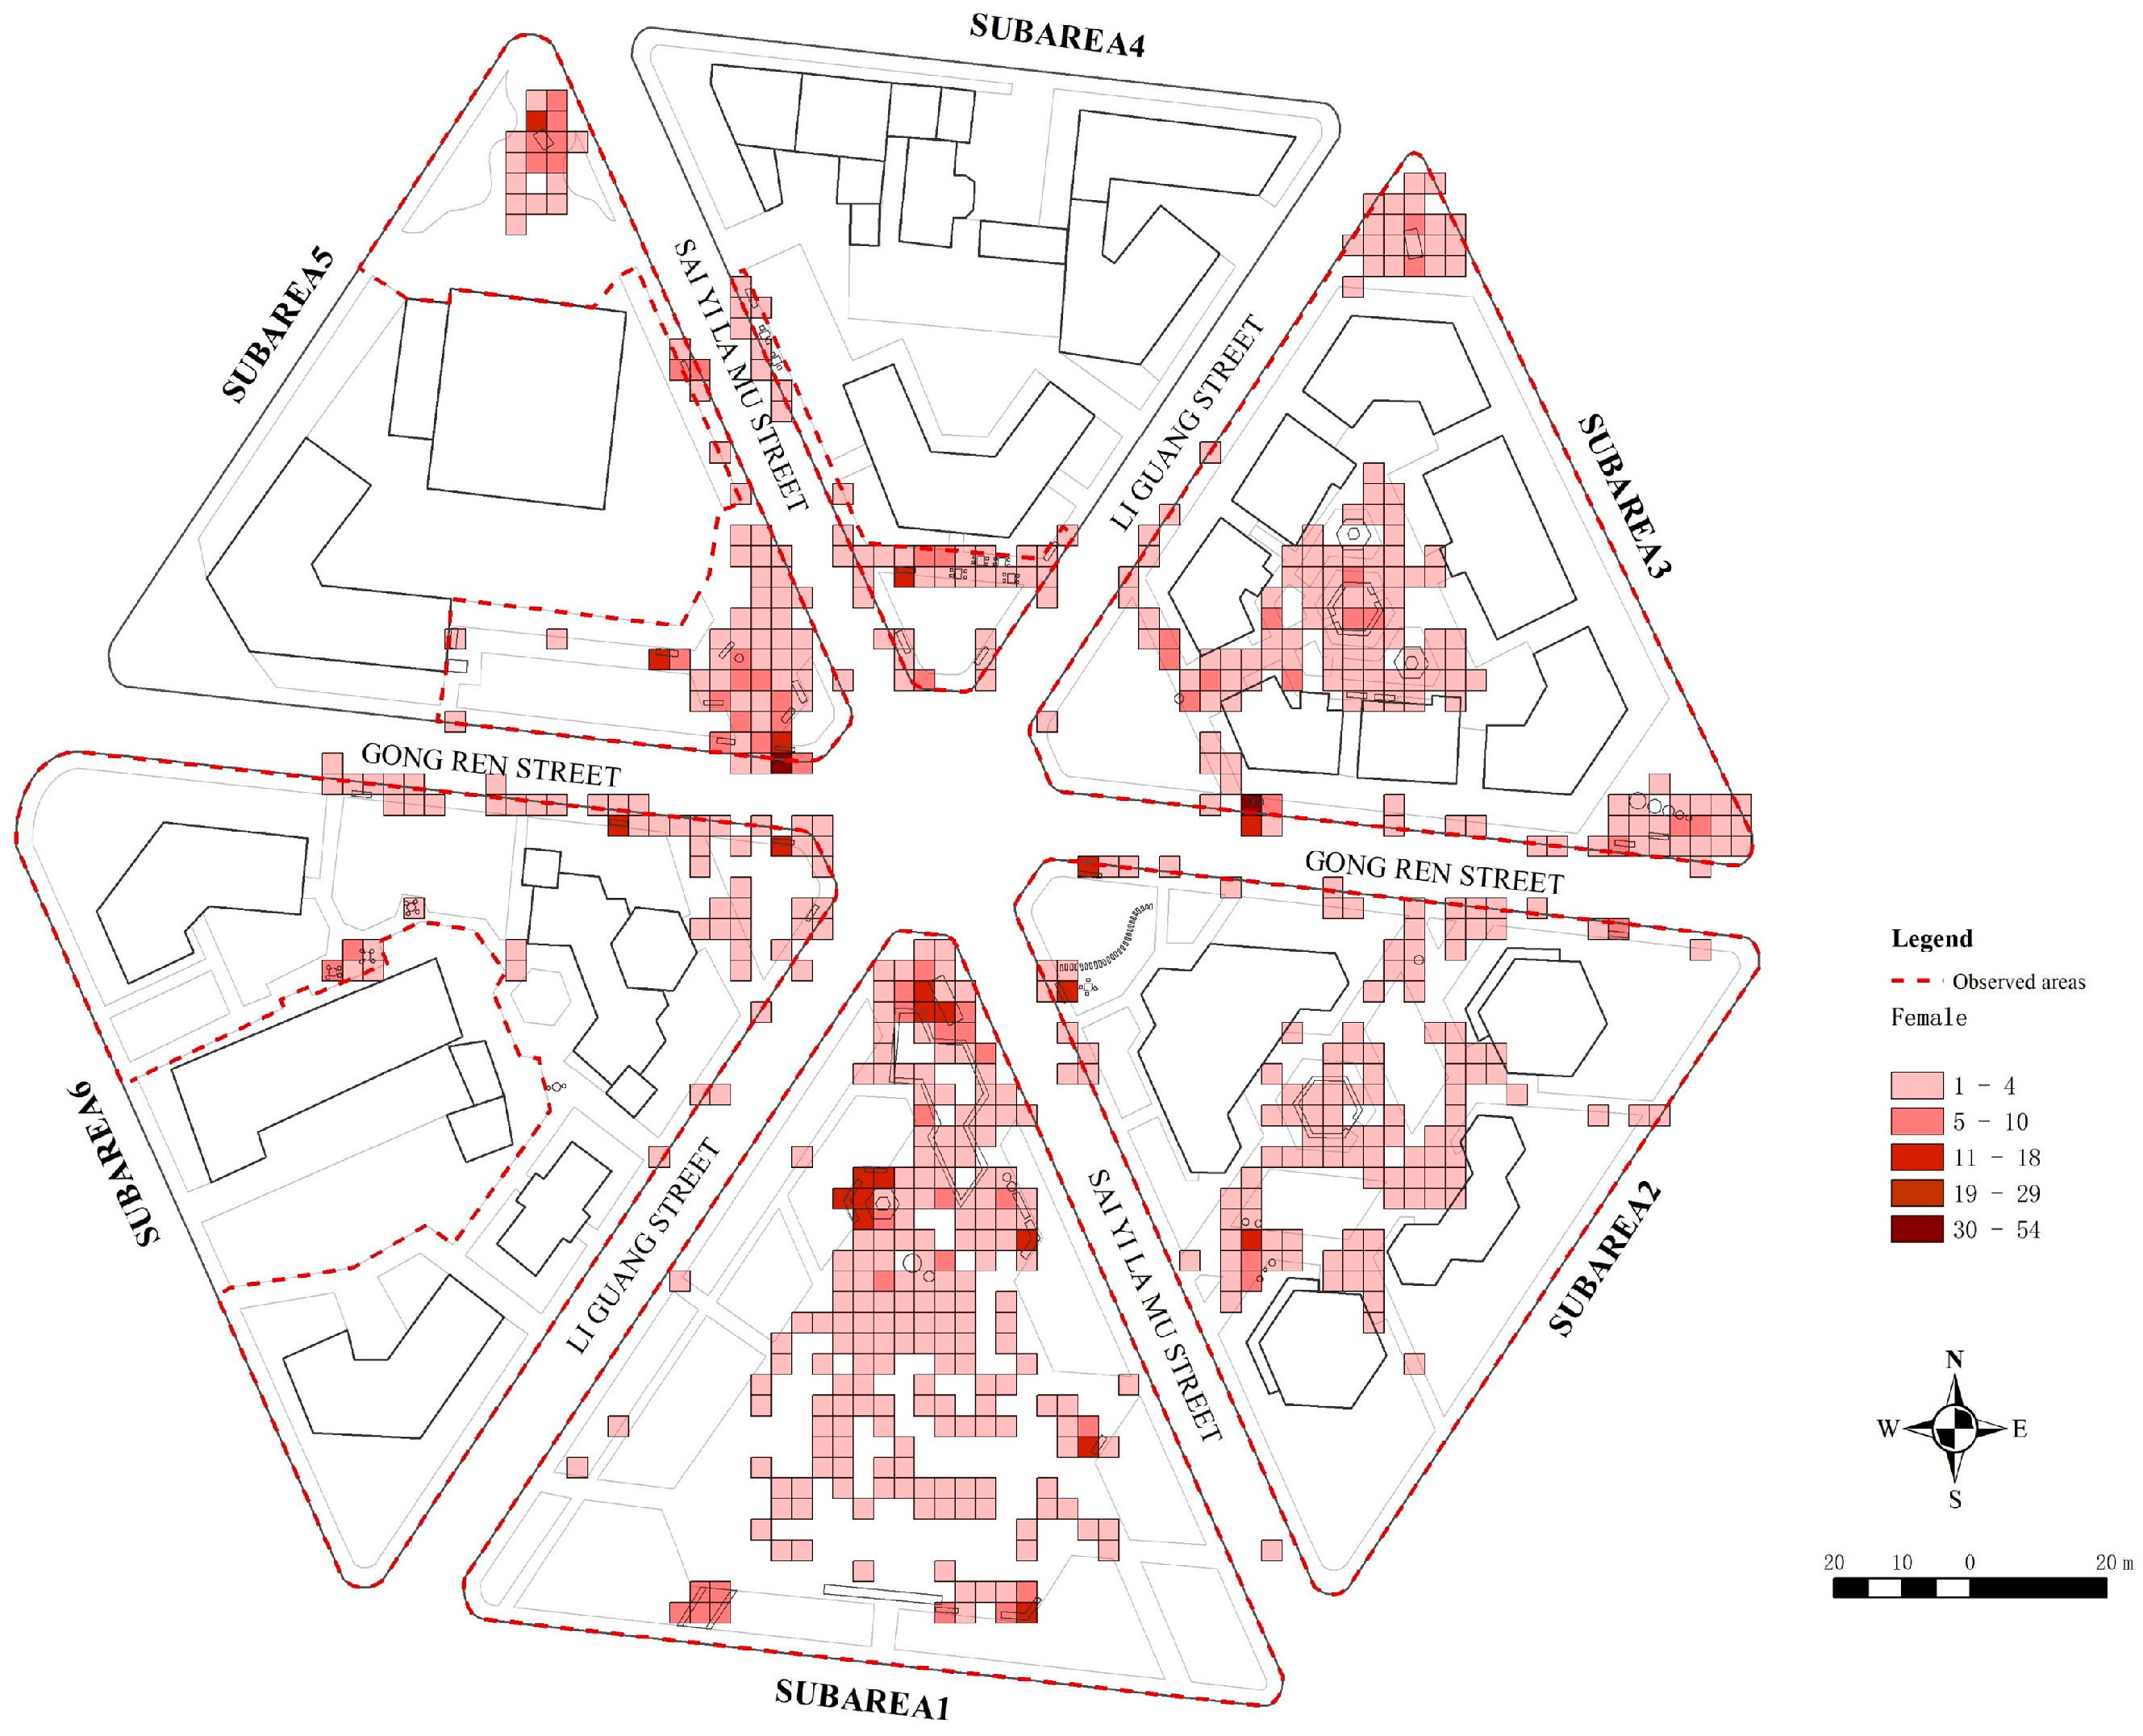
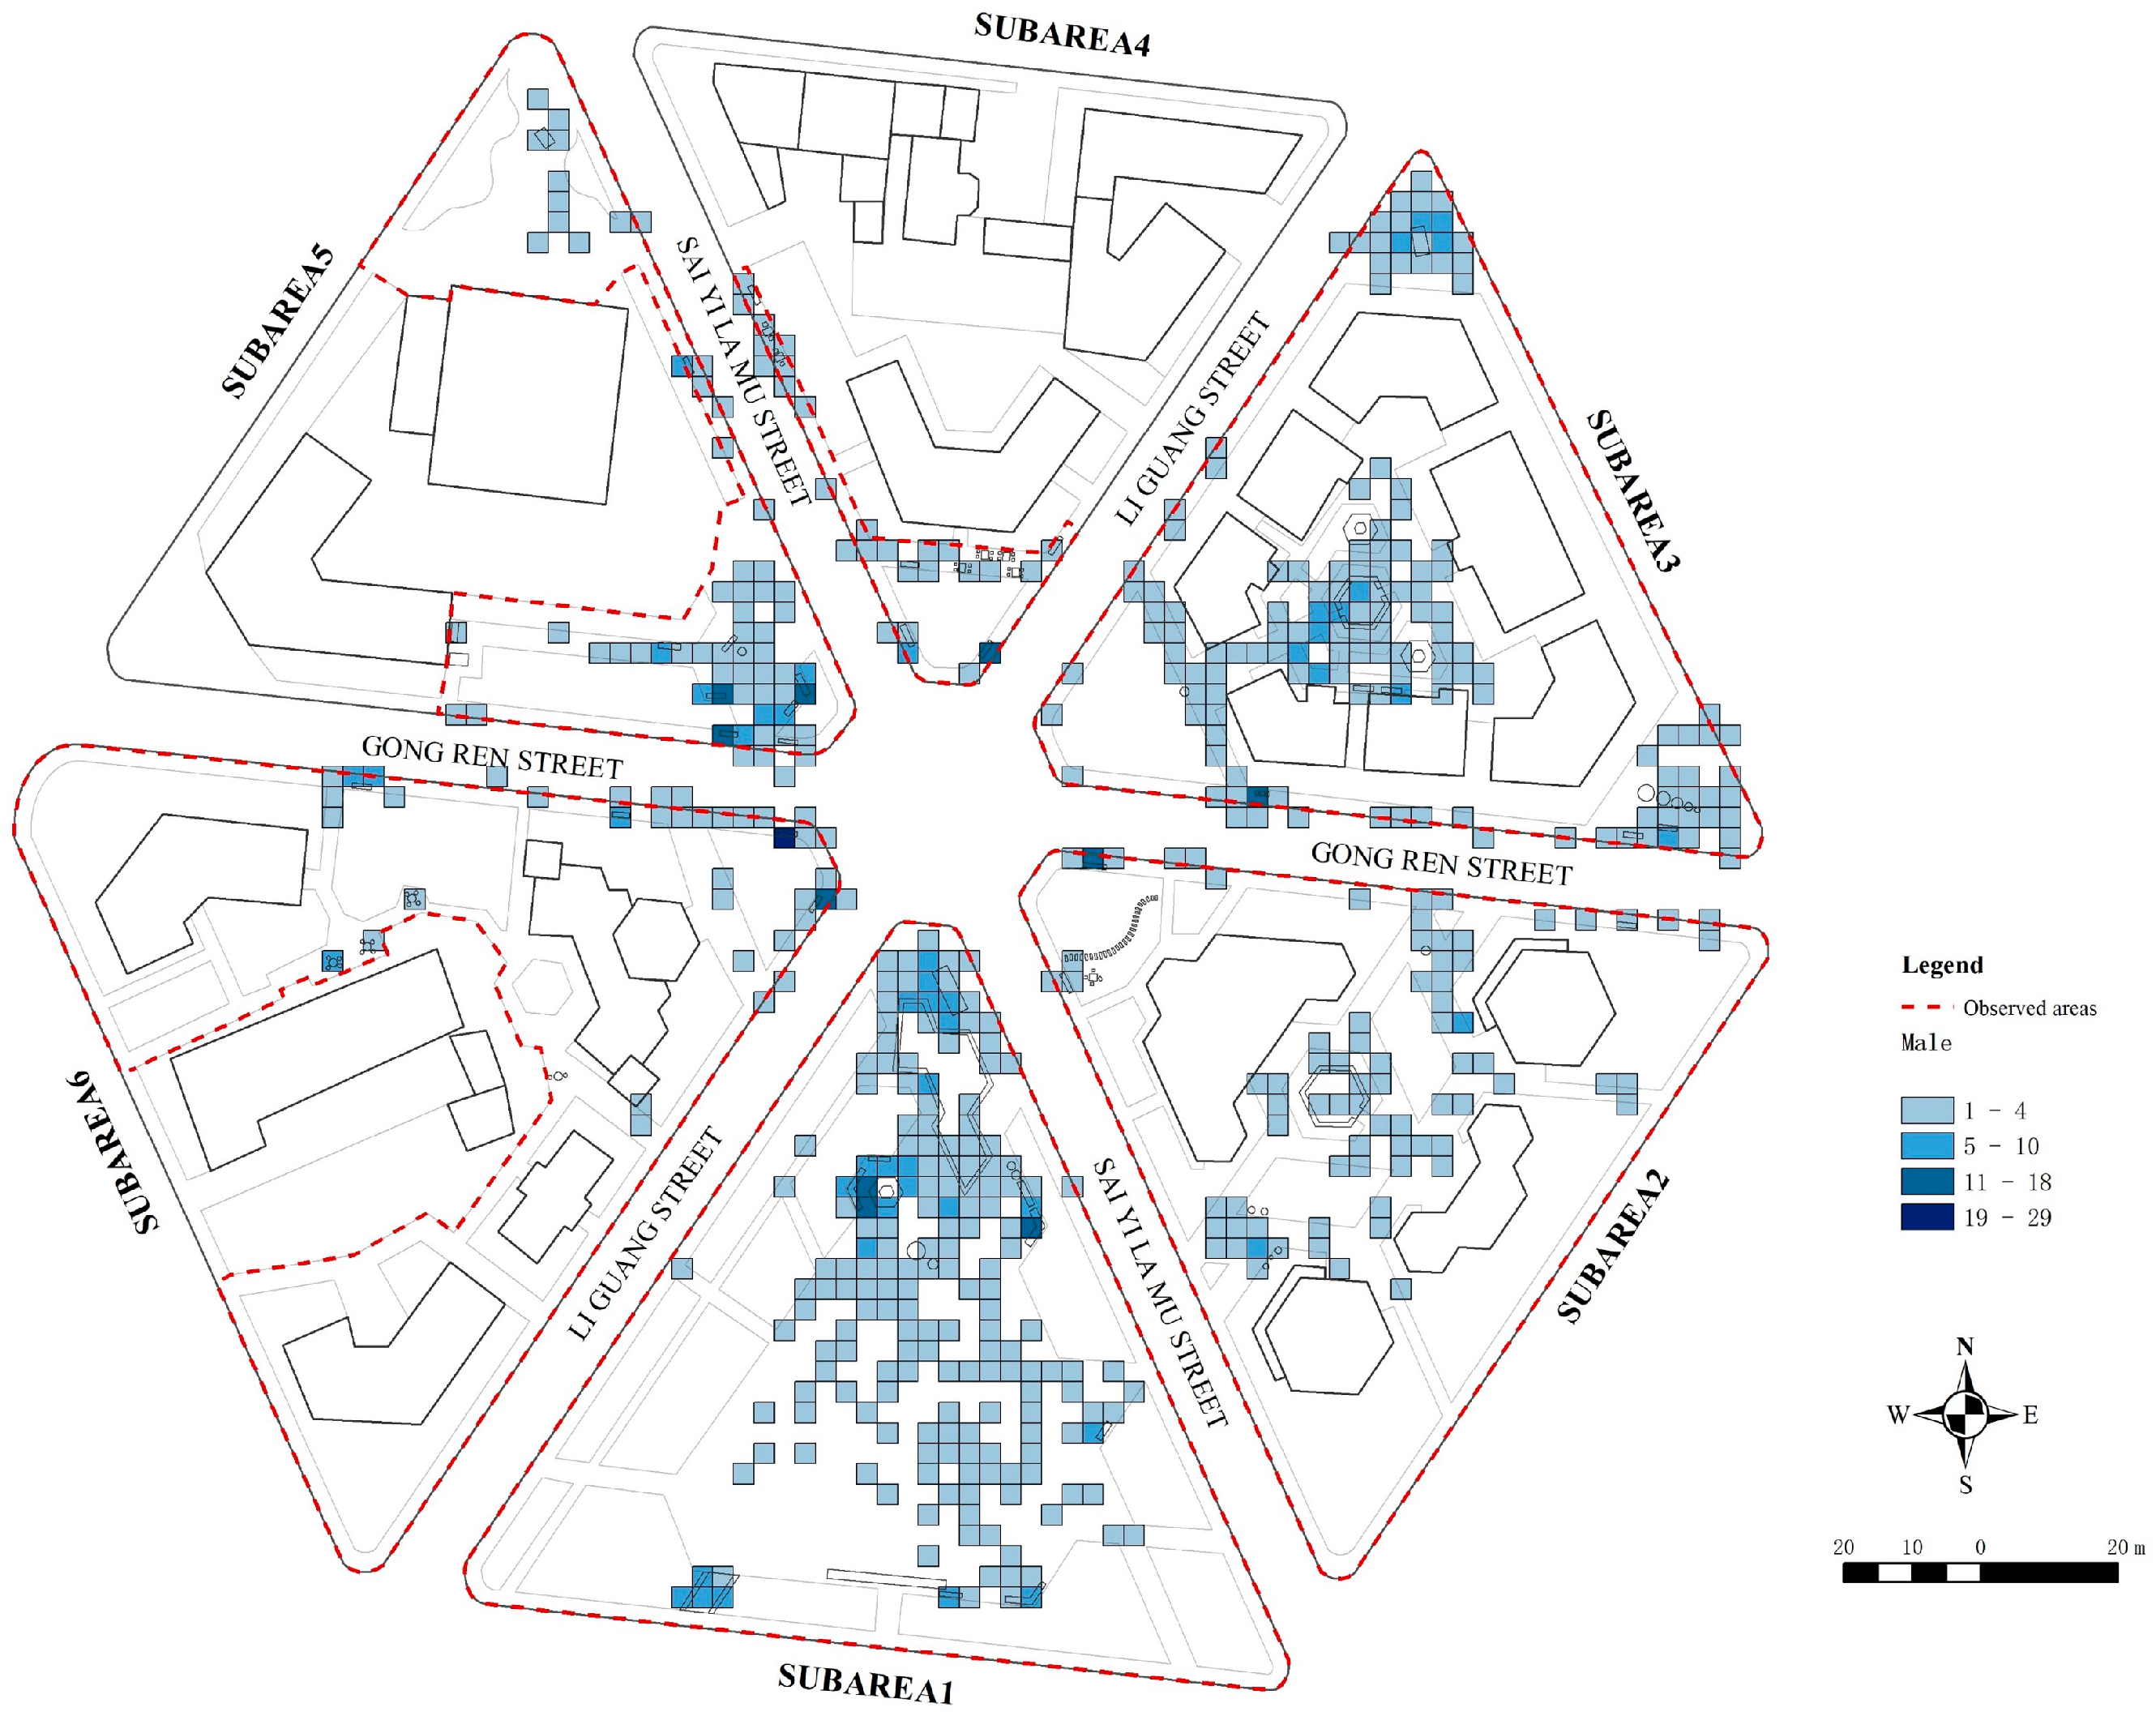
4.2. Spatial Distribution of Activities in Each Sub-Area

This section elaborates on the activities and their spatial distribution in each sub-area. The relationship between these activities and the characteristics of the study site, such as layout, facilities and landscape, as well as the possible reasons behind these activities, will be considered in detail in the discussion section.
According to the collected data in the five-day observation period, the first sub-area has the highest number of activity types among the six sub-areas, with a total of 19 primary activities, while the fourth sub-area has the least number with only six activity types. The number of activity types in the rest of the sub-areas ranges from 12 to 13. Figure 4 shows how many different types of primary activities are in each grid, and the number is represented by values ranging from 1 to 5. It is noticeable from the map that there are more varied types of activities in the first sub-area, implying that it has a higher diversity compared to the other sub-areas. The specific spatial distribution of activities in each sub-area is as follows.
Figure 5 shows the percentages of primary activities in each sub-area. It can be seen that in the first sub-area, sitting is the most common activity, and most people just rest or do nothing, chat or use their smartphones. They mostly sit on the benches or the edge of the water feature in the north of this area. Standing is another common activity in this sub-area, and most of the people take photos. The number of these activities increases in the afternoon when a group of people dance in the open space of this sub-area. The public square dancing is one of the daily activities the local people engage in as a form of exercise, usually performing folk dances. Some of them are retired people or housewives, and everyone can freely participate. This also provides tourists with an opportunity to experience the local culture. In addition, children’s activities are also mostly found near the water feature, as those people who take their children for walks usually prefer to stroll around it. Compared to the sedentary activities mentioned above, there are some activities with a short duration that involve simply passing by or taking a stroll. For instance, in the first sub-area, walking/strolling accounts for 18.1% of all activities, while sitting and standing account for 33.8% and 25.4%, respectively. This indicates that this sub-area has the potential to attract the majority of visitors to stay for longer periods of time.
In the second sub-area, walking/strolling occupies the largest proportion at 44.1%, which is the sum of sitting and standing. However, the percentage of activities that allow users to stay in the space is still higher than walking/strolling. For example, 21% of users sit, 23.1% stand, and 9.2% are involved in children’s activities, while other types, such as walking a dog and using a wheelchair, account for 2.6%. Similar to the first sub-area, there are many users taking photos, but it is mainly owing to the facilities and landscape features in the space rather than to particular activities. People often gather at the southwest entrance of the path that passes through this sub-area, where there are some ornamental decorations. Thus, some visitors often stop to take photos while passing by, especially those with children. Moreover, a few internet celebrities occasionally do live streaming or record videos here.
In terms of the layout, the third sub-area is similar to that of the second. In Figure 2 and Table 1, it can be seen that there is a pavilion in the centre of this sub-area, just like in the second. However, there are also photographic facilities and ornamental decorations in three of the corners here, which attract more visitors. Regarding the percentages of activities, walking/strolling accounts for 41.4% of all activities in this sub-area, while the remaining activities account for 58.6%. However, there are sometimes Russian dance performances in the pavilion at noon or in the afternoon, which attract nearby visitors. In addition, the photo-taking activity is mainly distributed in these three corners of this sub-area. Apart from the physical condition of the site, there is a well-known bakery in this sub-area, which also attracts many visitors. However, due to the limited outdoor seating, a relatively small number of visitors sit and eat in this sub-area.
The fourth sub-area has the least number of users and types of activities among all the sub-areas. The activities here are mainly distributed in the southern space as well as the southwestern edge. Compared to the other sub-areas, the size of this space is relatively small. Benches, tables and chairs are the main facilities. Overall, of the activities in this sub-area, the proportion of walking/strolling is 33.8%, while the proportion of remaining activities is 66.2%. Specifically, sitting is the most common activity and accounts for 32.5%, while children’s activities account only for 1.9%.
The fifth and sixth sub-areas are also similar in terms of their limited spaces for activities. Activities in both areas are mainly distributed in the space near the central area of the entire study site. The main difference between these two sub-areas is that the fifth sub-area has more facilities than the sixth, which also affects the diversity of activities and use of space to some extent. For instance, only half of the users in the sixth sub-area can sit because of limited seating, compared to the fifth sub-area, where there are not only benches for visitors to rest but also attract more children and people due to the photographic facilities. Overall, although these two sub-areas can attract visitors to linger in the spaces for a long duration, the fifth sub-area has more opportunities for other activities.

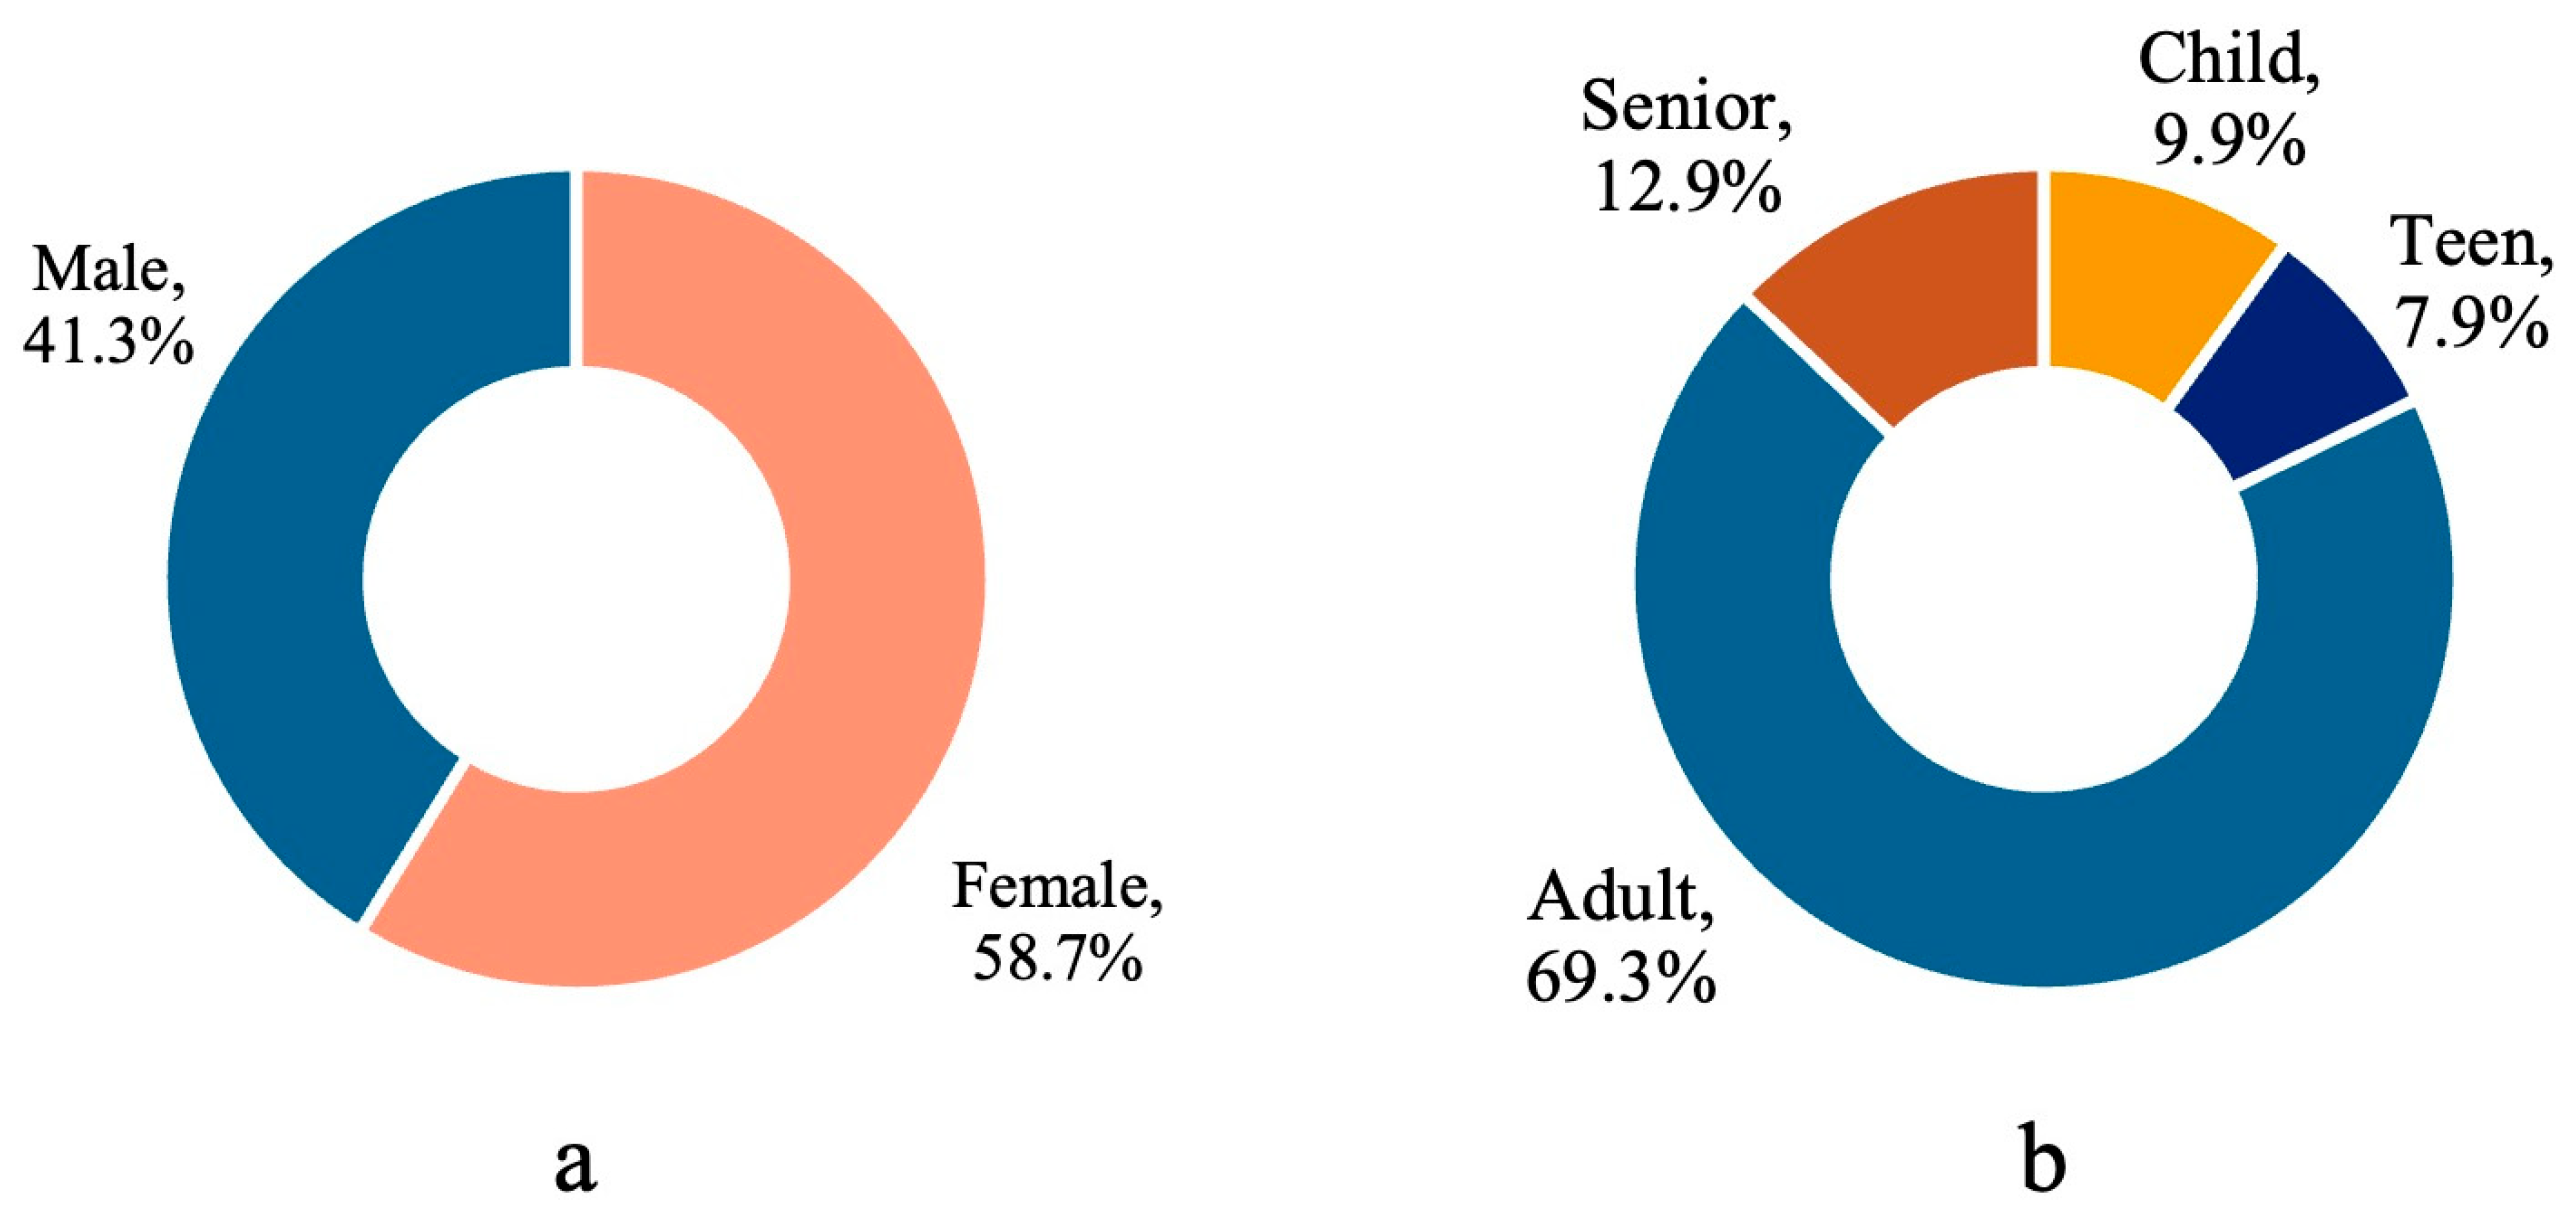
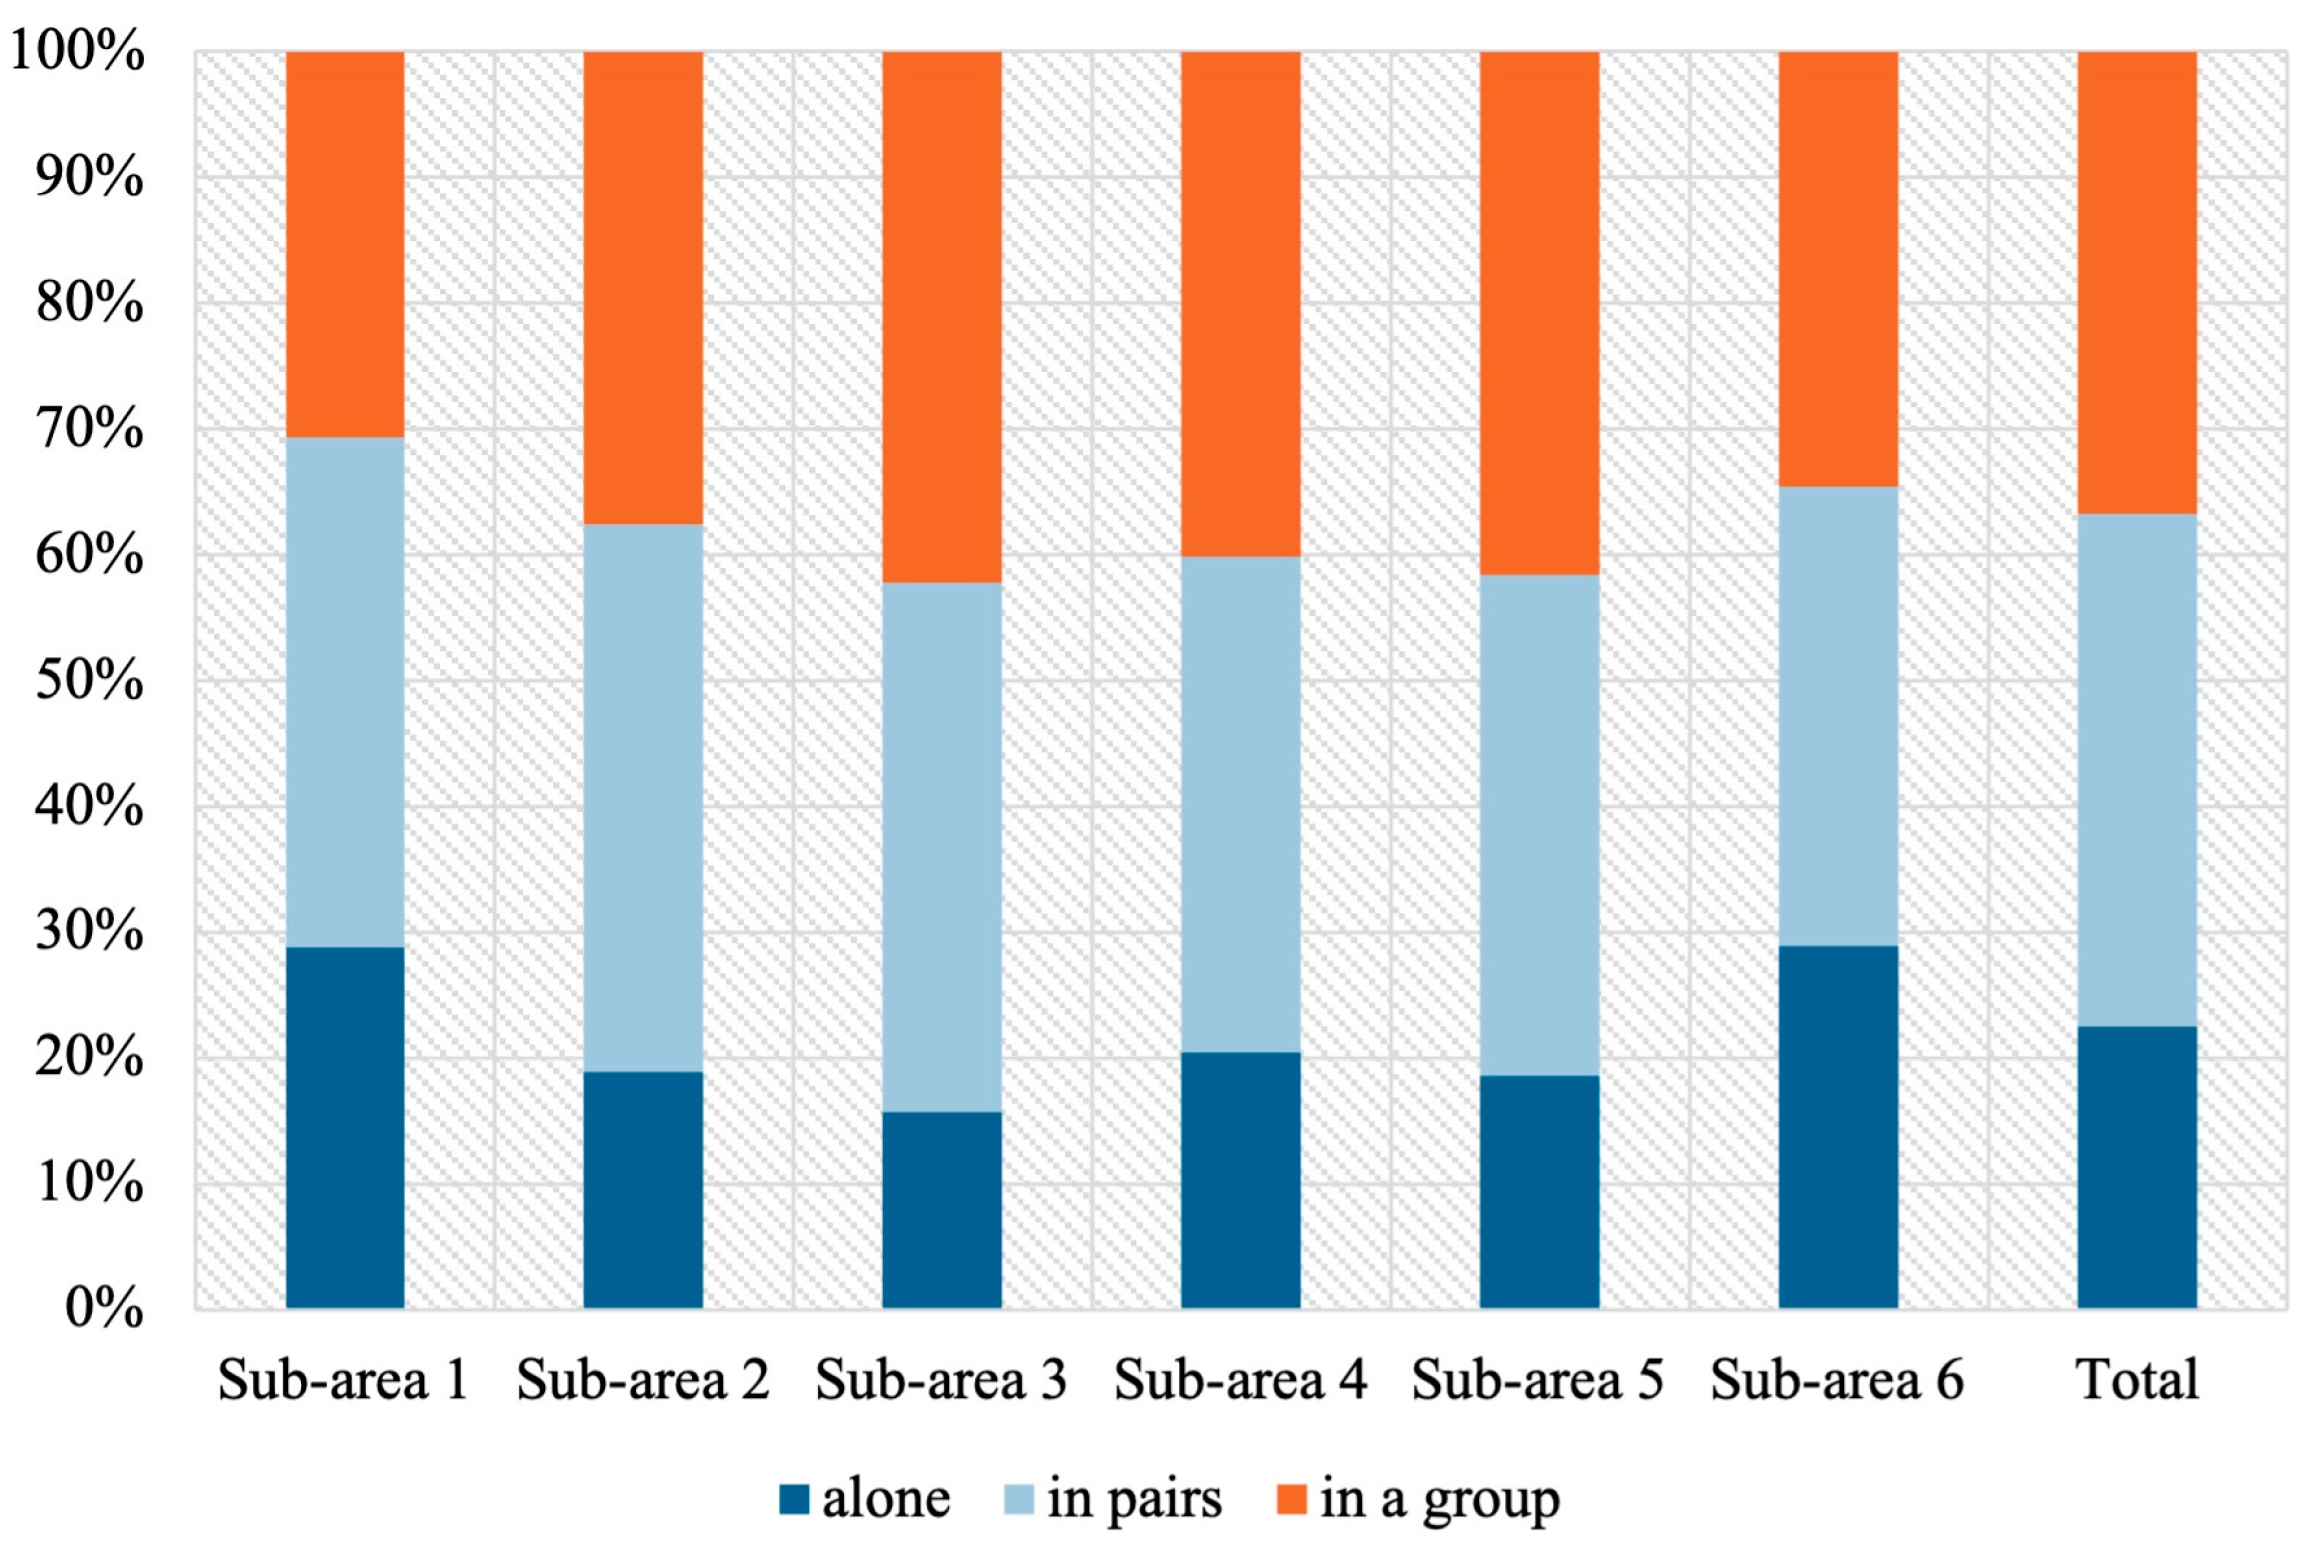
4.3. Users from Different Groups

According to the collected data, there are more female than male users across the whole study site, with proportions of 58.7% and 41.3%, respectively (see Figure 6a). Adults make up the largest proportion of all age groups, at 69.3%, while the other age groups occupy relatively small proportions, with old people accounting for 12.9%, children 9.9% and teenagers 7.9% (see Figure 6b). The seventh population census data in 2020 for Yining show that the proportion of females is 50.8% and that of males is 49.2% [64]. The proportion of adults between 20 and 59 years old is 61.5%, while old people aged 60 and above account for 11.8%, and 26.8% are people under 19 years of age.
Regarding the number of users in each sub-area, Figure 7 shows that the number of female users is higher than male users in all sub-areas. In particular, it shows that the number of female users is twice that of male users in the second sub-area, whereas there are no distinct differences in the other sub-areas.
Figure 8 and Figure 9 show the spatial distribution of female and male users in each sub-area. It can be seen from the figure that the number of female users is higher near benches, bronze statues, and photographic facilities, while the number of male users is higher near benches. Basically, seating areas are most commonly used by both female and male users. However, female users prefer to use spaces that offer opportunities for photography.
Regarding the spatial distribution of different age groups, children are mainly distributed in the first, second and fifth sub-areas, especially showing a higher density in the surrounding area of the water feature. The spatial distribution of old people is similar to that of children. The highest number of users across the whole study site is adults, showing a high density in each sub-area, particularly in the first and third. This contrasts with teenagers, who have the lowest number of users. There are, however, higher concentrations of teenagers in the fifth sub-area than in the others. Furthermore, there are fewer teenagers on weekdays than on weekends (see Figure 10).
In terms of the social aspect of public space according to different users, such as individuals, in pairs and in groups, the collected data show that users in pairs are the most common, accounting for 40.8%, followed by users in groups of three or more with a proportion of 36.8%, while individual users account for only 22.4% (see Figure 11). The users in pairs are mainly distributed in the first, second and sixth sub-areas, while the rest of the sub-areas are mainly used by people in groups.

5. Discussion

We have analysed the current use of public spaces in the central area of Liu Xing Street, such as the spatial distribution of various activities and the different segments of the population observed.

5.1. Site Characteristics and Activities

Previous studies have demonstrated that the size of public space can affect the density of activities, meaning that larger spaces may lead to a lower density of activities [19,65]. In contrast, small-scale urban public spaces are likely to have more practical use and play a greater role in the surrounding communities [66]. In this study, the area of each sub-area is not very large, basically around 3000 m2. The width of the streets and alleys is also suitable for walking, the width of the three main streets being approximately 8 metres. Furthermore, some sub-areas, such as the fourth and the fifth, actually have limited spaces for visitors to use. Based on the number of activities in each sub-area, it can be seen that the overall activity density of the study site is relatively high.
Apart from the weather conditions, the physical quality of public space is an important factor affecting the occurrence of activities. Existing research indicates that a high-quality space can provide users with opportunities to participate in a variety of activities, offering them more options [60,62,63,67]. Jan Gehl categorised outdoor activities into necessary, optional and social activities. Specifically, necessary activities refer to those that are less likely to be influenced by the environment, which means they can take place in nearly all conditions. Optional activities are related to the environment, and they are more likely to take place when physical conditions are favourable, such as sitting and standing. Social activities are more likely to occur in active and inviting spaces that enable people to engage in conversations and communal activities in public areas, such as children playing. According to Gehl’s graph of the relationship between the physical quality of the environment and three types of activities, optional activities are the most common in spaces with good physical quality, while necessary activities account for the majority in spaces of low quality [68]. Put simply, the diversity and number of activities in public spaces can reflect the physical quality of the space to some extent. In this study, 21 primary activities were observed across the whole study site. Among them, 61% of activities are optional, 29.2% are necessary, and the rest, 9.8%, are related to social activities. Therefore, the diversity and number of activities observed suggest that the study site is of good quality.
From all the observed activities, some overall trends can also be summarised. Firstly, although there is a diverse range of activities, the frequencies of sitting, standing, and walking/strolling are significantly higher than those of other activities, accounting for 84.2% of all activities. This result is similar to findings from the other study, which concluded that these activities are more popular than other activities in public spaces [69]. However, it should be noted that, apart from the three main ones, the number of other activities, such as walking dogs and roller skating, is relatively low. Secondly, activities related to children, such as walking with a child and the child playing freely, occupied 10.4% of all, while 5.4% of other activities. However, the on-site investigation revealed that there are few children’s facilities at the study site. As a result, children primarily gathered in the spacious open space in the first sub-area, implying that the facilities at the study site have not adequately considered the needs of children. Finally, this study found that public square dancing attracts more visitors to public spaces and encourages them to linger, which also increases the likelihood of other activities taking place. The impact of communal activities on public space usage has been highlighted in studies showing that diverse social activities enhance attractiveness and foster social interaction [70]. In addition, the central area of Liu Xing Street is rich in vegetation, with trees such as poplar, mulberry, and elm along the three main streets. Among all the sub-areas, the fourth and fifth sub-areas have larger shade areas, making them more favourable for some visitors to rest. Trees, grass and flowers play an important role in public spaces, attracting more visitors and encouraging them to spend more time in the space [71,72].

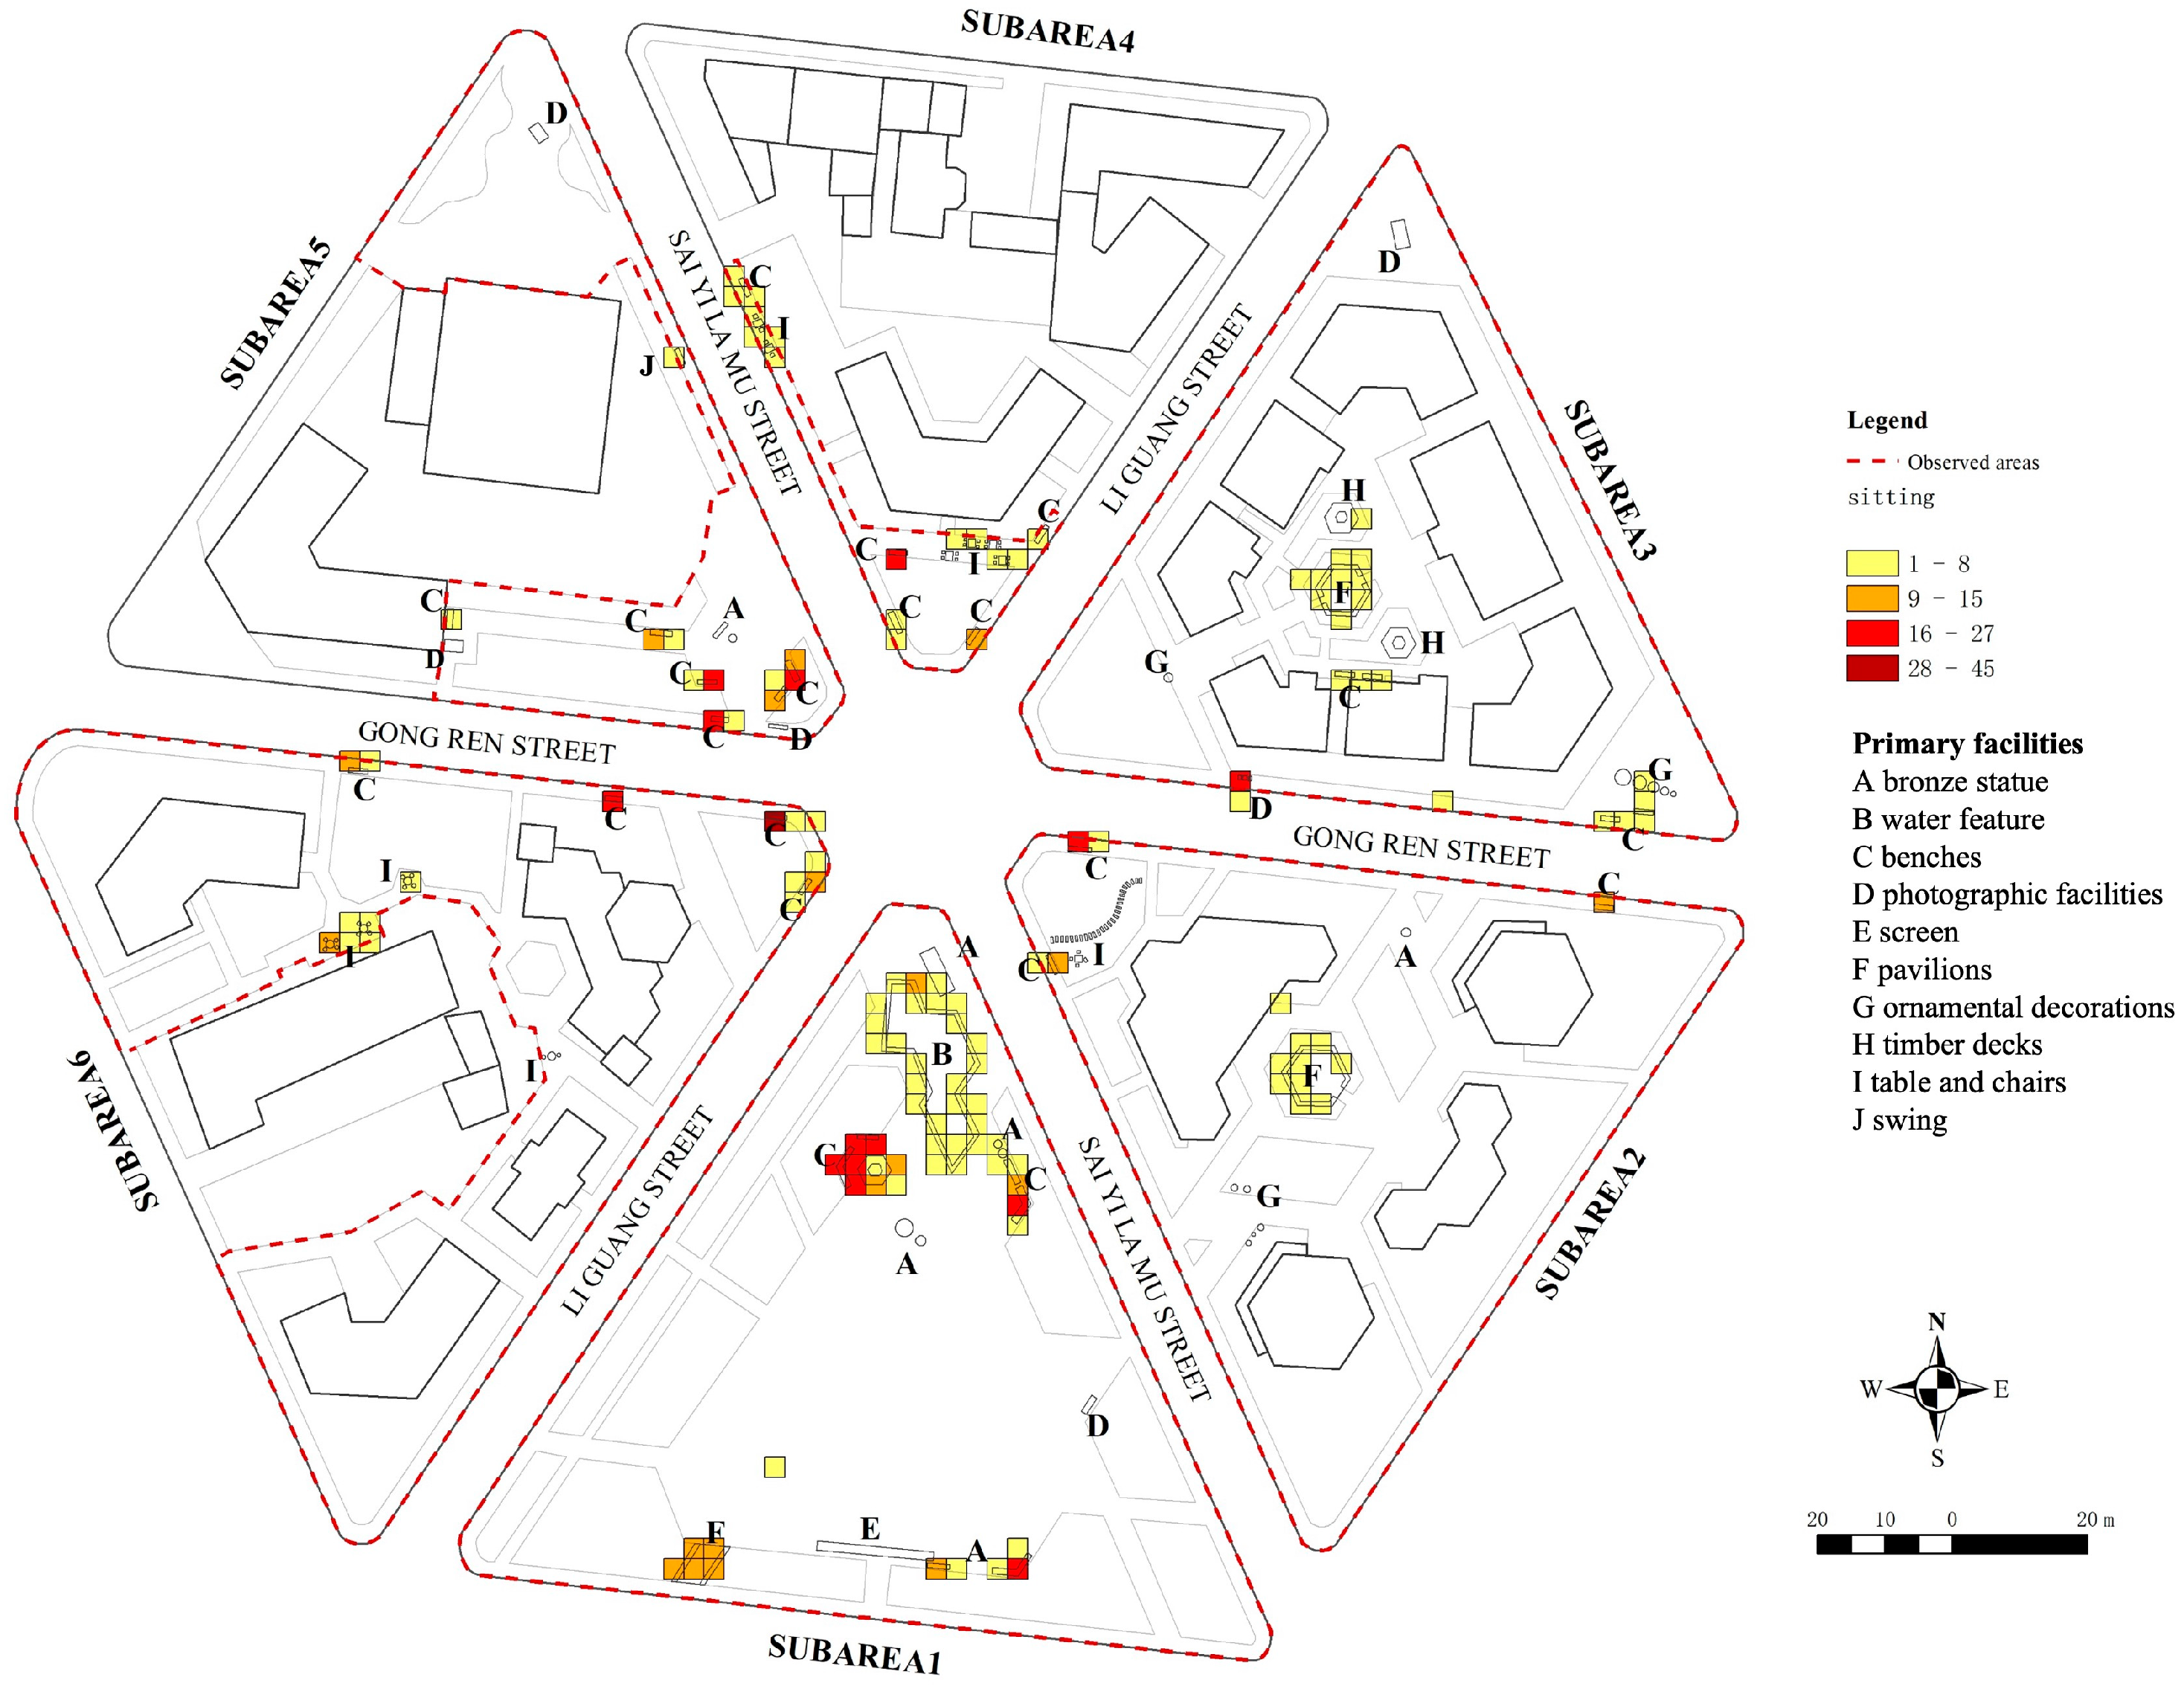
5.2. The Use of Facilities

The facilities in public spaces can directly affect the behaviour of visitors and their length of stay in the space [11,72,73]. Places with more facilities have higher activity densities, while places with fewer facilities have correspondingly lower activity densities [12,15,16,74]. Activities in public spaces can also be roughly divided into two categories: stationary and moving [67]. Specifically, stationary activities such as sitting depend on the seating provided in public spaces. Seating, including primary and secondary seating, is generally used more frequently in the space [62,67]. Here, primary seating mainly refers to benches and outdoor tables and chairs, while secondary seating mainly refers to the edges of the water feature in the first sub-area. Among all activities related to various facilities in the whole study site (referring to activities that use these facilities, such as sitting or taking photos), 59.8% are related to seating facilities.
In general, visitors tend to choose seating facilities with good visibility so that they can observe the surrounding environment and other people [72]. For instance, as shown in Figure 12, the benches commonly used by visitors in the first sub-area are those that have a good view of activities in the square. Similarly, the benches most commonly used in the second and sixth sub-areas are those on the edge of the street, allowing users to observe pedestrians as well as the other sub-areas. In other words, these frequently used benches have a good view of public spaces.
In addition, the observation has shown that old people prefer to use the first sub-area where they can sit and enjoy the sunshine, which is one of the reasons why the benches in this sub-area are used so frequently. The water feature in the first sub-area functions as secondary seating, attracting many visitors to sit on its edge and stay in its surroundings. Although the water feature was originally intended to enrich the landscape of the site, there is actually no water in it, even in the summer. Because the height of its edge is suitable for sitting, visitors often sit there and rest. Children also like to play in the water feature, resulting in many people with children gathering there. These are also similar to the results from the other studies, which have demonstrated that users usually have a higher demand for seating facilities [69,75].
Apart from sitting, standing is another stationary activity in this area. This type of activity does not require a high physical quality of public spaces, but some features, such as photographic facilities and statues, tend to attract the attention of visitors, resulting in them gathering here. For instance, the bronze statues, photographic facilities and ornamental decorations attract many visitors who want to take photos or stand near them to be photographed. According to the observed data, 38.2% of activities across the whole study site are related to those three facilities. It can be concluded that facilities have a significant impact on the use of public spaces [19]. This can be shown not only through the spatial distribution of users but also through their behaviours.

5.3. Users’ Usage Trends

One of the important roles of public spaces as a part of the urban fabric is that they allow everyone, regardless of their age, social status or ethnic background, to share a space for face-to-face communication and interaction [63,67]. This not only helps them to understand the city and social life they live in but also helps them to understand different cultures. The central area of Liu Xing Street is a multi-functional public space typical of traditional Uyghur residential areas. Since it has been transformed into a tourist attraction, additional functions related to tourism have been added. It has become a place not only for surrounding residents to relax and enjoy themselves on a daily basis but also a place that a large number of tourists can use.
According to the collected data, the number of users is highest in the afternoon, followed by the morning, and lowest at noon. In the afternoons, most users sat in public spaces, while many took walks or strolls in the mornings. Regardless of whether it was morning or afternoon, many users gathered in the first sub-area. They sat on benches or on the edge of the water feature, chatting with others, monitoring the children playing freely or just resting and doing nothing. Social interaction is particularly noticeable in the afternoon, with an increasing number of users and various activities taking place. Social interaction is one of the basic needs of users for public spaces, commonly taking place in a relaxed environment where visitors often gather together. Through positive interactions, visitors are more likely to develop social connections with strangers and individuals from different age groups and those from various cultural backgrounds, which leads to changes in their attitudes and perceptions of the living environment [31]. A study on the social needs of the elderly in public spaces indicates that the elderly have a greater need for social interaction [25]. However, although people from all age groups have access to the study site, the observation data show that the percentages of old people, children and teenagers are small. Based on the on-site investigation, one possible reason is that there are not sufficient facilities for them. Furthermore, as noted in other studies, when public spaces are transformed for tourists, the facilities and places for the locals’ daily activities may gradually disappear [1,28].
In addition, a sense of belonging is another basic need of users for public spaces. Characteristics of public spaces, such as architecture, water features, and vegetation, can affect their use. In particular, the unique elements in historical and cultural blocks can attract more visitors and encourage them to linger in public spaces [69]. These representative elements and events in public spaces can also enhance people’s sense of belonging and self-identity [31]. If a public space is constantly used by an increasing number of tourists, the sense of belonging is likely to be weakened [70]. It is challenging to clearly distinguish local residents from tourists by observation only. However, it is still important to consider whether the public spaces are consistently being used by local residents, especially those living in surrounding areas.

6. Conclusions

The central area of Liu Xing Street is a versatile public space that incorporates culture, entertainment, and tourism. It is also a place used daily by nearby residents and serves as one of the urban spaces where residents can engage with local culture. Overall, based on the number and diversity of activities, the public space in the central area of Liu Xing Street attracts many visitors to linger there. The openness, facilities and cultural activities are some of the main factors that can drive an increase in the number of people staying in the space. Although there are various types of activities across the whole study site, there are only a few high-frequency activities. This is mainly because of the limited spaces for activities and facilities, which cannot provide more opportunities for activities such as children’s play and sports activities. In addition, in terms of spatial distribution, the number and diversity of activities also show a concentrated distribution in a certain sub-area. For example, the first sub-area has the highest number and diversity of activities.
The main difference between workdays and weekends is not only the number of users but also the increase in certain activities, such as sports, which mainly occur on weekends. This also highlights the lack of adequate facilities and spaces available for children and teenagers. The morning and afternoon are the time periods when users are more frequent, especially in the afternoon. In terms of spatial distribution, only a few sub-areas have more users in the morning, with the number of users in all sub-areas increasing in the afternoon.
From the perspective of users, the entire study site has attracted people of different age groups and cultural backgrounds. There are more female users than male users, and the majority of users are adults, while other age groups occupy relatively small proportions. Similarly, the spatial distribution of users shows that there are more female users than male users in each sub-area, and the majority of them are adults. However, there is a slight difference in the second sub-area; that is, the number of female users is twice that of male users. More importantly, we found that male users are mainly distributed in those seating areas. Although the overall number of male users is lower than females, the number of male users who use the seating facilities is close to that of females. That is also a possible reason why there are fewer male users in the second sub-area. In contrast, in addition to the seating facilities, many female users were distributed near photographic facilities as well. Apart from that, we found that the majority of children are accompanied by adults rather than old people. Regarding the impact of site characteristics on users’ behaviour, we found that most high-frequency activities in each sub-area are related to the facilities. For example, seating facilities have the highest usage rate at 59.8%, and photo-taking facilities account for 38.2%. This implies that the facilities on the study site have a significant impact on users’ behaviour.
We also identified some possible issues in the current renovation process of this traditional residential area. The protection of traditional residential areas is particularly important, especially in contemporary cities filled with high-rise buildings. Traditional residential areas also contribute to the overall image of the city. It is worth considering that adding tourism facilities in such a traditional residential area may impact the daily lives of nearby residents. In addition, while it is necessary to have some decorative facilities to enhance the characteristics of public spaces, it is important to consider how to control the excessive impact of these on users’ behaviour, especially in such traditional residential areas. Therefore, there are some suggestions for the protection and renovation of public spaces in Liu Xing Street: (1) Conduct a post-use evaluation of the renovation of Liu Xing Street to assess its impact on local residents’ living quality; (2) Encourage local residents to participate in the renovation of public spaces in these traditional residential areas, to increase their level of satisfaction in meeting their needs.
It might be considered that a study such as this does not necessarily uncover original or unique insights that set the findings apart from other cities. However, in an era of evidence-based design, research such as this can be considered to be highly valuable in understanding how public spaces function and how to assess the success of different urban planning and landscape projects. This study demonstrates that because there are many culturally different urban areas around the world, each should be studied independently, and we should be wary of generalisations and adopting solutions from other places.

7. Limitations

Although this study has provided insights into the basic usage of public spaces in the central area of Liu Xing Street, it still has some limitations. Firstly, in terms of the observation process, due to the limited number of observers, it was not possible to select large or multiple areas for observation. Therefore, this study selected only the central area as the observation object and focused on the main public spaces, which excluded the surrounding streets. In future studies, the observation could be expanded to the surrounding public spaces, including streets and street corners, to explore the use of these traditional residential areas. Secondly, the collected data are still relatively limited, and no significant differences have been found in the use of public spaces among different ethnic groups, such as differences in activity preferences or time periods. Therefore, future studies could explore the correlation between people from different cultural backgrounds and their preferences in the use of public spaces. Finally, this study primarily explored the current use of public spaces from the overall perspectives of users but did not focus on a specific ethnic group. Therefore, future studies can also focus on a particular ethnic group to explore their preferences by combining their unique public spaces.

Author Contributions

Conceptualisation, D.D. and S.B.; Methodology, D.D. and S.B.; Formal analysis, D.D.; Investigation, D.D.; Writing—original draft, D.D.; Writing—review and editing, S.B.; Visualisation, D.D.; Supervision, S.B. All authors have read and agreed to the published version of the manuscript.

Funding

This research received no external funding.

Data Availability Statement

The data presented in this study are available on request from the corresponding author.

Acknowledgments

We would like to express our gratitude to Catharine Ward Thompson for her valuable discussions regarding the paper. We also would like to thank the editors and reviewers for their valuable comments and help with this paper.

Conflicts of Interest

The authors declare no conflict of interest.

References

  1. Gómez, E.; Alfonso, L. Residents’ opinions and perceptions of tourism development in the historic city of Toledo, Spain. Sustainability 2019, 11, 3854. [Google Scholar] [CrossRef]
  2. Chen, Z.; Yang, J.; Liu, X.; Guo, Z. Reinterpreting activity space in tourism by mapping tourist-resident interactions in populated cities. Tour. Recreat. Res. 2022, 49, 797–811. [Google Scholar] [CrossRef]
  3. Jover, J.; Díaz-Parra, I. Who is the city for? Overtourism, lifestyle migration and social sustainability. Tour. Geogr. 2020, 24, 9–32. [Google Scholar] [CrossRef]
  4. Page, S.J.; Duignan, M. Progress in Tourism Management: Is urban tourism a paradoxical research domain? Progress since 2011 and prospects for the future. Tour. Manag. 2023, 98, 104737. [Google Scholar] [CrossRef]
  5. Huang, W.-J.; Li, M.; He, J.; Chan, W.K. Conflicts and interactions in urban tourism: Use of urban public space by residents, tourists, and migrant domestic workers in Hong Kong. Tour. Manag. 2024, 105, 104960. [Google Scholar] [CrossRef]
  6. García-Hernández, M.; De la Calle-Vaquero, M.; Yubero, C. Cultural heritage and urban tourism: Historic city centres under pressure. Sustainability 2017, 9, 1346. [Google Scholar] [CrossRef]
  7. Wong, J.L. Culture, heritage and access to open spaces. In Open Space: People Space; Thompson, C.W., Travlou, P., Eds.; Taylor and Francis: London, UK, 2007; p. 45. [Google Scholar]
  8. Thompson, C.W. Urban open space in the 21st century. Landsc. Urban Plan. 2002, 60, 59–72. [Google Scholar] [CrossRef]
  9. Crouch, D.P. The historical development of urban open space. In Urban Open Spaces; Taylor, L., Ed.; Rizzoli: New York, NY, USA, 1981; pp. 7–8. [Google Scholar]
  10. Mehta, V. Evaluating public space. J. Urban Des. 2014, 19, 53–88. [Google Scholar] [CrossRef]
  11. Budner, W.W. The evaluation of the equipment and quality of the public space of Poznań. Real Estate Manag. Valuat. 2016, 24, 25–33. [Google Scholar] [CrossRef]
  12. Askari, A.H.; Soltani, S. Determinants of a successful public open space: The case of Dataran Merdeka in the city centre of Kuala Lumpur, Malaysia. Landsc. Res. 2018, 44, 162–173. [Google Scholar] [CrossRef]
  13. Carr, S.; Lynch, K. Open space: Freedom and control. In Urban Open Spaces; Taylor, L., Ed.; Rizzoli: New York, NY, USA, 1981; pp. 17–18. [Google Scholar]
  14. Madden, K. How To Turn A Place Around: A Placemaking Handbook; Project for Public Spaces: New York, NY, USA, 2018. [Google Scholar]
  15. Ramlee, M.; Omar, D.; Mohd Yunus, R.; Samadi, Z. Attributes of successful public spaces through users perception. Asian J. Qual. Life 2018, 3, 21–28. [Google Scholar] [CrossRef]
  16. Zhai, Y.; Li, D.; Wu, C.; Wu, H. Urban park facility use and intensity of seniors’ physical activity: An examination combining accelerometer and GPS tracking. Landsc. Urban Plan. 2021, 205, 103950. [Google Scholar] [CrossRef]
  17. Xie, C. Characteristics of Public Space Behavior and Demand of Rural Residents in Foshan. E3S Web Conf. 2021, 276, 02011. [Google Scholar] [CrossRef]
  18. Bahriny, F.; Bell, S. Patterns of urban park use and Their relationship to factors of quality: A case study of Tehran, Iran. Sustainability 2020, 12, 1560. [Google Scholar] [CrossRef]
  19. Chen, Y.; Liu, T.; Liu, W. Increasing the use of large-scale public open spaces: A case study of the North Central Axis Square in Shenzhen, China. Habitat Int. 2016, 53, 66–77. [Google Scholar] [CrossRef]
  20. Li, Z.; Liu, Q.; Zhang, Y.; Yan, K.; Yan, Y.; Xu, P. Characteristics of Urban Parks in Chengdu and Their Relation to Public Behaviour and Preferences. Sustainability 2022, 14, 6761. [Google Scholar] [CrossRef]
  21. Heft, H. Perceptual information of “an entirely different order”: The “cultural environment” in the senses considered as perceptual systems. Ecol. Psychol. 2017, 29, 122–145. [Google Scholar] [CrossRef]
  22. Lima, M.F.; Thompson, C.W.; Aspinall, P.; Bell, S. Communities facing urban depopulation: Exploring people’s environmental preferences. A case study of Lisbon, Portugal. Cities Health 2020, 6, 288–308. [Google Scholar] [CrossRef]
  23. Petrunoff, N.A.; Yi, N.X.; Dickens, B.; Sia, A.; Koo, J.; Cook, A.R.; Lin, W.H.; Lu, Y.; Hsing, A.W.; Dam, R.M.v.; et al. Associations of park access, park use and physical activity in parks with wellbeing in an Asian urban environment: A cross-sectional study. Int. J. Behav. Nutr. Phys. Act. 2021, 18, 87. [Google Scholar] [CrossRef]
  24. Zhang, L.; Cao, H.; Han, R. Residents’ Preferences and Perceptions toward Green Open Spaces in an Urban Area. Sustainability 2021, 13, 1558. [Google Scholar] [CrossRef]
  25. Yung, E.H.K.; Conejos, S.; Chan, E.H.W. Social needs of the elderly and active aging in public open spaces in urban renewal. Cities 2016, 52, 114–122. [Google Scholar] [CrossRef]
  26. Cao, Y.; Tang, X. Evaluating the effectiveness of community public open space renewal: A case study of the Ruijin community, Shanghai. Land 2022, 11, 476. [Google Scholar] [CrossRef]
  27. Cao, J.; Kang, J. Social relationships and patterns of use in urban public spaces in China and the United Kingdom. Cities 2019, 93, 188–196. [Google Scholar] [CrossRef]
  28. Song, H.; Shim, C. Comparing resident and tourist perceptions of an urban park: A latent profile analysis of perceived place value. J. Sustain. Tour. 2021, 29, 1180–1192. [Google Scholar] [CrossRef]
  29. Zhu, X.; Chiou, S. A study on the sustainable development of historic district landscapes based on place attachment among tourists: A case study of Taiping Old Street, Taiwan. Sustainability 2022, 14, 1755. [Google Scholar] [CrossRef]
  30. Kristianova, K.; Jaszczak, A. Historical Centers of Small Cities in Slovakia—Problems and Potentials of Creating Livable Public Spaces. IOP Conf. Ser. Mater. Sci. Eng. 2020, 960, 022012. [Google Scholar] [CrossRef]
  31. Alwah, A.A.Q.; Li, W.; Alwah, M.A.Q.; Shahrah, S. Developing a quantitative tool to measure the extent to which public spaces meet user needs. Urban For. Urban Green. 2021, 62, 127152. [Google Scholar] [CrossRef]
  32. Carr, S.; Francis, M.; Rivlin, L.G.; Stone, A.M. Public Space; Cambridge University Press: Cambridge, MA, USA, 1992. [Google Scholar]
  33. Merylova, I.; Smilka, V.; Kovalska, G. Public spaces in historic environment as urban fundamentals of sustainable development. IOP Conf. Ser. Earth Environ. Sci. 2023, 1275, 012026. [Google Scholar] [CrossRef]
  34. Liu, B.; Liu, J.; Cheng, T.; Wang, T.; He, Q. The theory and practice of urban renewal in China. China Anc. City 2021, 35, 1–10. [Google Scholar] [CrossRef]
  35. Gu, C.; Liu, J. Urban Sociology; Tsinghua University Press: Beijing, China, 2013. [Google Scholar]
  36. Chen, M. Research on the progress of Chinese urban renewal in the last decade. In Proceedings of the Urban Planning Annual Conference, Chongqing, China, 19 October 2019. [Google Scholar]
  37. Zhang, F.; Liu, Q.; Zhou, X. Vitality Evaluation of Public Spaces in Historical and Cultural Blocks Based on Multi-Source Data, a Case Study of Suzhou Changmen. Sustainability 2022, 14, 4040. [Google Scholar] [CrossRef]
  38. Jiaerken, M. Investigation of the renewal and development path of Liu Xing Street within the context of cultural tourism integration. Tour. Overv. 2024, 4, 77–79. [Google Scholar]
  39. Zhao, S. Research on the Protection and Innovative Application of Water Landscape in Yili Traditional Historical and Cultural Blocks—Taking Liuxing Street as an Example; Shihezi University: Shihezi, China, 2024. [Google Scholar]
  40. Su, F.; Teng, S.; Molake, A.; Liu, F. The application of regional architectural culture in the renewal design of Liuxing Street in Yining City. Huazhong Archit. 2023, 41, 104–107. [Google Scholar] [CrossRef]
  41. Zhang, W.; Xue, S.; Hou, M. “Harmony in Diversity”: Study on the strategies of embedding new buildings in the historic districts—A case of the section on the west side of Worker’s Street on Liuxing Street in Yining. Urban. Archit. 2022, 13, 19–23. [Google Scholar] [CrossRef]
  42. Huang, D. Research on the Production of Tourism Space in Historical and Cultural Block: A Case Study of Liuxing Street in Yining City; Xinjiang University of Finance & Economics: Urumqi, China, 2022. [Google Scholar]
  43. Dilimulati, N. Study on Block Protection and Micro Renewal: A Case Study of Liuxingstreet, Yining City, Xinjiang; Xinjiang University: Urumqi, China, 2020. [Google Scholar]
  44. Lin, J. Research on the Protection Division of Liuxing Street in Yili City from the Perspective of Place; Southwest University of Science and Technology: Mianyang, China, 2018. [Google Scholar]
  45. Koens, K.; Postma, A.; Papp, B. Is overtourism overused? Understanding the impact of tourism in a city context. Sustainability 2018, 10, 4384. [Google Scholar] [CrossRef]
  46. Zhang, L. Dialysis on the Multicultural Connotation of Xinjiang Traditional Ethnic Constructs—From the Ethnic Constructs to See the Exchange Between the Ethnic Relations; Xinjiang University: Urumqi, China, 2008. [Google Scholar]
  47. Reheman, A.; Ma, D. A Brief History of Uygur Culture; Xinjiang Remin Press: Urumqi, China, 2010. [Google Scholar]
  48. Yu, S. The Diversity of Xinjiang; China Intercontinental Press: Beijing, China, 2014. [Google Scholar]
  49. Qu, S. Research on the Protection and Renewal of Ayidun Historical District in Yining City; Chongqing University: Chongqing, China, 2017. [Google Scholar]
  50. Huang, K. The Regional Research of Vernacular Architecture in Xinjiang, Yili; Southwest University of Science and Technology: Mianyang, China, 2017. [Google Scholar]
  51. Chen, Z. Xinjiang Traditional Dwellings; China Architecture & Building Press: Beijing, China, 2009. [Google Scholar]
  52. Dilixiati, D. Analysis of the modelling and decoration of traditional Uygur dwellings doors and windows in Yili, Xinjiang—Taking Xinlu street residence in Yining city as an example. Design 2018, 23, 49–51. [Google Scholar]
  53. Fu, L. Investigation and exploration of the elite in the Liuxing Street tourist community in Yili. Tour. Overv. 2023, 17, 13–17. [Google Scholar]
  54. Zhang, W.; Hu, J. Syntactic analysis of historical and cultural neighbourhoods in Yining City—Taking Six Star Street as an example. J. Xinjiang Norm. Univ. (Nat. Sci. Ed.) 2024, 43, 43–51. [Google Scholar] [CrossRef]
  55. Marušić, B.G.n.; Marušić, D. Behavioural maps and GIS in place evaluation and design. In Application of Geographic Information Systems; IntechOpen: London, UK, 2012. [Google Scholar] [CrossRef]
  56. Thompson, C.W.; Aspinall, P.; Bell, S. Innovative Approaches to Researching Landscape and Health: Open Space: People Space 2; Routledge: London, UK, 2010. [Google Scholar]
  57. Moore, R.C.; Cosco, N.G. Using behaviour mapping to investigate healthy outdoor environments for children and families. In Innovative Approaches to Researching Landscape and Health; Routledge: London, UK, 2010; pp. 55–96. [Google Scholar]
  58. Sun, Z.; Bell, S.; Scott, I.; Qian, J. Everyday use of urban street spaces: The spatio-temporal relations between pedestrians and street vendors: A case study in Yuncheng, China. Landsc. Res. 2019, 45, 292–309. [Google Scholar] [CrossRef]
  59. Dahlkvist, E.; Engström, M.; Nilsson, A. Residents’ use and perceptions of residential care facility gardens: A behaviour mapping and conversation study. Int. J. Older People Nurs. 2020, 15, e12283. [Google Scholar] [CrossRef]
  60. Bell, S.; Fleming, L.E.; Grellier, J.; Kuhlmann, F.; Nieuwenhuijsen, M.J.; White, M.P. Urban Blue Spaces Planning and Design for Water, Health and Well-Being; Routledge: New York, NY, USA, 2021. [Google Scholar]
  61. Vassiljev, P. BlueHealth Behaviour Assessment Tool: A Protocol for Acquiring Data from Participant Site Observation. 2020. Available online: https://bluehealth2020.eu/wp/wp-content/uploads/2020/06/BlueHealth-Behaviour-Assessment-Tool-data-acquisition-protocol.pdf (accessed on 1 May 2025).
  62. Bell, S.; Vassiljev, P.; Wilczynska, A. BlueHealth Behaviour Assessment Tool: A Guidebook for Analysing Data from Participant Site Observations. 2020. Available online: https://bluehealth2020.eu/wp/wp-content/uploads/2020/06/BlueHealth-Behaviour-Assessment-Tool-analysis-guidebook.pdf (accessed on 1 May 2025).
  63. Goličnik, B.; Thompson, C.W. Emerging relationships between design and use of urban park spaces. Landsc. Urban Plan. 2010, 94, 38–53. [Google Scholar] [CrossRef]
  64. China Population Census Yearbook 2020; China Statistics Press: Beijing, China, 2020.
  65. Talbot, J.F.; Kapla, R. Judging the sizes of urban open areas: Is bigger always better? Landsc. J. 1986, 5, 83–92. [Google Scholar] [CrossRef]
  66. Thiel, P. People, Paths and Purposes: Notations for Participatory Envirotecture; Seattle University of Washington Press: Washington, DC, USA, 1996. [Google Scholar]
  67. Gehl, J. Cities for People; Island Press: Washington, DC, USA, 2013. [Google Scholar]
  68. Gehl, J. Life Between Buildings; Island Press: Washington, DC, USA, 2011. [Google Scholar]
  69. Kaczyńska, M. Warsaw small and medium-sized public urban green spaces as a response to short-time leisure needs of local residents and passers-by. Leis. Stud. 2024, 28, 1–6. [Google Scholar] [CrossRef]
  70. Li, Z.; Li, Z.; Ma, J. Exploring Design Interventions to Enhance Intergenerational Sharing: An Importance–Performance Analysis of Public Spaces in Changsha, China. Sustainability 2024, 16, 1228. [Google Scholar] [CrossRef]
  71. Li, Z.; Xie, C.; Lu, H.; Che, S. Rational planning of public open space by exploring the effects of environmental factors on human recreation—A case study in Shanghai, China. Appl. Ecol. Environ. Res. 2019, 17, 1247–1260. [Google Scholar] [CrossRef]
  72. Ghavampour, E.; Aguila, M.D.; Vale, B. GIS mapping and analysis of behaviour in small urban public spaces. Area 2017, 49, 349–358. [Google Scholar] [CrossRef]
  73. McCormack, G.R.; Rock, M.; Toohey, A.M.; Hignell, D. Characteristics of urban parks associated with park use and physical activity: A review of qualitative research. Health Place 2010, 16, 712–726. [Google Scholar] [CrossRef] [PubMed]
  74. Chen, Y.; Liu, T.; Xie, X.; Marušić, B.G. What attracts people to visit community open spaces? A case study of the Overseas Chinese Town Community in Shenzhen, China. Int. J. Environ. Res. Public Health 2016, 13, 644. [Google Scholar] [CrossRef]
  75. Mostofa, R.A.; Bonotulshi, D.; Guaralda, M. ‘GenUrban: Shaping cities for all genders’—Right to the city planning framework, Hong Kong. Cities 2024, 150, 105081. [Google Scholar] [CrossRef]
Figure 1. Location maps of the study site. The left map shows the location of Liu Xing Street in the city, and the right map shows the plan of Liu Xing Street. Source: The authors.
Land 14 01041 g001
Figure 2. Study site and its primary facilities. Source: The authors.
Land 14 01041 g002
Figure 3. Main characteristics of the study site and the spatial distribution of all observed users. Source: The authors.
Land 14 01041 g003
Figure 4. The number of primary activity types in each sub-area over a five-day observation period. Source: The authors.
Land 14 01041 g004
Figure 5. The percentages of primary activities in each sub-area over a five-day observation. Source: The authors.
Land 14 01041 g005
Figure 6. (a) The percentages of male and female users observed; (b) the percentages of different age groups. Source: The authors.
Land 14 01041 g006
Figure 7. The number of male and female users observed in each sub-area during a five-day observation. Source: The authors.
Land 14 01041 g007
Figure 8. The spatial distribution of female users in each sub-area. Source: The authors.
Land 14 01041 g008
Figure 9. The spatial distribution of male users in each sub-area. Source: The authors.
Land 14 01041 g009
Figure 10. The spatial distribution of users from different age groups. Source: The authors.
Land 14 01041 g010
Figure 11. The number of different social contexts of users observed in each sub-area. Source: The authors.
Land 14 01041 g011
Figure 12. The spatial distribution of activities related to seating facilities. Source: The authors.
Land 14 01041 g012
Table 1. Number of people involved in the observed activities.
Primary ActivitiesGenderAgeAll%
FemaleMaleChildTeenAdultSenior
Sitting429416265258618184527.7
Crouching17926171260.9
Lying down13 4 40.1
Standing56829115816966785928.1
Walking/strolling502364429262111186628.4
Walking with a child63172 5721802.6
Walking a dog84 111120.4
Using a wheelchair910 136190.6
Pushing a stroller154 154190.6
Street sweeping144 18 180.6
(Child) playing freely8683168 1 1695.5
(Child) playing on equipment7310 100.3
Playing on a swing86914 140.5
(Child) riding a scooter257 70.2
Riding a baby trike213 30.1
Roller skating314 40.1
Riding a bike1625 70.2
Playing football 77 70.2
Playing badminton134 40.1
Dancing562224702782.6
Skipping rope1 1 10.0
Total1793125930324121143943052100.0
Table 2. Photos of each sub-area.
DescriptionsPhotos of Each Sub-Area
Sub-area 1: Due to the equal division of the hexagons, the area of each sub-area is similar, approximately 3000 m2 in area. Benches, bronze statues, pavilions, etc., are the main facilities of this area. The open space here provides opportunities for various activities, such as public square dancing and children playing football. Older people often sit on benches to enjoy the sunshine, while younger people sit at the edge of the water feature to watch their children playing freely.Land 14 01041 i001
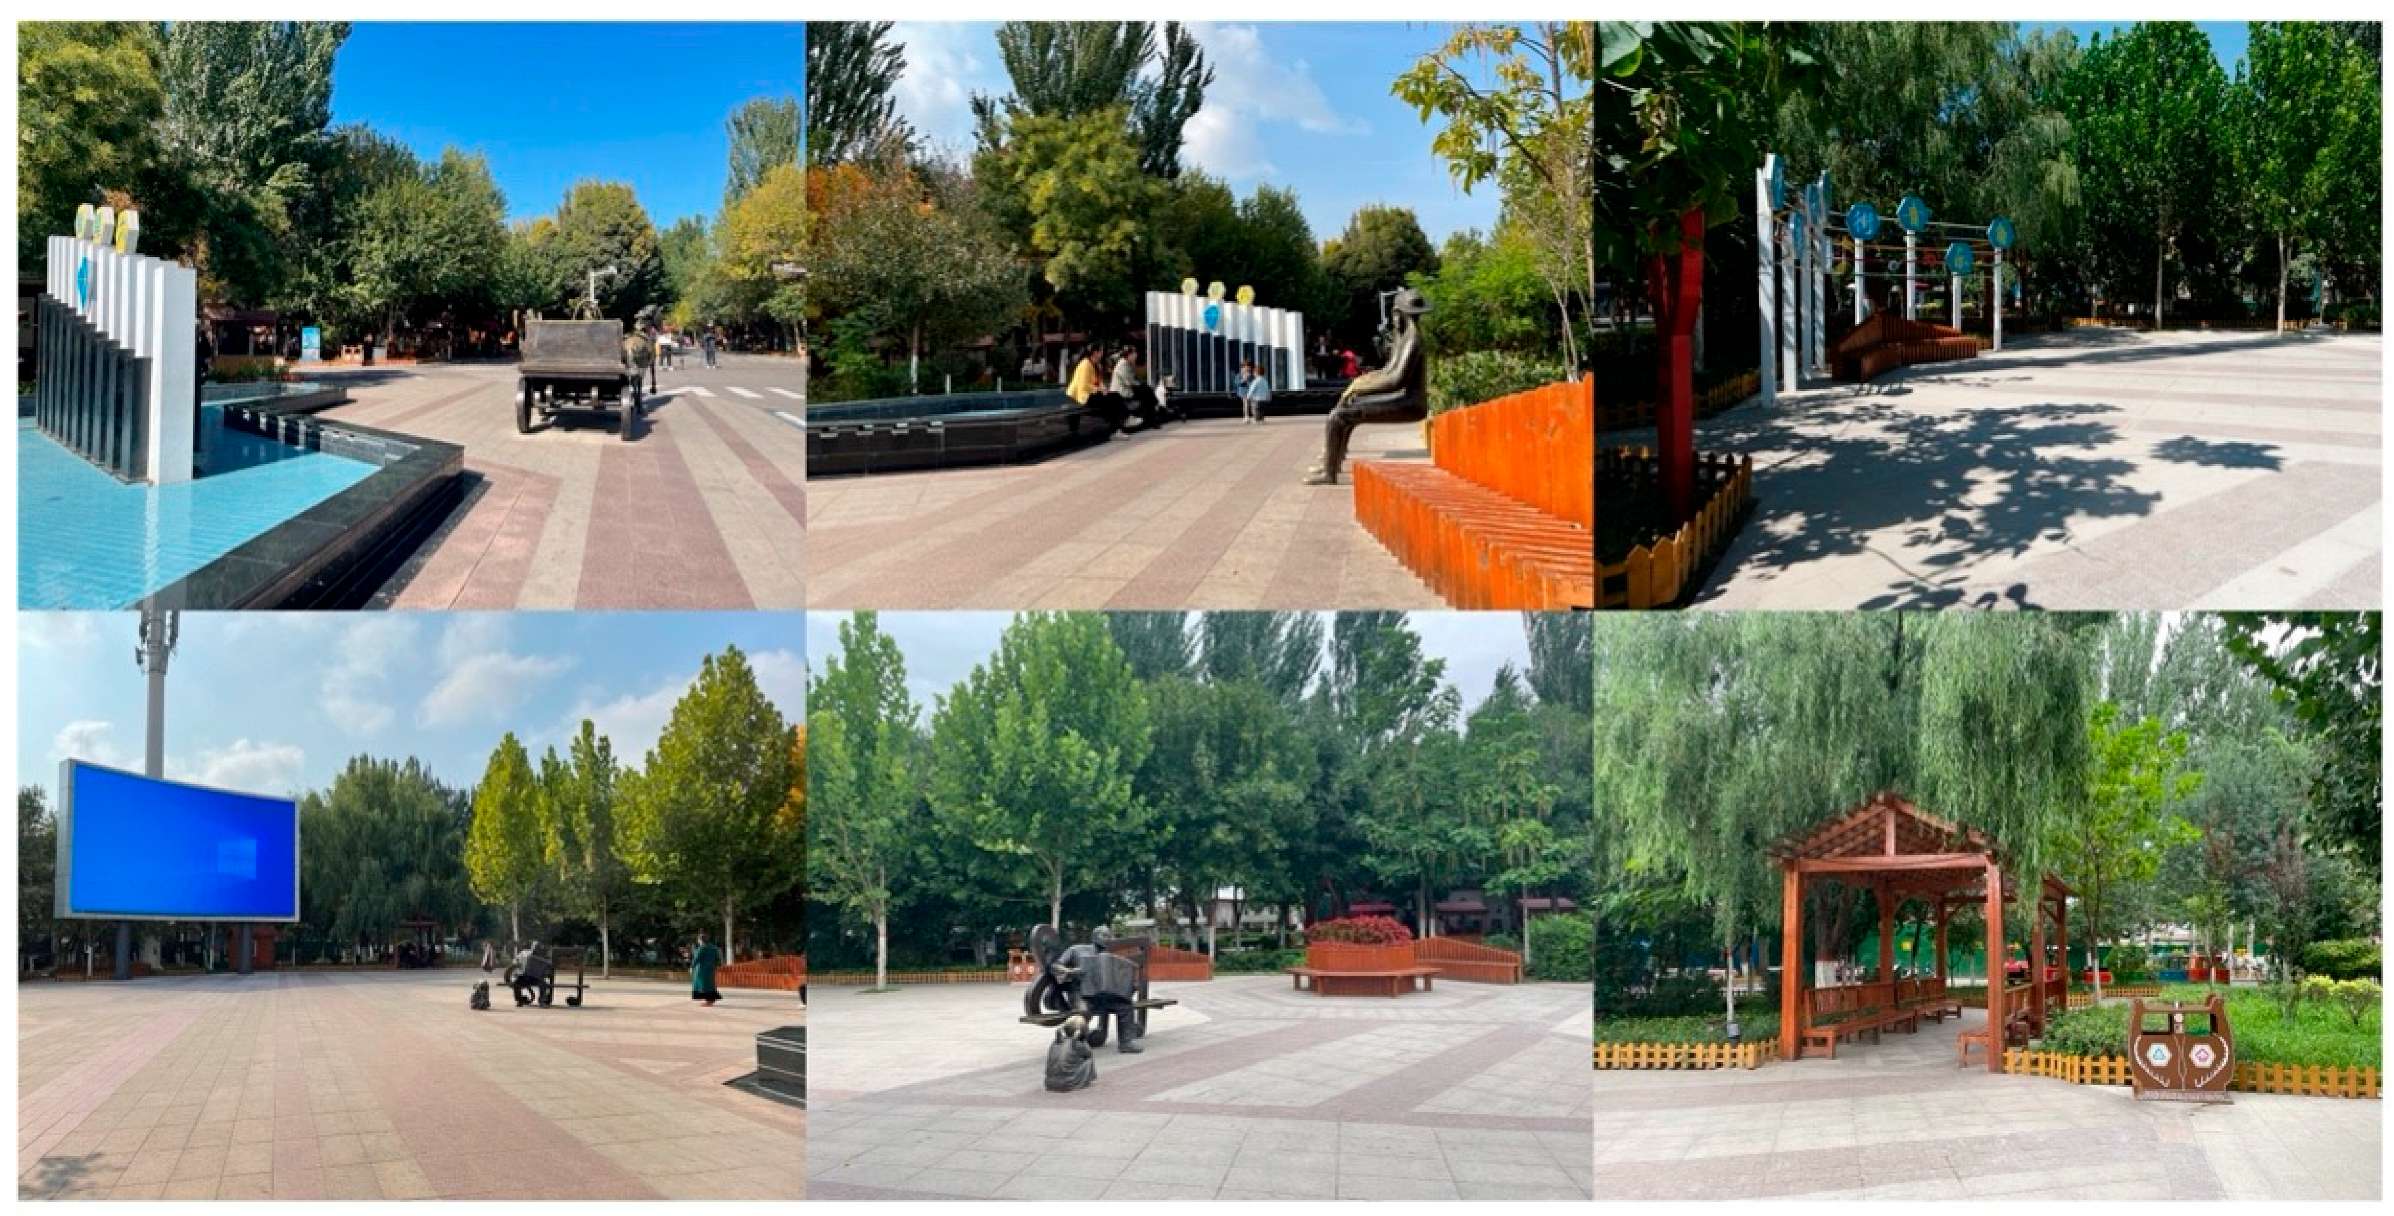
Sub-area 2: This area is surrounded by shops that sell local specialties. Many people often stop to take photos with decorative ornaments, especially parents with their children, or sit in the pavilion to rest.Land 14 01041 i002
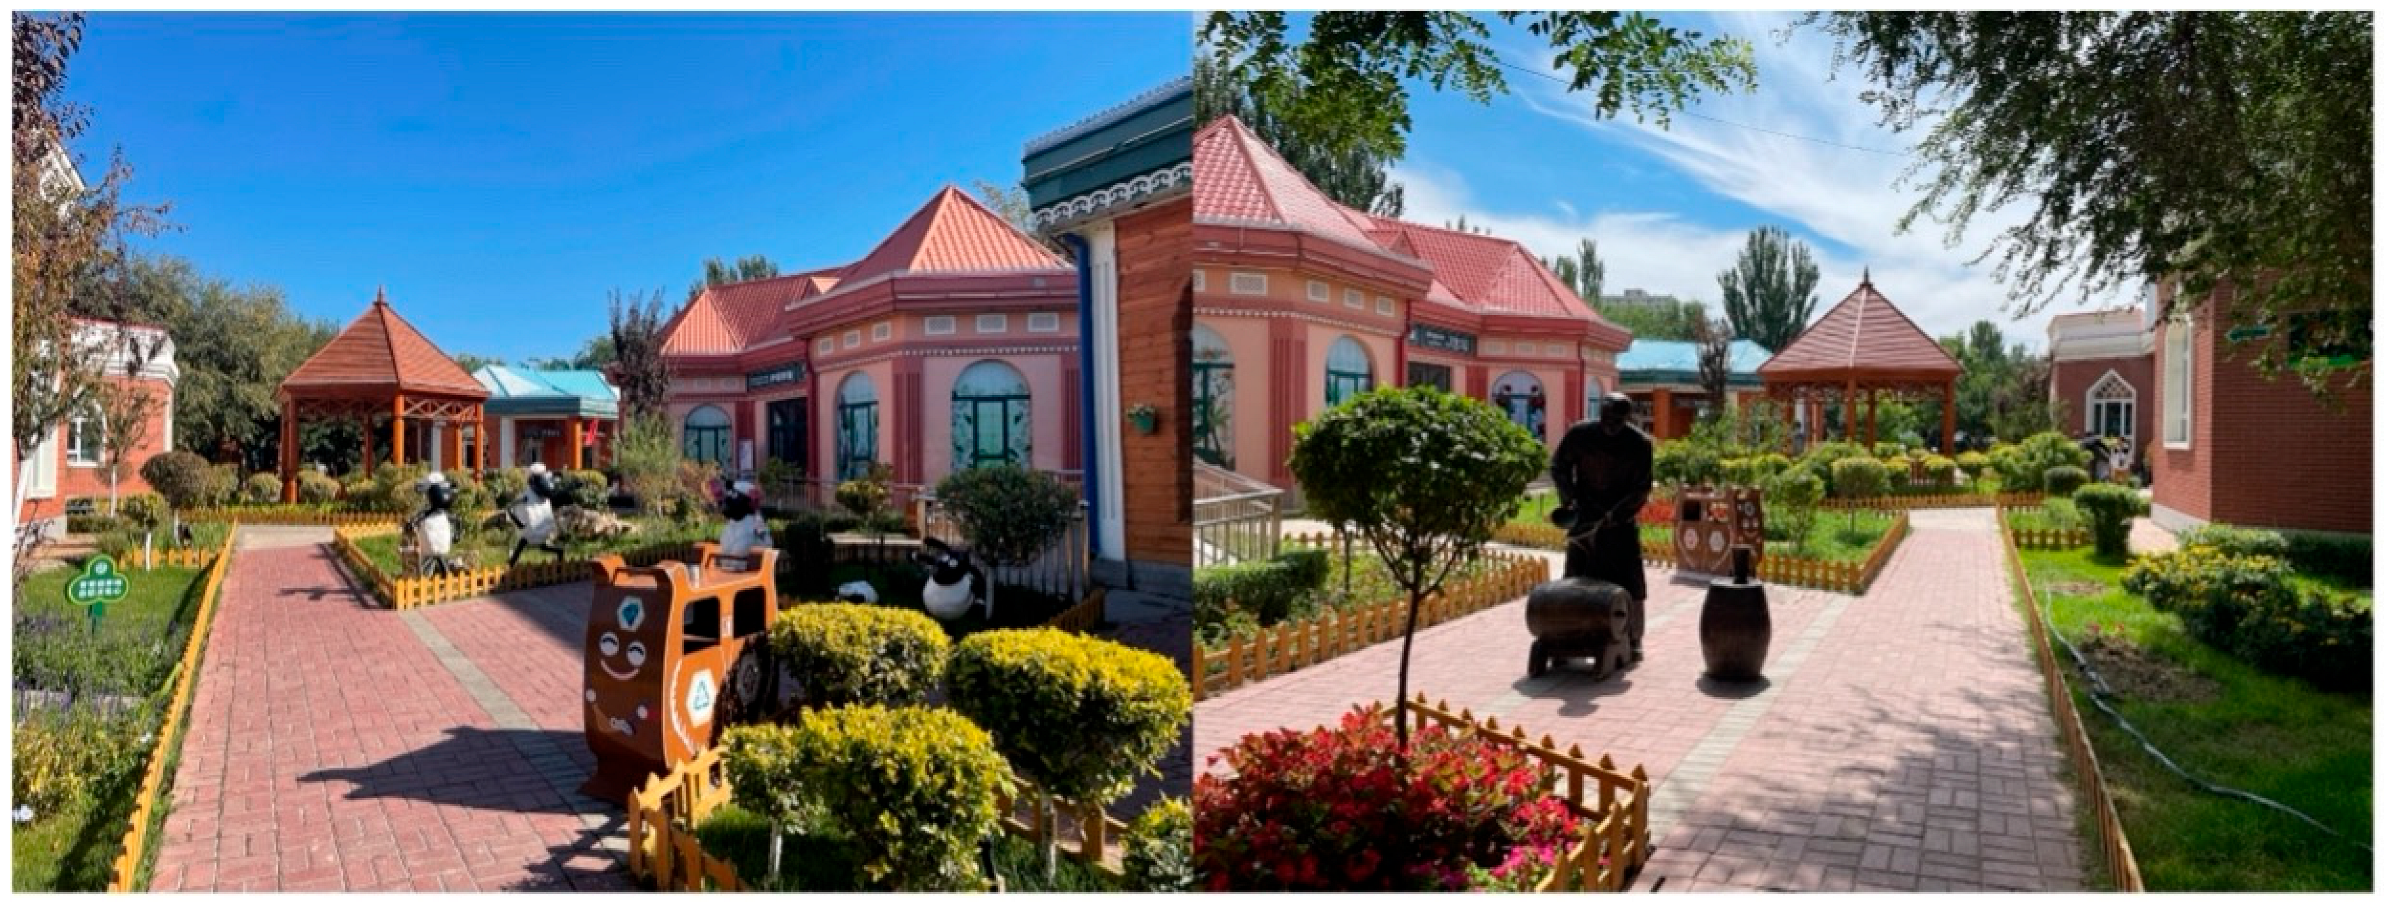
Sub-area 3: The architecture in this sub-area exhibits the typical features of Uyghur traditional houses in the city of Yining. In addition to the Russian-style architecture, the garden filled with beautiful flowers is an important part of traditional Uyghur houses. Similarly, this sub-area is filled with various flowers that attract many visitors, especially during spring and summer. Furthermore, during the tourist season, there are sometimes some short folk song and dance performances that attract visitors to stop and watch.Land 14 01041 i003
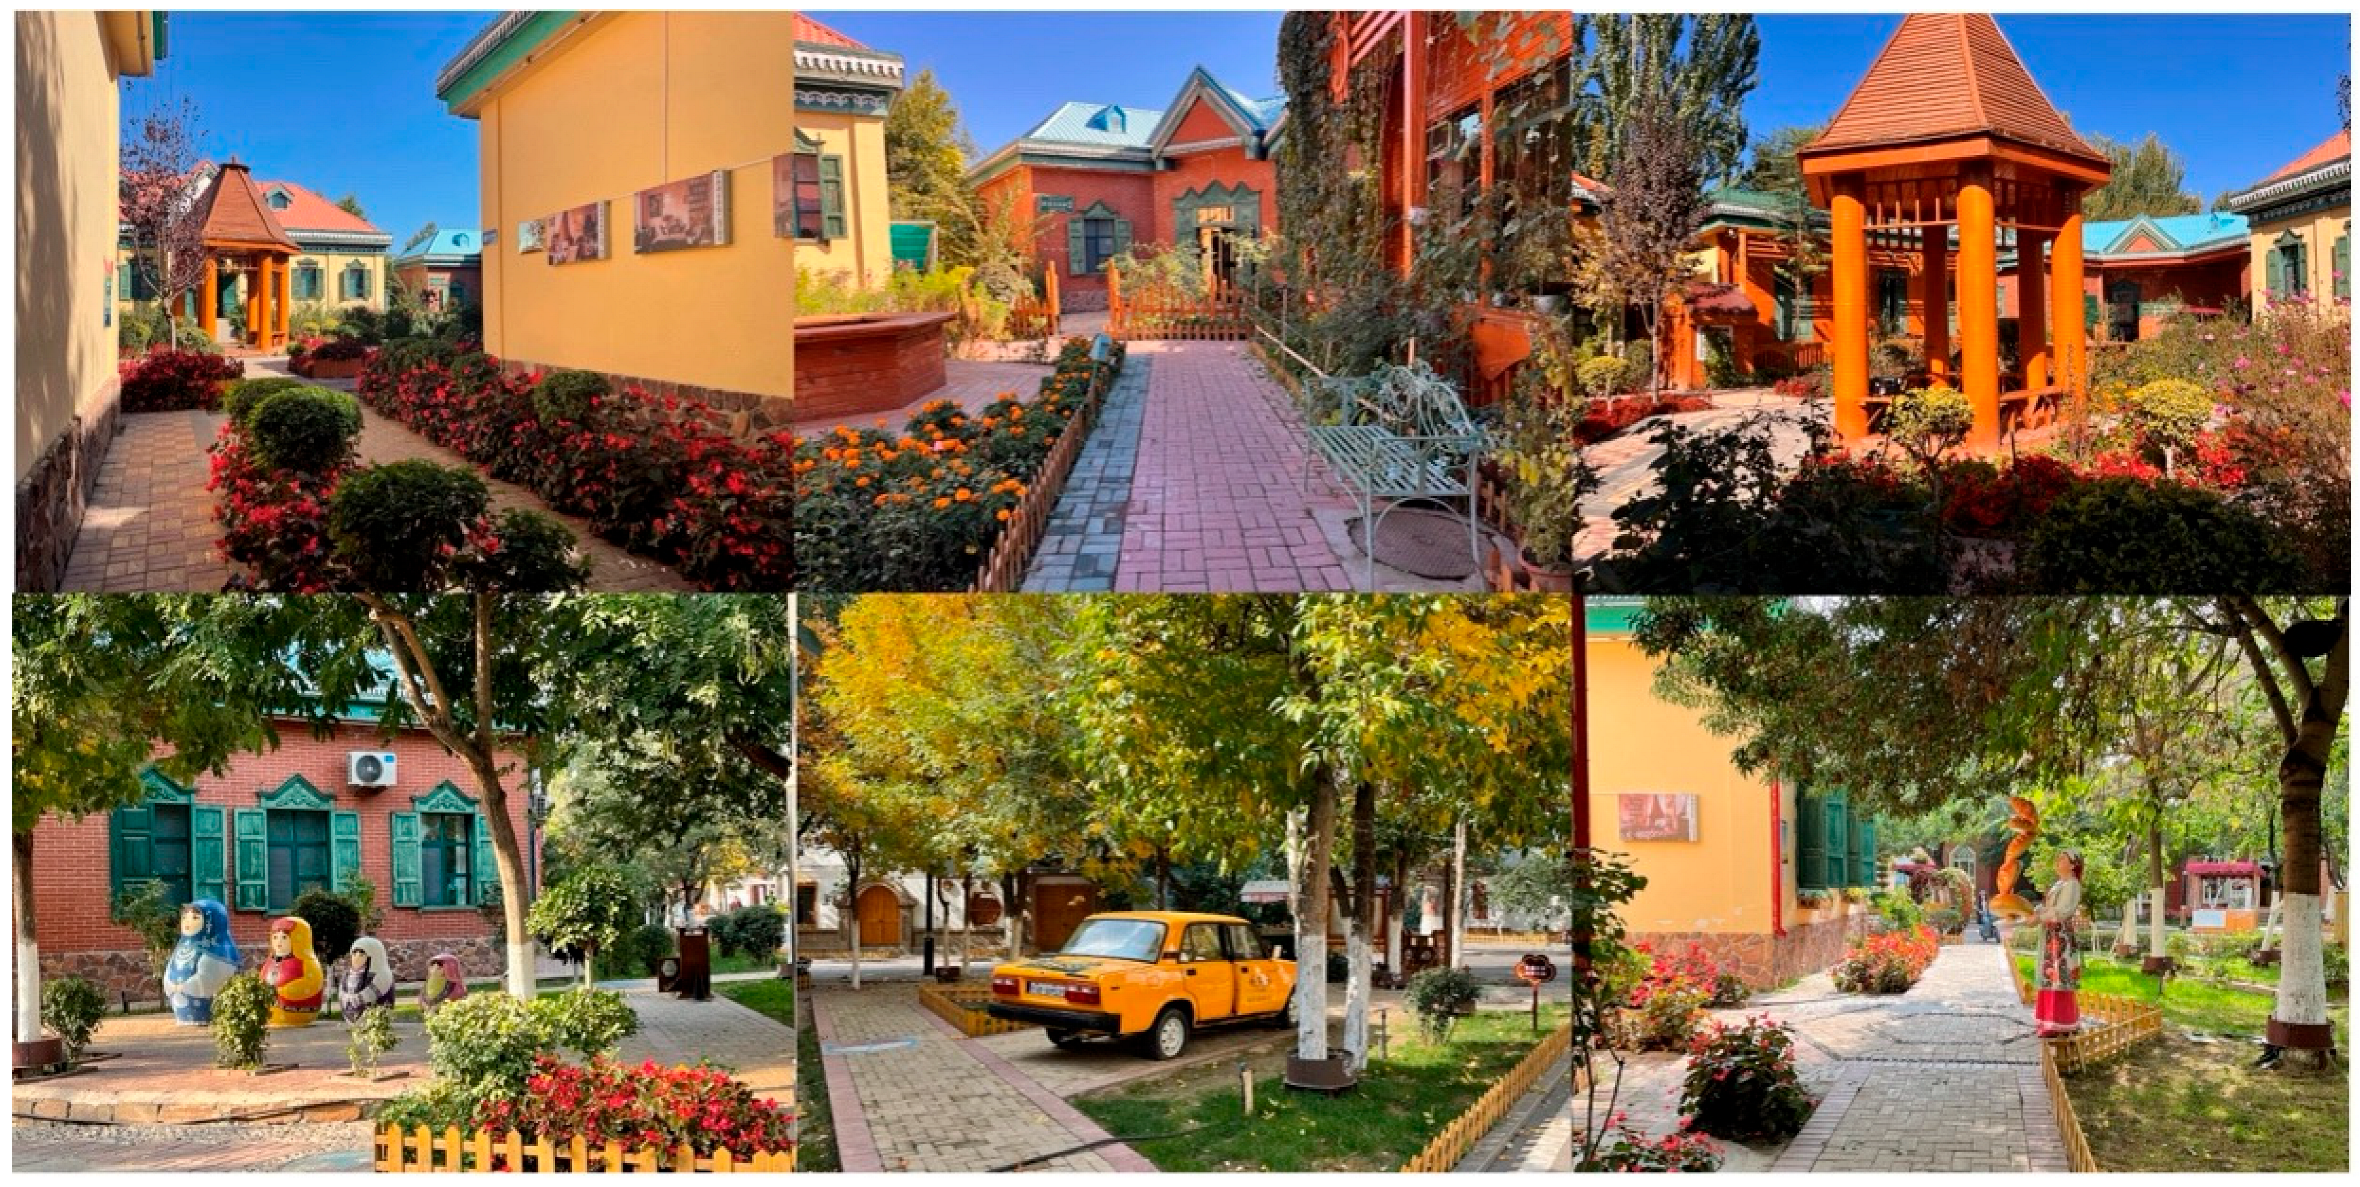
Sub-area 4: This sub-area has the least number of users and types of activities among all the sub-areas as there is limited space and facilities. Tables and chairs are temporarily provided by the nearby shops. People often stop here to sit and rest.Land 14 01041 i004
Sub-area 5: The mosque and public toilet are the main buildings in this sub-area. Since the mosque gate was closed during the observation period, only the surrounding areas were observed, and the front area of the public toilet was excluded. Tall trees provide plenty of shade in this area, making it one of the favourable spots for resting, especially in summer. In addition, a piano and an old car serve as decorative elements to enrich the space.Land 14 01041 i005
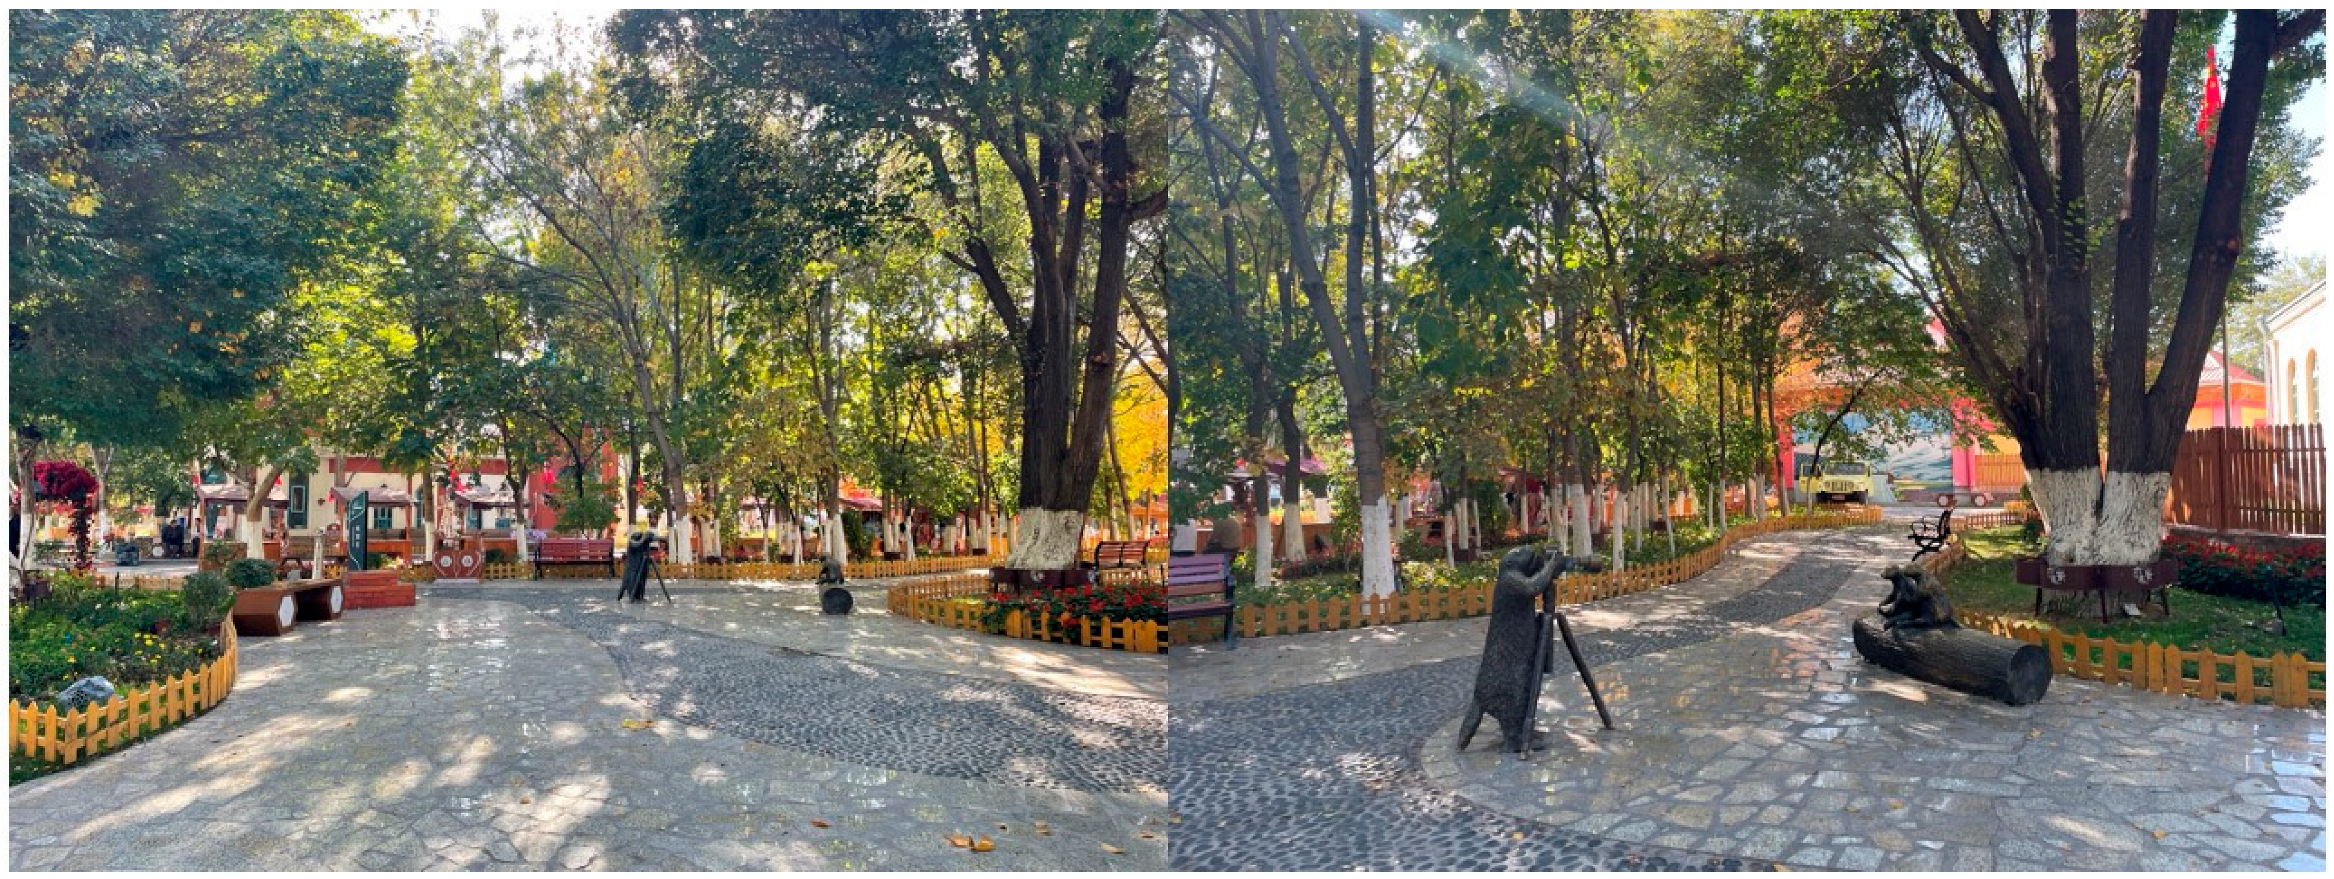
Sub-area 6: Although this sub-area provides some tables and chairs, very few people use them. In contrast, people prefer to sit on the benches along the streets, which offer a good view. As a result, this sub-area has become a place for a brief rest.Land 14 01041 i006
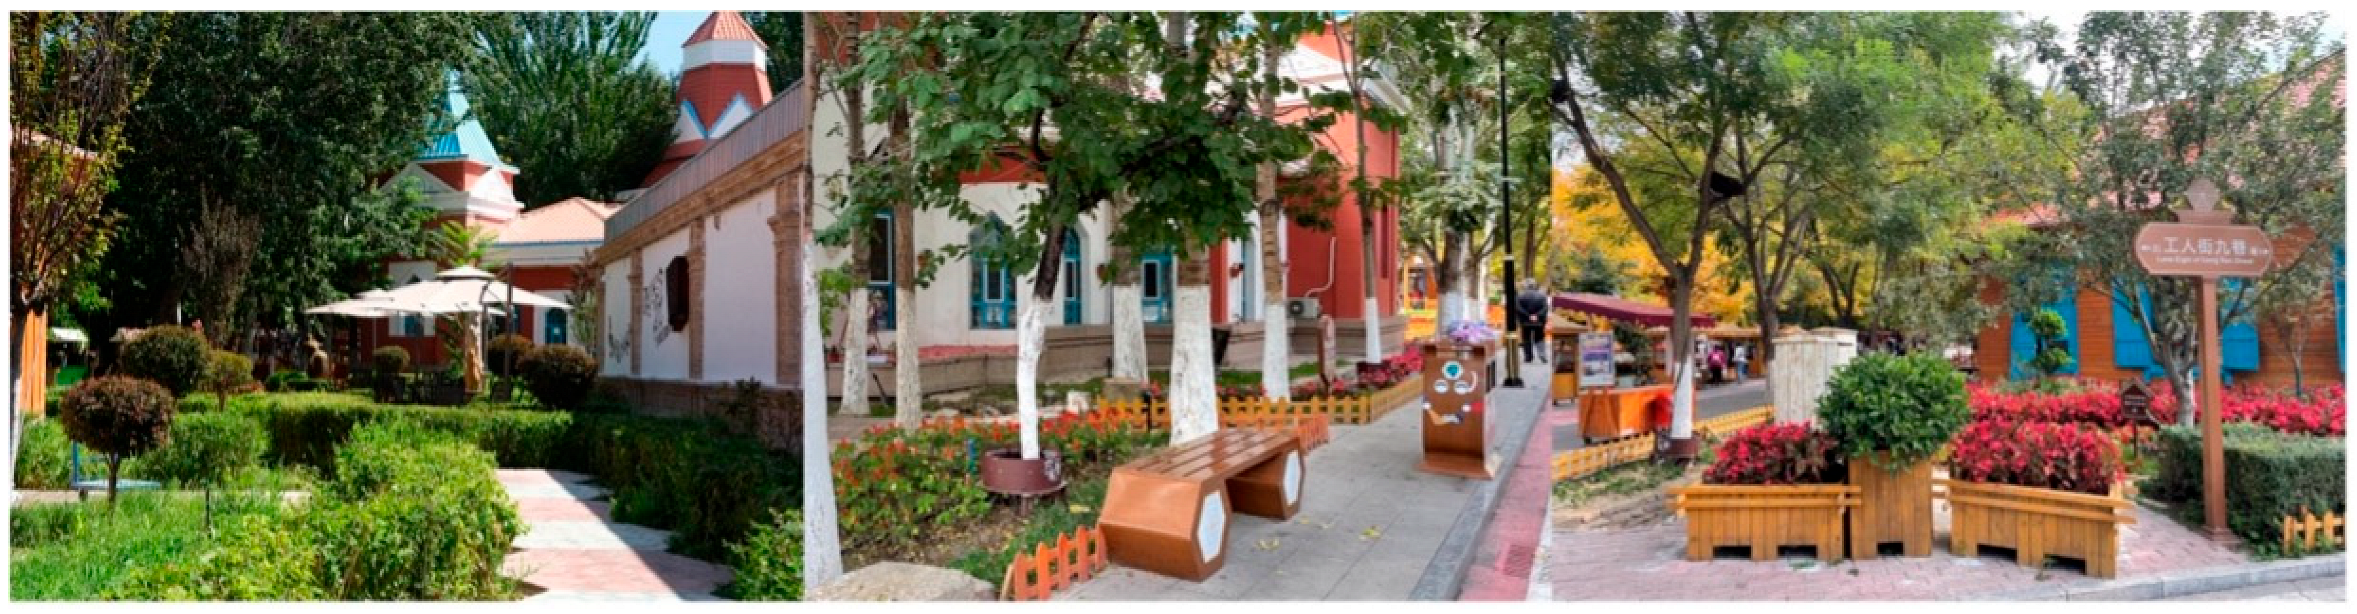
Disclaimer/Publisher’s Note: The statements, opinions and data contained in all publications are solely those of the individual author(s) and contributor(s) and not of MDPI and/or the editor(s). MDPI and/or the editor(s) disclaim responsibility for any injury to people or property resulting from any ideas, methods, instructions or products referred to in the content.

