Article

Multimodal Data-Driven Visual Sensitivity Assessment and Planning Response Strategies for Streetscapes in Historic Districts: A Case Study of Anshandao, Tianjin

by
Ya-Nan Fang
1,
Aihemaiti Namaiti
2,*,
Shaoqiang Zhang
3 and
Tianjia Feng
4
1
College of Fine Arts & Design, Tianjin Normal University, Tianjin 300387, China
2
School of Architecture, Tianjin University, Tianjin 300072, China
3
College of Computer and Information Engineering, Tianjin Normal University, Tianjin 300387, China
4
Tianjin Urban Planning and Design Institute Co., Ltd., Tianjin 300190, China
*
Author to whom correspondence should be addressed.
Land 2025, 14(5), 1036; https://doi.org/10.3390/land14051036
Submission received: 2 April 2025 / Revised: 4 May 2025 / Accepted: 7 May 2025 / Published: 9 May 2025

Abstract

:
The landscape visual sensitivity (LVS) assessment is recognized as a critical tool for identifying areas most sensitive to landscape changes and for informing multi-resource optimization and allocation strategies. However, conventional large-scale LVS assessment criteria and methodologies developed for natural landscapes do not satisfy the precision-oriented assessment requirements of streetscape visual sensitivity (SVS) in historic districts, nor do they facilitate the operational linkage between assessment outcomes and planning applications. This study proposes an innovative SVS–PAP assessment methodology, which is a systematic integration of the SVS assessment and public esthetic perception (PAP) evaluation. The SVS assessment criteria framework was first improved through the integration of enriched multi-modal datasets. Subjective weights were obtained via the analytic hierarchy process (AHP), incorporating expert and public judgments, while objective weights were derived through the entropy weight method (EWM) based on data information entropy. The integration of both approaches enhances the methodological rigor and scientific validity of SVS weight determination. An SVS–PAP analytical matrix was subsequently constructed through integration of SVS assessments and PAP-based scenic beauty estimation (SBE), enabling the derivation of planning strategies. An empirical validation conducted in Anshandao Historic District yielded four key findings: (1) The SVS–PAP methodology, which integrates subjective–objective evaluation factors and incorporates broad public participation, demonstrates strong scientific validity and reliability, establishing a novel paradigm for SVS assessment and strategic planning; (2) The technical framework—leveraging multi-modal data and GIS spatial analysis techniques—improves assessment precision, operability, and replicability; (3) The planning and management strategies formulated by the SVS–PAP analytical matrix were verified as reasonable, demonstrating effective planning-transition capability; (4) Notably, historical and cultural influences showed significantly higher weighting coefficients across assessment criteria compared to non-historic streetscape assessments. Overall, these research results address the persistent undervaluation of the esthetic and spiritual values of historic landscapes in multi-resource value trade-off and decision-making processes, demonstrating both theoretical and practical significance through a systematic methodological advancement.

1. Introduction

In this later stage of urbanization, nations worldwide face the challenge of alleviating human–land system coupling imbalance through sustainable development goals. A widening supply–demand gap now exists between high-level human spiritual/esthetic demands and low-quality cultural ecosystem services in urban visual landscapes [1]. This urban challenge stems largely from the persistent neglect of landscape spiritual/esthetic values during rapid urbanization, particularly when weighed against quantifiable economic and ecological factors [2,3]. Consequently, the establishment of scientifically robust and operationally feasible visual landscape assessment frameworks has been recognized as a critical priority for enhancing urban spatial visual quality through integrating them into multi-resource decision systems. Meanwhile, persistent materialist space-planning ideologies have homogenized expert-driven urban landscapes, eroding cultural continuity [4]. In this context, there is an urgent need to safeguard historical/cultural heritage through urban stock renewal processes, while reinforcing policies and expanding public participation.
Urban heritage has been acknowledged as a critical nexus connecting urban past, present, and future. Both tangible and intangible urban heritage are invaluable assets with the potential to drive social cohesion and urban revitalization [5]. Urban conservation has remained a central focus in urban planning, landscape architecture, and related disciplines since the French Revolution [6]. Protecting urban heritage has been identified as a pivotal issue for sustainable urban development [7]. Internationally, normative instruments including conventions, recommendations, and charters have been established by UNESCO, ICOMOS, and other global organizations for Historic Urban Landscape (HUL) conservation [8,9]. In China, a series of HUL conservation laws, technical standards, and supportive policies have been systematically implemented by governmental and planning authorities across administrative levels [7,10,11,12,13]. These documents demonstrate multi-scale coordination from national to local governance and planning sectors. This progression marks the initial establishment of China’s HUL conservation framework, structured in three tiers: “historic cities, historic conservation areas, and officially protected monuments and sites” [7]. Overall, the evidence confirms that the symbiotic integration of conservation and development as the core philosophy of HUL has gained universal recognition.
Significant progress in global HUL conservation has been made through sustained efforts. However, persistent disconnections exist between existing HUL visual resource assessment outcomes and the operational continuum spanning planning strategy formulation to implementation. This operational gap is primarily attributed to the mismatches between basic spatial units and evaluation objectives, where improperly scaled units (either oversized or undersized) fail to enable effective planning transformation of assessment outcomes. Concurrently, HUL environments are characterized as complex mega-systems in which limited social resources cannot be simultaneously allocated to all historical landscape conservation and renewal demands at urban or district scales. Historical landscapes at varied spatial locations are distinguished by unique biophysical and historical-cultural attributes. Consequently, prioritizing conservation-renewal actions has been identified as a key procedural requirement in historical landscape management [8]. Regional-scale natural landscape evaluations have conventionally addressed such prioritization challenges through integration of landscape visual sensitivity (LVS) into comprehensive visual assessment frameworks [14,15,16], given LVS’s capacity to quantify environmental responsiveness and public attention levels across zones. This approach facilitates identifying visual landscape renewal priorities and guides planning and management decisions. However, traditional regional-scale LVS criteria and methodologies have proven inadequate for assessing sensitivity in human-scale historical landscapes.
Within historic urban landscape systems, historic streets serve as crucial spatial carriers integrating historical-cultural, natural, and artistic characteristics and functions as the optimal perceptual scale for public HUL engagement. Empirical evidence has demonstrated that the reliability of public visual perception assessments and their influence on planning strategy formulation decrease proportionally with spatial scale expansion. Landscape visual resources in historic streets are classified as shared natural and cultural heritage that require collective stewardship [17]. Consequently, it is necessary to maximize the exemplary role of historic streets in preserving and enhancing visual landscape quality during conservation planning processes. This approach has been proven to be essential for shaping high-quality spatial environments that meet contemporary spiritual demands, facilitate urban spatial gene transmission, and promote harmonious human–land relationships [17]. However, internationally, current conservation systems predominantly employ regional or district-scale spatial units for LVS assessments, with only occasional inclusion of officially protected monuments and sites. Although streetscape visual assessment studies have exhibited marked quantitative growth in recent years, their application remains notably underdeveloped within HUL conservation frameworks.
To address these methodological gaps, a novel streetscape visual sensitivity (SVS) assessment framework has been developed with higher scientific rigor, precision, and operability. The proposed methodology ultimately aims to address the persistent neglect of esthetic and spiritual values in historic landscape visual resources during the process of multi-resource trade-off analyses and decision-making, while establishing scientifically grounded decision-support frameworks for targeted social resource allocation and systematically integrating SVS assessments with subsequent conservation planning and management systems. This integrative approach is critical for advancing urban high-quality development goals and realizing human–environment symbiosis visions. Three strategic pathways have been formulated: (1) A scientifically rigorous SVS evaluation framework has been constructed through systematic coupling of subjective and objective influencing factors; (2) The specificity of assessment criteria for landscape typologies and their adaptability to street scales have been systematically enhanced, and street-level human-centric criteria have been quantitatively enriched, by fully utilizing high-precision multi-modal data to improve assessment accuracy; (3) Theoretical and methodological innovations have been proposed using integrated public esthetic perception (PAP) assessments to assist SVS-driven HUL planning integration mechanisms.
The study features three innovations: First, it integrates public perception evaluation factors to build a theoretical framework combining subjective perception and objective physical features, enhancing the scientific validity of the streetscape assessment. Second, the SVS–PAP assessment methodology establishes a novel paradigm for addressing future uncertainties in planning and ensuring systematic coordination between SVS assessment outcomes and subsequent planning implementation. Third, it improves the precision and operability of SVS and PAP assessments based on multimodal data and GIS technology.
Building upon these research advancements, the scientific validity, reliability, and operability of the SVS–PAP methodology have been empirically validated through its implementation in Tianjin’s Anshandao Historic District (hereafter Anshandao). Tianjin, a pivotal treaty port city in modern China renowned for its fusion of Chinese and Western cultures, holds the honorary title of “China’s Modern Century, Captured in Tianjin”. It was designated a National Historic-Cultural City in 1986 and contains 14 officially recognized historic conservation areas. Anshandao, as one of such protected districts, not only encapsulates a century of China’s modern historical evolution but also represents invaluable cultural heritage shaped by the convergence of Eastern and Western cultures. Furthermore, Anshandao’s conservation policies have consistently adhered to the “symbiotic co-evolution between conservation and development” planning paradigm, with municipal authorities prioritizing its transformation into an experiential historic district featuring modern-era architectural heritage. However, numerous historic structures have exhibited significant deterioration due to prolonged maintenance neglect, while incompatible visual elements have increasingly compromised the district’s historical integrity. Consequently, Anshandao has been identified as a critical priority within Tianjin’s historic conservation system that requires urgent intervention. This case study demonstrates the theoretical and practical significance of conducting human-scale SVS assessments that are informed by public perspectives. This research provides transferable insights for implementing more prudent, refined, and adaptive conservation planning frameworks in historic districts.

2. Literature Review

2.1. Landscape Visual Quality Assessment

The 1960s witnessed the emergence of the environmental movement in the United States, which subsequently triggered global attention towards the sustainable development of human–nature relationships [18]. Concurrently, as basic survival needs were met, the pursuit of higher-quality living standards commenced. Following the enactment of legislation in the United States and Britain to protect valuable visual esthetic resources, the previously overlooked significance of landscape visual resources received legal recognition [19,20]. To prioritize conservation targets and methodologies, the quantification of landscape visual quality and the establishment of standardized evaluation criteria for assessing resource significance emerged as critical challenges in the field.
Landscape visual quality (LVQ), commonly referred to as “visual (quality) assessment” or “visual landscape esthetic assessment”, is defined as methodologies and tools for describing and evaluating landscape esthetic attributes [21]. Its central objective is to assign artistic value to scenic beauty, thereby providing decision-making foundations for subsequent conservation and esthetic enhancement initiatives in planning and management [22]. A review and analysis of existing LVQ assessments reveals that landscape esthetic assessment has attracted interdisciplinary interest since the 1960s, involving professionals from forestry, geography, landscape architecture, psychology, and environmental studies. Each discipline has contributed distinct methodologies, frameworks, and theoretical approaches, resulting in fragmented research outputs due to the absence of a unified theoretical framework. Early quantification and assessment of esthetics—a subject rooted in human subjective perception—were challenged by skepticism owing to insufficient theoretical foundations and scientific evaluation methods [23,24,25]. Subsequent legislative developments in Western nations [17,19,26], combined with advancements in landscape planning practices and growing academic engagement [14,20,27,28], propelled LVQ assessment research into an established discipline supported by an extensive literature base [25,29,30,31].
The theoretical frameworks of these studies are derived from interdisciplinary integrations, encompassing classical esthetics [32], ecology linked to landscape preferences [33], biological evolutionary theories [25,34], and psychological perception studies [35]. Existing theoretical frameworks have been classified into four paradigmatic categories—the expert paradigm, psychophysical paradigm, cognitive paradigm, and experiential paradigm—reflecting varying assumptions about “Landscape”, “Perception”, and their interrelationships [36]. These four paradigms have been established as key theoretical foundations and classification frameworks, providing robust foundational support for subsequent interdisciplinary theoretical integrations and applied research requiring evidence-based theoretical underpinnings.
The psychophysical assessment methodology is based on the interaction between landscape biophysical characteristics and human perceptual responses. Its theoretical foundation originates from the “stimulus–response” hypothesis in psychophysics, which posits landscapes as co-created products of biophysical characteristics and perceptual processes, where public esthetic perceptions are triggered by biophysical stimuli. This stimulus–response functional relationship has been empirically confirmed through psychophysical experimentation [36,37,38]. Widely regarded as the most suitable evaluation approach due to its enhanced scientific validity and operational feasibility, the methodology has gained prominence. The scenic beauty estimation (SBE) method, as a representative psychophysical approach, has been extensively utilized in landscape esthetic quality assessments [22,37,39]. While SBE-derived metrics remain unaffected by assessment criteria or subjective scoring, public perception data require systematic preprocessing prior to comparative analysis to minimize subjective variability. A standardized calculation procedure proposed by Daniel and Boster in 1976 has been adopted to normalize evaluator discrepancies and accentuate inter-landscape relativities [31].

2.2. Landscape Visual Sensitivity Assessment

To objectively assess how human activities affect visual quality, Litton (1974) first proposed visual vulnerability. This concept measures a landscape’s resilience and sensitivity to human-made and natural disturbances [40,41]. Building on this, our study develops streetscape visual sensitivity (SVS), focusing on historic districts’ susceptibility to urban development impacts [42]. SVS assessment pinpoints areas prone to visual changes [43]. It reflects two key aspects: a landscape’s tolerance to disruptions [44] and its visual prominence [45]. Higher SVS indicates greater visibility and responsiveness to disturbances [46]. Such areas demand priority conservation measures.
Since the 1980s, LVS assessment has established a relatively stable paradigm (Table A1 in Appendix A). Analysis of existing research reveals four dominant characteristics in LVS studies. First, in terms of scale and typology, most LVS assessments target large-scale natural landscapes [43,44,47]. Human-scale streetscapes demand finer granularity, which coarse large-scale LVS classifications cannot satisfy. Although human-centric historic districts have recently emerged as a research focus [42], such studies remain limited in quantity. Second, limited progress exists in criterion innovation. Despite multimodal data proving superior to unimodal data in urban planning and emotion recognition [48,49,50], advancements remain constrained. Multimodal data-driven frameworks enable comprehensive and accurate description, understanding, and prediction of the research object [51]. However, most LVS assessments still prioritize visibility criteria, relying on traditional DEM-derived parameters like relative slope and relative distance [52,53,54]. Third, in methodologies, dominant techniques include GIS-based multi-criteria evaluation (MCE) [15], analytic hierarchy processes (AHPs) [15], conjunctive–disjunctive methods [42,52], and SBE [55]. However, criterion weighting remains overly dependent on subjective expert judgments, lacking objective integration. Fourth, in planning applications, most studies interpret results qualitatively through professional expertise, with few employing matrix approaches or spatial overlays to derive management strategies [15,56,57,58].
Notably, recent advancements embed LVS into multidimensional frameworks [59,60], expanding its applications beyond visual quality. For example, studies have integrated LVS with ecological sensitivity and cultural sensitivity of landscapes to conduct comprehensive assessments of landscape sensitivity [61,62,63]. Additionally, research has constructed a multi-sensory evaluation framework combining visual and auditory dimensions by overlaying LVS, SBE, and soundscape satisfaction assessments [55].
In summary, with the collaborative efforts of scholars and governments, LVS assessment has established a research foundation and practical experience that can provide valuable theoretical and methodological references for in-depth studies of SVS in historic districts. However, current SVS assessment studies still require further refinement in terms of assessment criteria, methodological frameworks, and the practical application of assessment outcomes in planning.

2.3. Analytic Hierarchy Process and Entropy Weight Method

The analytic hierarchy process (AHP) was developed by Saaty (1980) [64]. This methodology has been recognized as a multi-criteria decision-making tool and has been extensively applied across decision-related disciplines [65]. In urban planning and design contexts, AHP has been systematically employed for prioritizing and ranking assessment criteria [66]. Typical implementations include weight determination for visual sensitivity and visual absorption capacity criteria in river basin forest landscapes by Dong et al. (2022) [15], and cultural heritage landscape visual perception factor-weighting by Kou et al. (2024) [58]. Critical analysis of planning-focused applications has revealed that subjective criterion weights have been primarily based on expert judgments, with public participation largely absent.
Information entropy was proposed by Shannon (1948) as a measure of uncertainty [67]. This concept has been recognized as a universal metric in statistical physics, transcending traditional disciplinary boundaries [46]. In information theory, entropy is defined as a measure of system disorder, while information is regarded as a measure of system order. The application of entropy to urban spatial analysis was pioneered by Batty (1974) and further developed through studies employing entropy calculations to validate urban spatial evolution and emergent structural patterns [4,68,69]. Since entropy values are determined solely by the informational content of each criterion, they inherently eliminate subjective human bias. Lower entropy values are associated with higher data dispersion, which conveys more information and thus is assigned greater weights. Conversely, higher entropy values result in reduced weights. Criteria with uniform data distributions are excluded because they provide no meaningful information [70]. Therefore, entropy-based weight calculation has been established as a reliable method. The entropy weight method (EWM), grounded in information entropy theory, has been extensively validated as an objective weighting approach across multidisciplinary evaluation systems, with its methodological reliability and operational efficiency empirically confirmed [71,72,73]. However, applications of EWM—whether applied independently or integrated with AHP’s subjective weighting framework—remain notably underrepresented in historic district SVS assessments.

2.4. Importance–Performance Analysis Method

The rational allocation of limited resources in historic district renewal requires priority identification of critical conflict zones, followed by phased, scenario-specific planning strategies. Among prioritization methods, the importance–performance analysis (IPA) proposed by Martilla and James (1977) [74] has been widely adopted for its ability to visualize stakeholder priorities through a two-dimensional matrix. Originally applied in marketing to map consumer satisfaction against attribute importance, IPA generates actionable insights via four quadrants, driving strategy formulation [75,76,77,78]. Its simplicity and interpretability have led to recent applications in historic district conservation [54,58,79].

3. Study Area and Data Preparation
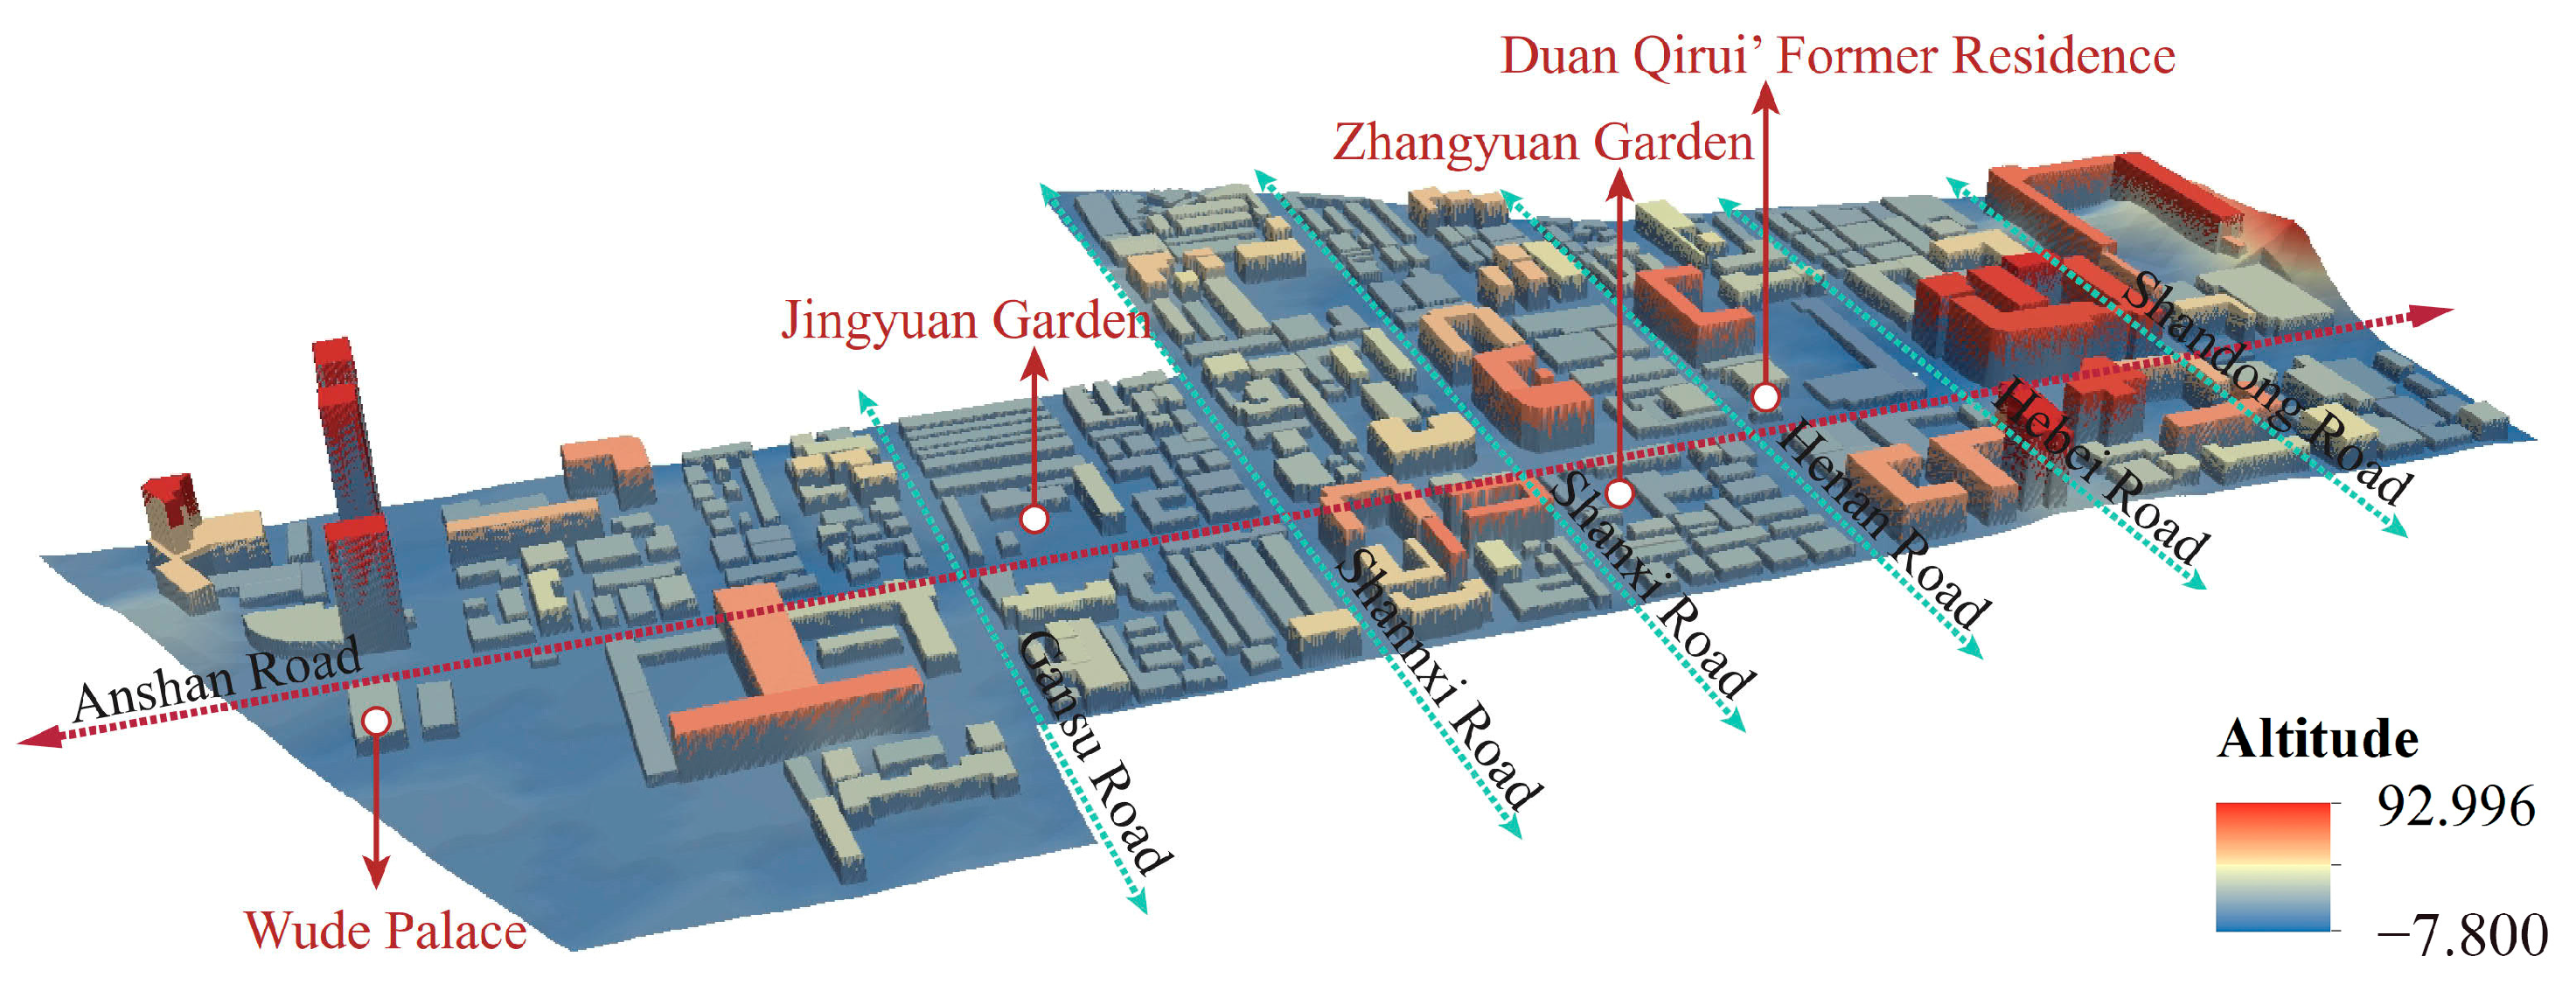
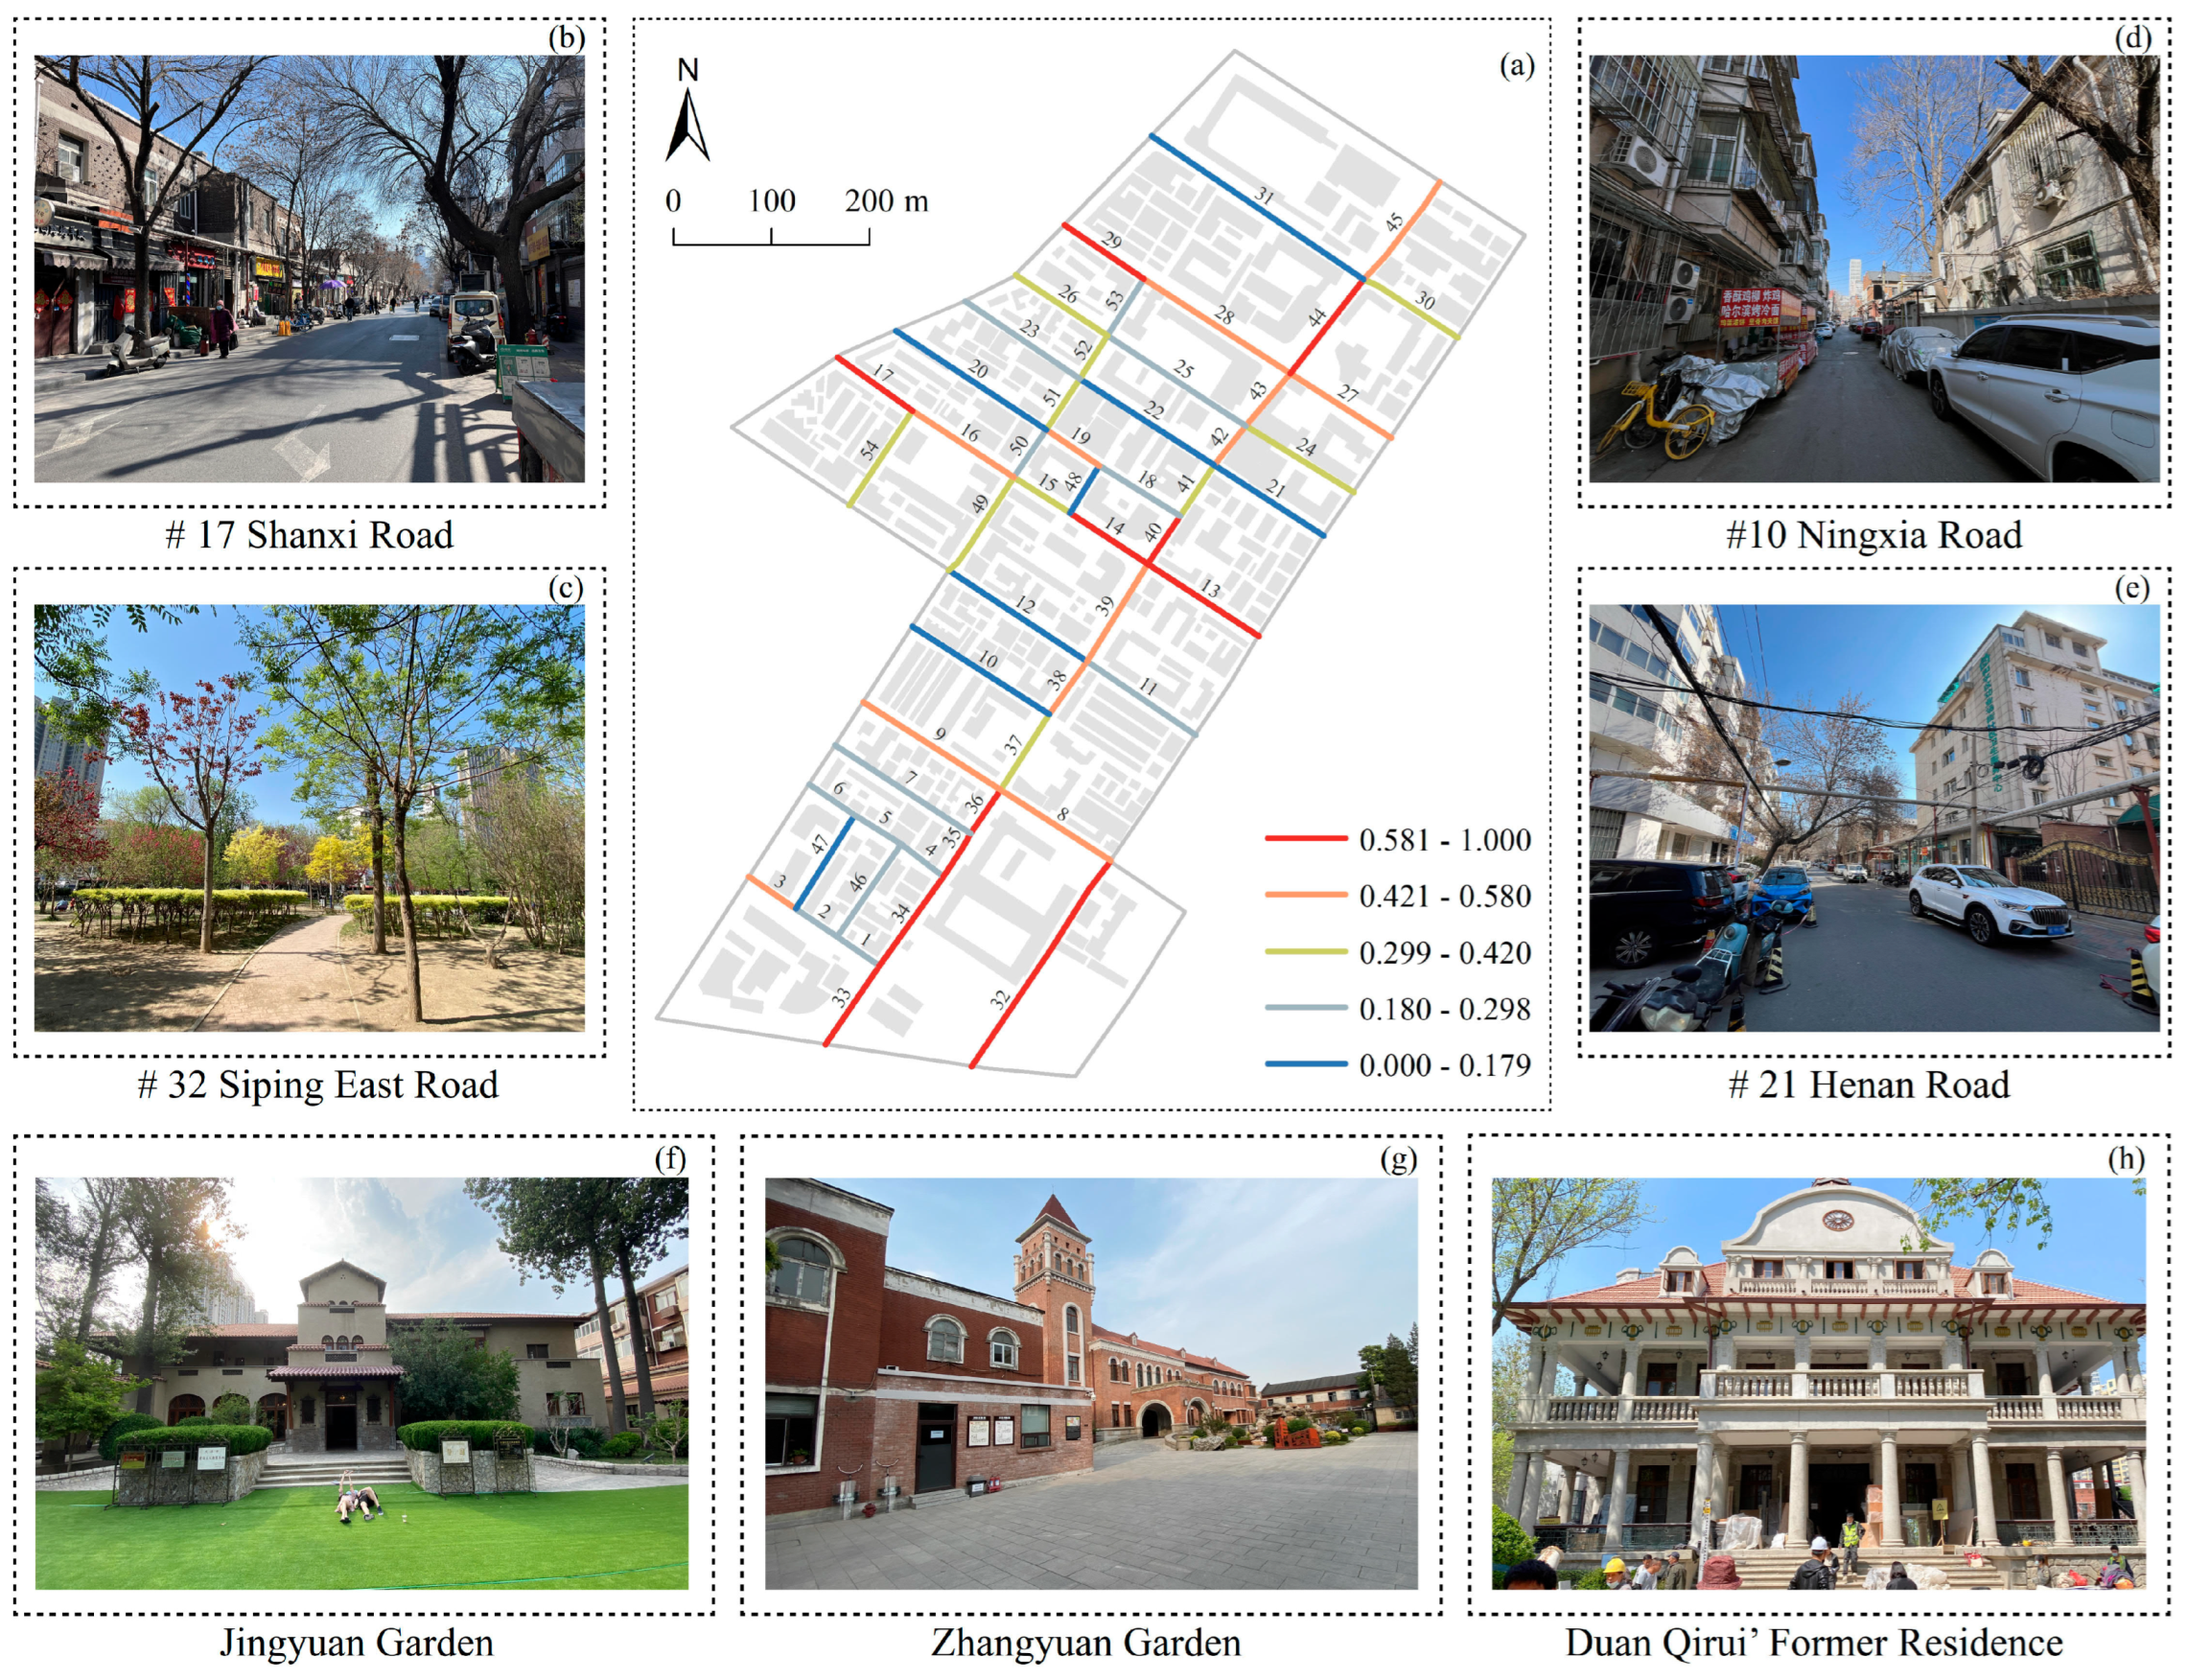
3.1. Study Area

Anshandao is situated within Heping District, Tianjin, covering an area of 40.79 hectares (Figure 1). Known for its “narrow streets and dense road networks”, Anshandao represents a mixed-use residential-commercial area featuring predominantly lane-style historic residences. During China’s modern era, the district was demarcated as the Japanese Concession, where its grid-pattern street layout and small-scale, regularly shaped land parcels have been well-preserved. Sub-lanes running north–south or east–west divide the plots, ensuring all properties have frontage on at least one street. Residential buildings open toward the streets, forming a basic spatial unit defined by lanes and the adjacent architecture architectures. This compact subdivision model shapes Anshandao’s dynamic spatial diversity and orderly architectural coherence.
Most buildings dating back to the concession era are 2–3 stories tall. Today, Anshandao’s architecture primarily consists of European eclectic-style residences, interspersed with a few classical and modern Japanese-style buildings. Its architectural diversity includes garden villas, row houses, and lane-style residences, characterized by flexible floor plans and subtly varied minimalist facades. These features collectively reflect Tianjin’s modern residential and social evolution, endowing the district with significant historical conservation value. Furthermore, Anshandao’s conservation policies are guided by the principle of “developing through protection and protecting through development”. Local authorities aspire to transform the area into an experiential cultural district centered on modern historical architecture. Thus, conducting SVS assessments and planning strategies from a human-scale public perspective holds significant theoretical and practical relevance for Anshandao’s sustainable preservation.

3.2. Data Acquisition

The multimodal datasets utilized in this study incorporate multidimensional attributes of Anshandao’s spatial, architectural, and socio-cultural features. These data were obtained from four primary sources: (1) official government portals and historic district planning documents, (2) commercially licensed datasets, (3) open-access web-based repositories, and (4) field surveys and questionnaire-based investigations. Table 1 provides a categorized breakdown of the foundational data sources with detailed specifications.

3.3. Data Processing

3.3.1. Basic Database Construction

The geodatabase construction was implemented on the ArcGIS platform (Esri, V10.4) using the WGS-1984 geographic coordinate system and Mercator projection. Multimodal foundational datasets were rigorously preprocessed, including data cleaning, filtering, integration, and georeferencing, with raster image resolution standardized to 0.2 m × 0.2 m. A 3D urban digital elevation model (UDEM) was developed by synthesizing digital elevation model (DEM) data and building contour layers containing floor-level attributes of Anshandao. This UDEM served as the baseline surface for spatial analysis (Figure 2). Vector road data were topologically corrected to generate error-free road centerlines, which were subsequently segmented at intersections, yielding 54 road segments. The street corridors flanking road centerlines and 15 m inward buffer zones from block boundaries were spatially overlaid. The resultant composite zones served as statistical units for computing all evaluation criteria across road segments in Anshandao. Along each centerline, viewpoints were systematically positioned at intervals of 30–50 m, with a vertical elevation of 1.5 m above ground level, yielding a total of 199 sampling viewpoints. The spatial distribution of road segments and viewpoints is illustrated in Figure 1.

3.3.2. Collection and Pre-Processing of Data Required by SBE

  • Photographs of Streetscape
Since 2020, we have conducted repeated field surveys across multiple seasons in Anshandao. A total of 1406 streetscape photographs were captured. Photographs were selected according to the visual complexity of each of the 54 road segments. One to two representative images per segment were chosen to encapsulate streetscape characteristics. This yielded a final set of 57 photographs for subsequent public esthetic perception questionnaires. Anshandao’s compact streetscapes experience significant visual obstructions during peak foliage seasons, with dense roadside trees obscuring historic architecture along the corridors. This vegetation coverage often conceals the distinctive visual character of individual streets as seen from pedestrian viewpoints. To address this limitation, 56 winter scenes—captured during minimal foliage periods—were selected for analysis. Segment 32 remained an exception, as construction closures during the study period necessitated the use of pre-construction spring imagery to maintain assessment integrity.
  • Collection of data from public online questionnaires.
We designed and distributed an online PAP-based scenic beauty assessment questionnaire using a 5-point Likert scale. Respondents scored Anshandao’s streetscape photographs using predefined options: “Very Unattractive” (1 point), “Somewhat Unattractive” (2), “Neutral” (3), “Somewhat Beautiful” (4), and “Very Beautiful” (5). Higher scores indicated greater perceived esthetic quality. Photo sequences were randomized before distribution to reduce contextual bias from segment-level impressions. The questionnaire was administered via the “Wenjuanxing” app to public volunteers, resulting in 349 valid responses. Reliability testing using Cronbach’s alpha ( α ) in SPSS 26 showed an α coefficient of 0.994 (threshold > 0.85), confirming high data reliability. Table A2 in Appendix A displays the demographic characteristics of participants.

3.3.3. Collection of Data from AHP Questionnaires
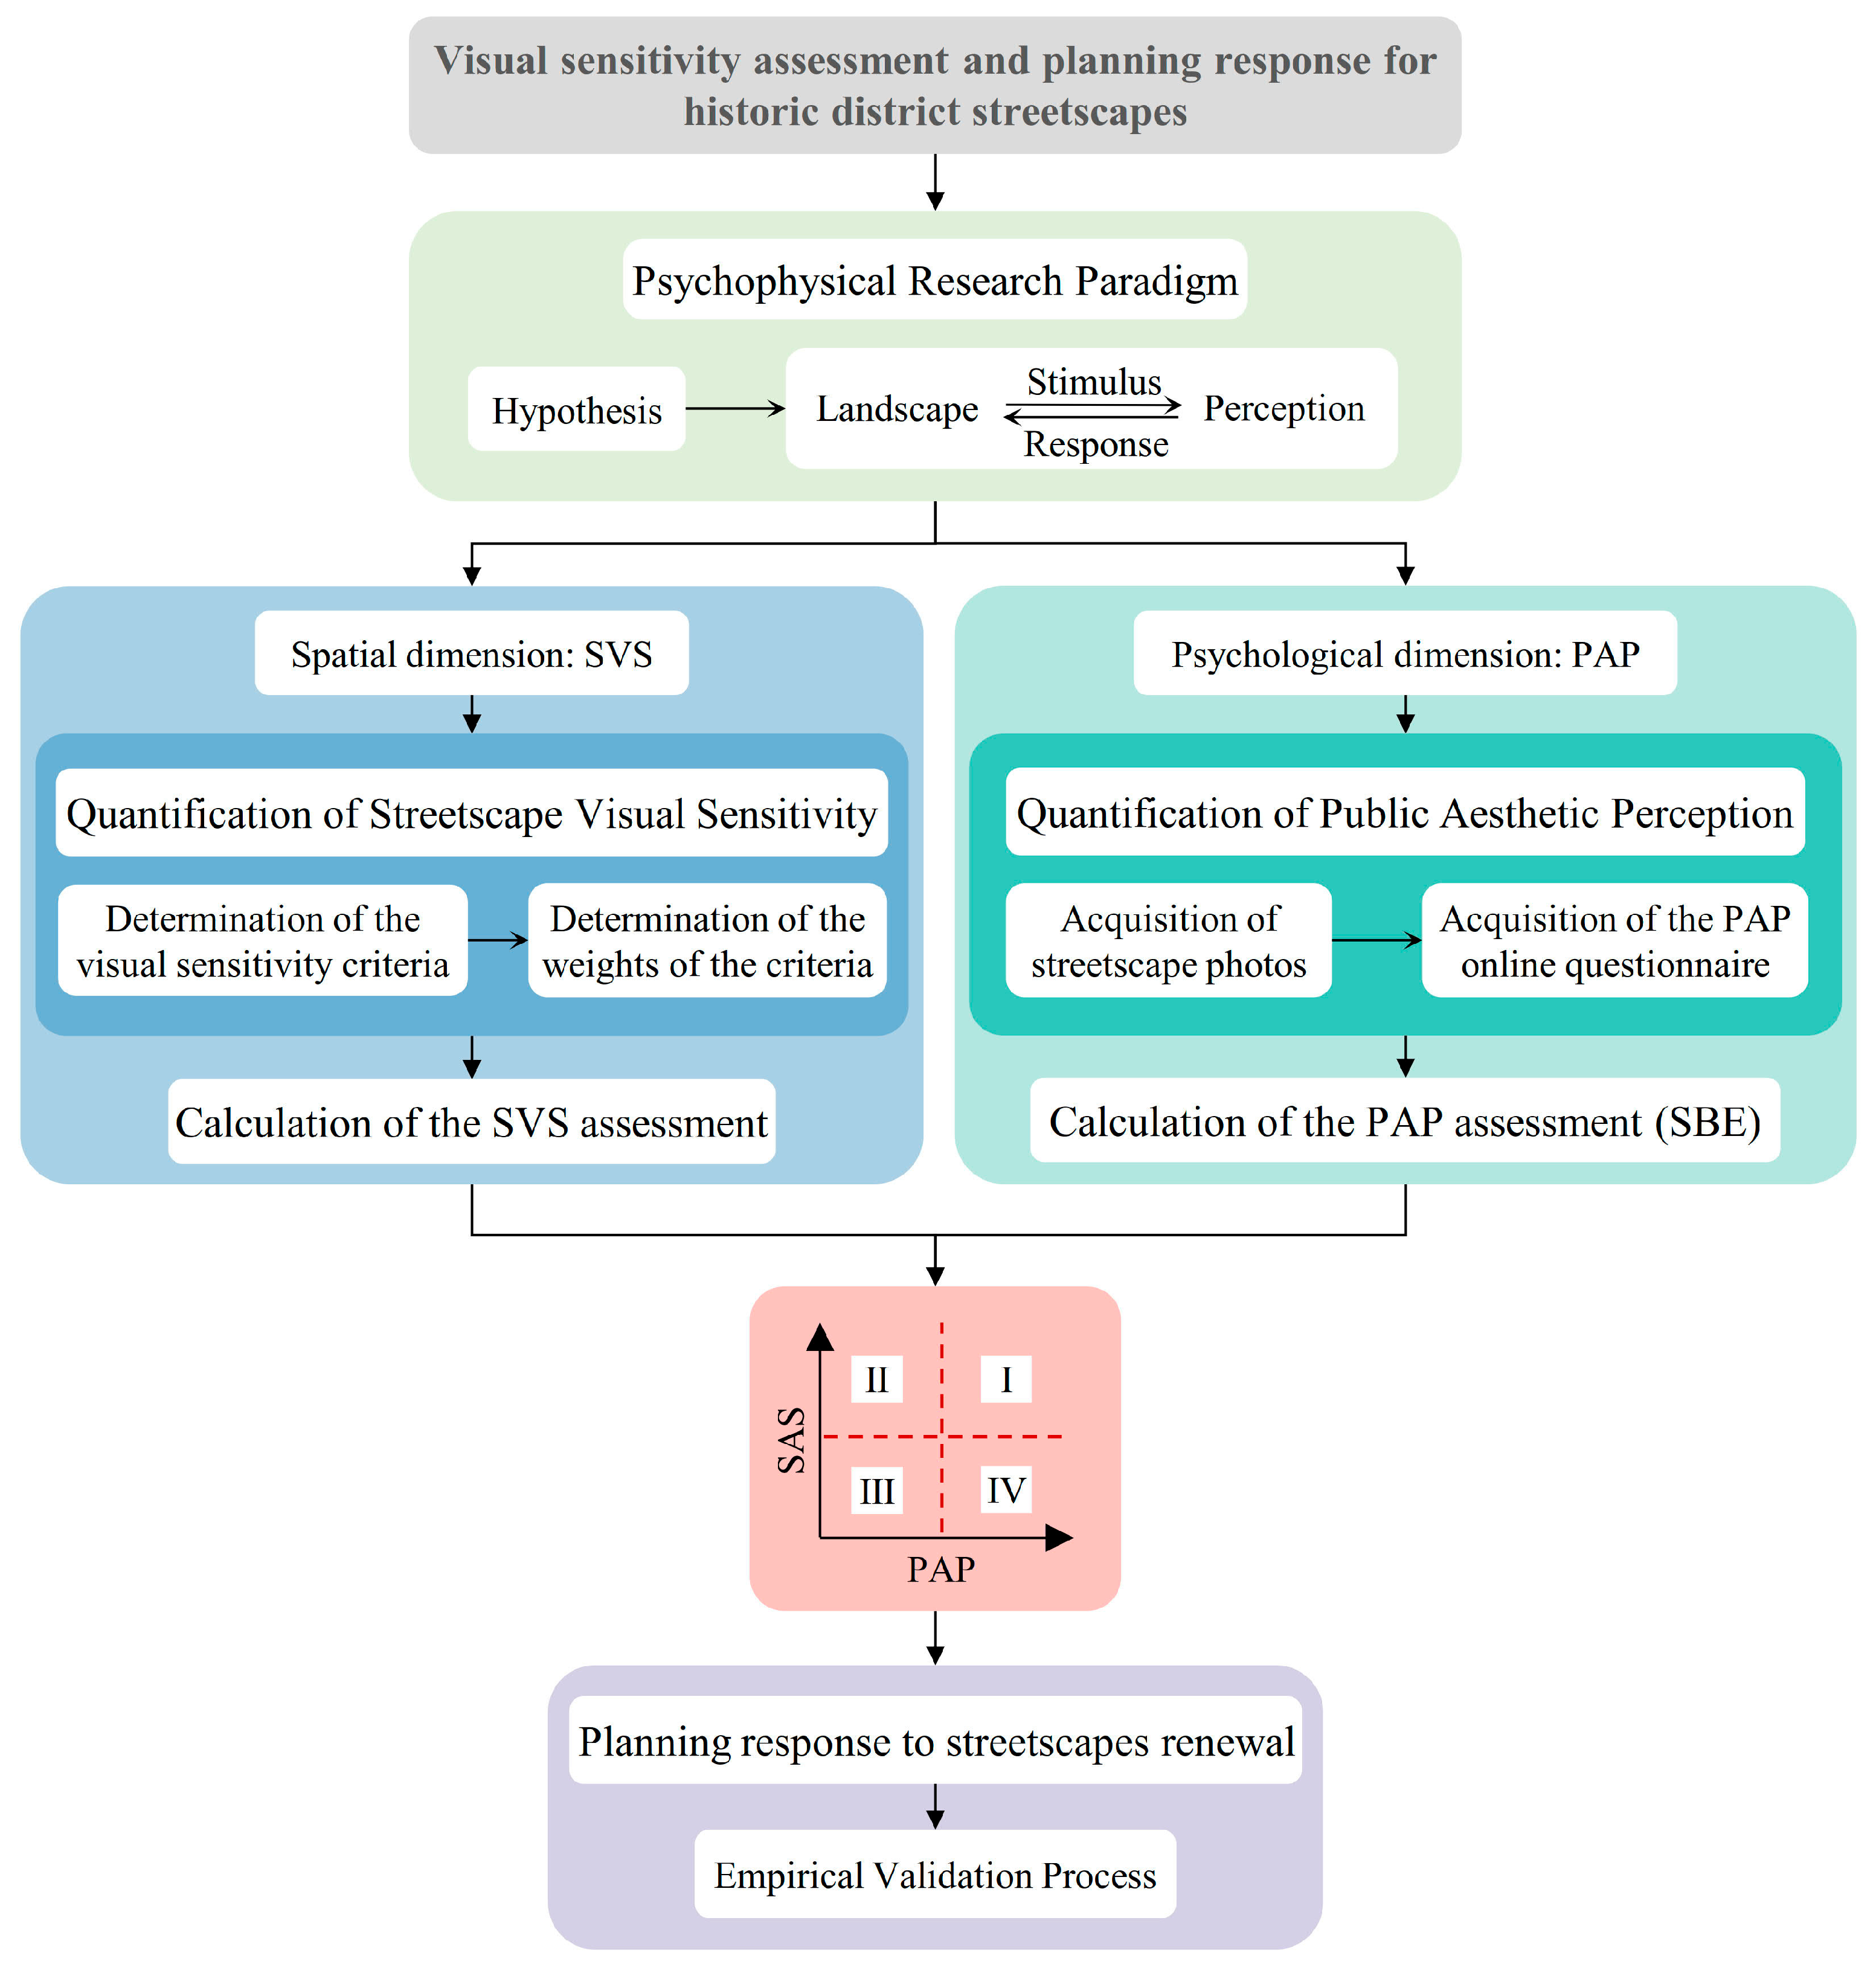
The AHP assessment model was constructed using Yaahp software (v12.11.8293 Pro). Valid pairwise comparison matrices were generated, and Excel-based questionnaires were exported for expert review. A total of 80 questionnaires were distributed, with 64 valid responses collected: 36 from experts (29 urban planning/design specialists, 4 architects, 3 landscape designers) affiliated with academic institutions and design firms, and 28 from the public (16 local residents, 12 tourists).

4. Methodology

This study proposes the SVS–PAP assessment methodology for historic district streetscapes, grounded in psychophysical “stimulus–response” theory. Physical streetscape features (“Landscape”) serve as quantitative stimuli, while public visual perceptions (“Perception”) act as psychological responses. Their functional relationships are empirically validated by psychophysical experiments [36,37,38]. We developed a dual-dimensional framework: (1) spatial dimension (SVS) that measures visual attention distribution through “Landscape–Perception” spatial correlations and (2) psychological dimension (PAP) assessing esthetic preferences via public perception. Multimodal data and GIS techniques enabled systematic quantification of assessment criteria. SVS and PAP results were integrated into a four-quadrant matrix using importance–performance analysis (IPA), generating evidence-based streetscape renewal strategies. Figure 3 illustrates the methodological framework and implementation workflow.

4.1. Visual Sensitivity Assessment of the Streetscape

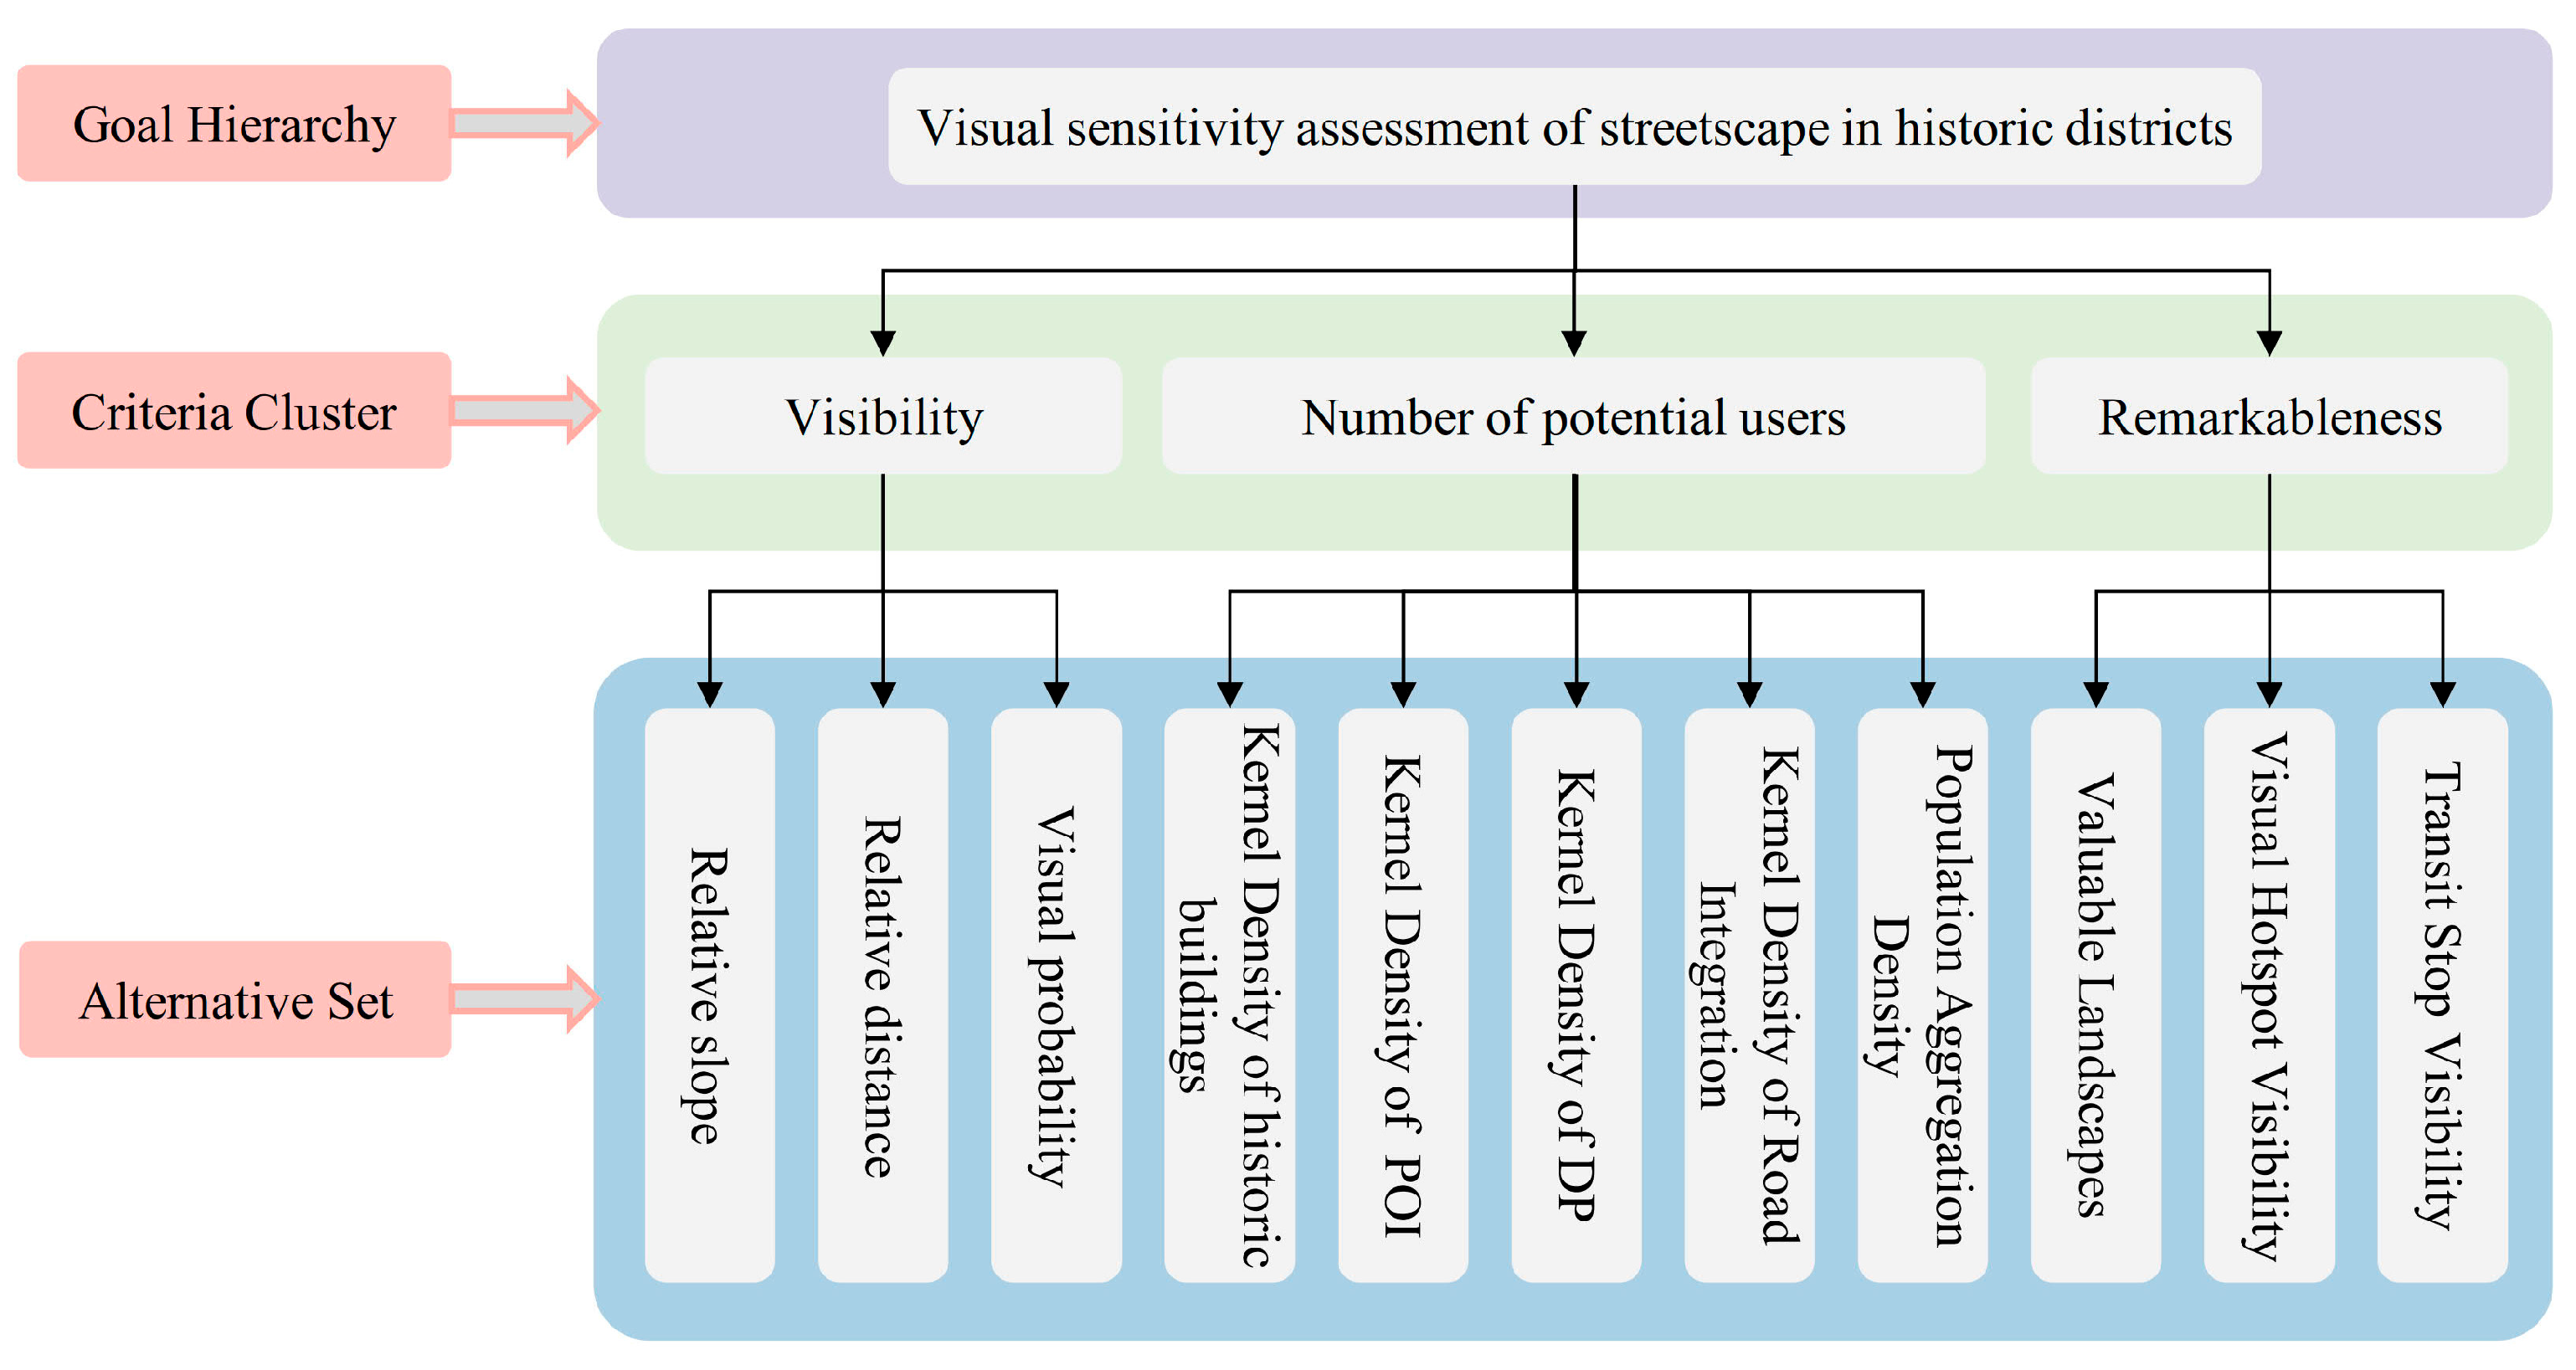
4.1.1. Determination of the SVS Criteria

Landscape visual sensitivity reflects the composite effects of visibility, clarity, remarkableness, and observer–landscape interactions. Key factors influencing LVS include spatial positioning, physical features, and observer proximity [45]. Scholars systematically select and quantify LVS criteria based on landscape typologies and data availability (Table A1 in Appendix A). For historic districts, three core SVS criteria were prioritized: visibility, number of potential users, and remarkableness. This study advances prior work [42] by integrating multimodal datasets, introducing three sub-criteria under potential user density: kernel density of DP, kernel density of road integration, and population aggregation density. The sub-criteria of remarkableness were further decomposed to enable granular quantification through weighted indicators. Table 2 details all SVS criteria, retaining original quantifications from [42] except new additions. Street-scale SVS calculations preserve raw data resolution to maximize precision, avoiding coarse classification used in district-scale LVS analyses.

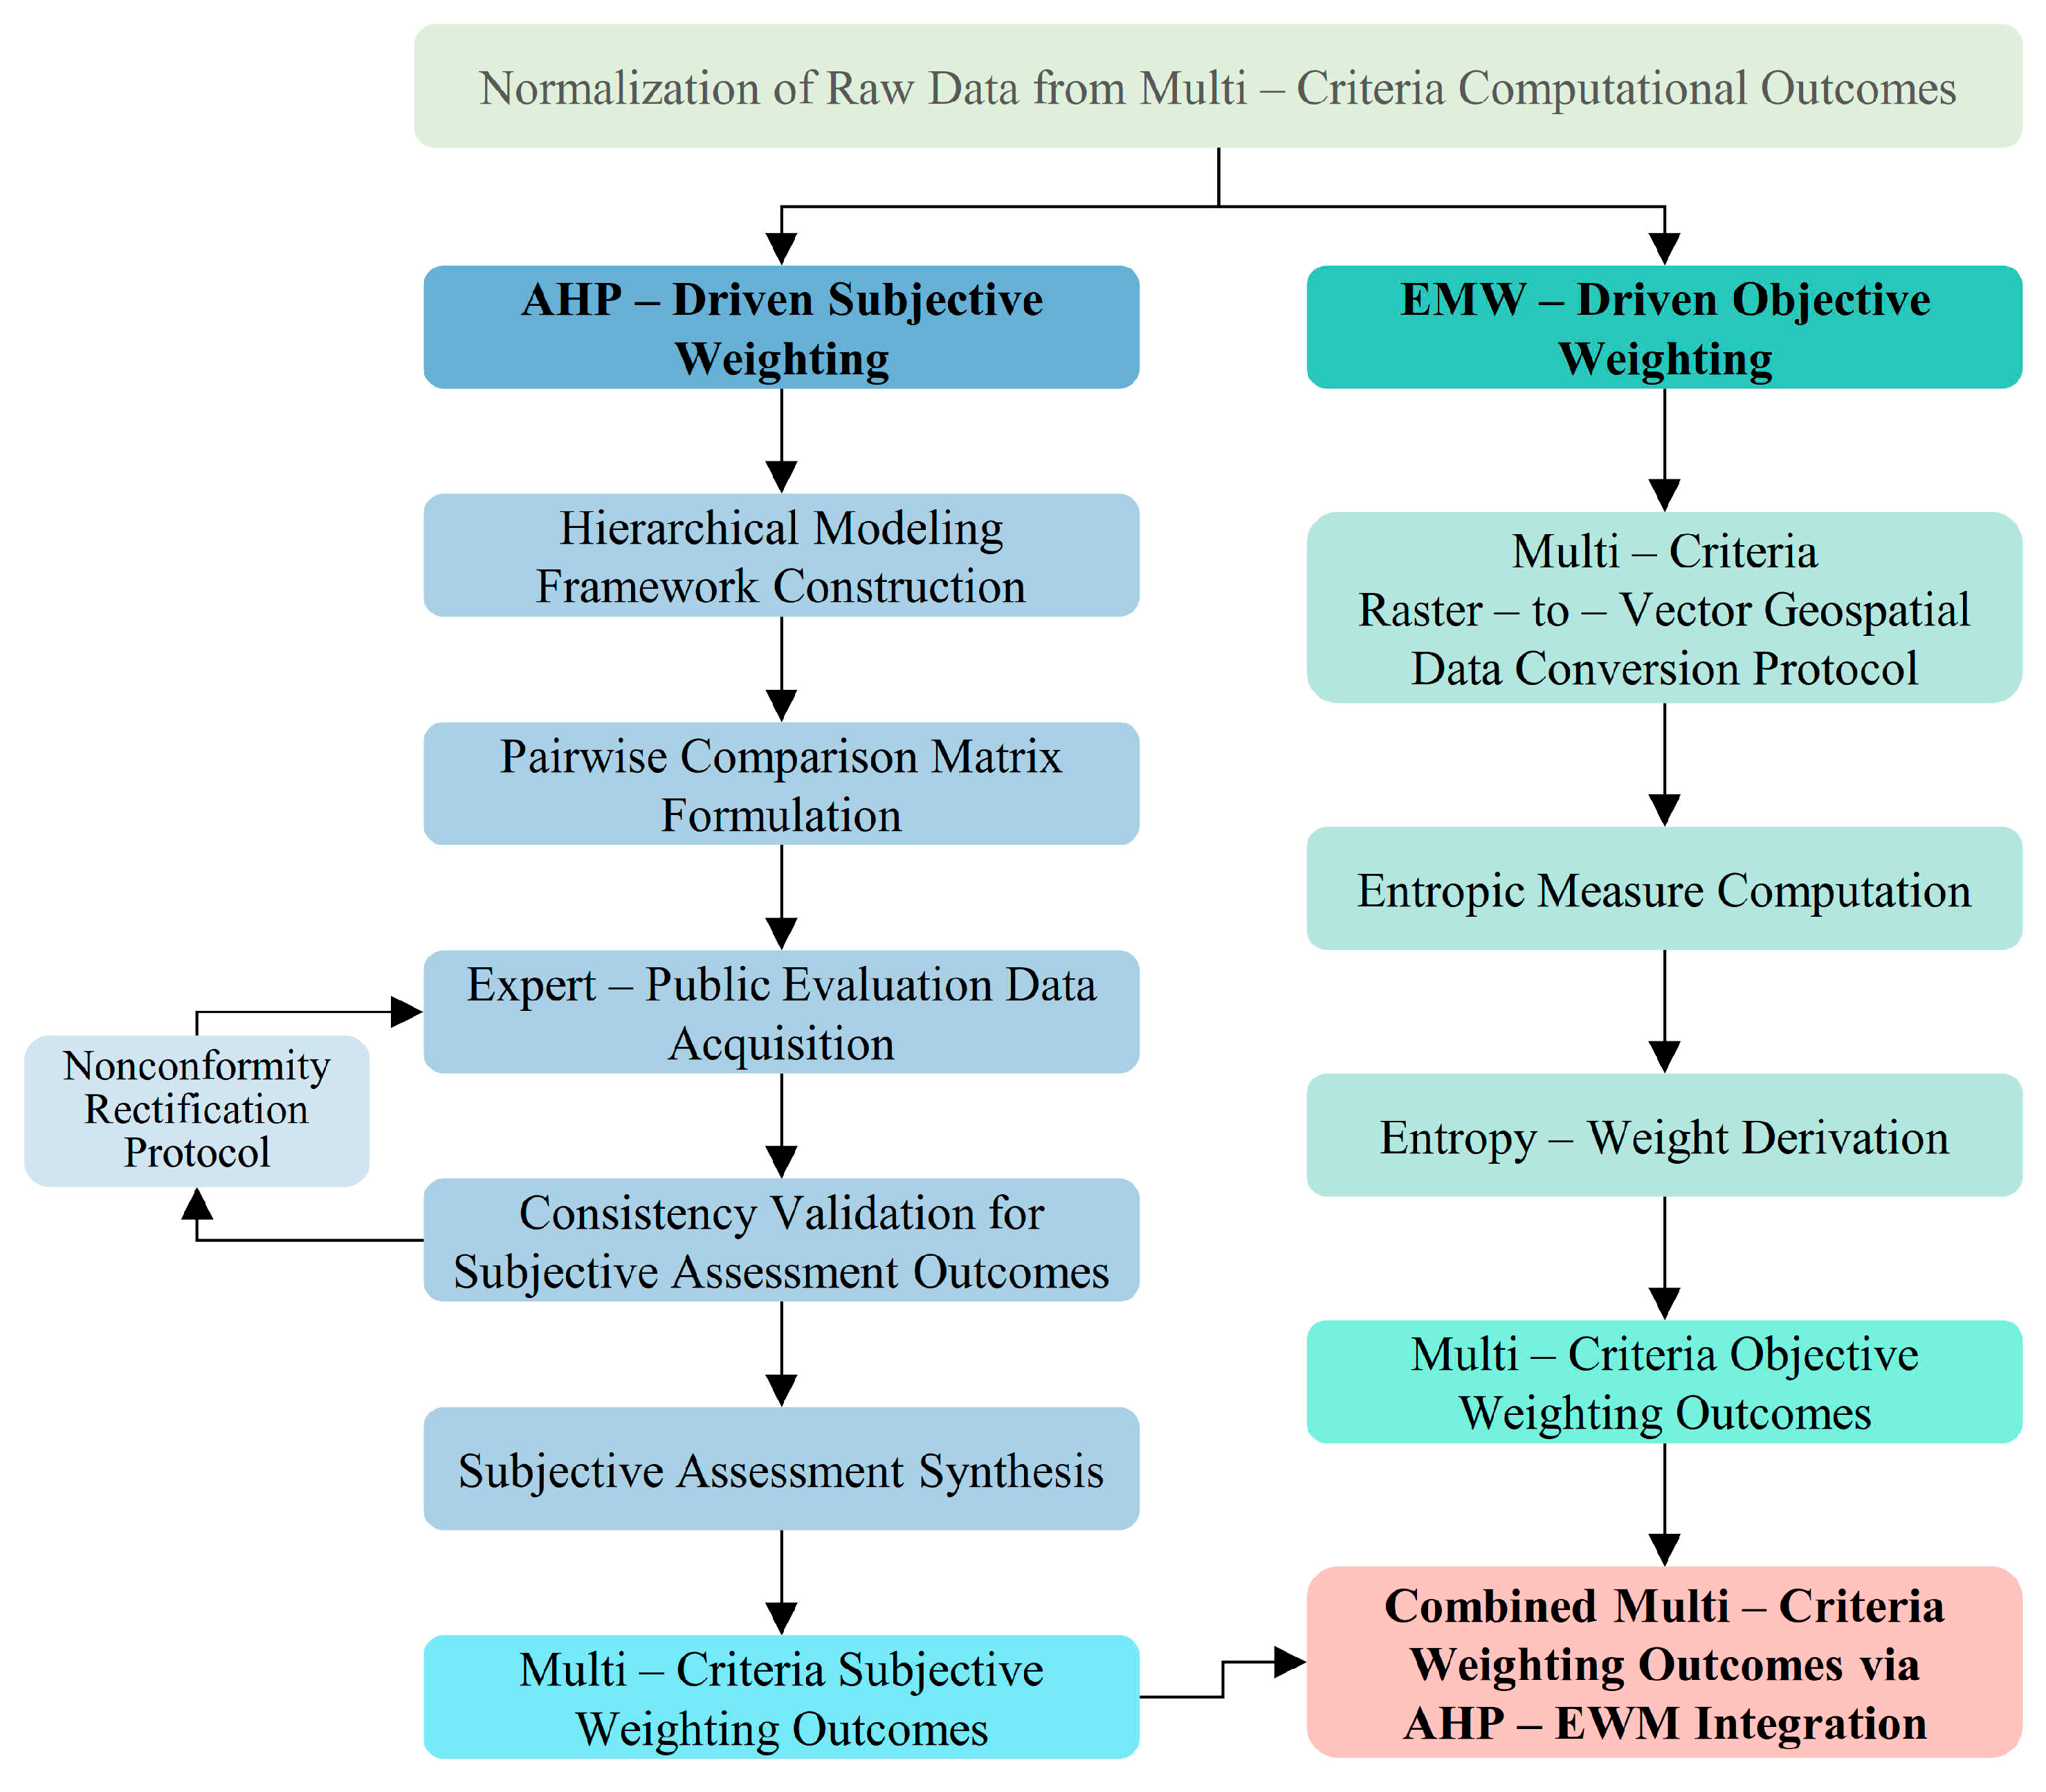
4.1.2. Determination of the Weights of the SVS Criteria

This study optimized criterion weighting through a hybrid subjective–objective approach, replacing conjunctive-disjunctive methods for historic district SVS calculations. We developed the AHP-EWM (analytic hierarchy process–entropy weight method) weighting method to enhance weighting scientific rigor: AHP quantified expert/public subjective weights, while EWM derived objective weights from assessment data via information entropy theory. Figure 4 details the AHP-EWM workflow.
  • Normalization of raw data from multi-criteria computational outcomes
The 11 criteria with different dimensions and magnitudes require normalization for cross-comparison and weighting. We applied the max–min normalization to resize values in raw data into the range of [0,1]. As all SVS criteria are positive indicators, Equation (1) was adopted for normalization. Let there be k criteria X 1 , X 2 , , X k , where each X j = X 1 j , X 2 j , , X n j contains the values of n landscape samples. Normalized values Y j = { Y 1 j , Y 2 j , , Y n j } were derived from X j .
Y i j = X i j m i n X j m a x X j m i n X j ,
where m a x X j and m i n X j represent the maximum and minimum values of criterion (or SBE value) j across all n samples, respectively, and X i j and Y i j are the raw and normalized values of criterion (or SBE values) j for sample i , respectively.
  • Subjective weighting via the analytic hierarchy process
This study employed AHP to derive subjective weights among SVS criteria (Figure 5), following these steps:
Step 1: Define objectives and hierarchy. The decision goal was “Visual sensitivity assessment of streetscapes in historic district”. A three-layer AHP hierarchy (goal–criterion–alternative) was constructed, with structural relationships and criteria detailed in Figure 5.
Step 2: Establish pairwise comparison matrices. Criteria importance was ranked using the 1–9 scale: 9 (absolutely more important), 7 (strongly more), 5 (moderately more), 3 (slightly more), 1 (equally important), with even numbers (8, 6, 4, 2) indicating intermediate priorities. A sample matrix is shown in Table 3.
Step 3: Collect expert/public weighting data. Valid matrices generated via Yaahp (v12.11.8293 Pro) were exported to Excel-based questionnaires for expert/public input.
Step 4: Calculate weights and verify consistency. Imported responses were processed in Yaahp using the power method to solve maximum eigenvalues ( λ m a x ) and eigenvectors by iterative calculation. Normalized eigenvectors yielded criterion weights. Consistency indices (Equation (2)) and consistency ratios (Equation (3)) were computed to validate matrix rationality.
C I = λ m a x n n 1 ,
where C I is the consistency index of the judgment matrix, and n denotes its order. To validate C I rationality, the consistency ratio ( C R ), which integrates expert-weighted stochastic consistency, is calculated by Equation (3).
C R = C I R I ,
where R I is the average random consistency index corresponding to the same matrix order as C I . The R I value is referenced from standardized lookup tables based on n . A judgment matrix passes the consistency test when C R < 0.10 , indicating smaller C R values (approaching 0) the higher consistency. C R = 0 denotes perfect consistency. If C R 0.10 , pairwise comparisons must be revised iteratively until compliance is achieved.
  • Objective weighting via entropy weight method
In this study, EWM was applied to derive objective SVS weights (Figure 4), with the following procedures:
Step 1: Data preprocessing. Raster layers were exported to Excel for EWM calculations. Each raster cell value was sampled at the original spatial resolution using the Raster to Point tool in ArcMap 10.4. Point-feature data were then exported to Excel format.
Step 2: Entropy value calculation. Entropy values were calculated for all criteria to quantify their informational magnitudes, ensuring the retained criteria reflected the majority of original data variability. The entropy E j of each criterion was computed using Equations (4) and (5):
E j = 1 ln n i = 1 n p i j ln p i j ,
p i j = Y i j i = 1 n Y i j ,
where p i j is the proportion of sample i in criterion j , defined as the ratio of Y i j (normalized value of sample i ) to the sum of all n sample values in criterion j . When p i j = 0 , lim p i j 0 p i j ln p i j = 0 was enforced. Computationally, l n p i j + ε , (with a pseudo-count ε = 10 7 ) replaced l n ( p i j ) to avoid undefined values.
Step 3: Entropy weight derivation. The entropy weight w j for criterion j was calculated as (Equation (6)):
w j = 1 E j k i = 1 k E i ,
where k = 11 (the number of total criteria). Normalized objective weights w = w 1 , w 2 , , w k were derived through Equation (6).
  • Integrated weight determination via the AHP–EWM weighting method.
Subjective weights in the AHP method are derived through pairwise comparisons of criteria by experts and the public within the hierarchical model, while objective weights in EWM are calculated based on entropy values derived from evaluation data. The former reflects human subjectivity, whereas the latter quantifies data-driven objectivity. To enhance scientific weighting rigor, this study integrated both approaches via the AHP-EWM weighting method, where the combined weight W j for criterion j is computed as (Equation (7)):
W j = 1 t s j + t w j j = 1 , 2 , , k ,
where W j is the integrated subjective–objective weight, s j denotes the subjective weight (AHP-derived), w j represents the objective weight (EWM-derived), and t is the integration coefficient (typically t = 0.5 ).

4.1.3. Calculation of the SVS Assessment

First, the assessment criterion results from Section 4.1.1 and the SVS weights from Section 4.1.2 were input into the weighted linear combination model (Equation (8)):
V x i = j W j Y i j ,
where V x i represents the integrated output combining normalized raster values with subjective–objective weights, W j is the integrated subjective–objective weight of criterion j (satisfying j W j = 1 ), and Y i j denotes the normalized value of criterion j for sample i , derived from the normalized calculation results of each criterion.
Subsequently, normalized raster layers were processed using the Spatial Analyst → Map Algebra → Raster Calculator tool in GIS to perform overlay operations, generating final SVS results.

4.2. Public Esthetic Perception Assessment of the Streetscape

Public esthetic perception was quantified using the SBE method, with evaluation outcomes determined by both the inherent landscape physical characteristics and their elicited public esthetic responses. Online questionnaires were distributed, as described in Section 3.3.2, to collect data on public perceptions of streetscape esthetics. Collected responses were subsequently cleansed, filtered, and subjected to reliability analysis, with the SPSS 26 “Reliability Analysis” module being employed for statistical validation. Processed data were systematically organized for SBE value computation via Equations (9) and (10). For streetscape segments with multiple images, mean scores were calculated prior to rounding and formula application. The computational workflow is defined by Equations (9) and (10):
M Z i = 1 m 1 l = 2 m f c f i l ,
S B E i = M Z i B M M Z × 100 ,
where m = 5 represents the number of total rating levels, c f i l denotes the cumulative frequency of ratings no lower than level l for landscape i , f c f i l is the z score normalization value of c f i l (for each level l = 2,3 , , m , while f c p i 1 = , M Z i represents the mean z score of public ratings for landscape i , S B E i is the scenic beauty value of landscape i , and B M M Z is the mean z score of randomly selected control landscapes. All SBE computations were implemented programmatically in R language.

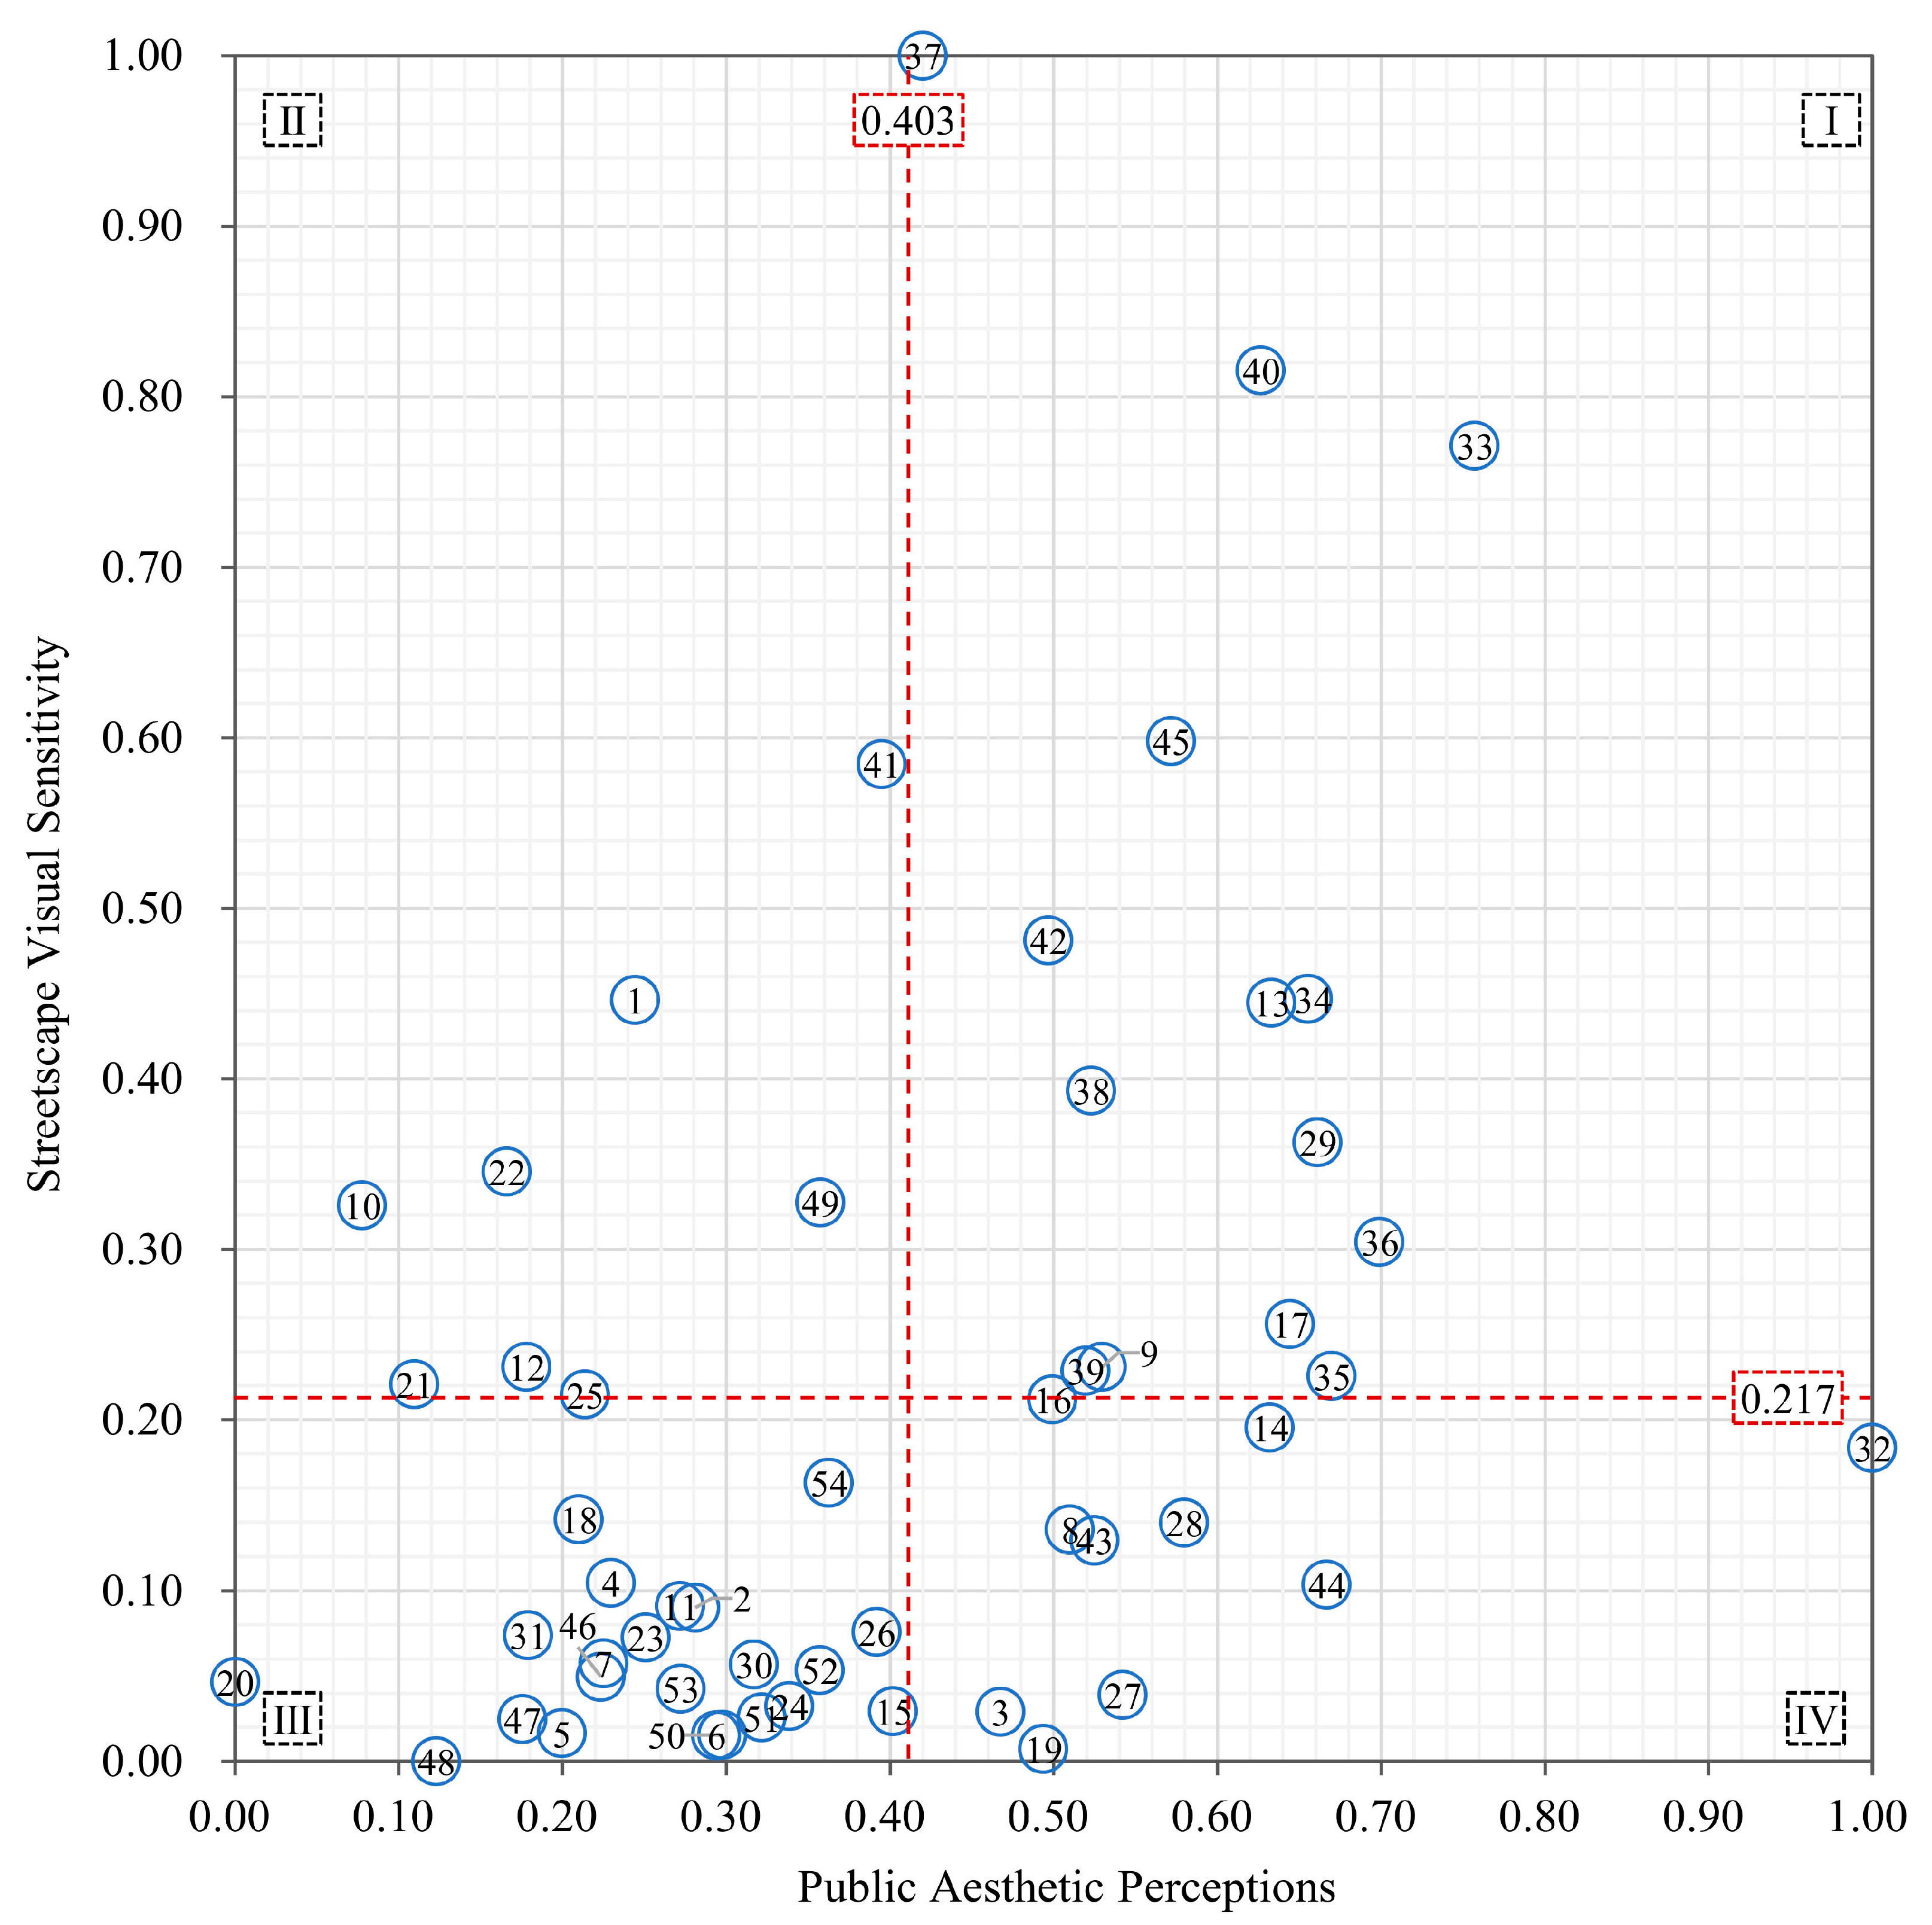
4.3. Planning Responses to Streetscapes Renewal via the SVS–PAP Analysis Matrix

The SVS–PAP assessment framework was developed by integrating IPA principles with SVS and PAP evaluation results. Normalized SVS (vertical axis) and PAP (horizontal axis) scores were mapped to a [ 0 , 1 ] scale (Figure 3), with quadrant boundaries defined by their mean values to divide the matrix into four strategic scenarios: quadrant I (Priority sustainment: high SVS and high PAP), quadrant II (Improvement priority: high SVS and low PAP), quadrant III (De-prioritization: low SVS and low PAP), and quadrant IV (Efficiency retention: low SVS and high PAP). Tailored streetscape renewal strategies were linked to each quadrant based on SVS–PAP synergy patterns.

5. Results

5.1. Assessment Results of the Streetscape Visual Sensitivity

  • Quantitative results of the SVS criteria.
The 11 sub-criteria were quantified using the approach outlined in Table 2. Spatial mapping visualizations were generated by importing the quantified data into GIS (Figure 6 and Figure 7). The criteria selection was grounded in three principles: (1) Anshandao’s natural-cultural attributes, (2) evolutionary theories and cultural perspective theories, and (3) empirically validated findings from prior studies. Higher quantified values in Anshandao’s SVS assessment criteria were defined to correspond with elevated visual sensitivity.
  • Weighting outcomes of the SVS criteria.
The AHP-EWM weighting method proposed in Section 4.1.2 was applied to determine SVS weights for Anshandao’s criteria. Subjective SVS weights derived from AHP are presented in Table 4. The group decision-making module in Yaahp software (v12.11.8293 Pro) was employed to integrate weights assigned by all respondents, generating final subjective weights for criteria and sub-criteria layers. Expert weight aggregation adopted the weighted arithmetic mean of individual priority vectors. Prior to synthesis, the expert data validation tool was used to screen datasets for contradictory judgments and incomplete matrix entries. The hierarchical total ranking consistency ratio (CR) was calculated as 0.049 (threshold: C R < 0.100 ), confirming satisfactory consistency across all expert judgments.
The highest weight among the main criteria was assigned to remarkableness in the criteria cluster, followed by visibility, with the number of potential users ranked lowest. remarkableness was recognized as the most critical criterion for historic streetscape SVS assessments by both experts and the public. Due to the historical significance and unique landscape features of landmark sites in Anshandao, coupled with policy-driven resource concentration in core areas, zones with high remarkableness were unanimously identified as visually sensitive zones. Visibility was subsequently prioritized as the secondary influential factor, reflecting objective measurability (presence/absence of visibility) compared to projected potential visitor volume derived from empirical studies and contextual realities. These weight allocations were validated to reflect the empirical characteristics of historic streetscape SVS and align with domain-specific logical judgments based on the results and analysis. The SVS spatial distribution based on subjective weights is visualized in Figure 8a.
The objective SVS weights derived from the EWM are presented in Table 5. The entropy weights of the main criteria were ranked as remarkableness > visibility > number of potential users. Remarkableness demonstrated the lowest entropy value, indicating the highest informational contribution and thus the greatest weight. Among sub-criteria, visual hotspot visibility and transit stop visibility under remarkableness received the highest entropy weights, while population aggregation density was assigned the lowest weight. This reflects minimal data dispersion and limited informational value in low-weight criteria, justifying their reduced prioritization.
The integrated subjective–objective SVS weights for Anshandao were calculated using Equation (7). As shown in Table 6, the highest-ranked sub-criteria remained valuable landscapes and visual hotspot visibility under remarkableness, while the lowest-ranked were four sub-criteria under the number of potential users, with population aggregation density assigned the minimal weight of 0.013. The SVS spatial distribution based on objective weights is visualized in Figure 8b.
  • Calculation of the SVS assessment
The SVS values for Anshandao’s road segments were calculated using Equation (11):
S V S = S a × 0.119 + S d × 0.037 + S t × 0.110 + S b × 0.030 + S p × 0.015 + S z × 0.086 + S i × 0.013 + S g × 0.035 + S f × 0.232 + S h × 0.205 + S r × 0.116
where S a , S d , …, S r denote the normalized values of 11 sub-criteria. Spatial distribution and segment-level statistics of SVS are shown in Figure 8c,d. High-sensitivity zones were concentrated in the core conservation corridor (Segments 33–45), exhibiting significant spatial clustering aligned with the “axial-multinodal” conservation strategy.
Moderate-to-high sensitivity zones were categorized into (1) heritage nuclei (e.g., Zhangyuan Garden and Jingyuan Garden historic buildings along Anshandao), (2) policy-driven redevelopment hotspots (e.g., Bayi Auditorium, Children’s Park), and (3) areas with dense visual landmarks or transit hubs (e.g., Segments 8 and 11). This spatial pattern reflects the strategic prioritization of conservation efforts by planning authorities. However, moderate-sensitivity anomalies (e.g., Segments 35 and 36) within the core zone indicate underutilized esthetic ecosystem services, while high-sensitivity segments in non-core areas require targeted attention.

5.2. Assessment Results of the Public Esthetic Perception

High-to-moderate scenic beauty (PAP) ratings were predominantly observed in Anshandao’s core conservation zones (Figure 9 and Figure 10). In non-core zones, segments with high-quality natural landscapes were also rated highly (e.g., Segments 17, 29, 32), confirming the efficacy of conservation planning in enhancing scenic esthetics. However, low-PAP anomalies were identified at core zone boundaries (e.g., Segments 10, 12, 22), characterized by discordant elements disrupting streetscape coherence. Similarly, transitional segments adjacent to the core experience corridor of Anshan Road exhibited low PAP due to incompatible modern architectures (e.g., Segment 21’s oversized structures), chaotic utility pipelines, and pedestrian obstruction from street parking.

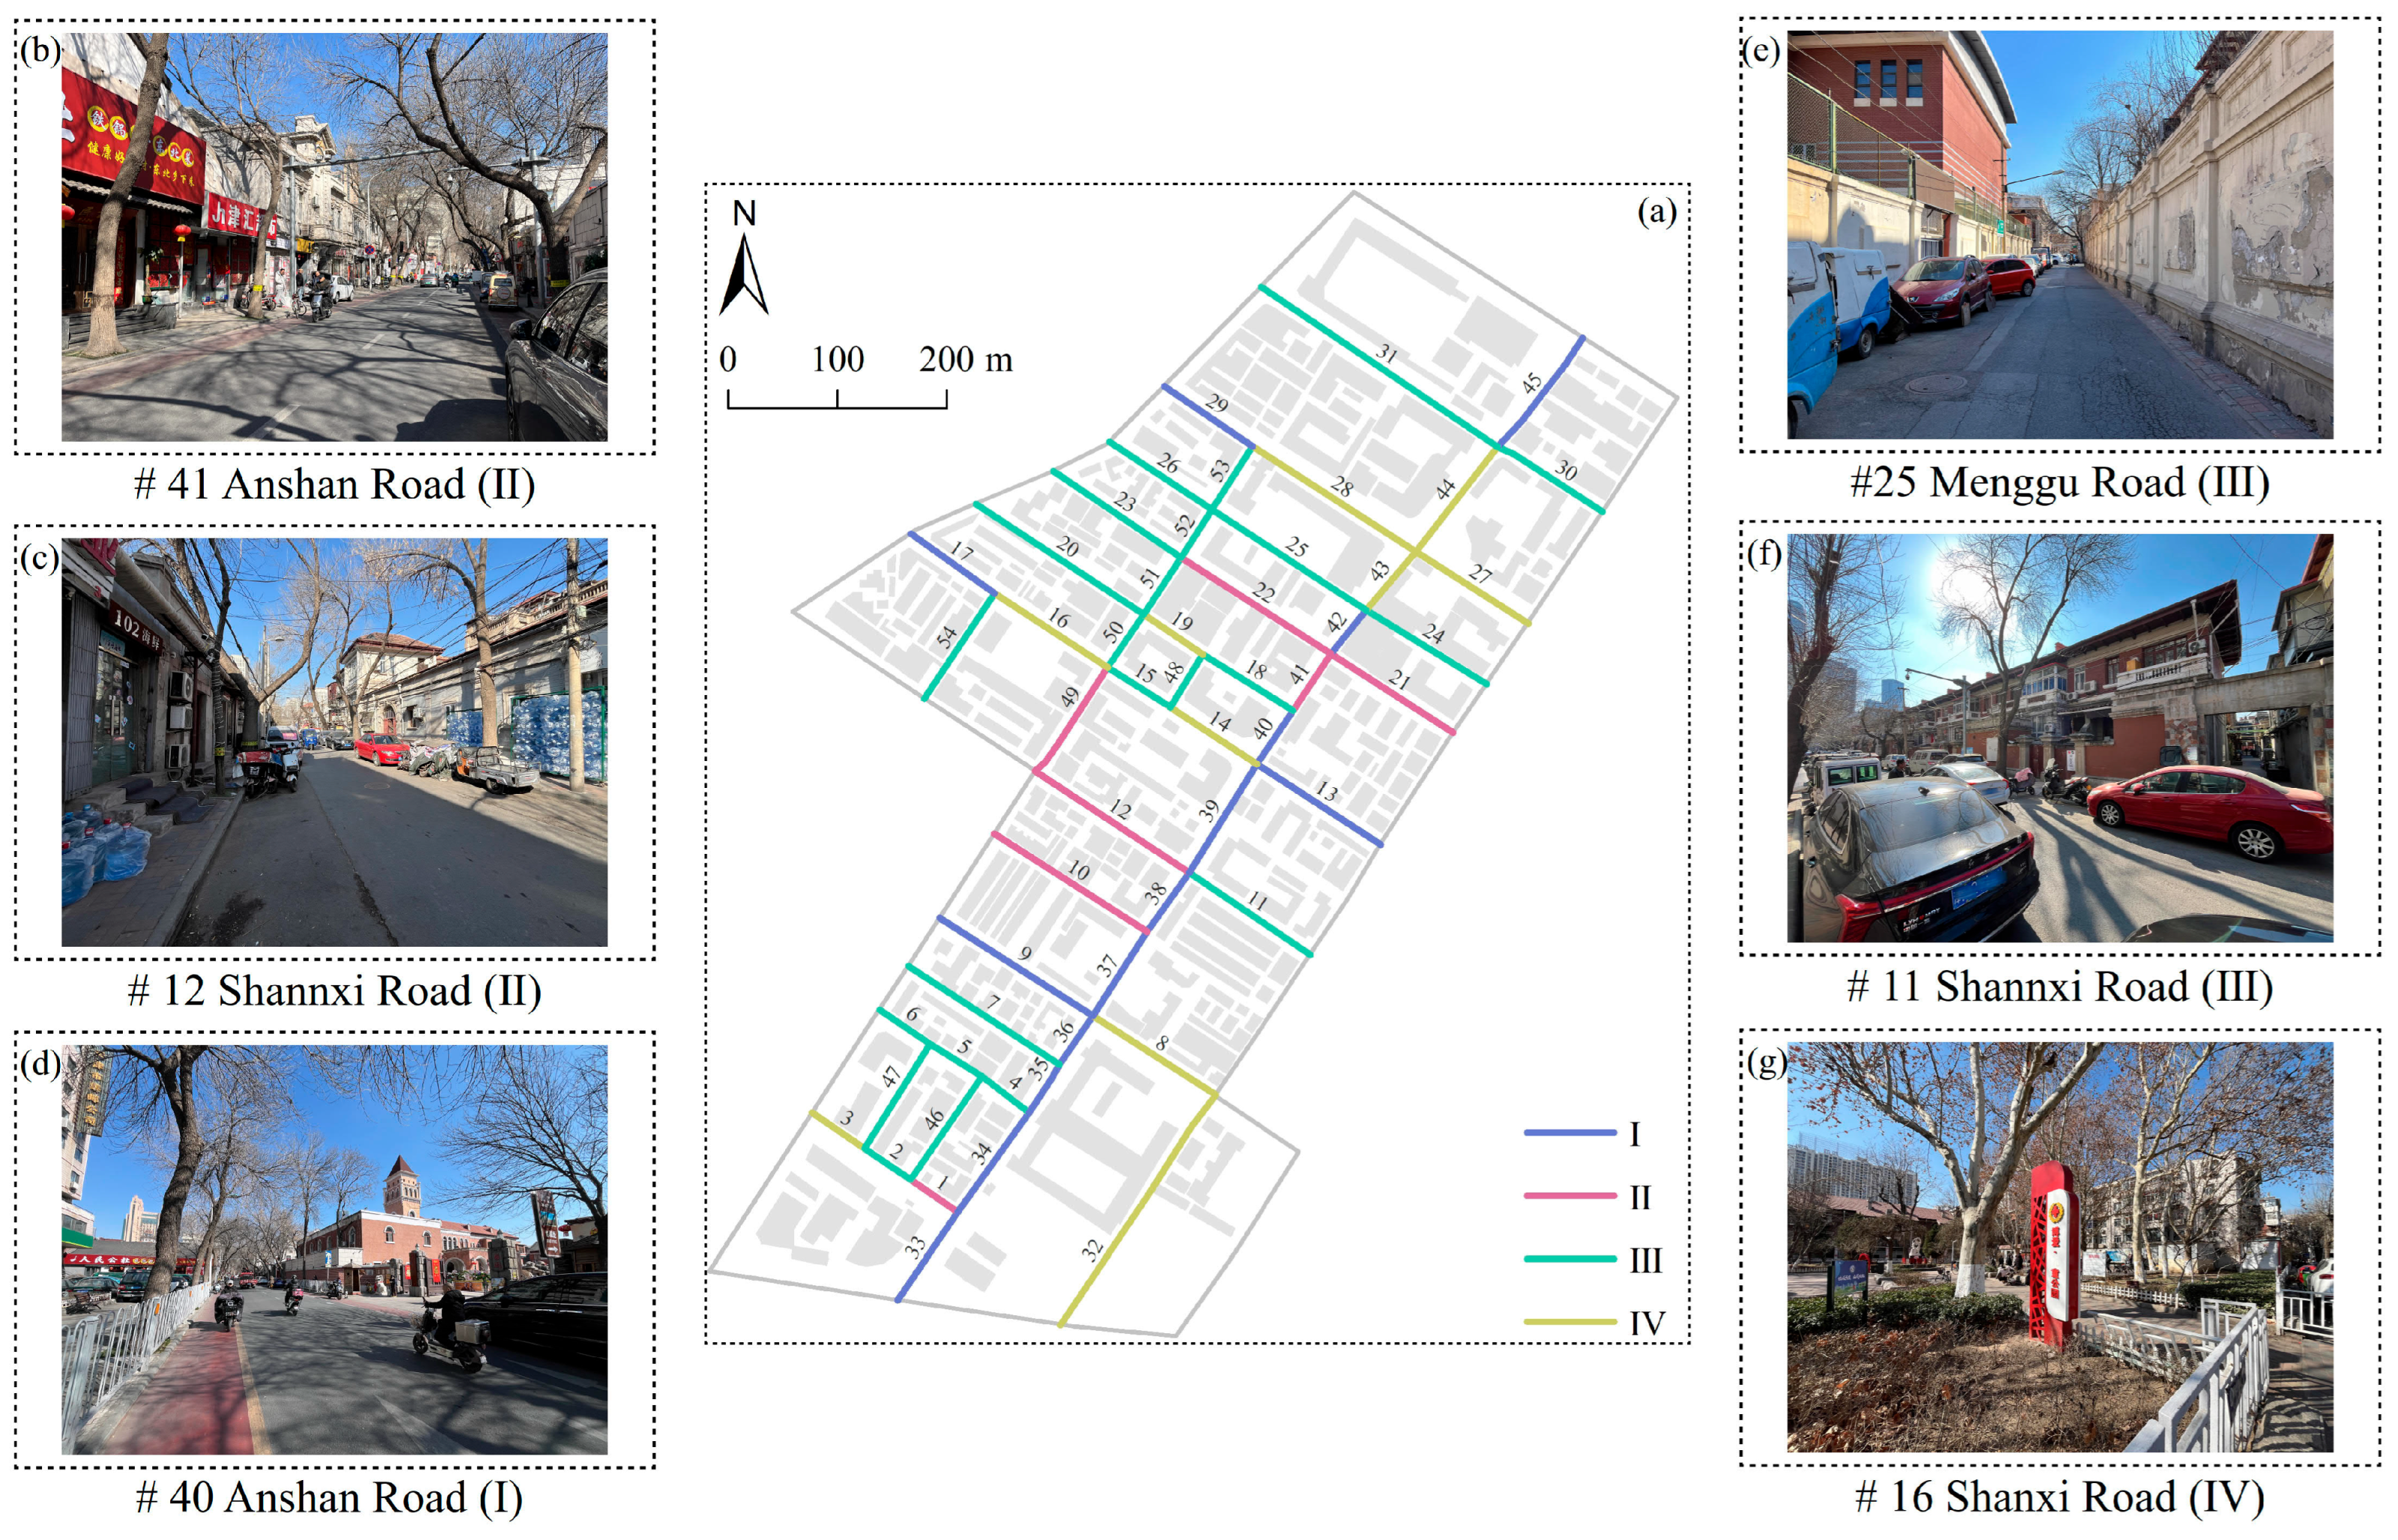
5.3. Planning Responses Based on the SVS–PAP Analysis Matrix

The scenario classifications of Anshandao’s road segments were determined through SVS–PAP matrix-based overlay analysis (Figure 11 and Figure 12). Quadrant II (high SVS, low PAP) included seven segments (13%), identified as improvement-priority zones requiring urgent renewal. Twenty-three segments (43%) were categorized into quadrant III, where low-priority incremental strategies were recommended. Quadrants I and IV accounted for 24 segments (44%), with quadrant I prioritized for preservation and quadrant IV maintained under status quo protocols. The renewal sequence was prioritized as improvement priority quadrant (II) → de-prioritization quadrant (III) → priority sustainment quadrant (I) → efficiency retention quadrant (IV). Strategic responses for all quadrants are systematically summarized in Table 7.
The conservation planning for core zones was validated to achieve partial success based on scenario proportions and spatial distributions (Figure 12). Improvement-priority segments were predominantly located in regulated planning zones. However, anomalies were identified within core zones. For example, segment 41 is not only located along Anshan Road, the primary thematic experience corridor for historic landscapes, but also links two critical planning nodes: Duan Qirui’s former residence and Zhangyuan Garden. Despite high SVS, its PAP was subpar due to incompatible signage. Similarly, segment 12, housing Lu Zhonglin’s former residence, exhibited degraded visual quality from street-side vendor clutter. Seven such core segments were flagged for prioritized intervention.
Three primary issues were identified in quadrant III segments: (1) delayed maintenance of historic building facades, (2) incompatible renovation styles of street-front shops with the historic district’s character, and (3) pedestrian obstruction and visual degradation caused by dense parking along narrow streets. Beyond implementing phased protective renewal of streetscapes in subsequent phases, attention should also be directed toward enhancing street vitality. For instance, Segment 11, adjacent to Jingyuan Garden and Zhangyuan Garden and connected to Anshan Road’s thematic experience corridor, exhibited unexpectedly low SVS despite its core conservation zone proximity. The revitalization of such streets was recognized as a critical factor for improving public experience.
The road segments located in quadrant I are primarily distributed along Anshan Road. These roads are adjacent to valuable historical landscape nodes. High SVS and PAP values are observed in road 40, for instance, due to its proximity to Zhangyuan Garden—a site of significant historical and artistic value. Constructed in 1915 by Zhang Biao, the late Qing Dynasty governor of Hubei Province, Zhangyuan Garden represents an elaborate residential complex. This architectural ensemble is distinguished by its harmonious combination of Chinese garden esthetics with Western-style buildings. Conservation strategies for such streets should prioritize maintaining current conditions and implementing focused protection measures.
Quadrant IV comprises road segments with high PAP but low SVS values, exemplified by the Children’s Park in segment 16. This park serves as a crucial public activity and social interaction space within the neighborhood. However, field investigations revealed that its SVS score remains below average despite high vegetation coverage. Deficiencies were identified in public infrastructure supporting children’s recreational activities and adult fitness facilities, while the esthetic quality of other landscape elements was also found to require improvement. Similarly, segment 32, originally designed as an extensive roadside green space, presented comparable issues. Currently, municipal authorities have initiated enclosure measures for this segment, with renovation works being implemented.
Anshan Road is characterized by its profound historical-cultural heritage and vibrant urban vitality. Systematic phased interventions employing scenario-specific refinement strategies are proposed to enhance public well-being. Such strategies are considered essential for establishing human–environment harmony and promoting sustainable urban development.

6. Discussion

6.1. Multimodal Data-Driven Exploratory Frameworks and Innovation Pathways

This study addressed the limitations of existing research and achieved the predetermined objectives through explorations, refinements, and innovations in the following four aspects:
  • Optimization of the HUL visual landscape assessment framework
The historical heritage evaluation framework has been established as a critical foundation for HUL conservation planning formulation and implementation globally. However, persistent assessment-to-planning procedural disconnections have been documented in existing evaluation frameworks internationally. China’s Standard of Conservation Planning for Historic City mandates a three-tier conservation framework—“historic cities–historic conservation areas–officially protected monuments and sites”—under holistic conservation principles. It also requires phased implementation workflows and public participation mechanisms at each planning level to ensure the integration of stakeholder input [7]. Under these national policy directives, comprehensive conservation of historic streets has been mandated in Tianjin’s Historic City Conservation Plan (2021–2035), requiring demarcation and tiered protection approaches [89]. However, current HUL assessment criteria lack process-oriented, street-scale landscape assessment frameworks with planning translation mechanisms [13,90]. Existing assessment criteria remain limited to quantitative analyses of architectural and historical elements, focusing predominantly on numerical counts and areal measurements [91].
The SVS–PAP methodology proposed in this study has enabled an effective scalar linkage between district-level evaluations and individual monument assessments. This approach has been demonstrated to directly inform conservation–renewal decision-making for specific street segments while facilitating holistic district planning formulation. Precision limitations observed in prior methodologies—including excessively coarse spatial granularity preventing targeted area identification or isolated element evaluations compromising holistic conservation principles—have been systematically addressed. For instance, Fang et al. (2021) conducted landscape visual sensitivity assessments in Wudadao historic district [42], but the results revealed only macro-scale sensitivity distributions rather than segment-level granularity, limiting the development of precise, segment-specific conservation strategies. Similarly, Yang et al. (2024) conducted visual impact evaluations on traditional Chinese garden walls through public perception analysis [92]; however, the non-spatialized elemental assessments required supplementary GIS-based spatial mapping and segment-level statistical processing to be applicable in planning.
  • Science-driven and context-specific streetscape assessment framework.
This study constructed an SVS–PAP assessment framework that integrates spatial and psychological dimensions, based on the landscape–perception coupling perspective. This theoretical perspective has been recognized as a cutting-edge research orientation in landscape perception studies since its proposal by Zube et al. (1982) [36]. Previous limitations in landscape characteristics quantification technologies had restricted their application to streetscape assessments, with expert-driven evaluation paradigms being predominantly adopted. Recent advancements in multi-modal data acquisition and artificial intelligence have enabled the collection of large-scale landscape–perception interaction datasets, while technical capacities for spatial mapping and computational processing have been established. Consequently, this methodological alignment has been strategically synchronized with contemporary research priorities and national-scale initiatives promoting global human–environment harmony.
The integrated spatial-psychological assessment methodology for planning-transformation mechanisms was initially operationalized through two visual resource management systems developed by the U.S. Forest Service and Bureau of Land Management (Visual Management System, VMS [28]; Visual Resource Management, VRM [14]). Subsequent applications have largely focused on large-scale natural landscapes, visual landscape quality assessments and management strategy formulations. Swetnam et al. (2017) proposed a two-dimensional quadrant matrix that integrates landscape esthetic quality with viewshed analysis, applying it to scenario-based planning strategies in Welsh rural landscapes [54]. Public perception factors have been typically constrained in these large-scale assessments, where equal weighting has been conventionally applied to esthetic criteria [93]. Visibility-based criteria, particularly GIS-derived viewshed analyses, have been exclusively utilized for visual sensitivity assessments. Kou et al. (2024) evaluated heritage visual value impacts from development projects through combined LVS and visual perception assessments [58], employing conventional visibility criteria with Boolean logic for LVS computation, while project visual impacts were determined through expert–public weighted scoring of perceptual factors.
The SVS–PAP assessment framework proposed in this study represents a shift away from expert-dominated paradigms by incorporating public perception factors more thoroughly. Compared with existing methodologies, this framework has demonstrated greater suitability for human-scale streetscape assessments with enhanced specificity and scientific rigor. For SVS assessment components, assessment criteria were first determined based on prior research and site-specific characteristics. Comprehensive SVS weights were subsequently derived through integrated AHP incorporating expert–public judgments and EWM grounded in multi-modal data information entropy. This dual-weighting approach systematically combines multidisciplinary subjectivity with data-driven objectivity. In PAP evaluation procedures, public-led photographic evaluation of representative historic streetscape characteristics was initially conducted, followed by SBE quantification. While SBE has been empirically validated as a robust public perception integration method, its incorporation into composite assessment frameworks at street-scale with SVS has remained underexplored. The feasibility and reliability of this methodological synthesis have been conclusively verified.
  • Planning application-oriented SVS–PAP assessment methodology for streetscape.
Effective procedural linkage between visual landscape evaluation outcomes and planning strategy formulation has been recognized as a persistent challenge in landscape esthetic quality assessment. Planning and management strategies have been formulated primarily through qualitative inferences combining assessment results with professional expertise in prior studies [47,52], an approach recognized for its methodological instability due to heavy reliance on individual experts’ knowledge and experience. Critical limitations have been identified regarding observer independence and methodological replicability. Recent methodological explorations have been undertaken to address these constraints, exemplified by Yang et al.’s (2023) application of correlation analyses to elucidate interrelationships among ecological, visual, and cultural sensitivity dimensions based on historic district landscape sensitivity assessments [63].
An integrated SVS–PAP assessment methodology was developed through combined assessments to explore practical planning applications, with four operational scenarios identified via a bivariate matrix (SVS–PAP) for future management prioritization. Urban historical districts, as open complex giant systems, operate under continuous coupling interactions between socioeconomic and natural ecosystems, confronting heightened environmental complexities in conservation planning. Current preservation strategies face significant uncertainties requiring systematic identification and management [94]. Traditional blueprint-style planning, typically based on singular deterministic scenarios, frequently proves inadequate in addressing rapid human–environment dynamics, resulting in repetitive revisions that waste resources. Contemporary urban planning is undergoing paradigm shifts toward dynamic control mechanisms and flexible planning frameworks [95]. The proposed framework serves dual purposes: as a decision-making tool enhancing planning flexibility and uncertainty resilience through optimized resource allocation sequencing, and as a theoretical-methodological reference addressing persistent disconnections between landscape visual assessments and practical planning implementation in historical district conservation.
  • Multimodal GIS-integrated enhancement of SVS assessment accuracy and operational efficiency.
An interdisciplinary problem-oriented approach was adopted to ensure practical application and planning integration of the proposed framework, with an open-source, user-friendly, and replicable technical pathway established. Scientific validity was enhanced through high-precision multimodal data incorporating spatially attributed public perceptions, while operational feasibility was improved via GIS-based integration, computation, analysis, and spatial mapping of these datasets. Three innovative sub-criteria were introduced from public perception perspectives: kernel density of DP, kernel density of road integration, and population aggregation density. This methodology not only provides technical support for analogous streetscape assessments but also enables dynamic monitoring of visual sensitivity, scenic beauty, and SVS–PAP analytical matrix quadrants in historical districts.
In SVS criterion weighting calculations, subjective weight results derived from the AHP revealed a consistent prioritization by experts and public participants: remarkableness > visibility > number of potential users, with identical rankings being obtained through EWM objective calculations. The AHP-EWM integrated weighting results demonstrated significantly higher remarkableness weights compared to other criteria, followed by visibility sub-criteria based on physical landscape attributes. This hierarchical pattern indicates that historical-cultural attributes outweigh physical characteristics in HUL streetscape evaluations, contrasting with conventional streetscape assessments. Among 11 sub-criteria, the lowest weight was assigned to kernel density of road integration, suggesting spatial syntax theory-based accessibility quantification is insufficient to support planning in public perception-oriented historic streetscape studies.
Integrated SVS and PAP assessment results demonstrated that medium-to-high level road segments were predominantly located within Anshandao’s core conservation zones, indicating effective implementation of historic district conservation planning [96]. However, street-scale refined analyses revealed low scenic beauty segments within core zones and high scenic beauty segments in planning control areas. Non-conforming landscape elements were found to contain visually discordant features in low scenic beauty segments, while high scenic beauty segments in non-core zones were mainly characterized by vegetation-dominated landscapes. In compact historic districts like Anshandao with limited core zones, medium-sensitivity segments within core areas need to be prioritized for vitality enhancement strategies to optimize cultural ecosystem service provision. SVS–PAP quadrant analysis classified Segment 41 (requiring prioritized intervention) within core zones, along with five high-SVS–low-PAP segments along the Anshan Road axis. This methodological framework has proven effective in meeting precision and operational requirements for human-scale streetscape renewal while providing evidence-based decision support for subsequent planning phases. Furthermore, the technical pathway enables continuous monitoring of visual sensitivity, scenic beauty, and SVS–PAP quadrant dynamics across historic districts.

6.2. Assessing the Visual Sensitivity of the Streetscape—Limitations and Future Work

A theoretical framework and technical pathway for SVS–PAP evaluation were developed to address the key scientific challenge of enhancing assessment validity while ensuring planning applicability for historical district streetscapes. The framework’s decision-making capacity in multi-resource allocation optimization was thereby strengthened. During implementation, public perception-based multimodal data were systematically incorporated through streetscape-scale physical characteristic analysis, while subjective and objective factors were systematically coupled through landscape feature integration. Scientific rigor was enhanced through these dual approaches. GIS, MCE, AHP-EWM, SBE, and IPA methods were integrated to establish a replicable technical pathway, improving operational applicability and replicability. The Anshandao case study confirmed the framework’s effectiveness in resolving targeted scientific challenges and achieving research objectives.
However, urban historical district streetscapes constitute an open and complex mega-system, whose complexity, regionality, and dynamics preclude the existence of a universally applicable evaluation framework and methodology. Three main limitations are identified in this study: (1) The evaluation framework could be further enhanced through the development of public perception-based criteria and the integration of richer multi-modal data. (2) When historic districts requiring renewal and preservation involve larger areas encompassing more historic streets, the number of historic streets contained in each quadrant of the SVS–PAP analysis matrix proportionally increases. This scenario necessitates the introduction of more precise models or algorithms to further refine the calculation of renewal sequencing for all road segments within the same quadrant. (3) For post-determination of renewal sequences via the SVS–PAP matrix, systematic analysis is required to establish improvement strategies for streetscape esthetic quality, particularly through elucidating the coupling mechanisms between landscape element quality and human perceptual evaluation. These unresolved challenges represent both current limitations and future research priorities. Previous studies suggest that landscape visual sensitivity assessment holds potential not only for integrated esthetic planning with PAP frameworks, but also for multi-sensory evaluations incorporating auditory/olfactory dimensions [55], and comprehensive sensitivity assessments combining ecological/cultural dimensions [61]. Substantial potential remains for exploration, refinement, and innovation in these extensible research directions focused on historic district streetscapes.

7. Conclusions

The transition of urban development into stock renewal phases has positioned the establishment of human–environment symbiosis under sustainable development goals as a globally shared vision. Historic streets, as essential physical carriers of urban cultural, natural, and spatial genetic characteristics, have been recognized for their significant artistic, scientific, and historical value. The quality of historic streetscape visual characteristics has been identified as a determinant factor influencing human well-being, prompting global policy initiatives for their conservation and sustainable utilization. This study has consequently focused on historic district streetscape-visual quality assessment through the innovative SVS–PAP methodology, addressing the persistent neglect of urban spiritual and cultural values—particularly streetscape esthetic quality—in multi-resource planning decisions, which has contributed to urban homogenization and cultural discontinuity. A planning-oriented SVS–PAP theoretical framework has been developed, complemented by technical implementation pathways. Empirical validation conducted in Anshandao Historic District confirmed the methodology’s scientific validity, operational reliability, and practical feasibility. The research objectives have been fully achieved through the development of theoretical foundations and technical protocols for translating evaluation outcomes into planning applications. The implementation of the methodology in planning decision-making processes has demonstrated its capacity to address the marginalization of esthetic values in multi-resource trade-offs, thereby laying critical foundations for preserving the esthetic quality of historic districts.
Five principal findings were identified through this research: First, a theoretical SVS–PAP assessment framework was established through the landscape–perception coupling perspective, demonstrating operational feasibility and reliability in human-scale streetscape assessments. The scientific rigor of streetscape evaluations was enhanced through subjective–objective factor integration, establishing theoretical foundations for future SVS assessments and planning integration. Second, a technical pathway integrating multi-modal data and GIS technologies was developed, significantly improving evaluation precision, operational applicability, and methodological replicability, while enabling planning translation of SVS–PAP outcomes. Third, an SVS–PAP analytical matrix was constructed through IPA and scenario planning theory, identifying four streetscape intervention scenarios with corresponding planning strategies formulated through expert knowledge integration. This implementation confirmed the methodology’s reliability at street-level applications while providing transferable protocols for analogous studies. Fourth, historical factors (particularly landmark landscapes) were found to carry significantly higher weighting coefficients across evaluation criteria compared to non-historic streetscape assessments. Fifth, significantly higher SVS and PAP values were documented in Anshandao’s core conservation zones compared to planning control areas. This finding empirically validates the significant impact of governmental conservation and utilization policies formulated by administrative authorities on historic district preservation outcomes.
In this study, the term “historic district” is defined as an inclusive concept encompassing historic cities, historic urban areas, historic sites, and historic conservation zones, which collectively reflect the traditional characteristics and regional identity of specific historical periods. Historic streets within these districts are not solely designated as cultural heritage protection zones but are institutionally linked to conservation planning frameworks of nationally designated historic cities and districts, as well as provincial/municipal-level historic landscape preservation areas. The SVS–PAP methodology has been developed for application to historic streets in modern Sino-Western cultural confluence cities, including visual landscape assessments of street typologies such as historic thoroughfares, traditional hutongs, heritage corridors, road heritage sites, character preservation roads within designated historic cities, conservation areas, urban districts, heritage sites, landscape preservation zones, and famous historic streets.
Furthermore, the SVS–PAP assessment methodology can be applied to visual landscape evaluations of non-historic streetscapes through adjustments and optimizations of multi-level SVS criteria and the replacement of PAP photographic questionnaires. The proposed assessment framework has been demonstrated to possess both historic landscape specificity and potential cross-contextual applicability. Three principal limitations have been identified: implementation sequencing determination for conservation-renewal projects within identical scenario types, multisensory coupling analyses, and multi-dimensional evaluation coordination. Subsequent research should therefore prioritize theoretical and methodological refinements in these domains while maintaining the established conceptual foundation.

Author Contributions

Conceptualization, Y.-N.F. and A.N.; methodology, Y.-N.F.; software, Y.-N.F., A.N. and S.Z.; validation, Y.-N.F., A.N., S.Z. and T.F.; formal analysis, Y.-N.F. and A.N.; investigation, Y.-N.F. and T.F.; resources, Y.-N.F., A.N. and S.Z.; data curation, Y.-N.F., S.Z. and T.F.; writing—original draft preparation, Y.-N.F.; writing—review and editing, Y.-N.F., A.N. and S.Z.; visualization, Y.-N.F. and A.N.; supervision, Y.-N.F. and T.F.; project administration, Y.-N.F.; funding acquisition, Y.-N.F. All authors have read and agreed to the published version of the manuscript.

Funding

This research was funded by Tianjin Philosophy and Social Science Planning Project, China (Grant number TJGL24-002).

Institutional Review Board Statement

The study was conducted in accordance with the Declaration of Helsinki and approved by the Institutional Review Board of Tianjin Normal University (Protocol code 2025042404; date of approval: 24 April 2025).

Data Availability Statement

The datasets supporting the findings of this study are partially available from the first author upon request.

Acknowledgments

The authors express sincere appreciation to all voluntary respondents participating in the research survey questionnaires and the anonymous peer reviewers.

Conflicts of Interest

Author Tianjia Feng was employed by the company Tianjin Urban Planning and Design Institute Co., Ltd. The remaining authors declare that the research was conducted in the absence of any commercial or financial relationships that could be construed as a potential conflict of interest.

Abbreviations

The following abbreviations are used in this manuscript:
GISGeographic information system
HULHistoric urban landscape
SVSStreetscape visual sensitivity
LVSLandscape visual sensitivity
PAPPublic esthetic perceptions
EWMEntropy weight method
LVQLandscape visual quality
DEMDigital elevation model
MCEMulti-criteria evaluation
AHPAnalytic hierarchy process
SBEScenic beauty estimation
POIPoint of interest
DPDianping
IPAImportance–performance analysis

Appendix A

Table A1. List of representative literature on LVS assessment.
ReferencesLandscape
Type
Main
Criterion
Sub-CriterionApproachesStrategies
Store et al., 2015 [47]Forest landscapeVisibilitySummit and slope forests; Edge forests; Vantage pointsGIS-based multi-criteria evaluation (MCE) approach; AHP approach based on landscape expert questionnaire was used to obtain weights for sensitivity criteria.Qualitative description of assessment results; No clear planning strategy.
Potential usersSettlements; Second homes; Accommodation services; Outdoor recreation; Traffic
Attractiveness of landscapeValuable landscapes; Small-scale attractions; Water system; Variability
Wang and Qu, 2018 [52]Urban landscapeSlopeGIS-based MCE approach; Conjunction–disjunction approach.Rough planning and management strategies were obtained based on a qualitative analysis of the assessment results.
Distance
Visual probability
Remarkableness
Yang et al., 2019 [43]Plantation forest landscapeAmount and attention of usersResidential area; Recreation area; Road levelGIS-based MCE approach; AHP approach based on landscape expert questionnaire was used to obtain weights for sensitivity criteria.Qualitative description of assessment results; No clear planning strategy.
Landscape attractivenessVegetation uniformity/Color diversity; Terrain diversity; Edge presence; Location significance
Viewing conditionDistance; Visibility
Zheng et al., 2019 [62] *Urban forest park landscapeVisual sensitivitySlope; Distance; VisibilityGIS-based MCE approach; Minimum-value approach; AHP approach.Rough planning and management strategies were obtained based on a qualitative analysis of the assessment results.
Ecological sensitivityElevation; Slope; Aspect; Forest Type; Distance to river
Manolaki et al., 2020 [61] *Mediterranean island landscapeEcological sensitivityEcological integrity; Ecological valueGIS-based MCE approach.Landscape sensitivity classification results were obtained by superimposing the three main criteria. No clear planning strategy.
Cultural sensitivityCultural integrity; Cultural Value
Visual sensitivityLandform; Tree/Shrub cover; View to the sea
Fang et al., 2021 [42]Historic district landscapeVisibilityRelative slope; Relative distance; Visual probabilityGIS-based MCE approach; Conjunction–disjunction approach.Rough planning and management strategies were obtained based on a qualitative analysis of the assessment results.
Number of potential usersKernel density of historic buildings; Kernel density of POI
RemarkablenessValuable landscapes; Bus stop visible area; Visual hotspot visible area
Dong et al., 2022 [15] *Forest landscapeScenic qualityVividness; Diversity; IntegrityGIS-based MCE approach; AHP approach based on landscape expert questionnaire was used to obtain criteria weights.Planning and management strategies came from the superposition and classification of three main criteria.
Visual sensitivityRelative slope; Relative sight distance; Visual probability and conspicuity
Visual absorption capabilitySlope; Aspect; Topographic relief; Vegetation richness; Soil stability
Lu et al., 2023 [53]Geological landscapeSlopeGIS-based MCE approach; Semantic analysis approach.Qualitative description of assessment results; No clear planning strategy.
Relative distance
Viewing odds
Visual acuity
Zhu et al., 2023 [55] *Geopark landscapeVisualscapeSBE; Visual sensitivity (relative slope, relative distance, sight probability)GIS spatial analysis, SBE, and a questionnaire survey approach.Planning and management strategies were obtained using the audio-visual preference matrix.
SoundscapeSoundscape satisfaction
Yang et al., 2023 [63] *Historic district landscapeLandscape ecological sensitivityElevation; Land use type; Slope; Aspect; Distance from water; NDVIGIS-based MCE approach; CRITIC weighting approach.Planning and management strategies were obtained through qualitative analysis of assessment results and statistical correlation analysis of assessment factors.
Landscape visual sensitivityTraffic accessibility; Street view; Random point view
Landscape cultural sensitivitySHDI; Density of heritage buildings; Density of tourist attractions
Zhou et al., 2023 [56] *Terraced agricultural landscape with cultural resourceLandscape visual sensitivityRelative slope; Relative distance; Occurrence probabilityGIS spatial analysis and SBE approach.Planning and management strategies were obtained using the sensitivity–subjectivity preference matrix.
Subjective preferenceLandscape beauty (SBE)
Xu and Matsushima, 2023 [60] *Forest-based scenic spotsLandscape visual sensitivitySlope; Distance from the viewpoints; Visual probability; Remarkableness degreeGIS spatial analysis and SBE approach, AHP approach; Minimum cumulative resistance model.Planning and management strategies were derived from the superposition and analysis of assessment results.
Landscape estheticScenic beauty
Kou et al., 2024 [58] *World Heritage landscapeVisual sensitivityRelative slope; Relative distance; Visibility probability; ConspicuousnessGIS-based MCE approach; Conjunction–disjunction approach; AHP approach; public questionnaire approach; Gray clustering evaluation.Rough planning and management strategies were obtained using the matrix method.
Visual perceptionNatural landscape integrity; Hydrological texture continuity et al.
* Integrated assessment framework including LVS.
Table A2. The demographic characteristics of 349 questionnaire participants.
Demographic CharacteristicsVariables
Gender (%)Male103
Female246
Age (%)Less than 185
18–24255
25–3015
31–407
41–509
51–609
Greater than 6049
Main field of study (at university) (%)Urban and rural planning/Art and design/Architectural design/Fine arts125
Other224
Have you ever visited the Anshandao historic district?Yes147
No202
Length of stay (work/study/travel) in Tianjin (%)Never visited Tianjin before15
1 month and less27
2–11 months80
12 months–4 years124
5–10 years36
11–20 years40
Longer than 20 years27

References

  1. Millennium Ecosystem Assessment. Millennium Ecosystem Assessment Ecosystems and Human Well Being: Current State and Trends Assessment; Island Press: London, UK, 2005. [Google Scholar]
  2. Giné, D.S.; Albert, M.Y.P.; Buendía, A.V.P. Aesthetic assessment of the landscape using psychophysical and psychological models: Comparative analysis in a protected natural area. Landsc. Urban Plan. 2021, 214, 104197. [Google Scholar] [CrossRef]
  3. Dronova, I. Landscape beauty: A wicked problem in sustainable ecosystem management? Sci. Total Environ. 2019, 688, 584–591. [Google Scholar] [CrossRef] [PubMed]
  4. Duan, J.; Jiang, Y.; Li, Y.; Lan, W. Space Gene: Connotation and functional mechanism. City Plan. Rev. 2022, 46, 7–14. [Google Scholar]
  5. UNESCO. New Life for Historic Cities: The Historic Urban Landscape Approach Explained. Available online: https://unesdoc.unesco.org/ark:/48223/pf0000220957 (accessed on 26 April 2025).
  6. Bandarin, F.; van Oers, R. The Historic Urban Landscape: Managing Heritage in an Urban Century; John Wiley & Sons: West Sussex, UK, 2012. [Google Scholar]
  7. GB/T 50357-2018; Standard of Conservation Planning for Historic City. China Architecture & Building Press: Beijing, China, 2018.
  8. UNESCO. Recommendation on the Historic Urban Landscape. Available online: https://whc.unesco.org/uploads/activities/documents/activity-638-98.pdf (accessed on 10 August 2022).
  9. UNESCO. Vienna Memorandum on World Heritage and Contemporary Architecture: Managing the Historic Urban Landscape and Decision 29 COM 5D. Available online: https://unesdoc.unesco.org/ark:/48223/pf0000140984?posInSet=1&queryId=0d7dade6-f8c0-4311-a334-13ca7671b0d8 (accessed on 26 April 2025).
  10. National Cultural Heritage Administration. Cultural Heritage Protection Law of the People’s Republic of China (Draft Revision). Available online: https://www.gov.cn/xinwen/2020-11/11/content_5560460.htm (accessed on 11 November 2020).
  11. General Office of the State Council. Regulations on the Protection of Historic and Cultural Cities, Towns, and Villages. Available online: https://www.gov.cn/gongbao/content/2019/content_5468892.htm (accessed on 21 November 2023).
  12. General Office of the Communist Party of China Central Committee; General Office of the State Council. Guidelines on Strengthening Historic and Cultural Conservation and Inheritance in Urban and Rural Construction. Available online: http://www.gov.cn/zhengce/2021-09/03/content_5635308.htm (accessed on 26 January 2022).
  13. GB 55035-2023; Technical Standards for Urban and Rural Historic-Cultural Conservation and Utilization Projects. China Architecture & Building Press: Beijing, China, 2023.
  14. USDI, Bureau of Land Management. Visual Resource Management; Bureau of Land Management: Washington, DC, USA, 1976.
  15. Dong, S.; Ma, J.; Mo, Y.; Yang, H. GIS-Based Watershed Unit Forest Landscape Visual Quality Assessment in Yangshuo Section of Lijiang River Basin, China. Sustainability 2022, 14, 14895. [Google Scholar] [CrossRef]
  16. Swanwick, C. Topic Paper 6: Techniques and criteria for judging capacity and sensitivity. In Landscape Character Assessment: Guidance for England and Scotland; NatureScot: Inverness, Scotland, 2002. [Google Scholar]
  17. Council of Europe. European Landscape Convention; Council of Europe: Saint-Strasbourg, France, 2000. [Google Scholar]
  18. Carson, R. Silent Spring; Houghton Mifflin: Boston, MA, USA, 1962. [Google Scholar]
  19. Environmental Protection Agency. National Environmental Policy Act of 1969; Environmental Protection Agency: Washington, DC, USA, 1969.
  20. Sullivan, R.G.; Meyer, M.; O’Rourke, D.J. Comparison of Visual Impact Analysis under the National Environmental Policy Act and Section 106 of the National Historic Preservation Act. In Visual Resource Stewardship: Landscape and Seascape Management in a Time of Change; Argonne National Laboratory: Lemont, IL, USA, 2018. [Google Scholar]
  21. Daniel, T.C. Whither scenic beauty? Visual landscape quality assessment in the 21st century. Landsc. Urban Plan. 2001, 54, 267281. [Google Scholar] [CrossRef]
  22. Gobster, P.H.; Ribe, R.G.; Palmer, J.F. Themes and trends in visual assessment research: Introduction to the Landscape and Urban Planning special collection on the visual assessment of landscapes. Landsc. Urban Plan. 2019, 191, 103635. [Google Scholar] [CrossRef]
  23. Gussow, A. Conserving the magnitude of uselessness: A philosophical perspective. In Proceedings of Our National Landscape: A Conference on Applied Techniques for Analysis and Management of the Visual Resource; Pacific Southwest Forest and Range Experiment Station: Berkeley, CA, USA, 1979. [Google Scholar]
  24. Kreimer, A. Environmental preferences: A critical analysis of some research methodologies. J. Leisure Res. 1977, 9, 88–97. [Google Scholar] [CrossRef]
  25. Appleton, J. Landscape evaluation: The theoretical vacuum. Trans. Inst. Br. 1975, 66, 120–123. [Google Scholar] [CrossRef]
  26. Congressional Research Service. Coastal Zone Management Act of 1972; Congressional Research Service: Washington, DC, USA, 1972.
  27. USDA Forest Service. Proceedings of Our National Landscape; U.S. Forest Service: Washington, DC, USA, 1979.
  28. USDA Forest Service. The Visual Management System; U.S. Forest Service: Washington, DC, USA, 1973.
  29. Ulrich, R.S. Aesthetic and Affective Response to Natural Environment. Behav. Nat. Environ. 1983, 6, 85–125. [Google Scholar] [CrossRef]
  30. Kaplan, S.; Kaplan, R. Cognition and Environment: Functioning in an Uncertain World; Praeger: New York, NY, USA, 1982. [Google Scholar]
  31. Daniel, T.C.; Boster, R.S. Measuring Landscape Esthetics: The Scenic Beauty Estimation Method; U.S. Forest Service: Washington, DC, USA, 1976.
  32. Lothian, A. Landscape and the philosophy of aesthetics: Is landscape quality inherent in the landscape or in the eye of the beholder? Landsc. Urban Plan. 1999, 44, 177–198. [Google Scholar] [CrossRef]
  33. Gobster, P.H. An ecological aesthetic for forest landscape management. Landsc. J. 1999, 18, 54–64. [Google Scholar] [CrossRef]
  34. Appleton, J. The Experience of Landscape; Revised Edition; John Wiley & Sons: Hoboken, NJ, USA, 1975. [Google Scholar]
  35. Kaplan, R.; Kaplan, S. The Experience of Nature: A Psychological Perspective; CUP Archive; Cambridge University Press: Cambridge, UK, 1989. [Google Scholar]
  36. Zube, E.H.; Sell, J.L.; Taylor, J.G. Landscape Perception: Research, Application and Theory. Landsc. Plan. 1982, 1, 1–33. [Google Scholar] [CrossRef]
  37. Fang, Y.; Tian, J.; Namaiti, A.; Zhang, S.; Zeng, J.; Zhu, X. Visual aesthetic quality assessment of the streetscape from the perspective of landscape-perception coupling. Environ. Impact Asses 2024, 106, 107535. [Google Scholar] [CrossRef]
  38. Smardon, R. Ecosystem Services for Scenic Quality Landscape Management: A Review. Land 2021, 10, 1123. [Google Scholar] [CrossRef]
  39. Wang, L.; Sun, C.; Wang, M. Optimization Strategies for Waterfront Plant Landscapes in Traditional Villages: A Scenic Beauty Estimation–Entropy Weighting Method Analysis. Sustainability 2024, 16, 7140. [Google Scholar] [CrossRef]
  40. Litton, R.B. Visual Vulnerability of Forest Landscapes. J. Forest 1974, 72, 392397. Available online: https://academic.oup.com/jof/article/72/7/392/4660904?login=false (accessed on 7 May 2025).
  41. Thomas, M.F. Landscape sensitivity in time and space—An introduction. Catena 2001, 42, 83–98. [Google Scholar] [CrossRef]
  42. Fang, Y.; Zeng, J.; Namaiti, A. Landscape Visual Sensitivity Assessment of Historic Districts—A Case Study of Wudadao Historic District in Tianjin, China. Isprs Int. J. Geo-Inf. 2021, 10, 175. [Google Scholar] [CrossRef]
  43. Yang, H.; Li, Y.; Zhang, Z.; Xu, Z.; Huang, X. GIS-Based Multi-Criteria Assessment and Seasonal Impact on Plantation Forest Landscape Visual Sensitivity. Forests 2019, 10, 297. [Google Scholar] [CrossRef]
  44. Haara, A.; Store, R.; Leskinen, P. Analyzing uncertainties and estimating priorities of landscape sensitivity based on expert opinions. Landsc. Urban Plan. 2017, 163, 56–66. [Google Scholar] [CrossRef]
  45. Yu, K. Assessment of landscape sensitivity and impact resistability: With a case study of Wangxiangyan Canyon in south MT. Taihang. Geogr. Res. 1991, 10, 38–51. [Google Scholar]
  46. Bacon, W.R. The visual management system of forest service. In Proceedings of Our National Landscape; U.S. Forest Service: Washington, DC, USA, 1979. [Google Scholar]
  47. Store, R.; Karjalainen, E.; Haara, A.; Leskinen, P.; Nivala, V. Producing a sensitivity assessment method for visual forest landscapes. Landsc. Urban Plan. 2015, 144, 128–141. [Google Scholar] [CrossRef]
  48. Das, R.; Singh, T.D. Image–Text Multimodal Sentiment Analysis Framework of Assamese News Articles Using Late Fusion. ACM Trans. Asian Low-Resour. Lang. Inf. Process. 2023, 22, 161. [Google Scholar] [CrossRef]
  49. Zhang, R.; Yan, X.; Wang, C.; Chen, J. Research on emotional interaction between people and built environment driven by multi-modal data: Take Wudaokou Jingzhang railway park as an example. Urban Dev. Stud. 2022, 29, 55–66. [Google Scholar]
  50. Bai, L.; Huang, W.; Zhang, X.; Du, S.; Cong, G.; Wang, H.; Liu, B. Geographic mapping with unsupervised multi-modal representation learning from VHR images and POIs. Isprs J. Photogramm. 2023, 201, 193–208. [Google Scholar] [CrossRef]
  51. Zhang, H.; Li, L.; Liu, D. A survey of multimodal data fusion research. J. Front. Comput. Sci. Technol. 2024, 18, 2501–2520. [Google Scholar] [CrossRef]
  52. Wang, F.; Qu, X. The study of urban landscape visual sensitivity assessments: A case study in the Zhongshan District of Dalian. J. Spat. Sci. 2018, 63, 325–340. [Google Scholar] [CrossRef]
  53. Lu, X.; Liu, R.; Xia, L. Landscape planning and design and visual evaluation for landscape protection of geological environment. J. King Saud Univ. Sci. 2023, 35, 102735. [Google Scholar] [CrossRef]
  54. Swetnam, R.D.; Harrison-Curran, S.K.; Smith, G.R. Quantifying visual landscape quality in rural Wales: A GIS-enabled method for extensive monitoring of a valued cultural ecosystem service. Ecosyst. Serv. 2017, 26, 451–464. [Google Scholar] [CrossRef]
  55. Zhu, Y.; Pang, X.; Zhou, C. Key area recognition and evaluation of audio-visual landscape for global geoparks: A case study of Koktokay in China. Land 2023, 12, 1799. [Google Scholar] [CrossRef]
  56. Zhou, L.; Zhao, Y.; Yang, X.; He, J.; Wang, H. Identification of important terraced visual landscapes based on a sensitivity-subjectivity preference matrix for agricultural cultural heritage in the southwestern china. Ecol. Indic. 2023, 154, 110573. [Google Scholar] [CrossRef]
  57. Huang, T.; Zhang, Y.; Li, S.; Griffiths, G.; Lukac, M.; Zhao, H.; Yang, X.; Wang, J.; Liu, W.; Zhu, J. Harnessing machine learning for landscape character management in a shallow relief region of China. Landsc. Res. 2023, 48, 1019–1040. [Google Scholar] [CrossRef]
  58. Kou, H.; Zhang, L.; Zhang, S. Visual impact assessment method for cultural heritage: West Lake cultural landscape in Hangzhou, China. Land 2024, 13, 1596. [Google Scholar] [CrossRef]
  59. Luo, X.; Li, X.; Liu, W.; Wang, M.; Liu, C. Comprehensive evaluation of natural landscapes before and after earthquake based on GST-FAHP-GIS analytical method: A case study of Jiuzhaigou Nature Reserve, China. Ecol. Indic. 2023, 154, 110850. [Google Scholar] [CrossRef]
  60. Xu, M.; Matsushima, H. Establishing Landscape Networks Based on Visual Quality and Ecological Resistance: A Case Study in Tianmeng Scenic Spot, China. Forests 2023, 14, 516. [Google Scholar] [CrossRef]
  61. Manolaki, P.; Zotos, S.; Vogiatzakis, I.N. An integrated ecological and cultural framework for landscape sensitivity assessment in Cyprus. Land. Use Policy 2020, 92, 104336. [Google Scholar] [CrossRef]
  62. Zheng, Y.; Lan, S.; Chen, W.Y.; Chen, X.; Xu, X.; Chen, Y.; Dong, J. Visual sensitivity versus ecological sensitivity: An application of GIS in urban forest park planning. Urban For. Urban Gree. 2019, 41, 139–149. [Google Scholar] [CrossRef]
  63. Yang, X.; Shen, J. Landscape Sensitivity Assessment of Historic Districts Using a GIS-Based Method: A Case Study of Beishan Street in Hangzhou, China. Isprs Int. J. Geo-Inf. 2023, 12, 462. [Google Scholar] [CrossRef]
  64. Saaty, T.L. The Analytic Hierarchy Process; McGraw-Hill: New York, NY, USA, 1980. [Google Scholar]
  65. Vaidya, O.S.; Kumar, S. Analytic hierarchy process: An overview of applications. Eur. J. Oper. Res. 2006, 169, 1–29. [Google Scholar] [CrossRef]
  66. Li, X.; Pan, Y.; Shi, C.; Guo, Y. Research on protection and construction of historical village landscape based on AHP-FCE Model evaluation. J. Northwest For. Univ. 2022, 37, 257–265. [Google Scholar] [CrossRef]
  67. Shannon, C.E. A Mathematical Theory of Communication. Bell Syst. Tech. J. 1948, 27, 623–656. [Google Scholar] [CrossRef]
  68. Batty, M. Spatial Entropy. Geogr. Anal. 1974, 6, 1–31. [Google Scholar] [CrossRef]
  69. Antrop, M. Landscape change: Plan or chaos? Landsc. Urban Plan. 1998, 41, 155–161. [Google Scholar] [CrossRef]
  70. Zhou, S.; Fu, Y.; Xu, Z.; Yang, M.; Han, W. Geological disasters susceptibility mapping in Fujian Province based on subjective and objective weighting. J. Saf. Environ. 2023, 23, 3204–3214. [Google Scholar] [CrossRef]
  71. Aihemaiti, N.; Zeng, J.; Jiang, F. Supply–Demand analysis and planning intervention of emergency shelter services based on comprehensive disaster risk: A case study in Tianjin. J. Catastrophol. 2022, 37, 92–100. [Google Scholar]
  72. Tian, F.; Ma, Q.; Zhang, M.; Tang, Z. Evaluation of water quality in Xin’anjiang River Basin based on principal component analysis and entropy weight method. Geol. China 2023, 50, 495–505. [Google Scholar] [CrossRef]
  73. Meng, S.; Yang, F.; Li, Z.; Shi, P.; Zhang, S. The Satisfaction Evaluation and Obstacle Factor Analysis of Villagers in Rural Landscape of Guangxi-A Case Study of Northern Villages in Beiliu City. Chin. Landsc. Archit. 2022, 38, 87–92. [Google Scholar] [CrossRef]
  74. Martilla, J.A.; James, J.C. Importance-Performance Analysis. J. Mark. 1977, 41, 77–79. [Google Scholar] [CrossRef]
  75. Lai, I.K.W.; Wong, J.W.C. Comparing crisis management practices in the hotel industry between initial and pandemic stages of COVID-19. Int. J. Contemp. Hosp. Manag. 2020, 32, 3135–3156. [Google Scholar] [CrossRef]
  76. Phadermrod, B.; Crowder, R.M.; Wills, G.B. Importance-performance analysis based SWOT analysis. Int. J. Inform. Manag. 2019, 44, 194–203. [Google Scholar] [CrossRef]
  77. Bi, J.; Liu, Y.; Fan, Z.; Zhang, J. Wisdom of crowds: Conducting importance-performance analysis (IPA) through online reviews. Tour. Manag. 2019, 70, 460–478. [Google Scholar] [CrossRef]
  78. Chen, Y.; Wang, Y.; Yi, T.; Hu, Y.; Qi, Y.; Xie, Z.; Xia, L.; Dong, C. Priority analysis of educational needs related to geriatric nursing competence among Chinese undergraduate nursing students: Application of Borich needs assessment, importance-performance analysis and locus for focus model. Nurse Educ. Pract. 2025, 83, 104253. [Google Scholar] [CrossRef] [PubMed]
  79. Ji, X.; Shao, L.; Du, Y. Collaborating with Local Communities to Identify Improvement Priorities for Historic Urban Landscape Based on Residents’ Satisfaction: An Application of Asymmetric Impact-Performance Analysis in Dandong, China. Sustainability 2020, 12, 1463. [Google Scholar] [CrossRef]
  80. Palmer, J.F. The contribution of a GIS-based landscape assessment model to a scientifically rigorous approach to visual impact assessment. Landsc. Urban Plan. 2019, 189, 80–90. [Google Scholar] [CrossRef]
  81. Hillier, B.; Iida, S. Network and Psychological Effects in Urban Movement; Springer: Berlin/Heidelberg, Germany, 2005; Volume 3693, pp. 475–490. [Google Scholar]
  82. Wu, Y.; Liu, Q.; Hang, T.; Yang, Y.; Wang, Y.; Cao, L. Integrating restorative perception into urban street planning: A framework using street view images, deep learning, and space syntax. Cities 2024, 147, 104791. [Google Scholar] [CrossRef]
  83. Wang, L.; Han, X.; He, J.; Jung, T. Measuring residents’ perceptions of city streets to inform better street planning through deep learning and space syntax. Isprs J. Photogramm. 2022, 190, 215–230. [Google Scholar] [CrossRef]
  84. sDNA Software. Available online: https://sdna.cardiff.ac.uk/sdna/software/software/ (accessed on 4 February 2025).
  85. Lerman, Y.; Rofè, Y.; Omer, I. Using Space Syntax to Model Pedestrian Movement in Urban Transportation Planning. Geogr. Anal. 2014, 46, 392–410. [Google Scholar] [CrossRef]
  86. Zhang, H. Extracting active population data based on Baidu Heat Maps for transportation planning applications. Urban Transp. China 2021, 19, 103–111. [Google Scholar]
  87. Xu, Q.; Zhou, X.; Zhou, S. Range identification of urban fringe areas and evaluation of urban vitality based on multisource data: Taking the main urban area of Hangzhou city as an example. Urban Dev. Res. 2024, 31, 80–88. [Google Scholar]
  88. Gkoltsiou, A.; Paraskevopoulou, A. Landscape character assessment, perception surveys of stakeholders and SWOT analysis: A holistic approach to historical public park management. J. Outdoor Recreat. Tour. 2021, 35, 100418. [Google Scholar] [CrossRef]
  89. Tianjin Municipal Bureau of Planning and Natural Resources. Tianjin Historic and Cultural City Conservation Plan (2021–2035) Draft for Public Consultation. Available online: https://ghhzrzy.tj.gov.cn/ywpd/cxgh_43015/ghgs/202211/t20221102_6024105.html (accessed on 23 July 2023).
  90. Ministry of Housing and Urban-Rural Development. Guidelines on Comprehensive Implementation of Urban Physical Examination Initiatives. Available online: https://www.gov.cn/zhengce/zhengceku/202312/content_6918801.htm (accessed on 1 May 2025).
  91. Ministry of Housing and Urban-Rural Development of the People’s Republic of China. 2022 Urban Assessment Indicator System; Ministry of Housing and Urban-Rural Development of the People’s Republic of China: Beijing, China, 2022. Available online: https://www.gov.cn/zhengce/zhengceku/2022-07/09/content_5700178.htm (accessed on 1 May 2025).
  92. Yang, Z.; Han, C.; Gu, T.; Zhang, L.; Li, G.; Zhao, J.; Huang, X. A study on visual impact assessment of the enclosing wall entourage of Chinese traditional private garden. Environ. Impact Asses 2024, 105, 107427. [Google Scholar] [CrossRef]
  93. Kalinauskas, M.; Mikša, K.; Inácio, M.; Gomes, E.; Pereira, P. Mapping and assessment of landscape aesthetic quality in Lithuania. J. Environ. Manag. 2021, 286, 112239. [Google Scholar] [CrossRef] [PubMed]
  94. He, L.; Song, Y.; Dai, S. Research on the paradigm of urban planning responding to uncertainty. City Plan. Rev. 2012, 36, 15–22. [Google Scholar]
  95. Dou, Y.; Zhang, S. Application of scenario analysis on urban planning in the past 30 years: A review and outlook of bibliometric-based research between 1991 and 2020. Urban Plan. Int. 2024, 39, 55–64. [Google Scholar] [CrossRef]
  96. Tianjin Urban Planning Information Center. Conservation Plan for Anshandao Historic and Cultural Conservation District, Tianjin. Available online: https://ghhzrzy.tj.gov.cn/ywpd/cxgh_43015/ghgb/202012/t20201206_4506849.html (accessed on 30 April 2025).
Figure 1. Case study area: (a) Urban planning map with sampling site distribution in Anshandao; (b) Geolocation of Anshandao within Tianjin, China.
Land 14 01036 g001
Figure 2. Three-dimensional urban digital elevation model (UDEM) of Anshandao. Altitude values in meters (m).
Land 14 01036 g002
Figure 3. Theoretical framework and implementation workflow of the SVS–PAP assessment methodology for historic district streetscapes.
Land 14 01036 g003
Figure 4. AHP-EWM hybrid workflow for SVS criteria weighting in historic districts.
Land 14 01036 g004
Figure 5. Hierarchical model based on the AHP method.
Land 14 01036 g005
Figure 6. Road-segment statistical results of nine sub-criteria under two main criteria: visibility and number of potential users.
Land 14 01036 g006
Figure 7. Quantified outcomes of three sub-criteria under the main criterion remarkableness.
Land 14 01036 g007
Figure 8. AHP-EWM-based assessment results of SVS for Anshandao: (a) Subjective weighting results of SVS assessment criteria; (b) Objective weighting results of SVS assessment criteria; (c) Integrated subjective–objective weighting results of SVS assessment criteria; (d) Segment-specific statistical results of SVS assessment values.
Land 14 01036 g008
Figure 9. M Z i and S B E (PAP) values for 54 road segments of Anshandao.
Land 14 01036 g009
Figure 10. (a) Normalized spatial distribution of PAP scenic beauty evaluation values; (be) On-site street-view imagery of representative road segments; (fh) On-site imagery of renowned scenic spots.
Land 14 01036 g010
Figure 11. Quadrant determination of Anshandao road segments based on the SVS–PAP analysis matrix.
Land 14 01036 g011
Figure 12. (a) Quadrant classifications and historic street-view imagery of Anshandao road segments; (b–g) On-site street-view imagery of representative road segments.
Land 14 01036 g012
Table 1. Data sources for assessing the SVS and PAP in the study area.
Type of Data SourceNameData TypeData SourceDate of Data Acquisition
Official government portals and historic district planning documentsThe protection planning scope of the Anshandao districtVectorTianjin Municipal Bureau of Planning and Natural Resources website; available online: https://ghhzrzy.tj.gov.cn/ (accessed on 7 March 2025)7 March 2025
Basic information on Tianjin’s historic buildingsVectorUnified open platform website of Tianjin’s information resources; available online: https://data.tj.gov.cn (accessed on 22 November 2020)22 November 2020
Building contour data with floor attribute information of AnshandaoVectorThrough the relevant planning documents and books on Wudadao, combined with field investigation and mapping2019–2025
Historic street and alley data of AnshandaoVector
Commercially licensed datasetsThe DEM of Tianjin with a 12.5 m accuracyRasterSuzhou Zhongke Tuxin Network; available online: http://www.tuxingis.com (accessed on 21 April 2020)21 April 2020
Point of interest (POI) data of TianjinVectorSuzhou Zhongke Tuxin Network; available online: http://www.tuxingis.com (accessed on 26 April 2020)26 April 2020
Open-access web-based repositoriesMunicipal road dataVectorAvailable online: https://www.openstreetmap.org (accessed on 22 April 2020)22 April 2020
Dianping data of AnshandaoVectorAvailable online: https://www.dianping.com (accessed on 12 May 2020)12 May 2020
Baidu heatmapRasterAvailable online: https://huiyan.baidu.com (accessed on 15 May 2020)15 May 2020
Field surveys and questionnaire-based investigationsPhotos of Anshandao street sceneryImage1406 digital camera photos of field photography in totalJune 2020–March 2025
Questionnaire dataStatistical dataThe weight evaluation data were obtained from both experts and the public using the analytical software Yaahp (Professional Edition, Version 12.11.8293).March 2024
Obtaining public esthetic assessment web questionnaire data through the Wenjuanxing app (a Chinese online survey tool)February–April 2025
Table 2. Names (symbols) and description of the SVS assessment criteria for historic districts.
Main CriterionIDSub-CriterionDescription
Visibility (VSv)aRelative slope (Sa)The projected area of the surface of a landscape element relative to the viewer’s line of sight [45]. The greater the slope of the landscape surface relative to the viewer’s line of sight, the greater the projected area. Therefore, the area where the landscape is seen by the viewer is greater, the possibility of being noticed is greater, and human activities in this area have a greater visual impact on the district environment.
bRelative distance (Sd)The relative distance of the elements of the streetscape in the historic district from the centerline of the road. The viewing area of the historic district is mainly located in the area accessible to the viewer, such as the roads at various levels in the district. The closer the relative distance of the streetscape elements from the road, the more visibility and clarity there will be, and the higher the SVS will be, as well as the greater the visual disturbance caused by human activities [45].
cVisual probability (St)The probability or duration of the appearance of streetscape elements within the viewer’s field of view. The longer the streetscape appears within the viewer’s field of view or the greater the probability of its appearance, the higher the SVS will be and the greater the probability of human activity disrupting the landscape [45,80].
Number of potential users (VSu)dKernel density of historic buildings (Sb)Kernel density calculation based on historical building point element data with spatial latitude and longitude coordinate attributes in the historic district. Buildings are an important element of the streetscape in historic districts and are the main physical carriers of the historical and cultural genes of the district. The greater the density of historically protected buildings, the higher the esthetic quality and attractiveness of the streetscape, which often indicates a higher potential number of local residents and out-of-town tourists coming here for leisure and sightseeing.
eKernel density of POI (Sp)Point of interest (POI) data contains rich commercial-type information. The calculation of POI kernel density needs to be based on POI point-feature data with attributes of spatial latitude and longitude coordinates. The higher the POI kernel density value, the greater the number of potential viewers.
fKernel density of DP (Sz) *The data from Dianping (a Chinese online platform for consumer reviews, hereinafter referred to as “DP”) contains the total number of public reviews accumulated by various businesses since they went online. The area with a higher kernel density value of the total number of reviews has a larger number of potential users. First, businesses with spatial latitude and longitude coordinates are created as point-feature datasets. Then, based on this dataset, the “Kernel Density” tool is used to calculate the kernel density value of all raster points in the study area. At the same time, the total number of reviews of businesses over the years is selected as the weight, and the weight is added through the “Population” field of the “Kernel Density” tool.
gKernel density of road integration (Si) *Uses the road local integration derived from space syntax theory as the fundamental data for subcriterion kernel density calculation [81]. Road local integration reflects the degree of aggregation or dispersion between a specific space and other spaces within the road network system, serving as a crucial parameter for measuring spatial accessibility [82,83]. Initially, local integration values of road segments were calculated based on historic district road centerline data and spatial topological relationships. This analysis was conducted using the sDNA toolkit (Version 4.1.1) embedded in the ArcGIS platform [84], applying an angle-weighted segment analysis method [81,85]. The search radius was configured as 400 m, representing a 5 min pedestrian walking catchment area. Subsequently, this subcriterion was derived through ArcMap’s Kernel density tool using the calculated local integration values. Higher kernel density values of road integration correspond to greater segment accessibility. This relationship implies that road segments with elevated integration density may attract increased pedestrian traffic as destination nodes, thereby enhancing the potential viewer population in the associated road segments.
hPopulation aggregation density (Sg) *The population aggregation density is represented by the monthly average heatmap data of workday pedestrian flow, as recorded through the Baidu Huiyan Platform. The Baidu Heatmap constitutes a dynamic representation of population aggregation density through open-access spatiotemporal big data. Compared to conventional data sources such as mobile phone signaling, public transit smart card records, and census-based demographic datasets, it demonstrates superior operational simplicity and enhanced temporal resolution in data acquisition [86,87]. The higher the heatmap value, the greater the population aggregation density and the greater the number of potential viewers. To ensure data validity, a deduplication algorithm is applied: repeated Wi-Fi-based localizations from the same user within a 24 h period are aggregated into a single daily record.
Remarkableness (VSe)iValuable landscapes (Sf) Renowned scenic spots, planned core areas, and high-development hotspots were identified as valuable landscape spaces exhibiting high visual sensitivity [47,88].
jVisual hotspot visibility (Sh) The visible area within 100 m of the visual hotspot is considered to have high visual sensitivity. The acquisition of this type of visible area in this study was based on planning documents and the total number of reviews accumulated by DP over the years.
kTransit stop visibility (Sr) The visible field of view within 100 m of the transit stop is considered to have high visual sensitivity. The acquisition of this type of visible area in this study is based on the POI transit stop data.
* Newly added sub-criterion compared to the literature [42]. Newly split sub-criterion based on literature [42].
Table 3. Pairwise comparison of criteria-layer groups (A/B): Importance weights toward decision goals.
APairwise Importance ComparisonB
Visibility98765432123456789Number of potential users
Visibility98765432123456789Remarkableness
Number of potential users98765432123456789Remarkableness
Table 4. Subjective weighting results of SVS assessment criteria for historic districts.
Main CriterionWeightsSub-CriterionWeights
Visibility0.290Relative slope0.075
Relative distance0.062
Visual probability0.152
Number of potential users0.150Kernel density of historic buildings0.036
Kernel density of POI0.019
Kernel density of DP0.025
Kernel density of road integration0.011
Population aggregation density0.059
Remarkableness0.561Valuable landscapes0.324
Visual hotspot visibility0.177
Transit stop visibility0.060
Table 5. Objective weighting results of SVS assessment criteria for historic district.
Main CriterionWeightsSub-CriterionWeights
Visibility0.244Relative slope0.164
Relative distance0.012
Visual probability0.068
Number of potential users0.211Kernel density of historic buildings0.024
Kernel density of POI0.012
Kernel density of DP0.148
Kernel density of road integration0.015
Population aggregation density0.012
Remarkableness0.545Valuable landscapes0.140
Visual hotspot visibility0.233
Transit stop visibility0.172
Table 6. Integrated subjective–objective weighting results of SVS assessment criteria for historic district.
Main CriterionWeightsSub-CriterionWeights
Visibility0.267Relative slope0.119
Relative distance0.037
Visual probability0.110
Number of potential users0.180Kernel density of historic buildings0.030
Kernel density of POI0.015
Kernel density of DP0.086
Kernel density of road integration0.013
Population aggregation density0.035
Remarkableness0.553Valuable landscapes0.232
Visual hotspot visibility0.205
Transit stop visibility0.116
Table 7. Quadrant-based scenario typology and strategic response priorities for Anshandao historic segments.
Scenario ArchetypeQuadrant AllocationScenario CharacterizationStrategic Priorities
Priority sustainment quadrantHigh SVS—High PAPStatus quo sustenance with priority conservation
Improvement priority quadrantHigh SVS—Low PAPTargeted intervention with renovation prioritization
De-prioritization quadrantLow SVS—Low PAPPhased regeneration under low-priority framework
Efficiency retention quadrantLow SVS—High PAPOperational continuity with efficiency retention
Disclaimer/Publisher’s Note: The statements, opinions and data contained in all publications are solely those of the individual author(s) and contributor(s) and not of MDPI and/or the editor(s). MDPI and/or the editor(s) disclaim responsibility for any injury to people or property resulting from any ideas, methods, instructions or products referred to in the content.

