1. Introduction
Remote sensing (RS) and geographic information systems (GIS) have become indispensable tools for monitoring and managing forest resources worldwide, particularly in countries with complex terrains and diverse ecosystems such as Vietnam. In forest land inventories, laser scanning is used, while linear regression methods are employed for automating land valuation assessments [
1]. Satellite systems enable the analysis of urban vegetation conditions [
2]. In forest management in Russia and European countries, digitalization is considered a promising approach [
3]. GIS technologies have been applied to establish protective zones around cultural heritage sites [
4]. In Vietnam, complex terrain and climatic conditions limit the extent and scale of research. With a forest cover of 47.6% and with most of the landscape being mountainous, traditional methods of forest land monitoring face significant limitations [
5]. Field-based surveys are often time-consuming, labor-intensive, and hindered by accessibility challenges in remote or rugged areas. Furthermore, the country’s diverse regional climate patterns and unpredictable natural disasters (including storms, floods, and prolonged droughts) consistently disrupt field data collection and verification efforts. Consequently, RS has emerged as the primary effective method for forest land monitoring [
6]. Nonetheless, challenges remain in developing comprehensive methodologies that fully utilize available data sources and analytical techniques. Current approaches often demonstrate deficiencies in classification accuracy, temporal change detection, and the integration of environmental variables into land cover analysis models [
7].
While previous studies have demonstrated the applicability of RS and GIS technologies in monitoring forest cover, many have relied primarily on spectral data, without integrating supplementary variables such as Digital Elevation Models (DEM), slope data, and socio-environmental factors [
8]. These omissions can result in oversimplified models that inadequately capture the factors of forest cover change.
RS technology has become an important tool in Earth research, enabling the collection of information about the surface and atmosphere remotely through sensors mounted on satellites, aircraft, or drones [
9]. With the ability to record multi-spectral, multi-spatial, and multi-temporal data, remote sensing provides a continuous data source that supports the monitoring of environmental changes with high accuracy. This technology is widely applied in various fields such as land cover mapping, forest monitoring, urban planning, disaster management, precision agriculture, and climate change research [
10]. A key advantage of remote sensing is its ability to cover large areas, including those that are hard to reach, providing synchronized and continuous real-time data. It can also be integrated with GIS for in-depth spatial analysis. As a result, RS is playing an increasingly essential role in both scientific research and supporting evidence-based decision making [
11].
GIS has revolutionized spatial analysis through its ability to integrate, process, and visualize multidimensional geographic data [
12]. Modern GIS platforms, including ArcGIS, QGIS, and the Google Earth Engine (GEE) cloud computing platform, offer significant advantages for forest cover monitoring. ArcGIS stands out for its comprehensive analytical toolset, user-friendly interface, and robust data processing capabilities, making it well suited for professional organizations. GEE enables the processing of large volumes of satellite data with high computational efficiency, facilitates cloud-based pre-processing (e.g., cloud masking, atmospheric correction), and supports the integration of multiple data types, including topographic and socio-environmental layers [
13]. Meanwhile, QGIS is a powerful, flexible, and cost-effective open-source solution.
The integration of RS data with GIS and machine learning algorithms enhances natural resource management by combining satellite data with ground-based measurements, climate indicators, and socio-economic factors [
14]. RS also contributes to addressing transboundary environmental issues such as deforestation and habitat fragmentation.
The simulation and prediction of land cover changes have become critical components of forest resource management, particularly in dynamic environments. The CA-Markov model, combining cellular automata and Markov chain analysis, has been widely used to simulate land use and land cover transitions based on historical patterns. For example, in Ezhou City, China, the Markov-FLUS model was successfully applied to forecast multi-scenario land use changes and ecosystem service dynamics under the expansion of construction land [
15]. Similarly, in the Cerrado/Atlantic forest ecotone of Brazil, Markov-based models contributed to understanding long-term land use and land cover change under the advancement of agriculture [
16]. These studies demonstrate the value of transition-based modeling frameworks in capturing land use trends over time.
However, the CA-Markov model relies exclusively on historical transition probabilities and assumes land cover change processes remain stationary over time. This approach cannot fully incorporate the influence of external factors. To overcome these limitations, new approaches, such as the MOLUSCE (Modules for Land Use Change Simulation) module integrated in QGIS, have been developed. MOLUSCE incorporates Artificial Neural Networks (ANNs) to model complex, nonlinear relationships between land cover changes and multiple environmental, socio-economic variables. These capabilities are crucial for enhancing the accuracy, scalability, and reproducibility of forest cover monitoring workflows [
17]. The application of ANNs to complex forest ecosystems, such as in the Eastern Mediterranean region of Turkey, has shown potential for evaluating eco-friendly soil slope stabilization techniques for forest roads [
18].
This study aims to address existing methodological limitations by developing an enhanced classification and prediction framework that integrates spectral, vegetative (NDVI), topographic (DEM, slope), climatic (temperature, precipitation) and anthropogenic (distance to road and urban centers) data. The Random Forest (RF) machine learning algorithm is used to classify land cover categories, and two predictive models—the CA-Markov model and the MOLUSCE module (based on Artificial Neural Networks, ANNs)—are compared to predict forest cover changes in three ecologically distinct provinces of Vietnam: Thanh Hoa, Kon Tum, and Dong Nai. By integrating diverse data sources and advanced modeling techniques, this research seeks to improve the robustness and accuracy of forest cover monitoring in Vietnam, contributing valuable insights for sustainable forest management and land use planning.
2. Materials and Methods
2.1. Study Areas
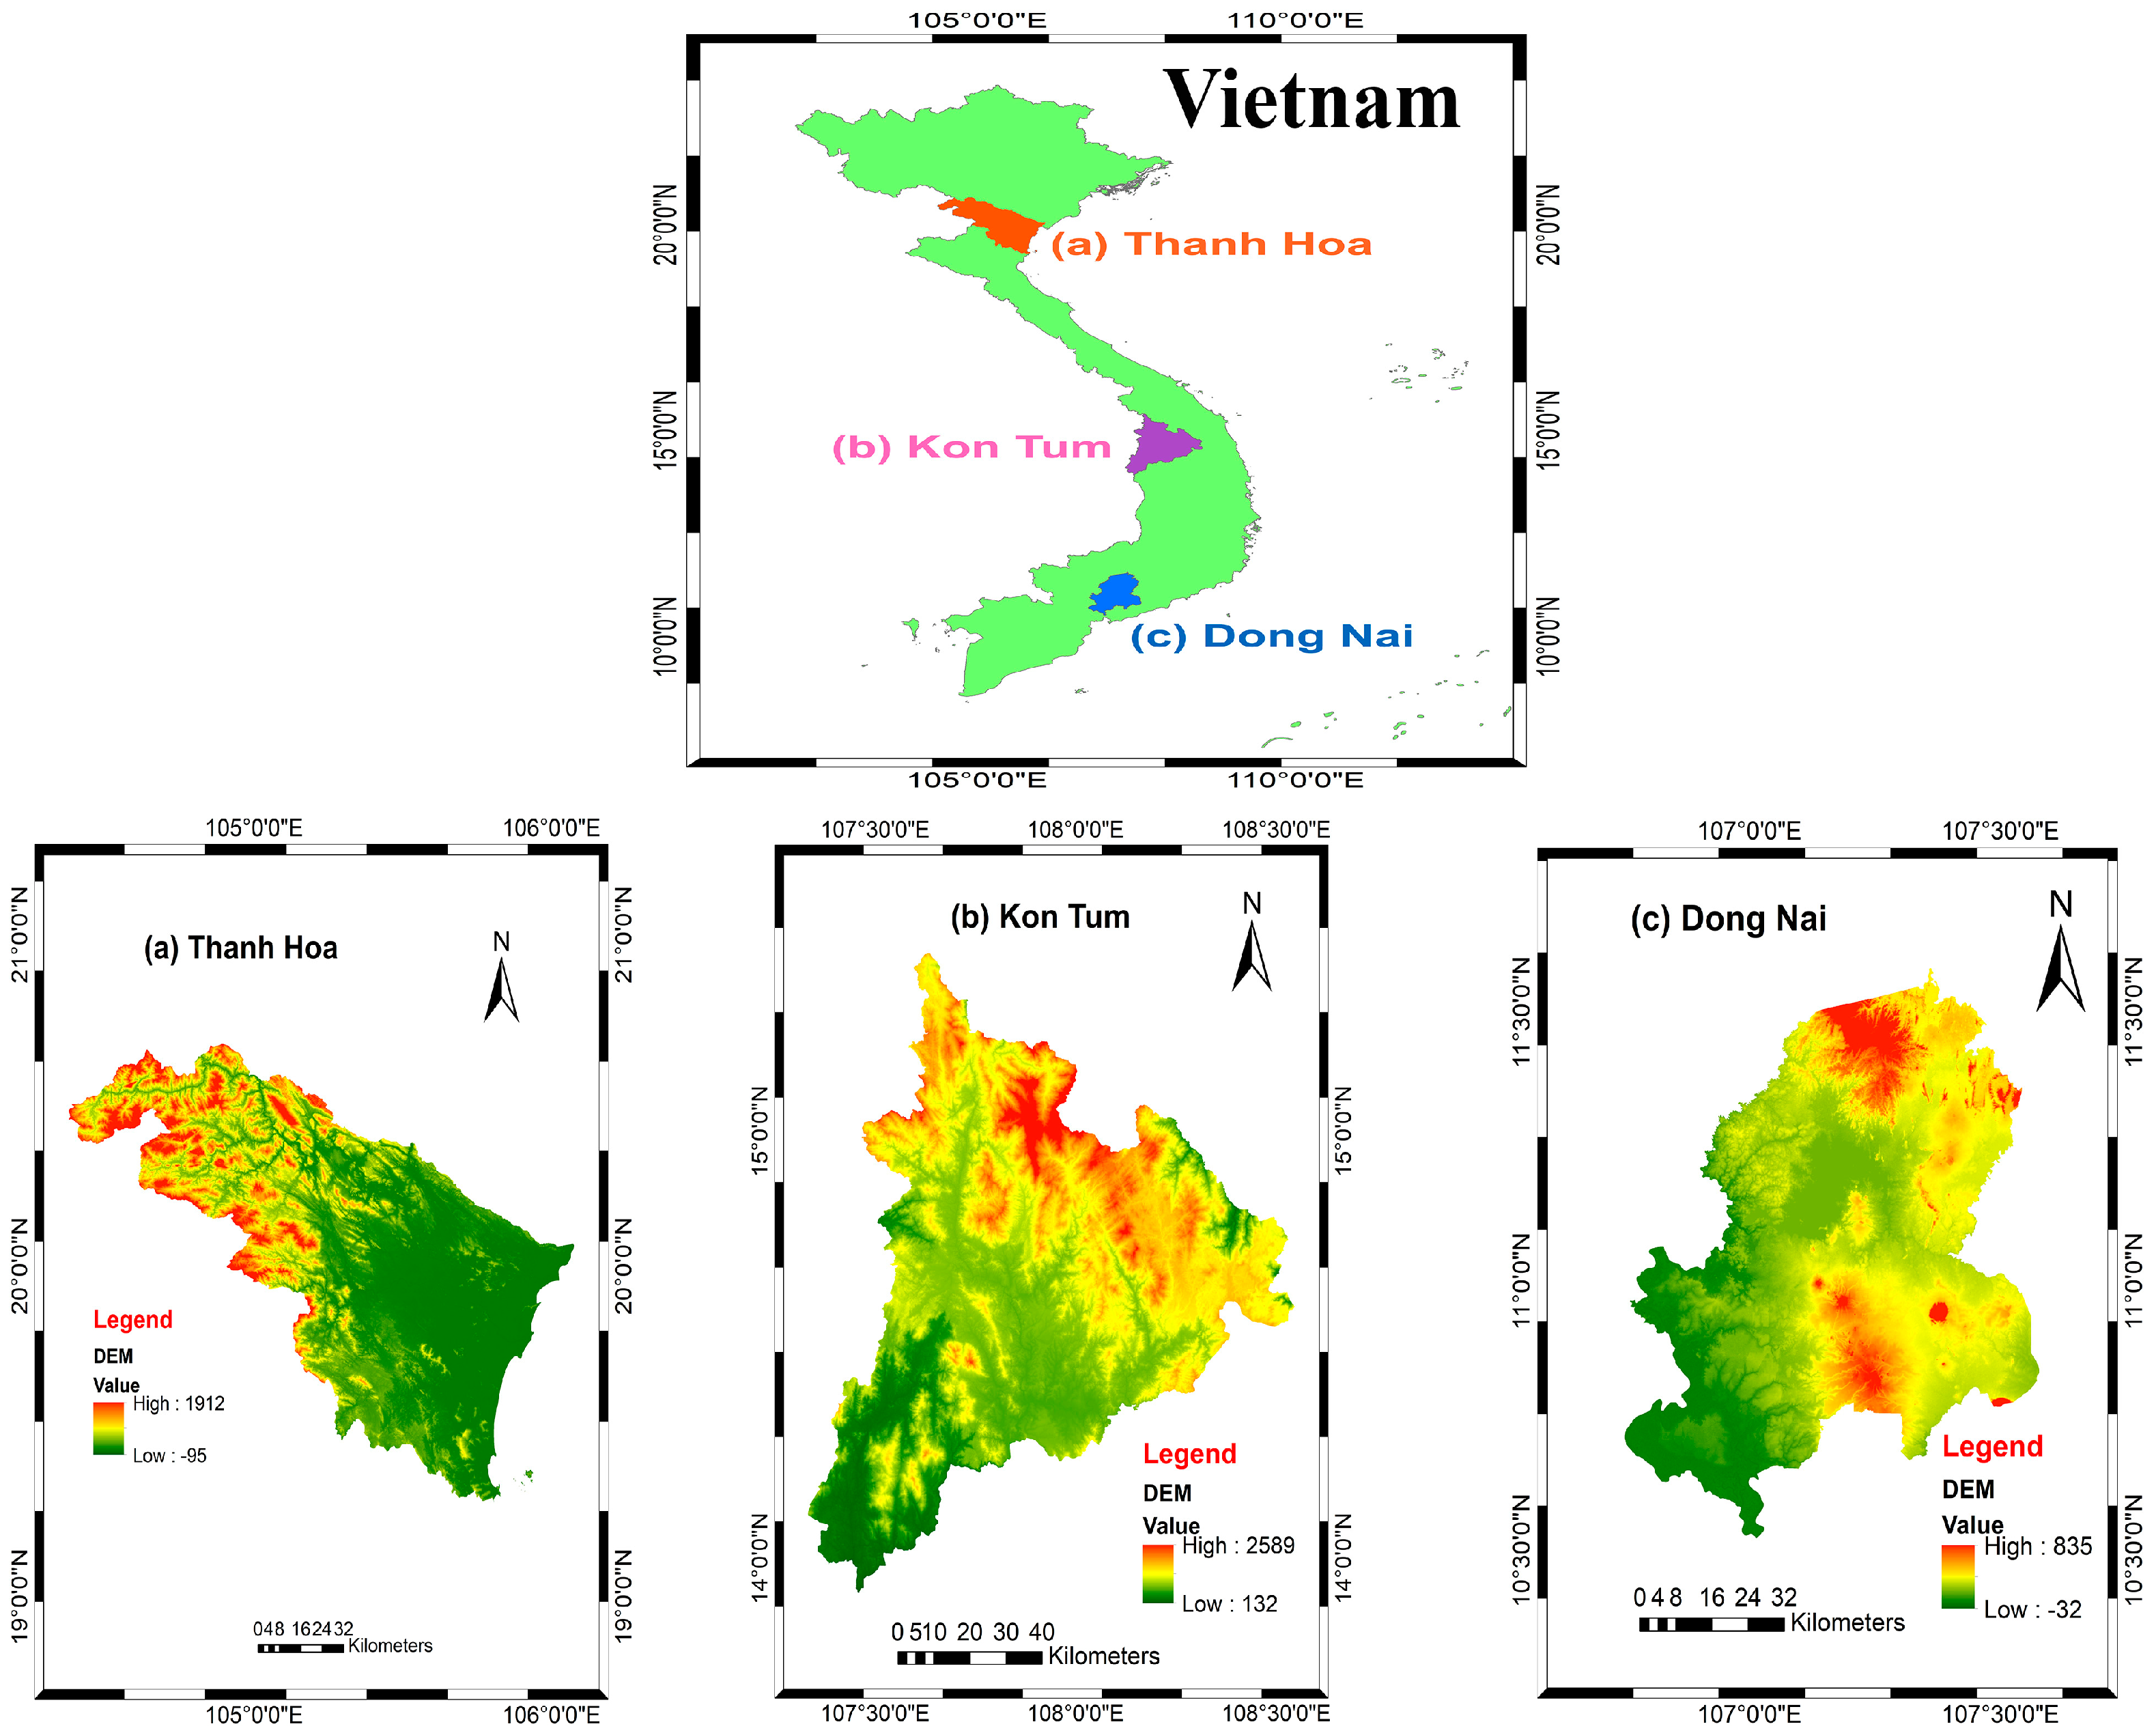
This study focuses on monitoring forest cover changes in three provinces: Thanh Hoa, Kon Tum, and Dong Nai, located in the northern, central, and southern regions of Vietnam, respectively.
Thanh Hoa is located in the North Central region of Vietnam, with geographical coordinates ranging from 19°18′ to 20°40′ north latitude and from 104°22′ to 106°05′ east longitude. The province features diverse topography, including lowlands, midlands, and mountainous areas, and has a tropical monsoon climate with abundant rainfall. Forest land occupies approximately 52% of the total natural area, primarily concentrated in the western mountainous districts such as Quan Son, Quan Hoa, and Muong Lat [
19]. This forest resource plays a crucial role in environmental protection and the development of the forestry-based economy.
Kon Tum is located in the northern part of the Central Highlands of Vietnam, with geographical coordinates ranging from 13°55′ to 15°27′ north latitude and from 107°20′ to 108°32′ east longitude. The province is characterized by mountainous terrain and plateaus, with a tropical monsoon climate that varies significantly with altitude. Forest land accounts for over 60% of the total natural area, mainly concentrated in districts such as Dak Glei, Tu Mo Rong, and Kon Plong [
20]. This forest resource plays a vital role in biodiversity conservation and the sustainable development of the forestry economy.
Dong Nai is located in the Southeast region of Vietnam, with geographical coordinates ranging from 10°30′ to 11°34′ north latitude and from 106°45′ to 107°35′ east longitude. The province features mainly low hills and semi-mountainous terrain, with a tropical monsoon climate characterized by two distinct seasons. Forest land accounts for approximately 29% of the total natural area, notably including the Dong Nai Biosphere Reserve and Nam Cat Tien Forest [
21]. The province’s forest resources play a critical role in ecosystem protection, climate regulation, and the sustainable development of the forestry sector. The geographic location of study areas is illustrated in
Figure 1.
2.2. Data Collection
The data used for this study were collected from various sources, including satellite remote sensing data, Google Earth images, field maps, topographic data, distance to roads and urban centers, and regional-scale climatic variables.
Satellite images from Landsat 7 and Landsat 8, with a 30 m spatial resolution, were obtained from the United States Geological Survey (USGS), while Sentinel-2 satellite images with a 10 m resolution were sourced from the European Space Agency (ESA).
Table 1 provides detailed information about the satellite images used in this study.
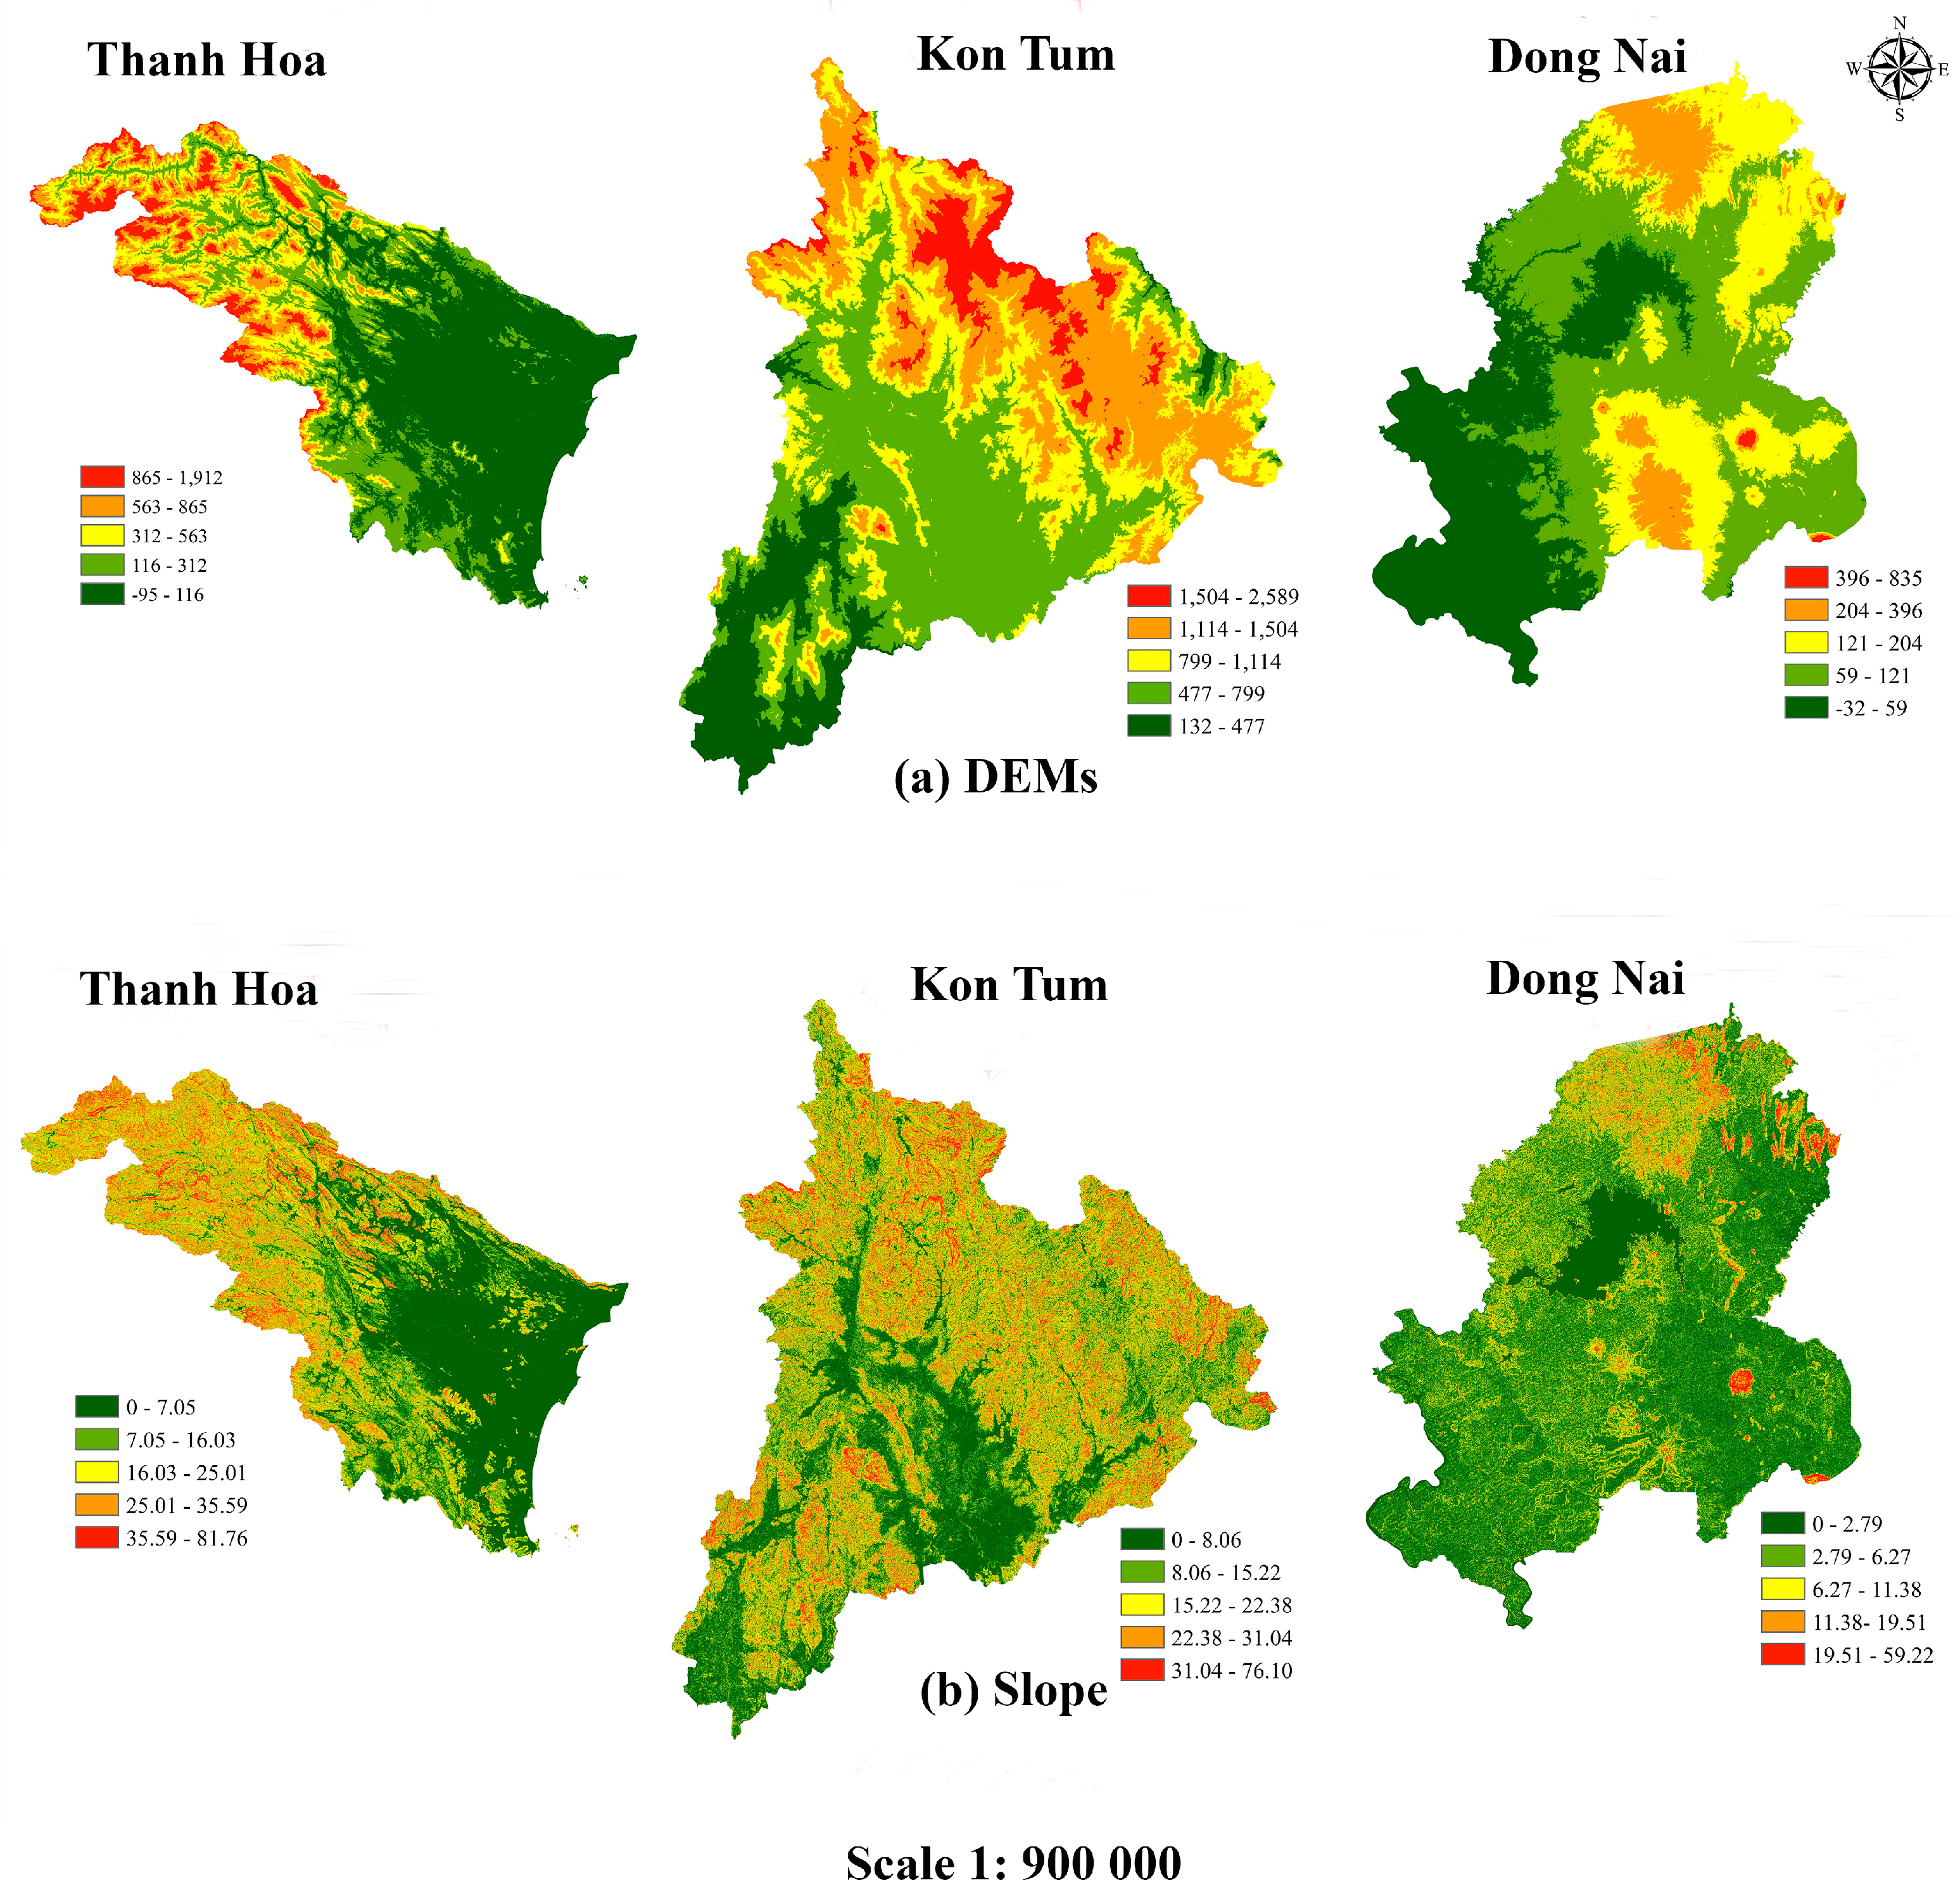
Topographic data consisted of Digital Elevation Models (DEMs) derived from the Shuttle Radar Topography Mission (SRTM) dataset, and slope data, with a spatial resolution of 30 m. The DEMs were processed in ArcGIS to generate slope layers, which were later used as supplementary variables in classification and prediction modeling (
Figure 2). Distances to roads and urban centers were calculated from OpenStreetMap infrastructure data (accessed via OSMnx Python package, version 1.1.2) using geometries extracted in GeoJSON format. Regional-scale climatic variables, including annual precipitation and mean annual temperature, were obtained from the WorldClim v2 dataset at a spatial resolution of approximately 1 km. Google Earth Pro (version 7.3.6) images and field maps were used to improve the accuracy of land cover classification. Furthermore, pre-processing of the remote sensing data included cloud cover assessment, radiometric calibration, and atmospheric correction, all performed using the JavaScript API on the Google Earth Engine (GEE) code editor platform (updated as of November 2024).
2.3. Method
2.3.1. Land Cover Classification
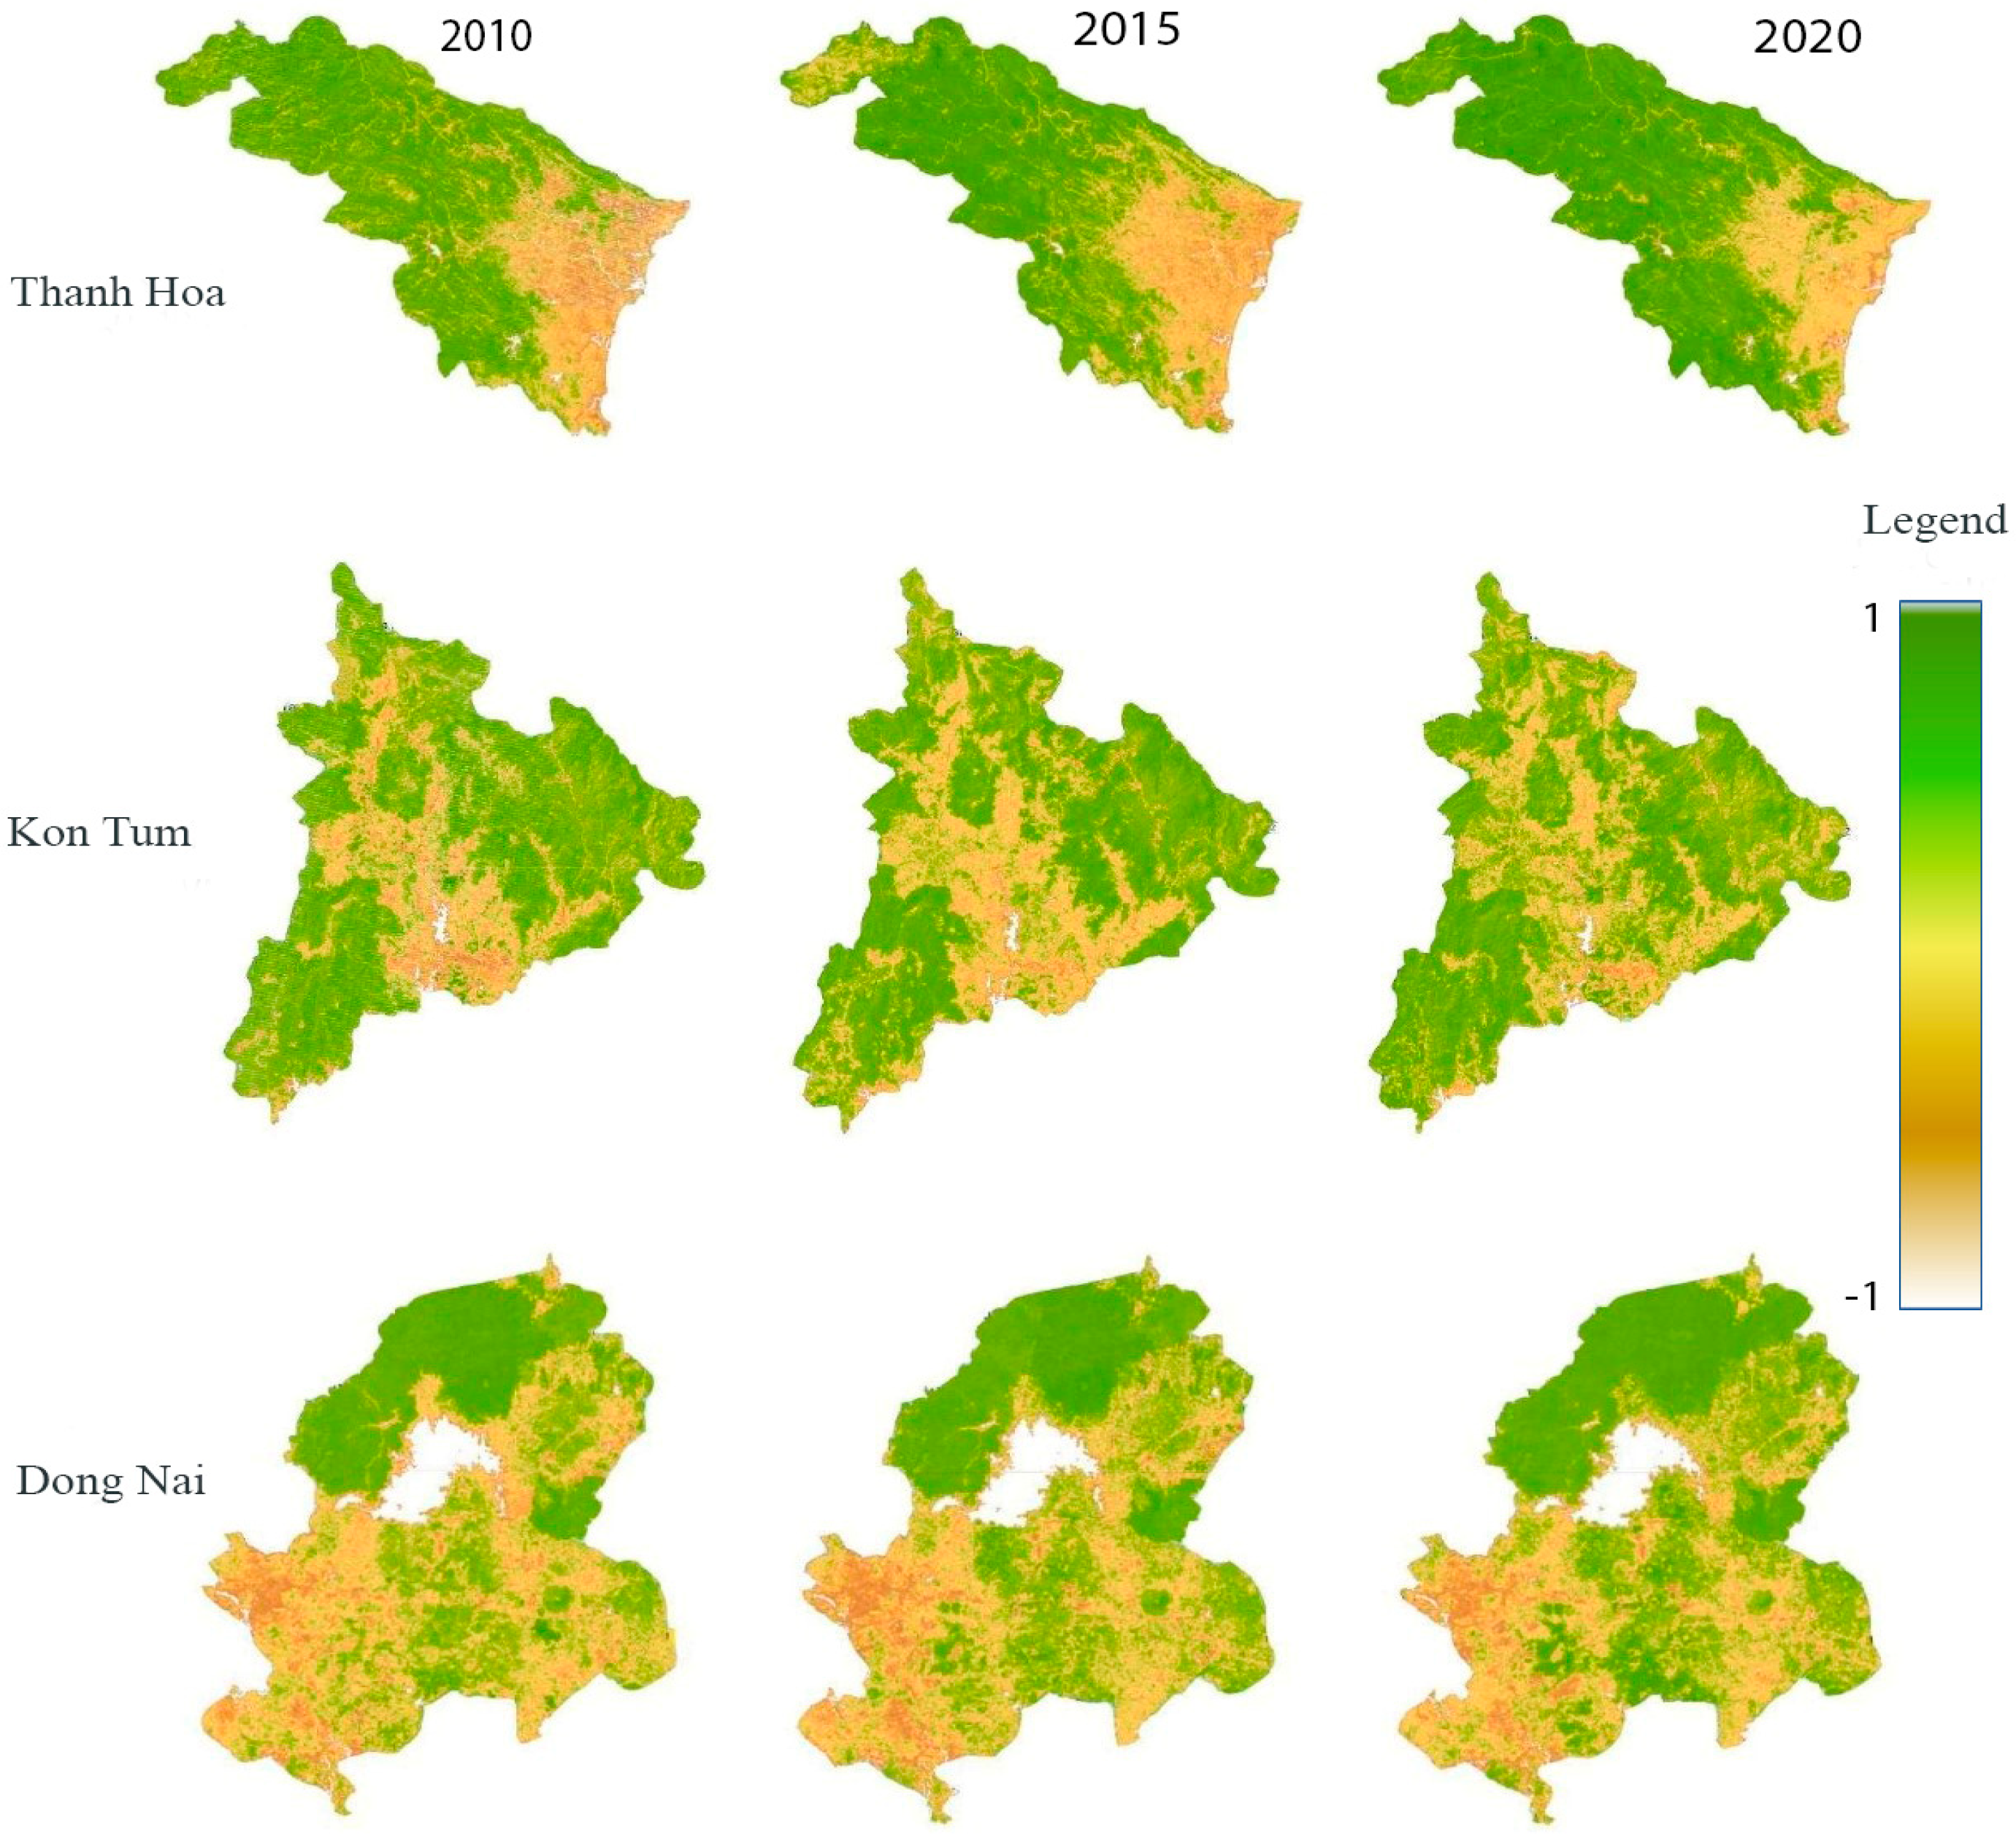
Land cover classification was conducted using the Normalized Difference Vegetation Index (NDVI), spectral band combinations, Google Earth images, and field maps. On the GEE platform, the function ee.Image.normalizedDifference([x, y]), where x represents the value of the near-infrared channel and y represents the value of the red channel, was employed to calculate NDVI for each province at different time points: 2010, 2015, and 2020. The NDVI served not only as a visualization tool but also as an input variable for the RF classifier, enhancing discrimination between forest types based on vegetation density. After calculation, the NDVI maps were integrated with the spectral bands and topographic layers to form a comprehensive multi-band image collection for each classification year. This integration enabled the RF model to simultaneously consider vegetation vigor (through NDVI), spectral signatures, and terrain characteristics when distinguishing between land cover categories [
22].
Spectral band combinations, particularly the Red, Green, and Blue (RGB) and Color Infrared (NIR, red, and green) composites, were used during visual interpretation to aid the selection of training samples. These combinations allowed for more effective identification of land cover categories, particularly distinguishing dense broadleaf forests from mixed forests and agricultural lands [
23].
Particular attention was paid to accurately distinguishing between mixed forests and broadleaf forests. Broadleaf forests typically exhibited higher NDVI values and more uniform canopy reflectance. In contrast, mixed forests—comprising a combination of deciduous and evergreen species—showed greater variability in spectral signatures, and slightly lower NDVI values due to seasonal leaf fall or species heterogeneity. These biophysical distinctions were critical for training sample selection: reference samples for broadleaf forests were selected in areas with consistently high NDVI values (>0.7) across multiple dates and with lower variability in spectral bands; samples for mixed forests were chosen from areas with moderate NDVI values (0.5–0.7) and more heterogeneous spectral reflectance. This sampling strategy ensured that the RF classifier could learn and differentiate forest types, thus improving classification performance in heterogeneous and mountainous environments.
Using the Random Forest algorithm, land cover was classified into five categories: (1) water bodies; (2) non-forested areas; (3) shrubland/grassland/agricultural land; (4) mixed forests; (5) broadleaf forests. Training data were generated through random sampling, guided by visual interpretation of satellite imagery, Google Earth data, and field maps. Approximately 200–250 sample points were collected for each land cover category. The dataset was divided into 70% for training and 30% for validation. The quality and representativeness of the samples directly influenced classification performance. Well-distributed, accurately labeled samples enabled the RF model to learn the unique spectral, vegetative, and topographic characteristics of each category more effectively. This was particularly important for distinguishing spectrally similar categories, such as mixed forests and broadleaf forests. The RF model was configured with 500 decision trees and used all available input features (spectral bands, NDVI, elevation, and slope). The Gini impurity index was employed for feature selection at each split. Classification accuracy was assessed using confusion matrices, with overall accuracy and the Kappa coefficient reported to evaluate the agreement between classified maps and reference data.
2.3.2. Forest Cover Changes Prediction
Accurate predictions play a key role in decision-making processes aimed at the effective conservation and restoration of the country’s forest resources. The CA-Markov model, which utilizes Markov transition matrices, is commonly applied to predict land use and land cover changes [
24]. This widely used method models land cover transitions by analyzing the probabilities of change between different classes. Utilizing the CA-Markov model, the area or state of land cover S(t + n) at a future time t + n is determined using the following equation:
where
S(t): The state of land cover at the initial time t, represented as a column matrix indicating the area or proportion of each land cover class.
P: The Markov transition matrix, which defines the probability of transition from one land cover category to another over a given time period.
n: The number of time steps (forecasting period).
S(t + n): The predicted state of land cover at time t + n.
The initial state S(t) is typically represented as a column matrix, where each element Si(t) corresponds to the area or percentage of land cover type i at time t, as follows:
where
: Area of broadleaf forests at time t.
: Area of mixed forests at time t.
: Area of shrubs, meadows and agricultural lands at time t.
: Area of unvegetated and non-forested lands at time t.
: Area of water fund lands at time t.
The CA-Markov model combines cellular automata (CA) and Markov chain analysis to simulate land cover transitions based on historical patterns. In this study, the transition probability matrices were generated using land cover classification results from 2010 and 2015. These classified maps served as the base data for transition analysis. The IDRISI TerrSet 2020 software was used to calculate the transition matrices and to project future land cover distributions. The CA component allowed spatial allocation of changes based on neighborhood rules, while the Markov chain component modeled the probability of transition between categories. The prediction accuracy of the CA-Markov model was evaluated by comparing the predicted 2020 land cover maps with the actual classified 2020 maps. Overall deviation percentages of predicted land cover areas were calculated for each province, providing quantitative measures of model performance.
The CA-Markov model offers several advantages, including simplicity, accessibility, the ability for long-term forecasting, and integration with spatial data [
25]. Despite its benefits, the CA-Markov model is limited by its reliance on historical transition probabilities and its inability to incorporate external environmental or socio-economic factors. This study addresses these limitations by supplementing the prediction process with an ANN-based modeling approach that integrates a broader range of input variables influencing forest dynamics.
- B.
MOLUSCE Module
MOLUSCE module in Qgis software (version 2.18.10) works on the principle of an Artificial Neural Networks (ANNs) algorithm. ANNs are powerful machine learning algorithms designed to model complex, nonlinear relationships among multiple variables [
26]. These networks can be trained on historical data, identify intricate relationships between multiple factors, and generate reliable forecasts. The method is based on simulating the functioning of the human brain, where neurons are interconnected, forming responses and making decisions.
The fundamental equation for a hidden layer in an ANN is defined as follows:
where
: Input features.
: Weight of the connection between input neuron i and hidden neuron j.
: Bias term for neuron j.
: Output of the hidden layer neuron j.
f: Activation function.
2.4. Structure of the ANN Algorithm
Input layer includes: land cover maps from 2010 and 2015 (classified using the RF algorithm); elevation and slope layers derived from the 30 m resolution SRTM DEM; distance to roads and urban centers, calculated from OpenStreetMap infrastructure data; regional-scale climatic variables, including annual precipitation and mean annual temperature, obtained from the WorldClim v2 dataset at a spatial resolution of approximately 1 km). Demographic data at high spatial resolution were not directly available; therefore, distance to roads and urban centers was used as proxy variables of anthropogenic impacts. All input layers were resampled to 30 m resolution to match the spatial resolution of the land cover maps, ensuring consistency across datasets.
The ANN model was trained using a supervised learning approach, where the land cover transitions between 2010 and 2015 served as the training target. The structure of the ANN consisted of an input layer, ten hidden layers using sigmoid activation functions, and an output layer predicting transition probabilities for each land cover category. The training dataset consisted of 1000 randomly selected points, stratified across land cover categories.
After training, the ANN algorithm was used to predict future land cover states based on the following equation:
where
X: set of input data.
Y: predicted results, representing the area or probability of land cover categories in the future.
Model accuracy was evaluated by comparing the predicted 2020 land cover maps with the actual classified 2020 maps. Accuracy assessment included calculating overall deviation percentages of predicted land cover areas for each province and Kappa coefficients using confusion matrices.
In the context of forest land monitoring, ANNs allow for the consideration of various factors, including climate, demographics, forest management policies, and socio-economic conditions. However, this method also has limitations: high demand for diverse data, including ecological and socio-economic indicators; and complex interpretation of results, making it difficult to isolate key factors influencing forecasts [
27]. In this study, the lack of social and economic datasets was partially compensated by using distance-based proxy variables (e.g., distance to roads, urban centers). The model architecture, including the number of hidden layers and neurons, was optimized through a trial-and-error process to achieve a balance between model complexity and overfitting.
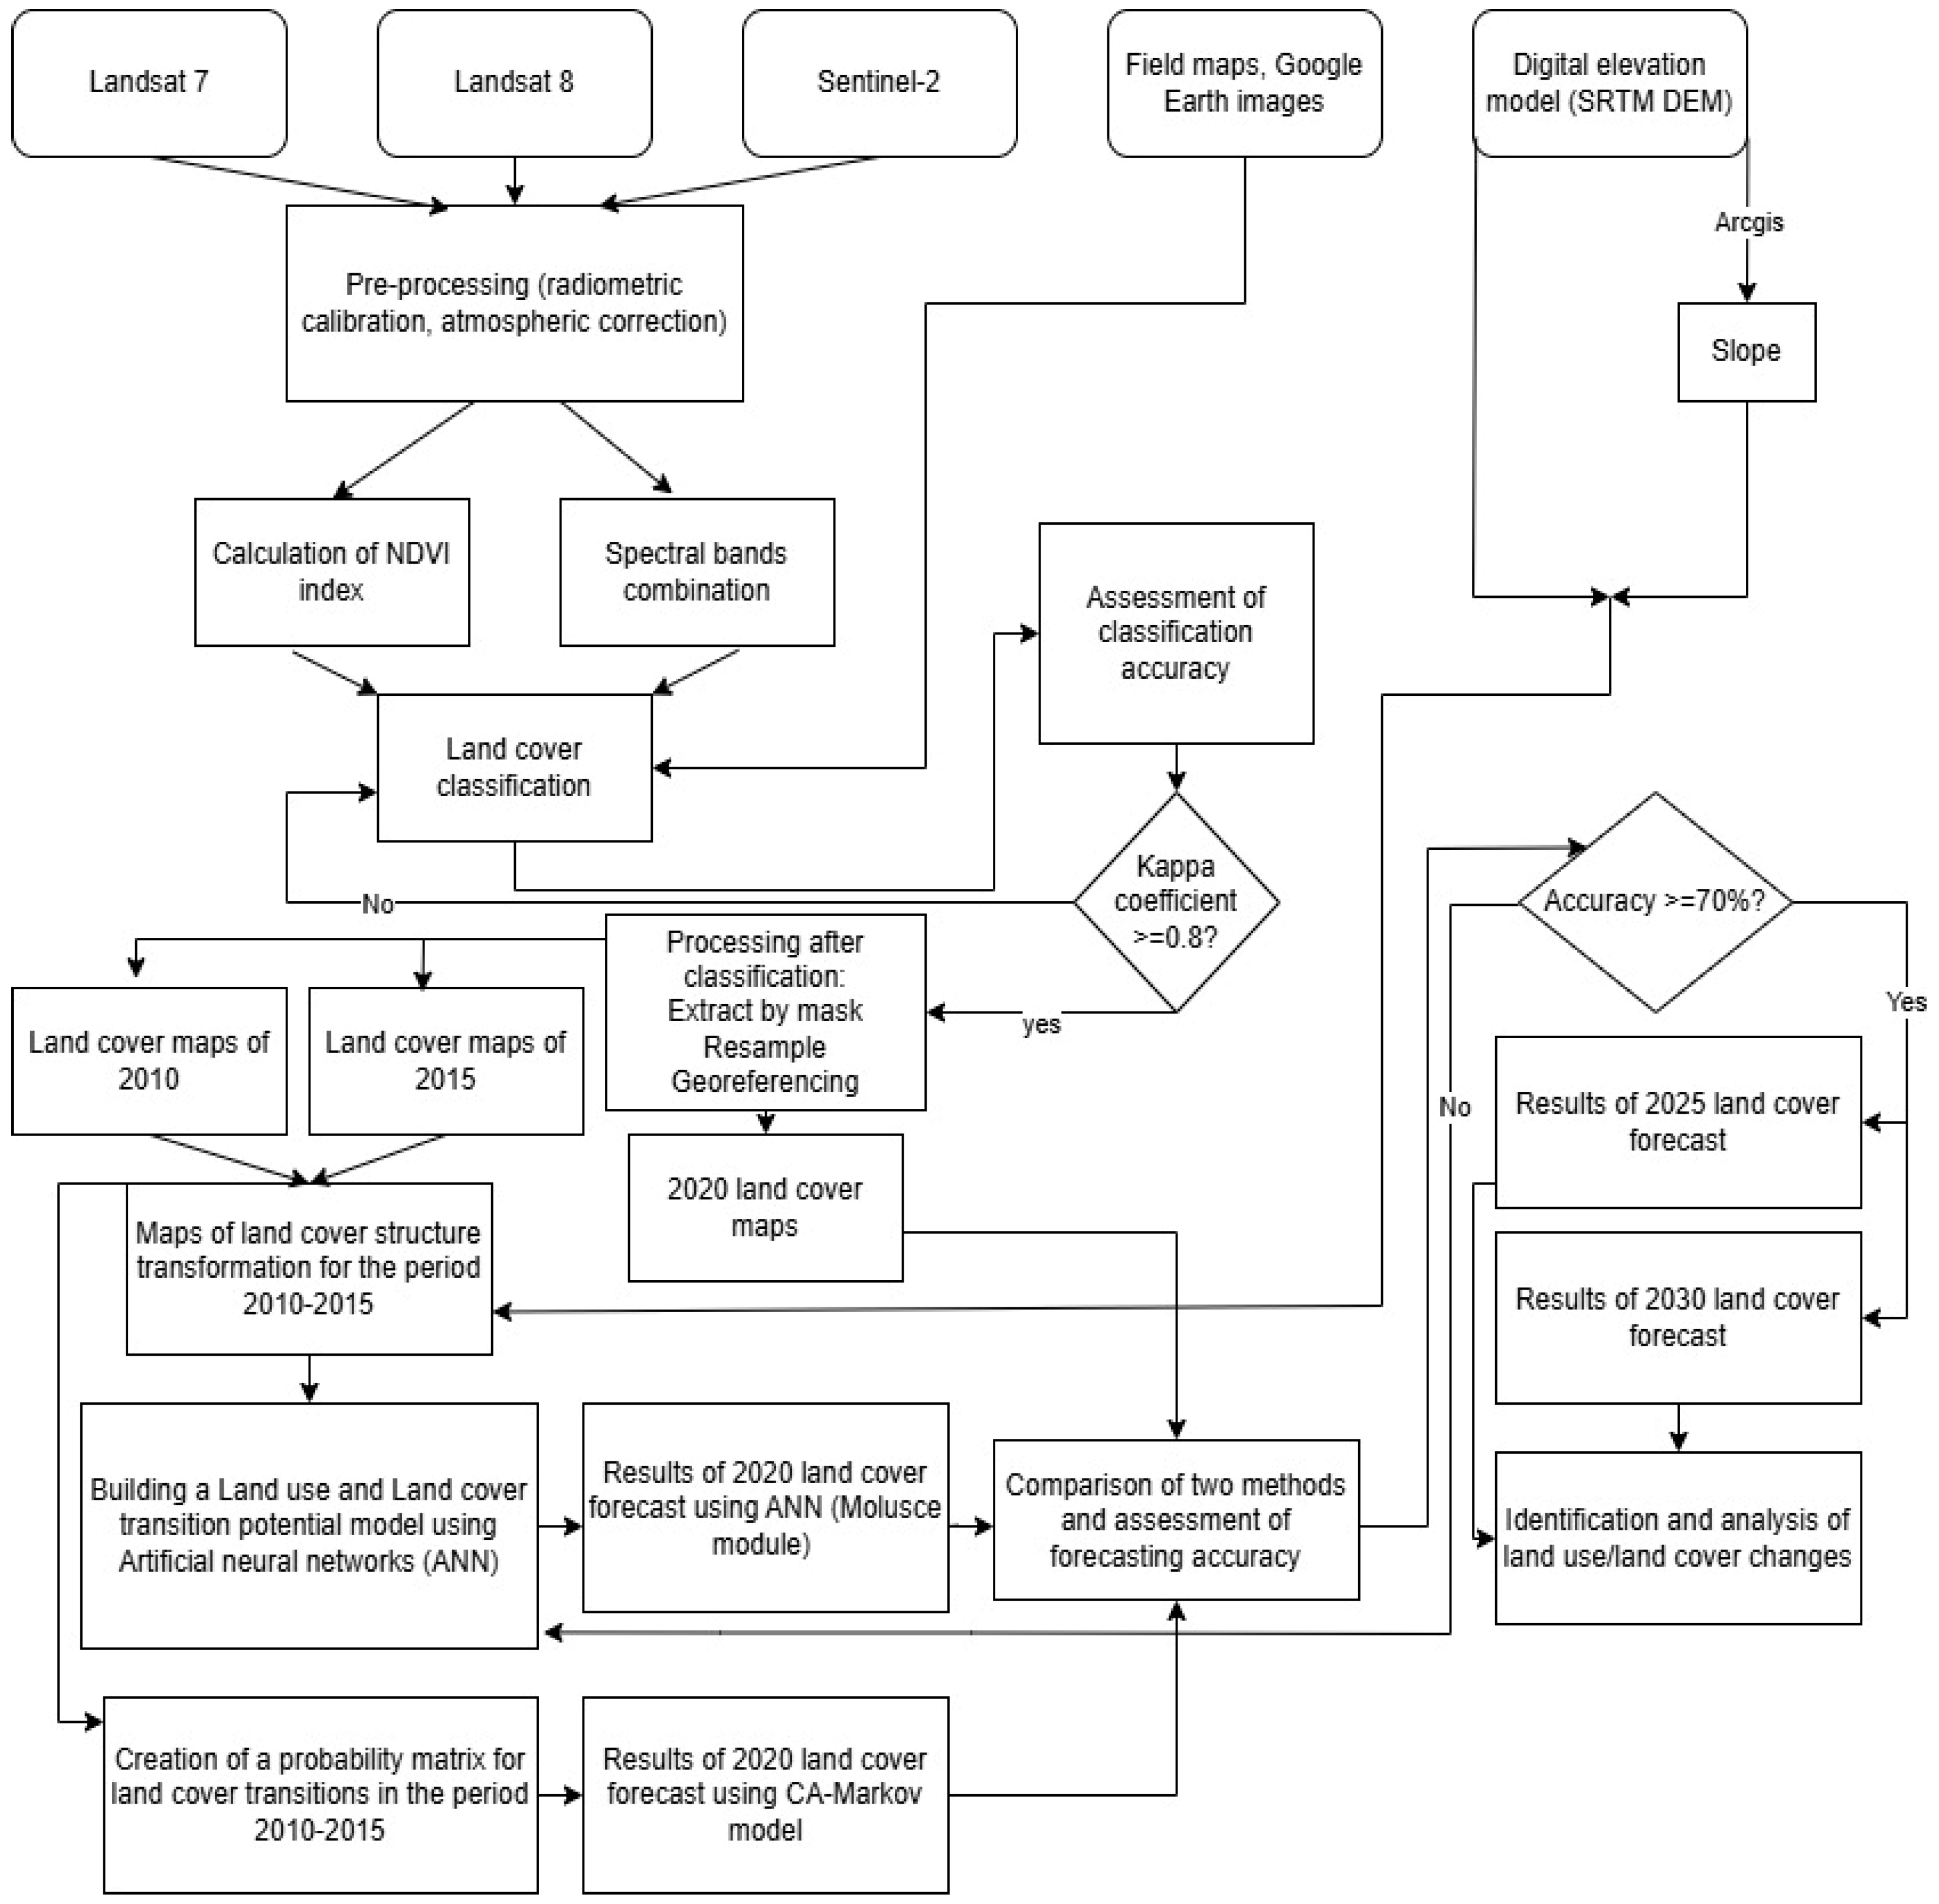
The research workflow is illustrated in
Figure 3.
4. Discussion
4.1. Advantages of Remote Sensing and GIS Technology over Traditional Methods
The monitoring of forest cover changes in Vietnam is essential for conserving forest resources and addressing climate change challenges. Traditional methods of forest monitoring, primarily based on ground-based surveys, visual inspections, and manual cartographic techniques, have historically played an important role in forest resource assessment. However, these approaches present several inherent limitations that significantly affect the accuracy, timeliness, and comprehensiveness of forest cover monitoring, especially in topographically complex regions with challenging climatic conditions, such as Vietnam’s diverse forest landscapes.
Firstly, field surveys are labor-intensive, time-consuming, and often logistically constrained by remote or mountainous terrain accessibility [
28]. In Vietnam, where extensive forested regions are located in rugged uplands, physical access limitations frequently result in incomplete spatial coverage. Consequently, significant forest areas may be under-sampled or entirely omitted, creating substantial biases in land cover estimates and preventing accurate documentation of localized forest cover changes. Secondly, traditional approaches face significant temporal limitations. Ground-based surveys are conducted infrequently due to their high cost and logistical challenges, making it difficult to detect rapid or seasonal changes in forest cover. This temporal infrequency creates substantial delays between actual land cover changes and their official documentation, reducing the relevance and responsiveness of forest management decisions [
29]. Thirdly, manual observation and interpretation are inherently subjective and susceptible to human error. Variability in observer judgment, inconsistencies in measurement techniques, and difficulties in maintaining standardized criteria across different survey teams can all introduce errors and inconsistencies into forest monitoring datasets. These methodological weaknesses prove particularly detrimental in ecologically diverse landscapes, where subtle differences between forest types or degradation levels may be overlooked or misclassified.
In contrast, remote sensing (RS) technology enables rapid and continuous data acquisition over forested areas, providing high-resolution satellite imagery and sensor data. This technology accurately identifies forest composition, coverage levels, and temporal changes, enhancing the objectivity, efficiency, and cost-effectiveness of land inventory processes. Additionally, GIS facilitates effective spatial data analysis and management, allowing users to create digital maps that model forest conditions and forecast trends [
30].
4.2. Application of Remote Sensing and GIS in Assessing Forest Cover Changes
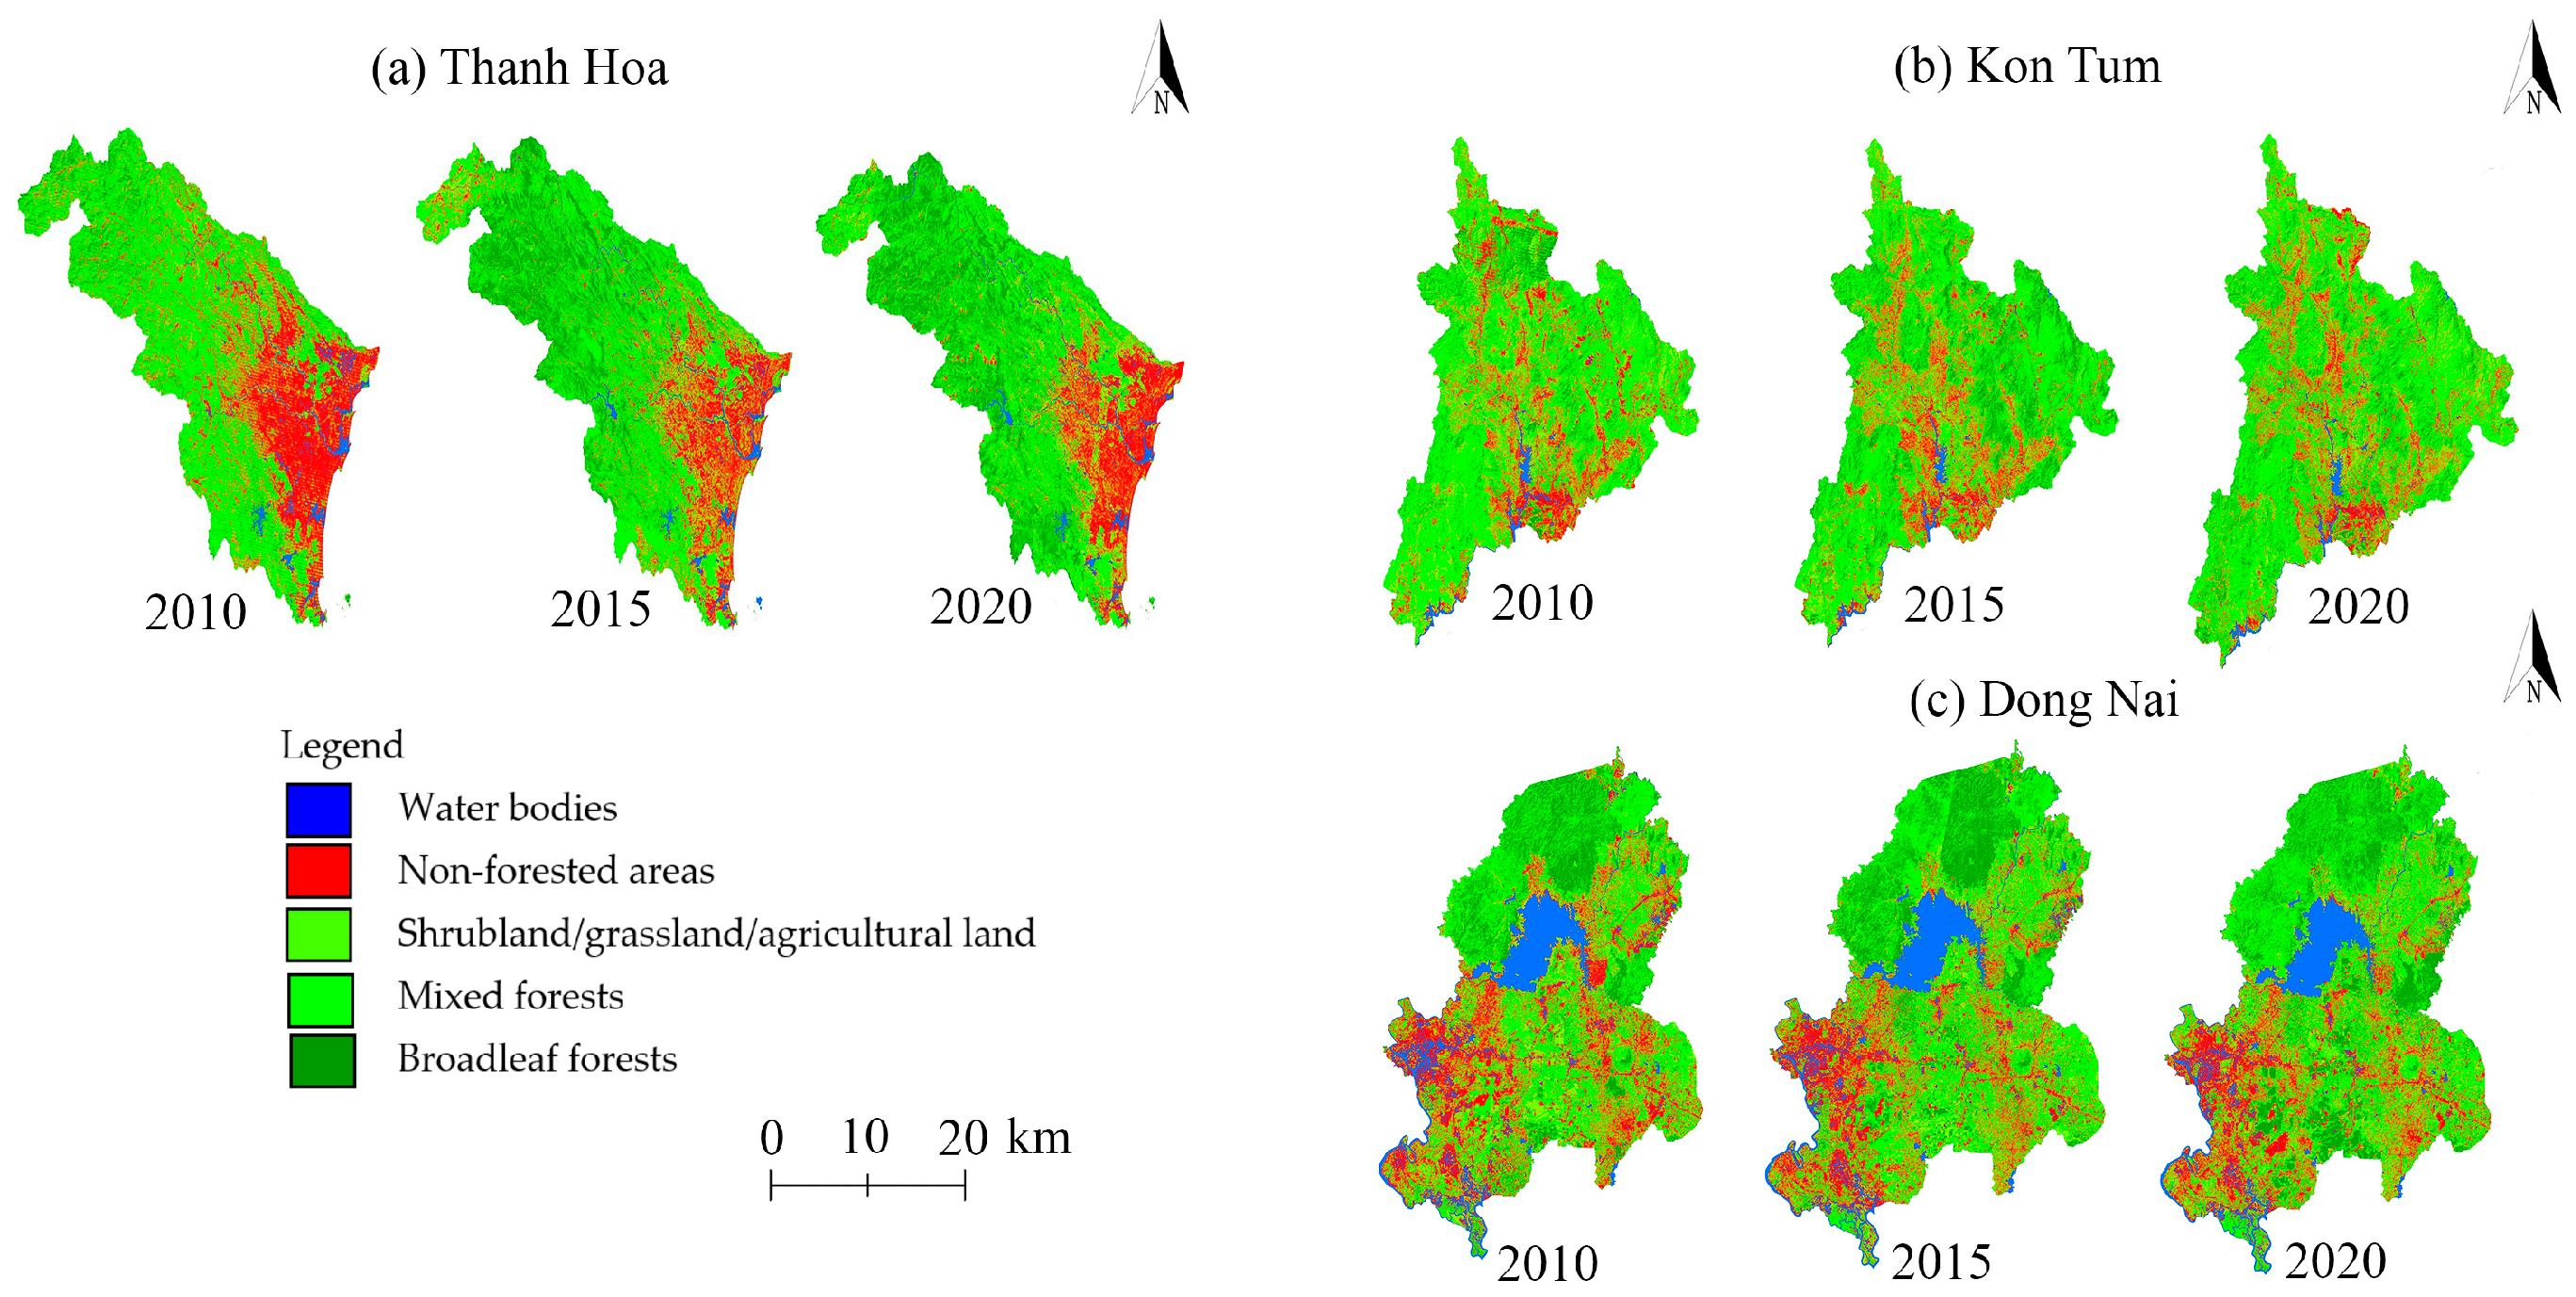
The application of RS and GIS technologies in this study proved essential for comprehensively assessing forest cover changes across three Vietnamese provinces: Thanh Hoa, Kon Tum, and Dong Nai, each with unique natural conditions. The integration of multi-temporal satellite imagery, environmental and anthropogenic variables allowed for the detailed mapping and analysis of forest dynamics over the decade from 2010 to 2020.
In Thanh Hoa province, characterized by both mountainous and lowland areas, RS facilitates large-scale monitoring of forest dynamics. GIS supports spatial data analysis and the creation of digital maps that clearly illustrate forest distribution and changes. Between 2010 and 2020, RS detected a 51.15% increase (91,159 ha) in broadleaf forests and a 19.68% decrease (105,445 ha) in mixed forests, with agricultural land increasing by 9.93% (18,151 ha). These trends reflect both ecological recovery and the expansion of agriculture. In Kon Tum province, which contains valuable primary forests, RS enables precise assessments of deforestation and agricultural encroachment. During the same period, broadleaf and mixed forests declined by 20.05% (26,685 ha) and 4.06% (20,501 ha), respectively, while shrubland, meadows, and agricultural land expanded by 25.30% (58,811 ha), indicating a shift in land use and ongoing pressures from illegal logging. In Dong Nai province, RS identified significant forest regeneration. Broadleaf forests expanded by 29.15% (23,263 ha), and mixed forests by 12.17% (20,632 ha), while shrubland/agricultural land and non-forested areas decreased by 8.07% (12,717 ha) and 17.28% (21,534 ha), respectively. These changes indicate the effectiveness of local forest restoration policies.
Human activities created significant pressure on forest ecosystems during the study period. Infrastructure development, agricultural expansion, and urbanization were key drivers of forest loss. The integration of distance to roads and urban centers layers into the classification and prediction models effectively captured these anthropogenic influences, illustrating that proximity to settlements was correlated with increased land cover transitions away from forested areas.
By enabling the integration and analysis of diverse datasets, RS and GIS technologies not only facilitated the accurate classification of forest cover but also allowed for the modeling of underlying drivers of change. This methodological approach directly supported this study’s objectives: to improve forest cover classification accuracy and to enhance predictive modeling by considering both environmental and anthropogenic factors.
Ultimately, the findings confirm that RS and GIS provide powerful frameworks for detecting, understanding, and predicting forest cover dynamics. They also demonstrate that effective forest management and conservation strategies must account for both natural landscape characteristics and human development pressures, aligning with the broader goals of sustainable land use planning and biodiversity conservation.
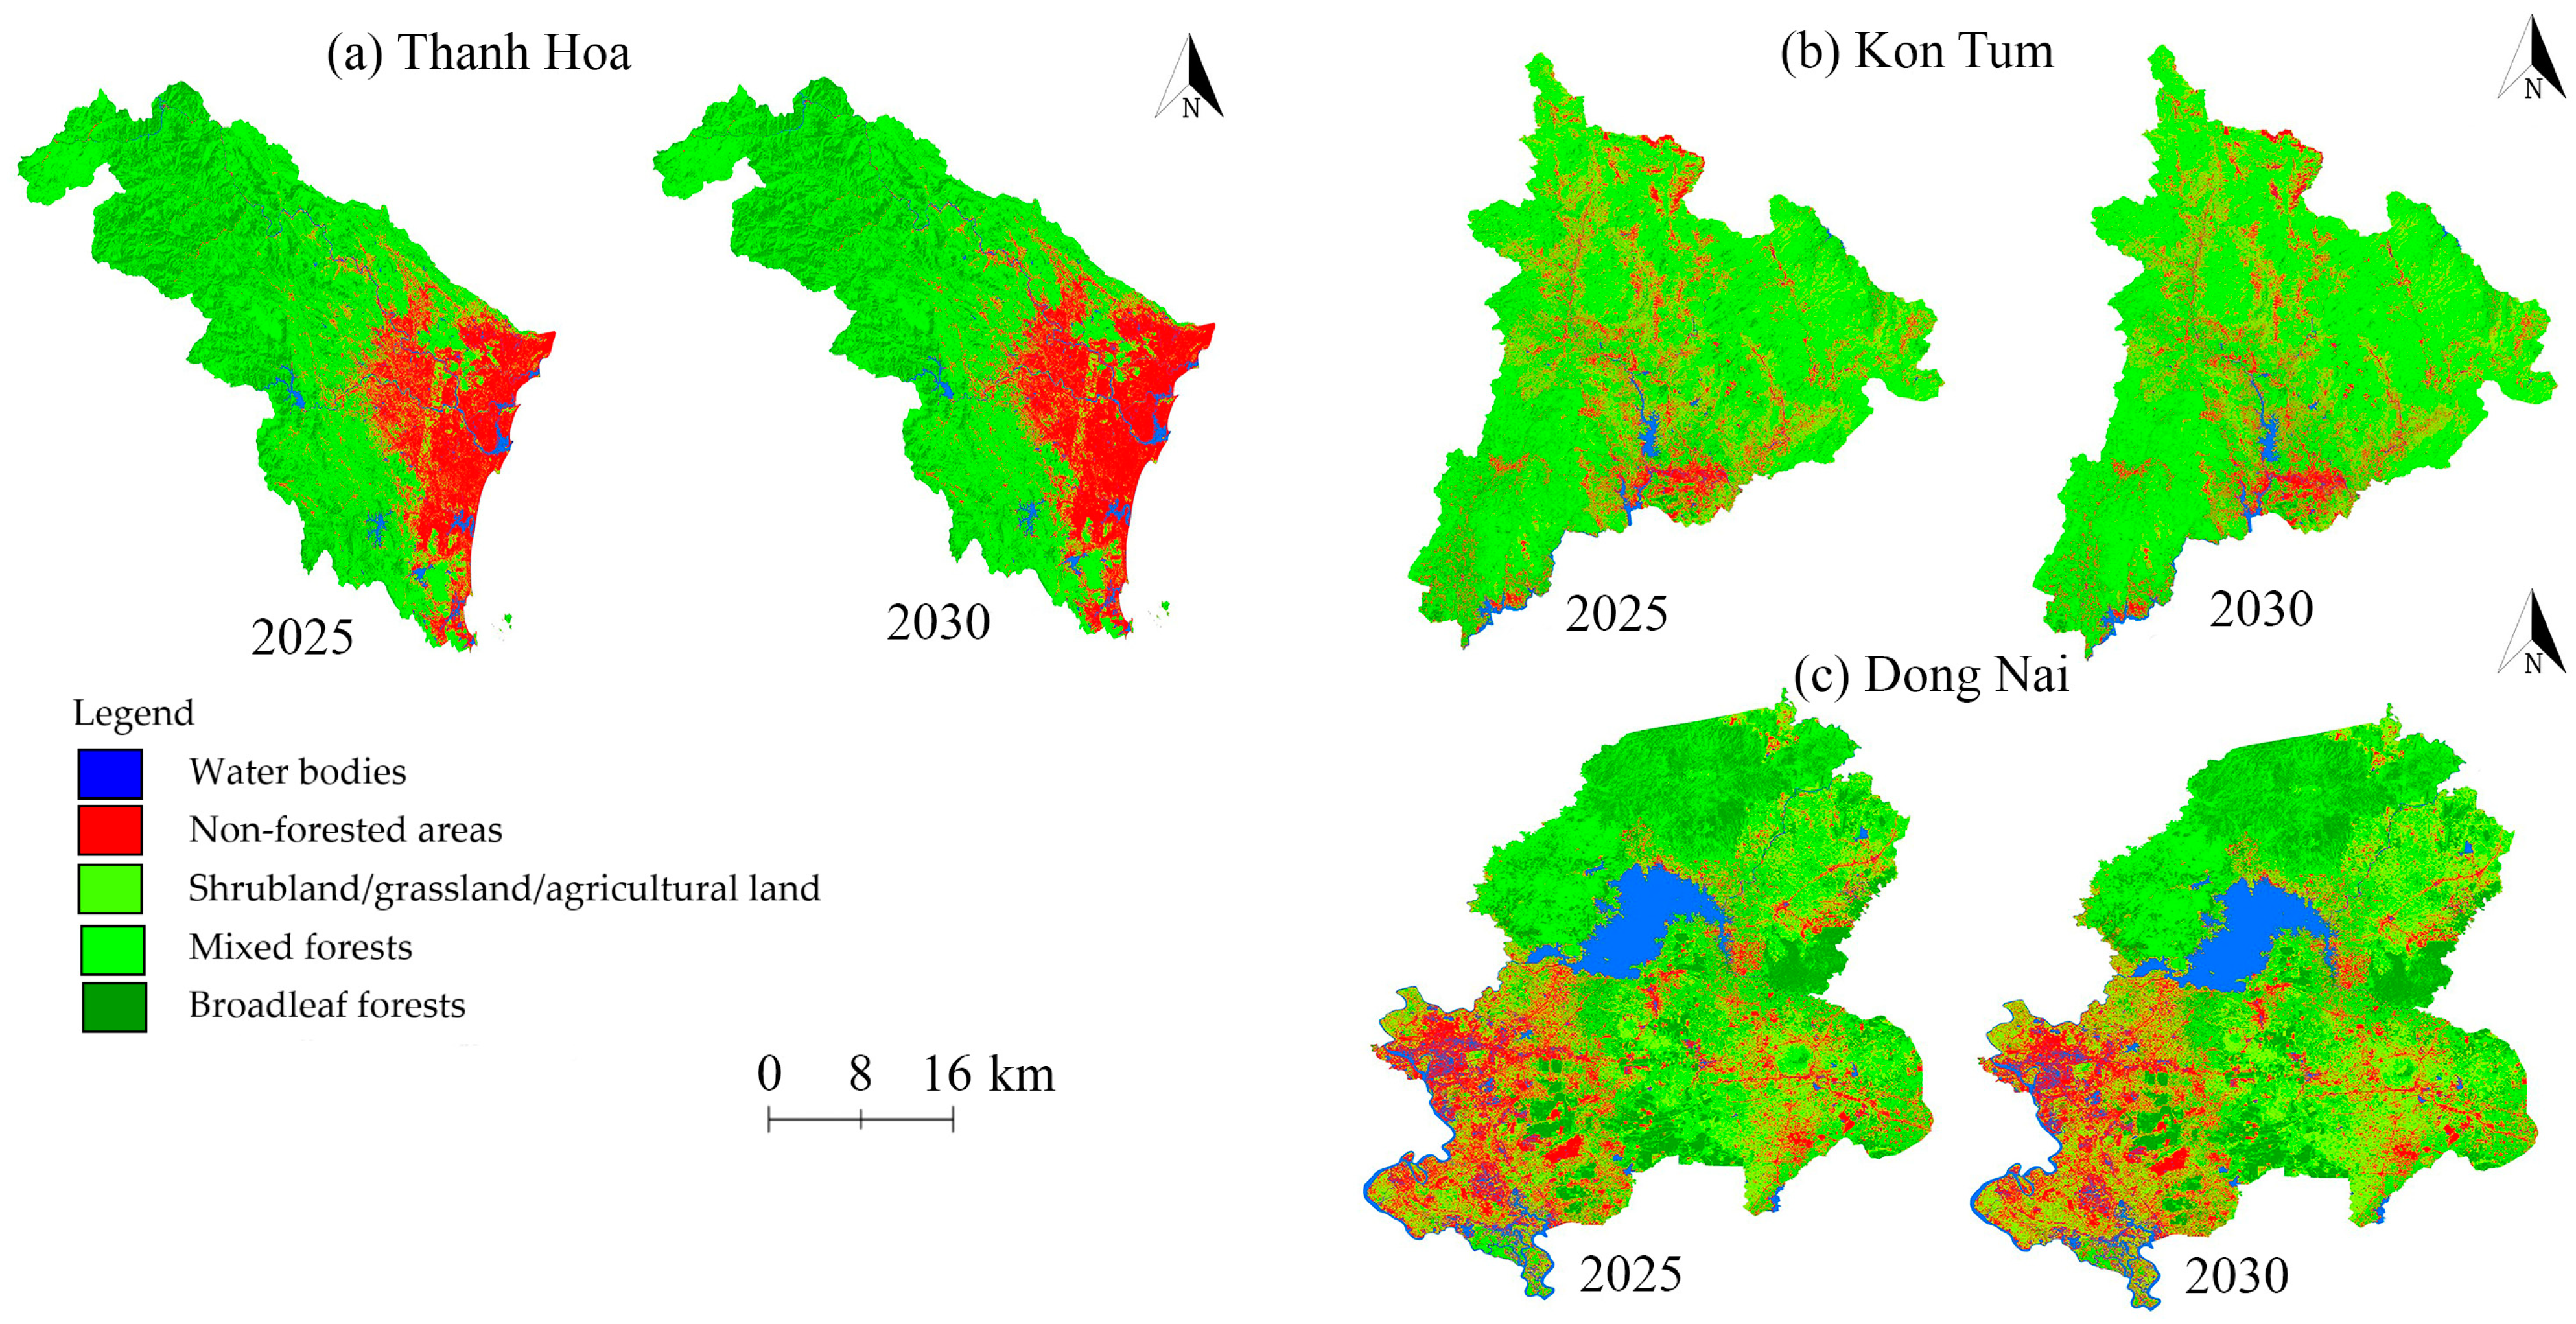
4.3. Using the MOLUSCE Module to Predict Forest Cover Changes to 2030
The application of the MOLUSCE module, employing an Artificial Neural Network (ANN) approach, demonstrated substantial advantages over the CA-Markov model for predicting forest cover changes to 2030 in the study areas. The superior performance of MOLUSCE was evident both in the higher predictive accuracy achieved for the 2020 validation year and in the model’s ability to capture complex spatial patterns of land cover change.
One of the primary reasons for the MOLUSCE module’s superiority lies in its methodological flexibility. While the CA-Markov model relies exclusively on historical transition probabilities and assumes stationary land cover change processes, MOLUSCE incorporates a wide range of supplementary variables that influence land use dynamics [
31]. In this study, MOLUSCE integrated land cover maps and topographic factors (elevation, slope), infrastructure proximity (distance to roads and urban centers), and climatic variables (precipitation, temperature). This multi-variable approach allowed the model to account for both natural and anthropogenic impacts, leading to a more reliable projection of land cover changes.
Moreover, the ANN framework within MOLUSCE can identify and model complex nonlinear relationships between input features and land cover transitions [
26]. This contrasts with the CA-Markov model’s linear probabilistic assumptions, which tend to oversimplify the drivers of forest change, particularly in the heterogeneous environments of Vietnam. As a result, the MOLUSCE module achieved much lower deviation rates when predicting 2020 land cover distributions (approximately 1–2%), compared with the CA-Markov model’s higher deviations (5–9%).
Thus, the MOLUSCE module was used for the 2030 projections. In Thanh Hoa province, broadleaf forests and shrubland/grassland/agricultural land are expected to decline (11.04% and 30.43%), while mixed forests and non-forested areas are expected to expand (10.57% and 25.75%) due to economic development and policy shifts. In Kon Tum, broadleaf forests and shrubland/grassland/agricultural land are projected to decrease by 19.44% and 16.87%, while mixed forests may rise by 20.21% due to restoration initiatives. In Dong Nai, increases of 18.59% (broadleaf forests) and 25.05% (shrubland/grassland/agricultural land) are expected, while mixed forests may decline by 25.22%, reflecting changing land use and the impact of protected areas.
4.4. Limitations and Recommendations for Future Research
While the methodologies applied in this study significantly improved the accuracy of forest cover classification and prediction, several limitations affecting result reliability should be acknowledged.
First, data limitations posed inherent challenges. Although the study integrated spectral, NDVI, topographic, and distance-based variables, the availability of high-resolution socio-economic and demographic data was limited [
32]. Proxies such as distance to roads and urban centers were used to approximate human activity pressures. These proxies may not fully capture the complexities of land use decision making or the influence of local policy implementation. Additionally, climatic data derived from global datasets (WorldClim) at approximately 1 km spatial resolution may overlook finer-scale climatic variations that influence forest cover changes.
Second, the temporal resolution of remote sensing data is a limitation [
33]. The study relied on five-year intervals (starting in 2010, 2015, and 2020) for land cover data due to cloud cover limitations and data availability. More frequent observations could capture short-term dynamics and better distinguish between temporary and permanent land cover changes.
Third, limitations related to the modeling approaches must be noted. Although the ANN-based MOLUSCE module outperformed the CA-Markov model in predictive accuracy, it remains a “black-box” system, providing limited insight into the model operation [
34].
To address these limitations, several recommendations can be made for future research. First, incorporating more detailed socio-economic data—including land ownership, land use regulations, economic activity, and population dynamics at finer spatial resolutions—would significantly improve modeling of anthropogenic drivers. Second, utilizing higher temporal resolution remote sensing datasets, like annual Sentinel-2 imagery, could improve the detection of forest cover changes. Third, adopting explainable AI techniques such as feature importance analysis or interpretable neural network architectures would provide crucial insights into the variable contributions on forest cover transitions and enhance model transparency [
35]. Fourth, the systematic integration of ground truth data through field validation and local knowledge would strengthen the reliability of remote sensing interpretations.
Implementing these improvements would advance the accuracy, transparency, and policy relevance of forest monitoring systems, ultimately supporting more effective sustainable land management strategies not only in Vietnam but also in other countries facing similar challenges.
5. Conclusions
This study employs a remote sensing approach integrated with GIS technology to monitor forest cover changes in Vietnam, providing valuable insights for scientific research and practical applications in forest management, conservation, and restoration at local, regional, and global scales. This integrated approach enables a comprehensive analysis of forest land dynamics and their interactions with environmental factors. This research focuses on three key provinces in northern, central, and southern Vietnam, each characterized by distinct climatic, topographic, and anthropogenic conditions. By incorporating diverse data sources, including multi-temporal satellite images, NDVI indices, topographic and climatic variables, infrastructure proximity, and applying advanced classification and prediction approaches (Random Forest algorithm, CA-Markov model, and ANN-based MOLUSCE module), this research achieved high classification accuracies and reliable predictions of future land cover dynamics. The results reveal significant shifts in forest land categories across Thanh Hoa, Kon Tum, and Dong Nai provinces. In Thanh Hoa, broadleaf forest recovery coincides with agricultural expansion, while Kon Tum experiences continued deforestation due to illegal logging and agricultural conversion. In contrast, Dong Nai shows successful forest restoration, largely attributed to effective local policies. These findings underscore the varying impacts of agricultural activity, deforestation, and reforestation efforts on forest cover. Projections indicate continued declines in certain forest types and further conversion to agricultural and other land uses by 2030. The integration of RS and GIS technologies provides substantial advantages for forest monitoring. RS enables consistent, large-scale observations of forest dynamics, overcoming the spatial and temporal limitations of traditional ground-based methods. GIS platforms facilitate the combination of remote sensing data with supplementary spatial information, enhancing the understanding of land cover change drivers and enabling more precise spatial analysis and modeling. The application of RS and GIS technologies directly supports sustainable forest resource management by providing timely, accurate geospatial data that enables decision makers to identify deforestation risks, prioritize conservation areas, evaluate policy effectiveness, and develop proactive management strategies. By analyzing current patterns and predicting future trends, this study supports land management and planning initiatives, contributing to the development of sustainable strategies for the conservation, restoration, and sustainable use of Vietnam’s forest land resources.


