
Fluctuating Development Traits of Industrial Land Mismatch and Its Influence on Urban Ecological Modernization


Abstract
1. Introduction
2. Literature Review and Hypothesis Development
2.1. Literature Review
2.1.1. Research on the Mismatch of Industrial Land Resources
2.1.2. Research on Urban Ecological Modernization
2.1.3. Research on the Impact of the Industrial Land Resource Mismatch on Urban Ecological Modernization
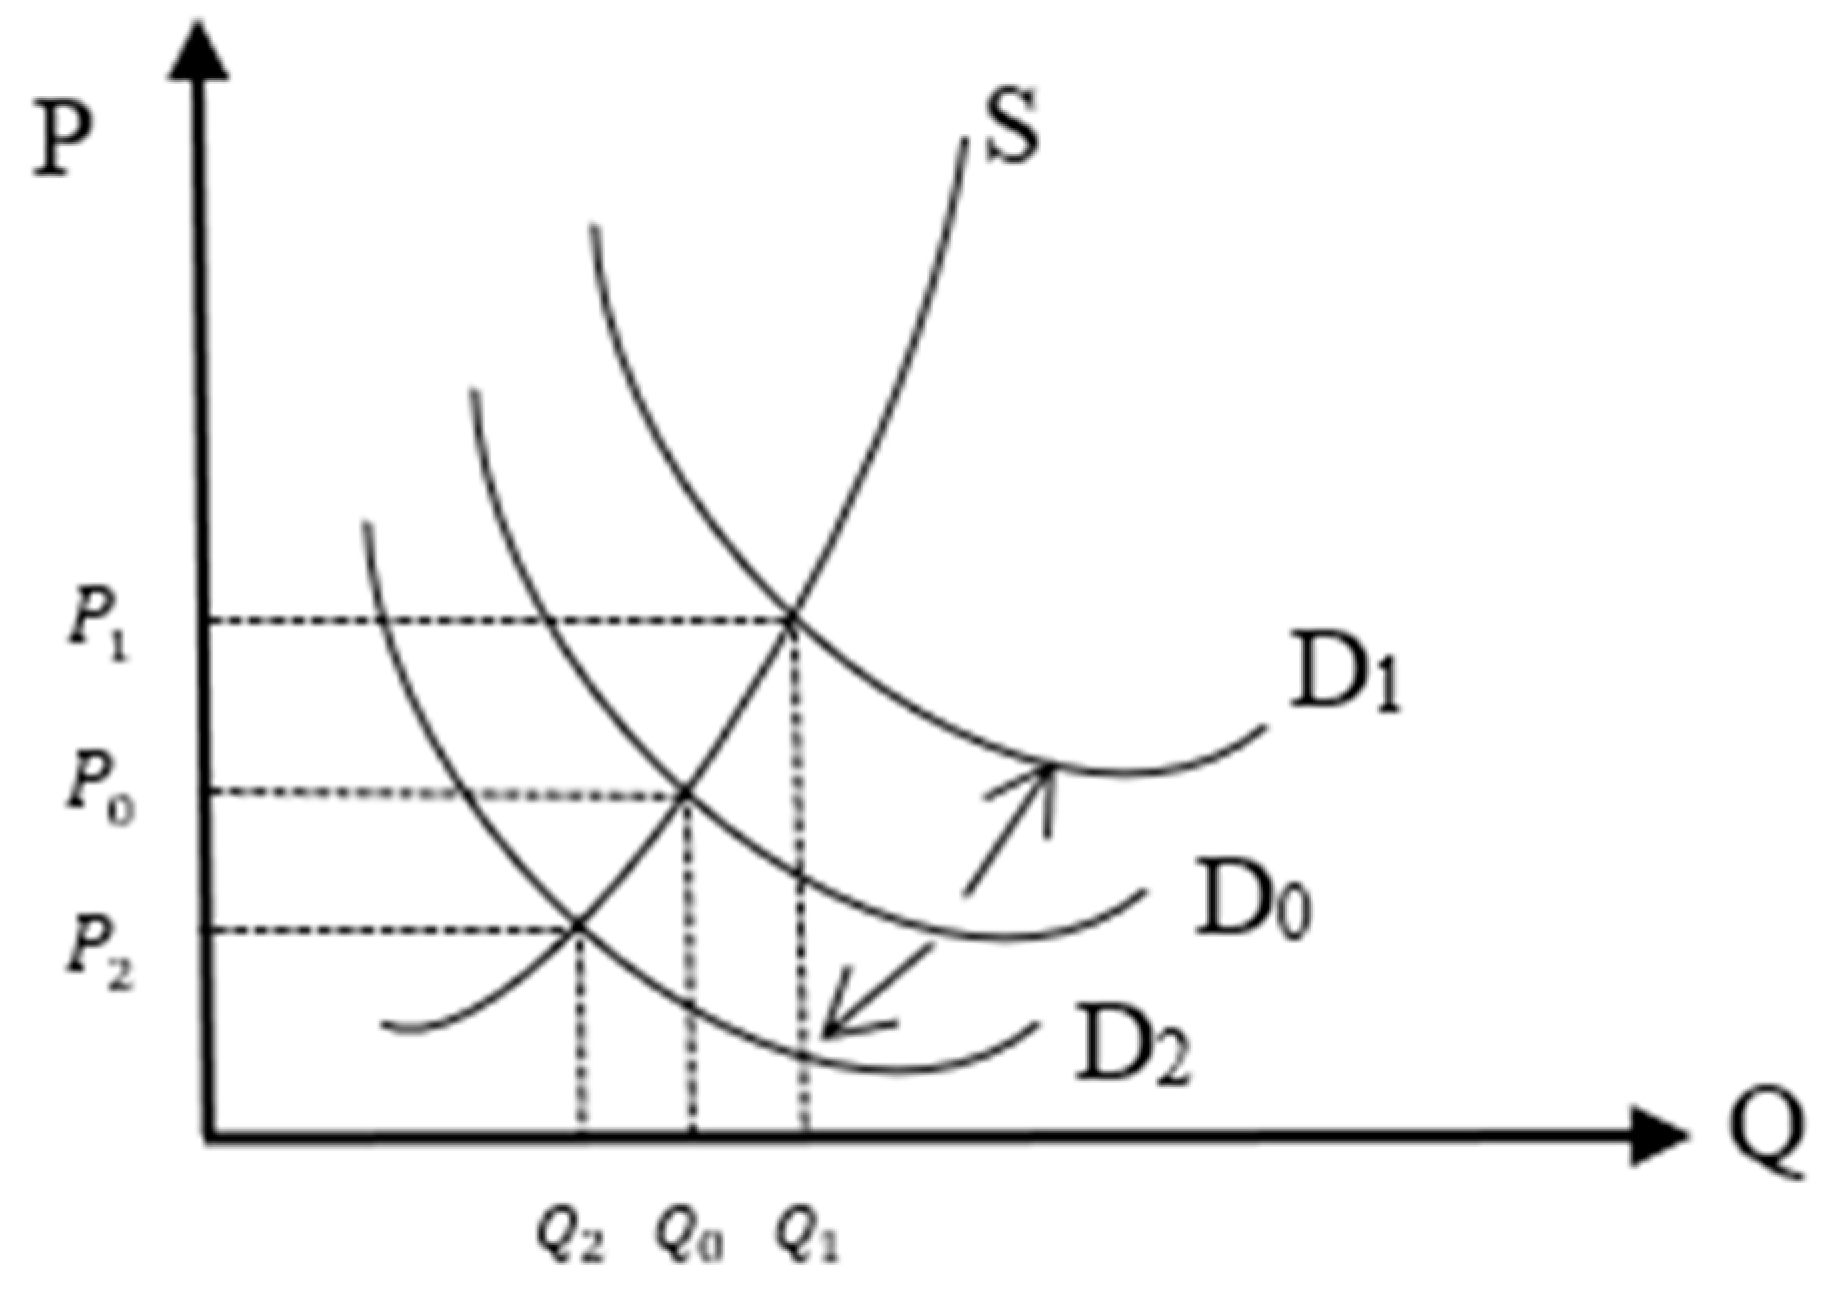
2.2. Theoretical Analysis and Research Hypothesis
3. Materials and Methods
3.1. Data Resource
3.2. Definition of Variables
3.2.1. Explained Variables: Urban Ecological Modernization (EM)
3.2.2. Core Explanatory Variables: Industrial Land Mismatch (ILM)
3.2.3. Control Variables
3.2.4. Mechanism Variables
3.3. Model
3.3.1. Baseline Model
3.3.2. Spatial Model
4. Results
4.1. Spatiotemporal Evolution Characteristics of the Industrial Land Mismatch in Chinese Cities
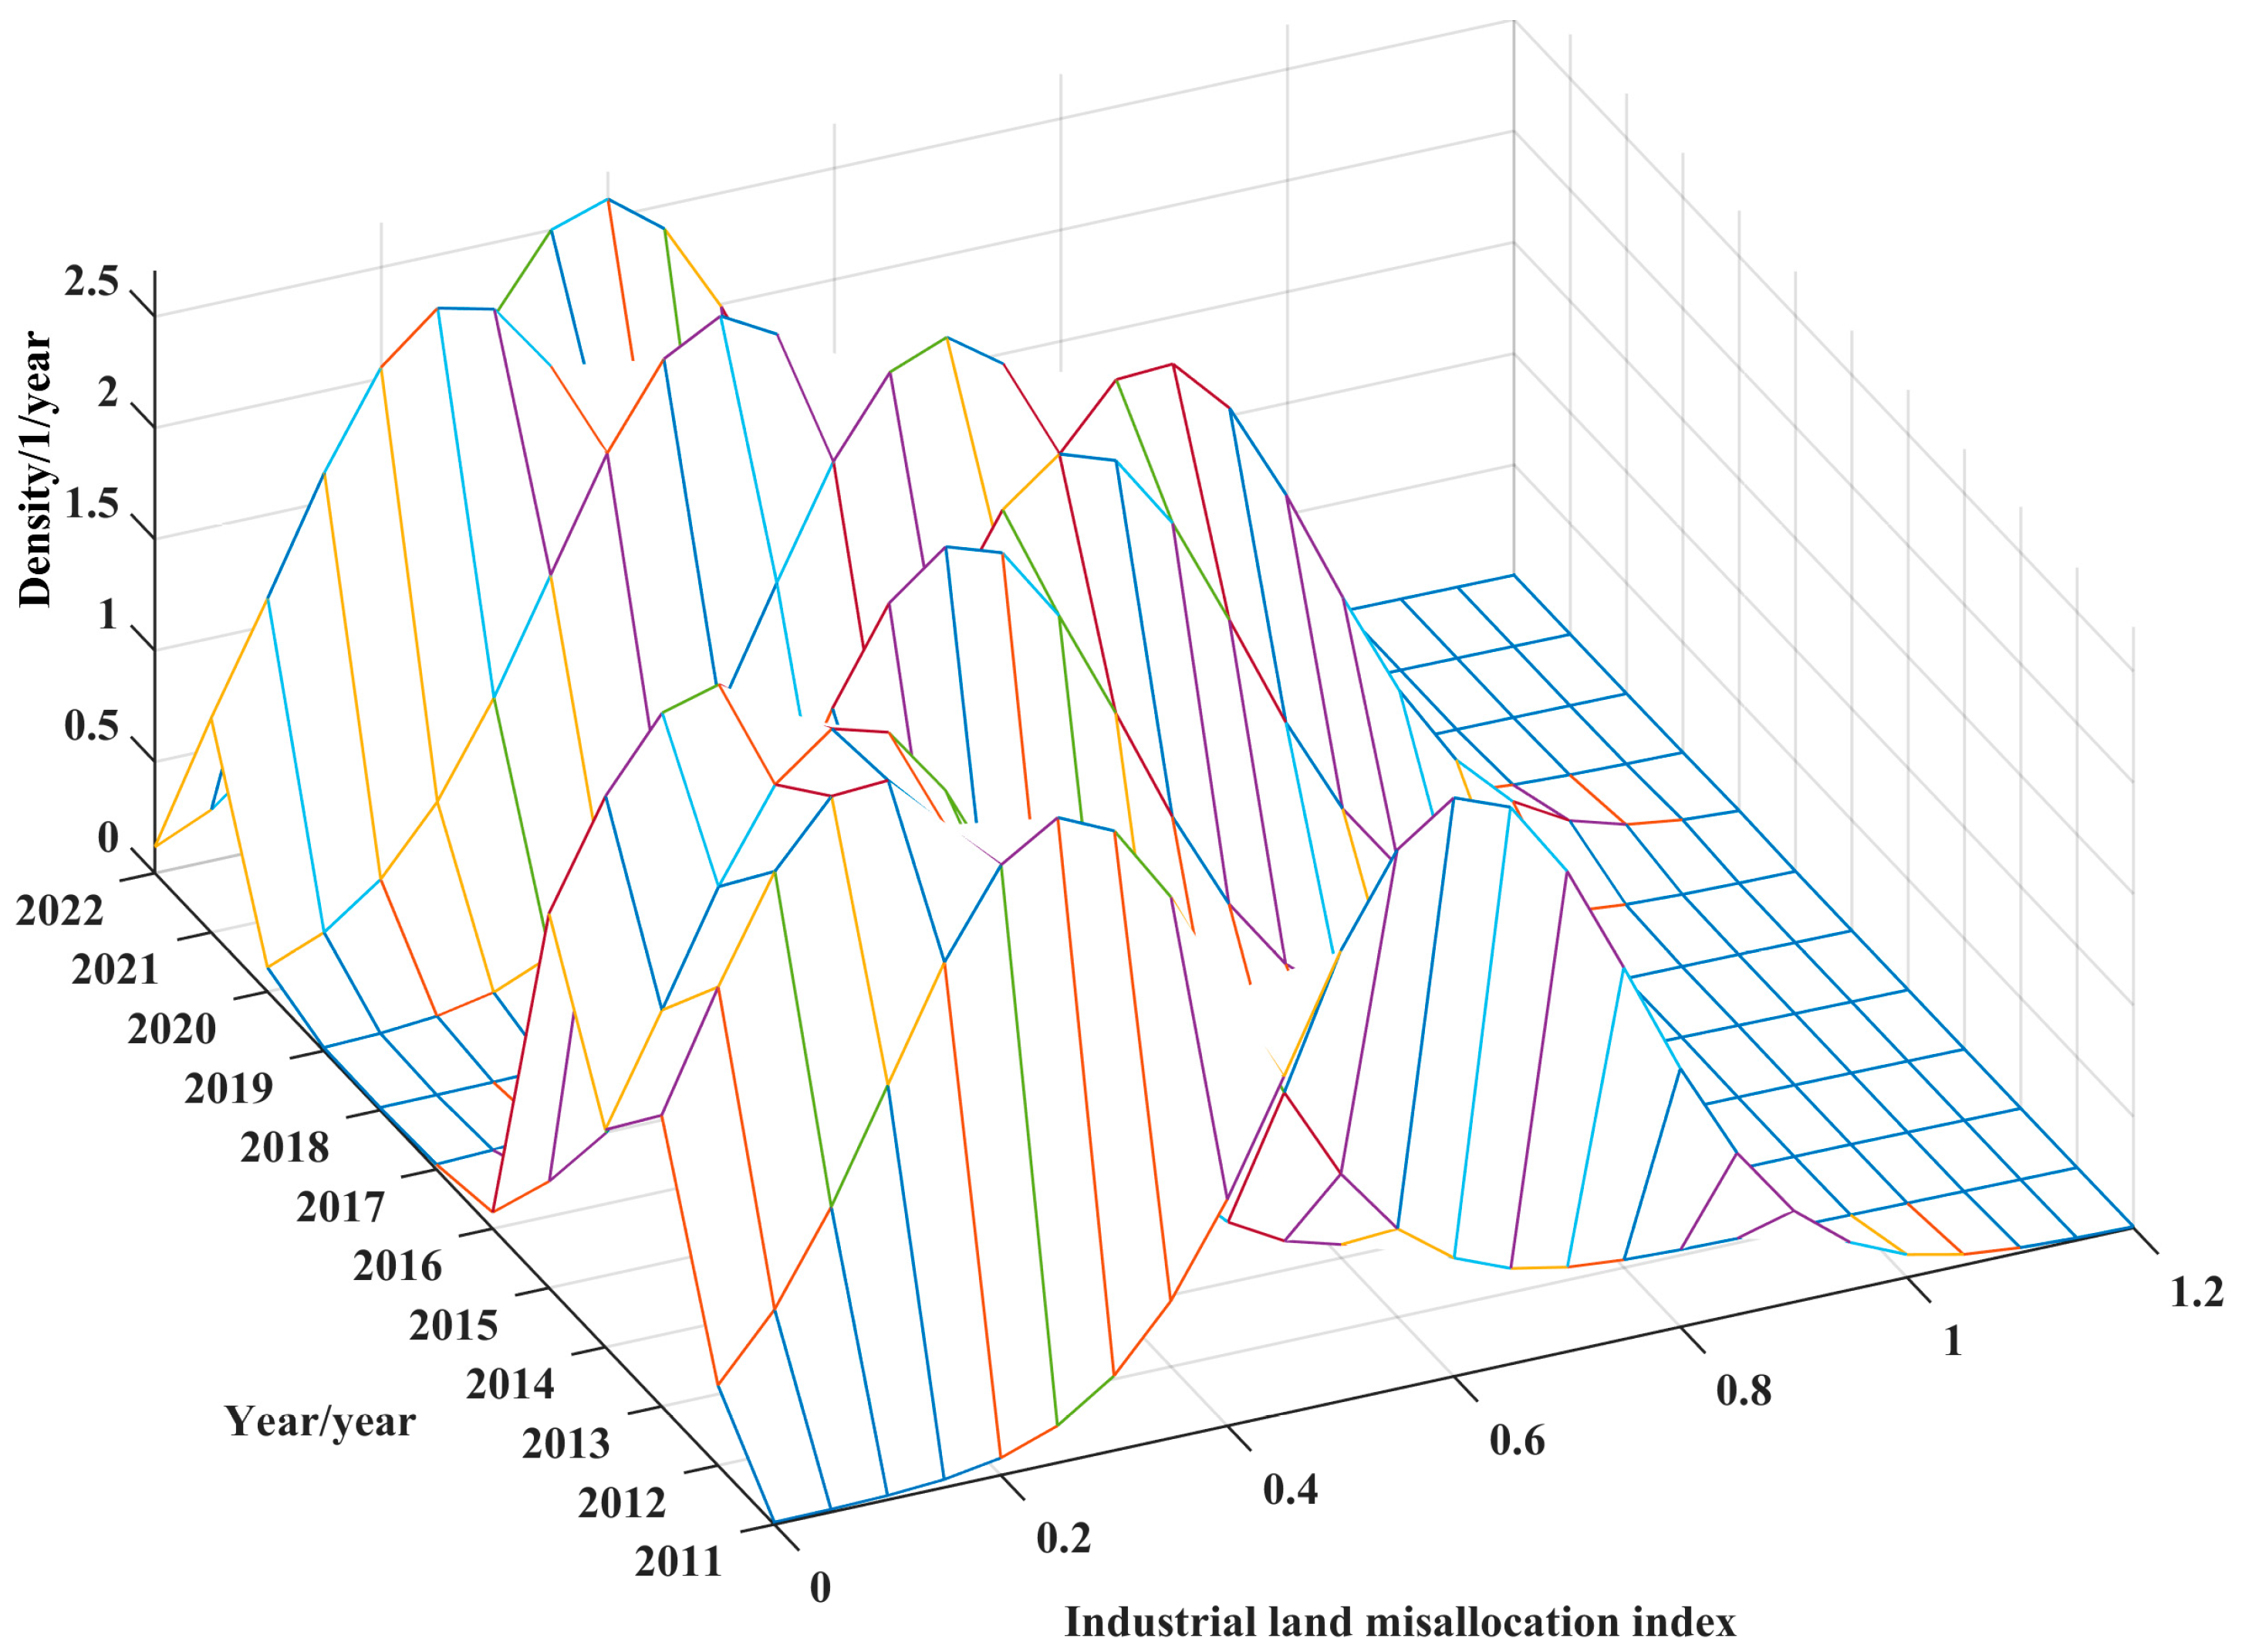
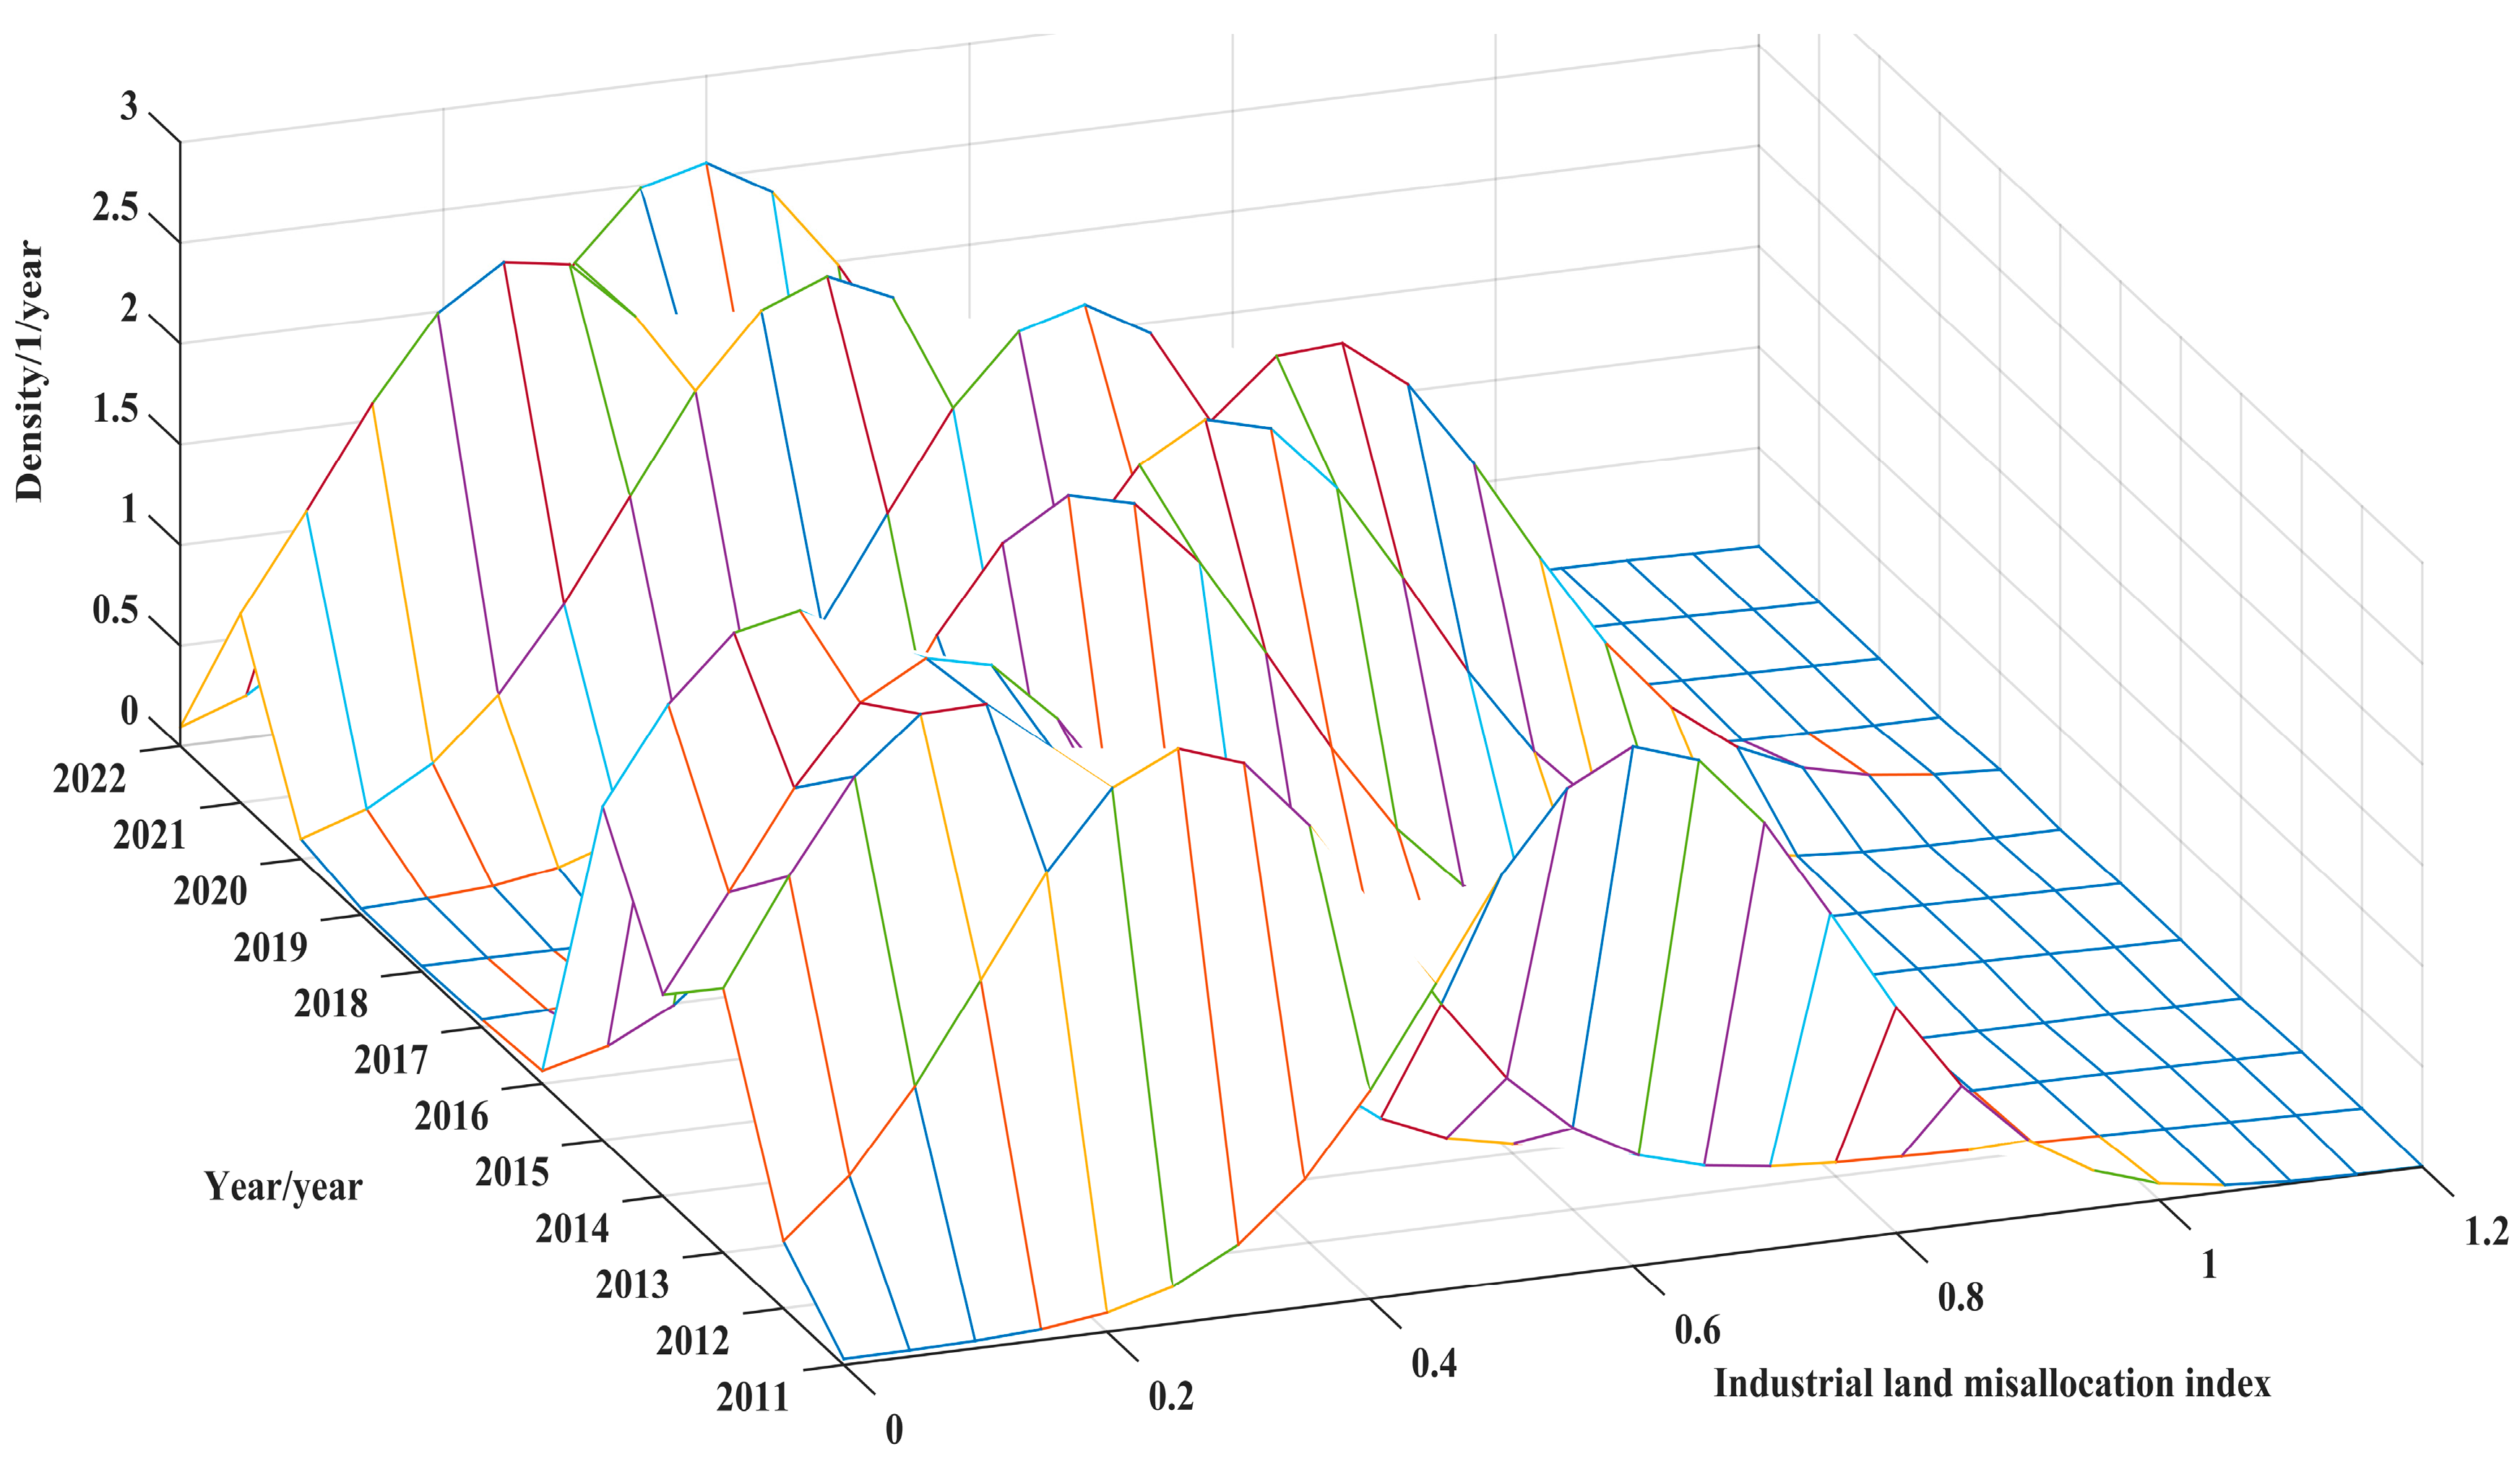
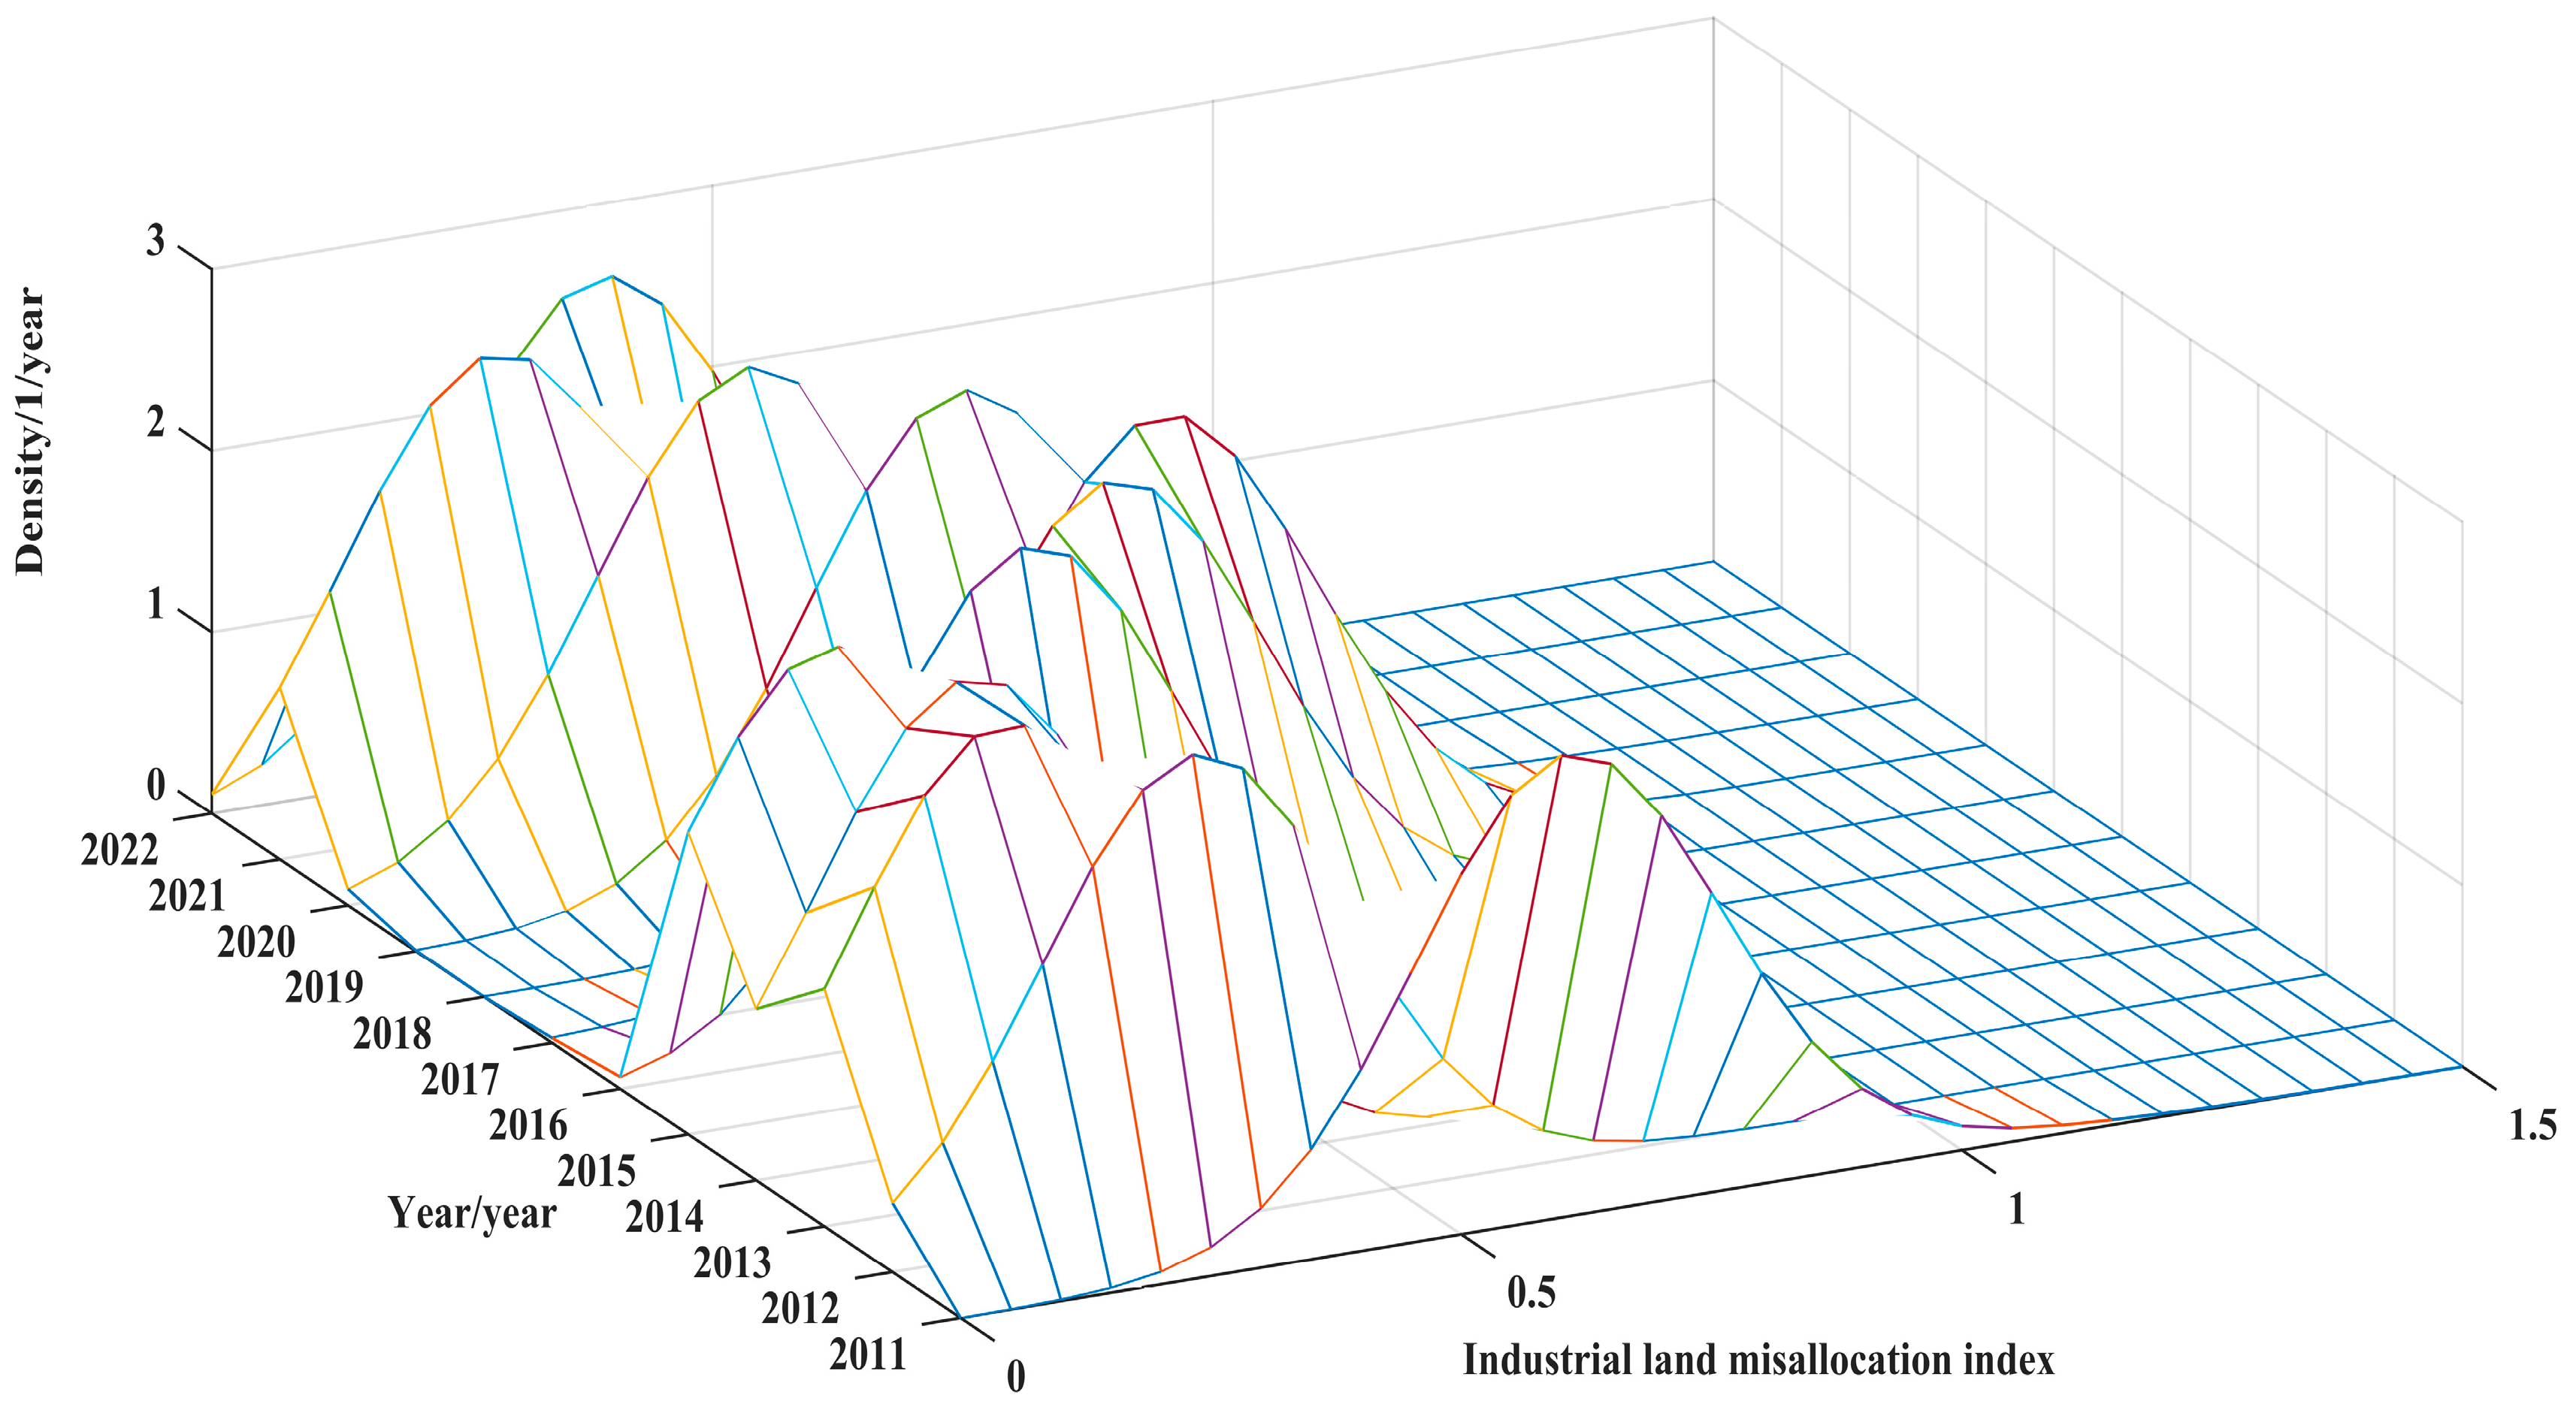
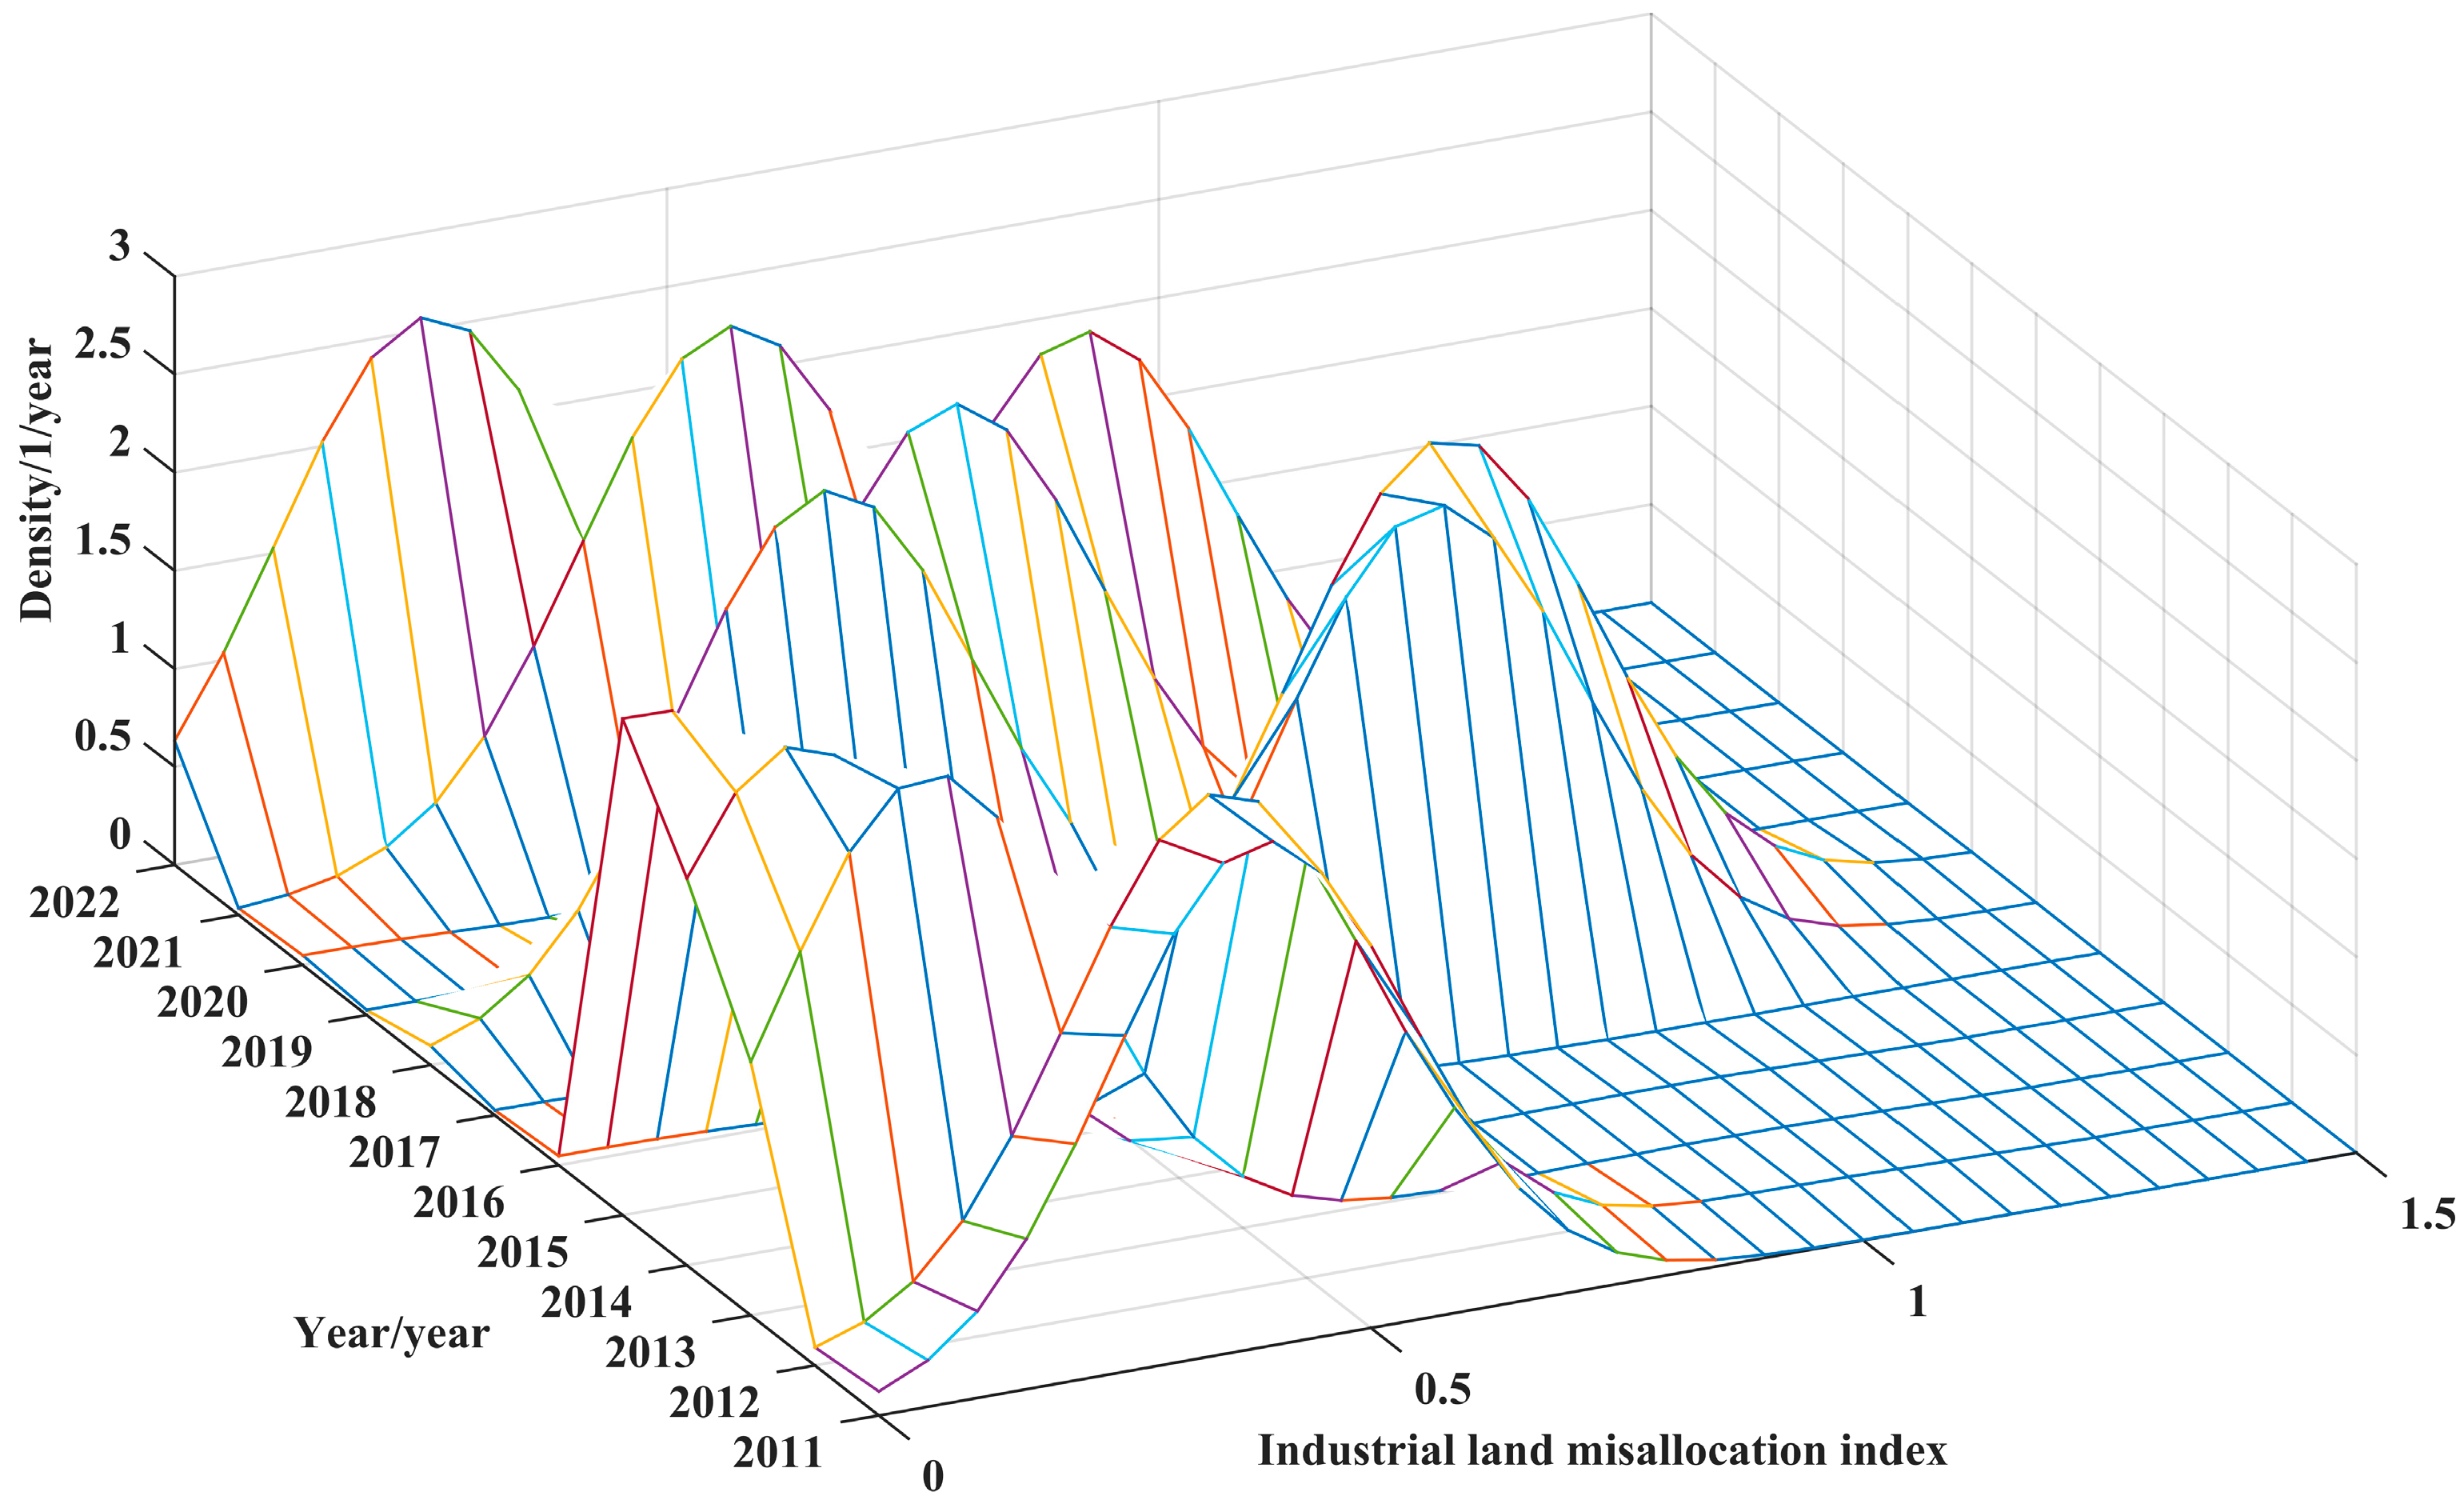
4.1.1. Kernel Density Estimation of the Industrial Land Mismatch
4.1.2. Markov Chain Analysis of the Industrial Land Mismatch in Chinese Cities
- (1)
- Prediction of Long-term Evolution Trend Based on the Traditional Markov Chain Model
- (2)
- Long-term Evolution Trend Prediction Based on the Spatial Markov Chain Model
4.2. Regional Differentiation Characteristics of the Mismatch Degree of Urban Industrial Land in China
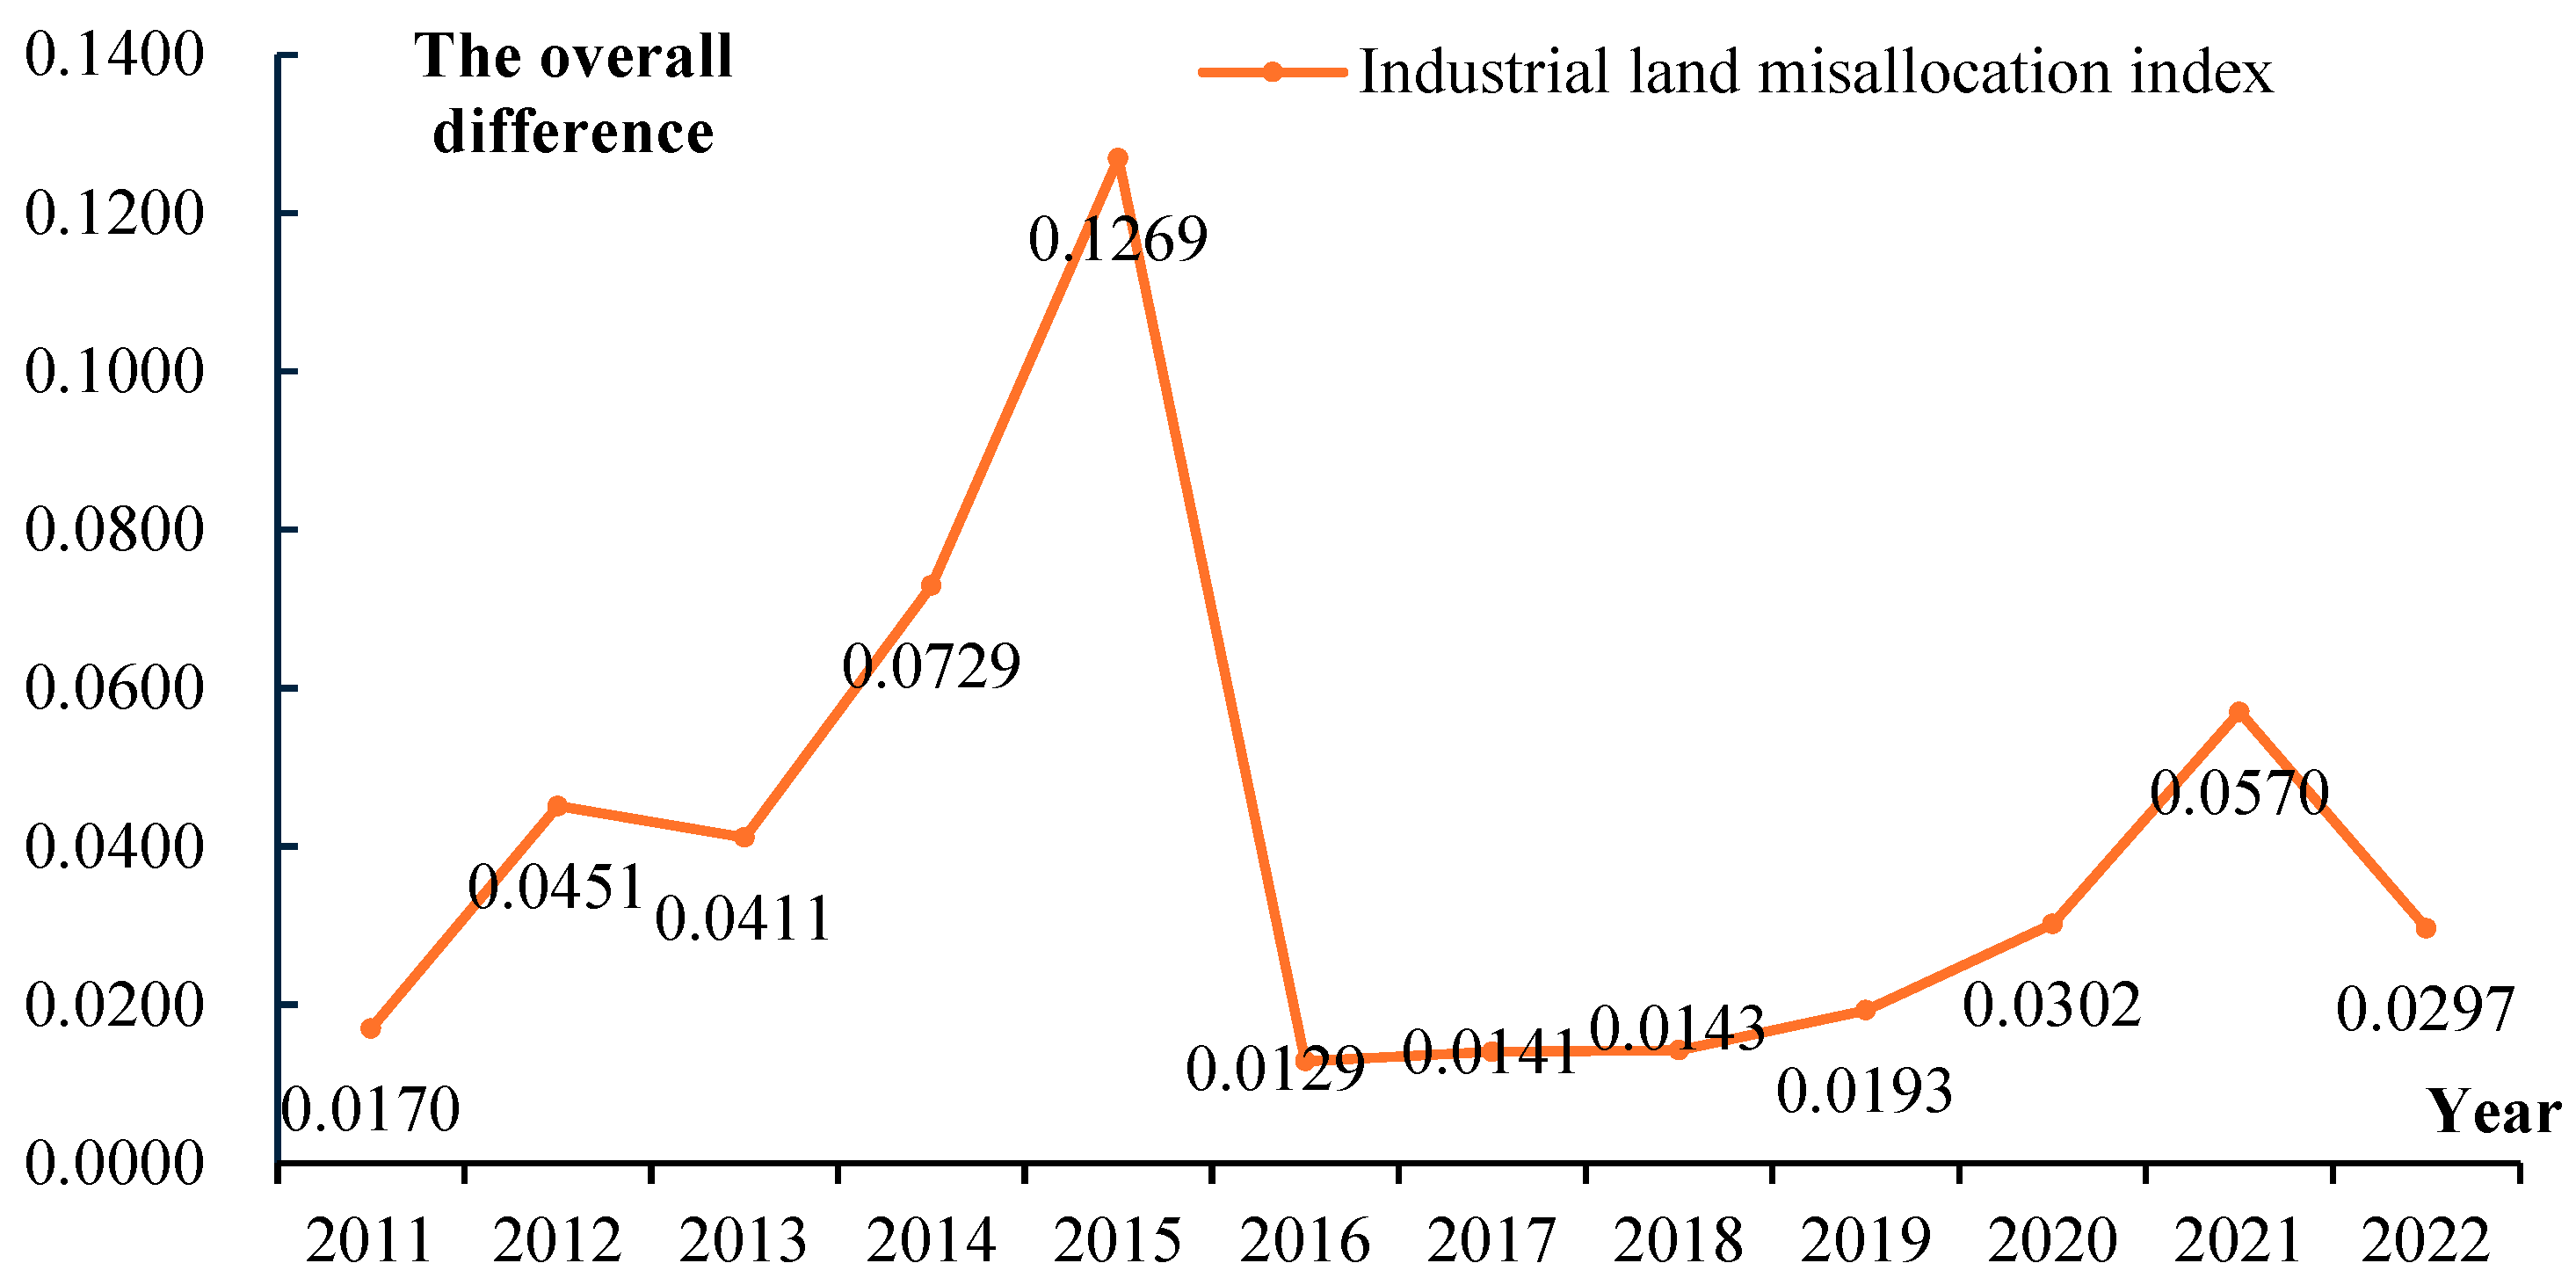
4.2.1. Overall Gap
4.2.2. Decomposition Based on Samples from the East, Central, and West
- (1)
- Intra-regional and Inter-regional Differences
- (2)
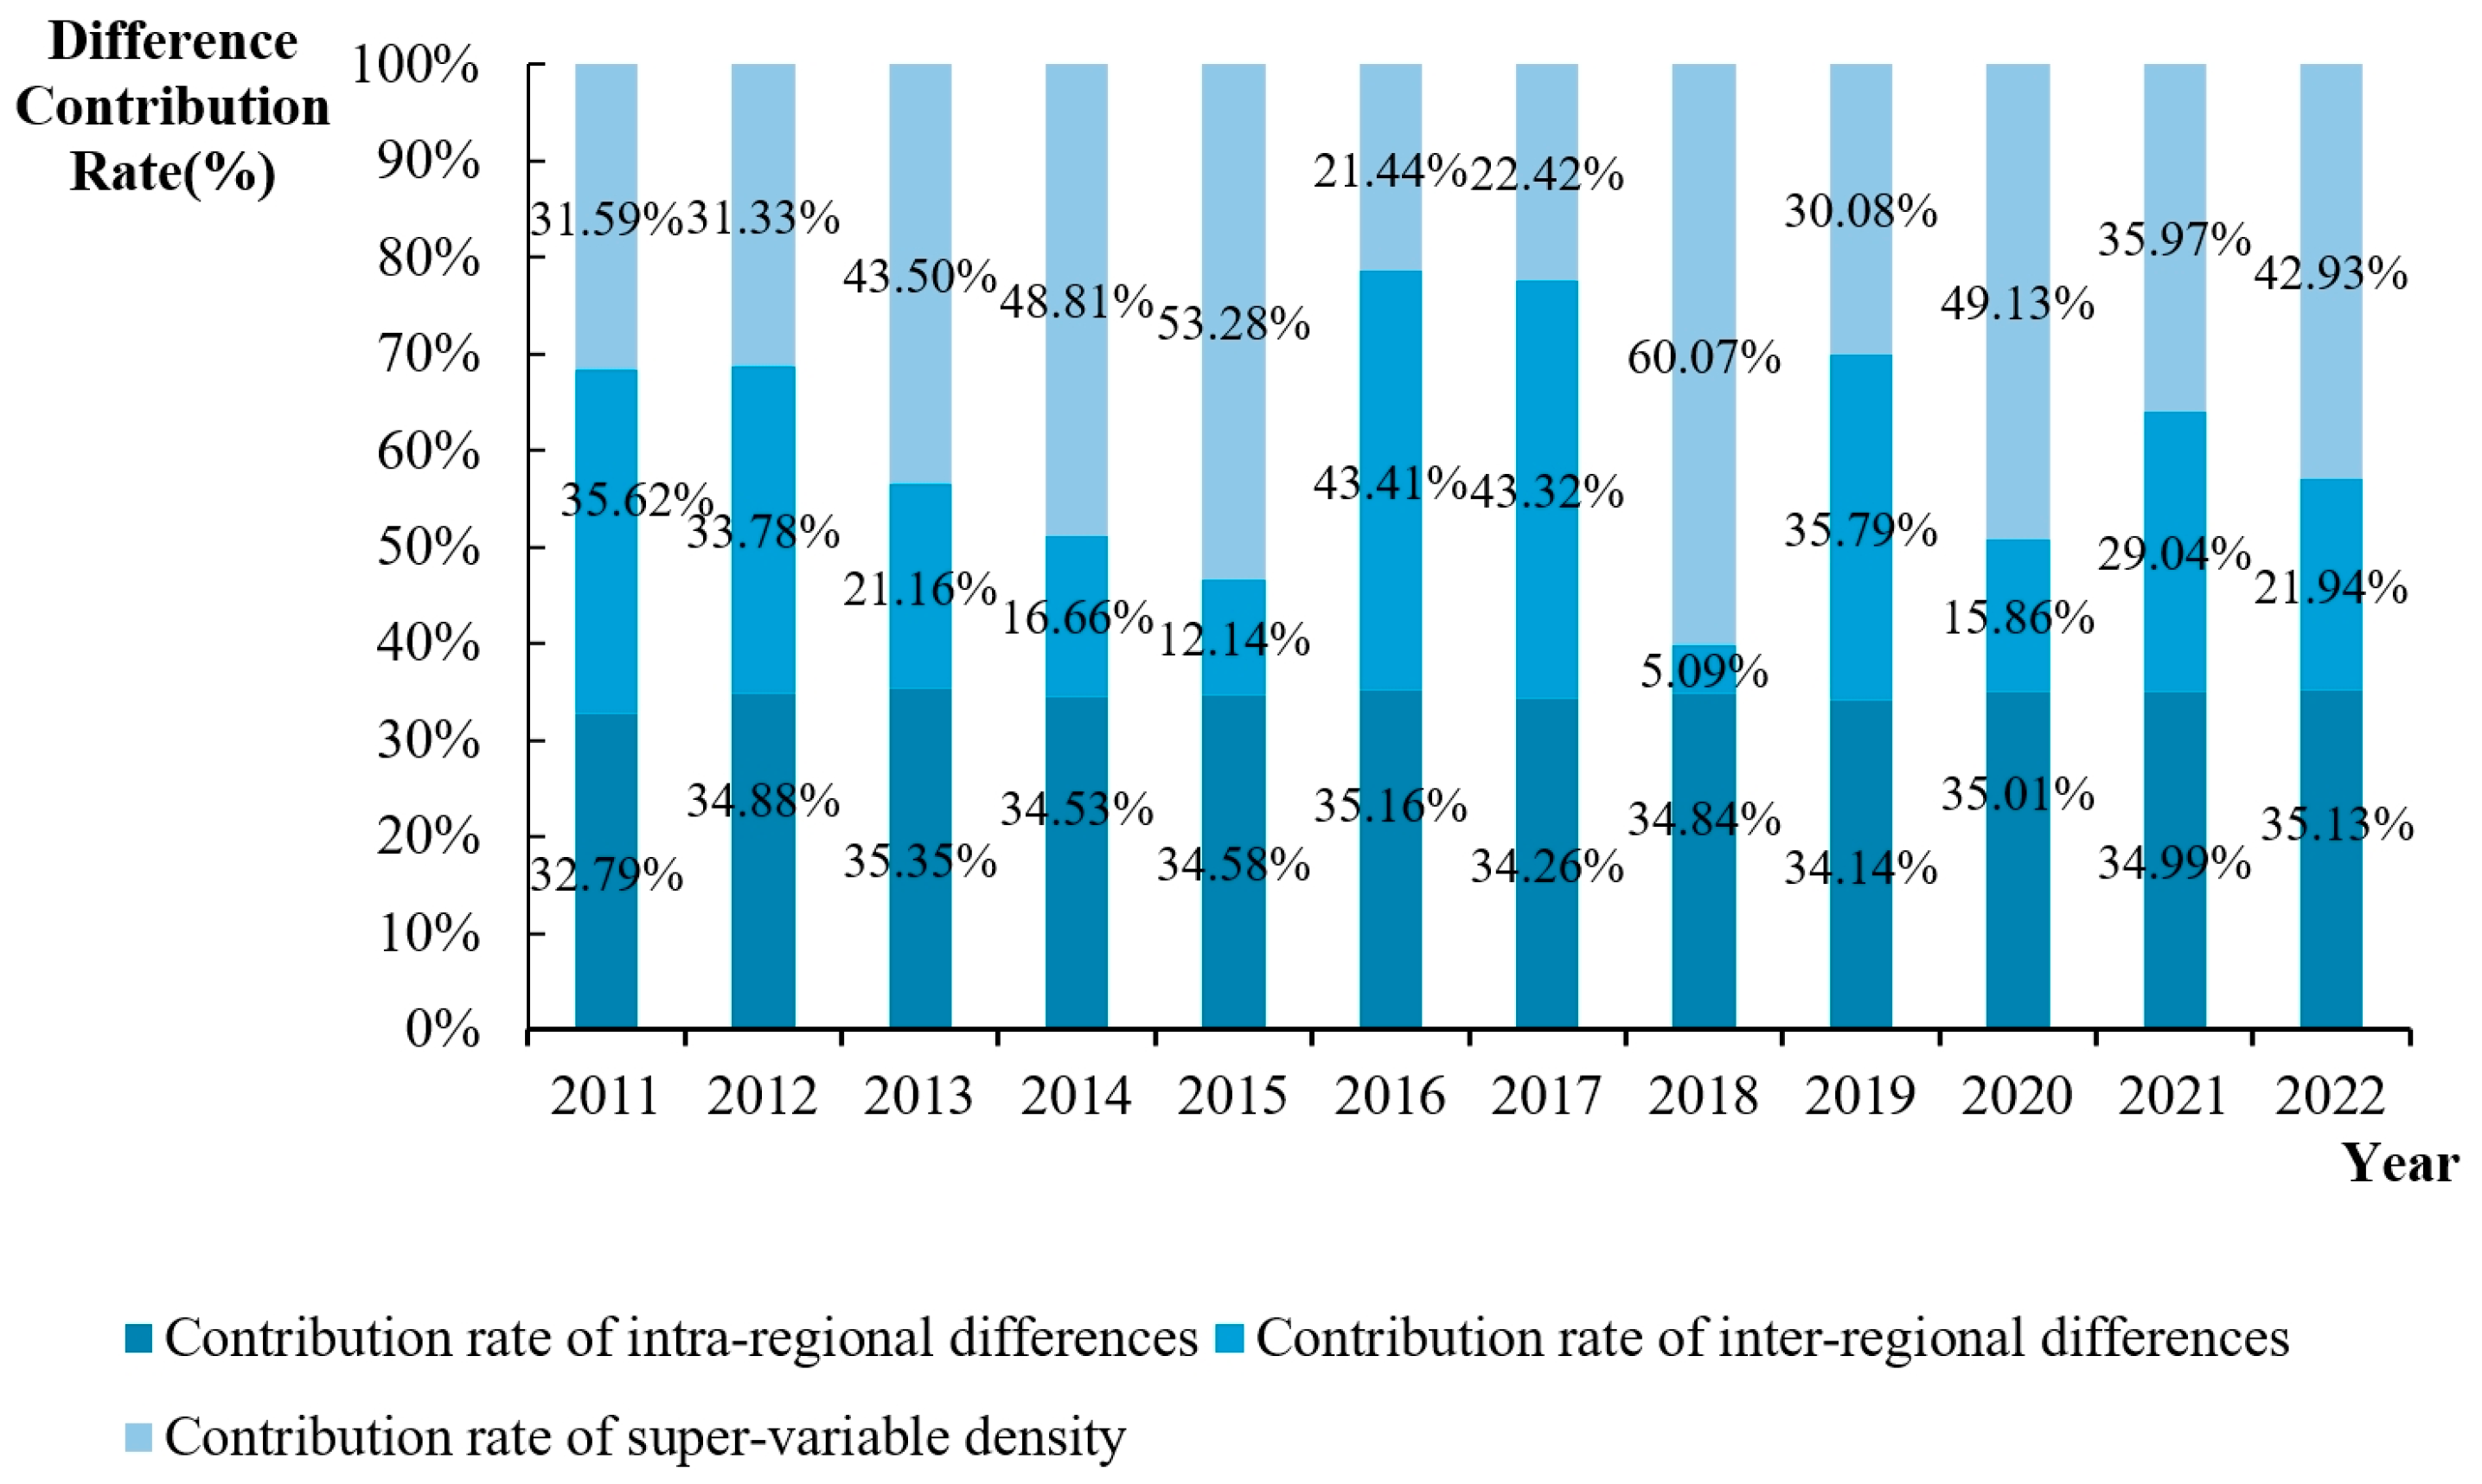
- Sources of Regional Disparity and its Contribution
4.3. Empirical Analysis of the Impact of the Industrial Land Mismatch on Urban Ecological Modernization
4.3.1. Baseline Regression Results
4.3.2. Robustness Check
- (1)
- One Period Lag
- (2)
- Bilateral Shrinking Processing
- (3)
- Replacing Explanatory Variables
4.3.3. Mechanism Inspection
- (1)
- Technological Innovation
- (2)
- Secondary Industry Employees
4.3.4. Heterogeneity Analysis
4.3.5. Further Analysis: Spatial Effects
- (1)
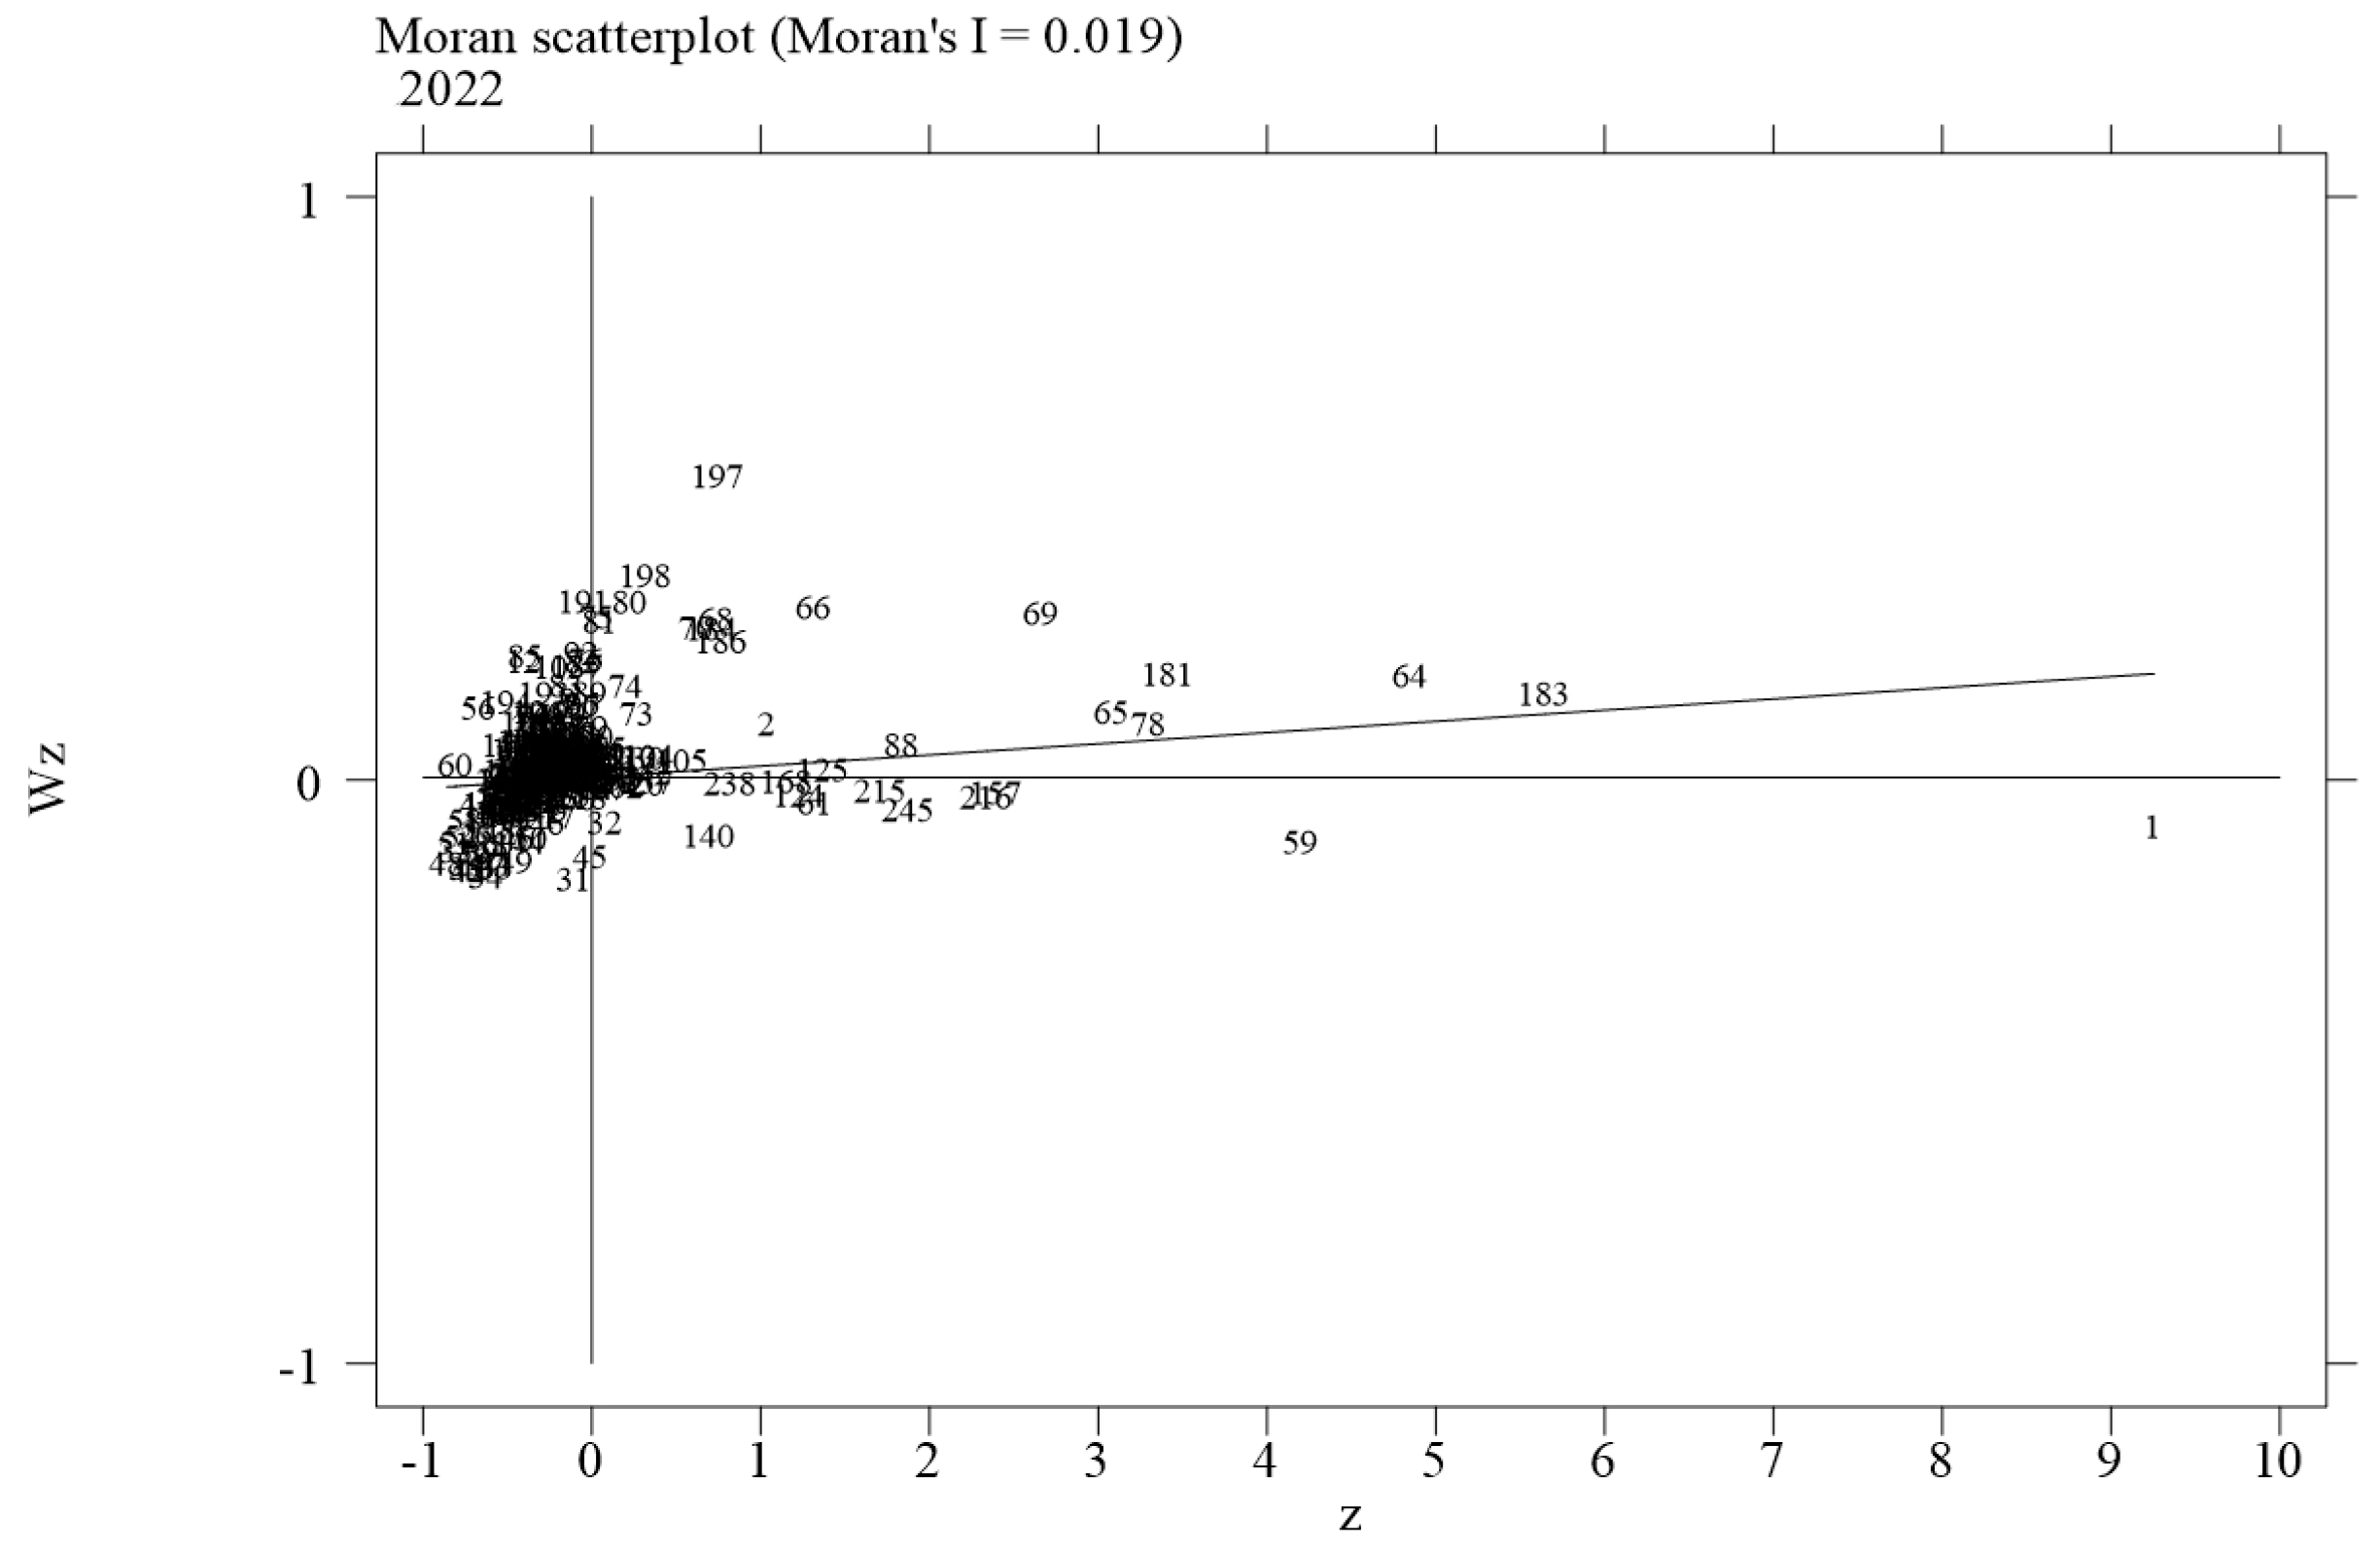
- Moran Index Results
- (2)
- Spatial Durbin Results
5. Discussion
6. Conclusions
Author Contributions
Funding
Data Availability Statement
Conflicts of Interest
References
- Duranton, G.; Puga, D. Chapter 48—Micro-Foundations of Urban Agglomeration Economies. In Handbook of Regional and Urban Economics; Henderson, J.V., Thisse, J.-F., Eds.; Cities and Geography; Elsevier: Amsterdam, The Netherlands, 2004; Volume 4, pp. 2063–2117. [Google Scholar]
- Xu, J.; Yeh, A.; Wu, F. Land Commodification: New Land Development and Politics in China since the Late 1990s. Int. J. Urban Reg. Res. 2009, 33, 890–913. [Google Scholar] [CrossRef]
- Kou, Z.; Liu, X. Find Report on City and Industrial Innovation in China; Fudan Institute of Industrial Development: Shanghai, China, 2017. [Google Scholar]
- Liu, S.; Wang, Z.; Zhang, W.; Xiong, X. The Exhaustion of China’s “Land-Driven Development” Mode: An Analysis Based on Threshold Regression. J. Manag. World 2020, 36, 80–92, 119, 246. [Google Scholar] [CrossRef]
- Zhang, Y.; Zhang, J.; Cheng, Y.; Ren, J. Study on the Meaning of Space Balance and Condition Assessment from the Perspective of Supply and Demand Driven—A Case of Shandong Province. Soft Sci. 2016, 30, 54–58. [Google Scholar] [CrossRef]
- Yi, J.; Guo, J.; Lin, J.; Ou, M. Territorial spatial equilibrium under the concept of ecological civilization: An analytical framework based on two kinds of wealth. Geogr. Res. 2022, 41, 945–959. [Google Scholar]
- Bian, Y.; Song, K.; Bai, J. Market Segmentation, Resource Misallocation and Environmental Pollution. J. Clean. Prod. 2019, 228, 376–387. [Google Scholar] [CrossRef]
- Li, L.; Huang, P.; Ma, G. Land resource mismatch and China productivity differences of industrial firms. J. Manag. World 2016, 8, 86–96. [Google Scholar] [CrossRef]
- Soria, K.Y.; Palacios, M.R.; Morales Gomez, C.A. Governance and Policy Limitations for Sustainable Urban Land Planning. The Case of Mexico. J. Environ. Manag. 2020, 259, 109575. [Google Scholar] [CrossRef] [PubMed]
- Huang, Z.; Du, X. Government Intervention and Land Misallocation: Evidence from China. Cities 2017, 60, 323–332. [Google Scholar] [CrossRef]
- Zhang, M.; Tan, S.; Pan, Z.; Hao, D.; Zhang, X.; Chen, Z. The Spatial Spillover Effect and Nonlinear Relationship Analysis between Land Resource Misallocation and Environmental Pollution: Evidence from China. J. Environ. Manag. 2022, 321, 115873. [Google Scholar] [CrossRef]
- Artioli, F. Sale of Public Land as a Financing Instrument. The Unspoken Political Choices and Distributional Effects of Land-Based Solutions. Land Use Policy 2021, 104, 105199. [Google Scholar] [CrossRef]
- Hartmann, T.; Spit, T. Dilemmas of Involvement in Land Management—Comparing an Active (Dutch) and a Passive (German) Approach. Land Use Policy 2015, 42, 729–737. [Google Scholar] [CrossRef]
- Olsen, S.; Fearnley, N. Policy Transfer of Public Transport Funding Schemes—The Case of Norway. Res. Transp. Econ. 2014, 48, 429–433. [Google Scholar] [CrossRef]
- Valtonen, E.; Falkenbach, H.; Viitanen, K. Securing Public Objectives in Large-Scale Urban Development: Comparison of Public and Private Land Development. Land Use Policy 2018, 78, 481–492. [Google Scholar] [CrossRef]
- Britos, B.; Hernandez, M.A.; Robles, M.; Trupkin, D.R. Land Market Distortions and Aggregate Agricultural Productivity: Evidence from Guatemala. J. Dev. Econ. 2022, 155, 102787. [Google Scholar] [CrossRef]
- Castañeda Dower, P.; Pyle, W. Land Rights, Rental Markets and the Post-Socialist Cityscape. J. Comp. Econ. 2019, 47, 962–974. [Google Scholar] [CrossRef]
- Sun, Z.; Hou, Y. Multi-perspective Observation and Policy Response to Regional Unbalanced Development in China. J. Manag. World 2019, 35, 1–8. [Google Scholar] [CrossRef]
- Chen, W.; Sun, W.; Zhao, H. The Spatial Imbalanced Pattern and State Assessment of Regional Development. Acta Geogr. Sin. 2010, 65, 1209–1217. [Google Scholar]
- Zhang, J.; Chen, Y.; Huang, X. Assessment of the Equilibrium Degree and Limitation Degree of Yangtze River Economic Blet’s Land Development. Resour. Environ. Yangtze Basin 2017, 26, 1945–1953. [Google Scholar]
- Tan, S.; Liu, Q.; Li, Y. Spatial-Temporal Characteristics of Spatial Balance Degrees on Land Use in China. China Land Sci. 2017, 31, 40–46. [Google Scholar]
- Yang, Q.; Wang, L.; Li, Y.; Qin, X. Land use spatial equilibrium from the perspective of supply and demand matching: A case study of Jiangsu Province. Resour. Sci. 2021, 43, 932–943. [Google Scholar] [CrossRef]
- Huang, Z.; Du, X. Review on the Land Resource Misallocation Studies. China Land Sci. 2014, 28, 80–87. [Google Scholar] [CrossRef]
- Mol, A.P.J. Environment and Modernity in Transitional China: Frontiers of Ecological Modernization. Dev. Change 2006, 37, 29–56. [Google Scholar] [CrossRef]
- Murphy, J.; Gouldson, A. Environmental Policy and Industrial Innovation: Integrating Environment and Economy through Ecological Modernisation. Geoforum 2000, 31, 33–44. [Google Scholar] [CrossRef]
- Young, S.C. Introduction: The Origins and Evolving Nature of Ecological Modernisation. In The Emergence of Ecological Modernisation; Routledge: London, UK, 2000; ISBN 978-1-315-81254-0. [Google Scholar]
- Gu, H. A Literature Review and Prospect of China’s Ecological Modernization Transformation at Home and Abroad. Marx. Real. 2015, 05, 184–189. [Google Scholar] [CrossRef]
- Ren, Z. The Relationship between Urban Modernization and Ecological, Characteristic and Humanization. Urban Dev. Stud. 2021, 28, 1–2+9. [Google Scholar]
- Zhang, L.; Mol, A.P.J.; Sonnenfeld, D.A. The Interpretation of Ecological Modernisation in China. Environ. Politics 2007, 16, 659–668. [Google Scholar] [CrossRef]
- Cui, Z.; Xie, L.; Liu, L.; Wang, Y. Study and Design of Eco-city Sustainable Development Index System and Assessment Methodology. Sci. Technol. Eng. 2006, 6, 1863–1868. [Google Scholar]
- Liu, S.; Gao, J. The study on the indicator system for the evaluation of eco-city. J. Shanghai Norm. Univ. Nat. Sci. 2007, 2, 104–110. [Google Scholar]
- Wu, Q.; Wang, R.; Li, H.; Xu, X. The indices and the evaluation method of eco-city. Acta Ecol. Sin. 2005, 8, 2090–2095. [Google Scholar]
- Song, Q.; Lv, B. Coupling Coordinating between Carbon Emissions and Urbanization—A Case of Chinese Low Carbon Pilot Cities. J. Beijing Inst. Technol. Soc. Sci. Ed. 2017, 19, 20–27. [Google Scholar] [CrossRef]
- Jiang, H.; He, J. The Dynamic Coupling Model of Coordinated Development between Regional Economic and Ecological Environment Systems Based on Jiangsu Province. Soft Sci. 2010, 24, 63–68. [Google Scholar]
- Zhao, X.; Wu, M. Evaluation on coordinative and harmonious development between regional urbanization and urban ecological environment—Comparison between thirty provinces and municipalities of China. West Forum 2007, 17, 73–78. [Google Scholar]
- Yang, T.; Wang, N. An Empirical Study on the Coupling Model of Ecological Environment and Urban Competitiveness. Ecol. Econ. 2008, 10, 33–36. [Google Scholar]
- Arvin, M.B.; Pradhan, R.P.; Norman, N.R. Transportation Intensity, Urbanization, Economic Growth, and CO2 Emissions in the G-20 Countries. Util. Policy 2015, 35, 50–66. [Google Scholar] [CrossRef]
- Liu, J.; Wang, Z.; Duan, Y.; Li, X.; Zhang, M.; Liu, H.; Xue, P.; Gong, H.; Wang, X.; Chen, Y.; et al. Effects of Land Use Patterns on the Interannual Variations of Carbon Sinks of Terrestrial Ecosystems in China. Ecol. Indic. 2023, 146, 109914. [Google Scholar] [CrossRef]
- Li, Y.; Huang, X.; Zheng, F. Effects of Land Use Patterns on Carbon Emission in Jiangsu Province. Trans. Chin. Soc. Agric. Eng. 2008, 24, 102–107. [Google Scholar]
- Li, J.; Lu, X.; Kuang, B.; Cai, D. How does the Industrial Land Misallocation Affect Regional Green Development. China Land Sci. 2021, 35, 43–50. [Google Scholar]
- Yoo, C.; Xiao, H.; Zhong, Q.; Weng, Q. Unequal Impacts of Urban Industrial Land Expansion on Economic Growth and Carbon Dioxide Emissions. Commun. Earth Environ. 2024, 5, 203. [Google Scholar] [CrossRef]
- Pu, W.; Zhang, A. Can China’s Market-Oriented Reform Improve the Efficiency of Industrial Land Use? A Panel Data Empirical Analysis at Prefecture Level From 2007–2019. Front. Environ. Sci. 2022, 10, 884958. [Google Scholar] [CrossRef]
- Wang, D.; Liang, Y.F.; Dou, W. How Does Urban Industrial Structure Upgrading Affect Green Productivity? The Moderating Role of Smart City Development. Struct. Change Econ. Dyn. 2025, 72, 133–149. [Google Scholar] [CrossRef]
- Gao, Z.; Cai, L.; Zhang, X. New Industrial Land Use Policy and Firms’ Green Technology Innovation in China—An Empirical Study Based on Double Machine Learning Model. Front. Environ. Sci. 2024, 12, 1356291. [Google Scholar] [CrossRef]
- Chang, J.; Wang, W.; Liu, J. Industrial Upgrading and Its Influence on Green Land Use Efficiency. Sci. Rep. 2023, 13, 2813. [Google Scholar] [CrossRef]
- Ma, J.; Hu, Q.; Wei, X. Effect of China’s Land Resource Allocation Method on Enterprise Technological Innovation: Promoting or Inhibiting. Front. Environ. Sci. 2022, 10, 766246. [Google Scholar] [CrossRef]
- Zeng, L.; Yi, Z. How Does Urban Green Development Affect Land Use Efficiency? Empirical Analysis Based on 285 Cities in China. Pol. J. Environ. Stud. 2025, 34, 3425–3439. [Google Scholar] [CrossRef]
- Yang, L.; Wang, J.; Wu, Q. The Influence of Spatial Imbalance of Urban Industrial Land on Green Economy in China. J. Hebei Univ. Econ. Bus. 2024, 45, 73–82. [Google Scholar] [CrossRef]
- Haung, J.; Chen, L.; Zhang, Y.; Zhao, A. The relationship between industrial land price and industrial structure change. Resour. Sci. 2017, 39, 585–596. [Google Scholar]
- Li, B.; Shao, S.; Fan, M. The Desire to Benefit but to Lose: Land Supply Bias and Urban Green Total Factor Productivity Growth. J. Guizhou Univ. Financ. Econ. 2022, 40, 100–111. [Google Scholar]
- An, Y.; Zhao, L. Land Resource Misallocation, Spatial Strategy Interaction and Urban Innovation Capability. China Land Sci. 2021, 35, 17–25. [Google Scholar]
- Yue, L.; Han, L. Impact of biased technological advances in different types of capital technologies on carbon emission efficiency. Sci. Technol. Manag. Res. 2022, 42, 211–218. [Google Scholar]
- Xu, Y.; Cheng, Y.; Wang, J. The impact of green technological innovation on the spatiotemporal evolution of carbon emission efficiency of resource-based cities in China. Geogr. Res. 2023, 42, 878–894. [Google Scholar]
- Li, L.; Zhang, B.; Xia, Q.; Dong, J. Spatial effect of land resource misallocation on carbon emission efficiency and its influence path: Empirical evidence from 108 cities in the Yangtze River Economic Belt. Resour. Sci. 2023, 45, 1059–1073. [Google Scholar] [CrossRef]
- Wang, R. The Modernization of Harmonious Coexistence between Humanity and Nature: Historical Achievements, Contradictory Challenges and Realization Paths. J. Manag. World 2023, 39, 19–30. [Google Scholar] [CrossRef]
- Fang, C.; Zhou, C.; Gu, C.; Chen, L.; Li, S. Theoretical analysis of interactive coupled effects between urbanization and eco-environment in mega-urban agglomerations. Acta Geogr. Sin. 2016, 71, 531–550. [Google Scholar] [CrossRef]
- Hsieh, C.-T.; Klenow, P.J. Misallocation and Manufacturing TFP in China and India. Q. J. Econ. 2009, 124, 1403–1448. [Google Scholar] [CrossRef]
- Duan, L.; Li, Y. Empirical Analysis of Spatial Spillover Effect Stems from Land Resource Misallocation and Economic Fluctuation. Econ. Geogr. 2020, 40, 207–215. [Google Scholar] [CrossRef]
- Feng, Y.; Wang, J.; Shao, Z.; Yang, L.; Zhu, Q.; Wu, Q. The impact of spatial misallocation of urban industrial land on industrial TFP in China. Resour. Sci. 2022, 44, 2511–2524. [Google Scholar] [CrossRef]
- Wang, J.; Wang, H. Multi-dimensional measurement of levels of Chinese mega-city modernization: Theoretical logic, spatial-temporal characteristics and improving path. Urban Probl. 2023, 05, 12–23. [Google Scholar] [CrossRef]
- Ren, B.; Zhang, Q. Construct a scientific and rational evaluation index system for Chinese-style modernization. Academics 2022, 06, 33–42. [Google Scholar]
- Zhao, X.; Zhou, W.; Hong, M.; Neophytou, A.M. Urbanization Exacerbates Disparities in Exposure to Air Pollution in China. Environ. Res. 2025, 267, 120661. [Google Scholar] [CrossRef]
- Zeng, Y.; Cao, Y.; Qiao, X.; Seyler, B.C.; Tang, Y. Air Pollution Reduction in China: Recent Success but Great Challenge for the Future. Sci. Total Environ. 2019, 663, 329–337. [Google Scholar] [CrossRef]
- Xie, D. Land Resource Misallocation and City Innovation Capacity: Based on Chinese City-level Panel Data Analysis. China J. Econ. 2020, 7, 86–112. [Google Scholar] [CrossRef]
- Geng, X. Industrial Land Misallocation, Industrial Structure and High-quality Economic Development. World Surv. Res. 2024, 09, 53–66. [Google Scholar] [CrossRef]
- Song, X.; Yao, Y.; Wu, X. Digital Finance, Technological Innovation, and Carbon Dioxide Emissions. Econ. Anal. Policy 2023, 80, 482–494. [Google Scholar] [CrossRef]
- Lai, C.; Li, R.; Gao, X. Bank Competition with Technological Innovation Based on Evolutionary Games. Int. Rev. Econ. Financ. 2024, 89, 742–759. [Google Scholar] [CrossRef]
- Shan, C.; Li, Q.; Ding, L. Intellectual Property Protection, Innovation Drive and High-Quality Development of Manufacturing Industry: A Moderated Mediating Effect Analysis. Econ. Probl. 2023, 02, 51–59. [Google Scholar] [CrossRef]
- Hu, F.; Ma, Q.; Peng, J. The Theoretical Mechanism and Empirical Test of Digital Economy Driving Chinese Modernization. Soc. Sci. Front. 2023, 07, 250–256. [Google Scholar]
- Zeng, J.; Blanco-González-Tejero, C.; Sendra, F.J. The Spatial Difference-in-Difference Measurement of Policy Effect of Environmental Protection Interview on Green Innovation. Technol. Forecast. Soc. Change 2023, 191, 122511. [Google Scholar] [CrossRef]
- Jiang, T. Mediating Effects and Moderating Effects in Causal Inference. China Ind. Econ. 2022, 05, 100–120. [Google Scholar] [CrossRef]
- Cai, H.; Henderson, J.V.; Zhang, Q. China’s Land Market Auctions: Evidence of Corruption? RAND J. Econ. 2013, 44, 488–521. [Google Scholar] [CrossRef]
- Cao, H.; Chen, W.; Tan, X.; Li, Q. Identification and Driving Mechanism of the Industrial Land Use Transition in China. Habitat Int. 2023, 138, 102848. [Google Scholar] [CrossRef]
- Dong, Z.; Li, Y.; Balland, P.-A.; Zheng, S. Industrial Land Policy and Economic Complexity of Chinese Cities. Ind. Innov. 2022, 29, 367–395. [Google Scholar] [CrossRef]
- Cheng, J.; Zhao, J.; Zhu, D.; Jiang, X.; Zhang, H.; Zhang, Y. Land Marketization and Urban Innovation Capability: Evidence from China. Habitat Int. 2022, 122, 102540. [Google Scholar] [CrossRef]
- Lin, G.C.S.; Yi, F. Urbanization of Capital or Capitalization on Urban Land? Land Development and Local Public Finance in Urbanizing China. Urban Geogr. 2011, 32, 52–79. [Google Scholar] [CrossRef]
- Han, F.; Huang, M. Land Misallocation and Carbon Emissions: Evidence from China. Land 2022, 11, 1189. [Google Scholar] [CrossRef]
- Yu, J.; Zhou, K.; Yang, S. Land Use Efficiency and Influencing Factors of Urban Agglomerations in China. Land Use Policy 2019, 88, 104143. [Google Scholar] [CrossRef]
- Zhang, X.; Mount, T.D.; Boisvert, R.N. Industrialization, Urbanization and Land Use in China. J. Chin. Econ. Bus. Stud. 2004, 02, 207–224. [Google Scholar] [CrossRef]
- Song, Y.; Zenou, Y. Urban Villages and Housing Values in China. Reg. Sci. Urban Econ. 2012, 42, 495–505. [Google Scholar] [CrossRef]
- Hong, Y.; Lyu, X.; Chen, Y.; Li, W. Industrial Agglomeration Externalities, Local Governments’ Competition and Environmental Pollution: Evidence from Chinese Prefecture-Level Cities. J. Clean. Prod. 2020, 277, 123455. [Google Scholar] [CrossRef]
- Xing, Z.; He, C. Regional inequality: Theoretical review, research progress, and prospects. Prog. Geogr. 2024, 43, 1839–1852. [Google Scholar]
- Lu, W.; Lu, S. A Study on Loan Interest Rate Liberalization, Banking Competition and Resource Misallocation in Cities. Economist 2024, 07, 45–56. [Google Scholar] [CrossRef]
- Shi, B.; Ming, M. Driving Mechanisms, Evolutionary Trends and Policy Options for the Basic Modernization of Western Chinese Cities. J. Beijing Norm. Univ. Soc. Sci. 2021, 03, 34–45. [Google Scholar]
- Yang, L.; Wang, J.; Wu, Q. Influence of Industrial Land Spatial Mismatching on Urban Innovation in Yangtze River Delta Region. Resour. Environ. Yangtze Basin 2024, 33, 1156–1167. [Google Scholar]


| First-Level Indicators | Second-Level Indicators | Third-Level Indicators | Indicator Attributes |
|---|---|---|---|
| Urban Ecological Modernization | Air Pollution | PM2.5 Annual Average Concentration | - |
| Inversion Days | - | ||
| Pollution Reduction | Industrial Sulfur Dioxide Emissions | - | |
| Energy Consumption | Energy Consumption Per Unit of GDP | - | |
| Pollution Treatment | Concentrated Treatment Rate of Sewage Treatment Plants | + | |
| Harmless Treatment Rate of Domestic Waste | + | ||
| Urban Greening | Green Coverage Rate of Built-up areas | + | |
| Per Capita Park Green Space Area | + | ||
| Environmental Protection Investment/GDP | + | ||
| Green Technology | Number of Green Patent Applications | + |
| t/t + 1 | I | II | III | IV |
|---|---|---|---|---|
| I | 0.5632 | 0.0958 | 0.3321 | 0.0089 |
| II | 0.5505 | 0.4073 | 0.0312 | 0.0110 |
| III | 0.0390 | 0.3000 | 0.3221 | 0.3390 |
| IV | 0.0179 | 0.3278 | 0.3291 | 0.3253 |
| Field Type | t/t + 1 | I | II | III | IV |
|---|---|---|---|---|---|
| k = 1 | I | 0.4264 | 0.0814 | 0.4845 | 0.0078 |
| II | 0.0000 | 0.5625 | 0.3750 | 0.0625 | |
| III | 0.0000 | 0.4000 | 0.4000 | 0.2000 | |
| IV | 0.3333 | 0.1667 | 0.5000 | 0.0000 | |
| k = 2 | I | 0.8516 | 0.1172 | 0.0273 | 0.0039 |
| II | 0.5754 | 0.4028 | 0.0198 | 0.0020 | |
| III | 0.1111 | 0.8333 | 0.0000 | 0.0556 | |
| IV | 0.3333 | 0.3333 | 0.0000 | 0.3333 | |
| k = 3 | I | 0.3750 | 0.2500 | 0.2500 | 0.1250 |
| II | 0.4348 | 0.3913 | 0.0435 | 0.1304 | |
| III | 0.0378 | 0.2851 | 0.3311 | 0.3459 | |
| IV | 0.0172 | 0.0129 | 0.0300 | 0.9399 | |
| k = 4 | I | 0.0000 | 0.3333 | 0.3333 | 0.3333 |
| II | 0.0000 | 0.5000 | 0.0000 | 0.5000 | |
| III | 0.0000 | 0.4286 | 0.1429 | 0.4286 | |
| IV | 0.0093 | 0.4664 | 0.4627 | 0.0616 |
| Year | Disparities Within Regions | Regional Disparity | |||||||
|---|---|---|---|---|---|---|---|---|---|
| East | Central | West | Yangtze River Basin Cities | Yellow River Basin Cities | East-Central | East-West | Central-West | Yangtze River Basin-Yellow River Basin | |
| 2011 | 0.0206 | 0.0093 | 0.0215 | 0.0307 | 0.0525 | 0.0154 | 0.0213 | 0.0157 | 0.0423 |
| 2012 | 0.0654 | 0.0367 | 0.0251 | 0.0389 | 0.0205 | 0.0520 | 0.0470 | 0.0313 | 0.0300 |
| 2013 | 0.0671 | 0.0308 | 0.0172 | 0.0570 | 0.0043 | 0.0494 | 0.0432 | 0.0245 | 0.0314 |
| 2014 | 0.0821 | 0.0801 | 0.0495 | 0.1608 | 0.1382 | 0.0817 | 0.0663 | 0.0654 | 0.1508 |
| 2015 | 0.1510 | 0.1252 | 0.0925 | 0.4270 | 0.4496 | 0.1392 | 0.1234 | 0.1095 | 0.4417 |
| 2016 | 0.0184 | 0.0121 | 0.0060 | 0.0243 | 0.0064 | 0.0154 | 0.0124 | 0.0091 | 0.0155 |
| 2017 | 0.0198 | 0.0099 | 0.0116 | 0.0130 | 0.0008 | 0.0150 | 0.0157 | 0.0108 | 0.0070 |
| 2018 | 0.0213 | 0.0107 | 0.0090 | 0.0342 | 0.0134 | 0.0161 | 0.0154 | 0.0099 | 0.0241 |
| 2019 | 0.0198 | 0.0218 | 0.0148 | 0.0206 | 0.0047 | 0.0211 | 0.0099 | 0.0184 | 0.0128 |
| 2020 | 0.0349 | 0.0370 | 0.0142 | 0.0355 | 0.0291 | 0.0362 | 0.0248 | 0.0260 | 0.0324 |
| 2021 | 0.0947 | 0.0343 | 0.0298 | 0.0315 | 0.0462 | 0.0669 | 0.0639 | 0.0325 | 0.0391 |
| 2022 | 0.0324 | 0.0397 | 0.0117 | 0.0532 | 0.0144 | 0.0364 | 0.0225 | 0.0261 | 0.0348 |
| Variables | EM |
|---|---|
| ILM | −0.010 *** |
| (−3.57) | |
| Economic | 0.003 *** |
| (8.99) | |
| Urbanization | −541.822 *** |
| (−10.18) | |
| Industrial Structure | 69.680 *** |
| (3.79) | |
| Opening | 8.075 * |
| (1.95) | |
| Population | 7.386 *** |
| (5.47) | |
| Constant | 2635.950 *** |
| (11.98) | |
| Observations | 3143 |
| R2 | 0.823 |
| City fixed effect | YES |
| Year fixed effect | YES |
| Variables | (1) | (2) | (3) |
|---|---|---|---|
| EM | EM | EM | |
| ILM | −0.006 *** | −0.006 *** | |
| (−2.63) | (−2.89) | ||
| XIS | −0.105 ** | ||
| (−2.28) | |||
| Observations | 2881 | 3143 | 3143 |
| R2 | 0.852 | 0.855 | 0.887 |
| Controls | YES | YES | YES |
| City fixed effect | YES | YES | YES |
| Year fixed effect | YES | YES | YES |
| Variables | (1) | (2) |
|---|---|---|
| Technological Innovation | Secondary Industry Employees | |
| ILM | −0.003 *** | 3.053 * |
| (−3.25) | (1.88) | |
| Observations | 3143 | 3143 |
| R2 | 0.837 | 0.917 |
| Controls | YES | YES |
| City fixed effect | YES | YES |
| Year fixed effect | YES | YES |
| Variables | (1) | (2) | (3) | (4) | (5) |
|---|---|---|---|---|---|
| EM | EM | EM | EM | EM | |
| ILM | −0.012 ** | −0.002 | 0.003 | −0.012 *** | 0.116 *** |
| (−2.48) | (−0.57) | (0.82) | (−3.21) | (2.82) | |
| Controls | YES | YES | YES | YES | YES |
| Observations | 1164 | 1140 | 839 | 1260 | 803 |
| R2 | 0.847 | 0.717 | 0.864 | 0.842 | 0.838 |
| City fixed effect | YES | YES | YES | YES | YES |
| Year fixed effect | YES | YES | YES | YES | YES |
| Year | I | E(I) | sd(I) | z | p-Value |
|---|---|---|---|---|---|
| 2011 | 0.080 | −0.004 | 0.005 | 15.564 | 0.000 |
| 2012 | 0.061 | −0.004 | 0.005 | 12.083 | 0.000 |
| 2013 | 0.043 | −0.004 | 0.005 | 9.209 | 0.000 |
| 2014 | 0.039 | −0.004 | 0.005 | 8.691 | 0.000 |
| 2015 | 0.036 | −0.004 | 0.005 | 7.940 | 0.000 |
| 2016 | 0.041 | −0.004 | 0.005 | 8.610 | 0.000 |
| 2017 | 0.042 | −0.004 | 0.005 | 8.763 | 0.000 |
| 2018 | 0.041 | −0.004 | 0.005 | 8.585 | 0.000 |
| 2019 | 0.034 | −0.004 | 0.005 | 7.328 | 0.000 |
| 2020 | 0.034 | −0.004 | 0.005 | 7.252 | 0.000 |
| 2021 | 0.027 | −0.004 | 0.005 | 5.998 | 0.000 |
| 2022 | 0.019 | −0.004 | 0.005 | 4.444 | 0.000 |
| Variables | (1) | (2) |
|---|---|---|
| Main | Wx | |
| ILM | −0.006 *** | −0.084 ** |
| (−3.20) | (−2.36) | |
| rho | 0.727 *** | |
| (10.56) | ||
| Observations | 3144 | |
| R-squared | 0.207 | |
| Controls | YES | |
| City fixed effect | YES | |
| Year fixed effect | YES | |
Disclaimer/Publisher’s Note: The statements, opinions and data contained in all publications are solely those of the individual author(s) and contributor(s) and not of MDPI and/or the editor(s). MDPI and/or the editor(s) disclaim responsibility for any injury to people or property resulting from any ideas, methods, instructions or products referred to in the content. |
© 2025 by the authors. Licensee MDPI, Basel, Switzerland. This article is an open access article distributed under the terms and conditions of the Creative Commons Attribution (CC BY) license (https://creativecommons.org/licenses/by/4.0/).
Share and Cite
Liu, K.; Du, R.; He, J. Fluctuating Development Traits of Industrial Land Mismatch and Its Influence on Urban Ecological Modernization. Land 2025, 14, 1035. https://doi.org/10.3390/land14051035
Liu K, Du R, He J. Fluctuating Development Traits of Industrial Land Mismatch and Its Influence on Urban Ecological Modernization. Land. 2025; 14(5):1035. https://doi.org/10.3390/land14051035
Chicago/Turabian StyleLiu, Ke, Ran Du, and Jiaxin He. 2025. "Fluctuating Development Traits of Industrial Land Mismatch and Its Influence on Urban Ecological Modernization" Land 14, no. 5: 1035. https://doi.org/10.3390/land14051035
APA StyleLiu, K., Du, R., & He, J. (2025). Fluctuating Development Traits of Industrial Land Mismatch and Its Influence on Urban Ecological Modernization. Land, 14(5), 1035. https://doi.org/10.3390/land14051035