Article

Evolution of Ecological Environment Quality in Metropolitan Suburbs and Its Interaction with Tourism Development: The Case of Huangpi District, Wuhan City

1
College of Urban and Environmental Sciences, Central China Normal University, Wuhan 430079, China
2
Wuhan Branch of China Tourism Academy, Wuhan 430079, China
3
Hubei Tourism Research Institute, Wuhan 430079, China
4
School of Geography and Environmental Sciences, Guizhou Normal University, Guiyang 550025, China
*
Author to whom correspondence should be addressed.
Land 2025, 14(5), 1032; https://doi.org/10.3390/land14051032
Submission received: 8 April 2025 / Revised: 6 May 2025 / Accepted: 7 May 2025 / Published: 8 May 2025

Abstract

:
Tourism has been a key factor in the economic growth of metropolitan suburbs. However, tourism development (TD) frequently precipitates ecological challenges, which are compounded by the absence of scientific frameworks for quantifying TD’s impact on suburban ecological environment quality (EEQ). We focused on assessing the spatiotemporal evolution of the EEQ of the primary scenic spots in Huangpi District, a suburb of Wuhan City, using a Remote Sensing Ecological Index (RSEI) model. We analyzed the impact of TD on the EEQ from 2000 to 2023 by employing independent sample t-tests, response coefficients, and the four-quadrant model. The findings indicate that the EEQ in Huangpi District from 2000 to 2023 presented the spatial distribution of “a lower EEQ in the south and a higher EEQ in the north”, first decreasing and then improving. The EEQ of the district’s scenic spots is higher than that of the entire district, and the overall trend in its variation is consistent with that for the district. TD’s impact on the EEQ in Huangpi District differs in terms of its direction and magnitude based on stage-specific characteristics, whereas for scenic spots, this difference is dependent on the grade and type of spot. We constructed a logical framework encompassing the “magnitude of difference–response characteristics–coordination status”, revealing the dynamic correlation mechanism between TD and EEQ and offering insights into balancing TD and protection of the ecological environmental, thereby facilitating the sustainable development of Huangpi District.

1. Introduction

Suburbs, transitional zones between urban and rural areas, experience some of the most complex dynamic changes in their cultural landscapes and socioeconomic processes [1,2]. Increased urbanization and mass tourism have significantly transformed the role of suburbs in metropolitan regions. Although the benefits of traditional industrial development have waned [3], suburbs are increasingly recognized for providing ecological services to cities through their abundant natural resources [4]. Concurrently, bolstered by favorable geographic conditions and robust market demand, suburbs play a prominent role in accommodating urban residents’ recreational and leisure needs [5], with tourism development (TD) emerging as a key industrial advantage. However, the rapid pace of urbanization has induced socioeconomic transformations and spatial reconfiguration of suburbs [6], producing substantial social and economic benefits while raising ecological risks [7]. These risks involve degraded ecosystem sustainability and ecological decline, hindering sustainable development in suburban regions. Balancing economic growth with the harmonious development of regional ecosystems is crucial for achieving sustainable development goals. As a green industry fostering regional economic growth, the tourism sector can promote economic development while protecting the environment [8], serving as a vital conduit for regional sustainable development [9]. However, in metropolitan suburbs, where ecotourism is the primary driver of development, effective tourism planning requires comprehensive assessments and management of the regional ecological environment quality (EEQ). Consequently, evaluating the characteristics of suburban EEQ and analyzing the interaction between tourism activities and EEQ are important for achieving tourism-driven economic growth and development that is synchronized with regional ecosystems.
From a data type perspective, the current methods for monitoring and assessing EEQ are classified into several categories. For example, one category entails constructing indicator systems at the macro level and selecting pertinent socioeconomic data [10,11]. Such approaches are primarily employed in early EEQ assessments to analyze the relationship between EEQ and urbanization [10,12]. However, these methods are inadequate for capturing intra-unit variations in the EEQ owing to the administrative-unit-based statistical scale of socioeconomic data. Another category involves applying individual ecological indicators derived from satellite remote sensing data in EEQ assessments, such as greenness, wetness, dryness, and heat [13,14,15]. Researchers have integrated socioeconomic indicators with remote sensing ecological indices, assigning weights to these indicators for comprehensive evaluations of EEQ [16]. However, owing to the complexity of EEQ assessments [17], a single remote sensing ecological indicator cannot accurately represent regional ecological environments, and the subjectivity in the weight assignments diminishes the scientific integrity of the assessment outcomes. In 2013, Xu Hanqiu first proposed the application of the Remote Sensing Ecological Index (RSEI) to a regional EEQ evaluation [18]. This index integrates four ecological factors—greenness (NDVI), wetness (WET), dryness (NDBSI), and heat (LST)—and employs a covariance-based principal component analysis (PCA) to determine the weights of these factors in the EEQ evaluation, eliminating the bias of manually established weights and enhancing the scientific objectivity of the results [19,20,21]. Additionally, utilizing the Google Earth Engine (GEE) remote sensing cloud computing platform has expedited and simplified the calculation and analysis of long-term series of the RSEI [22,23]. In conclusion, employing the RSEI to delineate the evolutionary characteristics of the EEQ in suburban areas is a reliable strategy.
The existing research indicates a significant interplay between the ecological environment and TD, characterized by mutual promotion and constraint [24,25,26]. A high EEQ and abundant ecological resources are essential for TD, a fact underscored by the ecotourism sector, which depends heavily on natural resources [9,27]. However, TD’s influence on EEQ is a matter of ongoing debate. While tourism positively contributes to ecological conservation through economic benefits that bolster the protection of biodiversity and environmental education [28,29], unsustainable TD models or intense tourism can also degrade the environment and deplete resources [30,31]. The relationship between TD and EEQ is complex and dynamic. However, few studies have quantified the effects of TD on the ecological environment in the context of long time series. Moreover, as TD becomes the predominant industry in suburbs, inadequate planning, excessive development of infrastructure, and poor management of tourist flows can cause the intensity of tourism to exceed the regional ecological carrying capacity [26,32], intensifying tensions between TD and ecological conservation [33,34]. The intensity of these tensions varies significantly across the grades and types of scenic spots. Hence, to effectively guide the integrated development of a green tourism economy and suburban ecological conservation, delineating the impact of TD on EEQ across scenic spot categories is imperative.
Research on the impact of TD on the ecological environment has examined a range of factors, including landscape patterns [8,35,36], ecological risks [37], landscape ecological risks [38], and ecosystem services [39]. Scholars have analyzed the impact of TD on the ecological environment from a unidimensional perspective using methodologies such as the coupling coordination degree [40], the response index (RI) [8,38], and structural equation modeling [39]. However, as TD diversifies and expands across spatial and temporal scales, different types and grades of scenic spots may experience variations in EEQ [38]. Moreover, the dual nature of TD [28,30] contributes to differences in the direction and magnitude of its impact on the EEQ at various stages [8], resulting in dynamic TD–EEQ interactions. Previous studies have mostly focused on the single-dimensional or short-term effects of TD, lacking an understanding of how TD influences the EEQ in different types and grades of scenic spots over long time-series periods. Consequently, we investigate the variations in the EEQ in relation to the grade and type of TD, the characteristics of the effect of TD on ecological environments across different temporal scales, and the correlation between TD and EEQ. We construct a logical framework of “magnitude of difference–response characteristics–coordination state” to comprehensively assess the mechanisms and evolution of TD’s impact on suburban ecological environments from multidimensional, multilevel perspectives.
Huangpi District is a subdistrict of the megacity of Wuhan, China, known as Wuhan’s “backyard garden”. It boasts a superior geographic location and is rich in natural tourism resources, with particularly prominent ecological functions. The tertiary industry, especially the leisure tourism sector, is a cornerstone of Huangpi District’s economy. Balancing ecological conservation and tourism-driven economic development is a critical challenge that requires further investigation. We examined Huangpi District’s major scenic spots, classified as 5A and 4A. Using the GEE platform, we calculated the RSEI to delineate the EEQ’s spatiotemporal evolution in Huangpi District as a whole and in its scenic spots. We also examined the impact of large-scale TD on the EEQ, addressing the following questions: Given tourism is a key industry, what are the temporal and spatial patterns of the variation in EEQ in Huangpi District? How do the characteristics of EEQ differ among scenic spots of various grades and types? What are the differentiated effects of TD on EEQ?

2. Materials and Methods
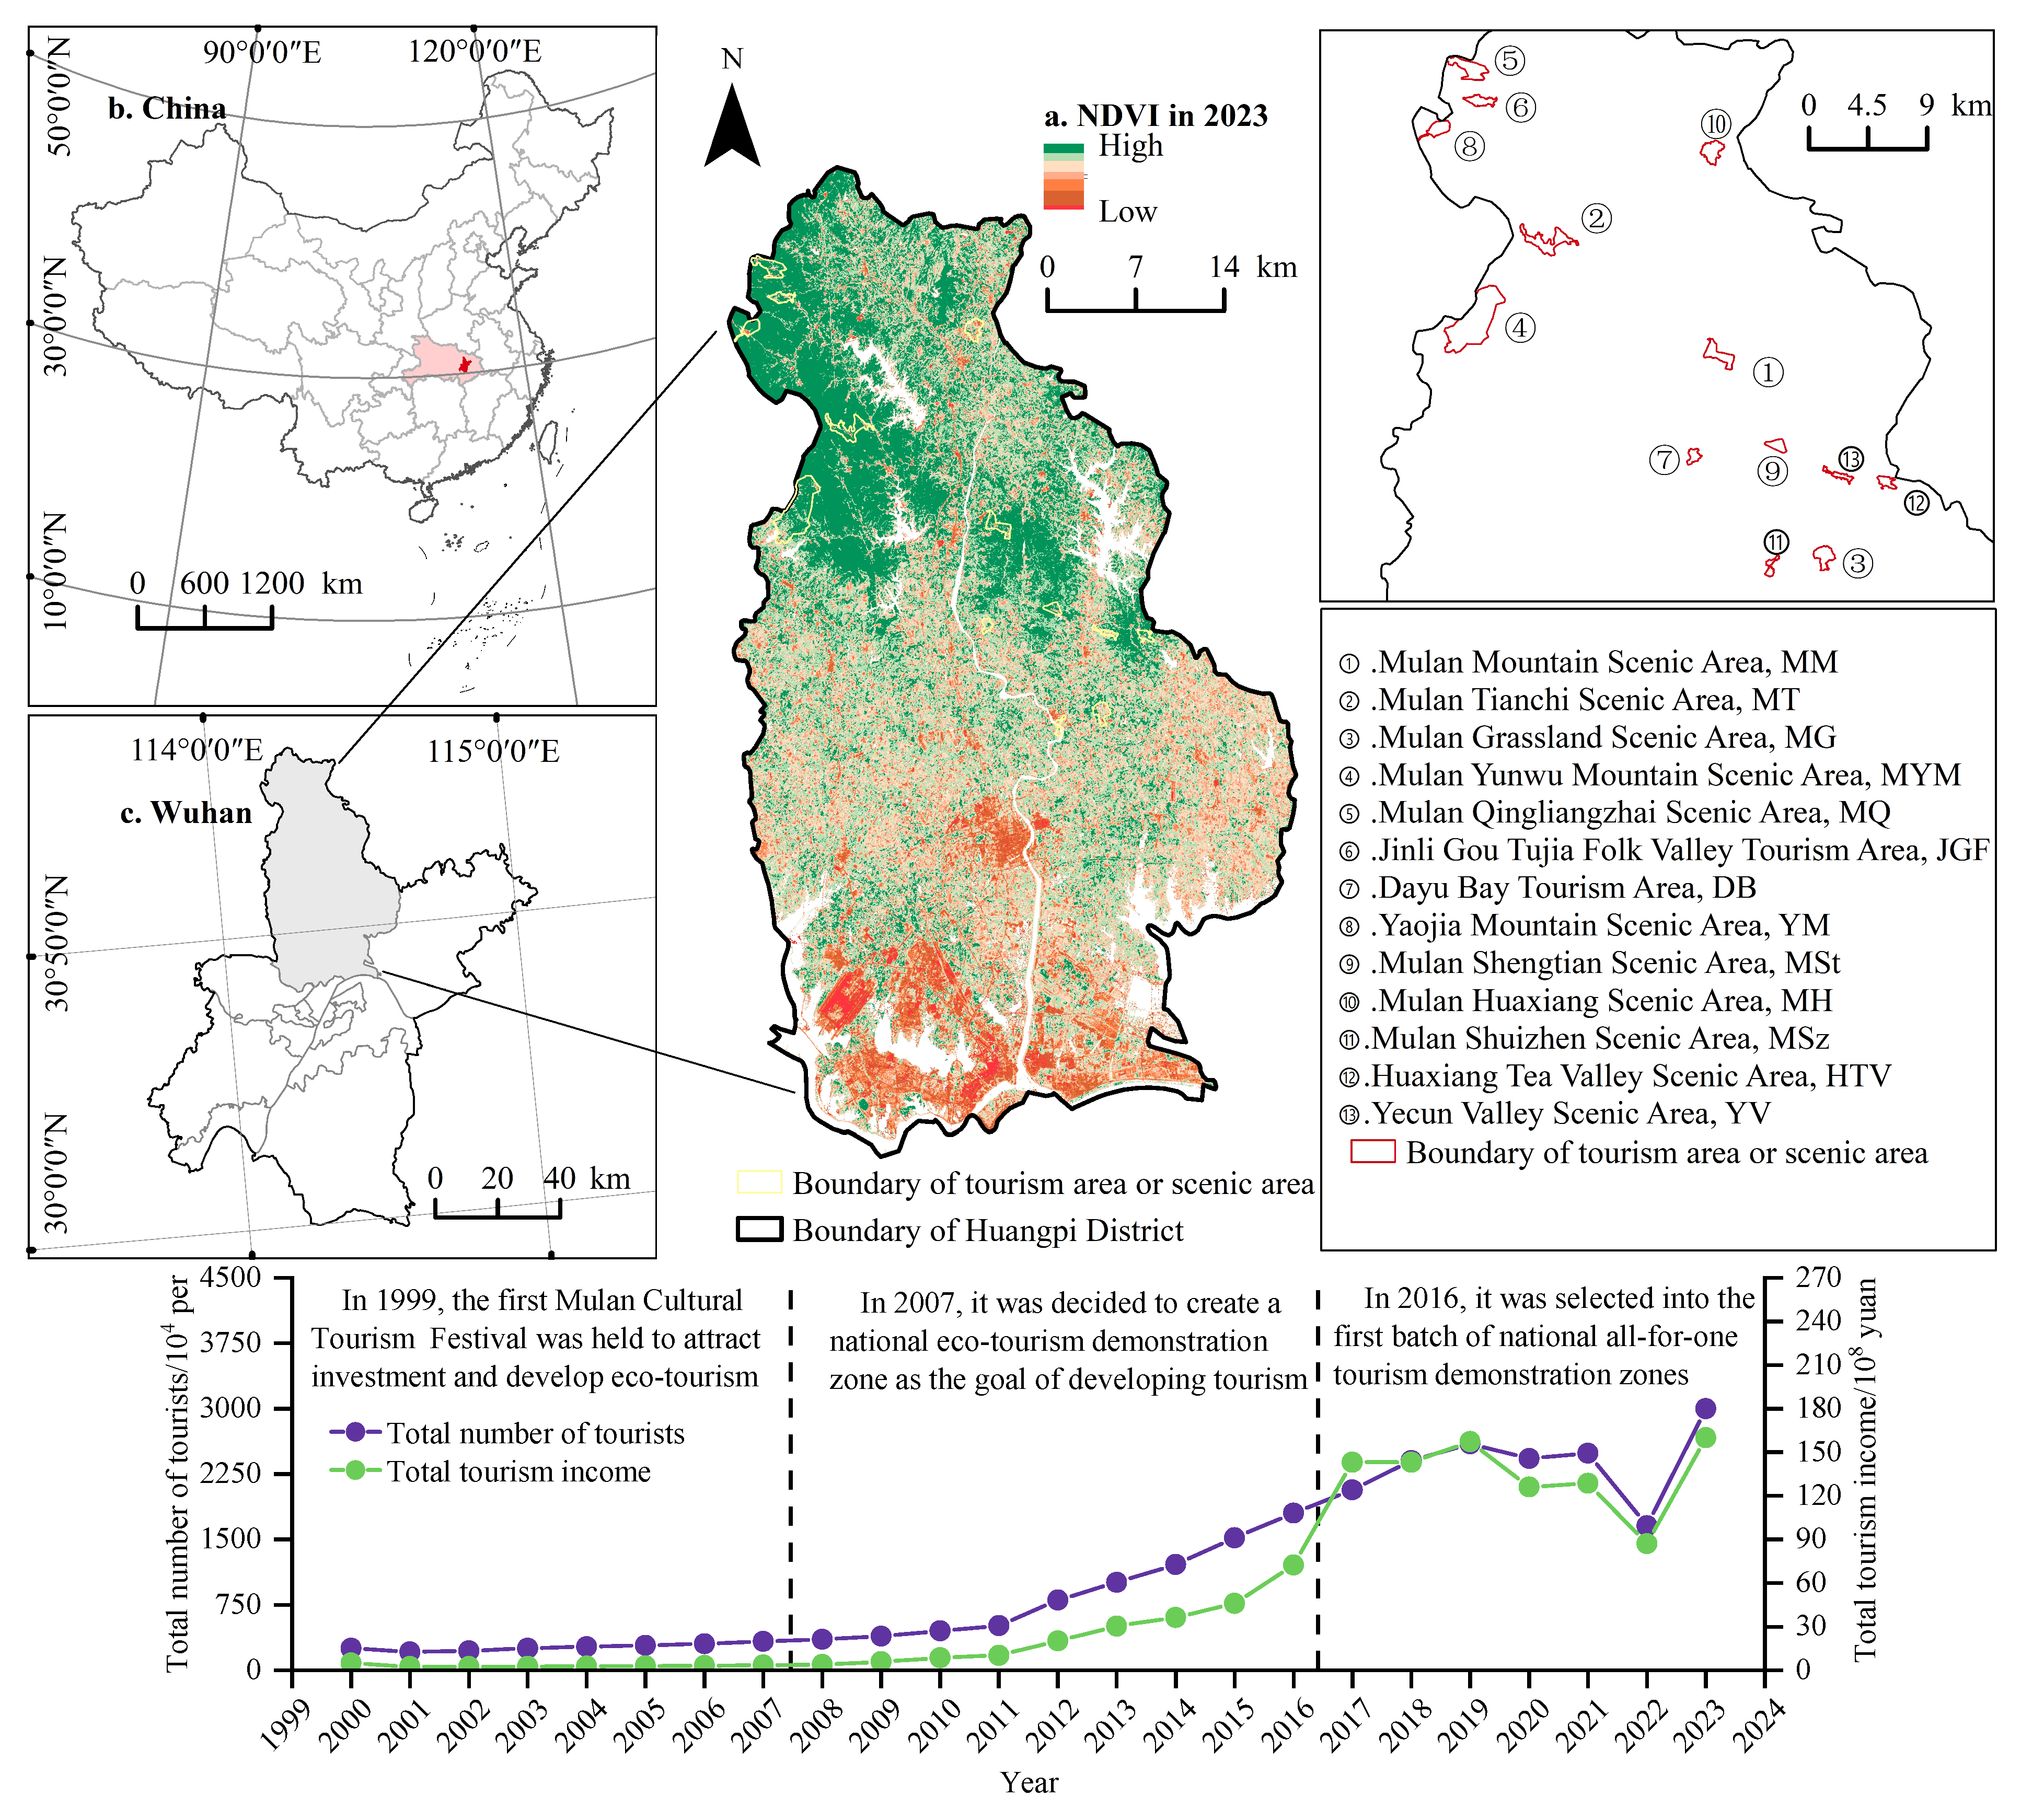
2.1. Study Area

Situated in the northwestern part of Wuhan (30°40′–31°22′ N, 114°09′–114°37′ E), Huangpi District lies within the central Chinese megacity along the Yangtze River Economic Belt and covers an area of 2243.23 km2 (Figure 1). It has a subtropical monsoon climate with an annual precipitation of 1202 mm and an average annual temperature of 17.3 °C. The district features four primary landforms that are conducive to ecotourism development—low mountains, hills, plains, and lakefront zones. Its proximity to a major city confers suburban benefits, and the cultural heritage of the Mulan tradition bolsters its TD. Consequently, tourism has become a key industry in Huangpi District, with 30 million tourist visits and 16 billion CNY in tourism revenue recorded in 2023. As of 2023, the district boasts four 5A and nine 4A scenic spots, including five cultural and eight natural sites, the largest urban ecotourism cluster in central China. Therefore, selecting Huangpi District and its 5A- and 4A-rated tourist attractions as the research subjects, while focusing on the evolutionary characteristics of the effects of TD on its ecological environment, is representative and indicative. Furthermore, we employed tourism life cycle theory, based on the tourist counts, the total tourism revenue from 2000 to 2023, and ecotourism development policies. Drawing on this theory, the evolution of EEQ is analyzed across three phases of Huangpi District’s TD: 2000–2007, 2008–2016, and 2017–2023.

2.2. Data Sources and Preprocessing

The dataset employed in this study encompasses remote sensing imagery, vector boundary data for tourist attractions, and socioeconomic information related to tourism. Initially, the remote sensing imagery was sourced from the GEE platform (https://code.earthengine.google.com/, accessed on 30 August 2024), with surface reflectance products obtained from the Landsat 5 (TM) and Landsat 8 (OLI) satellites. The data were limited to the vegetation growth period (June–September) and had a spatial resolution of 30 m. After being subjected to atmospheric correction, radiometric calibration, and orthorectification, the images were processed for cloud removal using the GFMASK algorithm within GEE. Additionally, an enhanced Modified Normalized Difference Water Index was applied to delineating the water bodies in the cloud-free images. The names of the 5A- and 4A-rated scenic spots in Huangpi District were then sourced from the A-class Tourist Attractions Table (as of 2023) provided by the Hubei Provincial Department of Culture and Tourism (https://wlt.hubei.gov.cn/, accessed on 25 September 2024). Through comprehensive field investigations, the accuracy of the scenic spot boundaries was cross-verified with various online mapping platforms, including Gaode Map, Baidu Map, and Tencent Map. Baidu Map was ultimately selected as the data source, with vector boundary data extracted for each scenic spot using Python’s Selenium framework and Edge WebDriver to access the Baidu Map’s API. The Huangpi District Bureau of Culture and Tourism provided the socioeconomic data, detailing the total tourism revenue and tourist arrivals for district-level and site-specific attractions. The time-series data for the total tourism revenue and tourist arrivals in Huangpi District extend from 2000 to 2023, and for individual scenic spots, they are limited to 2018–2023 due to government data disclosure regulations. We estimated the missing data for individual scenic spots between 2000 and 2017 by determining the proportion of each scenic spot’s total tourism revenue and tourist arrivals relative to the district figures for 2018–2023.

2.3. Methods

2.3.1. Method for Evaluating Ecological Environment Quality

We employed the RSEI to evaluate the EEQ in Huangpi District and its scenic spots given the index’s computational efficiency, reliability for objective evaluations, and visual representation of the results [18,41]. The RSEI encompasses four ecological factors closely associated with human activities: the WET, the NDVI, the NDBSI, and LST. These factors were computed following Qin et al. [42] and Sun et al. [43]. Owing to the variations in the dimensions of these ecological factors, normalization was required. The calculation formula was as follows:
N I i = ( I i I m i n ) / ( I m a x I m i n )
where NIi represents the normalized value of the i-th indicator, ranging between 0 and 1, and Imax and Imin denote the maximum and minimum values of the i-th indicator, respectively. To eliminate the subjectivity associated with indicator weighting, we calculated the weights of the four indicators using a PCA, extracting the first principal component (PC1) to represent the initial RSEI, which was then normalized to obtain the EEQ index. The calculation formulas used in this process were as follows:
R S E I 0 = P C 1 ( W E T , N D V I , N D B S I , L S T ) V W E T , V N D V I > 0 1 P C 1 ( W E T , N D V I , N D B S I , L S T ) V W E T , V N D V I < 0
R S E I = ( R S E I 0 R S E I m i n ) / ( R S E I m a x R S E I m i n )
where RSEI0 represents the initial RSEI, and VWET and VNDVI denote the eigenvectors of the WET and NDVI in PC1, respectively. The RSEI is the normalized EEQ index, with values ranging from 0 to 1, where values closer to 1 indicate a higher EEQ. Finally, the RSEI was classified into five grades using the equal interval classification method: excellent (0.8–1), good (0.6–0.8), moderate (0.4–0.6), fair (0.2–0.4), and poor (0–0.2). As the GEE platform efficiently and accurately processes long-term remote sensing data [44,45], the aforementioned calculations were performed using the GEE platform.
Table 1 presents the computed results. An analysis of the feature vectors for the four indices within the RSEI model indicated that from 2000 to 2023, the WET index and the NDVI in Huangpi District exhibited positive values, contrasting with the negative values for the NDBSI and LST. These findings suggested that the WET and the NDVI exert a positive influence on the RSEI, whereas the NDBSI and LST have a negative impact. The contributions of the four indices to the RSEI were ranked as NDVI > NDBSI > LST > WET, reflecting the conditions observed within the Huangpi District. Regarding PC1, the average contribution rate across the four indices in the RSEI model from 2000 to 2023 was 73.58%, exceeding the 70% threshold [46], thus demonstrating the validity of using PC1 to characterize the RSEI.

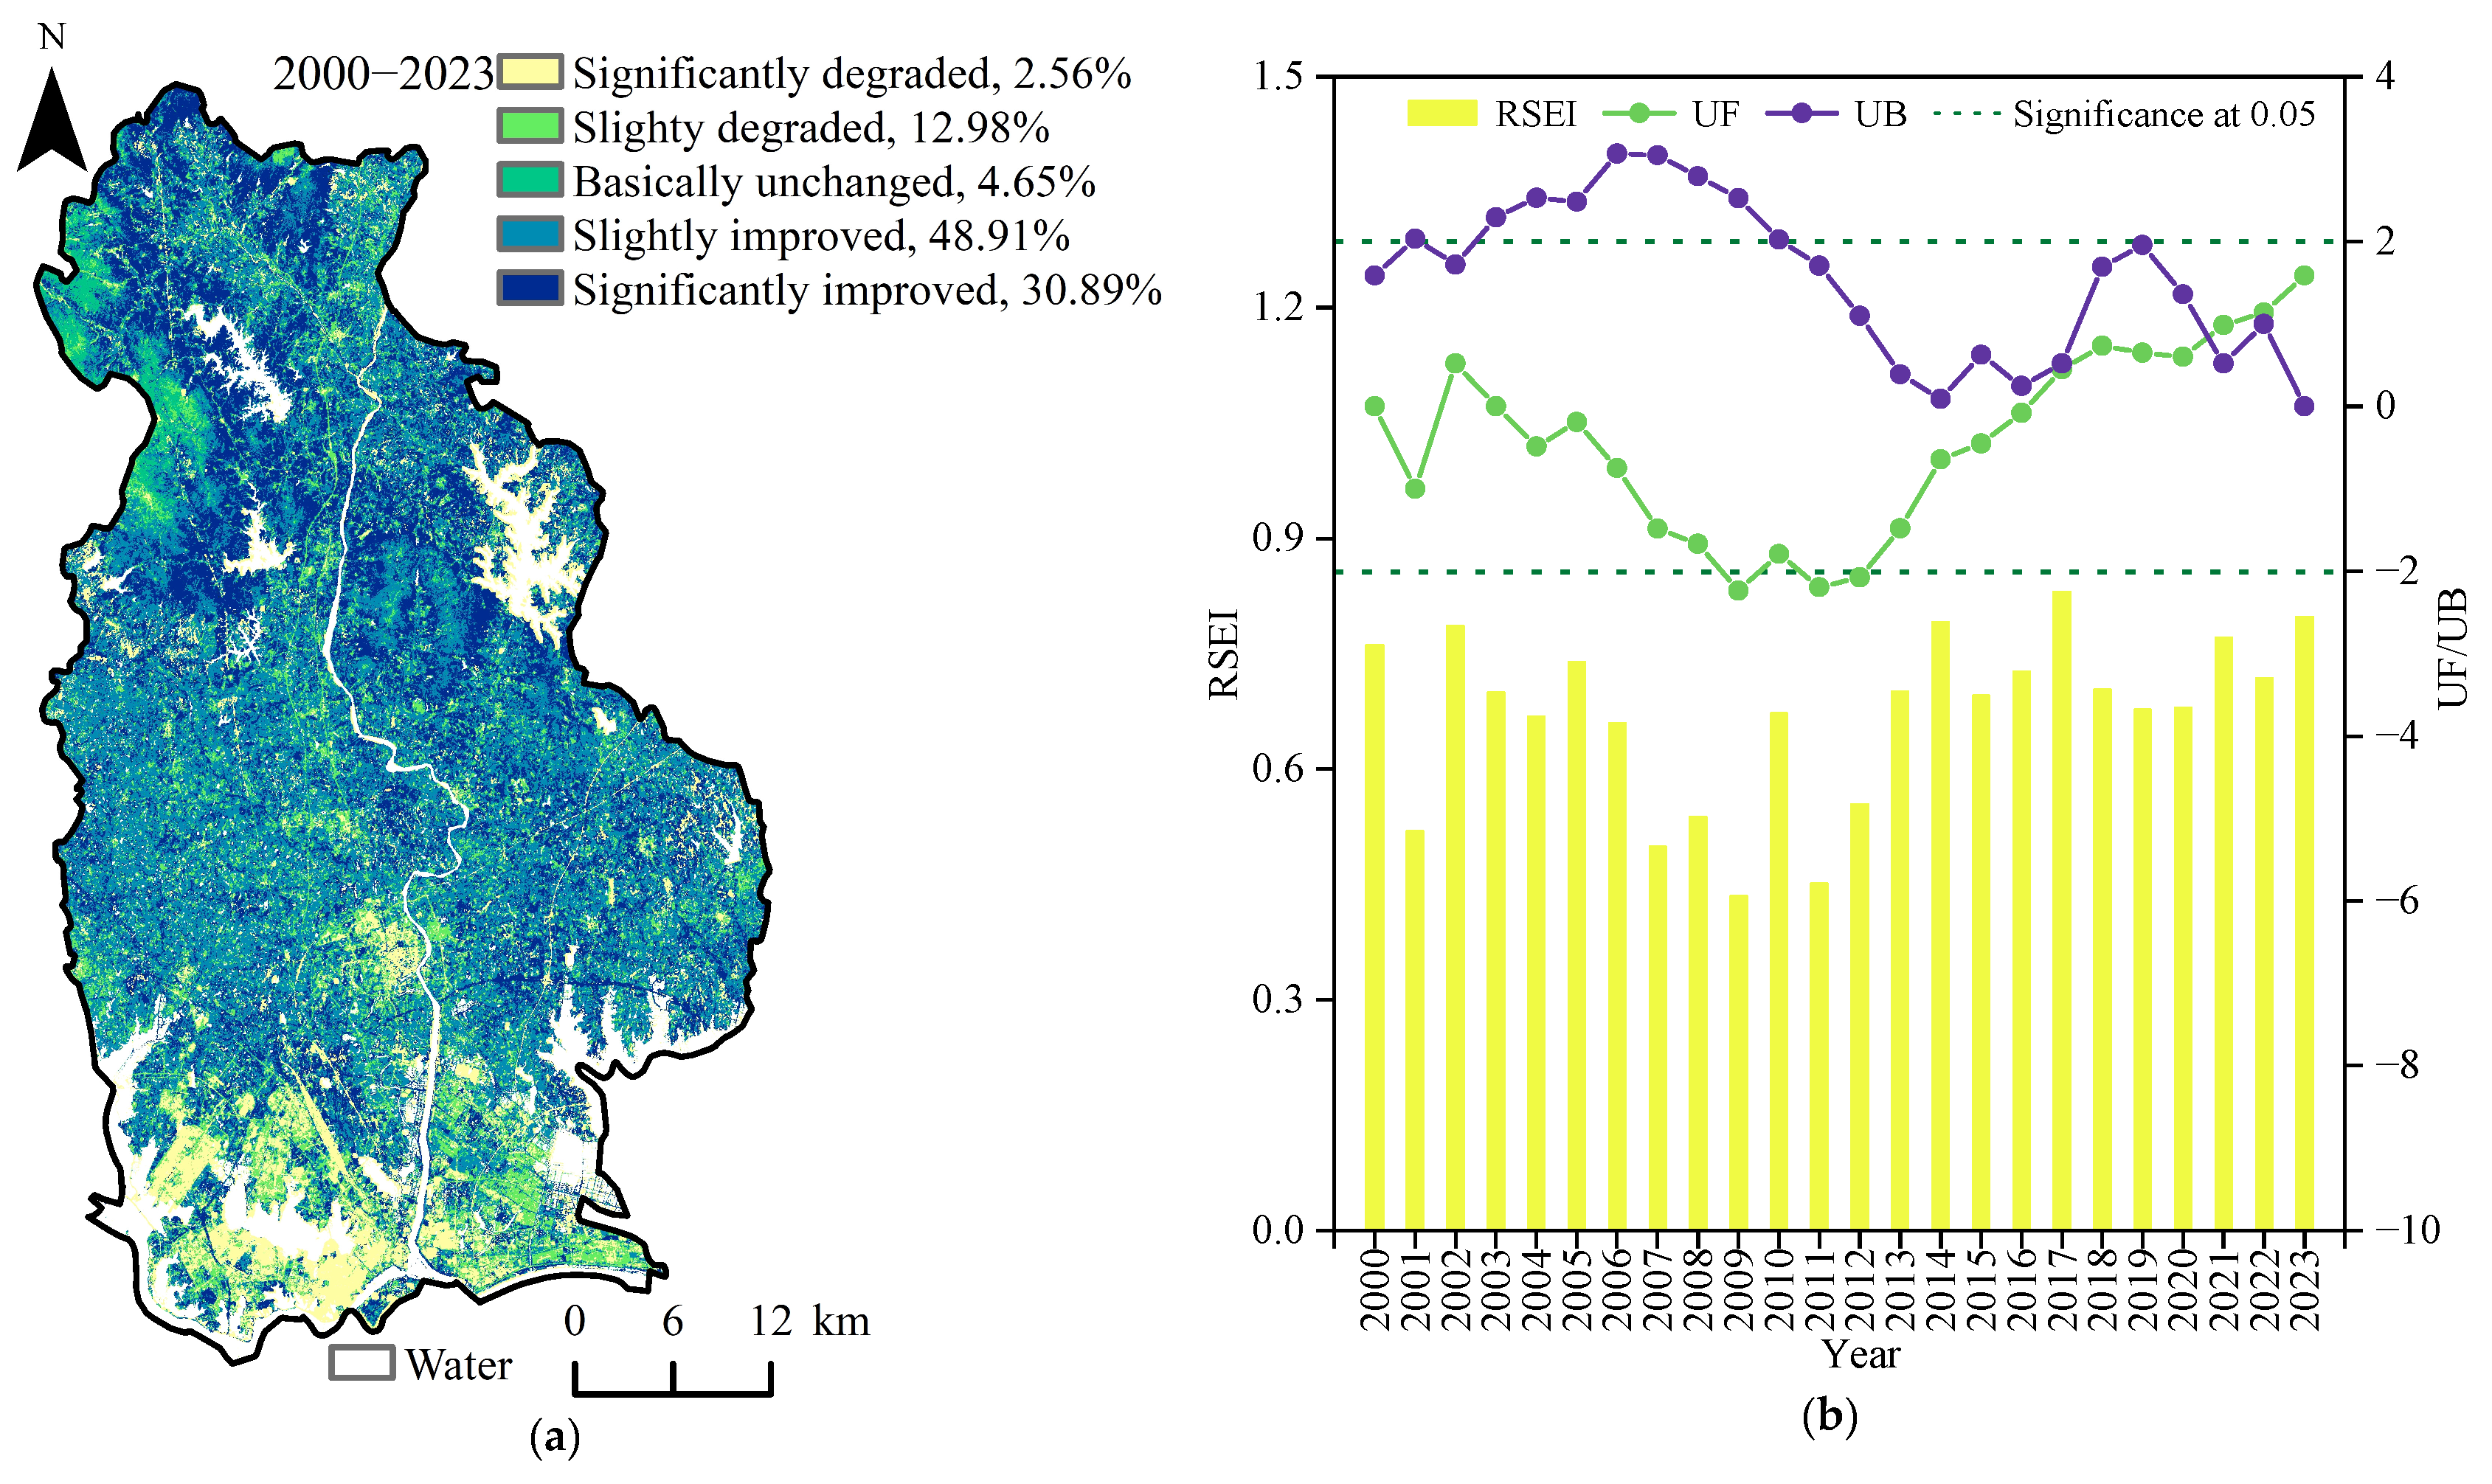
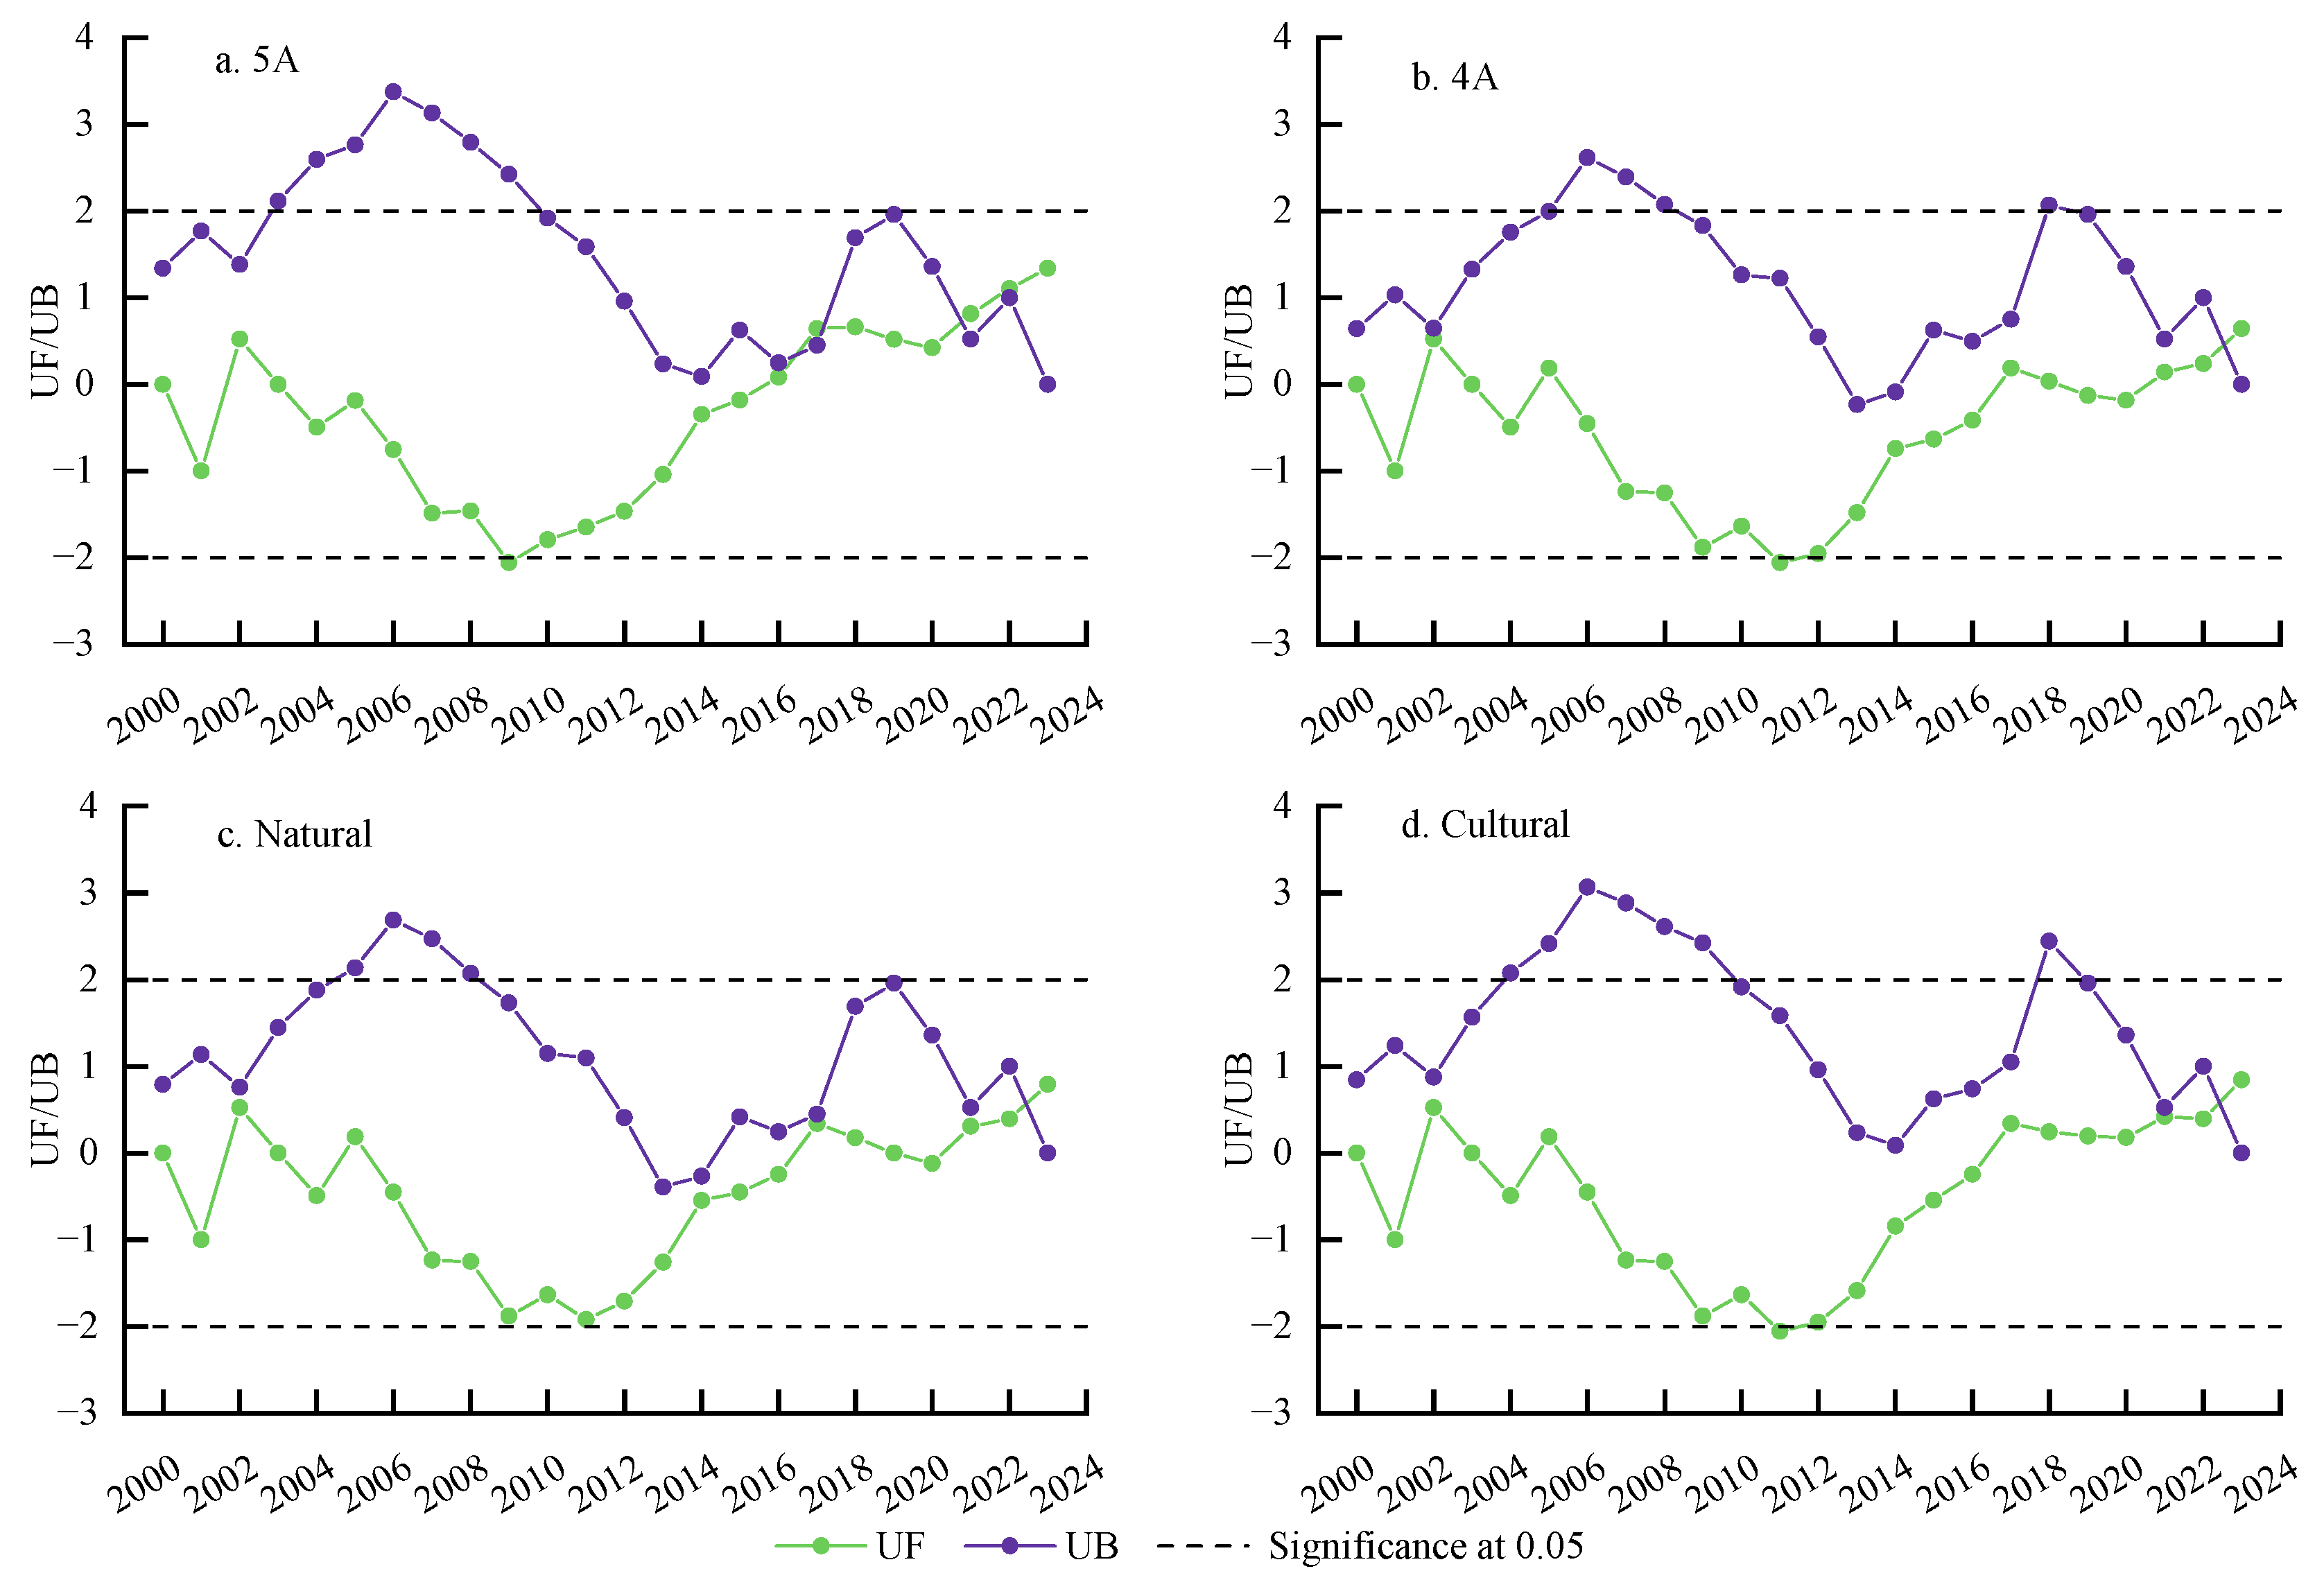
2.3.2. Analysis of the Trends in Ecological Environment Quality

We employed the Theil–Sen median slope [42], mitigating the influence of outliers, to assess the trend in the variation in the RSEIs in Huangpi District and its scenic spots. The formula for this measure was as follows:
β s l o p e = M e d i a n R S E I i R S E I j / i j
where RSEIi and RSEIj denote the RSEI values of the i-th and j-th years, respectively. βslope denotes the trend in the RSEI from year i to year j. When βslope > 0.0005, the RSEI is improving; when βslope < −0.0005, the RSEI is deteriorating; and when −0.0005 < βslope < 0.0005, the RSEI is stable.
To determine the significance of the RSEI variation trends in Huangpi District and its scenic spots, we employed the Theil–Sen slope and the Mann–Kendall mutation test. The combined significance level analysis was expressed using the following formula [45]:
s i g n ( R S E I i R S E I j ) = + 1 , R S E I i > R S E I j 0 , R S E I i = R S E I j 1 , R S E I i < R S E I j
S = j = 1 n 1 i = j + 1 n s i g n ( R S E I i R S E I j )
V a r ( S ) = n ( n 1 ) ( 2 n 5 ) / 18
Z = ( S 1 ) / V a r ( S ) , S > 0 0 , S = 0 ( S + 1 ) / V a r ( S ) , S < 0 ,
where S represents the sum of the sign function; Var denotes the variance; RSEIi and RSEIj are the RSEI values for the i-th and j-th years, respectively; n is the time-series length; and Z is the significance level. When the absolute value of Z is greater than 1.96, the RSEI variation trend has passed the significance test at a 95% confidence level.
Mann–Kendall mutation testing was also used to detect the mutation status of the RSEI in Huangpi District and its scenic spots. For the RSEI time series using n simple variables, the Mann–Kendall mutation testing can be expressed as follows [42,45]:
S k = i = 1 k r i , r i = 1 , R S E I i > R S E I j 0 , R S E I i R S E I j , ( j = 1 , 2 , , i ; k = 1 , 2 , , n )
U F K = S k E ( S k ) / V a r ( S k )
where Sk represents the total number of instances where the RSEI in the i-th year is greater than that in the j-th year, and E(Sk) and Var(Sk) denote the mean and variance of Sk, respectively. The sequence trend was significant for a given significance level α if |UFk| > Uα. The time series was then ranked in reverse order, and Formulas (9) and (10) were recalculated while setting UBk = −UFk. If the UF curve intersected with the UB curve within the significance level α, the RSEI had a sudden growth trend in the years where the curves intersected.

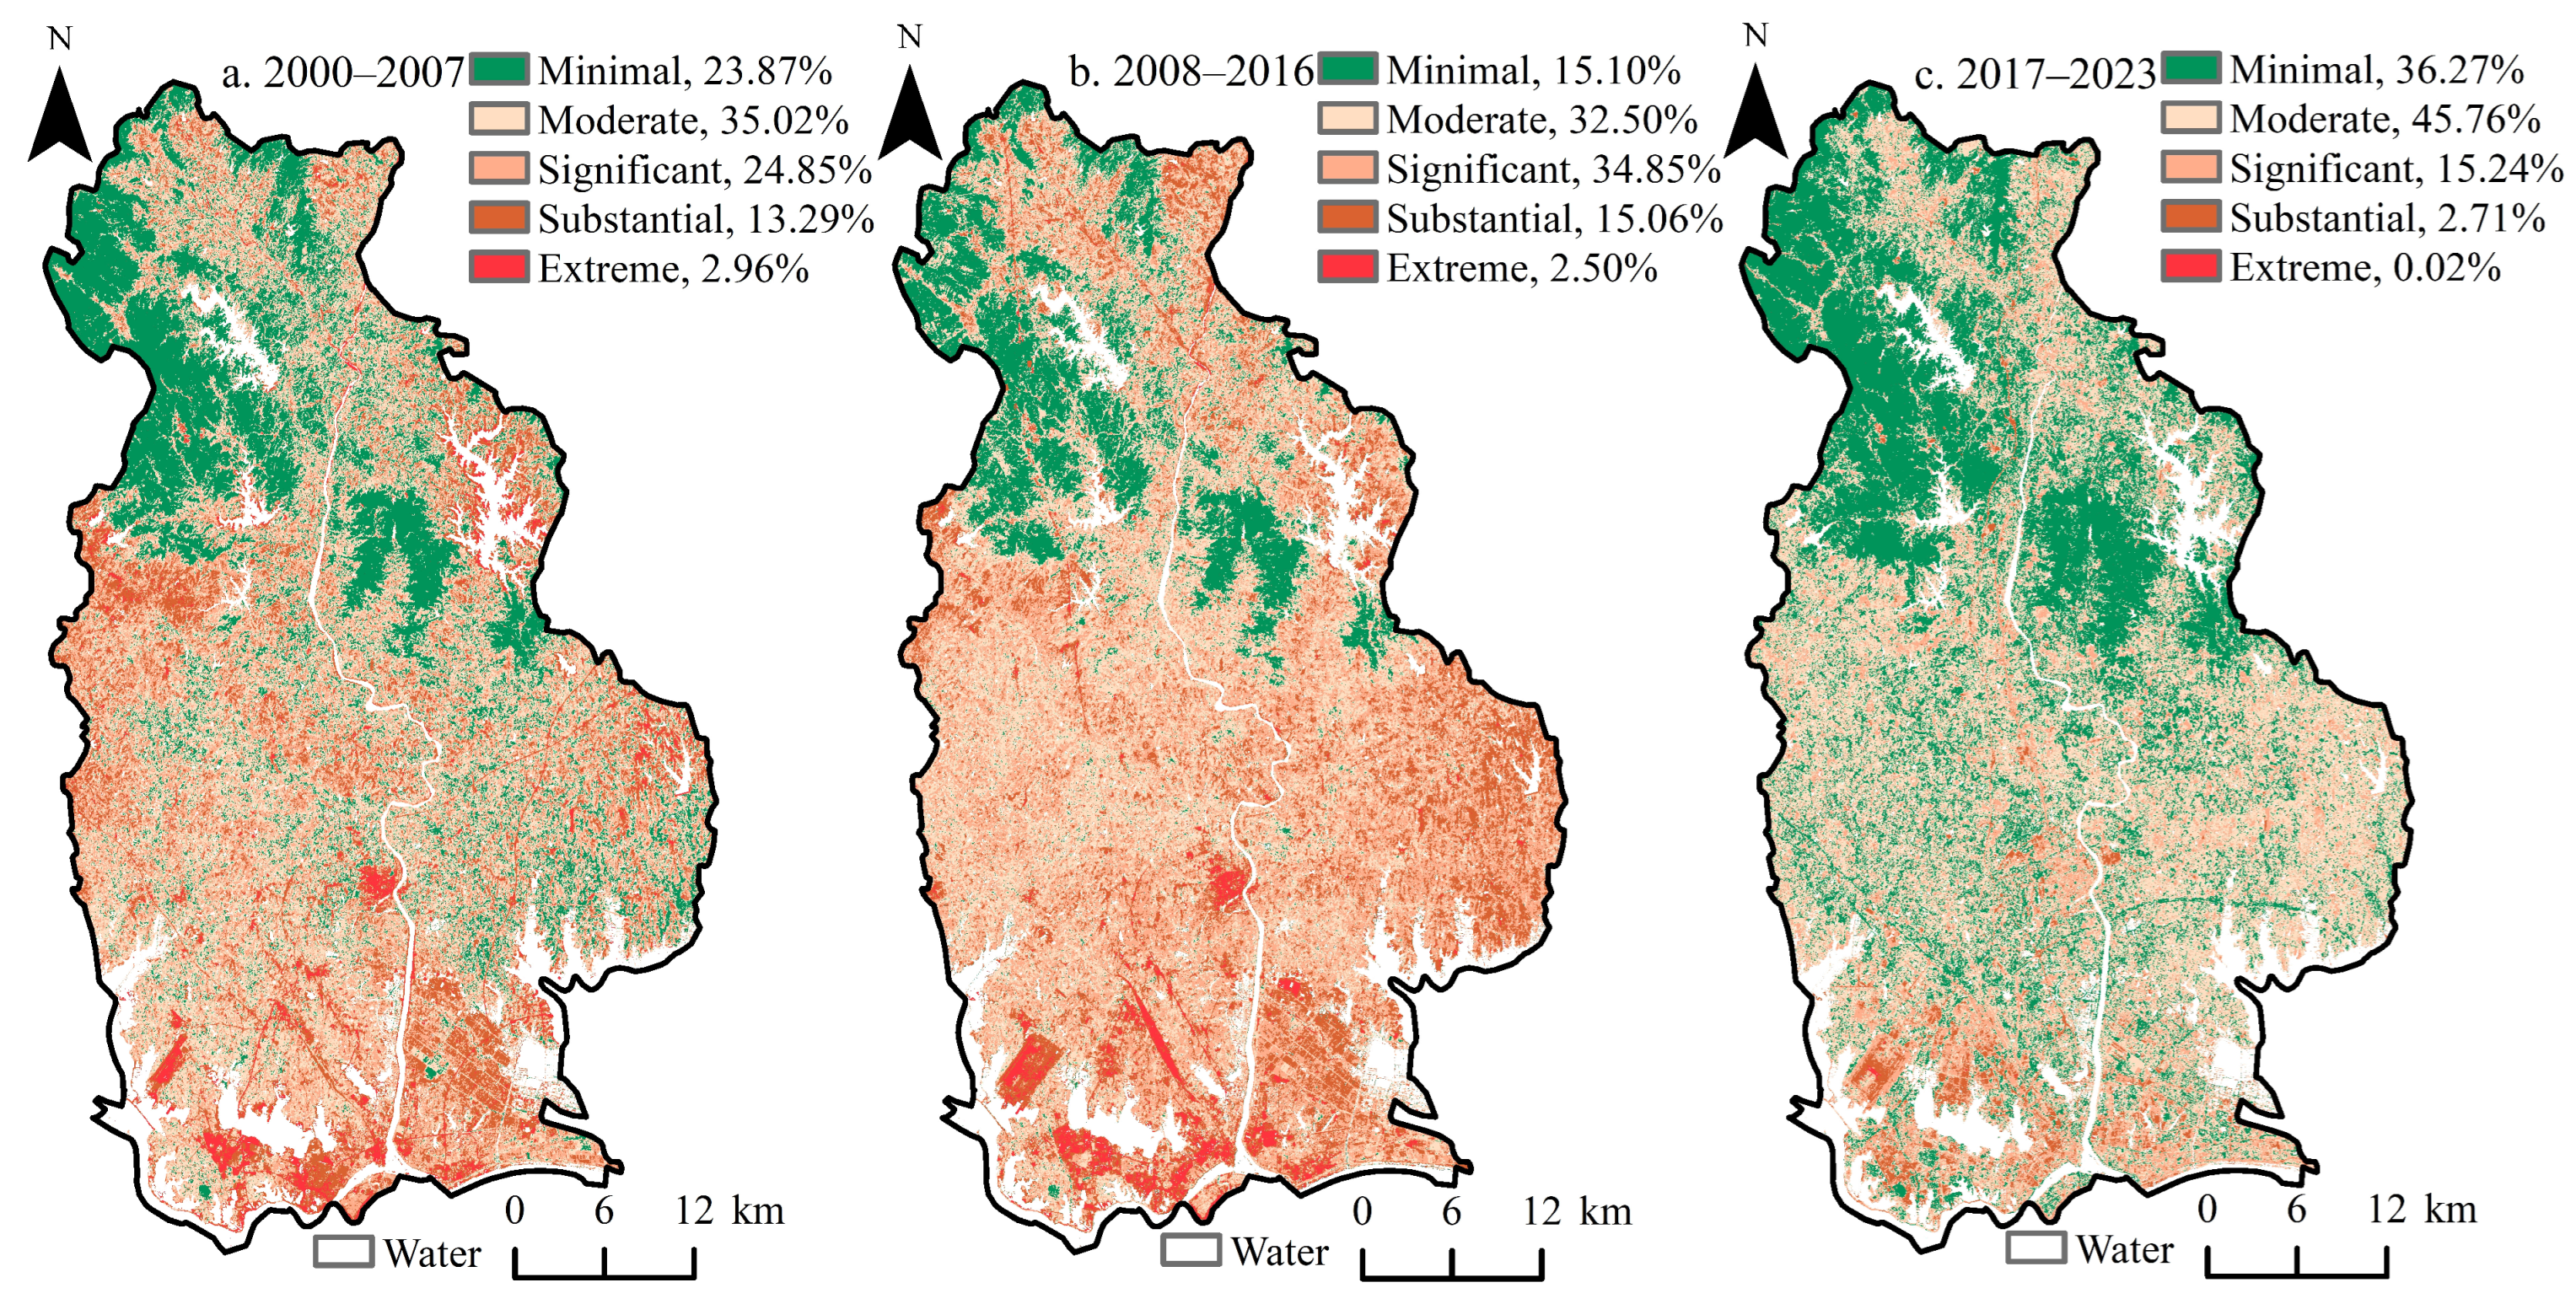
2.3.3. Method for Analyzing the Degree of Change in Ecological Environment Quality

We used the coefficient of variation (CV) to reflect the RSEI’s degree of variation in Huangpi District and its scenic spots. The calculation formula used was as follows [42]:
C V = R S E I s d / R S E I m e a n
where RSEIsd and RSEImean represent the SD and mean of the RSEI in Huangpi District and its scenic spots, respectively. CV denotes the CV for Huangpi District and its scenic spots. The larger the CV value, the greater the variation in the RSEI, whereas the smaller the CV value, the weaker the variation in the RSEI. We used the natural breaks classification method to categorize the CV into five grades: minimal, moderate, significant, substantial, and extreme.

2.3.4. Method for Analyzing the Impact of TD on EEQ

(1) Independent sample t-test
We assessed the impact of TD on EEQ by investigating the significance of the differences in the RSEI values across three scenarios: ① comparing the RSEI values in scenic spots versus those outside; ② comparing the RSEI values of 5A spots with those of 4A spots to gauge the differential effects of TD on EEQ across different ratings; and ③ examining the RSEI values of natural versus cultural scenic spots to understand TD’s impacts on the EEQ by type. By employing an independent sample t-test, we quantified whether there was a statistically significant difference between the mean RSEI values across these scenarios.
(2) The response index
We quantitatively measured the magnitude of the impact of TD on EEQ, using the RI to assess the size and direction of this effect on Huangpi District’s EEQ [31,38,47]. Tourism revenue and the number of tourists can directly reflect the level of TD [48], and usually, there is a direct correlation between tourism revenue and the number of tourists. Therefore, we assigned a weight of 0.5 to tourism revenue and the number of tourists to represent TD and calculated the RI using the following formula:
R I = F s 2 F s 1 / F w 2 F w 1
where Fs2 and Fs1 represent Huangpi District’s RSEI values at the end and beginning of the study period, respectively, and Fs2 and Fs1 represent Huangpi District’s TD values at the end and beginning of the study period, respectively. The larger the absolute value of RI, the greater the impact of TD on the EEQ. When RI > 0, TD positively affects EEQ, whereas RI < 0 indicates a negative effect.
(3) The four-quadrant model
We assessed the correlation between TD and EEQ in the scenic spots of Huangpi District using the four-quadrant model [49]. The implementation of the quadrant model involved the following steps: first, the average values of the EEQ and TD for the scenic spots were calculated. Values below the average were categorized as low-EEQ and low-TD, whereas values above the average were designated as high-EEQ and high-TD. By plotting the EEQ onto the x-axis and TD onto the y-axis, the four quadrants were delineated by the average values of EEQ and TD at their intersection points: high-EEQ and high-TD occupied the first quadrant, high-TD and low-EEQ the second quadrant, low-TD and low-EEQ the third quadrant, and low-TD and high-EEQ the fourth quadrant.

3. Results

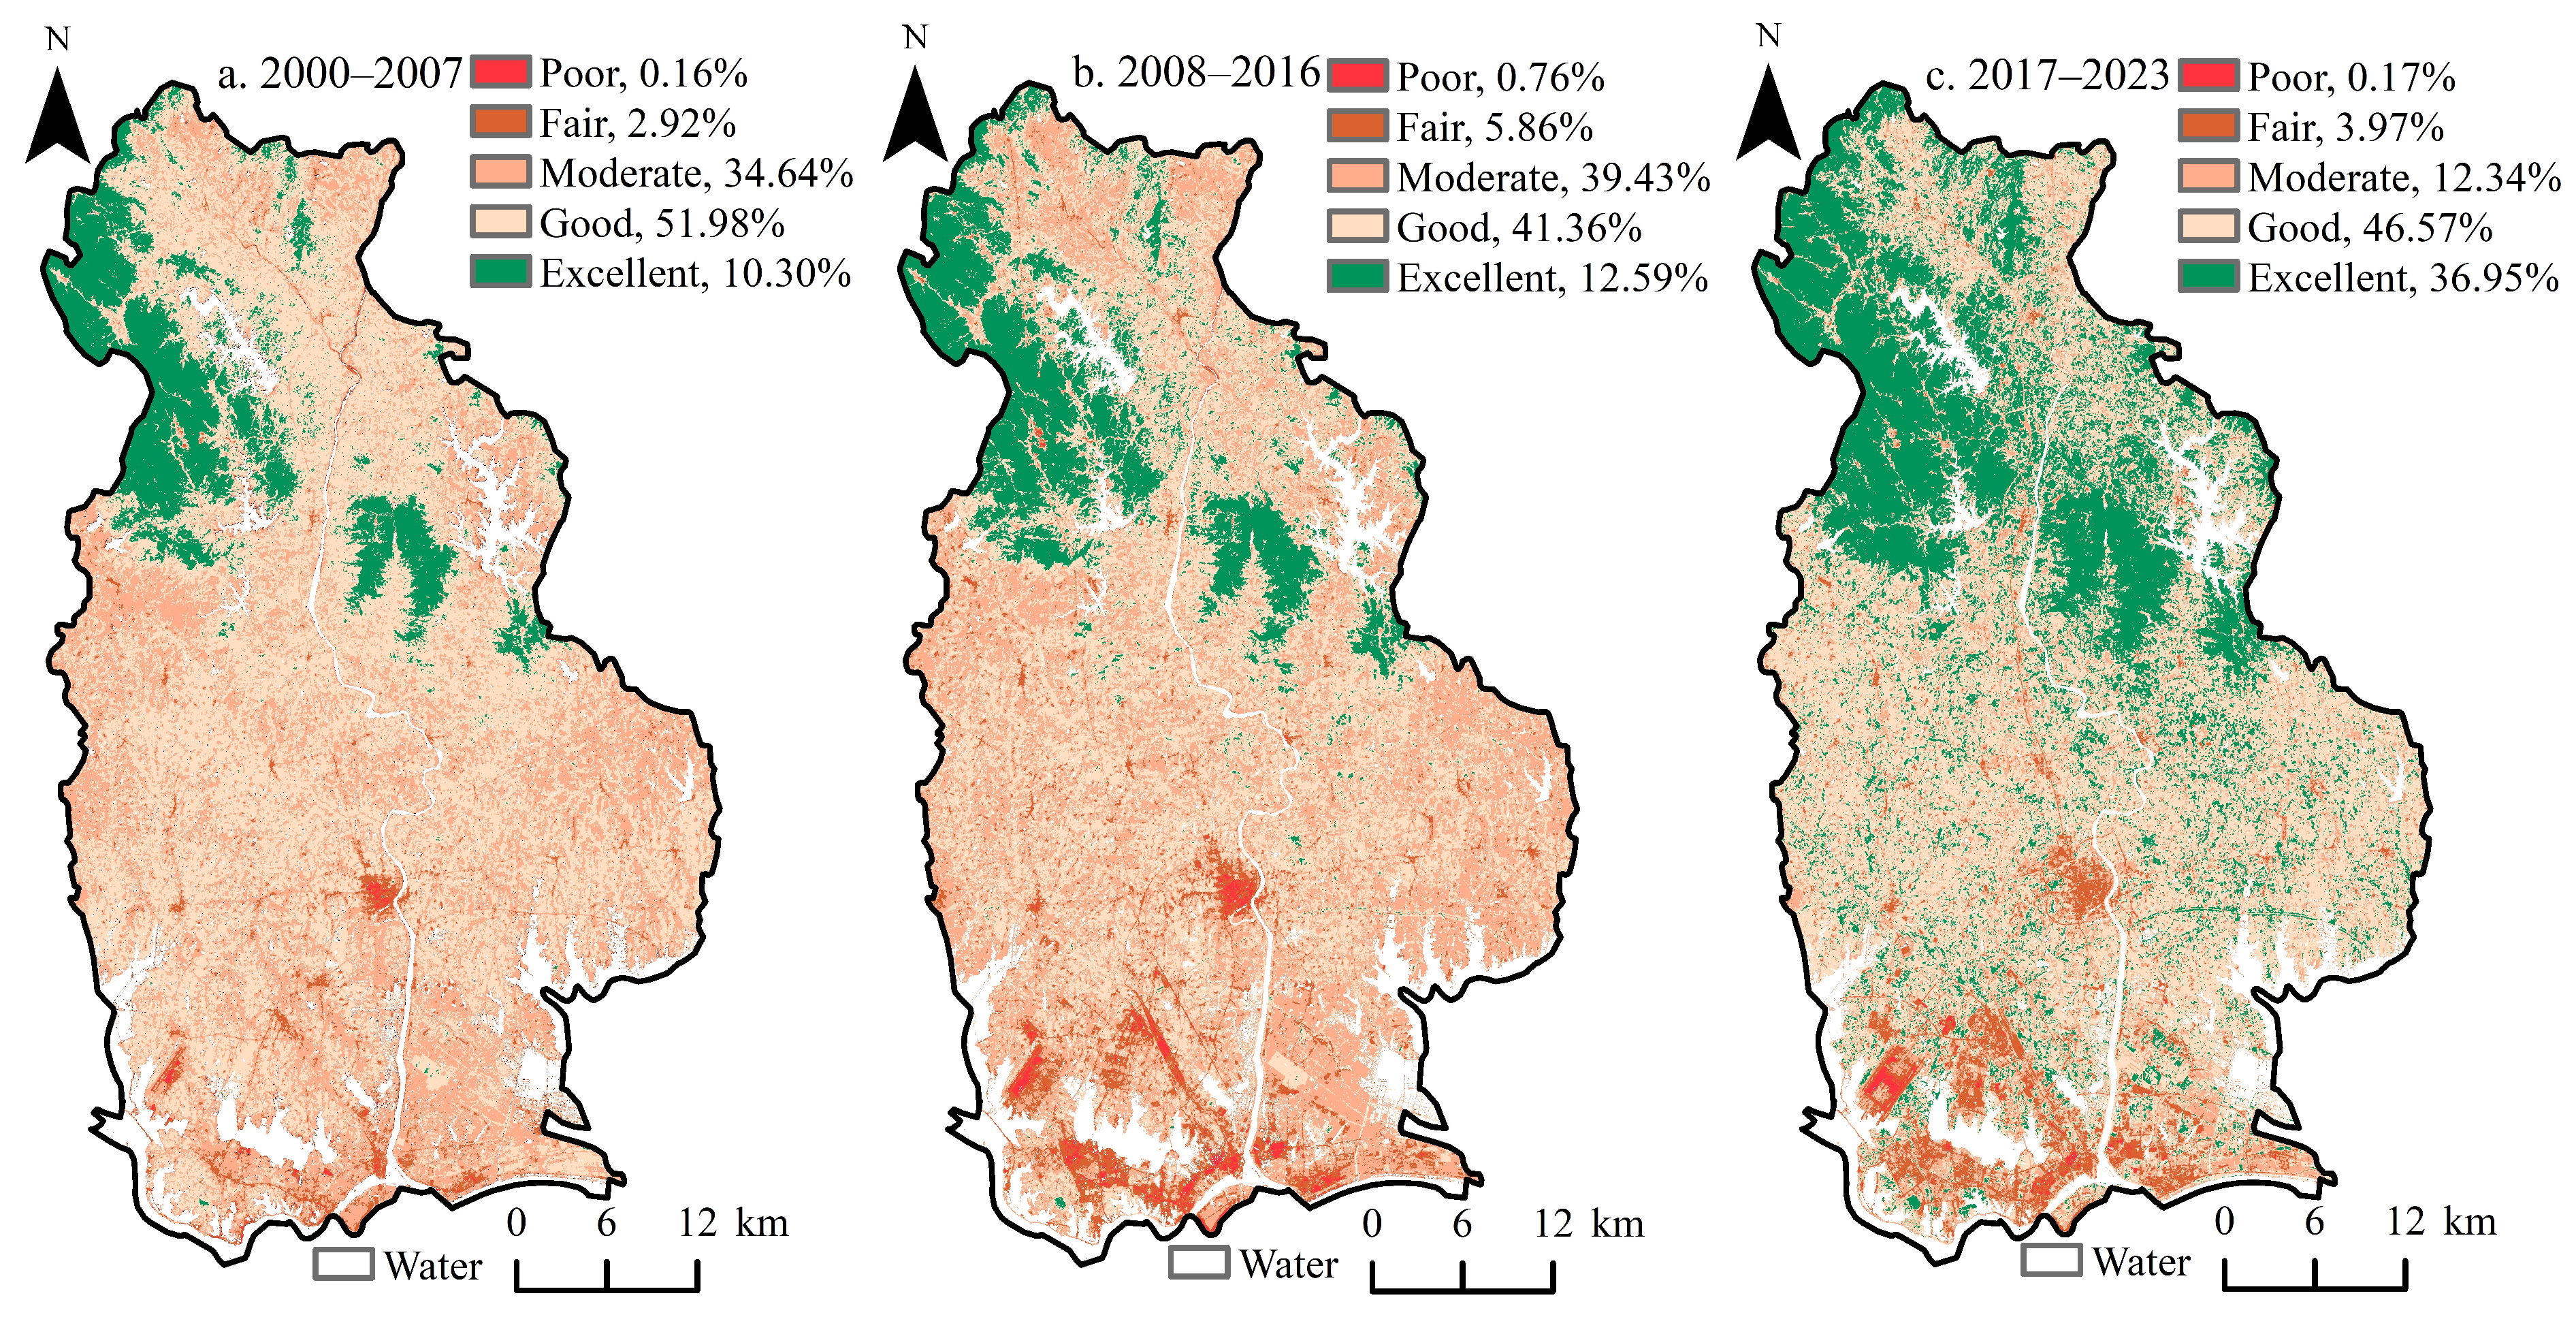
3.1. Spatiotemporal Distribution of EEQ

The spatial distribution of the average RSEI values in Huangpi District from 2000 to 2023 (Figure 2) revealed a pattern of “a lower EEQ in the south and a higher EEQ in the north”. During 2000–2007, 2008–2016, and 2017–2023, the average RSEI values for Huangpi District were 0.6665, 0.6181, and 0.7395, respectively, demonstrating an initially decreasing EEQ followed by an improvement. The proportion of areas with poor, fair, and moderate RSEI average grades increased from 0.16% to 0.76% and then decreased to 0.17%, while areas with excellent and good grades evolved as follows: excellent grades shifted from 51.98% to 41.36% to 46.57%, while good grades shifted from 0.16% to 2.92% to 5.86% to 3.97%. The high proportion of areas with good RSEI grades (up to 46.57%) indicates a favorable overall EEQ in Huangpi District. The proportion of areas with an excellent average RSEI value continuously increased from 10.30% in 2000–2007 to 36.95% in 2017–2023.
Figure 3 presents the spatiotemporal characteristics of the CVs in the RSEIs in Huangpi District from 2000 to 2023. The proportions of areas with minimal, moderate, substantial, and extreme grades for the CVs in the RSEIs were the inverse of the areas with average poor, fair, good, and excellent RSEI value grades. The changes in the area proportions for these four value grades were as follows: 23.87%—15.10%—36.27%; 35.02%—32.50%—45.76%; 13.29%—15.06%—2.71%; and 2.96%—2.50%—0.02%, respectively. The change in the proportion of the area for the significant RSEI CV grade followed the same trend as that for the moderate average RSEI value grade, increasing from 24.85% to 34.85% and then decreasing to 15.24%. Additionally, areas with higher average RSEI values demonstrated smaller CVs, whereas regions with lower average RSEI values exhibited larger CVs. This suggests that the EEQ in regions with higher average RSEIs tends to be more stable, whereas those with lower average RSEIs exhibit greater variability in EEQ.
Figure 4 illustrates the variation trends and mutation testing results for the RSEI in Huangpi District from 2000 to 2023. Figure 4a reveals that the area proportion of regions whose EEQ improved is 73.27%, with 29.77% of the area demonstrating significant improvements, predominantly in the northern region of Huangpi District and its surrounding scenic spots. In contrast, the area proportion of regions whose EEQ declined accounted for 22.54%, including 11.90% of areas showing substantial declines, which was mainly observed in the southern–central urban area of Huangpi District. In Figure 4b, the UF curve remained below zero from 2005 to 2009, indicating a steady deterioration in the EEQ. From 2011 to 2018, the UF curve continuously rose despite remaining below zero, suggesting a slight improvement in the EEQ. After 2017, the UF curve rose above zero, indicating a significant improvement in the EEQ. The UF and UB curves collectively indicate that 2020 was a mutation year for the EEQ in Huangpi District. In early 2020, the outbreak of COVID-19 led to a significant reduction in social activities, with factories halting production and the traffic flow decreasing, which directly reduced air and water pollution. This reversed the declining trend in the EEQ during the development stage from 2017 to 2023.

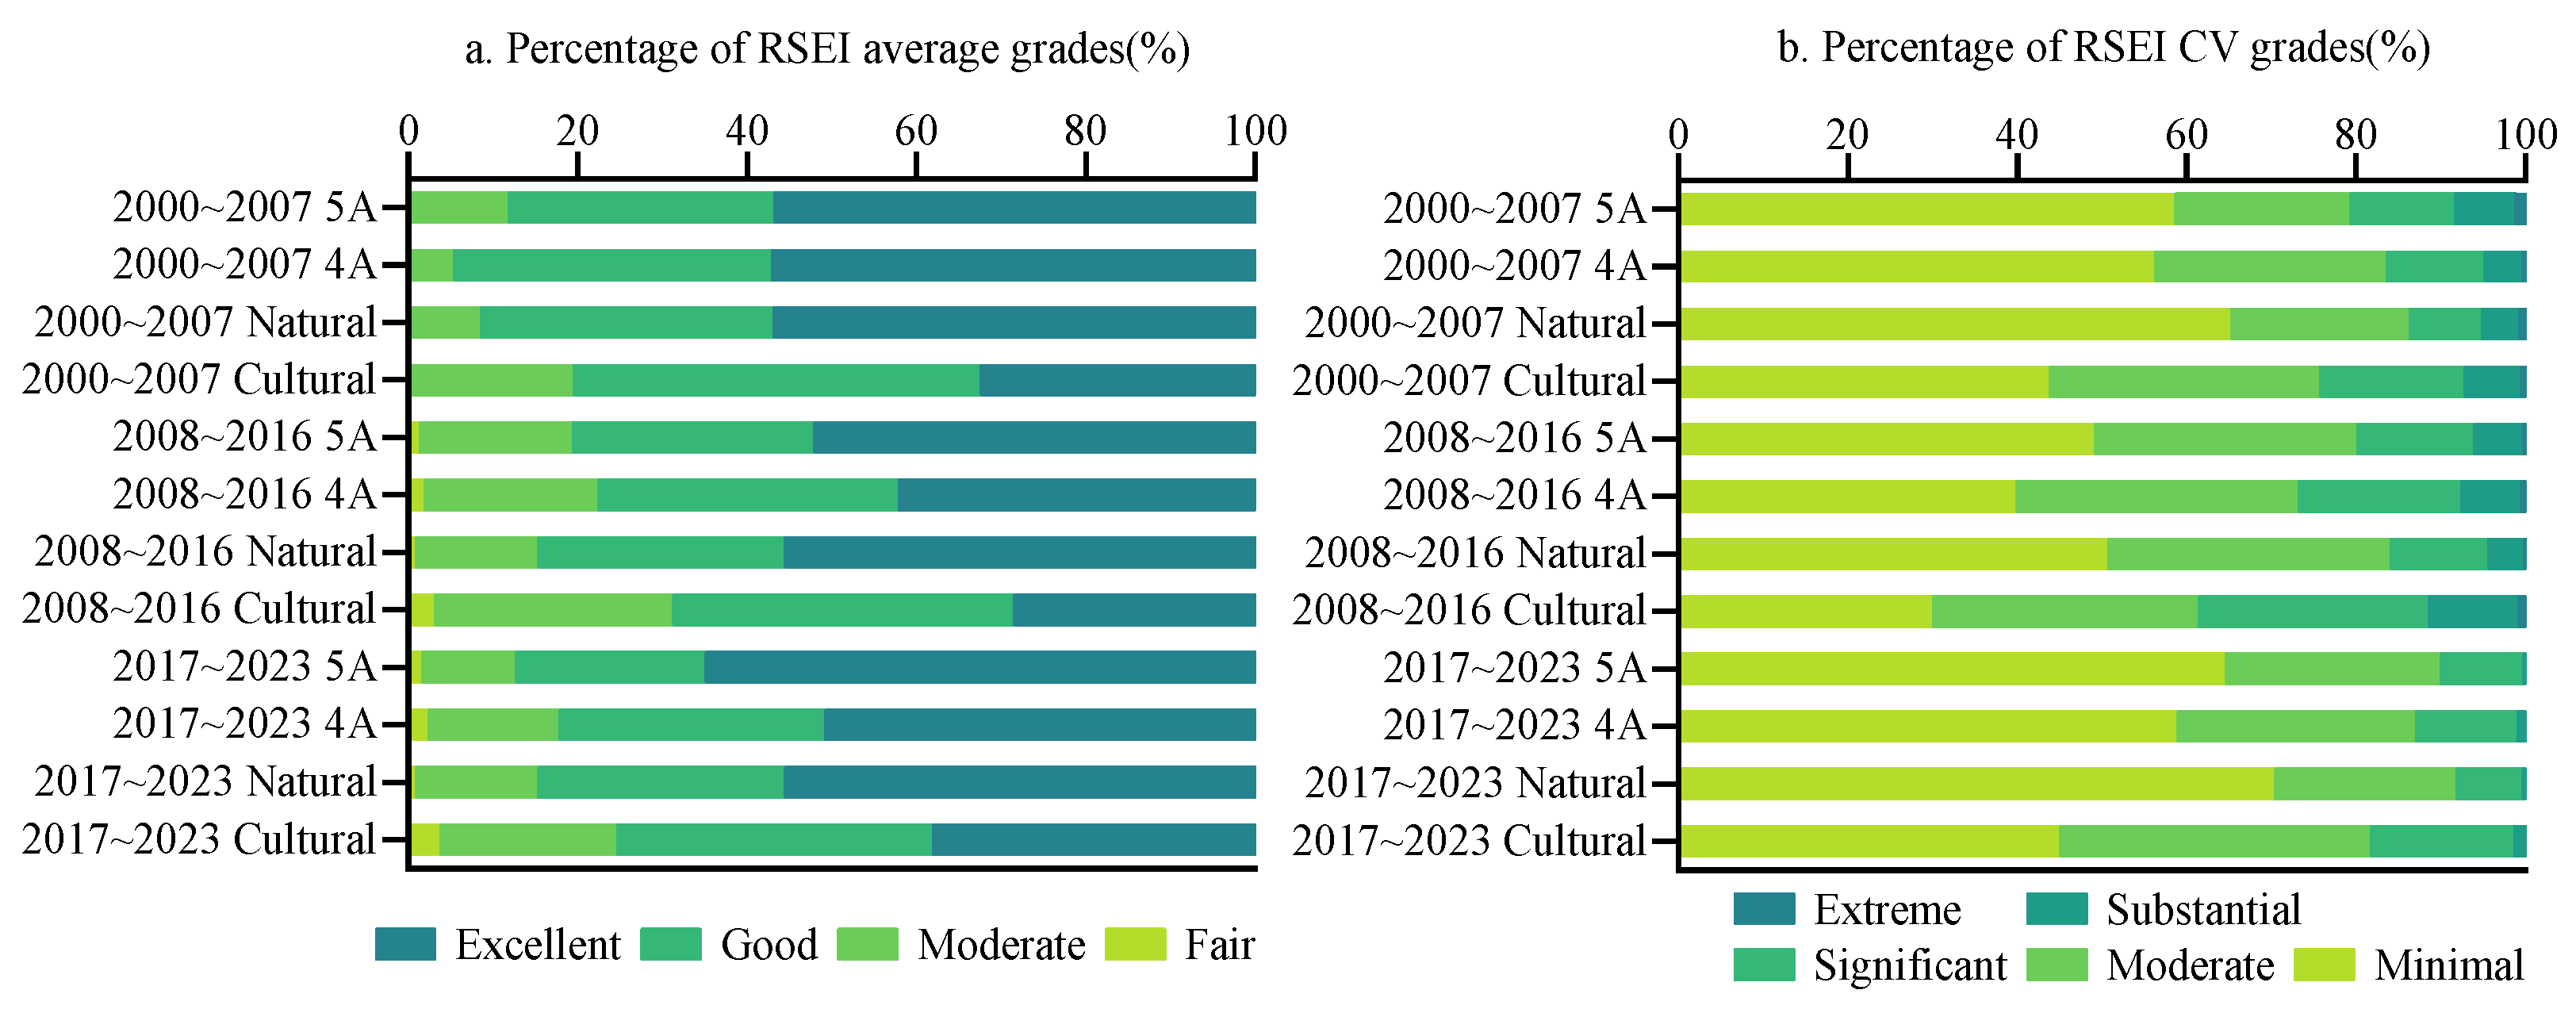
3.2. Evolution of the EEQ in Scenic Spots of Different Grades and Types

Figure 5a illustrates that from 2000 to 2023, the average RSEI values for various grades and types of scenic spots in Huangpi District consistently ranked above the poor grade, with the combined share of excellent and good ratings exceeding 70%. This suggests that a robust ecological foundation is a prerequisite for developing scenic spots. The average RSEI values from 2000 to 2023 exhibit the pattern of an initial decline followed by a subsequent improvement across Huangpi District’s various grades and types of scenic spots, implying a phased impact of TD on the EEQ. The distribution of each RSEI grade from 2000 to 2023 reveals that the excellent grade is most prevalent in the 5A and 4A rankings and in natural scenic spots, followed by the good grade. In contrast, cultural scenic spots receive better grades, followed by excellent grades. Regarding the changes within each RSEI grade, the proportion of excellent grades decreased and then increased between 2000 and 2023, whereas the proportion of good grades steadily declined. The proportion of moderate grades increased followed by a decrease, whereas the proportion of poor grades continuously increased.
Figure 5b shows that from 2000 to 2023, the combined proportion of CVs in the RSEIs in the minimal and moderate grades for different scenic spots in Huangpi District exceeded 60%, indicating a stable EEQ compared with that of the overall district. In terms of the distribution of the RSEI CV grades, the minimal grade accounted for the highest proportion from 2000 to 2023, followed by the moderate grade. By analyzing the changes in these proportions, CVs in the RSEI in the extreme grade first decreased and then increased, whereas the significant grade peaked, followed by a decline. Substantial grades for the 5A- and 4A-rated and natural scenic spots first increased and then decreased, whereas the cultural scenic spots showed a decreasing trend followed by an increase. The proportions of substantial and extreme grades for 5A-rated and natural scenic spots consistently decreased. In contrast, those for 4A-rated and cultural scenic spots initially increased, followed by a decline.
Figure 6 depicts the Mann–Kendall mutation testing results for scenic spots of varying grades and types, revealing that the UF curves for all scenic spots in Huangpi District exhibited an inverted “V” shape from 2000 to 2023. From 2000 to 2007, the curves depicted a fluctuating decline, followed by a rapid increase from 2008 to 2016. A fluctuating increase was subsequently observed from 2017 to 2023. The UF and UB curves for the 5A scenic spots intersected in 2017 and 2021. A sliding t-test was conducted to identify the year of mutation, indicating 2017 as the year of mutation. In 2017, the Huangpi District People’s Government issued the “Huangpi District Overall Plan for Innovation and Reform of All-for-One Tourism”, aiming to promote the integrated management of 5A scenic spots. By introducing smart tourism systems and strengthening green and low-carbon concepts, ecological tourism was developed, leading to a significant improvement in the EEQ of the 5A scenic spots [50]. For the 4A-rated, natural, and cultural scenic spots, the UF and UB curves intersected in 2023, the year of mutation.

3.3. Impact of TD on EEQ

3.3.1. Differences in the Average RSEI Values Under Different Scenarios

We calculated the average RSEI values for Huangpi District across various scenarios from 2000 to 2023 and performed an independent sample t-test. As shown in Table 2, the results indicated that the average RSEI of the scenic spots is greater than that of the areas outside, with a statistically significant independent sample difference. The most substantial difference was observed from 2008 to 2016. Significant sample differences in the average RSEI values were detected between different grades and types of scenic spots, with the RSEI of the 5A scenic spots exceeding that of the 4A scenic spots and the RSEI of the natural scenic spots surpassing that of the cultural scenic spots. The smallest difference was noted between 2008 and 2016, whereas the greatest difference was found between 2017 and 2023. Furthermore, from 2000 to 2023, the independent sample differences for type of scenic spot were more significant than those for grade, suggesting that TD resources more significantly impact the RSEI of scenic spots.

3.3.2. Differences in the RI Under Different Scenarios

Table 3 presents the variations in the direction and magnitude of the impact of TD on the EEQ, both within and outside scenic spots, as well as across different grades and types of scenic spots, from 2000 to 2023. The results indicated that the direction and magnitude of the impact of TD on the EEQ differ across various stages. Generally, during the periods of 2000–2007 and 2017–2023, the RIs for Huangpi District, both inside and outside its scenic spots, were all below zero across varied-grade scenic spots and varied-type scenic spots, suggesting an adverse effect of TD on the EEQ during these intervals. Notably, the absolute value of the RI was highest during 2000–2007, exceeding that in 2008–2016 and 2017–2023, indicating the greatest negative impact of TD on the EEQ during the former period. Conversely, in the 2008–2016 period, the RI values were positive, indicating a favorable impact of TD on the EEQ. When comparing the absolute values of the RIs across different scenarios, TD within the scenic spots during the 2000–2007 and 2008–2016 periods had a more pronounced impact on their EEQ than that of TD outside the scenic spots. Furthermore, TD within the 4A scenic spots exerted a stronger influence on their EEQ than that within the 5A scenic spots, and TD within the cultural scenic spots had a greater impact than that within the natural scenic spots. However, the reverse pattern emerged during the 2017–2023 period.

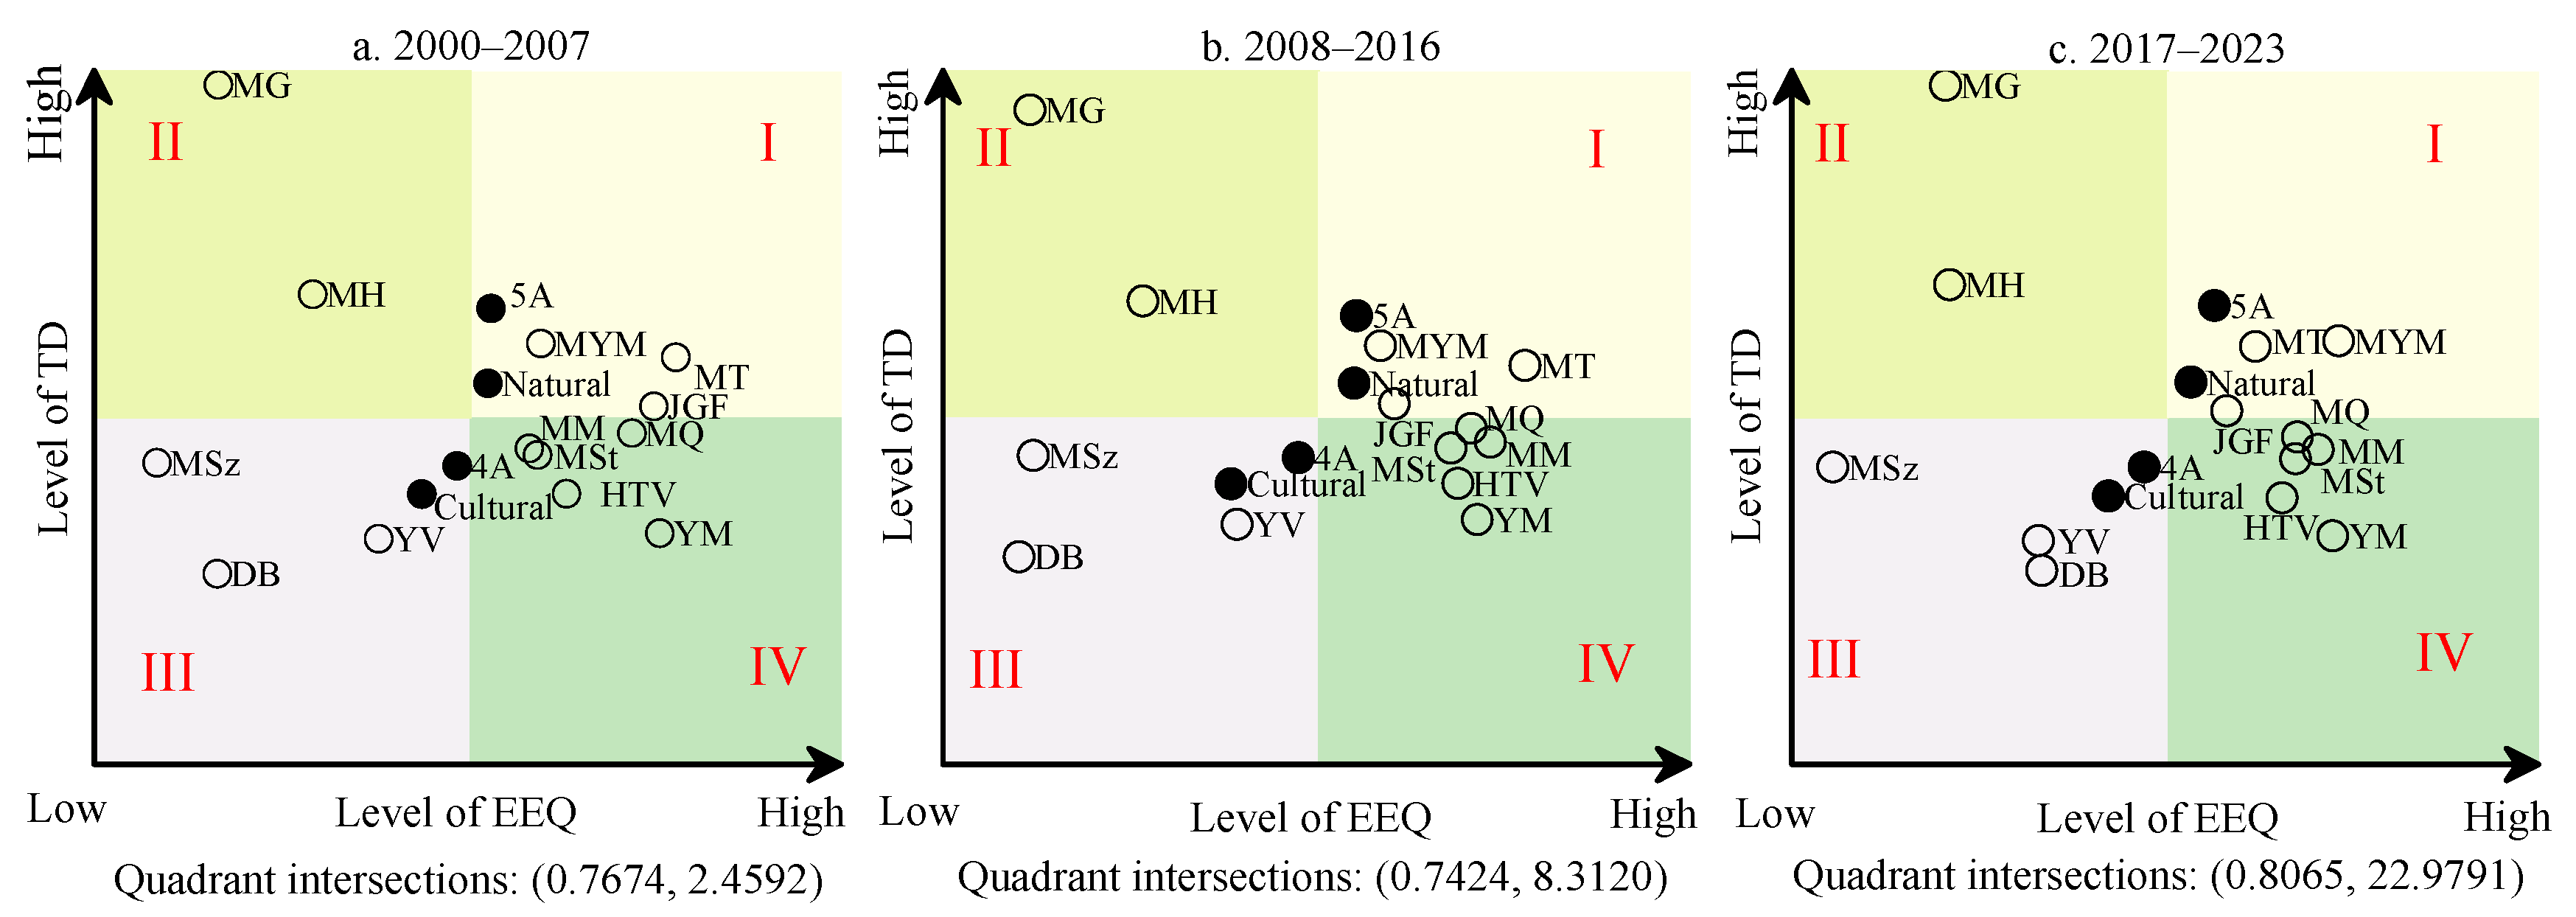
3.3.3. State of Coordination Between TD and RSEI

Figure 7 illustrates the state of coordination between the TD and EEQ for 13 scenic spots in Huangpi District of various grades and types. From 2000 to 2023, the quadrants occupied by the 13 scenic spots were constant. Specifically, MT, MYM, and JGF were situated in the first quadrant; MG and MH in the second quadrant; MSz, DB, and YV in the third quadrant; and MM, MQ, MSt, HTV, and YM in the fourth quadrant. Furthermore, 5A scenic spots and natural sites were located in the first quadrant, while 4A and cultural sites were positioned in the third quadrant. Despite the unchanged quadrants across the different stages, the distance analysis from the quadrant intersection points indicated that the TD for all scenic spots consistently increased from 2000 to 2023.

4. Discussion

4.1. Spatiotemporal Differences in the EEQ in Huangpi District

We employed the RSEI to quantitatively assess the spatial and temporal variability in the EEQ in Huangpi District from 2000 to 2023 by examining the three phases of TD. The findings indicated that the average RSEI values for Huangpi District across these phases all exceeded 0.6000, with the predominant area classified as good; thus, Huangpi District, Wuhan’s “backyard garden,” generally maintains a high EEQ. Spatially, the EEQ in Huangpi District exhibits a “lower EEQ in the south and higher EEQ in the north” pattern. Being closer to Wuhan, the southern regions have been influenced by the spillover effect of this large city’s economy. Successively, the national-level Aeronautical Economic Demonstration Zone, Hankou North International Commodity Trading Center, and Panlongcheng Development Zone were constructed, leading to the rapid expansion of construction land [51]. The expansion of construction land is likely to worsen EEQ, which may be one of the primary reasons for the relatively low EEQ in the southern region. Based on the seventh national census, from 2010 to 2020, the urban population in Huangpi District increased by 305,900. The increasing demand for housing has driven contiguous real estate development, resulting in the conversion of farmland and forest land into residential and commercial land. This population-driven process of land urbanization is a key socioeconomic driver behind the lower EEQ in the southern region compared with that in the northern region [52,53]. Conversely, northern areas, which are dominated by woodlands, foster the development of ecological tourism, enhancing their EEQ and preserving the ecological balance [54,55]. The EEQ and its fluctuations in Huangpi District varied across different development stages. During 2000–2007, the average RSEI value and its CV were 0.6665 and 0.2624, respectively. This period represents the initial phase of ecological TD, coinciding with industrialization and urbanization. Converting extensive farmland and forest land into industrial, residential, and other construction land contributed to a higher CV for the EEQ during this time. From 2008 to 2016, the average RSEI value and its CV were 0.6181 and 0.2708, respectively. These values reflect a significant decline in the EEQ and increased variability compared with those in the previous period. This stage aligns with the industrial upgrading phase, characterized by intensified urbanization. The infrastructure development intensified during industrial expansion and urban population growth, further increasing construction land and the subsequent decline in the EEQ. By 2017–2023, urbanization slowed, industrial development transitioned, and greater emphasis was placed on balancing economic growth with environmental protection. TD emerged as a key industry, and the impacts of earlier ecological restoration efforts became pronounced, improving and stabilizing Huangpi District’s EEQ.

4.2. Impact of TD on EEQ in Huangpi District at Different Stages

We found that the impact of TD on the EEQ in Huangpi District occurred in stages, which is consistent with the findings of Xu et al. [8] and Zheng and Yang [25]. From 2000 to 2007, the RI values for the TD and EEQ in Huangpi District were both below zero, with the absolute value for the RI being the highest compared to those for the other two stages, suggesting that TD had an adverse and significant impact on the EEQ. During this stage, Huangpi District was in the early phase of TD, with scenic spots and unique tourism projects being developed through events such as the “Mulan Cultural Tourism Festival” and “Return of Talents” [56]. The number of infrastructure services for tourism, including transportation and accommodation, increased, expanding construction land [57] and harming the EEQ. Furthermore, this stage placed more emphasis on developing the tourism economy; however, environmental protection measures had not yet been fully implemented, and environmental awareness was low. The increase in the number of tourists—reaching 3.3 million by 2007—placed considerable pressure on the ecological environment, negatively impacting EEQ [38,58]. During this period, the average RSEI values for the 5A and natural scenic spots were significantly higher than those for the 4A and cultural scenic spots, and the absolute RI values for the 4A and cultural scenic spots were higher than those for the 5A and natural scenic spots. However, the differences between types were more significant than those between grades, indicating that in the extensive development stage, the resource endowments of scenic spots more strongly constrained the EEQ than management grades. Compared with 5A scenic spots, 4A scenic spots, owing to looser regulations and a lack of ecological compensation, had a more significant adverse impact on the EEQ due to tourism expansion.
Between 2008 and 2016, Huangpi District recorded the lowest average RSEI value, with the TD and EEQ RI values shifting from negative to positive, signifying that TD positively influenced the EEQ during this era despite the lower EEQ. During this phase, Huangpi District established a national ecological tourism demonstration zone as a goal for TD [56]. A series of policy documents were issued, specifying the requirements for the sewage treatment ratio in scenic spots, the proportion of investment in ecological restoration, and other aspects, leading to a transformation in the TD model from extensive to ecofriendly development, alleviating the negative impact of TD on the EEQ. As tourism revenue grew, increased funding was allocated to ecological restoration and protection, enhancing EEQ [39,59]. Thus, despite the lower EEQ during this period, an upward trend was noted, suggesting a transition in TD from a model of “growth at the expense of ecology” to one of “balance between protection and development”. Although the EEQ had not fully rebounded, the positive ecological externalities of TD began to become apparent. During this stage, the disparity in the RSEIs between 5A and 4A scenic spots was reduced; however, the RI for 4A scenic spots remained higher than that for 5A spots. This aligns with the findings of Lin et al. [38], with the primary explanation being that 5A scenic spots, as China’s top-tier tourism resources, are larger in scale and attract more tourists. This heightens the ecological risks for 5A scenic spots, dampening their positive effect on the EEQ compared with that of 4A scenic spots. Additionally, the RI for cultural scenic spots outpaced that for natural scenic spots, contradicting previous research [38]. This could be attributed to the natural scenic spots’ higher ecological sensitivity and reliance on the ecological environment. Alternatively, the proximity of the study area to a major city may play a role. As Wuhan’s leading ecological leisure space, the natural scenic spots in Huangpi District (including Mulan Tianchi and Yunwu Mountain) maintained a high ecological baseline value. Still, they witnessed increased ecological sensitivity due to the surge in tourists on weekend trips and short holidays. This heightened ecological impact reduced the positive effect of TD on the EEQ of natural scenic spots compared with that on the EEQ of cultural scenic spots.
From 2017 to 2023, the RI values for TD and EEQ again turned negative, although with smaller absolute values than those in the 2000–2007 period. This suggests that while the negative effect of TD on the EEQ reemerged, its intensity diminished. Huangpi District, designated as one of the initial national all-region tourism demonstration areas in China in 2016, has seen its tourism industry flourish, with ongoing growth in its tourism revenue and tourist numbers [60]. Consequently, ecological pressure has rebounded. Simultaneously, the RI for 5A scenic spots surpassed that for 4A scenic spots, and the RI for natural scenic spots exceeded that for cultural sites. This highlights the dynamic trade-off between expanding the scale of tourism and ecological conservation in Huangpi District. This indicates that in suburban TD areas near large cities, relying on resource endowments and overcapacity in high-grade scenic spots may intensify the risk of ecological degradation.

4.3. Limitations and Suggestions

We investigated the spatial and temporal dynamics of TD’s impacts on the EEQ in suburban regions, providing scientific insights for EEQ management. Prior studies have indicated that TD indirectly influences the EEQ through changes in land use [39,61]. The present study conducted a quantitative analysis of the effects of land use transformations triggered by TD at various stages on the EEQ within Huangpi District. Future research should undertake a quantitative examination of the dynamic mechanisms underlying the effects of land use types and their changes on EEQ, specifically within scenic spots of differing grades and types. Furthermore, TD exhibits a spatial gradient effect on the EEQ of scenic spots [38,62]. Future studies should consider the spatial gradient variations in the impact of TD on the EEQ across scenic spots of different grades and types, providing empirical data to support the establishment of “buffer zones” for EEQ management in suburban scenic spots. Meanwhile, variations in the EEQ influence tourist experiences and destinations’ landscape value, thereby affecting regional TD levels. In subsequent research, we will analyze the impacts of changes in the EEQ on TD by integrating questionnaire surveys with operation data on scenic spots. Finally, this study is limited by the availability of data and the challenges of spatial quantification, using only two indicators—tourist numbers and tourism revenue—to measure TD. Subsequent research should integrate diverse data sources to expand the TD evaluation index system, thereby enabling a more accurate portrayal of the impact of TD on EEQ.

5. Conclusions

We analyzed the spatial and temporal variations, degrees of change, and trends in the EEQ in Huangpi District and its various scenic spots, categorized by type and grade, based on the RSEI. A research framework summarized as “magnitude of difference–response characteristics–coordination state” was constructed to provide new ideas for quantitatively evaluating the impact of TD on EEQ. The direction and magnitude of the impact of TD on EEQ in scenic spots of different grades and types were discussed, revealing the phased regularities of this impact and deepening our understanding of the interaction between tourism and the environment. The results indicate that (1) from 2000 to 2023, Huangpi District’s EEQ first decreased and then improved, revealing a spatial pattern of higher values in the north and lower values in the south, alongside a significant increase in the proportion of areas classified as excellent-grade in their EEQ. (2) The EEQ of the 5A, 4A, natural, and cultural scenic spots in Huangpi District exceeded the district’s overall grades, with all of these categories first decreasing and then improving. (3) The direction and magnitude of the impact of TD on the EEQ demonstrated phased characteristics. Between 2000 and 2007, and again from 2017 to 2023, TD adversely affected the EEQ of Huangpi District. During 2000–2007, the negative impact was more significant in 4A scenic spots than 5A spots and more pronounced in cultural than natural scenic spots. In contrast, from 2017 to 2023, the reverse trend was observed. From 2008 to 2016, TD positively influenced the EEQ, with a greater impact on 4A scenic spots than 5A scenic spots, as well as on cultural than natural scenic spots. In the TD and ecological environmental protection plan for Huangpi District, differentiated management strategies should be adopted according to the current characteristics of the EEQ and the type and grade of scenic spots. Furthermore, a dynamic monitoring mechanism should be established to adjust the relevant strategies at different time points. The results of this study can provide data support for achieving a balance between the expansion in tourism’s scale and protection of the EEQ in Huangpi District.

Author Contributions

Conceptualization: H.Q. Methodology: J.S. and J.F. Software: D.Y. Validation: D.Y. and S.X. Formal analysis: X.X. and J.S. Investigation: D.Y. and S.X. Resources: S.X. Data curation: D.Y. Writing—original draft preparation: D.Y. Writing—review and editing: S.X. Visualization: D.Y. Supervision: S.X. Project administration: D.Y. Funding acquisition: S.X. and H.Q. All authors have read and agreed to the published version of the manuscript.

Funding

This research was funded by the Humanities and Social Science Fund of Ministry of Education of China (24YJA630070); the National Natural Science Foundation of China (41961031, 42361028); and the Outstanding Graduate Education Innovation Funding Program of the Central China Normal University (3010624003).

Data Availability Statement

Publicly available datasets were analyzed, and the data sources and access links are indicated in the article.

Conflicts of Interest

The authors declare no conflicts of interest.

References

  1. Liu, S.; Shi, K.; Wu, Y. Identifying and evaluating suburbs in China from 2012 to 2020 based on SNPP–VIIRS nighttime light remotely sensed data. Int. J. Appl. Earth Obs. Geoinf. 2022, 114, 103041. [Google Scholar] [CrossRef]
  2. Tian, Y.; Qian, J.; Wang, L. Village classification in metropolitan suburbs from the perspective of urban-rural integration and improvement strategies: A case study of Wuhan, central China. Land Use Policy 2021, 111, 105748. [Google Scholar] [CrossRef]
  3. Wang, Y. The study on recreation-scape planning and landscape ecological protection of urban-rural fringe: A typical case study of Beijing. Geogr. Res. 2003, 22, 324–334. [Google Scholar] [CrossRef]
  4. Yang, H.; Wu, R.; Qiu, B.; Zhang, Z.; Hu, T.; Zou, J.; Wang, H. The next step in suburban rural revitalization: Integrated whole-process landscape management linking ecosystem services and landscape characteristics. Ecol. Indic. 2024, 162, 111999. [Google Scholar] [CrossRef]
  5. Lu, S.; Chen, L.; Long, C.; Duan, P. Tourism gentrification of traditional villages and towns in the suburbs of big cities in China: A case study of Zhujiajiao Ancient Town in Shanghai. Acta Geogr. Sin. 2023, 78, 2535–2553. [Google Scholar] [CrossRef]
  6. Cheng, Z.; Wang, H.; Wang, L.; Lin, A. Mix leading to success? Exploring the innovative development model in peri-urban China. Habitat. Int. 2018, 82, 1–8. [Google Scholar] [CrossRef]
  7. McDonald, R.I.; Mansur, A.V.; Ascensão, F.; Colbert, M.; Crossman, K.; Elmqvist, T.; Gonzalez, A.; Güneralp, B.; Haase, D.; Hamann, M.; et al. Research gaps in knowledge of the impact of urban growth on biodiversity. Nat. Sustain. 2020, 3, 16–24. [Google Scholar] [CrossRef]
  8. Xu, L.; Yu, H.; Zhong, L. Evolution of the landscape pattern in the Xin’an River Basin and its response to tourism activities. Sci. Total Environ. 2023, 880, 163472. [Google Scholar] [CrossRef]
  9. Cetin, M.; Zeren, I.; Sevik, H.; Cakir, C.; Akpinar, H. A study on the determination of the natural park’s sustainable tourism potential. Environ. Monit. Assess. 2018, 190, 167. [Google Scholar] [CrossRef]
  10. Zou, C.; Zhu, J.; Lou, K.; Yang, L. Coupling coordination and spatiotemporal heterogeneity between urbanization and ecological environment in Shaanxi Province, China. Ecol. Indic. 2022, 141, 109152. [Google Scholar] [CrossRef]
  11. Cui, X.; Fang, C.; Liu, H.; Liu, X. Assessing sustainability of urbanization by a coordinated development index for an Urbanization-Resources-Environment complex system: A case study of Jing-Jin-Ji region, China. Ecol. Indic. 2019, 96, 383–391. [Google Scholar] [CrossRef]
  12. Bi, J.; Zhu, P.; Zhang, M.; Lin, S. Impact of land urbanization on the quality of the ecological environment: Analysis based on the local-neighboring area perspective. Prog. Geogr. 2023, 42, 2033–2046. [Google Scholar] [CrossRef]
  13. Zheng, Y.; Wang, S.; Cao, Y.; Shi, J.; Qu, Y.; Li, L.; Zhao, T.; Niu, Z.; Yang, R.; Gong, P. Assessing the ecological vulnerability of protected areas by using Big Earth Data. Int. J. Digit. Earth 2021, 14, 1624–1637. [Google Scholar] [CrossRef]
  14. Wang, J.; Chen, J.; Wen, Y.; Fan, W.; Liu, Q.; Tarolli, P. Monitoring the coastal wetlands dynamics in Northeast Italy from 1984 to 2016. Ecol. Indic. 2021, 129, 107906. [Google Scholar] [CrossRef]
  15. Zhuang, Q.; Wu, S.; Yan, Y.; Niu, Y.; Yang, F.; Xie, C. Monitoring land surface thermal environments under the background of landscape patterns in arid regions: A case study in Aksu river basin. Sci. Total Environ. 2020, 710, 136336. [Google Scholar] [CrossRef]
  16. Sun, T.; Lin, W.; Chen, G.; Guo, P.; Zeng, Y. Wetland ecosystem health assessment through integrating remote sensing and inventory data with an assessment model for the Hangzhou Bay, China. Sci. Total Environ. 2016, 566–567, 627–640. [Google Scholar] [CrossRef] [PubMed]
  17. Yuan, B.; Fu, L.; Zou, Y.; Zhang, S.; Chen, X.; Li, F.; Deng, Z.; Xie, Y. Spatiotemporal change detection of ecological quality and the associated affecting factors in Dongting Lake Basin, based on RSEI. J. Clean. Prod. 2021, 302, 126995. [Google Scholar] [CrossRef]
  18. Xu, H. A remote sensing index for assessment of regional ecological changes. China Environ. Sci. 2013, 33, 889–897. [Google Scholar]
  19. Xu, Y.; Yang, X.; Xing, X.; Wei, L. Coupling eco-environmental quality and ecosystem services to delineate priority ecological reserves—A case study in the Yellow River Basin. J. Environ. Manag. 2024, 365, 121645. [Google Scholar] [CrossRef]
  20. Zhang, L.; Hou, Q.; Duan, Y.; Ma, S. Spatial and temporal heterogeneity of eco-environmental quality in Yanhe Watershed (China) using the Remote-Sensing-Based Ecological Index (RSEI). Land 2024, 13, 780. [Google Scholar] [CrossRef]
  21. Long, T.; Bai, Z.; Zheng, B. Spatiotemporal dynamics and driving forces of ecological environment quality in coastal cities: A remote sensing and land use perspective in Changle District, Fuzhou. Land 2024, 13, 1393. [Google Scholar] [CrossRef]
  22. Cao, S.; Chen, S. Analysis of quality evolution of important ecological function areas and implementation effects of the ecological redline in Jiangsu Province, China. Acta Ecol. Sin. 2023, 43, 8933–8947. [Google Scholar] [CrossRef]
  23. Peng, X.; Zhang, S.; Peng, P.; Chen, A.; Li, Y.; Wang, J.; Bai, M. Unraveling the Ecological Tapestry: A Comprehensive Assessment of Changtang Nature Reserve’s Ecological and Environmental Using RSEI and GEE. Land 2023, 12, 1581. [Google Scholar] [CrossRef]
  24. Arif, M.; Behzad, H.M.; Tahir, M.; Li, C. The impact of ecotourism on ecosystem functioning along main rivers and tributaries: Implications for management and policy changes. J. Environ. Manag. 2022, 320, 115849. [Google Scholar] [CrossRef]
  25. Zheng, X.; Yang, Z. Coordination or contradiction? The spatiotemporal relationship between ecological environment and tourism development within the tourism ecological security framework in China. Ecol. Indic. 2023, 157, 111247. [Google Scholar] [CrossRef]
  26. Zeng, Y.; Zhong, L. Identifying conflicts tendency between nature-based tourism development and ecological protection in China. Ecol. Indic. 2020, 109, 105791. [Google Scholar] [CrossRef]
  27. Gui, M.; Wang, K.; Wang, F.; Dong, Y. Analysis of the tourism-economy-ecology coupling coordination and high-quality development path in karst Guizhou Province, China. Ecol. Indic. 2023, 154, 110858. [Google Scholar] [CrossRef]
  28. Berman, N. Environmental Education Catalyzed by Tourism: Ecoliteracy Initiatives on the Coast of Kenya. Sustainability 2021, 13, 8501. [Google Scholar] [CrossRef]
  29. Chung, M.G.; Dietz, T.; Liu, J. Global relationships between biodiversity and nature-based tourism in protected areas. Ecosyst. Serv. 2018, 34, 11–23. [Google Scholar] [CrossRef]
  30. Adu-Ampong, E.A. Historical trajectories of tourism development policies and planning in Ghana, 1957–2017. Tour. Plan. Dev. 2019, 16, 124–141. [Google Scholar] [CrossRef]
  31. Xu, A.; Wang, C.; Tang, D.; Ye, W. Tourism circular economy: Identification and measurement of tourism industry ecologization. Ecol. Indic. 2022, 144, 109476. [Google Scholar] [CrossRef]
  32. Tang, Z. An integrated approach to evaluating the coupling coordination between tourism and the environment. Tour. Manag. 2015, 46, 11–19. [Google Scholar] [CrossRef]
  33. Chun, J.; Kim, C.; Kim, G.; Jeong, J.; Lee, W. Social big data informs spatially explicit management options for national parks with high tourism pressures. Tour. Manag. 2020, 81, 104136. [Google Scholar] [CrossRef]
  34. Kim, Y.; Kim, C.; Lee, D.; Lee, H.; Andrada, R.I.T. Quantifying nature-based tourism in protected areas in developing countries by using social big data. Tour. Manag. 2019, 72, 249–256. [Google Scholar] [CrossRef]
  35. Zhang, X.; Zhang, X.; Lu, L.; Li, D. Evolution characteristics and driving factors of basin multi-scale landscape pattern under the tourism disturbances: A case study of the Xin’an River Basin. Acta Ecol. Sin. 2021, 41, 3415–3428. [Google Scholar] [CrossRef]
  36. Wang, L.; Jia, G.; Qin, Q.; Huang, Z.; Hu, M. Change of rural recreational agriculture landscape pattern and driving factors under the development of tourism: A case study of Wuyuan, Jiangxi. Prog. Geogr. 2023, 42, 1556–1572. [Google Scholar] [CrossRef]
  37. Zeng, Y.; Wang, L.; Zhong, L. Measuring and reducing the ecological risk of community tourism for ecosystem conservation. Ecol. Indic. 2024, 166, 112493. [Google Scholar] [CrossRef]
  38. Lin, Y.; Jin, Y.; Lin, M.; Wen, L.; Lai, Q.; Zhang, F.; Ge, Y.; Li, B. Exploring the spatial and temporal evolution of landscape ecological risks under tourism disturbance: A case study of the Min River Basin, China. Ecol. Indic. 2024, 166, 112412. [Google Scholar] [CrossRef]
  39. Li, L.; Feng, R.; Xi, J.; Huijbens, E.H.; Gao, Y. Distinguishing the impact of tourism development on ecosystem service trade-offs in ecological functional zone. J. Environ. Manag. 2023, 342, 118183. [Google Scholar] [CrossRef] [PubMed]
  40. Hu, Z.; Kumar, J.; Qin, Q.; Kannan, S. Assessing the coupling coordination degree between all-for-one tourism and ecological civilization; case of Guizhou, China. Environ. Sustain. Indic. 2023, 19, 100272. [Google Scholar] [CrossRef]
  41. Wang, Z.; Dai, L. Assessment of land use/cover changes and its ecological effect in karst mountainous cities in central Guizhou Province: Taking Huaxi District of Guiyang City as a case. Acta Ecol. Sin. 2021, 41, 3429–3440. [Google Scholar] [CrossRef]
  42. Qin, G.; Wang, N.; Wu, Y.; Zhang, Z.; Meng, Z.; Zhang, Y. Spatiotemporal variations in eco-environmental quality and responses to drought and human activities in the middle reaches of the Yellow River basin, China from 1990 to 2022. Ecol. Inform. 2024, 81, 102641. [Google Scholar] [CrossRef]
  43. Sun, Z.; Han, J.; Li, Y.; Yang, L.; Shi, L.; Yan, J. Effects of large-scale land consolidation projects on ecological environment quality: A case study of a land creation project in Yan’an, China. Environ. Int. 2024, 183, 108392. [Google Scholar] [CrossRef]
  44. Wang, X.; Du, X.; Qin, Y.; Xu, F. Spatiotemporal differentiation and mechanisms of ecological quality in Central Asia. Ecol. Indic. 2024, 158, 111514. [Google Scholar] [CrossRef]
  45. Yan, Y.; Zhuang, Q.; Zan, C.; Ren, J.; Yang, L.; Wen, Y.; Zeng, S.; Zhang, Q.; Kong, L. Using the Google Earth Engine to rapidly monitor impacts of geohazards on ecological quality in highly susceptible areas. Ecol. Indic. 2021, 132, 108258. [Google Scholar] [CrossRef]
  46. Gong, C.; Lyv, F.; Wang, Y. Spatiotemporal change and drivers of ecosystem quality in the Loess Plateau based on RSEI: A case study of Shanxi, China. Ecol. Indic. 2023, 155, 111060. [Google Scholar] [CrossRef]
  47. Ma, W.; Yang, H.; Jiang, G.; Zhou, T.; Zhao, Q. Exploring trade-offs between residential and industrial functions in rural areas and their ecological impacts across transitioning agricultural systems: Evidence from the metropolitan suburbs of China. J. Environ. Manag. 2024, 358, 120907. [Google Scholar] [CrossRef]
  48. Liu, H.; Wang, C.; Tsai, H. Enhancing tourism carbon emission efficiency through industry agglomeration: Evidence from China. Tour. Manag. 2025, 110, 105170. [Google Scholar] [CrossRef]
  49. Zhang, X.; Fan, H.; Hou, H.; Xu, C.; Sun, L.; Li, Q.; Ren, J. Spatiotemporal evolution and multi-scale coupling effects of land-use carbon emissions and ecological environmental quality. Sci. Total Environ. 2024, 922, 171149. [Google Scholar] [CrossRef] [PubMed]
  50. Huangpi District People’s Government. Government Work Report 2017. Available online: https://www.huangpi.gov.cn/ywdt/gzbb/202004/t20200424_1110553.html (accessed on 26 March 2025).
  51. Zhang, B.; Xia, Q.; Dong, J.; Li, L. Research on the Impact of Land Use Change on the Spatio-temporal Pattern of Carbon Storage in Metropolitan Suburbs: Taking Huangpi District of Wuhan City as an Example. J. Ecol. Rural Environ. 2023, 39, 699–712. [Google Scholar]
  52. Huang, H.; Chen, W.; Zhang, Y.; Qiao, L.; Du, Y. Analysis of ecological quality in Lhasa Metropolitan Area during 1990–2017 based on remote sensing and Google Earth Engine platform. J. Geogr. Sci. 2021, 31, 265–280. [Google Scholar] [CrossRef]
  53. Xin, J.; Yang, J.; Yu, H.; Ren, J.; Yu, W.; Cong, N.; Xiao, X.; Xia, J.C.; Li, X.; Qiao, Z. Towards ecological civilization: Spatiotemporal heterogeneity and drivers of ecological quality transitions in China (2001–2020). Appl. Geogr. 2024, 173, 103439. [Google Scholar] [CrossRef]
  54. Chen, Y.; Feng, X.; Tian, H.; Wu, X.; Gao, Z.; Feng, Y.; Piao, S.; Lv, N.; Pan, N.; Fu, B. Accelerated increase in vegetation carbon sequestration in China after 2010: A turning point resulting from climate and human interaction. Glob. Change Biol. 2021, 27, 5848–5864. [Google Scholar] [CrossRef]
  55. Li, C.; Yang, J.; Zhang, Y. Evaluation and analysis of the impact of coastal urban impervious surfaces on ecological environments. IEEE J. Sel. Top. Appl. Earth Obs. Remot. Sens. 2023, 16, 8721–8733. [Google Scholar] [CrossRef]
  56. Feng, Y. Tourism Revenue Increases 87-Fold in 20 Years: How Huangpi District of Wuhan Became a Leading Tourism Hub in China. Available online: https://www.sohu.com/a/504070064_121123902 (accessed on 1 March 2025).
  57. Liu, S.; Zhang, J.; Geng, Y.; Li, J.; Wang, Y.; Zhang, J. Plausible response of urban encroachment on ecological land to tourism growth and implications for sustainable management, a case study of Zhangjiajie, China. Ecol. Indic. 2021, 132, 108253. [Google Scholar] [CrossRef]
  58. Ruan, W.; Li, Y.; Zhang, S.; Liu, C. Evaluation and drive mechanism of tourism ecological security based on the DPSIR-DEA model. Tour. Manag. 2019, 75, 609–625. [Google Scholar] [CrossRef]
  59. Wang, Y.; Dai, E. Spatial-temporal changes in ecosystem services and the trade-off relationship in mountain regions: A case study of Hengduan Mountain region in Southwest China. J. Clean. Prod. 2020, 264, 121573. [Google Scholar] [CrossRef]
  60. Huangpi District People’s Government. The List of the First Batch of National All-for-One Tourism Demonstration Zones Has Been Announced, with Huangpi District Being Included. Available online: https://www.huangpi.gov.cn/ywdt/bmzc/202001/t20200113_777130.html (accessed on 5 March 2025).
  61. Chen, H. Land use trade-offs associated with protected areas in China: Current state, existing evaluation methods, and future application of ecosystem service valuation. Sci. Total Environ. 2020, 711, 134688. [Google Scholar] [CrossRef]
  62. Li, G.; Yang, X.; Liu, Q.; Zheng, F. Destination island effects: A theoretical framework for the environmental impact assessment of human tourism activities. Tour. Manag. Perspect. 2014, 10, 11–18. [Google Scholar] [CrossRef]
Figure 1. Location of the study area, 2023 NDVI spatial distribution, and the total number of tourists and tourism revenue from 2000 to 2023.
Land 14 01032 g001
Figure 2. The temporal and spatial distribution of the average RSEI grades in Huangpi District.
Land 14 01032 g002
Figure 3. The temporal and spatial distribution of RSEI CV grades in Huangpi District.
Land 14 01032 g003
Figure 4. Variation trends and mutation characteristics for the RSEI in Huangpi District from 2000 to 2023: (a) Variation trends; (b) Mutation characteristics.
Land 14 01032 g004
Figure 5. The proportion of each average RSEI grade and the proportion of each RSEI CV grade for different types and grades of scenic spots in Huangpi District in 2000–2007, 2008–2016, and 2017–2023.
Land 14 01032 g005
Figure 6. The mutation characteristics of the RSEI for different grades and types of scenic spots in Huangpi District from 2000 to 2023.
Land 14 01032 g006
Figure 7. Quadrant distribution of EEQ and TD for different types and grades of scenic spots in Huangpi District in 2000–2007, 2008–2016, and 2017–2023.
Land 14 01032 g007
Table 1. Feature vectors and contribution rates of the first principal component for the WET, NDVI, NDBSI, and LST in Huangpi District from 2000 to 2023.
YearWETNDVINDBSILSTPC1 (%)YearWETNDVINDBSILSTPC1 (%)
20000.013840.9342−0.1836−0.209371.4920130.02440.9346−0.3375−0.109571.97
20010.00030.8144−0.3433−0.467954.9420140.00090.9997−0.0002−0.024089.92
20020.04330.9489−0.2481−0.209166.1220150.01930.9493−0.2867−0.127665.75
20030.02370.9098−0.0831−0.190270. 3120160.00040.9883−0.1415−0.057070.99
20040.00510.9912−0.3186−0.065959.6320170.01080.9981−0.0032−0.061088.96
20050.02680.8980−0.4191−0.131572.6320180.03590.9433−0.3255−0.054264.86
20060.05010.9506−0.2941−0.085285.9520190.05000.9323−0.3385−0.117072.04
20080.00190.9768−0.2006−0.074573.5720200.01010.9998−0.0047−0.018994.72
20090.06900.6202−0.7516−0.213753.5920210.01100.9996−0.0010−0.027091.51
20100.07120.8691−0.4107−0.126974.7820220.03850.9321−0.3472−0.095691.51
20110.03230.9250−0.3641−0.103955.3520230.16040.7567−0.6115−0.166871.08
20120.05170.9563−0.2502−0.142375.51
Table 2. Results of the independent sample t-test of the RSEI under different scenarios in Huangpi District in 2000–2007, 2008–2016, and 2017–2023.
YearAveragetpAveragetpAveragetp
InsideOutside5A4ANaturalCultural
2000–20070.76740.64202.2630.0400.78050.76160.7350.0420.77870.74201.1430.035
2008–20160.74240.61652.4530.0300.76310.73310.3920.0450.76190.69850.7660.041
2017–20230.80660.73832.4440.0260.83340.79471.6980.0210.82060.77501.9430.011
Table 3. RIs for inside and outside scenic spots and for scenic spots of different types and grades in 2000–2007, 2008–2016, and 2017–2023.
Region TypesAll AreasOutsideInside5A4ANaturalCultural
2000–2007−0.0067−0.0100−0.0148−0.1141−0.3594−0.1572−0.5294
2008–20160.00020.00030.00050.00680.00750.00630.0111
2017–2023−0.0001−0.0001−0.0001−0.0014−0.0013−0.0014−0.0006
Disclaimer/Publisher’s Note: The statements, opinions and data contained in all publications are solely those of the individual author(s) and contributor(s) and not of MDPI and/or the editor(s). MDPI and/or the editor(s) disclaim responsibility for any injury to people or property resulting from any ideas, methods, instructions or products referred to in the content.

