Article

Vegetation Dynamics and Responses to Climate Variations and Human Activities in the Basin of the Yarlung Tsangpo, Lhasa, and Nianchu Rivers in the Tibetan Plateau

1
College of Geography and Planning, Chengdu University of Technology, Chengdu 610059, China
2
College of Ecology and Environment, Chengdu University of Technology, Chengdu 610059, China
3
Tianfu Yongxing Laboratory, Chengdu 610213, China
4
Huaneng Tibet Yarlung Zangbo River Hydropower Development Investment Co., Ltd., Lhasa 850000, China
5
College of Earth and Planetary Sciences, Chengdu University of Technology, Chengdu 610059, China
*
Authors to whom correspondence should be addressed.
Land 2025, 14(5), 1027; https://doi.org/10.3390/land14051027
Submission received: 6 March 2025 / Revised: 27 April 2025 / Accepted: 30 April 2025 / Published: 8 May 2025
(This article belongs to the Special Issue Vegetation Cover Changes Monitoring Using Remote Sensing Data)

Abstract

:
Terrestrial ecosystem vegetation are vulnerable to the joint impacts of human activities and climate change, particularly in ecologically fragile areas such as the Tibetan Plateau. Identifying vegetation cover changes and distinguishing their driving factors are crucial for ecological conservation in this region. This study utilized MODIS normalized difference vegetation index (NDVI) data from 2000 to 2019, combined with trend analysis (univariate linear regression and the Mann–Kendall test), partial correlation analysis, and residual analysis methods, to investigate the spatial and temporal dynamics of vegetation cover and its responses to climate change and human activities in the Yarlung Tsangpo River, Lhasa River, and Nianchu River Basin (YLN Basin) on the Tibetan Plateau. The results revealed significant differences in vegetation dynamics both in summer and the growing season: the average summer NDVI showed a significant decreasing trend during the study period, whereas the growing season NDVI exhibited no significant overall temporal trend, which highlighted the necessity of assessing vegetation dynamics seasonally to accurately capture their interannual complexity. Partial correlation analysis indicated that precipitation was the key limiting climatic factor for vegetation growth in this region, with its positive influence covering over 90% of the land area during summer and over 60% during the growing season. The residual analysis further indicated the dual and spatially heterogeneous roles of human activities: on the one hand, positive impacts, primarily from vegetation restoration projects, promoted NDVI increases in some areas; on the other hand, negative impacts, such as continuous grazing pressure, population growth, and associated land use changes, inhibited vegetation development in other areas. This study quantitatively assessed the combined effects of climate variability and complex human activities on the vegetation NDVI in the YLN Basin, emphasizing that the development of adaptive management and effective vegetation restoration strategies must fully consider seasonal differences, the key climatic limiting factor (water availability), and the spatial heterogeneity of human impacts to promote sustainable development in this ecologically fragile region.

1. Introduction

Vegetation, as one of the primary components of terrestrial ecosystems, is essential for material and energy cycling and serves as a link among ecosystems, human activities, and climate change [1,2]. Climatic patterns and human activities are considered to be two fundamental drivers influencing the spatial and temporal distribution patterns of vegetation [3,4]. Climate controls how vegetation grows over time, influences its geographical distribution, and determines the type and extent of regional ecosystem services. However, human activities can significantly shift the spatial extent and quality of vegetation growth, which has considerable impacts on the services and functions of surrounding ecosystems [5,6]. Therefore, understanding the interactions among vegetation dynamics, climatic conditions, and human activities is a major focus of global change research [7]. Particularly in highly sensitive ecological regions such as the Tibetan Plateau, an in-depth investigation into the mechanisms, processes, and consequences of these interactions is critically important [8,9,10].
Vegetation cover is a key indicator of changes in regional vegetation and the ecosystem, as it can characterize vegetation growth, identify environmental changes, and quantify ecological quality to some extent [11]. Therefore, variations in vegetation cover can reflect changes in terrestrial ecosystems [12]. In recent years, satellite remote sensing imagery has become an important source of information for monitoring large-scale vegetation dynamics. Photosynthetic capacity, leaf area index (LAI), biomass, and net primary productivity (NPP) exhibit strong correlations with the normalized difference vegetation index (NDVI) obtained from sources such as GIMMS or MODIS. Furthermore, NDVI can more accurately reflect changes in plant growth and is highly sensitive to the dynamic changes of surface vegetation [13]. NDVI is a remote sensing index, constructed based on the distinct spectral contrast between the strong absorption of the red-light bands by vegetation chlorophyll and the high reflectance of the near-infrared spectrum by leaf cellular structures [14]. Its calculation formula, (NIR − Red)/ (NIR + Red), effectively amplifies this difference, enabling the index to quantitatively reflect the density, health status, and photosynthetic activity of surface vegetation cover [15]. Consequently, the spatial and temporal dynamics of NDVI are widely used to monitor vegetation phenology, growth conditions, and vegetation responses to environmental stress, which can more accurately reflect the dynamic changes in surface vegetation growth [16,17,18]. Moreover, leveraging its advantages for large-scale, long-term time series monitoring, NDVI enables researchers to effectively track vegetation development, estimate ecosystem status, and explore in-depth investigations into the underlying driving mechanisms within data-scarce plateau environments [19].
The evolution of plateau ecosystems, in particular, is governed by complex interactions between climate change and human activities. Climatic factors such as regional rapid warming and shifts in precipitation patterns intertwine with multiple anthropogenic drivers, such as adjustments in grazing pressure, land use/land cover change (LUCC), the implementation of ecological projects, and urban expansion, resulting in synergistic, antagonistic, or additive effects [20,21]. Such interactions are superimposed upon the environmental heterogeneity caused by the complex topography of a plateau and exhibit significant differences at different spatial and temporal scales, which may trigger non-linear responses or even threshold shifts in the ecosystem state [22]. Therefore, accurately identifying and quantifying the relative contributions of various natural and anthropogenic drivers to vegetation changes in plateaus, while also characterizing the complexity and heterogeneity of vegetation responses, constitutes a core scientific challenge in current research [23].
To address this challenge, researchers have employed a variety of analytical techniques, including linear regression, Theil–Sen trend analysis, the Mann–Kendall test, and wavelet analysis, to examine NDVI change patterns across various temporal and geographical scales, based on datasets such as NOAA/AVHRR, MOD13Q1 NDVI, and others [24,25]. Concurrently, the residual trend method based on multiple regression has also been utilized to investigate the relationship between human activities and NDVI [26,27,28,29,30,31,32]. Vegetation growth and soil moisture variations are directly influenced by the spatial and temporal differences in key climatic parameters (temperature and precipitation) [33,34]. Seasonal temperature and precipitation are considered to be primary variables for exploring changes in vegetation cover and its climatic responses [35,36]. Human activities also strongly influence NDVI variations, which are often more geographically localized compared to the pervasive influence of climate on vegetation [37]. Human activities such as overgrazing, urbanization, and population expansion can have negatively impacted vegetation growth. However, there is limited research concerning the effects of ecological restoration and environmental construction projects [38].
The Tibetan Plateau, possessing unique topography and thermal forcing, exerts significant influence on regional and even global climate systems. Concurrently, it serves as a ‘sentinel’ for terrestrial ecosystem responses to climate change [39,40]. The Yarlung Tsangpo, Lhasa, and Nianchu River (YLN) basin, as the economic, political, religious, and cultural center of the plateau, features an extremely fragile ecological environment that is highly sensitive to climate change and human activities. Under the pressures of global warming and accelerating urbanization, the ecological and environmental problems faced by this region are becoming increasingly prominent, subsequently constraining sustainable socio-economic development of the area. Notably, the Tibetan Plateau is experiencing rapid warming at a rate significantly higher than the global average, accompanied by alterations in precipitation patterns [41,42]. These climatic changes profoundly affect vegetation growth and distribution within the basins. Meanwhile, human activities, such as traditional grazing, land use/land cover change (LUCC) driven by rapid urbanization, and large-scale ecological restoration projects implemented in recent years [43,44], are also exerting increasingly complex and intense influences on the vegetation development of the YLN Basin. Numerous NDVI-based studies have documented a greening trend of the vegetation in parts of the plateau, attempting to attribute it to climate warming or ecological conservation measures [45]. However, other studies have revealed regional vegetation degradation or complex, non-linear responses constrained by factors such as precipitation fluctuations and overgrazing [46,47].
Therefore, in the crucial YLN Basin region, systematically examining the interrelationships among vegetation, climate change, and human activities is of critical importance for regional and ecological environmental protection and vegetation restoration. The primary aim of this study is to provide a comprehensive understanding of the recent (2000–2019) vegetation dynamics within this ecologically vital and sensitive area by dissecting the complex interplay between natural and anthropogenic drivers. To achieve this, the specific objectives of this study were (1) to analyze the spatial and temporal variation characteristics of NDVI to reveal the patterns of vegetation change; (2) to determine whether the growing season NDVI and the summer NDVI respond in similar or comparable ways to human activities and climate change, thereby highlighting the crucial seasonal dimensions of the ecosystem response; and (3) to quantify the respective or distinct impacts of human activities and climatic factors on vegetation dynamics, allowing for the differentiation of key driving forces. By integrating these analyses, this research contributes a nuanced assessment of vegetation response to climate variability (particularly water limitations) and spatially heterogeneous human activities (including degradation pressures and restoration efforts) in the YLN Basin. This work underscores the necessity of seasonal-scale analysis and provides critical insights for developing targeted and adaptive management and effective ecological conservation strategies for sustainable development in this fragile plateau environment.

2. Materials and Methods

2.1. Study Region

The YLN Basin of Tibet (87°40′–92°37′ E, 28°60′–30°30′ N) is situated on the Tibetan Plateau’s southern region (Figure 1), with the Yarlung Tsangpo River as the axis, starting from Sangri County in the Shannan Region in the east and Lhazhi County in the Shigatse Region in the west. It reaches the Tsangnam River Basin in the south. The total length is about 245.5 km, involving 18 administrative regions (counties), and is a wide valley area of the southern Tibetan plain, consisting of extra-high mountains, high mountains, and river valley basins. The narrow river valley area, which covers 66,700 km2, has a high altitude in the west and a low altitude in the east on average. There is an obvious vertical distribution of vegetation along the altitude. The mountain tops consist mostly of the sparse vegetation of flowing rocky beaches, affected by alpine freezing and thawing, with low vegetation coverage. The mountainsides are dominated by alpine meadows with high coverage and the foothills are dominated by alpine grasslands with some drought-tolerant shrubs and grasslands, and most of the river valley basins are distributed with agricultural land and artificial forests. The study region’s climate is classified as a temperate monsoon semi-arid zone of the plateau, with average annual temperatures of 5 to 10 °C, relative humidity averages of 40 to 60%, and precipitation of 400 to 800 mm, which mainly occurs in summer. Dramatic seasonal variations in precipitation, distinct dry and wet seasons, and an abundance of thermal and water resources in the valley make the study region a typical ecologically fragile region [48].

2.2. Data Sources and Preprocessing

2.2.1. NDVI Data

The National Tibetan Plateau Data Center’s monthly normalized difference vegetation index (NDVI) product (http://data.tpdc.ac.cn) contains the NDVI information for the years 2000–2023. This product is derived from the Aqua/Terra-MODIS satellite sensors’ MOD13Q1 data and land use data with a 250 m spatial resolution. The data synthesis method employed the monthly maximum value composite (MVC) approach [49]. For this study, data from 2000 to 2019 were selected. The downloaded MOD13Q1 data were preprocessed using the MODIS Reprojection Tool (MRT), which included tasks such as data format conversion and projection transformation.
The maximum value composite (MVC) was utilized to gather the seasonal variation NDVI statistics by separating them into summer and the growing season [50]. To lessen the effects of the soil background and boost the signal from the green vegetation, areas with NDVI 0.1 (non-vegetated areas) were removed from this study [51,52].

2.2.2. Meteorological Data

Utilizing regular rainfall and temperature statistics from the China Meteorological Science Data Sharing Service [53], along with ASTER GDEM V2 digital elevation data from the geospatial data cloud platform [54], the Anusplin method was utilized to spatially interpolate the information from 23 weather observation stations in and around the geographical research area for the purpose of calculating the seasonal temperature and rainfall [55].

2.3. Data Analysis

2.3.1. Trend Analysis and Mann–Kendall Test

The Theil–Sen median slope estimation provides a robust, non-parametric approach for quantifying the magnitude of trends in time series data. It works by calculating slopes between all possible pairs of data points in a series and uses the median of these slopes as the overall trend estimate [56]. A key advantage over simple linear regression is its robustness to outliers and does not require the data to follow a normal distribution [57,58]. In this study, the Theil–Sen slope was employed to compute the rate of change in NDVI for every pixel from 2000 to 2019. Thus, the specific rate and direction of the change, such as increase or decrease in the vegetation cover, was revealed. The calculation formula is as follows:
s N D V I = M e d i a n ( N D V I j N D V I i j i ) 0 < I < j < n
where NDVIj and NDVIi denote the NDVI values in year j and year i of the image element, respectively, and n denotes the length of the time series. When SNDVI > 0, it shows an upward trend in the NDVI; when SNDVI < 0, it shows a downward trend in the NDVI.
The Mann–Kendall (MK) test is also a non-parametric statistical procedure employed to determine monotonic trends within time series data [59]. It assesses the likelihood of the existence of a trend by comparing the relative magnitude of the values at all time points in the series to construct a statistic. The key advantages of the MK test include its independence from the assumptions of data normality and its considerable robustness to both missing data and outliers [60,61]. In this study, the MK test was applied in conjunction with the Theil–Sen slope method with the aim of assessing the statistical significance (e.g., p < 0.05) of the computed NDVI trends for individual pixels, thereby facilitating the differentiation of true vegetation change patterns from stochastic variability. The formula for calculating the value of the statistic Z in the Mann–Kendall method is as follows.
Z =   S 1 v a r ( S )                     ( S > 0 )         0                               ( S = 0 )   S + 1 v a r ( S )                   ( S < 0 )
Among them,
S = i = 1 n 1 j = i + 1 n s g n ( N D V I j N D V I i )
s g n ( x j x i ) = 1             N D V I j N D V I i > 0 0             N D V I j N D V I i = 0 1       N D V I j N D V I i < 0
v a r ( S ) = n ( n 1 ) ( 2 n + 5 ) 18
where the trend of NDVI is separated into significant increase (β > 0.0005 |Z| > 1.96), significant decrease (β < −0.0005, |Z| > 1.96), non-significant increase (β > 0.0005, |Z| < 1.96) at a 0.05 confidence level, non-significant decrease (β < −0.0005, |Z| < 1.96) at a 0.05 confidence level, and stable (−0.0005 < β < 0.0005).

2.3.2. Partial Correlation Analysis

From 2000 to 2019, the correlations between NDVI, temperature, and precipitation were investigated using partial correlation analysis. With a confidence level of 0.05, the partial correlation analysis t-test was calculated. The calculation formula is as follows:
r a b = i = 1 n ( x i x ¯ ) ( y i y ¯ ) i = 1 n ( x i x ¯ ) 2 i = 1 n ( y i y ¯ ) 2
where n is the number of years, and xi and yi are the value of the independent variables x and y in the ith year, respectively. x ¯ and y ¯ are the means of the values of the independent variables x and y for the study period.

2.3.3. Hurst Exponent Method

In this paper, future trends in vegetation change were predicted using the Hurst exponent method and TS trend analysis [62]. The Hurst index (H) is a measure of the long-term dependence of a time series and is usually computed by rescaled range (R/S) analysis [63,64]. Future trends were expected to be the inverse of historical trends when the Hurst exponent H was between 0 and 0.5. The estimated future trend coincided with the historical pattern when H was in the range of 0.5 and 1. Stronger continuity was suggested by H closer to 1, while stronger discontinuity was indicated by H closer to 0 [57]. The long-term dependency of the time series when H = 0.5 may be reflected by the rescaled range (R/S) analysis, which was established by Hurst in the middle of the 20th century. The time series data were a mutually independent random series with uncertain future trends.

2.3.4. Residual Analysis

Residual analysis provides a standard method for separating the effects of different drivers on a target variable. The basic idea began with building a statistical model that predicted NDVI using primary natural drivers including temperature and precipitation. This model was then used to predict the NDVI values attributable solely to these climate variables. The difference between the observed NDVI and the predicted NDVI constituted the residual series, representing NDVI changes not accounted for by the climate model. A trend analysis, employing Theil–Sen/MK methods, was then applied to these residuals. In this research, residual analysis served to quantitatively isolate the relative contributions of climate change versus human activities to NDVI dynamics. Assuming that temperature and precipitation were the main natural drivers, the residual trend was interpreted as the net effect of human activities on vegetation. Positive residual trends implied human activities enhanced vegetation growth relative to climatic expectations, whereas negative trends suggested the human-induced inhibition of vegetation growth [65].
Seven levels of individual activity-induced plant NDVI impacts were identified according to the NDVI residuals: Significant inhibition, Moderate inhibition, Slight inhibition, Basically no impact, Slight promotion, Moderate promotion, and Significant promotion [66] (Table 1).

3. Results

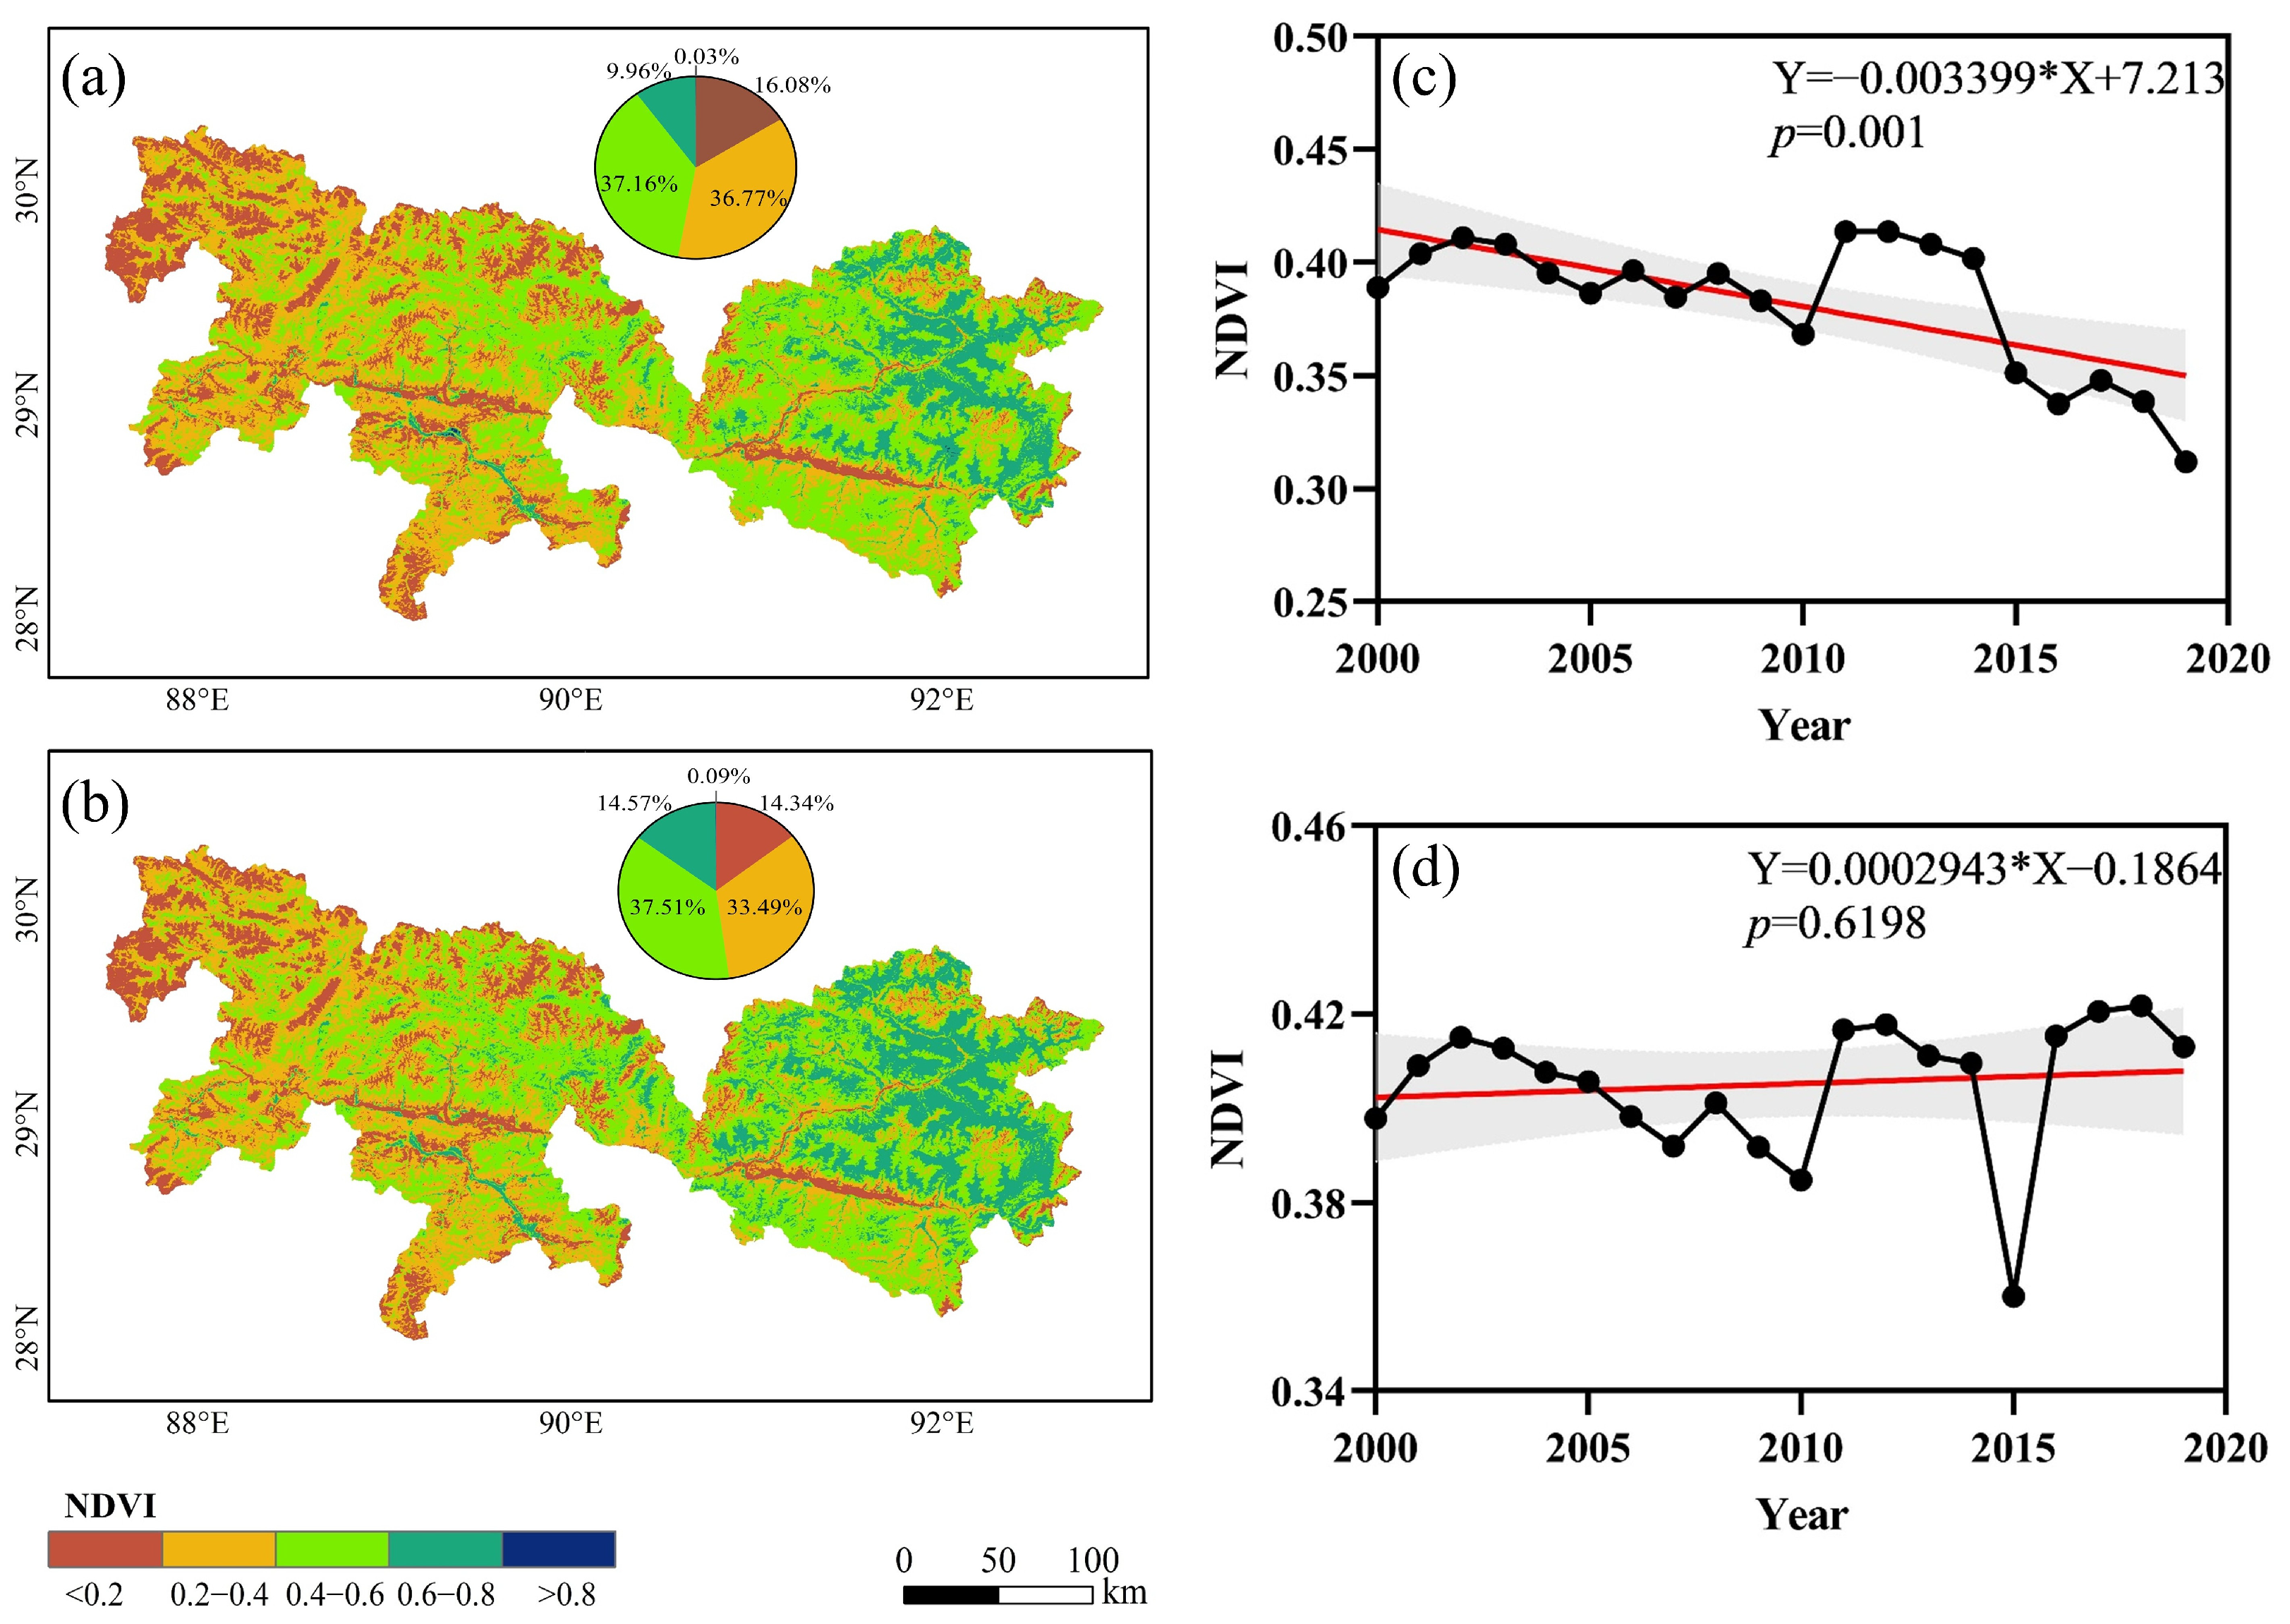
3.1. Spatiotemporal Changes in Vegetation Dynamics

Spatially, the multi-year average vegetation NDVI showed a clear pattern of higher values in the east decreasing towards the west for both summer (Figure 2a) and the growing season (Figure 2b). This spatial distribution highly coincided with the spatial distribution patterns of precipitation, confirming that moisture was the key factor limiting the growth of vegetation in the region. The NDVI in the majority of land areas ranged from 0.2 and 0.6 (73.93% for summer and 71% for the growing season).
Temporally, the basin-average summer NDVI showed a significant decreasing trend (p = 0.001) from 2000 to 2019 with an average NDVI of 0.41 (Figure 2c), while the growing season NDVI exhibited no significant overall trend (p = 0.6198) with an average NDVI of 0.53 (Figure 2d). This variability in summer and growing season NDVI trends highlighted the complexity of analyzing only a single time period, such as the annual average and summer, which may not fully capture vegetation dynamics, and that trends during the growing season, a critical period for vegetation activity, may be affected by a combination of changes in different months or phenological periods, resulting in an overall trend that is not significant. In particular, the growing season NDVI declined until 2010 and then remained almost constant except for in 2015, suggesting that there may be drivers like climatic fluctuations or anthropogenic intervention policies that changed over the study period.
There were strong spatial patterns of change trends in the vegetation NDVI for both summer and the growing season (Figure 3). Quantitively, the summer NDVI, in more than 80% of land areas, experienced a decreasing trend, with 31.66% reaching a significant level (Table 2) which widely distributed in the study areas. This suggested that the decline of vegetation during the summer months is a generalized phenomenon. However, the NDVI increased in about 50% of the land area during the growing season and remained stable in 18.45% of the land area. These areas were mainly located along the Yarlung Tsangpo, Lhasa, and Nianchu rivers.
The average Hurst index of the research area varied from 0.088 to 0.911 with an average of 0.45 for summer and varied from 0.098 to 0.978 with an average of 0.54 for the growing season. The Hurst index, in more than 76% of land areas, was lower than 0.5 (Figure 4a), indicating an inverse to the historical trends, while more than 23% of the land area remained consistent with historical trends (Figure 4b and Table 3).

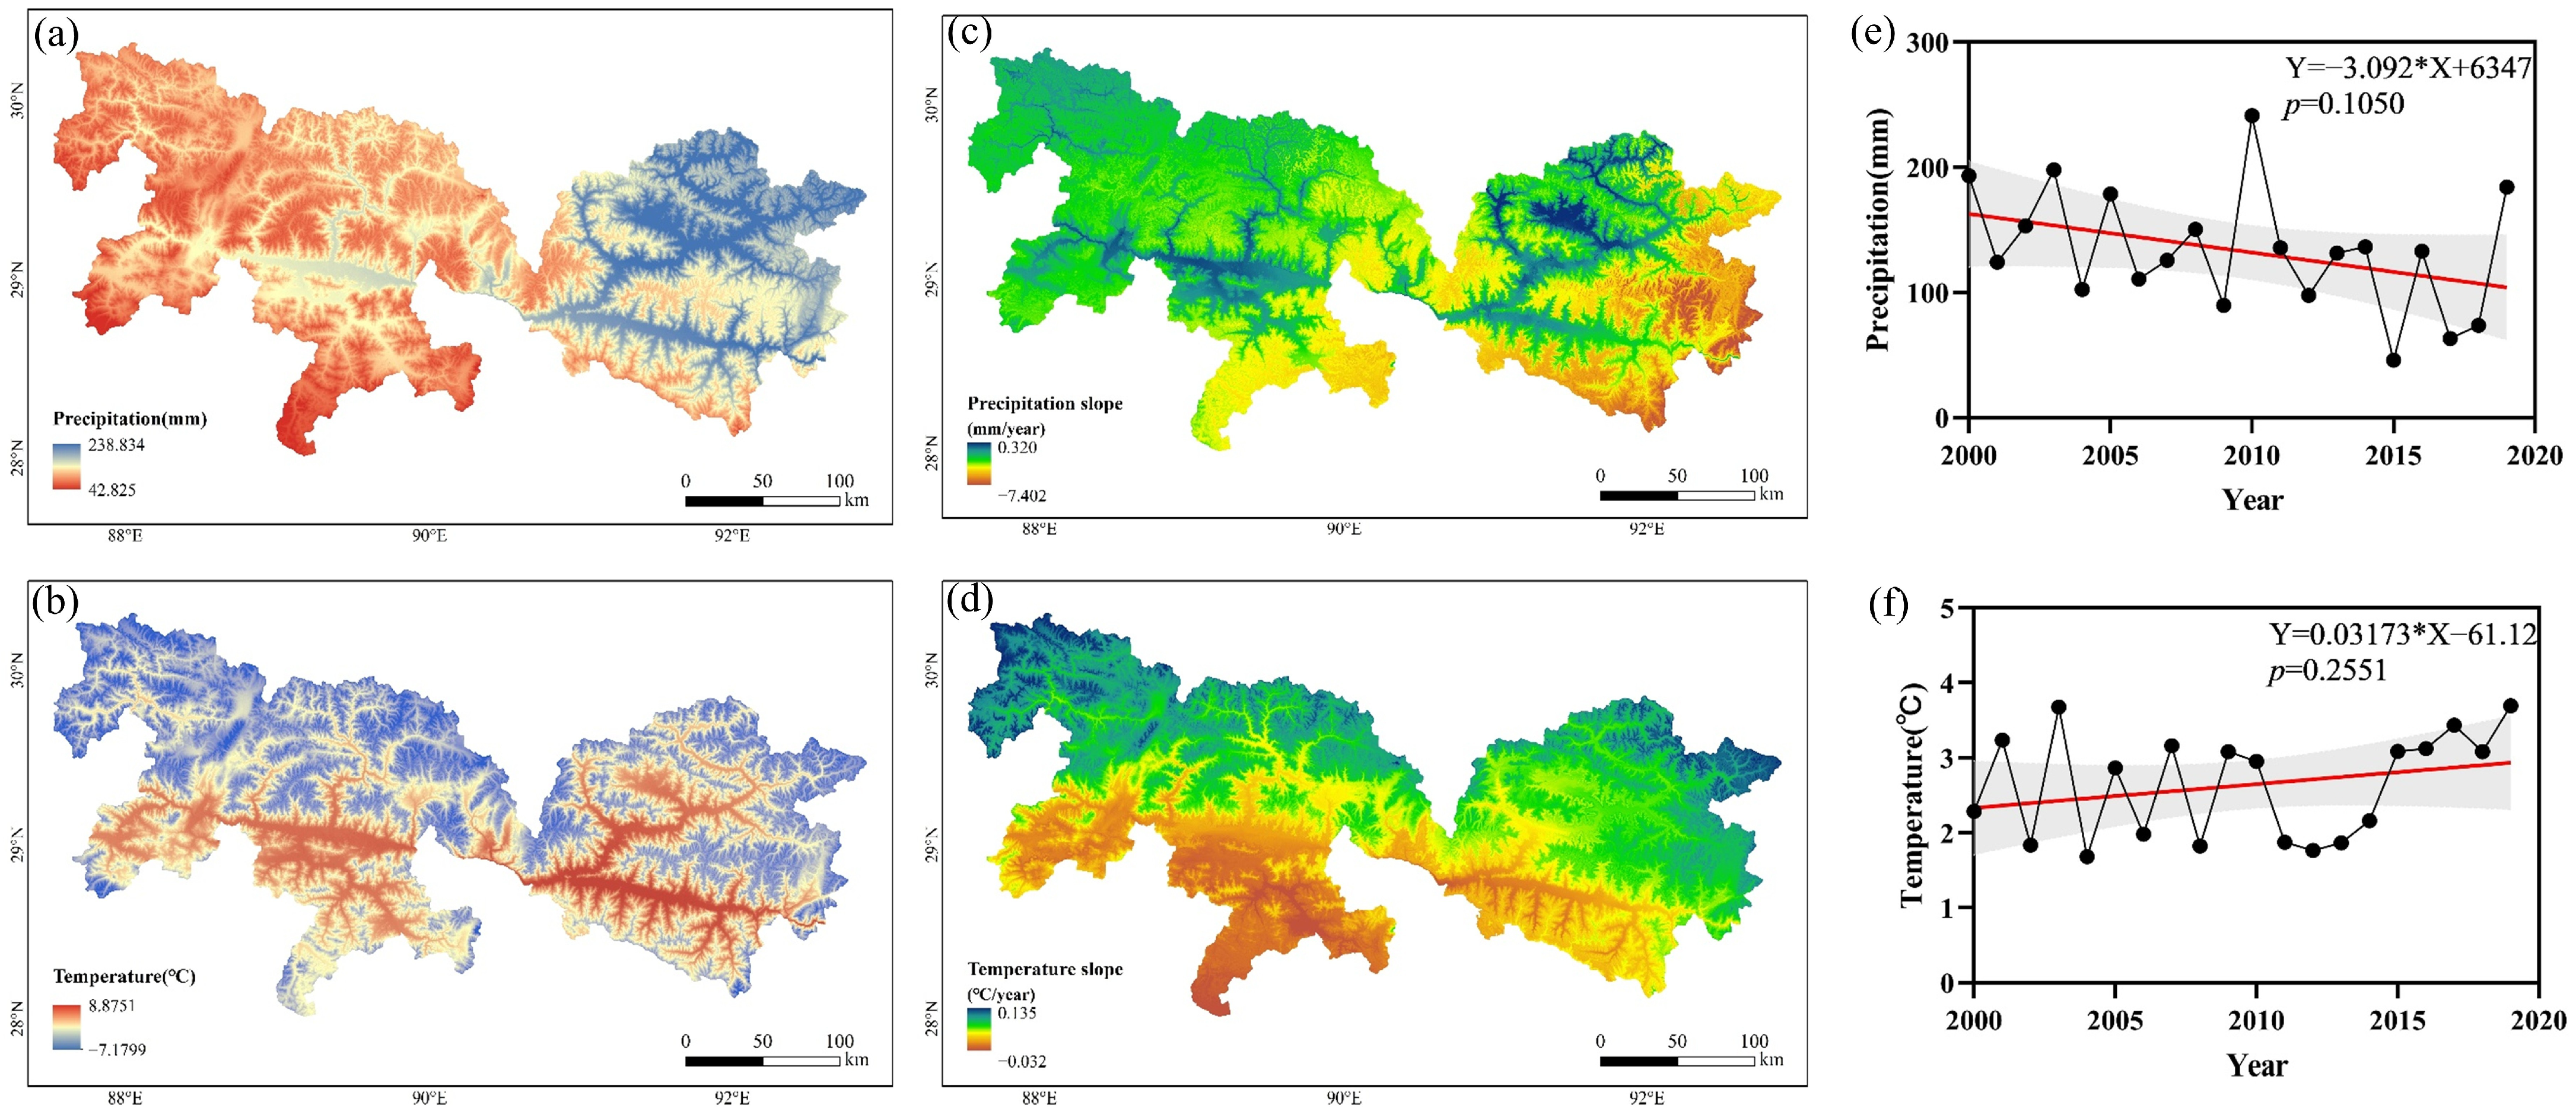
3.2. Changing Trends of Climatic Factors

The YLN Basin exhibits a significant diversity of climate zones that is strongly associated with elevation. These zones transition from subtropical conditions in the downstream areas to temperate and subarctic zones in the midstream reaches, culminating in alpine climates at the highest elevations [67]. This climatic gradient is a primary driver of vegetation distribution. Annual precipitation within the basin displays a pronounced spatial pattern, with downstream eastern regions receiving significantly higher amounts (>2000 mm) compared to the upstream western regions (around 200 mm) (Figure 5a) [68]. This marked spatial differentiation in precipitation directly influences regional water availability, subsequently shaping the east–west differences in vegetation types. The overall precipitation trend showed a slight decrease (Figure 5c,e), and evidence suggests an intensification of drought conditions since the early 21st century [69], indicating complex hydroclimatic variability within the basin. The majority of the basin’s rainfall was concentrated in the summer months, consistent with the influence of the Indian Summer Monsoon [70]. This seasonal precipitation pattern dictates the timing of vegetation growth and water availability. The air temperature generally decreased from the southeast to the northwest across the basin (Figure 5b). Furthermore, the temperature consistently decreased with increasing elevation. This vertical temperature gradient is a fundamental factor controlling vegetation types and their productivity. Temperature trends from 2000 to 2019 indicated no significant overall trend across the entire YLN Basin, although a significant increase was observed between 2012 and 2019 (Figure 5f).

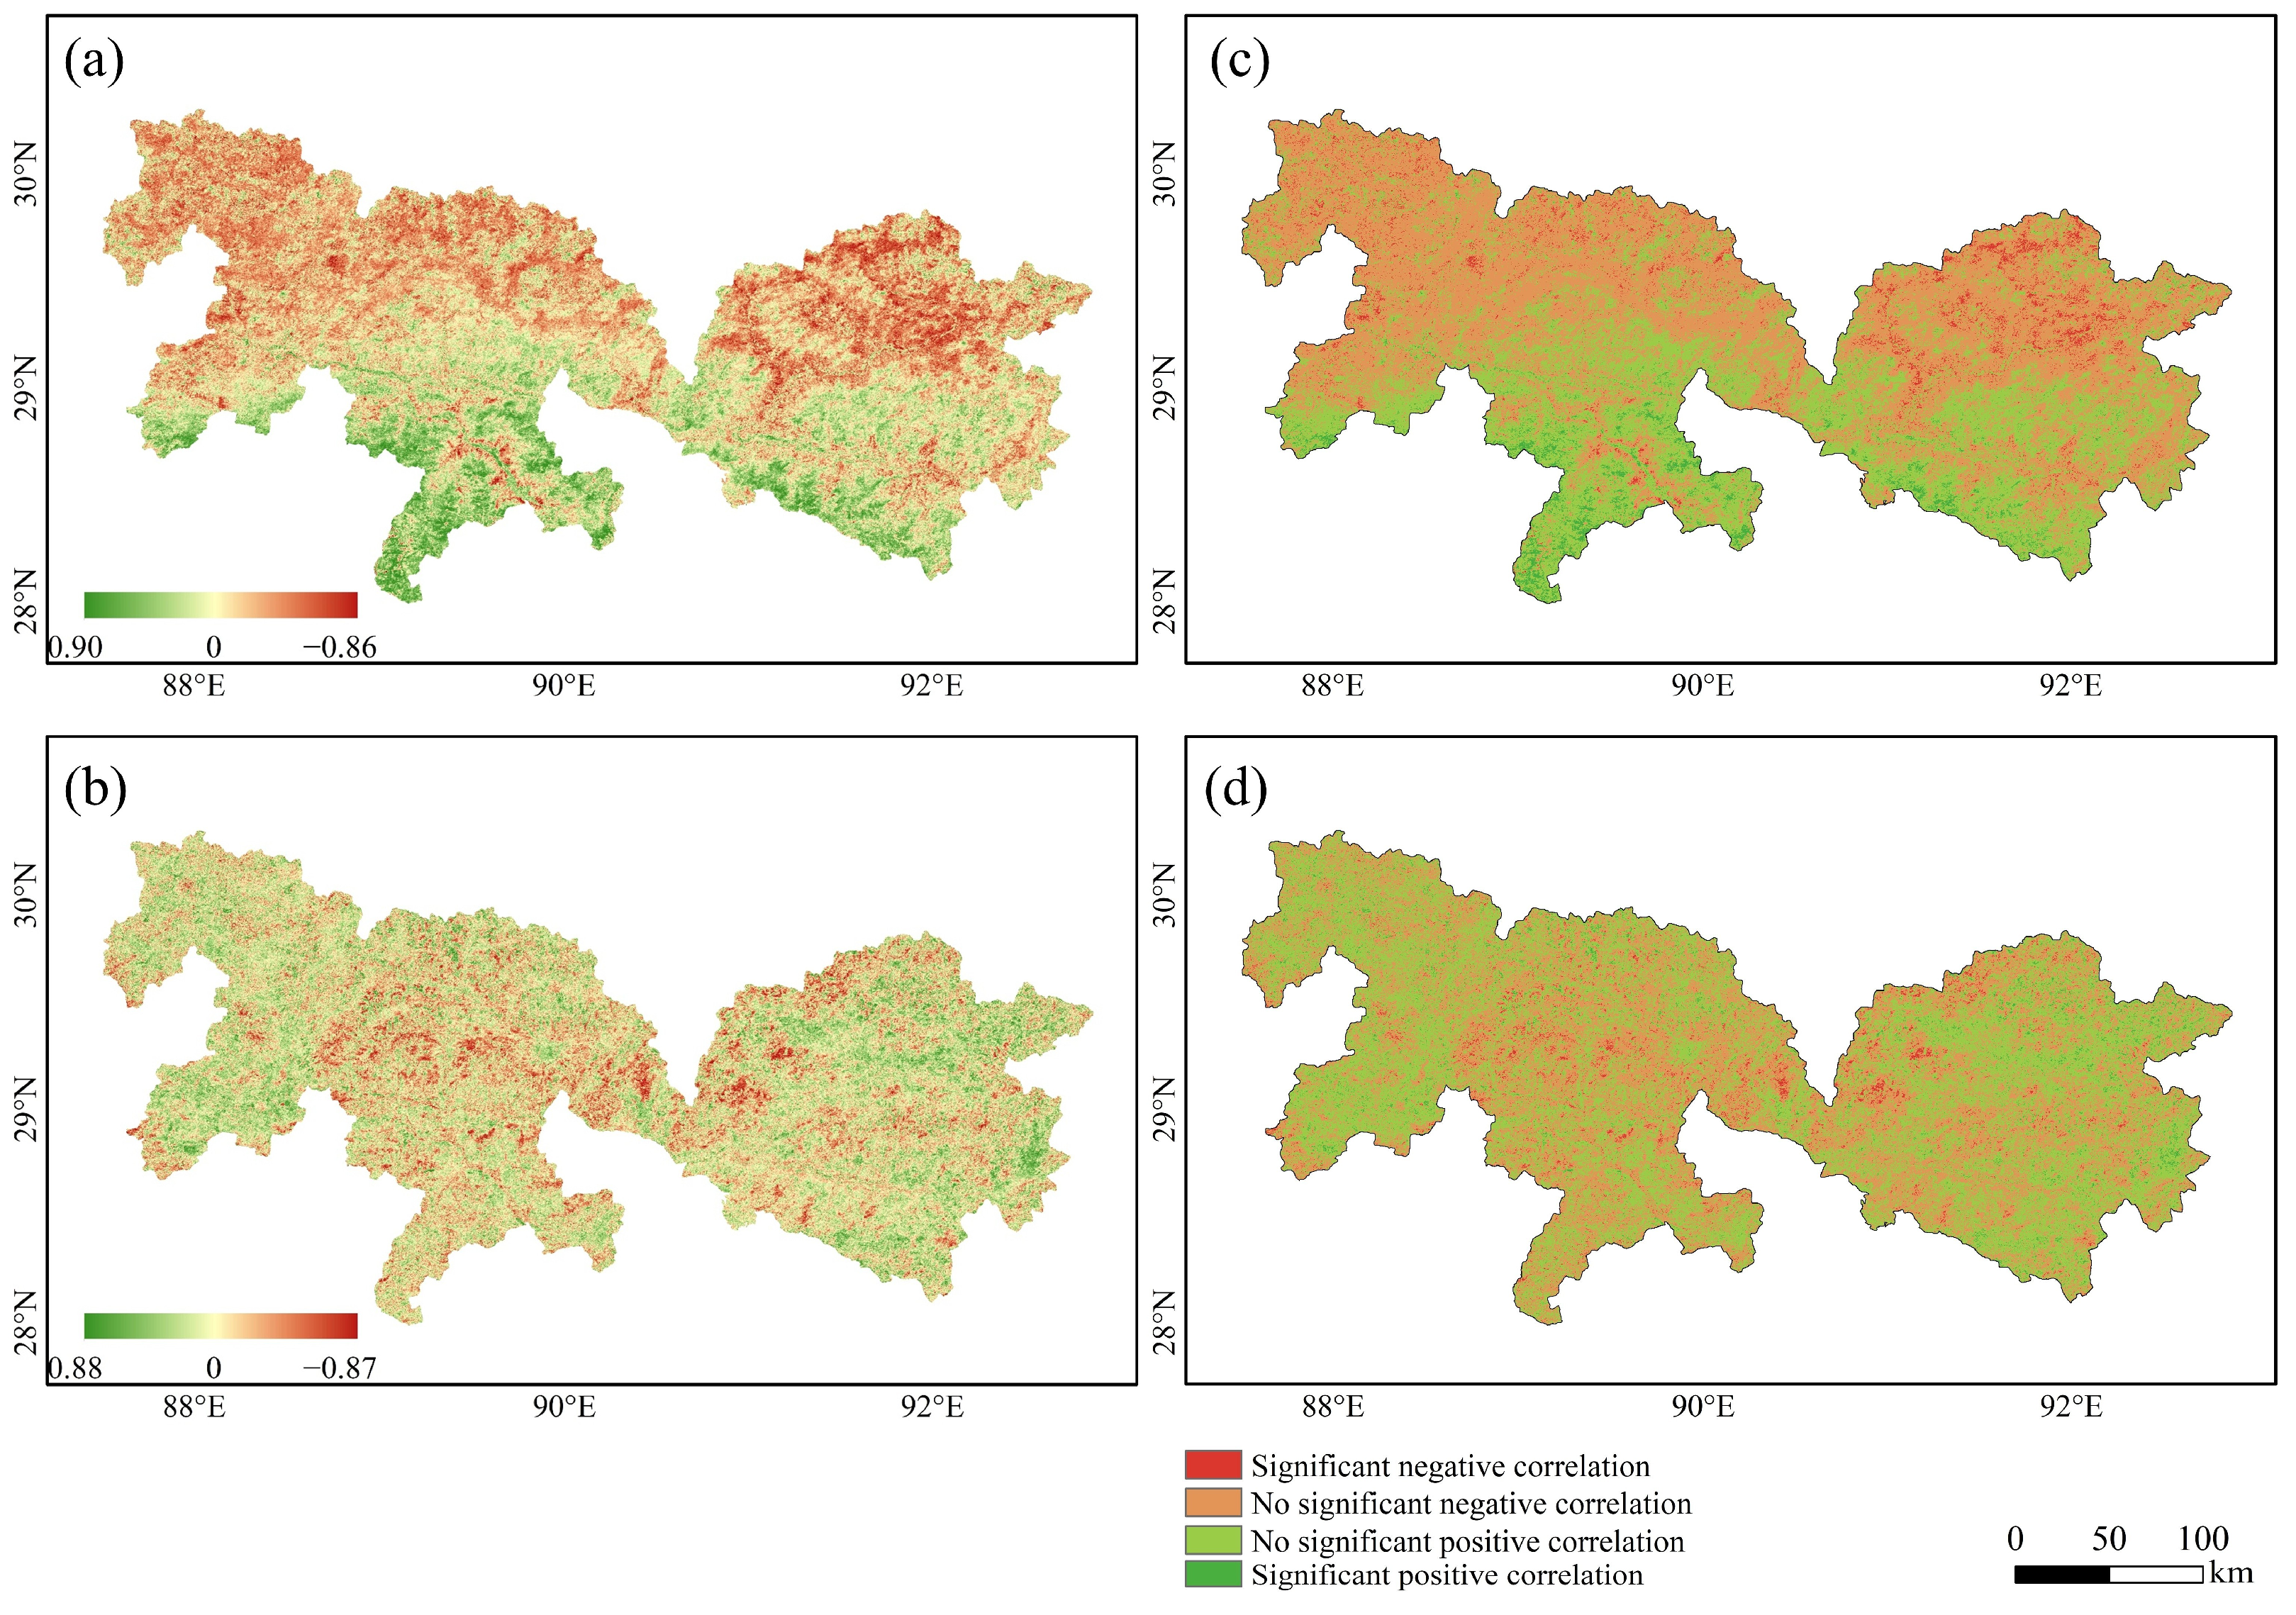
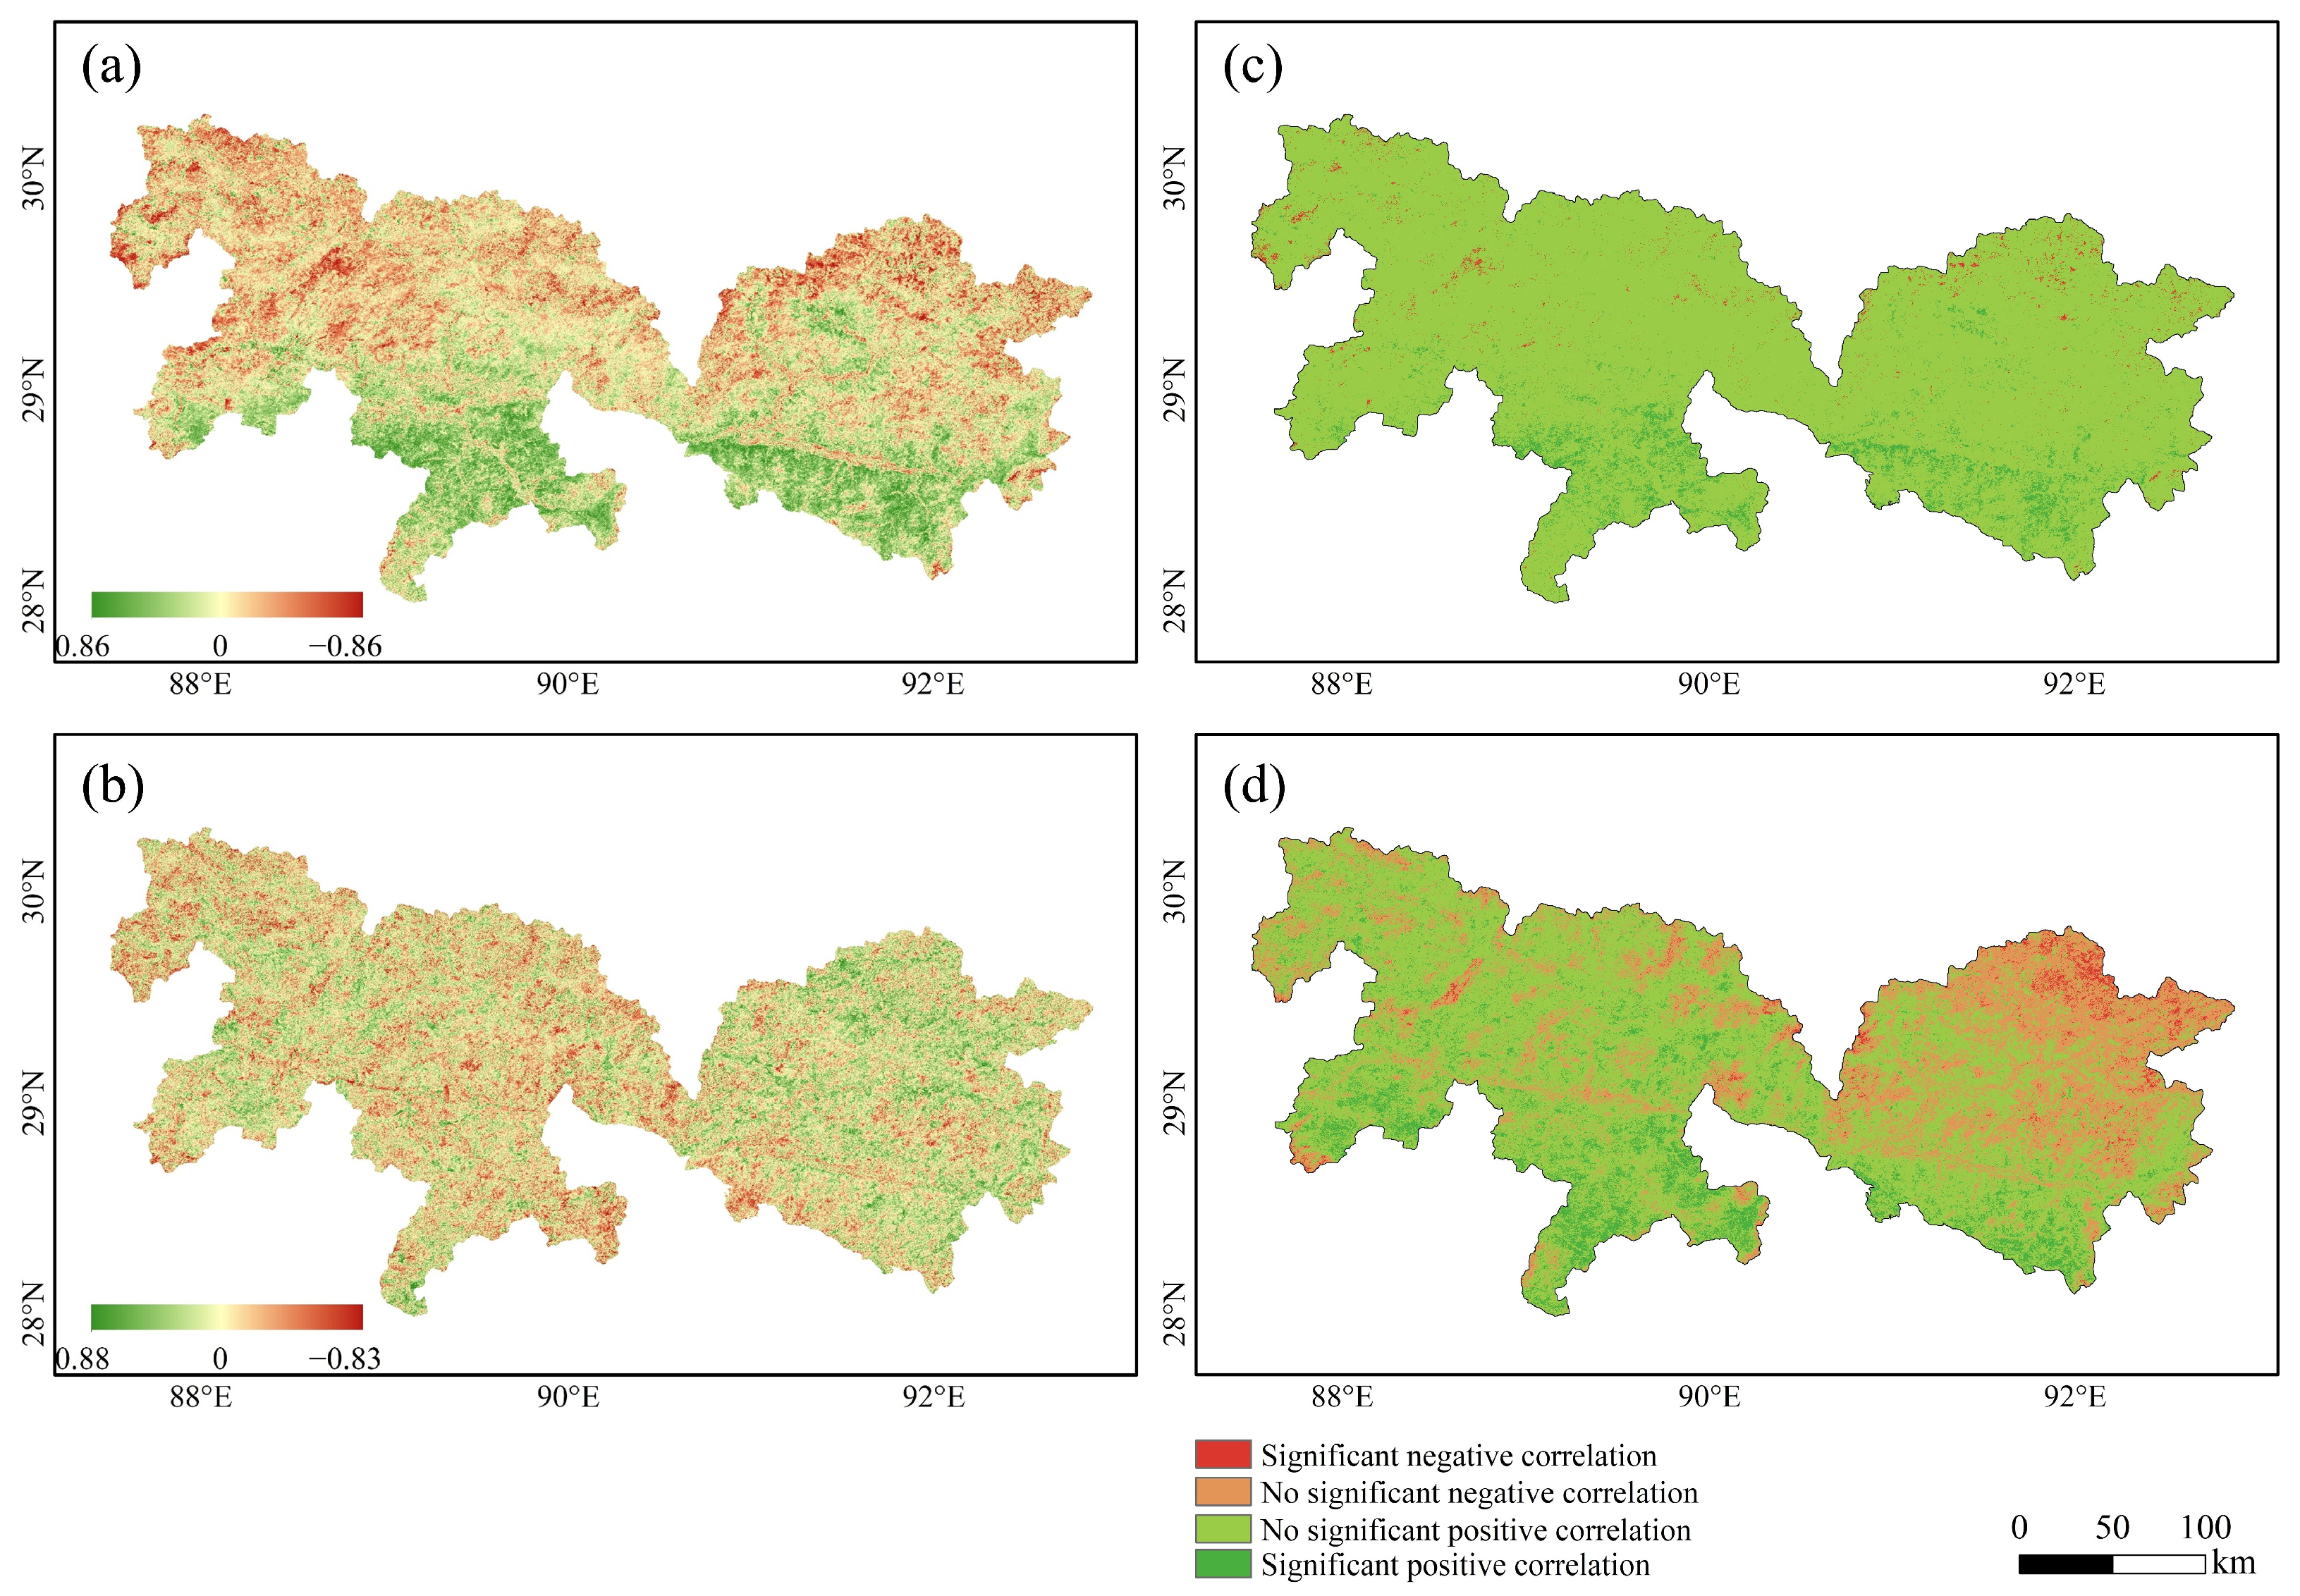
3.3. NDVI Responses to Temperature and Precipitation

The correlation coefficients between the NDVI and temperature varied between −0.86 and 0.90 in summer and between −0.87 and 0.88 in the growing season. Spatially, positive correlations were widespread, particularly during the growing season where over 50% of the area showed a positive relationship (Figure 6d, Table 4), although significant positive correlations were less common. This suggested that, where other factors like water availability are not limiting, increased accumulated temperature can indeed promote vegetation’s photosynthetic activity and growth. However, the northern part of the study area showed the strongest negative correlation between the summer NDVI and temperature (about 40% negatively correlated, Figure 6a, Table 4), while the central and southern parts of the study area showed the largest negative correlation (about 53% negatively correlated, Figure 6c, Table 4) during the growing season. This negative correlation, especially during the growing season, may reflect the fact that increased evapotranspiration accompanying higher temperatures may exacerbate water stress over a range of temperatures, especially in the areas or periods of relatively deficient precipitation, thereby inhibiting vegetation growth.
Similarly, the correlation values for precipitation throughout the growing season with the summer NDVI ranged from −0.86 to 0.86 and from −0.83 to 0.88 with the growing season NDVI. Crucially, precipitation showed a predominantly positive correlation with the NDVI across the basin. The summer NDVI was positively correlated with precipitation for an overwhelming 93.35% of the study area, which was widely distributed (Figure 7a,b; Table 4). The growing season NDVI was positively correlated with precipitation for more than 62% of the land area and was widely distributed over the study area except in the northeast (Figure 7c,d; Table 4). This result strongly suggested that precipitation, representing water availability, is the main positive climatic factor driving vegetation growth and determining vegetation greenness in this predominantly semi-arid region, especially during the relatively dry summer and across most of the growing season. Improved moisture availability generally promoted vegetation greenness. The growing season NDVI was negatively correlated with precipitation in the rest of the region (about 28%, Table 4), mainly in the northeastern part of the study area (Figure 7c,d). This may have occurred in specific alpine and high humidity environments where excess precipitation leads to excessively wet soil, reduced insolation, or coupling with low temperatures that are detrimental to vegetation growth.

3.4. The Impact of Human Activities on the Vegetation NDVI

In addition to climate, vegetation in the YLN Basin was also influenced by human activities. Multiple regression residual trend analysis showed that human activities had a significant and spatially variable influence on the vegetation NDVI (Figure 8). This suggests that on top of the climatic context, human activities have become another key force shaping vegetation patterns and dynamics in the region, and that their impacts are not unidirectional, but rather facilitative and inhibitory. The vegetation NDVI was suppressed by human activities in 43% of the land areas during the summer and 39% during the growing season (Figure 8). Of this, 22.2% of the land area was significantly suppressed during the summer and 13.2% during the growing season, and these areas were primarily located in the northern portion of the study area. The significantly suppressed areas in the north may be related to the high intensity of grazing activities, especially in the summer pastures, where excessive gnawing and trampling exceeded the carrying capacity of the grassland. In addition, some infrastructure construction or resource development activities may also lead to vegetation destruction. The vegetation NDVI on about 50% of the land areas during the summer and the growing season was promoted by human activities. However, the vegetation NDVI in 27% of the summer and 18% of the growing season land areas was significantly promoted by human activities. These areas were usually located on the banks of rivers. The significant contribution on both sides of the river likely reflected the effectiveness of ecological restoration projects, such as reforestation, fallowed land and grassland, as well as active anthropogenic interventions such as irrigated agriculture and rational land management, which were more pronounced in the river valleys where hydrothermal conditions were relatively favorable.

4. Discussion

4.1. Spatiotemporal Patterns of NDVI

Spatially, the vegetation NDVI in the YLN Basin showed a decreasing pattern from east to west during both the summer and growing seasons, which was consistent with the climatic pattern of the YLN Basin. Climatic conditions, especially higher precipitation (Figure 2, Figure 3 and Figure 5) was more favorable for plant growth in the east compared to the west, confirming that moisture was one of the dominant factors influencing vegetation distribution patterns across the Tibetan Plateau [71,72]. However, one of the key findings of this study was the significant difference between the summer and the growing season NDVI trends: the summer NDVI showed a clear downward trend during the study period, while the growing season NDVI did not show a consistent temporal change [73]. This finding not only contrasted with the overall greening trend of the Tibetan Plateau reported in some studies but also highlighted the high spatial heterogeneity of vegetation response in the context of global climate change [57]. More importantly, it emphasized that relying only on annual or single seasonal NDVI values may not be able to fully capture the complexity of the plateau ecosystem’s response to environmental change, and highlighted the need for multi-seasonal or higher temporal resolution analyses, as interannual or single-seasonal averages may mask critical intra-seasonal dynamics and interannual variability [38]. We attributed this difference in seasonal trends in part to the variability of precipitation within the study area (Figure 5), i.e., fluctuating or decreasing trends in precipitation over the study period had a more direct negative impact on summer vegetation growth, which was more dependent on in-seasonal moisture inputs.

4.2. Effects of Climate on Vegetation NDVI

In the context of global climate change, the annual precipitation in the study area showed a slight decrease in fluctuation (Figure 5), while the mean annual temperature showed no significant trend (Figure 5), which was different from some macro-trends of “warming and humidification” in the Tibetan Plateau [74]. The bias correlation analysis further confirmed that precipitation was the key limiting climatic factor in regulating vegetation growth in the YLN Basin. The positive correlation between NDVI and precipitation for more than 90% of the summer season and more than 60% of the growing season (Figure 7 and Table 4) clearly indicated that water availability was a fundamental constraint in determining vegetation growth in the region [75]. In contrast, the effect of temperature on the NDVI showed a more complex seasonal pattern. More than 60% of the regional NDVI was positively correlated with temperature in the summer, while this proportion dropped to about 47% in the growing season (Figure 6 and Table 4). This suggested that in the summer, when water was relatively abundant and the hydrothermal conditions are good, the increase in temperature promoted the photosynthesis and growth of vegetation, while in the whole scale of the growing season, the limitation of water was more prominent, and the effect of temperature was relatively weaker. Comparison of the present results with other high-elevation or arid and semi-arid regions revealed both regional commonalities and differences: compared with the Qilian Mountains in northwestern China, the latter had a decrease in NDVI at lower elevations due to decreasing precipitation and increasing temperatures, and an increase at higher elevations driven mainly by increasing temperatures [76]. This contrasts with the positive “precipitation-NDVI” relationship that prevailed over much of the YLN Basin, and highlights that even within similar highland environments, the dominant control of vegetation by climatic factors may vary depending on the region-specific hydrothermal mix and altitudinal gradient. In contrast to Nepal, another Himalayan country, there was also a significant positive correlation between the NDVI and temperature in some parts of the country, which was consistent with the findings in the YLN Basin. However, the NDVI was negatively correlated with rainfall in some parts of Nepal [38], which was different from the positive “rainfall-NDVI” relationship prevailing in the YLN Basin. Such differences may suggest regional differences in rainfall patterns such as intensity, frequency, soil water-holding capacity, or the adaptation strategies of vegetation types to water stress. Considering that the southwestern Tibetan Plateau was likely to face “warmer and drier” climate conditions in the future [72,77], sustained warming accompanied by reduced or more volatile precipitation may increase the risk of drought [78]. This risk will pose a serious challenge to the vegetation in the YLN basin, where moisture was the main limiting factor, and may inhibit growth or even exacerbate desertification. Therefore, future regional development and ecological conservation strategies need to fully consider the water resource challenges posed by climate change, like by promoting water-saving agriculture practices, improving irrigation systems, or developing adaptive management measures, to mitigate the impacts of potential droughts and maintain ecosystem stability and productivity.

4.3. The Effects of Human Activities on Vegetation Growth

Our study found both favorable (~50% of the land area) and deleterious (43%) effects of anthropogenic activities on the vegetation NDVI (Figure 8), a finding that was similar to previous studies [79] and suggested that anthropogenic activities have had a profound impact on vegetation dynamics in the YLN Basin. The analysis of anthropogenic-specific indicators (Figure 9) provided a deeper perspective for understanding this dual impact.
On the one hand, positive human impacts, promoting vegetation growth, were observed in approximately half of the study area. Figure 9a showed that forested areas from ecological restoration projects increased significantly since 2000 (from 965 km2 to 2019 km2) [80], while grassland restoration projects implemented around 2007 also contributed to vegetation growth [81]. This was highly consistent with our finding that the areas of significant NDVI promotion observed in Figure 8 (especially reaching 27% in the summer and 18% in the growing season) were mainly distributed in the riverine areas. This suggested that targeted artificial vegetation restoration measures, such as reforestation and grassland rehabilitation, were a key positive factor driving vegetation improvement in specific locations. Furthermore, as noted in our initial results, the stability or increase in the NDVI observed along the Yarlung Tsangpo, Lhasa, and Nianchu rivers during the growing season (Figure 4b,d) likely reflects the benefits derived from these ecological restoration efforts, potentially combined with active anthropogenic interventions such as irrigated agriculture and rational land management, which are more pronounced and effective in the river valleys where hydrothermal conditions are relatively favorable.
On the other hand, the equally significant areas of NDVI suppression in Figure 8 (22.2% in summer and 13.2% in the growing season), especially in the northern portion of the study area, reflected ongoing anthropogenic pressures. Although the total number of livestock (fitted by LOWESS) shown in Figure 9b fluctuated overall but did not show a sharp increase during the study period, considering the fragility of alpine meadow ecosystems, even the existing grazing intensity, especially intensive grazing in summer and the growing season [82], may exceed the carrying capacity of some areas, leading to vegetation degradation [83]. This was consistent with the significant suppression we observed in the northern rangelands. More importantly, Figure 9c,d clearly demonstrate the continued population growth during the study period (from about 1.87 million in 2000 to 3.1 million in 2019) which was a significant proportion of the total population of Tibet [84], as well as the rapid expansion of impervious surface area (from 62 km2 in 2000 to 360 km2 in 2020) [85]. Not only did population growth directly increase the demand for natural resources and intensify land-use pressures, but also rapid urbanization and infrastructure development led to the direct loss of vegetation and changes in the nature of the land surface. This is in comparison with the Lake Tahoe region of Sierra Nevada, USA, which is also an alpine environment and faces environmental pressures from rapid tourism development, population growth and settlement expansion, which are already having an impact on its vegetation cover [86]. This example provides a cautionary analogy of the possible ecological consequences of a growing population and development pressures in the YLN Basin.
Taken together, Figure 9 reveals the inherent complexity of anthropogenic impacts in the YLN Basin: active ecological restoration measures coexist with negative pressures such as continued grazing pressure, a growing population, and land use/land cover changes driven by them. The spatial pattern of the NDVI changes observed in Figure 8 was in fact a combination of these different directions and intensities of human activities interacting and superimposing on each other spatially, and were moderated by local climatic conditions, especially moisture limitation [87,88]. This remarkable heterogeneity and complexity of anthropogenic impacts highlights the need to implement more refined, spatialized, and typological management measures when formulating regional sustainable development and ecological conservation strategies in the future. The focus of future management should be on consolidating and expanding ecological restoration gains, as well as targeting the identification and mitigation of anthropogenic disturbance pressures caused by high-intensity grazing and rapid urbanization. At the same time, adaptation to climate change must be integrated into long-term planning to synergistically promote the overall stability and resilience of regional ecosystems.

4.4. Limitations and Prospects

Although this study provided valuable insights into understanding vegetation dynamics and its drivers in the YLN Basin, a few limitations still existed. The MODIS NDVI data used in this study had a spatial resolution of 250 m. Although suitable for regional-scale analysis, the data may not have been able to capture vegetation changes at smaller scales and finer details, especially in areas with complex topography or highly fragmented land use. Future studies may try to integrate higher resolution remote sensing data for nested analysis to reveal more microscopic details of vegetation dynamics. The NDVI suffered from saturation problems in areas with high vegetation cover, which may have underestimated the actual greenness of the most lushly vegetated areas. In addition, the NDVI is sensitive to soil background and atmospheric conditions. In the future, other vegetation indicators that more directly reflect the photosynthetic activity of vegetation, such as solar-induced chlorophyll fluorescence (SIF), can be introduced for comparative validation to improve the accuracy of monitoring. Finally, the residual analysis method, although commonly used, was based on the assumption that the climate impacts and anthropogenic impacts were considered relatively independent and of a linear superposition, which may be an oversimplification in reality. There were complex interactions and feedback mechanisms between climate change and human activities. The use of more advanced attribution models could be explored in the future to quantify more precisely the contributions of different drivers.

5. Conclusions

This study systematically examined the spatial and temporal dynamics of the NDVI and its drivers in the YLN Basin on the Tibetan Plateau from 2000 to 2019. It was found that vegetation changes in the basin showed significant seasonal differences, with the NDVI exhibiting a significant downward trend in summer and no overall temporal pattern in the growing season, revealing that vegetation monitoring relying only on a single season or an annual average NDVI may not accurately capture the complex response of plateau ecosystems to environmental changes and highlighting the necessity of seasonal-scale analyses. The partial correlation analysis confirmed that precipitation was the key limiting climatic factor regulating vegetation growth in the region, and its positive effect dominated most of the region, suggesting that moisture availability was the underlying limiting condition across the basin, likely exerting the strongest control in the drier western parts. At the same time, human activities had a significant dual impact on the vegetation NDVI and strong spatial heterogeneity; positive impacts from ecological restoration and potentially agriculture were evident along river valleys, while negative pressures from factors like grazing and urbanization likely influenced other areas, particularly the northern pastoral regions and around settlements. Therefore, the observed spatial and temporal patterns of the vegetation NDVI in the YLN Basin were not the result of a single factor dominating everywhere, but rather a complex outcome of the regional climatic context interacting with these spatially intertwined and superimposed impacts of diverse human activities. In view of this spatial complexity and the combined effects of natural and anthropogenic drivers, future ecological protection and sustainable development strategies must go beyond “one-fits-all” and adopt spatially refined and differentiated management measures, targeting both the consolidation of restoration gains and the mitigation of disturbance pressures in vulnerable areas, while integrating adaptation to climate change into long-term planning to promote the health and resilience of regional ecosystems.

Author Contributions

Conceptualization, C.S., J.L., S.Y. and Y.X.; methodology, C.S. and Y.X.; software, Y.X. and S.Y.; validation, Y.X., S.W. and D.X.; formal analysis, C.S., X.Z. and S.W.; investigation, Y.X.; resources, Y.X., P.P. and T.Z.; data curation, C.S., Y.X., S.Y. and X.Z.; writing—original draft preparation, Y.X., S.Y. and X.T.; writing—review and editing, Y.X., J.L., X.T., D.X. and P.P.; visualization, Y.X., J.L. and S.Y.; supervision, J.L. and P.P.; project administration, J.L.; funding acquisition, J.L. All authors have read and agreed to the published version of the manuscript.

Funding

The research reported in this manuscript was funded by the National Key R&D Program of China (2024YFF1307800, 2024YFF1307804), the National Key R&D Program of China (2023YFC3007103), TianfuYongxing Laboratory Organized Research Project Funding (No. 2023KJGG05), Base and Talent Project of XiZang (XZ202401JD0003) and the Ongoing Engineering Project in Tibet of Huaneng, China (JC2022/D01). We extend gratitude for the data support from the National Tibetan Plateau Data Center, China Meteorological Science Data Sharing Service.

Data Availability Statement

The data used to support the findings of this study are available from the corresponding author upon request.

Acknowledgments

The author thanks the anonymous reviewers for providing invaluable comments on the original manuscript.

Conflicts of Interest

Author Dinghui Xu and Shijun Wang were employed by Huaneng Tibet Yarlung Zangbo River Hydropower Development Investment Co. Ltd. The remaining authors declare that the research was conducted in the absence of any commercial or financial relationships that could be construed as a potential conflict of interest.

References

  1. Cao, M.K.; Woodward, F.I. Dynamic responses of terrestrial ecosystem carbon cycling to global climate change. Nature 1998, 393, 249–252. [Google Scholar] [CrossRef]
  2. Chen, T.; Xia, J.; Zou, L.; Hong, S. Quantifying the Influences of Natural Factors and Human Activities on NDVI Changes in the Hanjiang River Basin, China. Remote Sens. 2020, 12, 3780. [Google Scholar] [CrossRef]
  3. Parmesan, C. Ecological and evolutionary responses to recent climate change. Annu. Rev. Ecol. Evol. Syst. 2006, 37, 637–669. [Google Scholar] [CrossRef]
  4. Piao, S.; Wang, X.; Park, T.; Chen, C.; Lian, X.; He, Y.; Bjerke, J.W.; Chen, A.; Ciais, P.; Tømmervik, H.; et al. Characteristics, drivers and feedbacks of global greening. Nat. Rev. Earth Environ. 2020, 1, 14–27. [Google Scholar] [CrossRef]
  5. Krishnaswamy, J.; John, R.; Joseph, S. Consistent response of vegetation dynamics to recent climate change in tropical mountain regions. Glob. Change Biol. 2014, 20, 203–215. [Google Scholar] [CrossRef] [PubMed]
  6. Rull, V.; Gonzalez-Samperiz, P.; Pablo Corella, J.; Morellón, M.; Giralt, S. Vegetation changes in the southern Pyrenean flank during the last millennium in relation to climate and human activities: The Montcortes lacustrine record. J. Paleolimnol. 2011, 46, 387–404. [Google Scholar] [CrossRef]
  7. Burrell, A.L.; Evans, J.P.; Liu, Y. Detecting dryland degradation using Time Series Segmentation and Residual Trend analysis (TSS-RESTREND). Remote Sens. Environ. 2017, 197, 43–57. [Google Scholar] [CrossRef]
  8. Yuan, Q.; Yuan, Q.; Ren, P. Coupled effect of climate change and human activities on the restoration/degradation of the Qinghai-Tibet Plateau grassland. J. Geogr. Sci. 2021, 31, 1299–1327. [Google Scholar] [CrossRef]
  9. Jin, H.; Chen, X.; Wang, Y.; Zhong, R.; Zhao, T.; Liu, Z.; Tu, X. Spatio-temporal distribution of NDVI and its influencing factors in China. J. Hydrol. 2021, 603, 127129. [Google Scholar] [CrossRef]
  10. Li, T.; Xiong, Q.; Luo, P.; Zhang, Y.; Gu, X.; Lin, B. Direct and indirect effects of environmental factors, spatial constraints, and functional traits on shaping the plant diversity of montane forests. Ecol. Evol. 2020, 10, 557–568. [Google Scholar] [CrossRef]
  11. Feng, H.; Zou, B.; Luo, J. Coverage-dependent amplifiers of vegetation change on global water cycle dynamics. J. Hydrol. 2017, 550, 220–229. [Google Scholar] [CrossRef]
  12. Parmesan, C.; Yohe, G. A globally coherent fingerprint of climate change impacts across natural systems. Nature 2003, 421, 37–42. [Google Scholar] [CrossRef]
  13. Jiang, B.; Liang, S.L.; Jia, A.L.; Xu, J.L.; Zhang, X.T.; Xiao, Z.Q. Validation of the surface daytime net radiation product from version 4.0 GLASS product suite. IEEE Geosci. Remote Sens. Lett. 2019, 16, 509–513. [Google Scholar] [CrossRef]
  14. Tucker, C.J. Red and photographic infrared linear combinations for monitoring vegetation. Remote Sens. Environ. 1979, 8, 127–150. [Google Scholar] [CrossRef]
  15. Huang, S.; Tang, L.; Hupy, J.P.; Wang, Y.; Shao, G.F. A commentary review on the use of normalized difference vegetation index (NDVI) in the era of popular remote sensing. For. Res. 2020, 32, 1–6. [Google Scholar] [CrossRef]
  16. Jiang, L.; Liu, Y.; Wu, S.; Yang, C. Analyzing ecological environment change and associated driving factors in China based on NDVI time series data. Ecol. Indic. 2021, 129, 107933. [Google Scholar] [CrossRef]
  17. Xu, B.N.; Li, J.J.; Liu, Y.G.; Zhang, T.B.; Luo, Z.Y.; Pei, X.J. Disentangling the response of vegetation dynamics to natural and anthropogenic drivers over the Qinghai-Tibet Plateau using dimensionality reduction and structural equation model. For. Ecol. Manag. 2024, 554, 121677. [Google Scholar] [CrossRef]
  18. Xu, B.N.; Li, J.J.; Pei, X.J.; Yang, H. Decoupling the response of vegetation dynamics to asymmetric warming over the Qinghai-Tibet plateau from 2001 to 2020. Environ. Manag. 2023, 347, 119131. [Google Scholar] [CrossRef]
  19. Xu, B.; Li, J.; Pei, X.; Bian, L.; Zhang, T.; Yi, G.; Bie, X.; Peng, P. Dominance of topography on vegetation dynamics in the Mt. Qomolangma National Nature Reserve: A UMAP and PLS-SEM Analysis. Forests 2023, 14, 1415. [Google Scholar] [CrossRef]
  20. Jia, L.; Li, Z.; Xu, G.; Ren, Z.; Li, P.; Cheng, Y.; Zhang, Y.; Wang, B.; Zhang, J.; Yu, S. Dynamic change of vegetation and its response to climate and topographic factors in the Xijiang River basin, China. Environ. Sci. Pollut. Res. 2020, 27, 11637–11648. [Google Scholar] [CrossRef]
  21. Sun, J.; Ye, C.; Liu, M.; Wang, Y.; Chen, J.; Wang, S.; Lu, X.; Liu, G.; Xu, M.; Li, R.; et al. Response of net reduction rate in vegetation carbon uptake to climate change across a unique gradient zone on the Tibetan Plateau. Environ. Res. 2021, 203, 111894. [Google Scholar] [CrossRef]
  22. Wang, X.; Li, Y.; Wang, X.; Li, Y.; Li, Y.; Lian, J.; Gong, X. Temporal and Spatial Variations in NDVI and Analysis of the Driving Factors in the Desertified Areas of Northern China From 1998 to 2015. Front. Environ. Sci. 2021, 9, 633020. [Google Scholar] [CrossRef]
  23. Li, L.; Zhang, Y.; Wu, J.; Li, S.; Zhang, B.; Zu, J.; Zhang, H.; Ding, M.; Paudel, B. Increasing sensitivity of alpine grasslands to climate variability along an elevational gradient on the Qinghai-Tibet Plateau. Sci. Total Environ. 2019, 678, 21–29. [Google Scholar] [CrossRef]
  24. Lamchin, M.; Lee, W.K.; Jeon, S.W.; Jeon, S.W.; Wang, S.W.; Lim, C.H.; Song, C.; Sung, M.J. Long-term trend and correlation between vegetation greenness and climate variables in Asia based on satellite data. Sci. Total Environ. 2018, 618, 1089–1095. [Google Scholar] [CrossRef] [PubMed]
  25. Xu, H.; Wang, X.; Yang, T. Trend shifts in satellite-derived vegetation growth in Central Eurasia, 1982–2013. Sci. Total Environ. 2017, 579, 1658–1674. [Google Scholar] [CrossRef] [PubMed]
  26. Chen, J.; Yan, F.; Lu, Q. Spatiotemporal Variation of Vegetation on the Qinghai-Tibet Plateau and the Influence of Climatic Factors and Human Activities on Vegetation Trend (2000–2019). Remote Sens. 2020, 12, 3150. [Google Scholar] [CrossRef]
  27. Hu, M.Q.; Mao, F.; Sun, H.; Hou, Y.Y. Study of normalized difference vegetation index variation and its correlation with climate factors in the three-river-source region. Int. J. Appl. Earth Obs. Geoinf. 2011, 13, 24–33. [Google Scholar] [CrossRef]
  28. Lin, X.; Niu, J.; Berndtsson, R.; Yu, X.; Zhang, L.; Chen, X. NDVI Dynamics and Its Response to Climate Change and Reforestation in Northern China. Remote Sens. 2020, 12, 4138. [Google Scholar] [CrossRef]
  29. Martinez, B.; Amparo Gilabert, M. Vegetation dynamics from NDVI time series analysis using the wavelet transform. Remote Sens. Environ. 2009, 113, 1823–1842. [Google Scholar] [CrossRef]
  30. Pouliot, D.; Latifovic, R.; Olthof, I. Trends in vegetation NDVI from 1km AVHRR data over Canada for the period 1985–2006. Int. J. Remote Sens. 2009, 30, 149–168. [Google Scholar] [CrossRef]
  31. Li, L.; Zhang, Y.; Liu, L.; Wu, J.; Wang, Z.; Li, S.; Zhang, H.; Zu, J.; Ding, M.; Paudel, B. Spatiotemporal patterns of vegetation greenness change and associated climatic and anthropogenic drivers on the Tibetan Plateau during 2000–2015. Remote Sens. 2018, 10, 1525. [Google Scholar] [CrossRef]
  32. Sun, W.C.; Wang, Y.Y.; Fu, Y.H.; Xue, B.L.; Wang, G.Q.; Yu, J.S.; Zuo, D.P.; Xu, Z.X. Spatial heterogeneity of changes in vegetation growth and their driving forces based on satellite observations of the Yarlung Zangbo River basin in the Tibetan plateau. J. Hydrol. 2019, 574, 324–332. [Google Scholar] [CrossRef]
  33. Fan, Z.; Fan, B. Shifts of the Mean Centers of Potential Vegetation Ecosystems under Future Climate Change in Eurasia. Forests 2019, 10, 873. [Google Scholar] [CrossRef]
  34. Zhang, Y.; Zhu, Z.; Liu, Z.; Zeng, Z.; Ciais, P.; Huang, M.; Liu, Y.; Piao, S. Seasonal and interannual changes in vegetation activity of tropical forests in Southeast Asia. Agric. For. Meteorol. 2016, 224, 1–10. [Google Scholar] [CrossRef]
  35. Chen, A.; He, B.; Wang, H.; Wang, H.; Huang, L.; Zhu, Y.; Lv, A. Notable shifting in the responses of vegetation activity to climate change in China. Phys. Chem. Earth 2015, 87, 60–66. [Google Scholar] [CrossRef]
  36. Piao, S.; Yin, G.; Tan, J.; Cheng, L.; Huang, M.; Li, Y.; Liu, R.; Mao, J.; Mynei, R.; Peng, S.; et al. Detection and attribution of vegetation greening trend in China over the last 30 years. Glob. Change Biol. 2015, 21, 1601–1609. [Google Scholar] [CrossRef] [PubMed]
  37. Hostert, P.; Kuemmerle, T.; Prishchepov, A.; Sieber, A.; Lambin, E.; Radeloff, V. Rapid land use change after socio-economic disturbances: The collapse of the Soviet Union versus Chernobyl. Environ. Res. Lett. 2011, 6, 45201. [Google Scholar] [CrossRef]
  38. Li, D.; Luo, H.; Hu, T.; Shao, D.; Cui, Y.; Khan, S.; Luo, Y. Identification of the Roles of Climate Factors, Engineering Construction, and Agricultural Practices in Vegetation Dynamics in the Lhasa River Basin, Tibetan Plateau. Remote Sens. 2020, 12, 1883. [Google Scholar] [CrossRef]
  39. Liu, C.; Li, W.; Wang, W.; Zhou, H.; Liang, T.; Hou, F.; Xu, J.; Xue, P. Quantitative spatial analysis of vegetation dynamics and potential driving factors in a typical alpine region on the northeastern Tibetan Plateau using the Google Earth Engine. Catena 2021, 206, 105500. [Google Scholar] [CrossRef]
  40. Zhang, Y.; He, N.; Liu, Y. Temperature factors are a primary driver of the forest bryophyte diversity and distribution in the southeast Qinghai-Tibet Plateau. For. Ecol. Manag. 2023, 527, 120610. [Google Scholar] [CrossRef]
  41. Li, S.; Wu, J.; Gong, J.; Li, S. Human footprint in Tibet: Assessing the spatial layout and effectiveness of nature reserves. Sci. Total Environ. 2018, 621, 18–29. [Google Scholar] [CrossRef] [PubMed]
  42. Nan, C.; Shen, M.; Yang, W.; Yang, Z.; Zhang, G.; Piao, S. Varying responses of vegetation activity to climate changes on the Tibetan Plateau grassland. Int. J. Biometeorol. 2017, 61, 1433–1444. [Google Scholar] [CrossRef]
  43. Cai, H.; Yang, X.; Xu, X. Human-induced grassland degradation/restoration in the central Tibetan Plateau: The effects of ecological protection and restoration projects. Ecol. Eng. 2015, 83, 112–119. [Google Scholar] [CrossRef]
  44. Zhao, H.; Liu, S.; Dong, S.; Su, X.; Wag, X.; Wang, X.; Wu, L.; Zhang, X. Analysis of vegetation change associated with human disturbance using MODIS data on the rangelands of the Qinghai-Tibet Plateau. Rangel 2015, 37, 77–87. [Google Scholar] [CrossRef]
  45. Zhong, L.; Ma, Y.; Xue, Y.; Piao, S. Climate Change Trends and Impacts on Vegetation Greening Over the Tibetan Plateau. J. Geophys. Res. Atmos. 2019, 124, 7540–7552. [Google Scholar] [CrossRef]
  46. Xiong, Q.; Xiao, Y.; Marwa, W.A.H.; Mohammed, A.; Liang, P.; Liu, C.; Zhang, L.; Bikram, P.; Pan, K.; Sameh, B.; et al. Monitoring the impact of climate change and human activities on grassland vegetation dynamics in the northeastern Qinghai–Tibet Plateau of China during 2000–2015. J. Arid Land 2019, 11, 637–651. [Google Scholar] [CrossRef]
  47. Huang, S.; Zheng, X.; Ma, L.; Wang, H.; Huang, Q.; Leng, G.; Meng, E.; Guo, Y. Quantitative contribution of climate change and human activities to vegetation cover variations based on GA-SVM model. J. Hydrol. 2020, 584, 124687. [Google Scholar] [CrossRef]
  48. Wang, H.F.; Rao, E.; Xiao, Y.; Xiao, Y.; Yan, Y.; Lu, H.T.; Zhu, J.Y. Ecological risk assessment in Southwest China based on multiple risk sources. Acta Ecol. Sin. 2018, 38, 8992–9000. [Google Scholar] [CrossRef]
  49. Gao, J.; Shi, Y.; Zhang, H.; Chen, X.; Zhang, W.; Shen, W.; Xiao, T.; Zhang, Y. China Regional 250 m Normalized Difference Vegetation Index Data Set (2000–2023); National Tibetan Plateau/Third Pole Environment Data Center: Beijing, China, 2023. [Google Scholar]
  50. Doraiswamy, P.C.; Hatfield, J.L.; Jackson, T.J.; Akhmedov, b.; Prueger, J.; Stern, A. Crop condition and yield simulations using Landsat and MODIS. Remote Sens. Environ. 2004, 92, 548–559. [Google Scholar] [CrossRef]
  51. Xu, Z.H.; Li, Y.F.; Li, B.; Hao, Z.B.; Hu, X.Y.; Yu, H.; Xiang, S.Y.; Pascal, M.L.F.; Shen, W.L.; He, A.Q.; et al. A comparative study on the applicability and effectiveness of NSVI and NDVI for estimating fractional vegetation cover based on multi-source remote sensing image. Geocarto Int. 2023, 38, 2184501. [Google Scholar] [CrossRef]
  52. Zhang, P.; Gesang, Z.; Fan, J. Soil Erosion Status and Distribution Characteristics in the ‘One River and Two Streams’ Region in Tibet. Res. Soil Water Conserv. 2017, 24, 49–53. [Google Scholar] [CrossRef]
  53. Li, P.; Peng, C.; Wang, M.; Luo, Y.P.; Li, M.X.; Zhang, K.R.; Zhang, D.L.; Zhu, Q. Dynamics of vegetation autumn phenology and its response to multiple environmental factors from 1982 to 2012 on Qinghai-Tibetan Plateau in China. Sci. Total Environ. 2018, 637, 855–864. [Google Scholar] [CrossRef] [PubMed]
  54. Jiang, G.X.; Xie, Y.L.; Gao, Z.Y.; Zhou, P. Evaluation on Elevation Accuracy of Commonly Used DEM in Five Typical Areas of China. Res. Soil Water Conserv. 2020, 27, 72–80. [Google Scholar] [CrossRef]
  55. Yan, K.; Yang, H.M.; Wang, D.C. Digital Mapping of Forest Soil Organic Carbon Based on NDVI Time Series Features: A Case Study of Jiyuan Nanshan Forest Farm. Soil Bull. 2024, 4, 921–931. [Google Scholar] [CrossRef]
  56. Sen, P.K. Estimates of the regression coefficient based on Kendall’s Tau. J. Am. Stat. Assoc. 1968, 63, 1379–1389. [Google Scholar] [CrossRef]
  57. Zhang, L.; Guo, H.; Ji, L.; Lei, L.; Wang, C.; Yan, D.; Li, B.; Li, J. Vegetation greenness trend (2000 to 2009) and the climate controls in the Qinghai-Tibetan Plateau. J. Appl. Remote Sens. 2013, 7, 73572. [Google Scholar] [CrossRef]
  58. Jiang, L.; Jiapaer, G.; Bao, A.; Guo, H.; Ndayisaba, F. Vegetation dynamics and responses to climate change and human activities in Central Asia. Sci. Total Environ. 2017, 599, 967–980. [Google Scholar] [CrossRef]
  59. Kalisa, W.; Igbawua, T.; Henchiri, M.; Ali, S.; Zhang, S.; Bai, Y.; Zhang, J. Assessment of climate impact on vegetation dynamics over East Africa from 1982 to 2015. Sci. Rep. 2019, 9, 16865. [Google Scholar] [CrossRef]
  60. Kendall, M. Rank Correlation Methods; Charles Griffin & Co., Ltd.: London, UK, 1975. [Google Scholar]
  61. Tošić, I. Spatial and temporal variability of winter and summer precipitation over Serbia and Montenegro. Theor. Appl. Climatol. 2004, 77, 47–56. [Google Scholar] [CrossRef]
  62. Guo, C.Q.; Kuang, W.H.; Dou, Y.Y. Dataset of Urban Impervious Surface Area and Green Space Fractions in the Tibetan Plateau (2000–2020); National Tibetan Plateau Data Center: Beijing, China, 2021. [Google Scholar]
  63. Hurst, F.B. Climates Prevailing in the Yellow-Gray Earth and Yellow-Brown Earth Zones in New Zealand. In Selected Papers in Soil Formation and Classification; Drew, J.V., Ed.; Wiley Online Library: Hoboken, NJ, USA, 1967; Volume 1, pp. 209–227. [Google Scholar] [CrossRef]
  64. Mandelbrot, B.B.; Wallis, J.R. Robustness of the rescaled range R/S in the measurement of noncyclic long run statistical dependence. Water Resour. Res. 1969, 5, 967–988. [Google Scholar] [CrossRef]
  65. Fensholt, R.; Proud, S.R. Evaluation of Earth Observation based global long term vegetation trends—Comparing GIMMS and MODIS global NDVI time series. Remote Sens. Environ. 2012, 119, 131–147. [Google Scholar] [CrossRef]
  66. Wan, Z.; Gao, W. Changes in urban vegetation cover and analysis of the influencing factors: A case study of Harbin, Heilongjiang Province, China. Arab. J. Geosci. 2020, 13, 1053. [Google Scholar] [CrossRef]
  67. Liu, X.; Li, Y.; Wang, L.; Gong, J.; Sheng, Y.; Li, Z. The Analysis of Hydrometeorological Characteristics in the Yarlung Tsangpo River Basin. Water 2025, 17, 344. [Google Scholar] [CrossRef]
  68. Li, F.; Xu, Z.; Liu, W.; Zhang, Y. The impact of climate change on runoff in the Yarlung Tsangpo River basin in the Tibetan Plateau. Stoch. Environ. Res. Risk Assess. 2014, 28, 517–526. [Google Scholar] [CrossRef]
  69. Niu, Q.; Liu, L.; Heng, J.; Li, H.; Xu, Z. A multi-index evaluation of drought characteristics in the Yarlung Zangbo River Basin of Tibetan Plateau, Southwest China. Front. Earth Sci. 2020, 8, 213. [Google Scholar] [CrossRef]
  70. Li, F.; Xu, Z.; Feng, Y.; Liu, M.; Liu, W. Changes of land cover in the Yarlung Tsangpo River basin from 1985 to 2005. Environ. Earth Sci. 2013, 68, 181–188. [Google Scholar] [CrossRef]
  71. Sun, J.; Cheng, G.; Li, W.; Sha, Y.; Yang, Y. On the Variation of NDVI with the Principal Climatic Elements in the Tibetan Plateau. Remote Sens. 2013, 5, 1894–1911. [Google Scholar] [CrossRef]
  72. Jiao, K.; Gao, J.; Liu, Z. Precipitation Drives the NDVI Distribution on the Tibetan Plateau While High Warming Rates May Intensify Its Ecological Droughts. Remote Sens. 2021, 13, 1305. [Google Scholar] [CrossRef]
  73. Li, Y.; Gong, J.; Zhang, Y.; Gao, B. NDVI-Based Greening of Alpine Steppe and Its Relationships with Climatic Change and Grazing Intensity in the Southwestern Tibetan Plateau. Land 2022, 11, 975. [Google Scholar] [CrossRef]
  74. Li, X.; Chen, Y.H.; Chen, Z.; Zhang, G.Z.; Tang, M.Y. Analysis of spatio-temporal changes and driving vegetation NDVI in coastal areas of China. Ecol. Environ. Sci. 2024, 33, 180–191. [Google Scholar] [CrossRef]
  75. Hurst, H.E. Long-Term Storage Capacity of Reservoirs. Trans. Am. Soc. Civ. Eng. 1951, 116, 770–799. [Google Scholar] [CrossRef]
  76. Wang, J.; Ye, B.; Liu, F.; Li, J.; Yang, G.J. Variations of NDVI over elevational zones during the past two decades and climatic controls in the Qilian mountains, northwestern China. Arct. Antarct. Alp. Res. 2011, 43, 127–136. [Google Scholar] [CrossRef]
  77. Liu, L.; Niu, Q.; Heng, J.; Li, H.; Xu, Z.X. Transition characteristics of the dry-wet regime and vegetation dynamic responses over the Yarlung Zangbo River Basin, Southeast Qinghai-Tibet Plateau. Remote Sens. 2019, 11, 1254. [Google Scholar] [CrossRef]
  78. Peng, J.; Liu, Z.; Liu, Y.; Wu, J.; Han, Y. Trend analysis of vegetation dynamics in Qinghai-Tibet Plateau using Hurst Exponent. Ecol. Indic. 2012, 14, 28–39. [Google Scholar] [CrossRef]
  79. Dragoni, D.; Schmid, H.P.; Wayson, C.A.; Potter, H.; Grimmond, C.S.B.; Randolph, J.C. Evidence of increased net ecosystem productivity associated with a longer vegetated season in a deciduous forest in south-central Indiana, USA. Glob. Change Biol. 2011, 17, 886–897. [Google Scholar] [CrossRef]
  80. Li, L.; Zhang, Y.; Liu, L.; Wang, Z.; Zhang, H.; Li, S.; Ding, M. Mapping changing population distribution on the Qinghai-Tibet Plateau since 2000 with multi-temporal remote sensing and point-of-interest data. Remote Sens. 2020, 12, 4059. [Google Scholar] [CrossRef]
  81. Lehnert, L.W.; Wesche, K.; Trachte, K.; Reudenbach, C.; Bendix, J. Climate variability rather than overstocking causes recent large scale cover changes of Tibetan pastures. Sci. Rep. 2016, 6, 24367. [Google Scholar] [CrossRef]
  82. Yang, L.; Guan, Q.; Lin, J.; Tian, J.; Tan, Z.; Li, H. Evolution of NDVI secular trends and responses to climate change: A perspective from nonlinearity and nonstationarity characteristics. Remote Sens. Environ. 2021, 254, 112247. [Google Scholar] [CrossRef]
  83. Li, Y.; Gong, J.; Dai, R.; Jin, T. Spatio-temporal Variation of Vegetation Cover and Its Relationship with Climatic Factors and Human Activities in the Southwest Tibetan Plateau. Sci. Geogr. Sin. 2022, 42, 761–771. [Google Scholar] [CrossRef]
  84. Gao, X.; Li, T.; Sun, D. Regional differentiation regularity and influencing factors of population change in the Qinghai-Tibet plateau, China. Chin. Geogr. Sci. 2021, 31, 888–899. [Google Scholar] [CrossRef]
  85. Liu, Y.; Tian, J.; Liu, R.; Ding, L. Influences of Climate Change and Human Activities on NDVI Changes in China. Remote Sens. 2021, 13, 4326. [Google Scholar] [CrossRef]
  86. Löffler, R.; Steinicke, E. Counterurbanization and Its Socioeconomic Effects in High Mountain Areas of the Sierra Nevada (California/Nevada). Mt. Res. Dev. 2006, 26, 64–71. Available online: https://www.jstor.org/stable/3674394 (accessed on 29 April 2025). [CrossRef]
  87. Diao, C.; Liu, Y.; Zhao, L.; Zhuo, G.; Zhang, Y. Regional-scale vegetation-climate interactions on the Qinghai-Tibet Plateau. Ecol. Inform. 2021, 65, 101413. [Google Scholar] [CrossRef]
  88. Li, X.; Wang, Y.; Zhao, Y.; Zhai, J.; Liu, Y.; Han, S.; Liu, K. Research on the Impact of Climate Change and Human Activities on the NDVI of Arid Areas—A Case Study of the Shiyang River Basin. Land 2024, 13, 533. [Google Scholar] [CrossRef]
Figure 1. Topographic map of the YLN Basin.
Land 14 01027 g001
Figure 2. (a) Spatial distribution of the multiyear average summer NDVI and (b) the growing season NDVI; (c) interannual variations of the summer NDVI and (d) the growing season NDVI.
Land 14 01027 g002
Figure 3. (a) Spatial distribution of the multiyear average NDVI trends in summer and (b) the growing season; (c) significance of the NDVI trends for summer, (d) and the growing season.
Land 14 01027 g003
Figure 4. (a) Spatial distribution of the Hurst index for summer and (b) the growing season; (c) the NDVI trend in summer and (d) the growing season.
Land 14 01027 g004
Figure 5. Spatial patterns and temporal trends (2000–2019) of precipitation and temperature in the YLN Basin. (a) Spatial distribution of the multiyear average precipitation and (b) average temperature; (c) temporal trend in precipitation and (d) temperature; (e) interannual variations in precipitation and (f) temperature.
Land 14 01027 g005
Figure 6. (a) The correlation coefficients between temperature and the NDVI for (a) summer and (c) the growing season, and the significance level between temperature and the NDVI for (b) summer and (d) the growing season.
Land 14 01027 g006
Figure 7. (a) The correlation coefficients between precipitation and the NDVI for summer. (b) The significance level between precipitation and the NDVI for summer. (c) The correlation coefficients between precipitation and the NDVI for the growing season. (b) The significance level between precipitation and the NDVI for the growing season.
Land 14 01027 g007
Figure 8. Geographical distribution of how individuals affect vegetation NDVI in (a) summer and (b) growing season. SII: Significant inhibition, MOI: Moderate inhibition, SLI: Slight inhibition, BNI: Basically no impact, SLP: Slight promotion, MOP: Moderate promotion, SIP: Significant promotion. (c) Area percentage of human activity impact levels on NDVI for summer and growing season.
Land 14 01027 g008
Figure 9. Changes in human activities in recent years: (a) Ecological restoration project forest area (km2), (b) Livestock headcount (LOWESS fitted the nonlinear trend), (c) population, (d) impervious surface area (km2).
Land 14 01027 g009
Table 1. Classification of the impacts of climatic change and human activities on vegetation NDVI (10−3 a−1).
SlopeInfluence Level
<−2.0Significant inhibition
−2.0~−1.0Moderate inhibition
−1.0~−0.2Slight inhibition
−0.2~0.2Basically no impact
0.2~1.0Slight promotion
1.0~2.0Moderate promotion
≥2.0Significant promotion
Table 2. NDVI change trend statistics.
βZNDVI Trend TypesArea Ratio (%)
SummerGrowing Season
β < −0.0005|Z| > 1.96Significant decrease31.653.18
β < −0.0005|Z| < 1.96Non-significant decrease50.4231.18
β > 0.0005|Z| < 1.96Non-significant increase7.9339.56
β > 0.0005|Z| > 1.96Significant increase1.857.63
−0.0005 < β < 0.0005ZStable8.1518.45
Table 3. Persistence of the change trend of the NDVI in the study region from 2000 to 2019.
Change PatternsArea Ratio (%)
SummerGrowing Season
Continuous significant decrease11.22%7.46%
Continuous non-significant decrease 8.12%0.99%
Uncertain76.19%76.26%
Continuous significant increase0.62%2.11%
Continuous non-significant increase 1.95%8.93%
No significant change1.90%4.26%
Table 4. Correlation significance between the NDVI and temperature/precipitation from 2000 to 2019.
CorrelationsArea Ratio (%) of TemperatureArea Ratio (%) of Precipitation
SummerGrowing SeasonSummerGrowing Season
Significant negative correlation3.68%2.27%1.27%1.75%
Significant positive correlation56.96%44.51%5.38%9.77%
No significant negative correlation36.24%50.60%<0.05%26.47%
No significant positive correlation3.12%2.62%93.35%62.00%
Disclaimer/Publisher’s Note: The statements, opinions and data contained in all publications are solely those of the individual author(s) and contributor(s) and not of MDPI and/or the editor(s). MDPI and/or the editor(s) disclaim responsibility for any injury to people or property resulting from any ideas, methods, instructions or products referred to in the content.

