Article

Analysis of Driving Factors of Cropland Productivity in Northeast China Using OPGD-SHAP Framework

1
State Key Laboratory of Geographic Information Science and Technology, Institute of Geographic Sciences and Natural Resources Research, Chinese Academy of Sciences, Beijing 100101, China
2
University of Chinese Academy of Sciences, Beijing 100049, China
*
Author to whom correspondence should be addressed.
Land 2025, 14(5), 1010; https://doi.org/10.3390/land14051010
Submission received: 31 March 2025 / Revised: 22 April 2025 / Accepted: 3 May 2025 / Published: 7 May 2025

Abstract

:
In the context of climate change and ecological degradation, enhancing cropland productivity in Northeast China is essential for ensuring national food security. This study adopted an integrated framework combining the optimal parameter-based geographical detector (OPGD) and SHapley Additive exPlanations (SHAP) to identify key drivers of average and total cropland productivity at the county level from 2001 to 2020. Growing-season-based cropland Net Primary Productivity (NPP) was estimated using the CASA model to represent cropland productivity. Results indicated that natural and ecological factors significantly dominated the spatial variation of cropland productivity, with their interactions amplified through dual-factor or nonlinear enhancements. Various machine learning models were fine-tuned and compared, and optimal models were selected for subsequent SHAP analysis. The findings revealed that erosion intensity exhibited the most significant impact on cropland productivity, whereas the effect of precipitation shifted from negative to positive, with a clear threshold of around 400 mm—matching the boundary between China’s semi-arid and semi-humid regions. Low-elevation plains (<300 m) and gentle slopes (<0.5°) predominately promoted total cropland productivity. Interactions between erosion and fertilizer intensity highlighted the need for moderate fertilization to prevent ecological degradation in severely eroded counties. These findings provide scientific support for targeted cropland management aimed at achieving sustainable agriculture in Northeast China.

1. Introduction

In the context of rising global food demand and intensifying climate change, cropland productivity, which is defined as the capacity to produce material outputs within specific socioeconomic and technological constraints, has emerged as a pivotal indicator for assessing the efficiency of agricultural systems [1,2,3]. Consequently, enhancing cropland productivity has become a key pathway for addressing food security and promoting sustainable agricultural development particularly for China—a country feeding approximately 20% of the global population with limited cropland resources [4].
Northeast China, known as one of the major black soil regions in the world, has achieved 21 consecutive years of production growth since 2004 and accounts for 25% of China’s total grain output and nearly one-third of commercial grain supply in 2024 [5]. This region serves as the stabilizer of domestic food production and the foundation of China’s agricultural system. However, emerging challenges are threatening cropland productivity in Northeast China. Intensive agricultural practices and improper cropland management have caused severe ecological degradation, including the thinning of the black soil layer, loss of soil organic matter, and deterioration of soil structure [6,7,8]. Furthermore, climate change introduces additional uncertainties and risks. Extreme weather events, such as floods, droughts, and chilling injury, have repeatedly caused crop yield reductions in this region [9,10]. Therefore, identifying and analyzing the key drivers of cropland productivity is not only critical for achieving sustainable productivity enhancement in Northeast China’s agricultural systems but also holds strategic importance for China’s national food security.
Previous studies, on the one hand, have demonstrated that the driving factors of cropland productivity are multidimensional. Climatic factors, such as precipitation, land surface temperature, and solar radiation, collectively play a substantial role in shaping cropland productivity [11]. Additionally, climate change, along with hazards and extreme weather events, increasingly threatens the long-term stability of agricultural productivity [12]. Researchers in agricultural sciences emphasize the influence of soil characteristics, crop species, agricultural management and farming practices such as intercropping and crop rotation, all of which significantly affect crop yields [13,14,15,16]. Meanwhile, ecological studies explore the relationships between landscape diversity, structure changes, cropland fragmentation, and productivity [17,18,19]; notably, soil erosion has long been recognized as a crucial factor in reducing agricultural output [7]. Moreover, other studies stress the roles of public policies and infrastructure investments in determining cropland productivity [20]. Given the diversity of factors involved, identifying and analyzing of all potential drivers at large scales are neither feasible nor necessary. However, valuable insights into the driving mechanisms of cropland productivity can be obtained by investigating factors in both natural and socioeconomic contexts, providing scientific support for targeted policy decisions.
On the other hand, the existing literature has explored the drivers of cropland productivity from various perspectives, including mechanism exploration, spatial heterogeneity, and factor contribution analyses. Correlation analysis [21], principal component analysis [22,23], and structural equation modeling [24,25] have been employed to elucidate the driving mechanisms and interactions among multiple driving factors affecting cropland productivity. Spatial autocorrelation analysis [26] and geographical detector (GD) methods [27,28] are effective tools for identifying spatial heterogeneity of the spatial drivers of cropland productivity. Moreover, methods such as dominance analysis and residual trend analysis [29,30] can quantify their relative importance and contributions of different drivers to cropland productivity. Nevertheless, no single approach can simultaneously quantify spatial heterogeneity, factor importance, thresholds, and driving mechanisms. Recent studies have employed machine learning algorithms such as Support Vector Machines, Random Forests, and Gradient Boosting algorithms to capture complex nonlinear relationships in large datasets, providing higher predictive accuracy and computational efficiency [31,32]. Yet, the inherent “black-box” nature of these models obscures the interpretation of underlying mechanisms and influences patterns of driving factors. To overcome these limitations, interpretable machine learning approaches—particularly SHapley Additive exPlanations (SHAP)—have been widely adopted to elucidate feature importance, reveal thresholds and identify interaction dynamics [33,34]. Building upon these developments, a framework involving GD and SHAP [35] is proposed in this study, thereby integrating spatial heterogeneity detection with interpretable assessments of driver importance, nonlinear and interaction mechanisms, and threshold identification. This integrated approach provides a more comprehensive understanding of the multidimensional drivers of cropland productivity.
Net Primary Productivity (NPP), which quantifies the total organic materials produced by vegetation during the biogeochemical cycling process, conceptually aligns with the caloric yield of crops [36] for cross-crop comparisons of cropland productivity. In addition, studies have indicated a strong correlation between the cropland NPP during the growing season and actual agricultural production [3], establishing NPP as a robust proxy for cropland productivity. For large-scale NPP estimation, the Carnegie-Ames-Stanford Approach (CASA) model—a widely-used light-use efficiency model adjusted for vegetation and land use types [37,38]—has demonstrated higher accuracy within China compared with NPP products such as MODIS NPP [29,39].
Based on these foundations, this study estimated monthly NPP data from 2001 to 2020 at the county level in Northeast China using the CASA model. The cumulative growing-season NPP on cropland was calculated to characterize average and total cropland productivity for each county. The optimal parameter-based geographical detector (OPGD) was then applied to explore the spatial contributions of driving factors and their interactions. Multiple machine learning models were comparatively evaluated to identify optimal modeling approaches, and the SHAP algorithm was subsequently used to determine the critical driving factors, their influence patterns, and threshold effects. Finally, this study aims to provide targeted policy implications to ensure food security and promote sustainable agriculture in Northeast China.

2. Materials and Methods

2.1. Study Area

The study area encompasses three northeastern provinces (Heilongjiang, Jilin, and Liaoning) and four leagues/cities of eastern Inner Mongolia (Hulunbuir, Hinggan, Chifeng, and Tongliao), located in the northeastern part of mainland China (38°44′−53°30′ N, 115°33′−135°09′ E). Overall, Northeast China has an annual frost-free period of 80 to 180 days, with average annual precipitation ranging from 180 mm to 1000 mm.
The topography of Northeast China is characterized by mountains on three sides and plains in the center, creating favorable conditions for large-scale cultivation. Specifically, the Greater Khingan Mountains are in the west, the Lesser Khingan Mountains are in the north, and the Changbai Mountains are in the east, forming a peripheral mountainous belt. In the center, Songnen, Sanjiang, and Liaohe Plains constitute the Northeast China Plain—the largest plain in China—with an average elevation between 50 and 200 m, known for its fertile black soil. As shown in Figure 1, cropland in Northeast China is predominantly distributed in the central and eastern plains. The mountain areas feature high elevations, rugged terrain, and cold climates that restrict cultivation. In contrast, the flat terrain and favorable climates of Liaohe, Songnen, and Sanjiang Plains support extensive cropland areas.

2.2. Data Source

2.2.1. Cropland Productivity

In this study, cropland productivity is measured by the accumulation of growing season NPP estimated through the CASA model on the cropland. Multisource satellite imagery, climate data, DEM data, and land use data were used for model construction. MODIS13A1 NDVI dataset was compiled for vegetation coverage, while China’s National Land Use and Cover Change (CNLUCC) dataset was used for cropland extraction [40]. Climate data included monthly temperature (°C) and precipitation (mm) acquired from datasets provided by the Resource and Environment Science Data Center of the Chinese Academy of Sciences (www.resdc.cn, accessed on 4 May 2025). Specifically, monthly average temperatures and total precipitation at 1 km spatial resolution across China were utilized. Surface solar radiation data were acquired from the ERA5 dataset via the Google Earth Engine (GEE) platform. Elevation data (m) were obtained from the Shuttle Radar Topography Mission (SRTM) digital elevation model (DEM) v3 dataset at a 30 m resolution, and slope (°) data were processed through the GEE based on the DEM.
Subsequently, the photosynthetically active radiation use efficiency parameter for cropland was adjusted according to the method proposed by Zhu et al. [41] The optimized parameter, along with the NDVI, climate, and DEM data, was integrated as input into the CASA model to generate monthly NPP data at a 1 km resolution for the period of 2001–2020.
The growing season in Northeast China was defined as the period from April to October [42], and cropland productivity was calculated by the cumulative NPP during this period. Based on these results, the average NPP and total NPP within each county were computed to quantify average cropland productivity and total cropland productivity, respectively. Both average and total productivity values were log-transformed prior to further analysis [43,44].

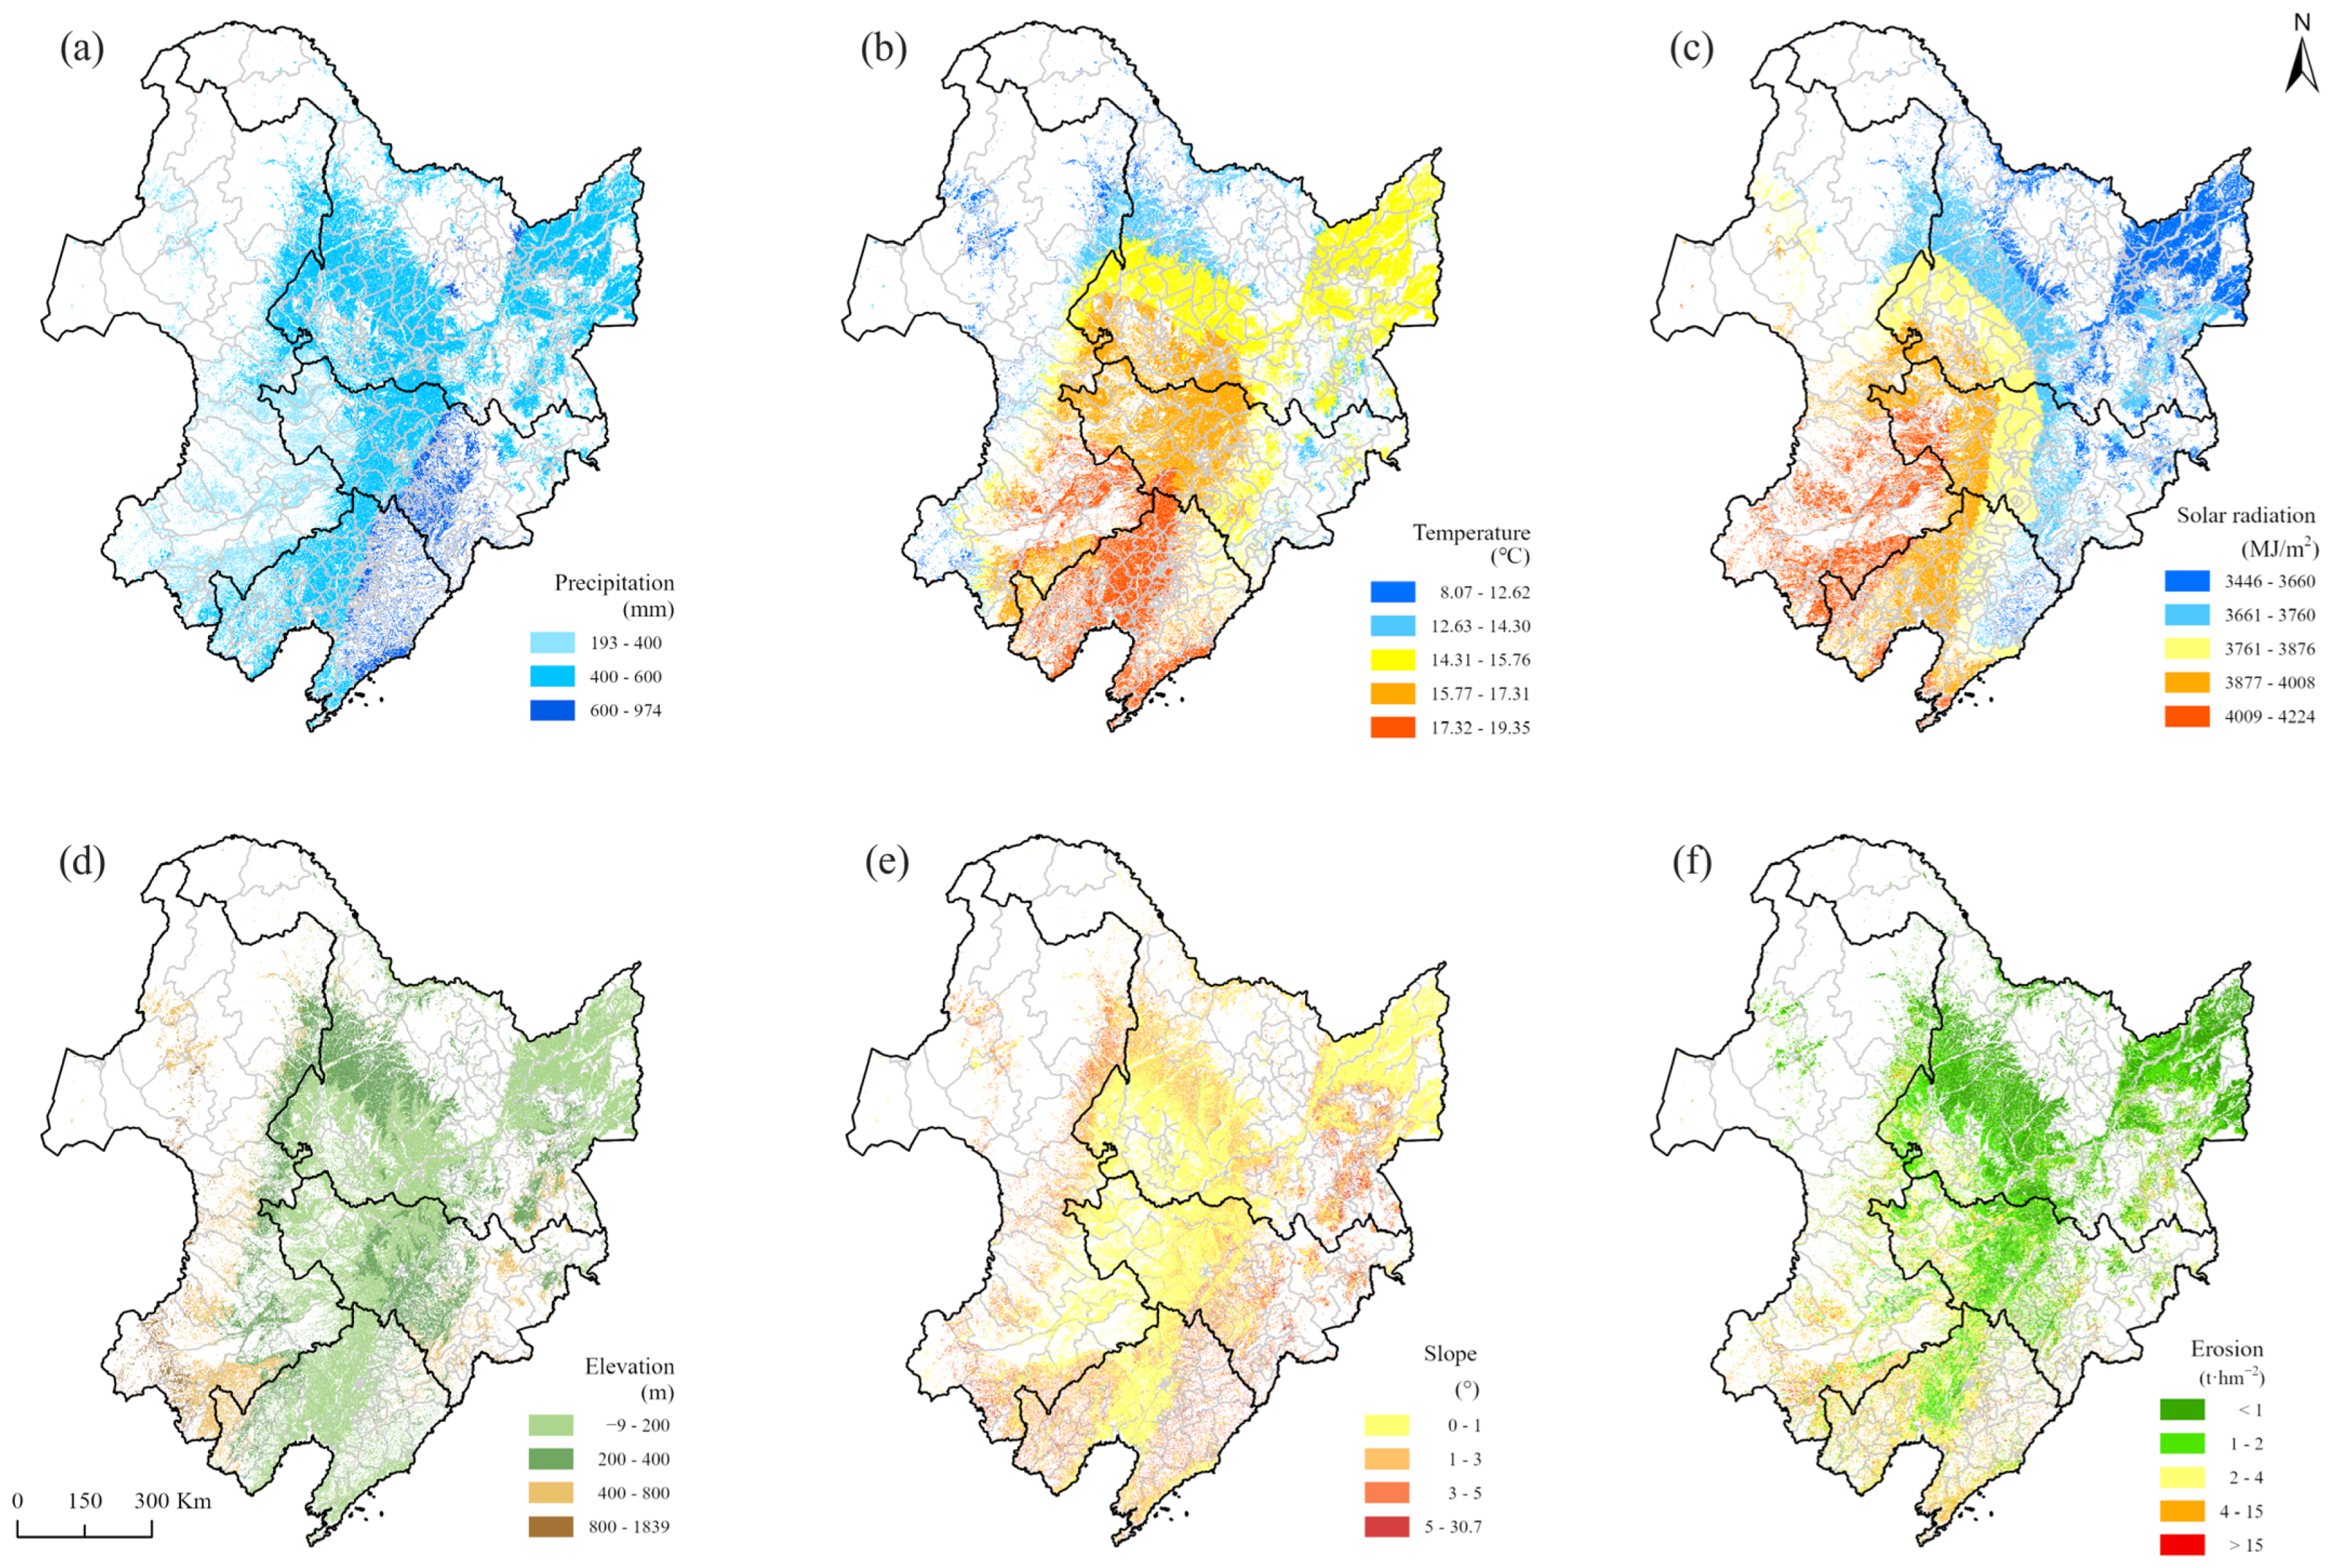
2.2.2. Explanatory Variables

This study compiled multisource datasets to comprehensively analyze the spatiotemporal heterogeneity and driving factors of cropland productivity in Northeast China from 2001 to 2020. Driver selection followed two criteria: (1) complete temporal coverage at the county level for statistical variables and (2) representation of the major driver dimensions —climate, topography, ecology, agricultural management, and socioeconomics. Accordingly, the final driver set comprises natural conditions (growing season total precipitation, mean temperature, and total surface solar radiation); topographic and ecological constraints (mean elevation, mean slope, and erosion intensity, the latter measured as the combined effect of wind and water erosion—the two predominant forms of soil loss in Northeast China [45]); and agricultural management factors (chemical fertilizer application, agricultural-machine power, and rural electricity consumption). Table 1 describes the metadata for cropland productivity and explanatory variables, including definitions, hypothesized effects, original data sources, and key supporting references of those driving factors in detail. Figure 2 illustrates the spatial distribution of raster-based driving factors affecting cropland productivity.

2.3. Methods

2.3.1. Optimal Parameter-Based Geographical Detector

The geographical detector is a geostatistical method for detecting spatial heterogeneity and quantifying the contributions of driving factors [49]. Its core assumption posits that the stronger an independent variable’s influence on a dependent variable, the more similar their spatial distributions will be. According to this principle, the input variables need to be grouped into discrete categories according to the dependent variable to capture spatial heterogeneity. However, this discretization of continuous variables remains subjective, with outcomes heavily dependent on the chosen method and the number of breakpoints, which may introduce bias into the GD analysis.
To address this issue, the optimal parameter-based geographical detector was proposed to reduce subjective bias in variable discretization [50]. Specifically, different discretization schemes and the number of classifications are combined to determine the best parameter set for more accurate analyses of the spatial contribution of the influence of variables. In this study, five classification methods—natural breaks, equal intervals, quantiles, geometrics, and standard deviations—were employed, and each influencing factor was categorized from 3 to 9 classes for optimal parameter selection. The optimized discretization results for average and total cropland productivity are shown in Appendix A, Table A1. The explanatory power of each driving factor on the spatial distribution of cropland productivity is quantified using the q-value calculated by the following equation:
q = 1 h = 1 H n h σ h 2 n σ 2
where h denotes the discretization number of a given factor, and n h and n represent the number of samples within each classification and the total number of samples across the entire study area, respectively. σ h 2 and σ h represent the variance in cropland productivity. The q-value ranges from 0 to 1, where larger q-values indicate stronger explanatory power of a factor regarding the spatial variation of cropland productivity.
Furthermore, the interaction detector [51] was used to investigate the spatial contribution of pairwise interactions among factors to cropland productivity. Spatial interaction is regarded as the combination of two spatial explanatory variables. As shown in Table 2, by comparing the q-values of individual variables with those of their interaction, the type and strength of the combined effect can be determined, indicating whether the effects of two spatial variables are attenuated, enhanced, or independent. In this study, the analysis was conducted using the GD 10.8 package in R 4.3.3 [50].

2.3.2. SHapley Additive exPlanations

SHAP is a model-agnostic interpretability algorithm that leverages the Shapley value concept from cooperative game theory to attribute predictions made by various machine learning algorithms, including linear models, decision trees, and deep learning networks [52]. Specifically, it quantifies the contribution of every input feature to each individual prediction. Consequently, the interpretability of the SHAP algorithm transforms those “block-box” models into transparent ones and enables a global importance rank.
In this study, we used the TreeExplainer method from the SHAP 0.45 library [53] in Python 3.9 to calculate the Shapley values of driving factors. Positive SHAP values denote drivers that enhance cropland productivity, while negative values indicate negative effects. The mean absolute SHAP values reflect the relative importance of driving factors to cropland productivity. Dependence plots are used to visualize influencing mechanisms and threshold effects of driving factors to cropland productivity. Furthermore, pairwise SHAP interaction plots reveal the effects between driving factors. The core equation for calculating the Shapley value is defined as follows:
ϕ j = S { 1 , , p } { j } S ! p S 1 ! p ! f S { j } f S
In Equation (2), ϕ j denotes the SHAP value of feature j ; p represents the total number of features; S is the subset of features excluding feature j ; and f ( ) refers to the prediction function of the model. The term f ( S { j } ) f ( S ) represents the marginal contribution of feature j .

3. Results

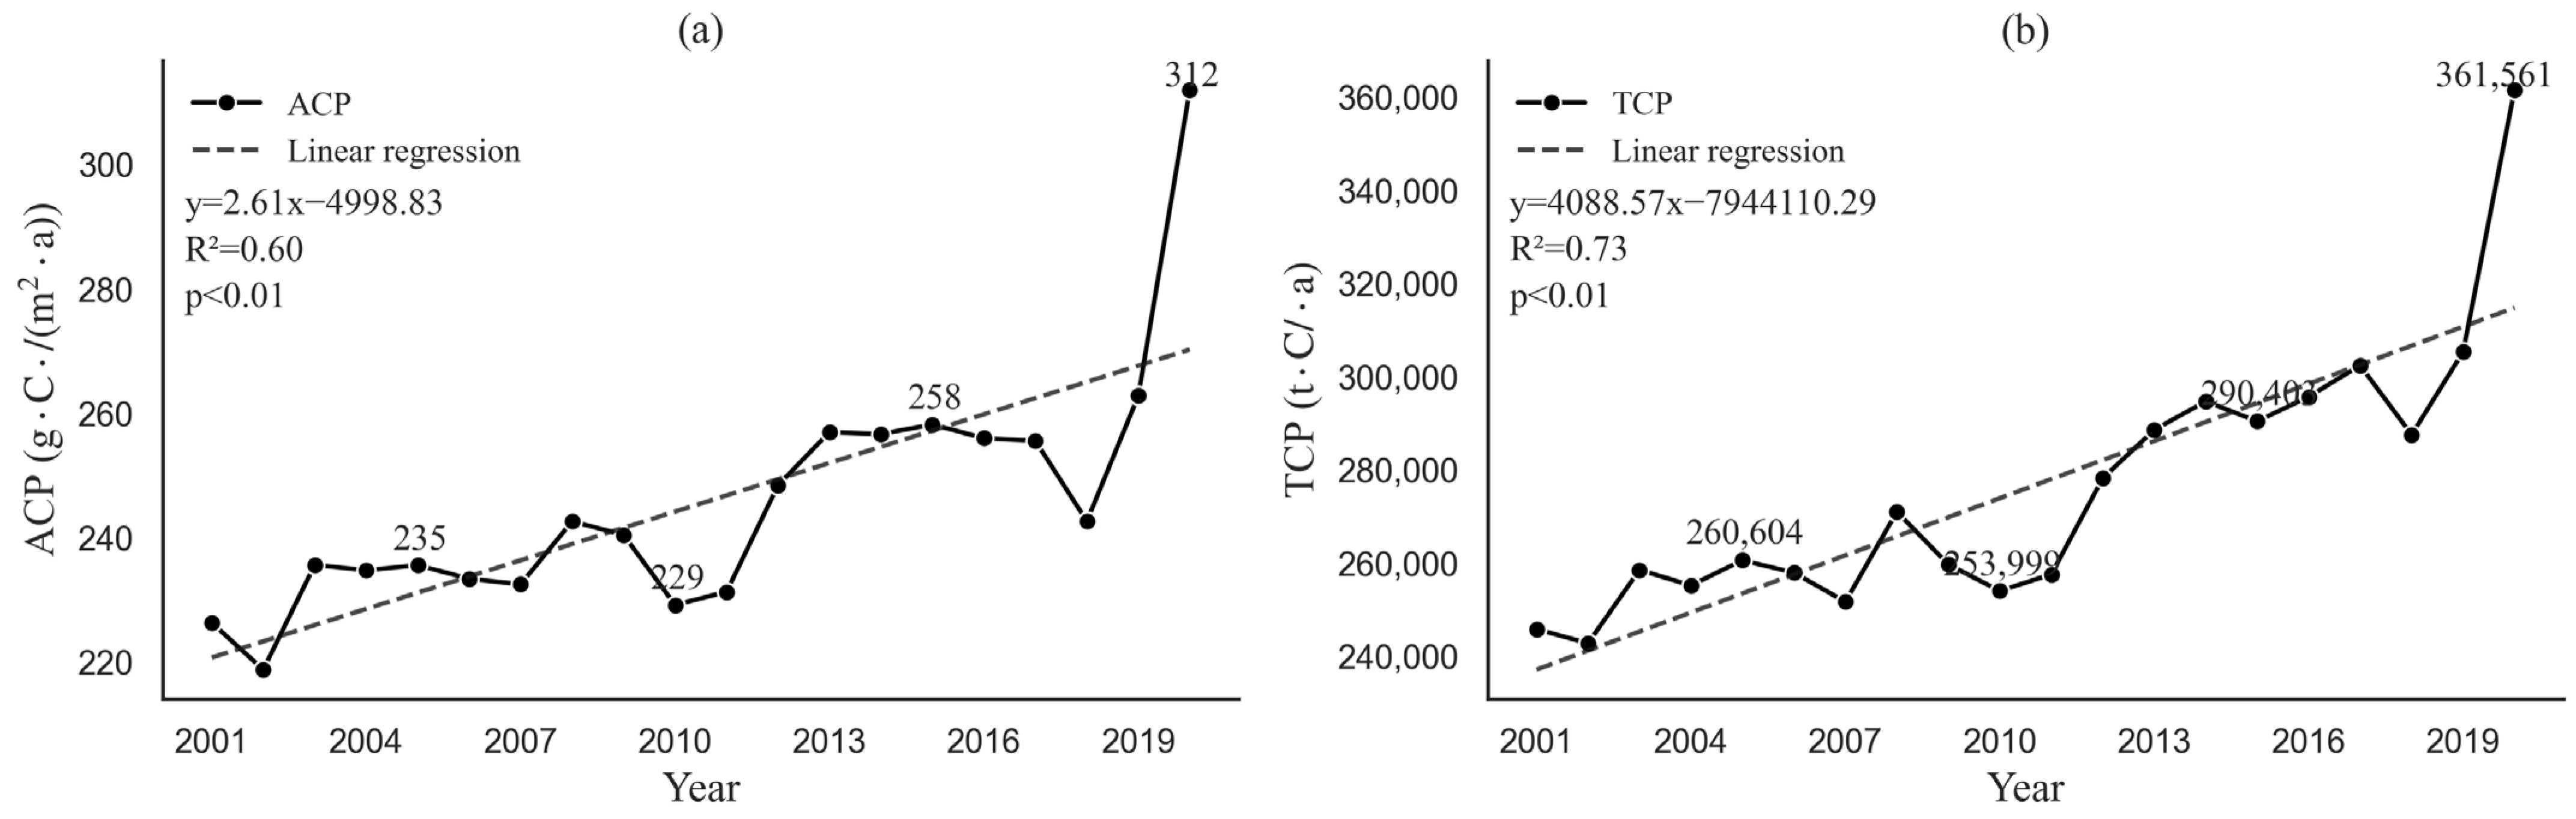
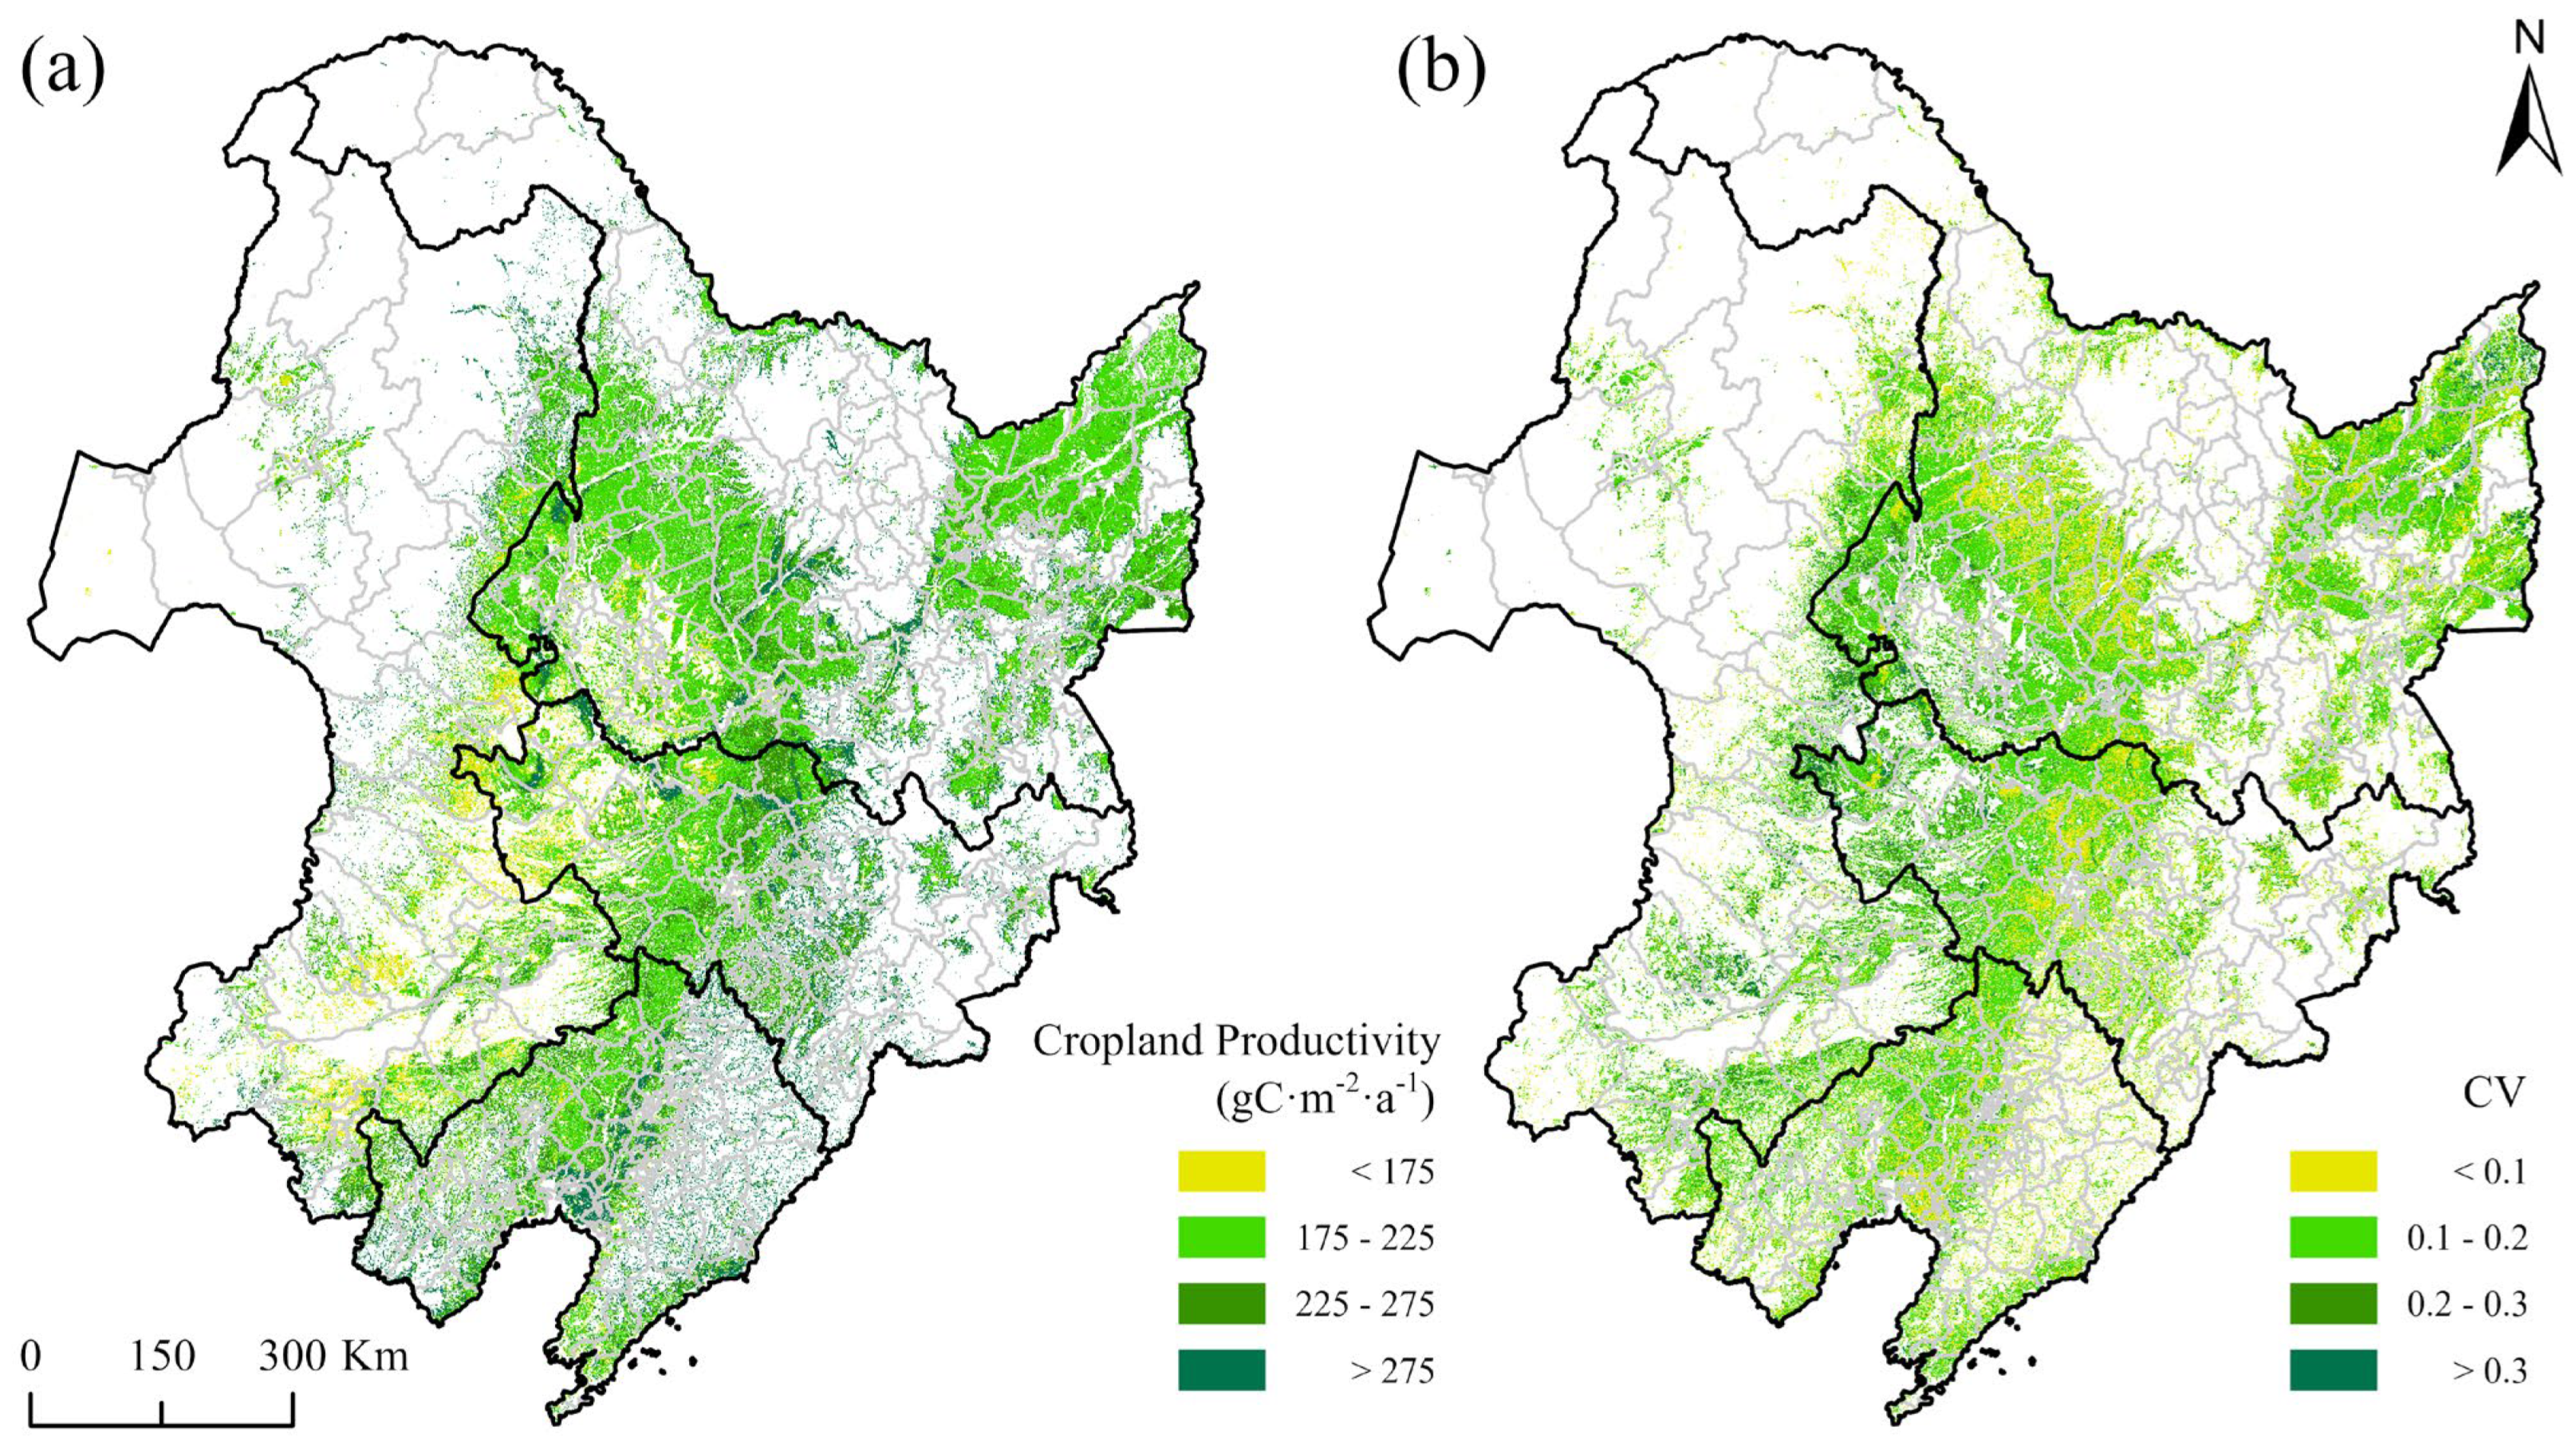
3.1. Spatiotemporal Variations of Cropland Productivity

The temporal trend of cropland productivity in Northeast China was analyzed using linear regression and Mann–Kendall (MK) trend tests. As depicted in Figure 3, both the average and total cropland productivity in Northeast China showed a consistent upward trajectory over the study period, with minimum values recorded in 2002 and maxima in 2020. The MK test results demonstrated statistically significant increasing trends for both ACP and TCP across all counties during 2001–2020 (p < 0.01). Additionally, the linear regression results exhibited an average annual increase of 2.61 g·C/(m2·a) for average cropland productivity ( R 2 = 0.60 ), and a steady increase of 4088.57 t·C/a for total cropland productivity ( R 2 = 0.73 ).
The spatial distribution of multi-year average cropland productivity in Northeast China followed a pattern of “lower in the west and higher in the east” (Figure 4a). Areas with high cropland productivity were primarily located in the central and eastern parts of the Northeast Plain, whereas areas with low cropland productivity were concentrated in the western region. The coefficient of variance (CV) was used to describe the stability of cropland productivity from 2001 to 2020 in Northeast China. However, as shown in Figure 4b, the spatial distribution of CV of cropland was lower in the east and higher in the west. The mean CV value is 0.14, indicating that the cropland productivity remained relatively stable during the study period.

3.2. Spatial Contributions of Driving Factors for Cropland Productivity

3.2.1. Effects of Single Driving Factors

Figure 5 illustrates the explanatory power of ten driving factors for the spatial heterogeneity of county-level average and total cropland productivity in Northeast China. Although multiple dimensions of factors shape the distribution of cropland productivity, the major determinants differ notably. Regarding the reliability of the OPGD results, all driving factors have passed the significance test (p < 0.01).
It should be noted that the coordinate axes in Figure 5 represent q-values derived from the GD, reflecting the explanatory strength of each independent factor concerning cropland productivity. Erosion intensity emerged as the dominant spatial driver of ACP, exhibiting the highest explanatory power (q = 0.601), followed by fertilizer input (q = 0.492) and elevation (q = 0.367). In contrast, topographic factors dominated the spatial distribution of TCP, with slope (q = 0.432) and elevation (q = 0.381) accounting for the largest proportion of spatial heterogeneity, while erosion intensity ranked third (q = 0.315). Compared with the top three drivers for both ACP and TCP, the contributions of the remaining drivers were relatively less significant.

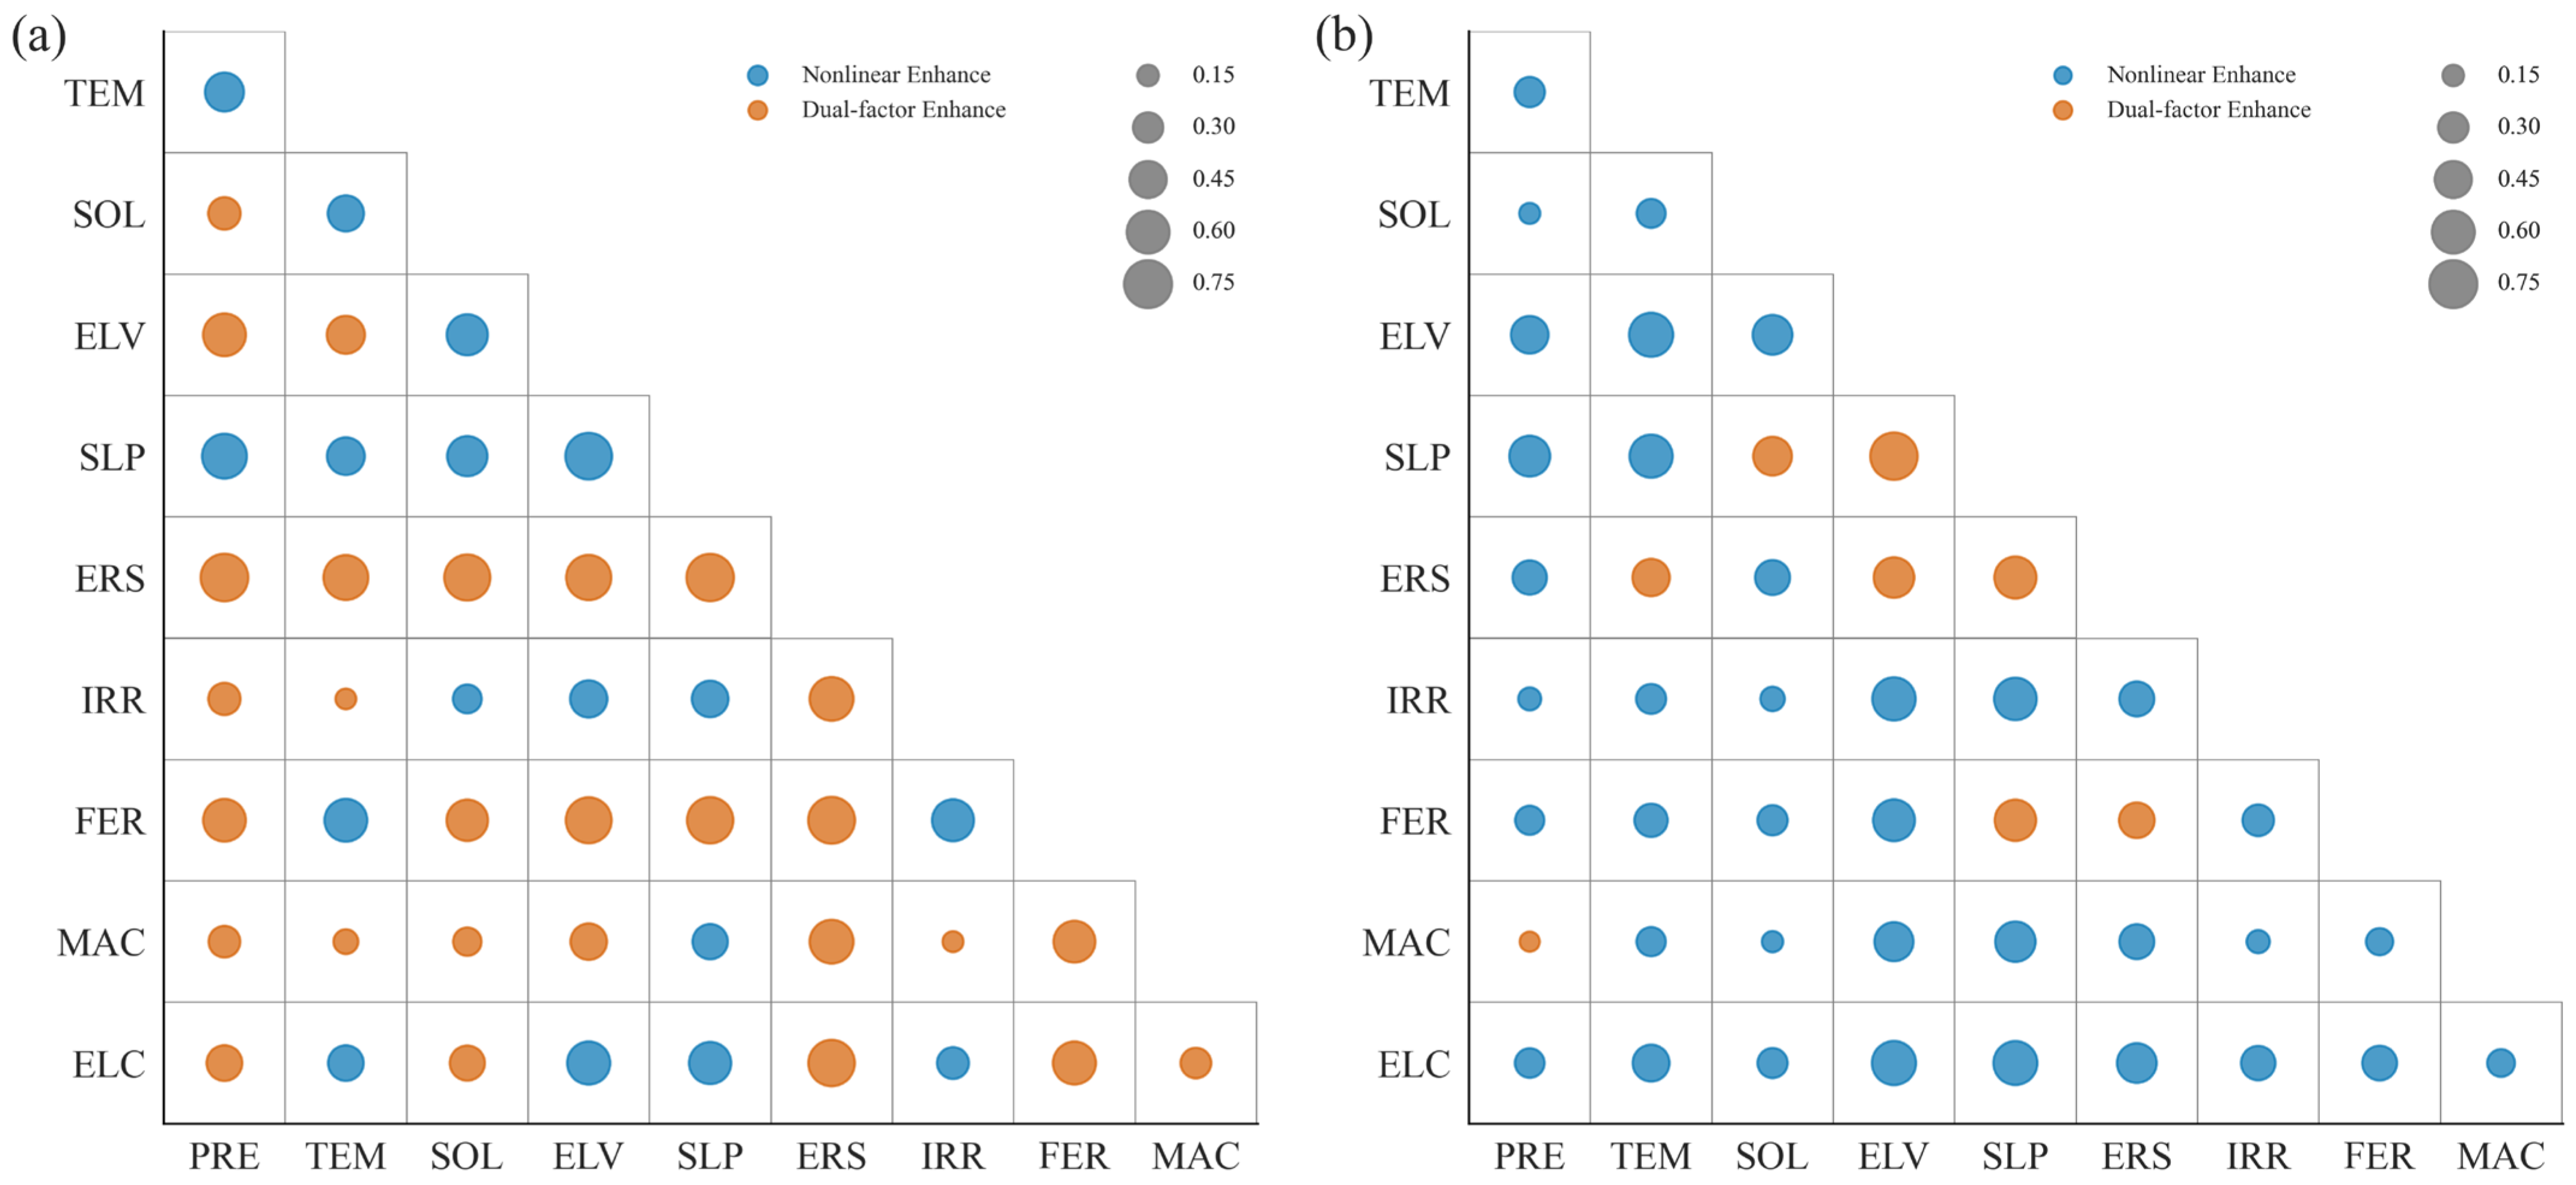
3.2.2. Interactive Effects Among Driving Factors

Interactions among different natural and socioeconomic drivers often result in coupled effects, significantly influencing the spatial distribution of cropland productivity. Therefore, the interactions among driving factors were explored using the OPGD method. As shown in Figure 6a, interactions influencing ACP were mainly characterized by a “dual-factor enhancement” effect, with certain combinations exhibiting “nonlinear enhancement”. This indicates that factor interactions generally strengthened explanatory power compared with individual factors alone. Specifically, the interaction between precipitation and erosion intensity exhibited the strongest contribution (q = 0.75), classified as a dual-factor enhancement. The interaction between elevation and slope also had a high q-value (0.72), classified as nonlinear enhancement, underscoring the importance of combined topographic conditions. Additionally, interactions with slope mostly showed nonlinear or strong dual-factor enhancement effects.
Regarding TCP (Figure 6b), factor interactions also displayed significantly higher explanatory power than individual factors, predominantly categorized as “nonlinear enhancement”, reflecting substantially strengthened impacts on TCP. The highest interaction was again between elevation and slope (q = 0.74), characterized as a dual-factor enhancement.

3.3. SHAP Explanations of the Driving Mechanisms

3.3.1. Comparative Assessment of Machine Learning Models

To systematically evaluate the influence mechanisms of different variables on county-level ACP and TCP, various machine learning algorithms were selected, including Support Vector Machine (SVM), Random Forest, Light Gradient Boosting Machine (LightGBM), Extreme Gradient Boosting (XGBoost), and Categorical Boosting (CatBoost). Each model’s key hyperparameters were fine-tuned through grid search and 10-fold cross-validation, with 90% of the data for training and 10% for validation [54]. The model performances were assessed using the root mean square error (RMSE), mean absolute error (MAE), and the coefficient of determination (R2), aiming to reduce overfitting risks while enhancing prediction robustness. The set of best parameters and their performance are shown in Appendix A, Table A2, and Table 3.
The results indicated that the performance of the SVM model was relatively weaker, as evidenced by its lower R2 values and higher errors (ACP: RMSE = 0.179, MAE = 0.140, R2 = 0.705; TCP: RMSE = 0.552, MAE = 0.433, R2 = 0.473). This deficiency may be attributed to the high sensitivity of SVM to kernel function parameters and its primary suitability for classification tasks. By contrast, Random Forest, CatBoost, XGBoost, and LightGBM all demonstrated relatively similar levels of accuracy. Although Random Forest produced sound interpretability and stability, its RMSE and MAE values were slightly higher than those of the gradient-boosting decision tree algorithms. Notably, CatBoost performed the best in modeling ACP (R2 = 0.933, MAE = 0.065, RMSE = 0.085), while XGBoost showed the highest accuracy in assessing TCP (R2 = 0.968, MAE = 0.095, RMSE = 0.135).
In subsequent analyses, the hyperparameter-optimized LightGBM and CatBoost models were selected for ACP and TCP, respectively. These models were integrated with the SHAP framework to systematically identify and interpret key driving factors of cropland productivity, as well as to elucidate their directions of impact and turning points. To further verify the robustness of the model outcomes, default-parameter configurations of both models were subjected to parallel SHAP analysis. The results exhibited broad consistency with those derived from their optimized counterparts, thereby reinforcing the generalizability and stability of the identified drivers and their mechanistic roles in shaping productivity outcomes.

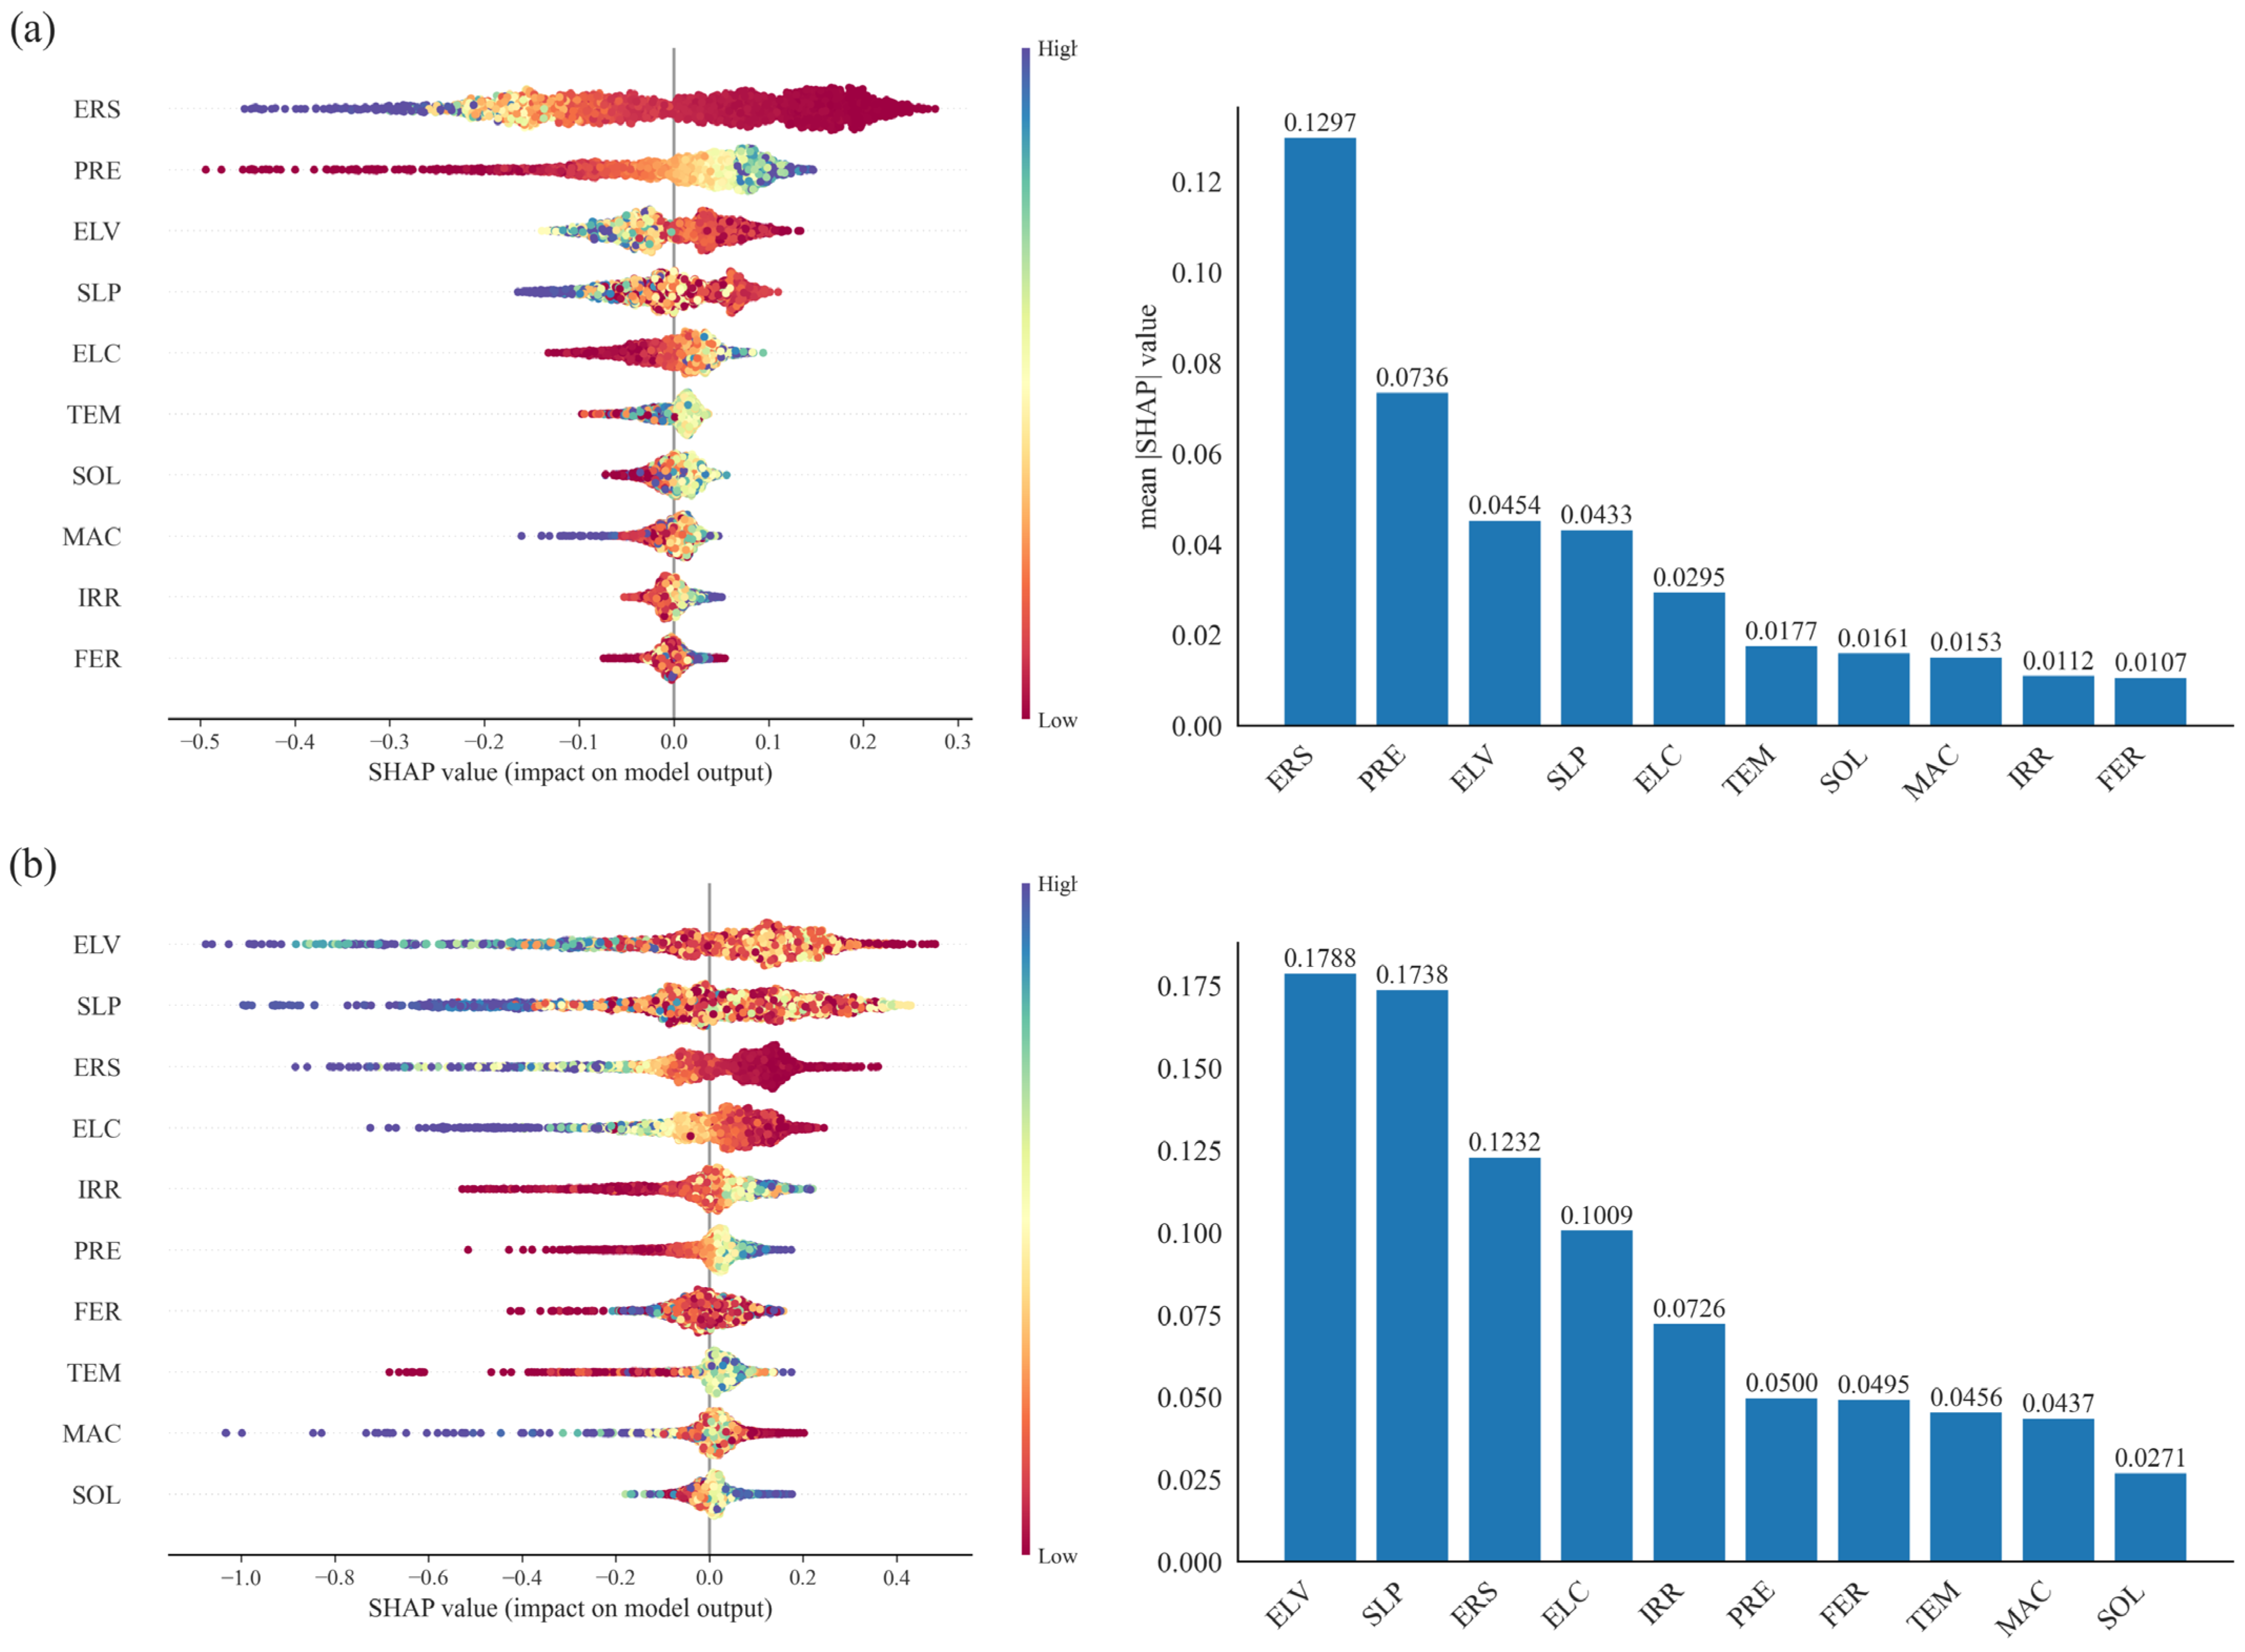
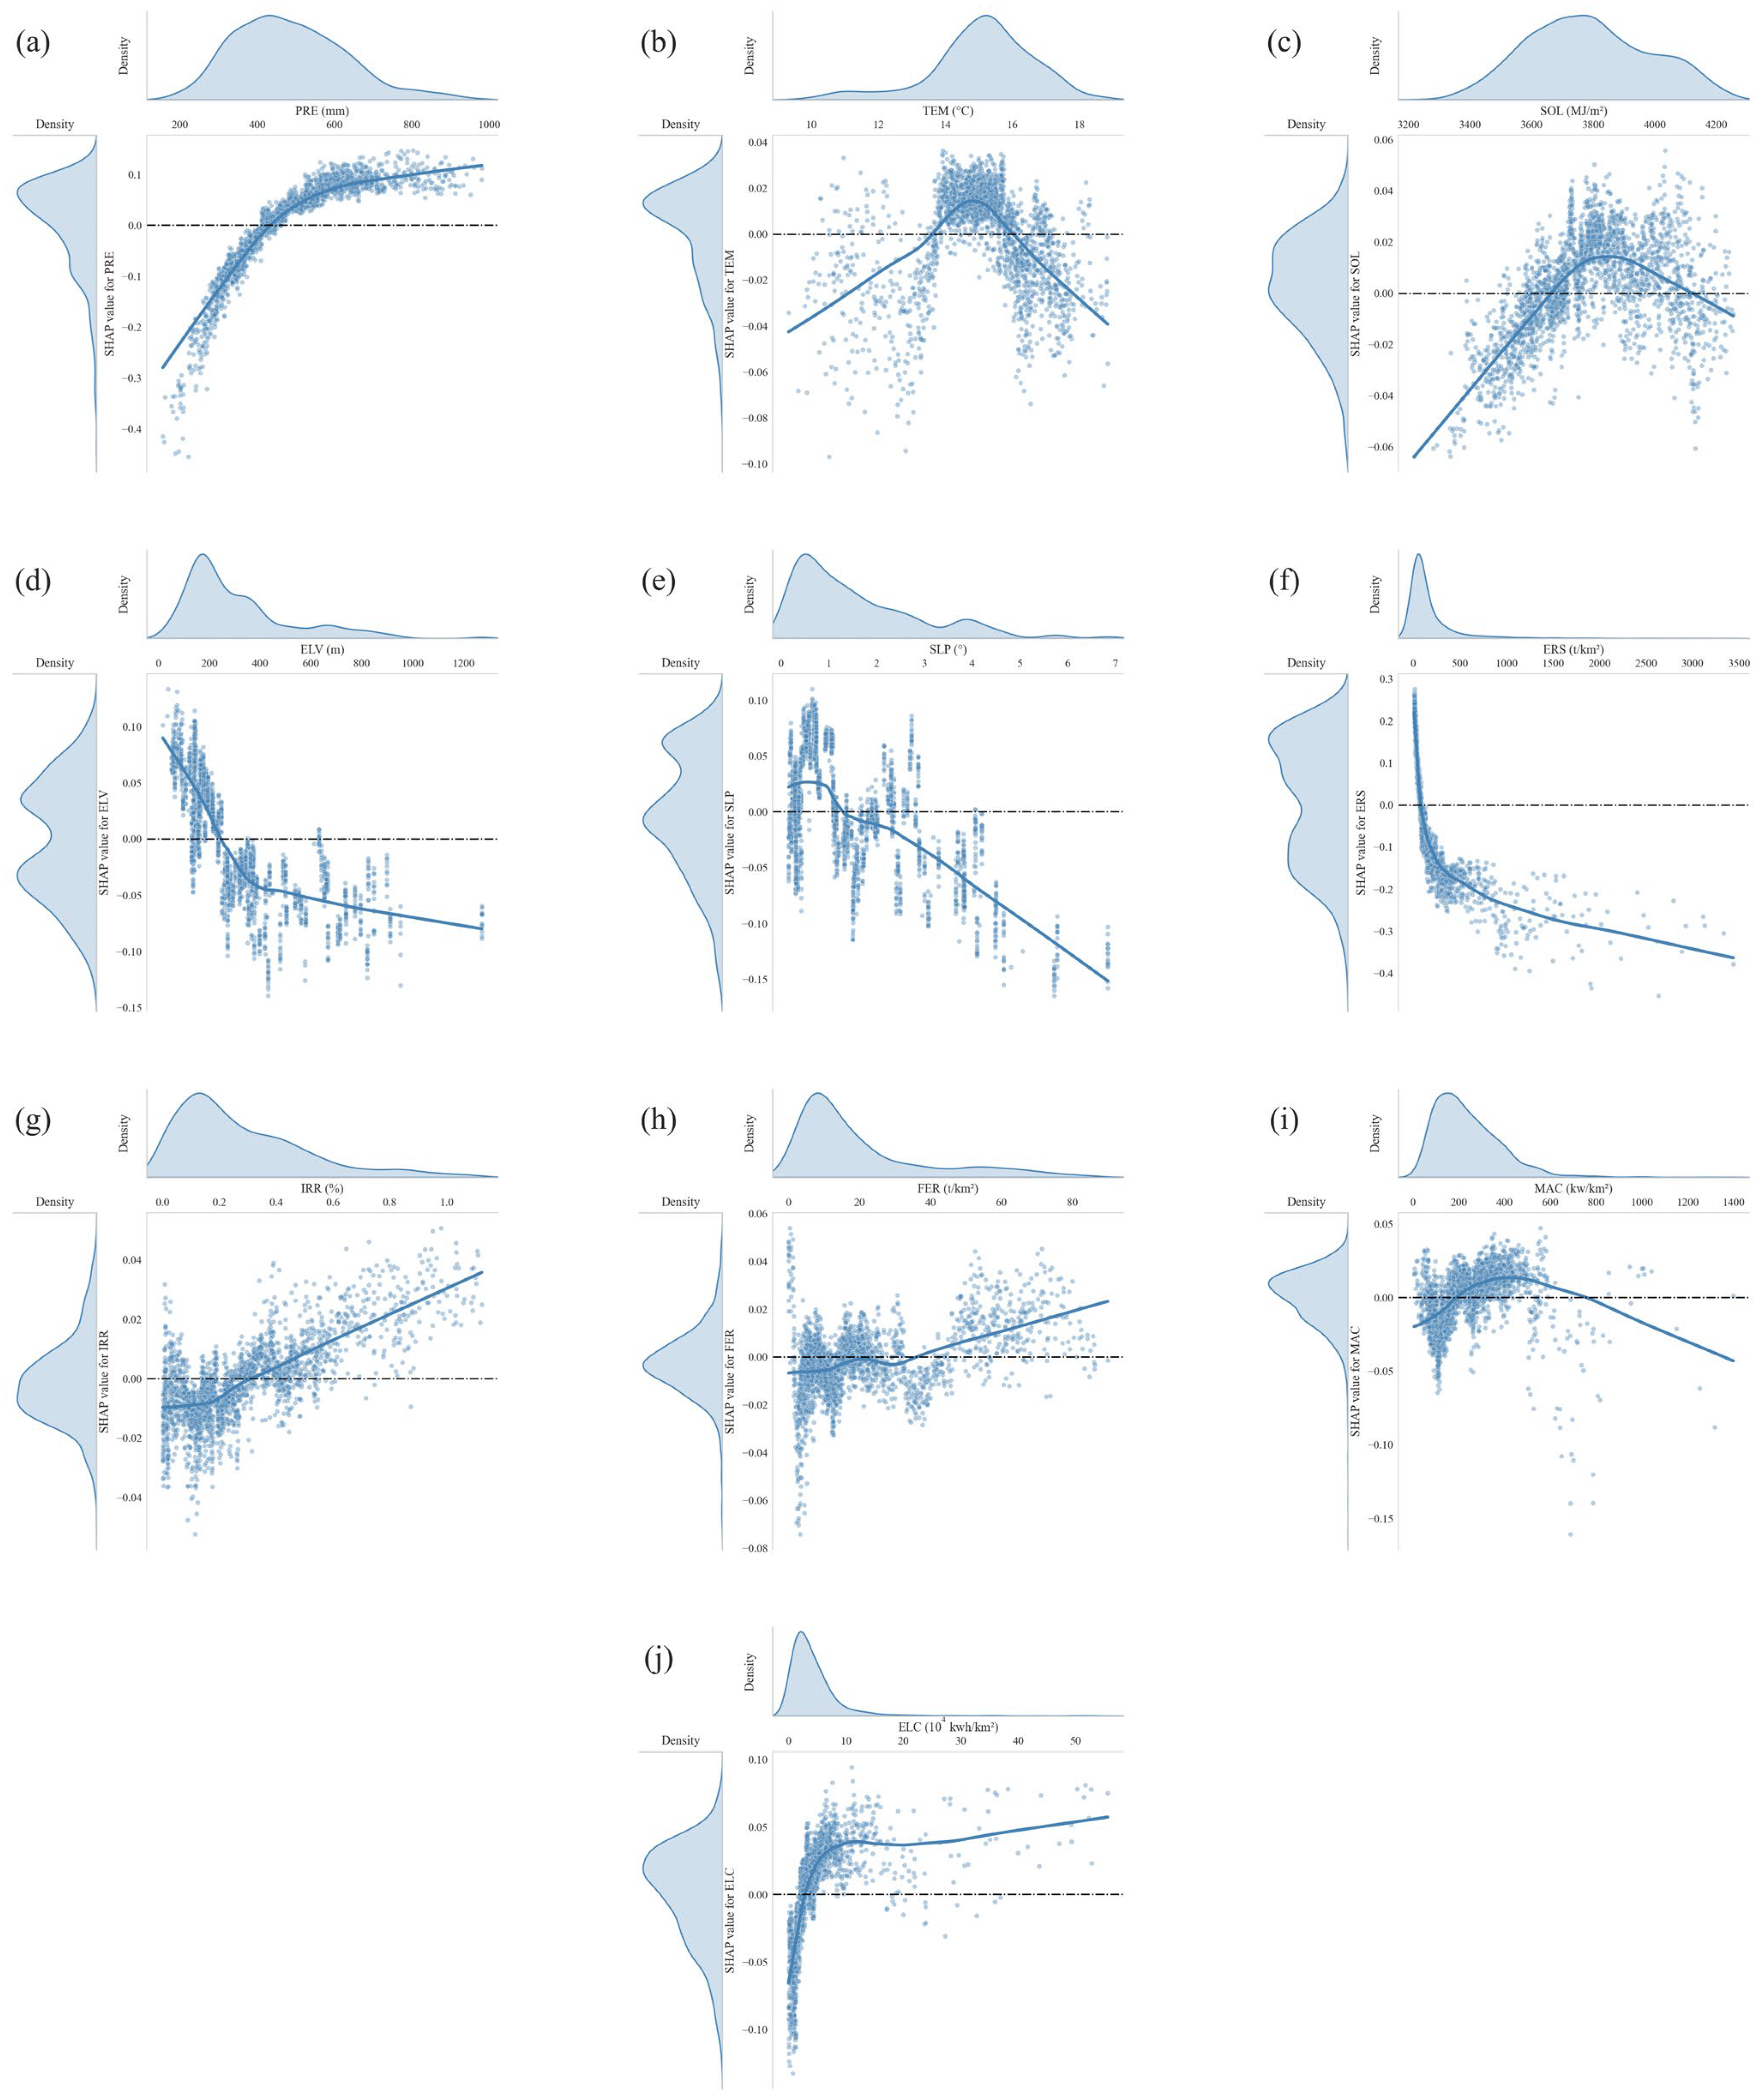
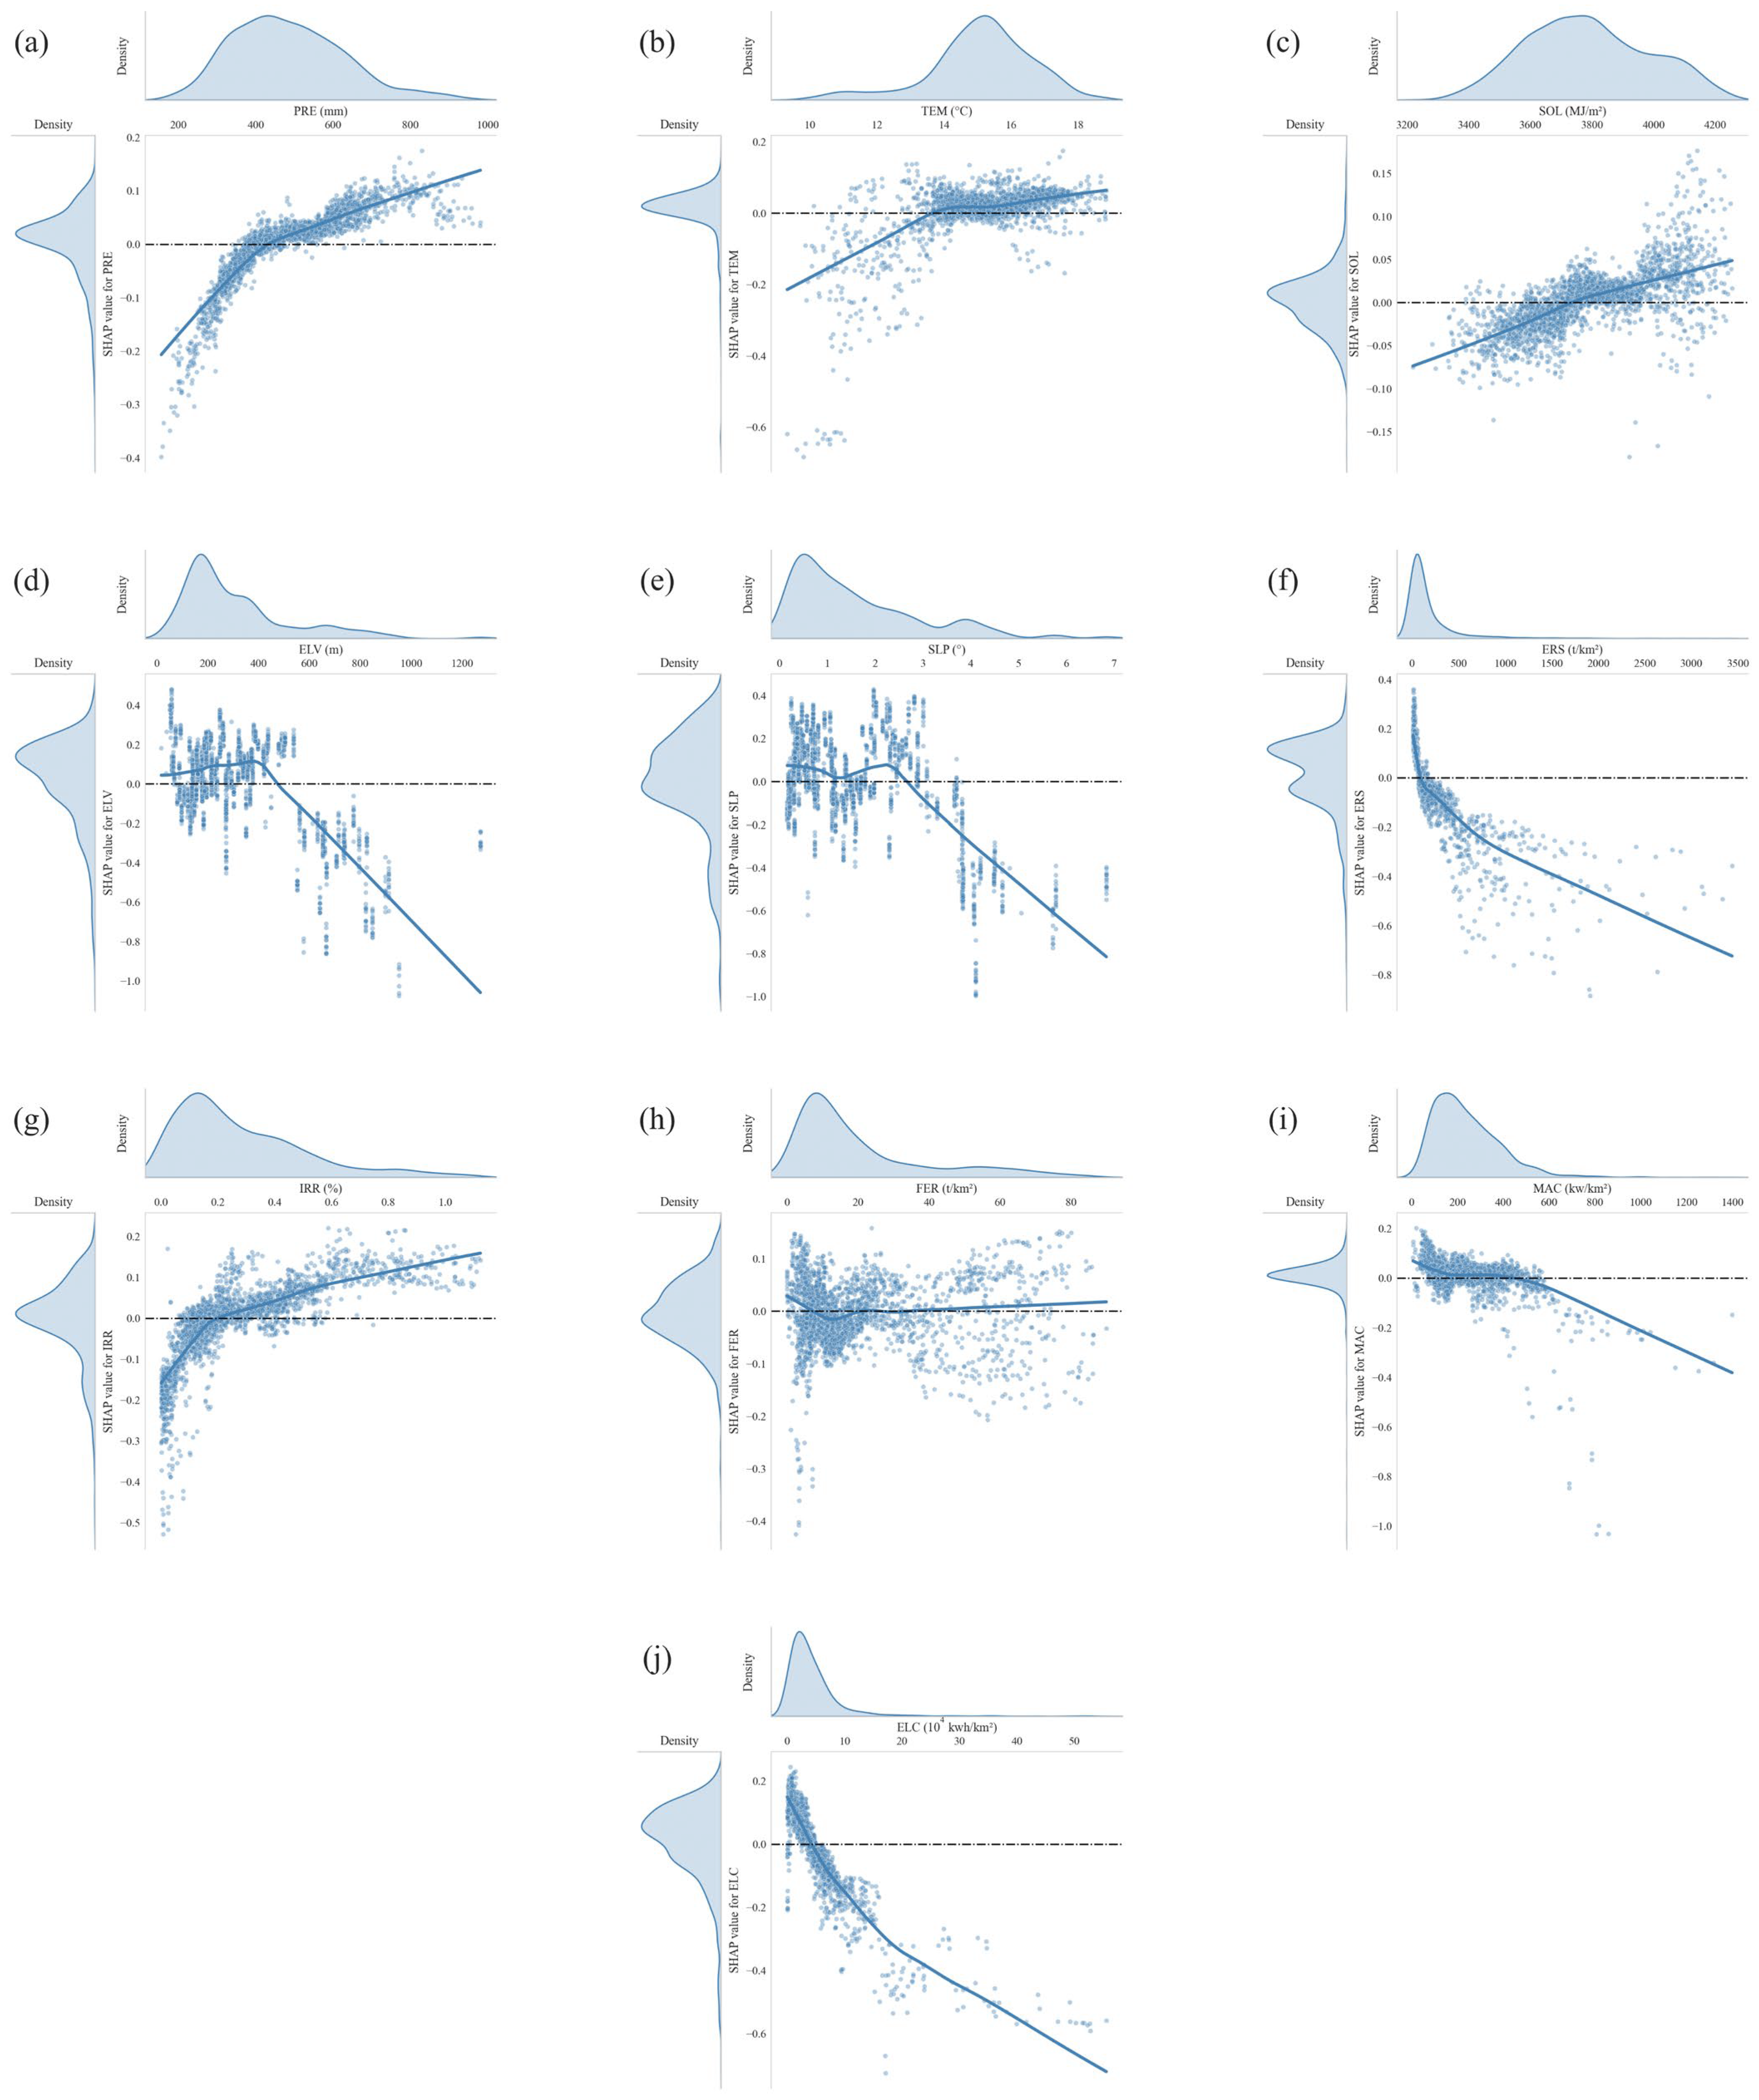
3.3.2. Identification of the Key Drivers of Cropland Productivity

Based on the optimal model results, the relative importance of each driving factor was quantified using the mean absolute SHAP values, with positive or negative values indicating the direction of influence. As illustrated in Figure 7, the primary factors influencing cropland productivity align closely with the ranking obtained from the OPGD analysis. Erosion intensity maintained the dominant factor for ACP, with a mean absolute SHAP value of 0.130. Topographic conditions, such as elevation and slope, remained critical determinants for TCP, with mean absolute SHAP values of 0.174 and 0.179, respectively, significantly higher than those of other factors.
Figure 8 presents the driving mechanisms behind ACP revealed by the SHAP value distributions. Erosion intensity exhibited the most significant negative correlation with ACP. Specifically, SHAP values rapidly decreased as erosion intensity increased. In contrast, precipitation showed a positive relationship with ACP. Precipitation has the opposite pattern. As shown in Figure 8a, a clear threshold around 400 mm separates negative to positive SHAP values, matching the climatic boundary between semi-arid and semi-humid regions in China. Fertilizer application intensity and rural electricity consumption displayed similar SHAP value distributions to precipitation; low input levels had limited positive effects, whereas higher fertilizer and electricity use were associated with increasingly positive SHAP values, enhancing ACP.
Figure 9 illustrates the dependency of SHAP values on driving factors for the TCP model. Notably, for average elevation and slope, the critical thresholds at which SHAP values transitioned from positive to negative were approximately 400 m and 0.5°, respectively. Gentle terrains below these thresholds positively contributed to TCP, whereas higher elevations and steeper slopes significantly limited cropland expansion and productivity, reflecting a predominantly negative contribution. Erosion continues to exert a substantial negative impact on TCP. In addition, a similar threshold effect of precipitation (approximately 400 mm) re-emerged, while the pattern of fertilizer application was less clear.

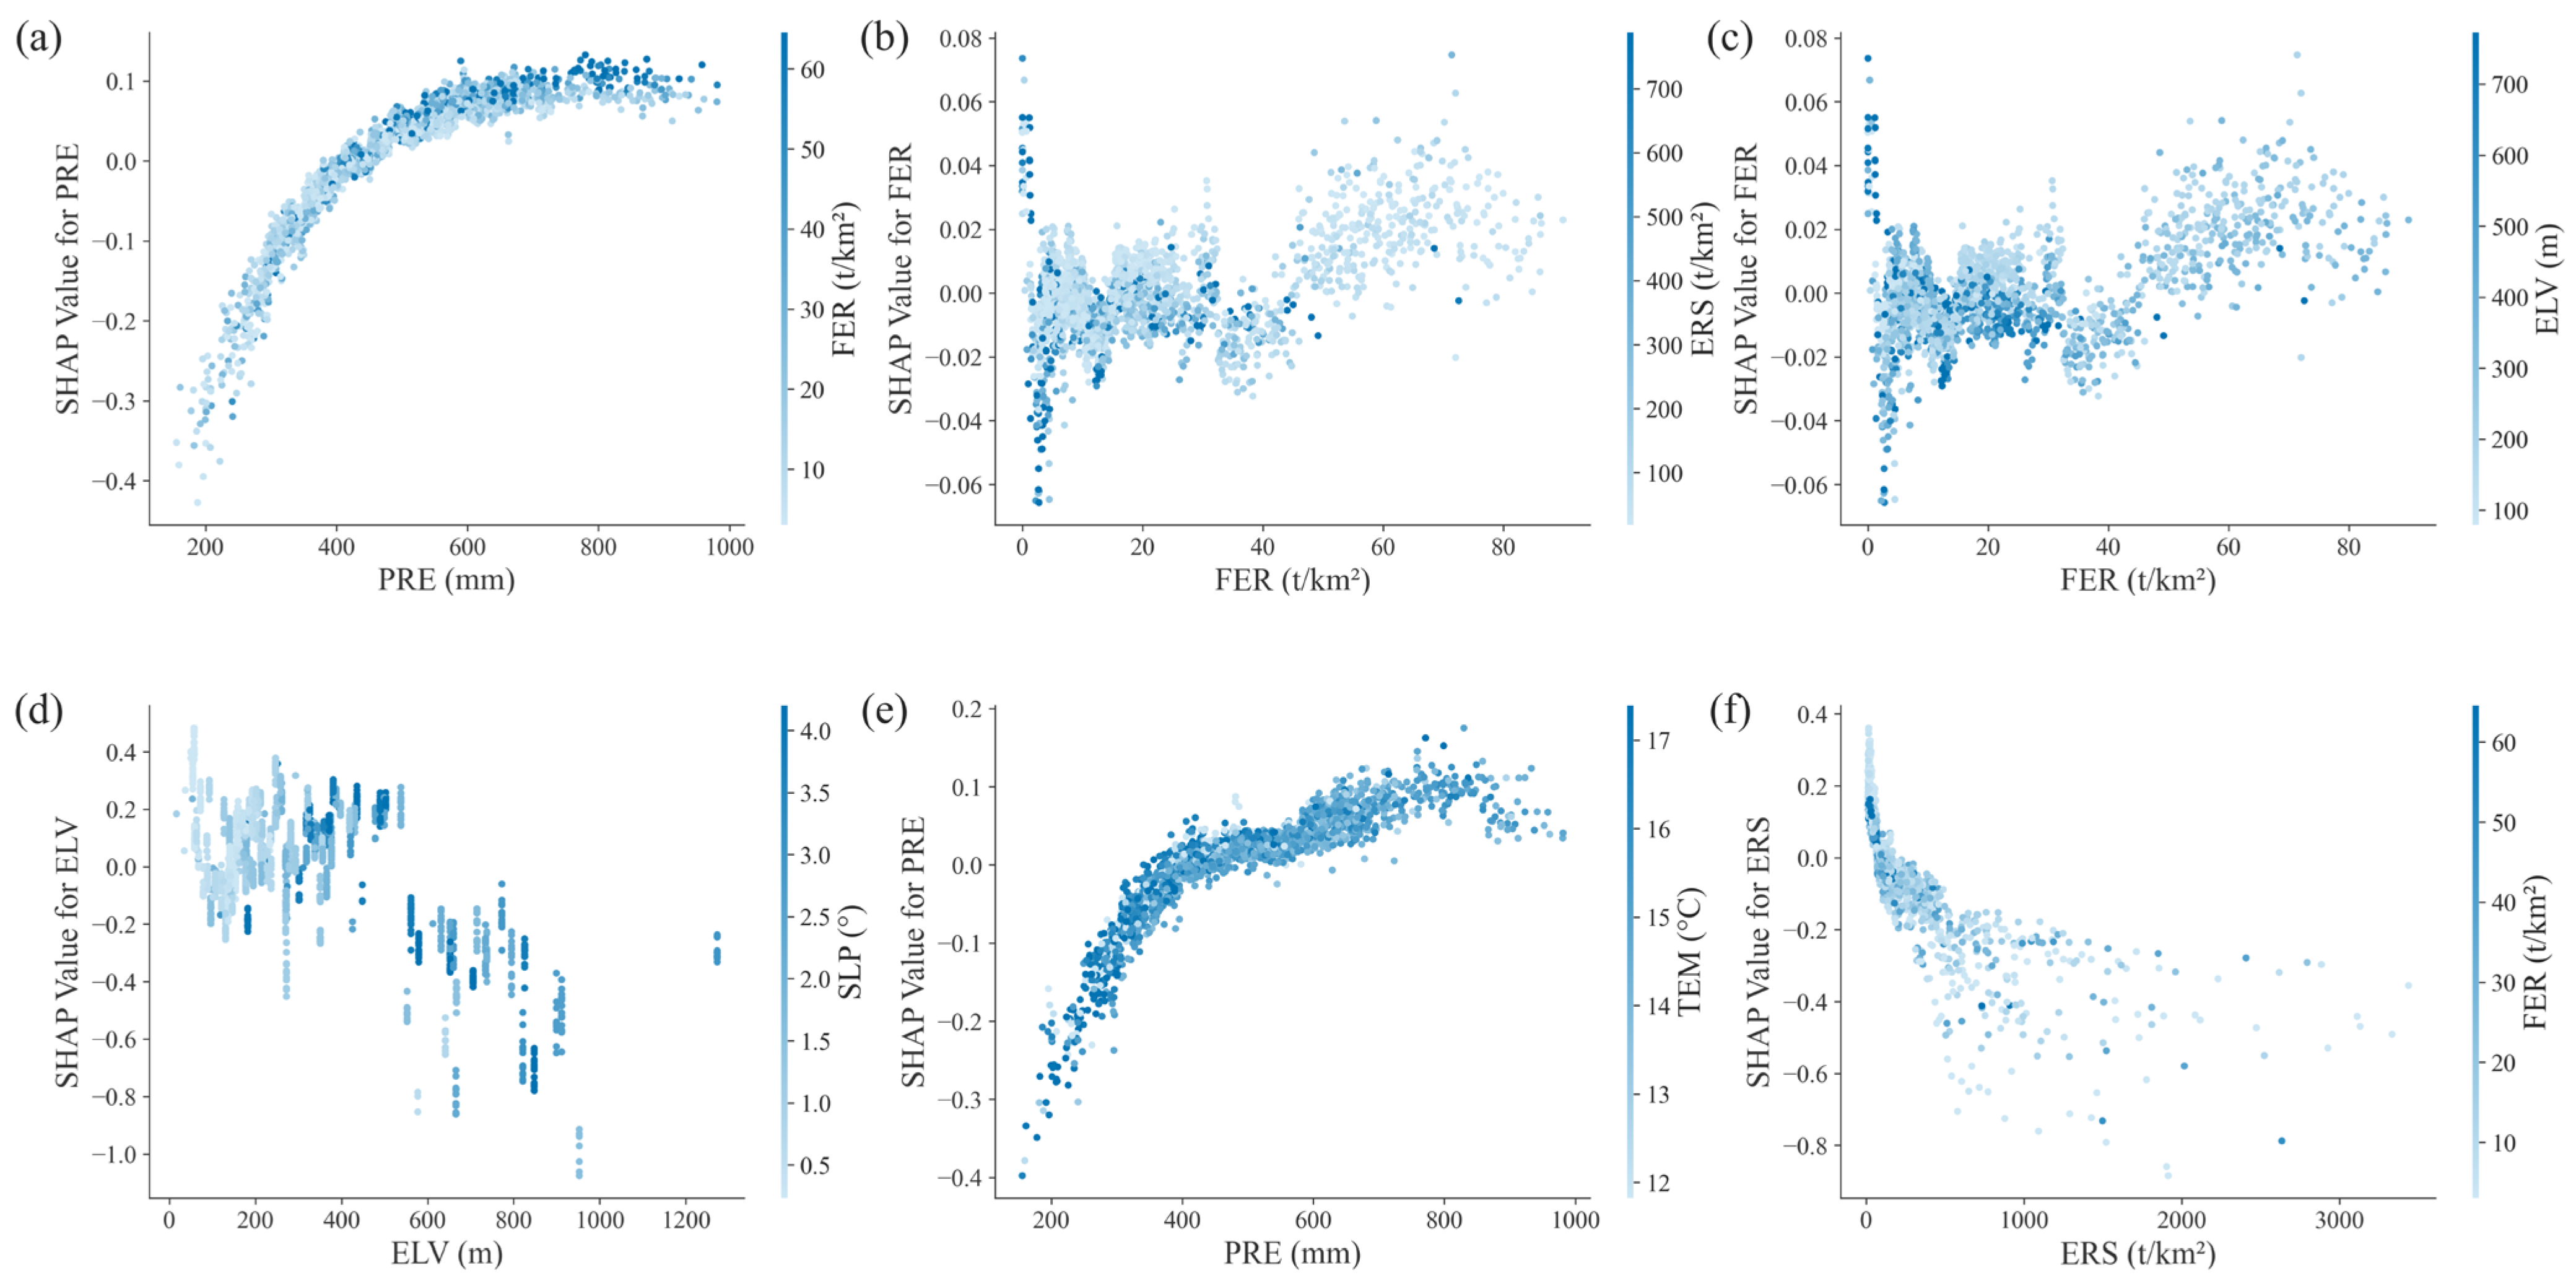
3.3.3. Interactions Between the Key Drivers of Cropland Productivity

In this section, we visualized SHAP interaction values to reveal the effects among the key driving factors for cropland productivity, as illustrated in Figure 10, while the interaction results for the remaining factors can be found in Appendix A, Figure A1.
For the ACP model, significant spatial heterogeneity was observed in the interaction effects between total precipitation during the growing season and fertilizer application intensity (Figure 10a). In regions with abundant precipitation (>400 mm), increased fertilizer intensity corresponded to higher SHAP interaction values. Conversely, in semi-arid and semi-humid regions with precipitation below 400 mm, the enhancing effect of increased fertilizer application was less pronounced. Furthermore, as depicted in Figure 10b, the interaction between fertilizer application intensity and erosion intensity indicated that areas with a combination of lower erosion intensity and higher fertilizer application intensity significantly enhance ACP. Similarly, the interaction effect between elevation and fertilizer application intensity (Figure 10c) revealed that the positive contribution of fertilizer application was particularly pronounced in flat, low-elevation (<300 m) plain areas.
For the TCP model, the interaction between average elevation and slope (Figure 10d) also highlighted their significant positive contributions to TCP. While in regions above 600 m elevation, slope gradients did not clearly affect SHAP interaction values. Additionally, counties with relatively high temperatures (>16 °C) under inadequate precipitation (<400 mm) conditions exhibit a negative impact on TCP (Figure 10e). However, as precipitation increased, the positive influence of increasing temperature on SHAP interaction values became more pronounced. The interaction pattern between soil erosion and fertilizer application intensity for TCP was largely consistent with ACP (Figure 10c,f). In areas with lower erosion intensity and favorable ecological environments, increased fertilizer application contributed positively to SHAP interaction values. In contrast, in areas experiencing severe erosion, moderate fertilizer application was more effective in increasing productivity, while overuse of chemical fertilizer may damage TCP.

4. Discussion

4.1. Importance, Mechanisms, and Thresholds of the Multidimensional Drivers for Cropland Productivity

In this study, OPGD and SHAP exhibited highly consistent results in identifying and ranking key driving factors of ACP and TCP. Both methods highlighted that erosion intensity dominated the driving factors for ACP, while slope and elevation emerged as the most crucial determinants for TCP. Thus, OPGD provides an effective approach for the preliminary screening of potential drivers, whereas SHAP provides in-depth insights into their underlying driving mechanisms [35,46,55]. Overall, climate conditions, topographical and ecological drivers fundamentally shaped the spatial patterns and temporal trends of cropland productivity [56,57,58], thereby constraining the effectiveness of agricultural management and input-related factors, which depend heavily on their alignment with local ecological and environmental conditions [59,60,61,62].
The OPGD and SHAP analysis both indicated that the total precipitation during the growing season was among the major drivers of cropland productivity, especially for ACP at the county level. Previous studies have demonstrated that the seasonality and accumulation of effective precipitation are essential for potential cropland productivity and its stable growth [63,64]; therefore, its benefits for cropland productivity grow when the amount of precipitation during the growing season increases. Interestingly, the identified critical precipitation threshold at around 400 mm for both ACP and TCP aligns precisely with the well-documented 400 mm precipitation contour that isolates China’s semi-humid and semi-arid zones. While this climatic boundary has long been empirically recognized as a key determinant of agricultural suitability [65], our SHAP dependency analysis provides a data-driven quantitative validation of its importance in cropland productivity dynamics. This precipitation threshold reflects the water requirements constraining cropland productivity from a spatial perspective. Regions below this threshold should focus on drought-resilient crop species and expansion of water-efficient irrigation facilities [66,67], whereas regions with adequate water supply from growing season precipitation cropland exhibit more resilience to climate variability [16,43] and would benefit more from effective fertilizer use [68] as the interaction results implied. Meanwhile, the interaction between temperature and precipitation indicated that although increased precipitation showed a consistent trend of improving cropland productivity, growing season temperature exhibited an optimal interval. As shown in Figure 8b, lower temperature (approximately lower than 13 °C) increases the risk of cold events, while higher temperature (approximately greater than 17 °C) reduces effective precipitation [69], thereby diminishing cropland productivity.
Erosion intensity, calculated as the accumulation of wind and water erosion divided by cropland area for each county, emerged as the most important driver for ACP. Meanwhile, the SHAP dependency plots further indicated that increasing erosion intensity substantially exacerbated its negative impacts on cropland productivity, which coincided with previous studies on the degradation of black soil in Northeast China [7,70,71,72]. The erosion process involves not only the physical degradation associated with thinning of the black soil layer but also the loss of soil organic matter and depletion of key nutrients, such as N, P, and K, which are essential for maintaining soil fertility [21]. Furthermore, the ecological deterioration resulting from erosion indirectly undermines soil health [73] and fertility recovery and reduces the resilience to climate variability in the long term [74,75]. The interaction between erosion and fertilizer application intensity (Figure 10b,f), however, indicated that the effectiveness of fertilizer application depended on erosion intensity, implying an underlying relation between fertilizer usage and the ecological environment. Therefore, strict policies should prioritize strengthening the monitoring and management of soil erosion in Northeast China and adopt conservation tillage practices to mitigate soil and nutrient loss, thereby enhancing cropland productivity and supporting sustainable agricultural development.
Slope and elevation were also identified as major determinants of cropland productivity. Particularly, they combined exhibited substantially greater importance on TCP compared to other explanatory variables. According to the SHAP dependency plots, areas characterized by gentle slopes (<1.5°) and moderate elevations (<300 m) were generally positively associated with higher cropland productivity. Conversely, increases in slope steepness and elevation beyond these thresholds tended to negatively influence cropland productivity. Moreover, the interaction effect between slope and elevation further indicated that those regions below these thresholds were significantly more productive [3,22,46,59]. Spatially, these highly productive regions are distributed across the Songnen, Liaohe, and Sanjiang Plains. These three plains constitute the core black soil region and represent the major grain-producing areas of Northeast China. Overall, these results underscore the critical role of topographic conditions in shaping county-level TCP.

4.2. Policy Implications

Based on the above findings, this study proposes the following policy recommendations to enhance cropland productivity in Northeast China:
(1) Enhance black soil conservation policies against ecological degradation. Soil erosion, including water and wind erosion, remains a major threat to cropland productivity. To address this, efforts should be intensified to protect black soils through the establishment of high-standard farmland and widespread adoption of conservation tillage practices. As this study revealed, the positive impact of fertilizer application intensity diminishes in severely eroded areas. Therefore, fertilizer management should be scientifically optimized by promoting soil testing-based fertilization and organic fertilizer substitution, with the goal of achieving zero growth and eventual reduction in chemical fertilizer application.
(2) Promote region-specific management strategies based on the threshold effects of key drivers. This study identified threshold effects for precipitation, slope, and elevation. Regions with gentle terrain, including low slopes and elevations, are highly suitable for large-scale mechanized agricultural production. Notably, the interaction between slope and elevation exhibited a strong enhancement effect, reinforcing the importance of topographic suitability. Regions with adequate precipitation should focus on maximizing their potential cropland productivity. As for counties with precipitation levels below 400 mm, efforts should prioritize expanding irrigation coverage and improving water-use efficiency to mitigate water constraints and enhance the resilience of cropland productivity in arid environments.

4.3. Advantages and Limitations

This study constructed a comprehensive analytical framework based on the OPGD combined with the SHAP algorithm, integrating statistical approaches with machine learning methods. The framework systematically investigates the spatial heterogeneity of cropland productivity in Northeast China and systematically identifies multidimensional drivers from three aspects: (1) relative importance ranking of drivers, (2) nonlinear and interactive influence patterns, and (3) critical thresholds of spatial drivers. The main advantages of this framework include the following:
(1) This integrated approach overcomes previous methodological limitations, such as the separate treatment of mechanistic interpretation and factor-contribution analyses and the difficulty of quantitatively determining critical thresholds for explanatory variables. As a result, this integrated method provides robust methodological support for developing precise regional cropland management policies.
(2) Taking advantage of the model-agnostic nature of the SHAP algorithm, this study incorporated a hyperparameter optimization phase, where we compared multiple competing machine learning models in order to further enhance predictive accuracy and model generalizability, thereby improving the overall reliability of the results.
Despite these advantages, several limitations for further improvement remain. In particular, the selection of explanatory variables could be expanded to account for additional agricultural practices (e.g., cropping systems and regional agricultural policies) [76], socioeconomic factors (e.g., farming inputs and cropland transformation) [77], and in-depth analysis of detailed climate change factors if data are available. Moreover, as Northeast China mostly follows a single-cropping system, future studies extending this model to other regions with more complex cropping systems need to consider how different crop-management systems influence cropland productivity and its recovery, as well as adjustments in driver selection and model optimization.
Additionally, the cropland productivity in this study sources from NPP simulations based on the CASA model, which inevitably incorporates modeling errors that may add uncertainty to the results. Nevertheless, systematic model optimization and cross-validation procedures in this study ensured the reliability of key findings. Further research may also focus on the temporal dynamics in the importance and influence mechanisms of driving factors across different periods. With the support of long-term high-resolution remote sensing imagery and more detailed crop-specific statistical data, the research could construct two cropland productivity metrics: (1) nutrition-based calorie productivity computed through crop-type-specific conversion coefficients and (2) cropland economic productivity measured by the marketing prices of various crops [78]. Applying the OPGD-SHAP framework to analyze the drivers of cropland productivity would enable a more comprehensive understanding of its spatial heterogeneity and dynamics in agricultural systems.

5. Conclusions

This study established an integrated OPGD-SHAP framework to analyze the importance, mechanisms, and threshold effects of driving factors of county-level cropland productivity in Northeast China from 2001 to 2020. The main conclusions are as follows:
(1) OPGD results confirmed the dominant role of natural and ecological factors in shaping the spatial distribution of cropland productivity. Factor interactions predominantly exhibited dual-factor or nonlinear enhancement effects, indicating that pairwise interactions significantly improved explanatory power compared with individual variables. Among all interactions, the combined effect of average slope and elevation ranked highest for both ACP and TCP, underscoring the fundamental importance of topographic conditions.
(2) Through grid search and 10-fold cross-validation, hyperparameter-optimized LightGBM and CatBoost outperformed the other models for ACP and TCP, respectively. The SHAP analysis was conducted based on these optimal models to further interpret factor importance, influence mechanisms and threshold effects. SHAP analysis revealed that erosion intensity had a strong negative effect on ACP, while precipitation, fertilizer intensity, and electricity consumption were identified as major positive contributors. The impact of total precipitation during the growing season shifted from negative to positive at approximately 400 mm, aligning with China’s semi-arid/semi-humid ecotone boundary. Low-elevation plains (<300 m) and gentle slopes (<1.5°) significantly enhanced TCP, reflecting optimal topographic and climatic conditions for sustaining high cropland productivity. The interaction between soil erosion and fertilizer application intensity further suggests that in severely eroded counties, moderate fertilization is recommended to mitigate ecological degradation—offering practical insights for targeted and region-specific cropland management policies.

Author Contributions

Conceptualization, R.G. and H.C.; data curation, R.G.; methodology, R.G.; formal analysis, R.G. and H.C.; software, R.G.; visualization, R.G.; writing—original draft preparation, R.G.; writing—review and editing, H.C. and X.X.; resources, H.C.; funding acquisition, H.C. and X.X.; supervision, H.C. All authors have read and agreed to the published version of the manuscript.

Funding

This research was funded by the National Key Research and Development Program of China, grant number 2021YFD1500101.

Data Availability Statement

The raw data supporting the conclusions of this article will be made available by the authors upon request.

Conflicts of Interest

The authors declare no conflicts of interest. The funders had no role in the design of the study, in the collection, analyses, or interpretation of data, in the writing of the manuscript, or in the decision to publish the results.

Abbreviations

The following abbreviations are used in this manuscript:
GDGeographical detector
OPGDOptimal parameter-based geographical detector
SHAPSHapley Additive exPlanations
NPPNet Primary Productivity
CASACarnegie-Ames-Stanford Approach
ACPAverage cropland productivity
TCPTotal cropland productivity
PREPrecipitation
TEMTemperature
SOLSolar radiation
ELVElevation
SLPSlope
ERSErosion
IRREffective irrigation
FERFertilizer application
MACMachinery
ELCElectricity

Appendix A

Table A1. Discretization types of driving factors.
VariableACPTCP
MethodNumberMethodNumber
PRENatural7Equal9
TEMStandard deviation9Standard deviation9
MACGeometric9Geometric9
IRRNatural9Quantile8
FERNatural9Natural9
ELEQuantile9Quantile9
ERSNatural9Quantile9
SOLNatural9Natural9
ALTQuantile7Quantile9
SLPQuantile9Quantile8
Table A2. Descriptions and tuning results of hyperparameters.
ModelHyperparameterDescriptionSearch RangeBest Value
ACPTCP
CatBoostdepthMaximum tree depth[3, 5, 7]53
iterationsNumber of boosting iterations[100, 200, 300]300300
l2_left_regL2 regularization coefficient[1, 3, 5]13
learning_rateStep size shrinkage for boosting[0.01, 0.1, 0.2]0.20.2
XGBoostcolsample_bytreeFraction of features sampled for each tree[100, 200, 300]0.81
learning_rateStep size shrinkage for boosting[0.01, 0.1, 0.2]0.10.2
max_depthMaximum tree depth[3, 5, 7]53
n_estimatorNumber of boosting trees[0.6, 0.8, 1.0]300300
subsampleFraction of features sampled for each tree[0.6, 0.8, 1.0]0.61
LightGBMcolsample_bytreeFraction of features sampled for each tree[100, 200, 300]0.61
learning_rateStep size shrinkage for boosting[0.01, 0.1, 0.2]0.20.2
max_depthMaximum tree depth[3, 5, 7]33
n_estimatorNumber of boosting trees[0.6, 0.8, 1.0]300300
subsampleFraction of features sampled for each tree[0.6, 0.8, 1.0]0.60.6
Random Forestmax_depthMaximum tree depth[100, 200, 300] [3, 5, 7]NoneNone
n_estimatorNumber of trees in the forest[None, 3, 5, 7]300100
Support Vector MachineCRegularization parameter[0.1, 1, 10]1010
epsilonEpsilon parameter in epsilon-SVR[0.01, 0.1, 1]0.10.1
kernelKernel function type[rbf, linear, poly]rbfrbf
Figure A1. SHAP interactive plot of driving factors for cropland productivity: (a) ACP; (b) TCP.
Land 14 01010 g0a1

References

  1. Shi, W.; Wang, M.; Liu, Y. Crop Yield and Production Responses to Climate Disasters in China. Sci. Total Environ. 2021, 750, 141147. [Google Scholar] [CrossRef] [PubMed]
  2. Yan, H.; Du, W.; Zhou, Y.; Luo, L.; Niu, Z. Satellite-Based Evidences to Improve Cropland Productivity on the High-Standard Farmland Project Regions in Henan Province, China. Remote Sens. 2022, 14, 1724. [Google Scholar] [CrossRef]
  3. Han, B.; Jin, X.; Yeting, F.; Chen, H.; Jin, J.; Xu, W.; Ren, J.; Zhou, Y. Trend and Spatial Pattern of Stable Cropland Productivity in China Based on Satellite Observations (2001–2020). Environ. Impact Assess. Rev. 2023, 101, 107136. [Google Scholar] [CrossRef]
  4. Liu, Y.; Sun, D.; Wang, H.; Wang, X.; Yu, G.; Zhao, X. An Evaluation of China’s Agricultural Green Production: 1978–2017. J. Clean. Prod. 2020, 243, 118483. [Google Scholar] [CrossRef]
  5. National Bureau of Statistics of China. China Statistical Yearbook; China Statistics Press: Beijing, China, 2024. [Google Scholar]
  6. Xu, X.Z.; Xu, Y.; Chen, S.C.; Xu, S.G.; Zhang, H.W. Soil Loss and Conservation in the Black Soil Region of Northeast China: A Retrospective Study. Environ. Sci. Policy 2010, 13, 793–800. [Google Scholar] [CrossRef]
  7. Duan, X.; Xie, Y.; Ou, T.; Lu, H. Effects of Soil Erosion on Long-Term Soil Productivity in the Black Soil Region of Northeastern China. CATENA 2011, 87, 268–275. [Google Scholar] [CrossRef]
  8. Liu, Z.; Wang, M.; Liu, X.; Wang, F.; Li, X.; Wang, J.; Hou, G.; Zhao, S. Ecological Security Assessment and Warning of Cultivated Land Quality in the Black Soil Region of Northeast China. Land 2023, 12, 1005. [Google Scholar] [CrossRef]
  9. Yang, X.; Lin, E.; Ma, S.; Ju, H.; Guo, L.; Xiong, W.; Li, Y.; Xu, Y. Adaptation of Agriculture to Warming in Northeast China. Clim. Change 2007, 84, 45–58. [Google Scholar] [CrossRef]
  10. Xu, Q.; Liang, H.; Wei, Z.; Zhang, Y.; Lu, X.; Li, F.; Wei, N.; Zhang, S.; Yuan, H.; Liu, S.; et al. Assessing Climate Change Impacts on Crop Yields and Exploring Adaptation Strategies in Northeast China. Earths Future 2024, 12, e2023EF004063. [Google Scholar] [CrossRef]
  11. Mechiche-Alami, A.; Abdi, A.M. Agricultural Productivity in Relation to Climate and Cropland Management in West Africa. Sci. Rep. 2020, 10, 3393. [Google Scholar] [CrossRef]
  12. Ray, D.K.; Gerber, J.S.; MacDonald, G.K.; West, P.C. Climate Variation Explains a Third of Global Crop Yield Variability. Nat. Commun. 2015, 6, 5989. [Google Scholar] [CrossRef] [PubMed]
  13. Raseduzzaman, M.; Jensen, E.S. Does Intercropping Enhance Yield Stability in Arable Crop Production? A Meta-Analysis. Eur. J. Agron. 2017, 91, 25–33. [Google Scholar] [CrossRef]
  14. Li, T.; Long, H.; Zhang, Y.; Tu, S.; Ge, D.; Li, Y.; Hu, B. Analysis of the Spatial Mismatch of Grain Production and Farmland Resources in China Based on the Potential Crop Rotation System. Land Use Policy 2017, 60, 26–36. [Google Scholar] [CrossRef]
  15. Shah, F.; Wu, W. Soil and Crop Management Strategies to Ensure Higher Crop Productivity within Sustainable Environments. Sustainability 2019, 11, 1485. [Google Scholar] [CrossRef]
  16. Egli, L.; Schröter, M.; Scherber, C.; Tscharntke, T.; Seppelt, R. Crop Diversity Effects on Temporal Agricultural Production Stability across European Regions. Reg. Environ. Change 2021, 21, 96. [Google Scholar] [CrossRef]
  17. Zymaroieva, A.; Zhukov, O.; Fedoniuk, T.; Pinkina, T.; Hurelia, V. The Relationship Between Landscape Diversity and Crops Productivity: Landscape Scale Study. J. Landsc. Ecol. 2021, 14, 39–58. [Google Scholar] [CrossRef]
  18. Penghui, J.; Manchun, L.; Liang, C. Dynamic Response of Agricultural Productivity to Landscape Structure Changes and Its Policy Implications of Chinese Farmland Conservation. Resour. Conserv. Recycl. 2020, 156, 104724. [Google Scholar] [CrossRef]
  19. Nguyen, L.H.; Robinson, S.V.J.; Galpern, P. Effects of Landscape Complexity on Crop Productivity: An Assessment from Space. Agric. Ecosyst. Environ. 2022, 328, 107849. [Google Scholar] [CrossRef]
  20. Lichtenberg, E.; Ding, C. Assessing Farmland Protection Policy in China. Land Use Policy 2008, 25, 59–68. [Google Scholar] [CrossRef]
  21. Liu, Q.; Xu, H.; Yi, H. Impact of Fertilizer on Crop Yield and C:N:P Stoichiometry in Arid and Semi-Arid Soil. Int. J. Environ. Res. Public Health 2021, 18, 4341. [Google Scholar] [CrossRef]
  22. Li, T.; Li, L.; Chen, X.; Zhang, S.; Wang, H.; Pu, Y.; Xu, X.; Wang, G.; Jia, Y.; Li, H.; et al. Soil Quality Assessment of Cropland in China and Its Relationships with Climate and Topography. Land Degrad. Dev. 2023, 34, 637–652. [Google Scholar] [CrossRef]
  23. Long, Y.; Zeng, Y.; Liu, X.; Yang, Y. Multivariate Analysis of Grain Yield and Main Agronomic Traits in Different Maize Hybrids Grown in Mountainous Areas. Agriculture 2024, 14, 1703. [Google Scholar] [CrossRef]
  24. Dong, H.; Han, J.; Zhang, Y.; Chen, T.; Fan, H.; Wang, C. Research on Influencing Factors of Cultivated Land Productivity of High-Standard Farmland Projects in Hanzhong City of China—An Empirical Study Based on PLS-SEM. Front. Sustain. Food Syst. 2023, 7, 1176426. [Google Scholar] [CrossRef]
  25. Zhang, J.; Zhang, Y.; Qin, Y.; Lu, X.; Cao, J. The Spatiotemporal Pattern of Grassland NPP in Inner Mongolia Was More Sensitive to Moisture and Human Activities than That in the Qinghai-Tibetan Plateau. Glob. Ecol. Conserv. 2023, 48, e02709. [Google Scholar] [CrossRef]
  26. He, Y.; Lin, C.; Wu, C.; Pu, N.; Zhang, X. The Urban Hierarchy and Agglomeration Effects Influence the Response of NPP to Climate Change and Human Activities. Glob. Ecol. Conserv. 2024, 51, e02904. [Google Scholar] [CrossRef]
  27. Guo, X.; Yuan, L.; Chen, X. Spatial-Temporal Variations and Influencing Factors of Vegetation Net Primary Productivity: A Case Study of Yunnan Province, China. Pol. J. Environ. Stud. 2025, 34, 2141–2156. [Google Scholar] [CrossRef]
  28. Wang, C.; Wang, L.; Zhao, W.; Zhang, Y.; Liu, Y. Analysis of Spatiotemporal Change and Driving Factors of NPP in Qilian Mountains From 2000 to 2020. Rangel. Ecol. Manag. 2024, 96, 56–66. [Google Scholar] [CrossRef]
  29. Long, B.; Zeng, C.; Zhou, T.; Yang, Z.; Rao, F.; Li, J.; Chen, G.; Tang, X. Quantifying the Relative Importance of Influencing Factors on NPP in Hengduan Mountains of the Tibetan Plateau from 2002 to 2021: A Dominance Analysis. Ecol. Inform. 2024, 81, 102636. [Google Scholar] [CrossRef]
  30. Zhang, H.; Xu, Y.; Lu, Y.; Hasi, E.; Zhang, H.; Zhang, S.; Wang, W. Spatiotemporal Variations and Driving Factors of Crop Productivity in China from 2001 to 2020. J. Environ. Manag. 2024, 371, 123344. [Google Scholar] [CrossRef]
  31. Yi, Z.; Wu, L. Identification of Factors Influencing Net Primary Productivity of Terrestrial Ecosystems Based on Interpretable Machine Learning—Evidence from the County-Level Administrative Districts in China. J. Environ. Manag. 2023, 326, 116798. [Google Scholar] [CrossRef]
  32. Ba, W.; Qiu, H.; Cao, Y.; Gong, A. Spatiotemporal Characteristics Prediction and Driving Factors Analysis of NPP in Shanxi Province Covering the Period 2001–2020. Sustainability 2023, 15, 12070. [Google Scholar] [CrossRef]
  33. Li, T.; Zhang, Q.; Peng, Y.; Guan, X.; Li, L.; Mu, J.; Wang, X.; Yin, X.; Wang, Q. Contributions of Various Driving Factors to Air Pollution Events: Interpretability Analysis from Machine Learning Perspective. Environ. Int. 2023, 173, 107861. [Google Scholar] [CrossRef] [PubMed]
  34. Meng, X.; Li, S.; Akhmadi, K.; He, P.; Dong, G. Trends, Turning Points, and Driving Forces of Desertification in Global Arid Land Based on the Segmental Trend Method and SHAP Model. GIScience Remote Sens. 2024, 61, 2367806. [Google Scholar] [CrossRef]
  35. Yang, L.; Ji, X.; Li, M.; Yang, P.; Jiang, W.; Chen, L.; Yang, C.; Sun, C.; Li, Y. A Comprehensive Framework for Assessing the Spatial Drivers of Flood Disasters Using an Optimal Parameter-Based Geographical Detector–Machine Learning Coupled Model. Geosci. Front. 2024, 15, 101889. [Google Scholar] [CrossRef]
  36. Cassidy, E.S.; West, P.C.; Gerber, J.S.; Foley, J.A. Redefining Agricultural Yields: From Tonnes to People Nourished per Hectare. Environ. Res. Lett. 2013, 8, 034015. [Google Scholar] [CrossRef]
  37. Yu, D.; Shi, P.; Shao, H.; Zhu, W.; Pan, Y. Modelling Net Primary Productivity of Terrestrial Ecosystems in East Asia Based on an Improved CASA Ecosystem Model. Int. J. Remote Sens. 2009, 30, 4851–4866. [Google Scholar] [CrossRef]
  38. Xu, F.; Wang, X.; Li, L. NPP and Vegetation Carbon Sink Capacity Estimation of Urban Green Space Using the Optimized CASA Model: A Case Study of Five Chinese Cities. Atmosphere 2023, 14, 1161. [Google Scholar] [CrossRef]
  39. Zhang, J.; Wang, J.; Chen, Y.; Huang, S.; Liang, B. Spatiotemporal Variation and Prediction of NPP in Beijing-Tianjin-Hebei Region by Coupling PLUS and CASA Models. Ecol. Inform. 2024, 81, 102620. [Google Scholar] [CrossRef]
  40. Xu, X.; Liu, J.; Zhang, S.; Li, R.; Yan, C.; Wu, S. China’s Multi-Period Land Use Land Cover Remote Sensing Monitoring Data Set (CNLUCC); Resource and Environment Data Cloud Platform: Beijing, China, 2018. [Google Scholar]
  41. Zhu, W.-Q.; Pan, Y.-Z.; Zhang, J.-S. Estimation of Net Primary Productivity of Chinese Terrestrial Vegetation Based on Remote Sensing. Chin. J. Plant Ecol. 2007, 31, 413. [Google Scholar]
  42. Dong, M.; Jiang, Y.; Zhang, D.; Wu, Z. Spatiotemporal Change in the Climatic Growing Season in Northeast China during 1960–2009. Theor. Appl. Climatol. 2013, 111, 693–701. [Google Scholar] [CrossRef]
  43. Renard, D.; Tilman, D. National Food Production Stabilized by Crop Diversity. Nature 2019, 571, 257–260. [Google Scholar] [CrossRef] [PubMed]
  44. Egli, L.; Schröter, M.; Scherber, C.; Tscharntke, T.; Seppelt, R. Crop Asynchrony Stabilizes Food Production. Nature 2020, 588, E7–E12. [Google Scholar] [CrossRef] [PubMed]
  45. Wang, S.; Xu, X.; Huang, L. Spatial and Temporal Variability of Soil Erosion in Northeast China from 2000 to 2020. Remote Sens. 2023, 15, 225. [Google Scholar] [CrossRef]
  46. Liu, Y.; Huang, C.; Yang, C.; Chen, C. Spatiotemporal Variation and Driving Factors of Vegetation Net Primary Productivity in the Guanzhong Plain Urban Agglomeration, China from 2001 to 2020. J. Arid Land 2025, 17, 74–92. [Google Scholar] [CrossRef]
  47. He, H.; Ding, R.; Tian, X. Spatiotemporal Characteristics and Influencing Factors of Grain Yield at the County Level in Shandong Province, China. Sci. Rep. 2022, 12, 12001. [Google Scholar] [CrossRef]
  48. Sang, X.; Chen, C.; Hu, D.; Rahut, D.B. Economic Benefits of Climate-Smart Agricultural Practices: Empirical Investigations and Policy Implications. Mitig. Adapt. Strateg. Glob. Change 2024, 29, 9. [Google Scholar] [CrossRef]
  49. Wang, J.; Xu, D. Geodetector: Principle and prospect. Acta Geogr. Sin. 2017, 72, 116–134. [Google Scholar] [CrossRef]
  50. Song, Y.; Wang, J.; Ge, Y.; Xu, C. An Optimal Parameters-Based Geographical Detector Model Enhances Geographic Characteristics of Explanatory Variables for Spatial Heterogeneity Analysis: Cases with Different Types of Spatial Data. GIScience Remote Sens. 2020, 57, 593–610. [Google Scholar] [CrossRef]
  51. Song, Y.; Wu, P. An Interactive Detector for Spatial Associations. Int. J. Geogr. Inf. Sci. 2021, 35, 1676–1701. [Google Scholar] [CrossRef]
  52. Chen, H.; Covert, I.C.; Lundberg, S.M.; Lee, S.-I. Algorithms to Estimate Shapley Value Feature Attributions. Nat. Mach. Intell. 2023, 5, 590–601. [Google Scholar] [CrossRef]
  53. Lundberg, S.; Lee, S.-I. A Unified Approach to Interpreting Model Predictions. In Proceedings of the Advances in Neural Information Processing Systems, Long Beach, CA, USA, 4–9 December 2017. [Google Scholar]
  54. Kuhn, M.; Johnson, K. Applied Predictive Modeling; Springer: New York, NY, USA, 2013; ISBN 978-1-4614-6848-6. [Google Scholar]
  55. Duan, D.; Wang, P.; Rao, X.; Zhong, J.; Xiao, M.; Huang, F.; Xiao, R. Identifying Interactive Effects of Spatial Drivers in Soil Heavy Metal Pollutants Using Interpretable Machine Learning Models. Sci. Total Environ. 2024, 934, 173284. [Google Scholar] [CrossRef] [PubMed]
  56. Xiao, J.; Zhou, Y.; Zhang, L. Contributions of Natural and Human Factors to Increases in Vegetation Productivity in China. Ecosphere 2015, 6, art233. [Google Scholar] [CrossRef]
  57. Yan, Y.; Xu, X.; Liu, X.; Wen, Y.; Ou, J. Assessing the Contributions of Climate Change and Human Activities to Cropland Productivity by Means of Remote Sensing. Int. J. Remote Sens. 2020, 41, 2004–2021. [Google Scholar] [CrossRef]
  58. Sun, F.; Chen, B.; Xiao, J.; Li, F.; Sun, J.; Wang, Y. Effects of Natural Factors and Human Activities on the Spatio-Temporal Distribution of Net Primary Productivity in an Inland River Basin. Land 2025, 14, 650. [Google Scholar] [CrossRef]
  59. Li, Y.; Yang, X.; Cai, H.; Xiao, L.; Xu, X.; Liu, L. Topographical Characteristics of Agricultural Potential Productivity during Cropland Transformation in China. Sustainability 2015, 7, 96–110. [Google Scholar] [CrossRef]
  60. Niedertscheider, M.; Kastner, T.; Fetzel, T.; Haberl, H.; Kroisleitner, C.; Plutzar, C.; Erb, K.-H. Mapping and Analysing Cropland Use Intensity from a NPP Perspective. Environ. Res. Lett. 2016, 11, 014008. [Google Scholar] [CrossRef]
  61. Yan, Y.; Liu, X.; Wen, Y. Quantification of the Relationship Among Cropland Area, Cropland Management Measures, and Cropland Productivity Using Panel Data Model. Int. J. Plant Prod. 2020, 14, 689–702. [Google Scholar] [CrossRef]
  62. Zheng, Z.; Song, H. Improving the Benefit Compensation Mechanism for Main Grain Producing Areas: Basis, Problems, and Policy Optimization. Res. Agric. Mod. 2023, 44, 214–221. [Google Scholar] [CrossRef]
  63. Zeng, X.; Hu, Z.; Chen, A.; Yuan, W.; Hou, G.; Han, D.; Liang, M.; Di, K.; Cao, R.; Luo, D. The Global Decline in the Sensitivity of Vegetation Productivity to Precipitation from 2001 to 2018. Glob. Change Biol. 2022, 28, 6823–6833. [Google Scholar] [CrossRef]
  64. Alexander, J.D.; McCafferty, M.K.; Fricker, G.A.; James, J.J. Climate Seasonality and Extremes Influence Net Primary Productivity across California’s Grasslands, Shrublands, and Woodlands. Environ. Res. Lett. 2023, 18, 064021. [Google Scholar] [CrossRef]
  65. Zhe, Y.; Denghua, Y.; Zhiyong, Y.; Jun, Y.I.N.; Yong, Y. Research on temporal and spatial change of 400 mm and 800 mm rainfall contours of China in 1961–2000. Adv. Water Sci. 2014, 25, 494–502. [Google Scholar]
  66. Liu, J.; Bi, X.; Ma, M.; Jiang, L.; Du, L.; Li, S.; Sun, Q.; Zou, G.; Liu, H. Precipitation and Irrigation Dominate Soil Water Leaching in Cropland in Northern China. Agric. Water Manag. 2019, 211, 165–171. [Google Scholar] [CrossRef]
  67. Fu, J.; Wang, W.; Zaitchik, B.; Nie, W.; Fei, E.X.; Miller, S.M.; Harman, C.J. Critical Role of Irrigation Efficiency for Cropland Expansion in Western China Arid Agroecosystems. Earths Future 2022, 10, e2022EF002955. [Google Scholar] [CrossRef]
  68. Wang, J.; Liu, W.; Dang, T. Responses of Soil Water Balance and Precipitation Storage Efficiency to Increased Fertilizer Application in Winter Wheat. Plant Soil 2011, 347, 41–51. [Google Scholar] [CrossRef]
  69. Chen, X.; Cui, X.; Gao, J. Differentiated Agricultural Sensitivity and Adaptability to Rising Temperatures across Regions and Sectors in China. J. Environ. Econ. Manag. 2023, 119, 102801. [Google Scholar] [CrossRef]
  70. Wang, Z.; Liu, B.; Wang, X.; Gao, X.; Liu, G. Erosion Effect on the Productivity of Black Soil in Northeast China. Sci. China Ser. Earth Sci. 2009, 52, 1005–1021. [Google Scholar] [CrossRef]
  71. Liu, X.B.; Zhang, X.Y.; Wang, Y.X.; Sui, Y.Y.; Zhang, S.L.; Herbert, S.J.; Ding, G. Soil Degradation: A Problem Threatening the Sustainable Development of Agriculture in Northeast China. Plant Soil Environ. 2010, 56, 87–97. [Google Scholar] [CrossRef]
  72. Xiong, J.; Wu, H.; Wang, X.; Ma, R.; Lin, C. Response of Soil Fertility to Soil Erosion on a Regional Scale: A Case Study of Northeast China. J. Clean. Prod. 2024, 434, 140360. [Google Scholar] [CrossRef]
  73. Lehmann, J.; Bossio, D.A.; Kögel-Knabner, I.; Rillig, M.C. The Concept and Future Prospects of Soil Health. Nat. Rev. Earth Environ. 2020, 1, 544–553. [Google Scholar] [CrossRef]
  74. Rhodes, C.J. Soil Erosion, Climate Change and Global Food Security: Challenges and Strategies. Sci. Prog. 2014, 97, 97–153. [Google Scholar] [CrossRef]
  75. Webb, N.P.; Marshall, N.A.; Stringer, L.C.; Reed, M.S.; Chappell, A.; Herrick, J.E. Land Degradation and Climate Change: Building Climate Resilience in Agriculture. Front. Ecol. Environ. 2017, 15, 450–459. [Google Scholar] [CrossRef]
  76. Knapp, S.; van der Heijden, M.G.A. A Global Meta-Analysis of Yield Stability in Organic and Conservation Agriculture. Nat. Commun. 2018, 9, 3632. [Google Scholar] [CrossRef] [PubMed]
  77. Deng, X.; Xu, X.; Cai, H.; Li, J. Assessment the Impact of Urban Expansion on Cropland Net Primary Productivity in Northeast China. Ecol. Indic. 2024, 159, 111698. [Google Scholar] [CrossRef]
  78. Driscoll, A.W.; Leuthold, S.J.; Choi, E.; Clark, S.M.; Cleveland, D.M.; Dixon, M.; Hsieh, M.; Sitterson, J.; Mueller, N.D. Divergent Impacts of Crop Diversity on Caloric and Economic Yield Stability. Environ. Res. Lett. 2022, 17, 124015. [Google Scholar] [CrossRef]
Figure 1. Study area: (a) location; (b) spatial distribution of cropland in 2020.
Land 14 01010 g001
Figure 2. Spatial distribution of driving factors: (a) PRE; (b) TEM; (c) SOL; (d) ELV; (e) SLP; (f) ERS.
Land 14 01010 g002
Figure 3. Temporal trends of cropland productivity in Northeast China from 2001 to 2020: (a) ACP; (b) TCP.
Land 14 01010 g003
Figure 4. Spatial variation of cropland productivity in Northeast China from 2001 to 2020: (a) multi-year average; (b) coefficient of variation.
Land 14 01010 g004
Figure 5. Ranking of the q-values for the driving factors at the county level based on the OPGD model results (p < 0.01): (a) ACP; (b) TCP.
Land 14 01010 g005
Figure 6. Interaction types of the driving factors of cropland productivity at the county level based on the OPGD interaction results (p < 0.01): (a) ACP; (b) TCP.
Land 14 01010 g006
Figure 7. SHAP values and importance ranking of driving factors of cropland productivity: (a) ACP; (b) TCP.
Land 14 01010 g007
Figure 8. SHAP dependency plot of the driving factors of ACP. (a) PRE; (b) TEM; (c) SOL; (d) ELV; (e) SLP; (f) ERS; (g) IRR; (h) FER; (i) MAC; (j) ELC.
Land 14 01010 g008
Figure 9. SHAP dependency plot of the driving factors of TCP. (a) PRE; (b) TEM; (c) SOL; (d) ELV; (e) SLP; (f) ERS; (g) IRR; (h) FER; (i) MAC; (j) ELC.
Land 14 01010 g009
Figure 10. SHAP interactive plot of the key drivers for cropland productivity: (ac) ACP; (df) TCP.
Land 14 01010 g010
Table 1. Definitions, hypotheses, data source, and references of the variables.
VariableDefinitionHypothesized EffectsData SourceKey Reference
Response variables
Average cropland productivity (ACP)The average value of growing season cropland NPP (estimated by the CASA model) for each county---
Total cropland productivity (TCP)The total value of growing season cropland NPP (estimated by the CASA model) for each county---
Explanatory variables
Precipitation (PRE)The sum of growing season-based cropland precipitationSufficient water availability is crucial for crop growth. Higher precipitation generally promotes productivity.RESDC[11,43]
Temperature (TEM)The average temperature during the growing season on croplandAppropriate temperature ranges support productivity. Extremely high or low temperatures can hinder physiological processes, shorten effective growing seasons, and reduce productivity.RESDC[11,43]
Solar radiation (SOL)The total amount of solar radiation received during the growing season on croplandSolar radiation is essential for photosynthesis. Adequate sunlight typically increases biomass accumulation, namely the NPP cropland productivity.ERA-5[11]
Elevation (ELV)The average elevation of croplandHigher elevations usually have shorter growing seasons and thus limit the cropland productivity.SRTMDEM v3.0[46]
Slope (SLP)The average slope of croplandPlains are more favorable for agriculture and are more productive.SRTMDEM v3.0[46]
Erosion (ERS)The intensity of wind and water erosion of croplandSoil erosion threatens cropland productivity, especially in Northeast China. High erosion rates can lead to lower cropland quality and degraded soil health.[45][7]
Effective irrigation (IRR)The proportion of cropland covered with effective irrigationAdequate irrigation satisfies water demands, stabilizing cropland productivity under variable rainfall patterns and reducing the risk of drought stress.NBSC[16,43]
Fertilizer application (FER)The intensity of chemical fertilizer usage per unit of croplandProper fertilizer application improves soil fertility and provides essential nutrients, enhancing crop growth and resilience to less favorable conditions. Overuse, however, can lead to environmental degradation.NBSC[16,43]
Machinery (MAC)The intensity of agricultural machinery power per unit of croplandEnhanced mechanization typically increases cultivation efficiency and improves the timeliness of cropland operations, and therefore boosts cropland productivity.NBSC[47,48]
Electricity (ELC)The intensity of electricity consumption in rural areas per unit of croplandSufficient electricity supply supports cropland operations. Improved access to electricity is linked to higher agricultural productivity.NBSC[47,48]
RESDC: Resources and Environmental Science Data Center, Chinese Academy of Science (www.resdc.cn, accessed on 4 May 2025). NBSC: National Bureau of Statistics of China (www.stats.gov.cn, accessed on 4 May 2025).
Table 2. Interaction types of drivers in GD.
Interaction TypesCondition
Nonlinear attenuation q X 1 X 2 < min q X 1 , q X 2
Single-factor nonlinear attenuation min q X 1 , q X 2 < q X 1 X 2 < max q X 1 , q X 2
Dual-factor enhance q X 1 X 2 > max q X 1 , q X 2
Independent q X 1 X 2 = q X 1 + q X 2
Nonlinear enhance q X 1 X 2 > q X 1 + q X 2
Table 3. Performance of different machine learning models.
Model NameACPTCP
R2MAERMSER2MAERMSE
CatBoost0.9330.0650.0850.9610.1090.151
XGBoost0.9180.0690.0940.9680.0950.135
LightGBM0.9190.0710.0940.9500.1210.170
Random Forest0.9150.0720.0960.9420.1090.184
Support Vector Machine0.7050.1400.1790.4730.4330.552
Disclaimer/Publisher’s Note: The statements, opinions and data contained in all publications are solely those of the individual author(s) and contributor(s) and not of MDPI and/or the editor(s). MDPI and/or the editor(s) disclaim responsibility for any injury to people or property resulting from any ideas, methods, instructions or products referred to in the content.

