
Investigation and Monitoring of Sinkhole Subsidence and Collapse: Additional Data on the Case Study in Alcalá de Ebro (Zaragoza, Spain)


Abstract
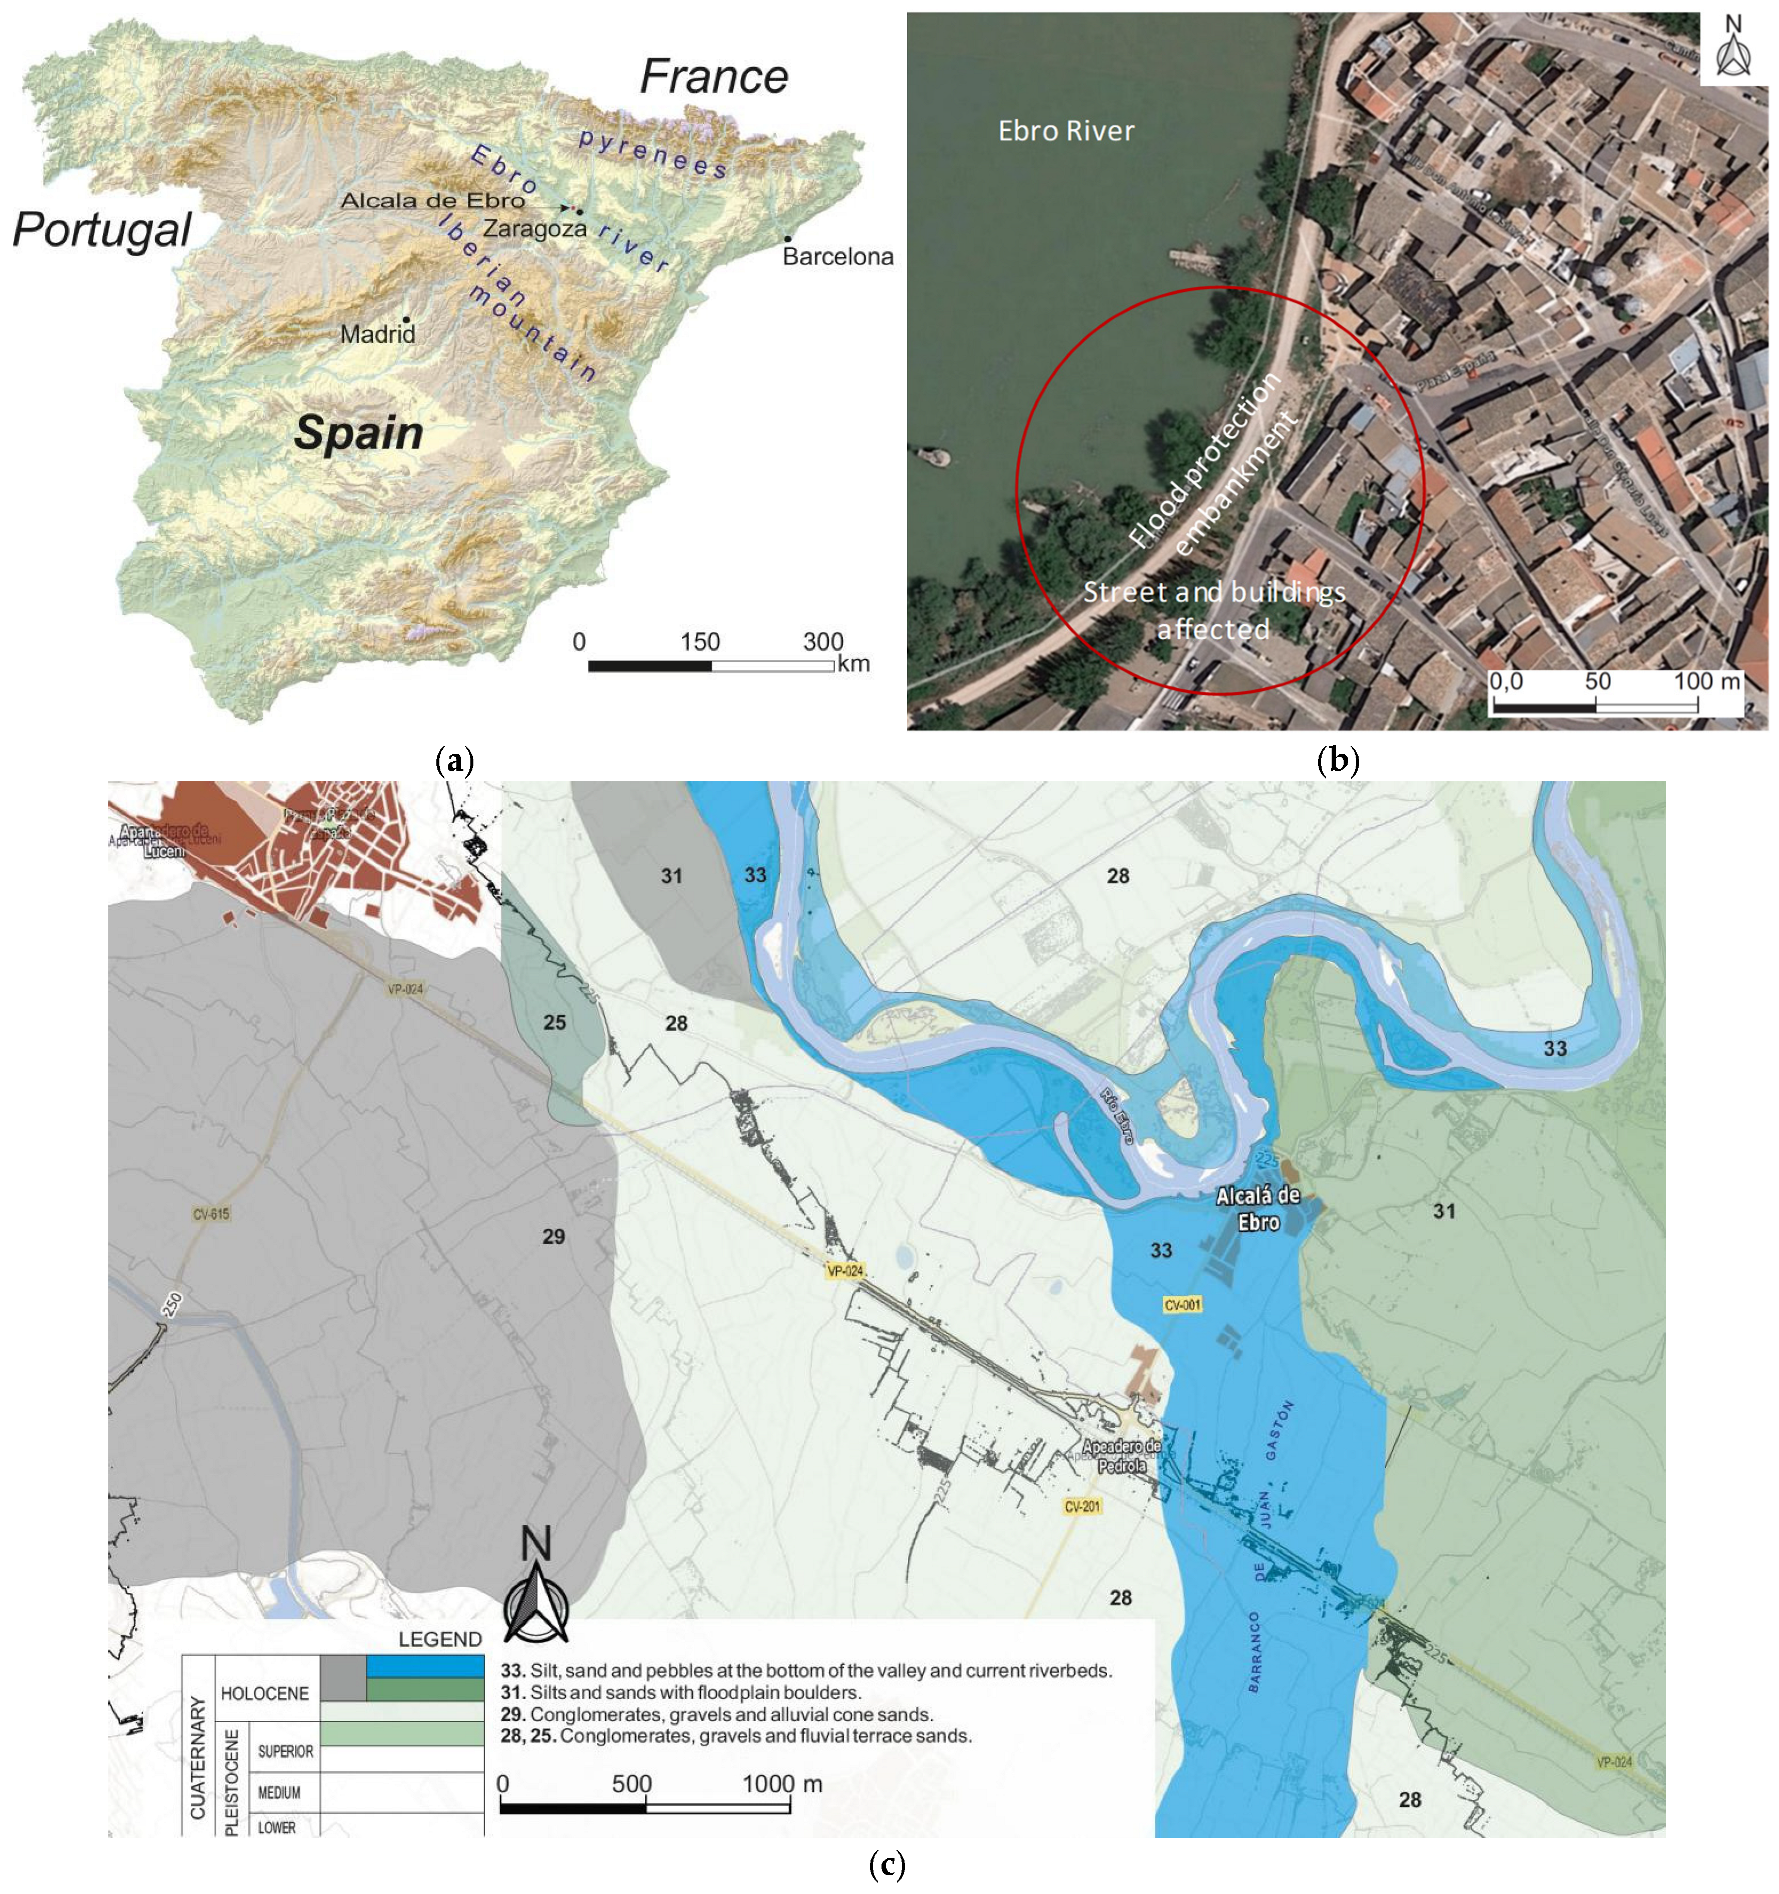
1. Introduction
2. Methodology
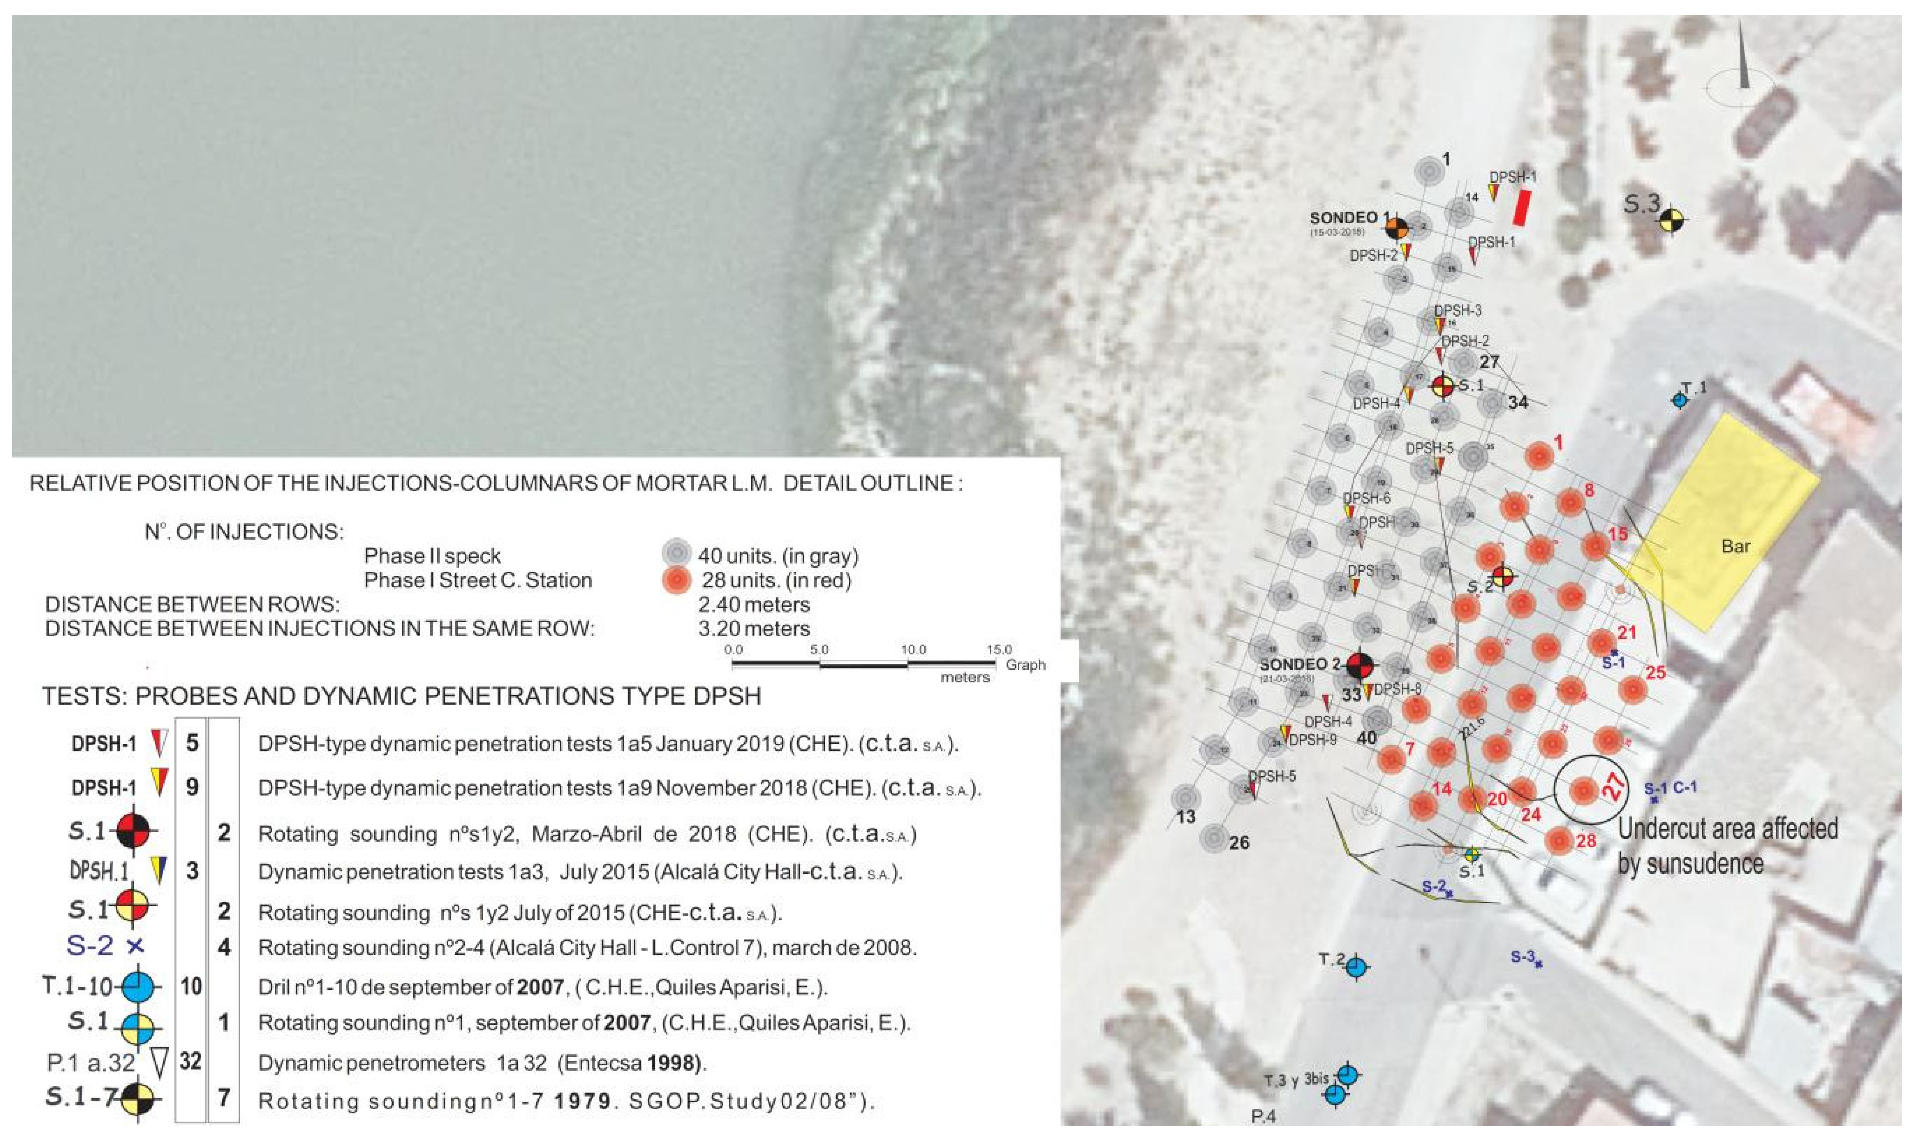
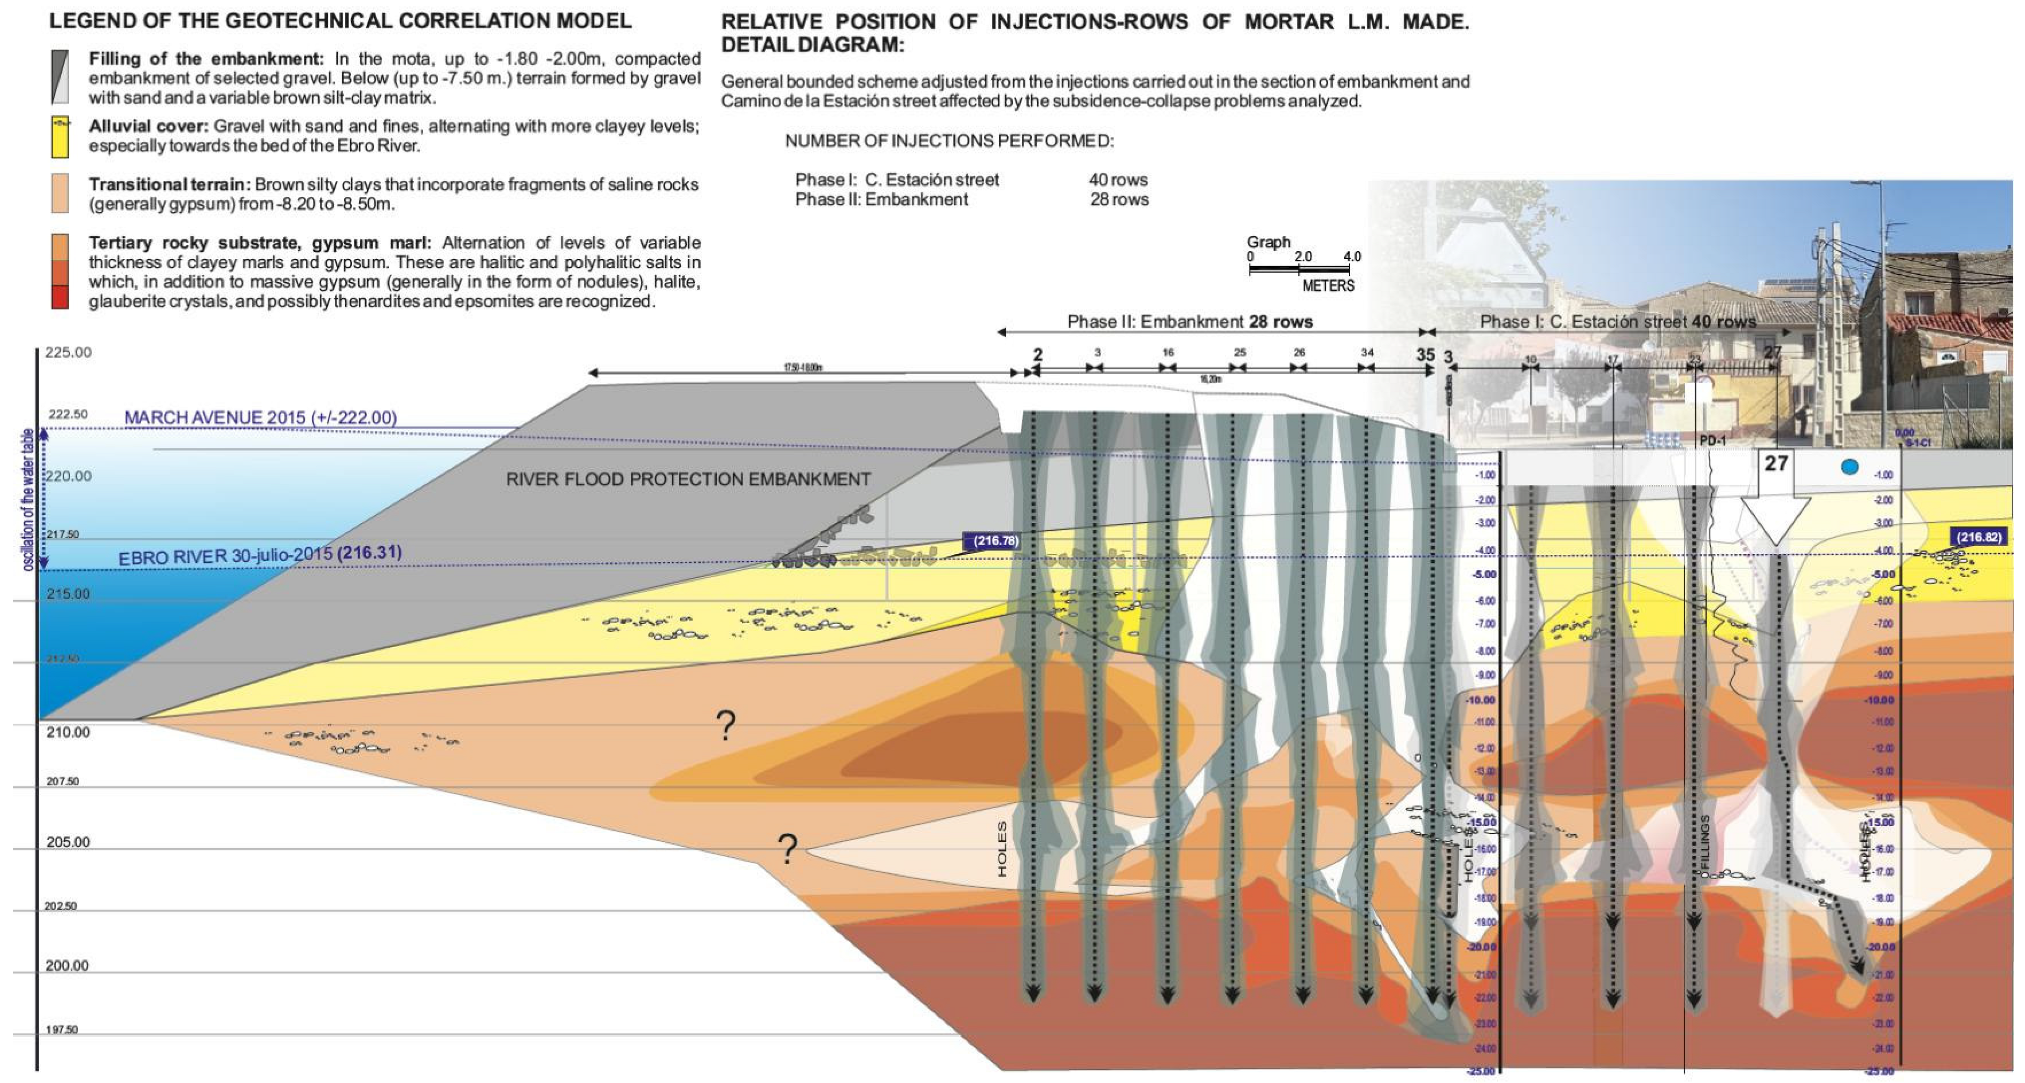
- Verification, at source, of all the information gathered in recent years and the results of the process of consolidating the undermined terrain by injecting “low mobility” (L.M.) mortar. Four rows of injection sites were established, starting from the river and heading towards the city. The number of injections carried out was 28 for Station Road Street (phase I) and 40 in the embankment (phase II). In Figure 5, the details of the relative position of the injection columns of L.M. mortar are displayed. The following aspects have been considered in their positioning:
- ◦
- General delimited scheme adjusted to the section of the embankment and Station Road Street affected by the subsidence and collapse problems analysed. The distribution follows the layout of the road that crowns the hill. Injections are incorporated towards the embankment that falls towards Station Road Street to complete the area affected by subsidence in the plan.
- ◦
- In both cases, the excavation was between 0.80 and 1.20 m above the respective slopes of the street and embankment.
- ◦
- The distribution is in alternate rows, in a staggered fashion, adapting to the floor plan of the embankment and the street.
- ◦
- The distance between rows is 2.40 m, and the distance between injections in the same row is 3.20 m.
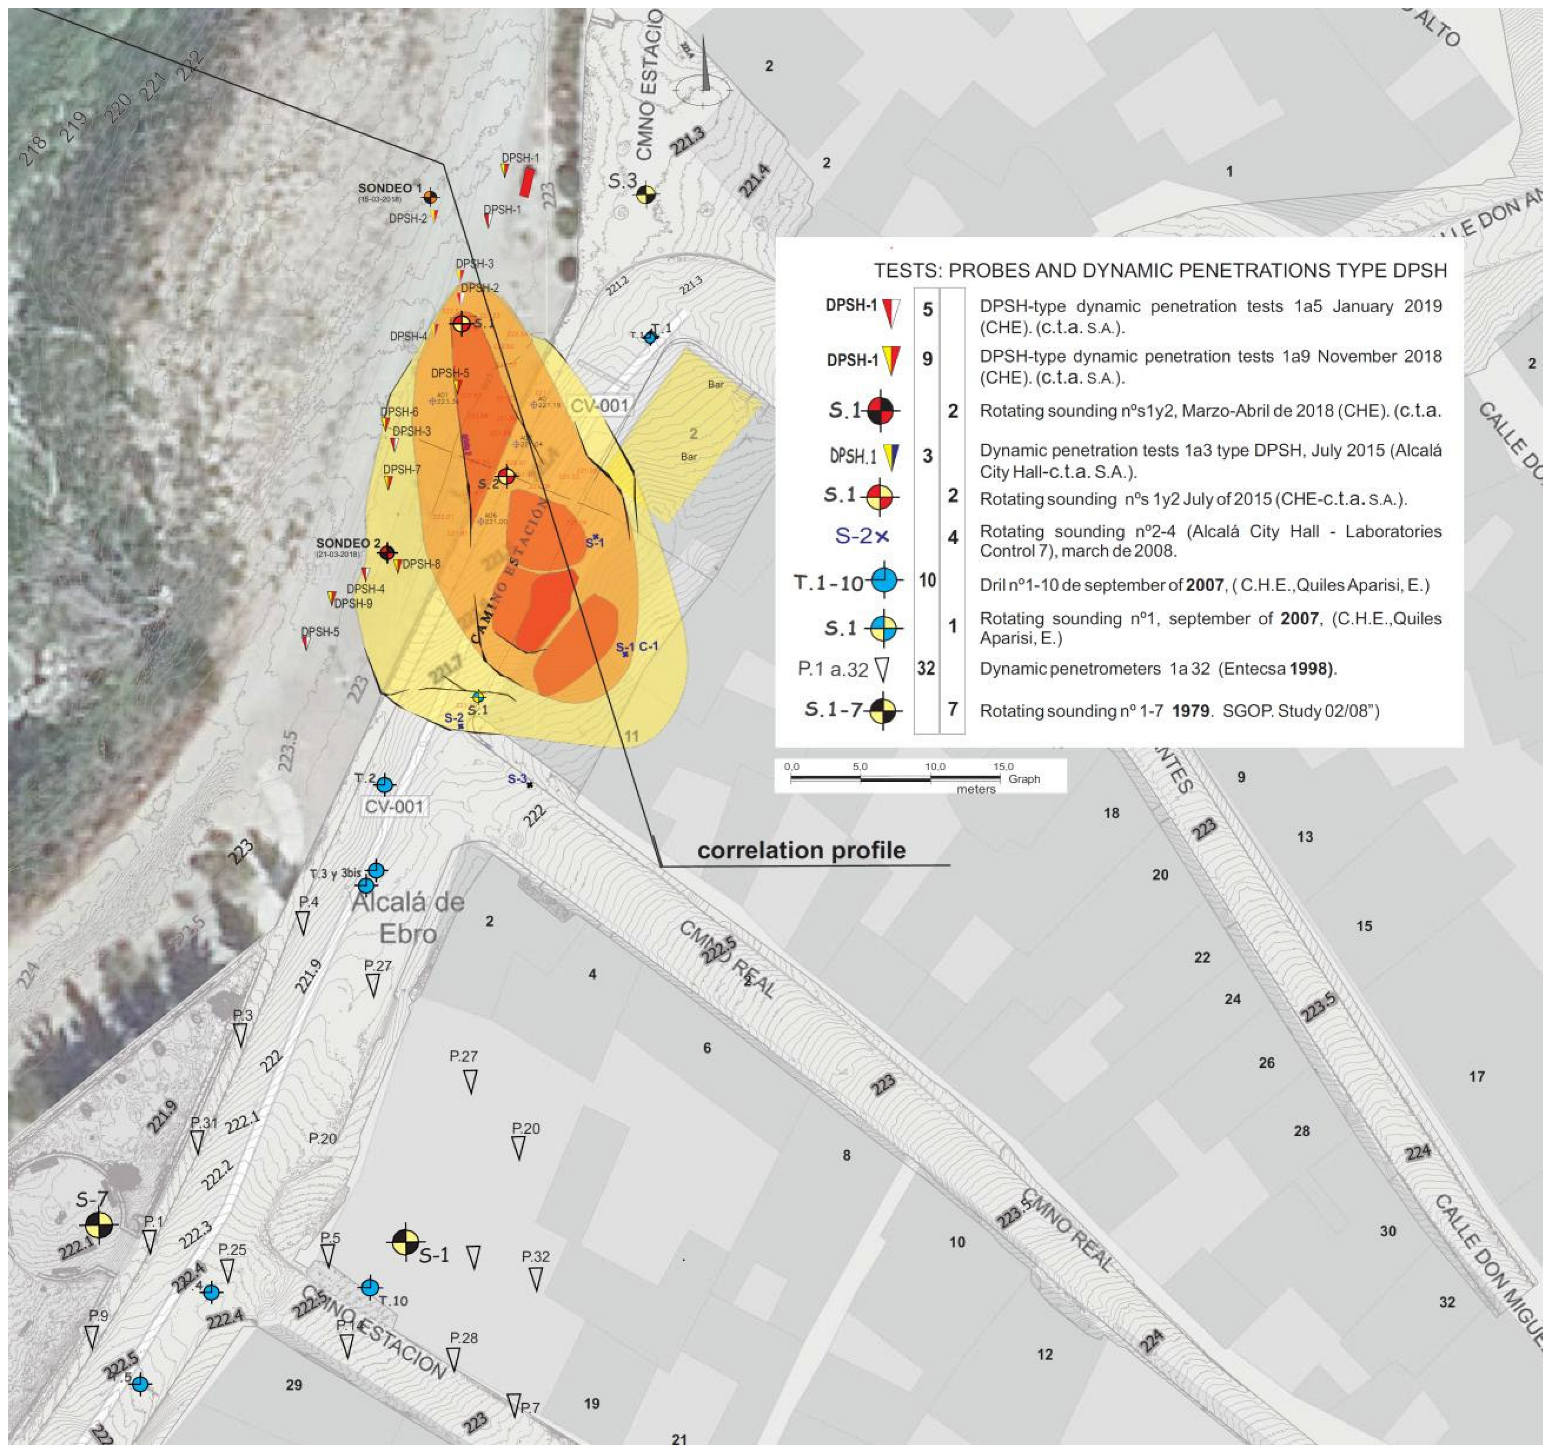
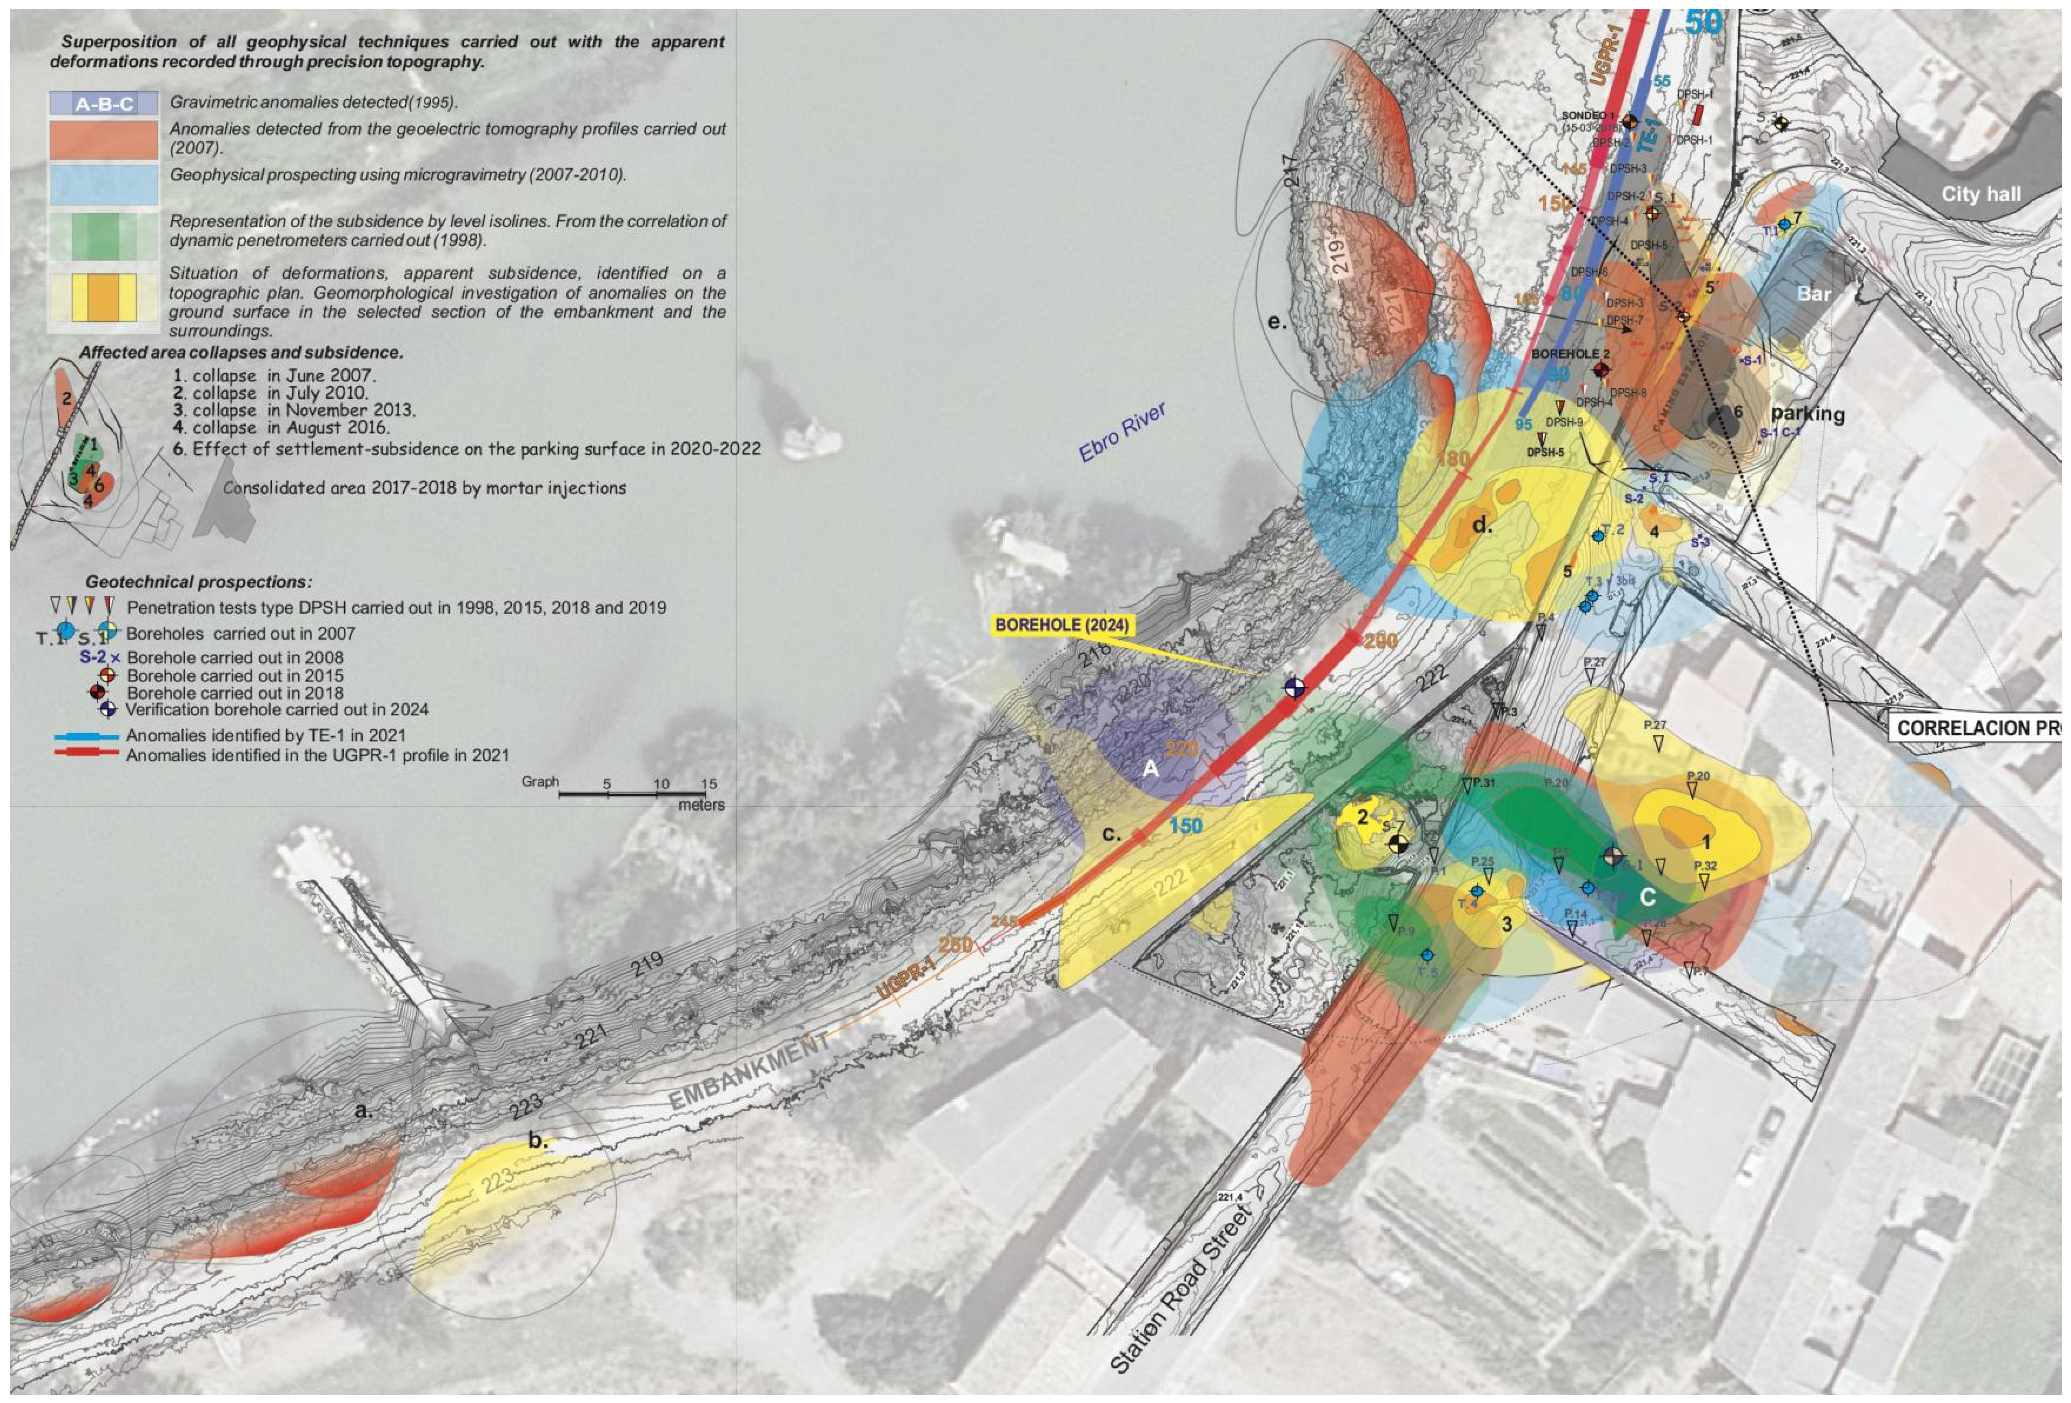
- The preparation of a map integrating and synthesising all the information includes rotational surveys and other tests (pits, dynamic penetration tests, etc.). It also includes the superposition of all the geophysical techniques carried out, locating the main anomalies recorded in the plan.
- Topographic auscultation. The Leica Geosystems RTC360 laser scanner was used in collaboration with Tecnitop, a Spanish company specialising in digitisation and 3D applications for heritage, engineering and industrial metrology. There have been 4 laser scanner monitoring campaigns. For example, in the fourth topography auscultation campaign, a total of 47 measurement stations were carried out, 22 of which were used to carry out detailed topographic auscultation in the embankment that protects Alcalá de Ebro.This laser takes panoramic images superimposed on a cloud of high-precision points at a speed of 2,000,000 points/second. It has a range of up to 130 m and is accurate to the millimetre. This type of analysis allows us to obtain 3D images composed of point clouds. By processing these images (Cloud Compare software: 3D point cloud editing and processing software), detailed topographies are generated that are used to relocate all existing information from tests and trials carried out. It also helps to identify differential movements that can be deduced from small depressions and crack systems that can be seen both on the surface and on the facades of some houses. The use of this 3D technology provides a series of advantages over the usual 2D technology, which we list below:
- ◦
- Greater “as-built” information: The capture of reality data is much more complete than usual acquisitions, which represents an increase in reliability and precision, as well as better visualization than in 2D plans.
- ◦
- Allows greater access to information: Information is more available, since we can manage the model in 3 dimensions, which allows for excellent structuring of it.
- ◦
- Provides better use of information: The multiple possibilities of obtaining results provide us with a better design.
- ◦
The data obtained were processed using the Ciclone Register 2023.3 software, uniting the visualisations made in the same model, obtaining an overlap greater than 38% and a precision of 0.7 cm. Plans were obtained at a scale of 1:1000 (general situation with contours every 0.20 m) and at a scale of 1500 (detailed with contours every 0.02 m).
- New geophysical and verification surveys will be conducted in the identified areas, extending the work area to assess whether the consolidation carried out will transfer any potential effects to other adjacent areas within the nearby environment. In the affected area and its surroundings, we consider that the combination of electrical tomography in the 3D mode and the georadar of the UltraGPR type constitutes the geophysical tools with the greatest capacity to detect subsoil areas affected by dissolution processes of halite layers [3,8]:
- ◦
- Electrical tomography. The campaign carried out includes an electrical tomography profile and ultra-GPR profiles (mainly on the wheel). The geophysical prospection campaign was carried out by the company IGT (International Geophysical Technology, S.L.) in November 2021. The tomographic profile was 150 m long, consisting of 16 electrodes spaced 5.5 m apart, and reached a depth of approximately 30 m.
- ◦
- UltraGPR type georadar. The UGPR-1 profile, carried out along the banks of the Ebro River, was made.
3. Results
3.1. Results of the Consolidation Procedure of the Undermined Terrain Using “Low Mobility” (L.M.) Mortar Injections
- Consumption has been exceptionally high in the first row (closest to the river). The total injected in the first column was 135,165.85 L in 13 injections of 24 m of relative length, of the order of 433.22 L/m.l.
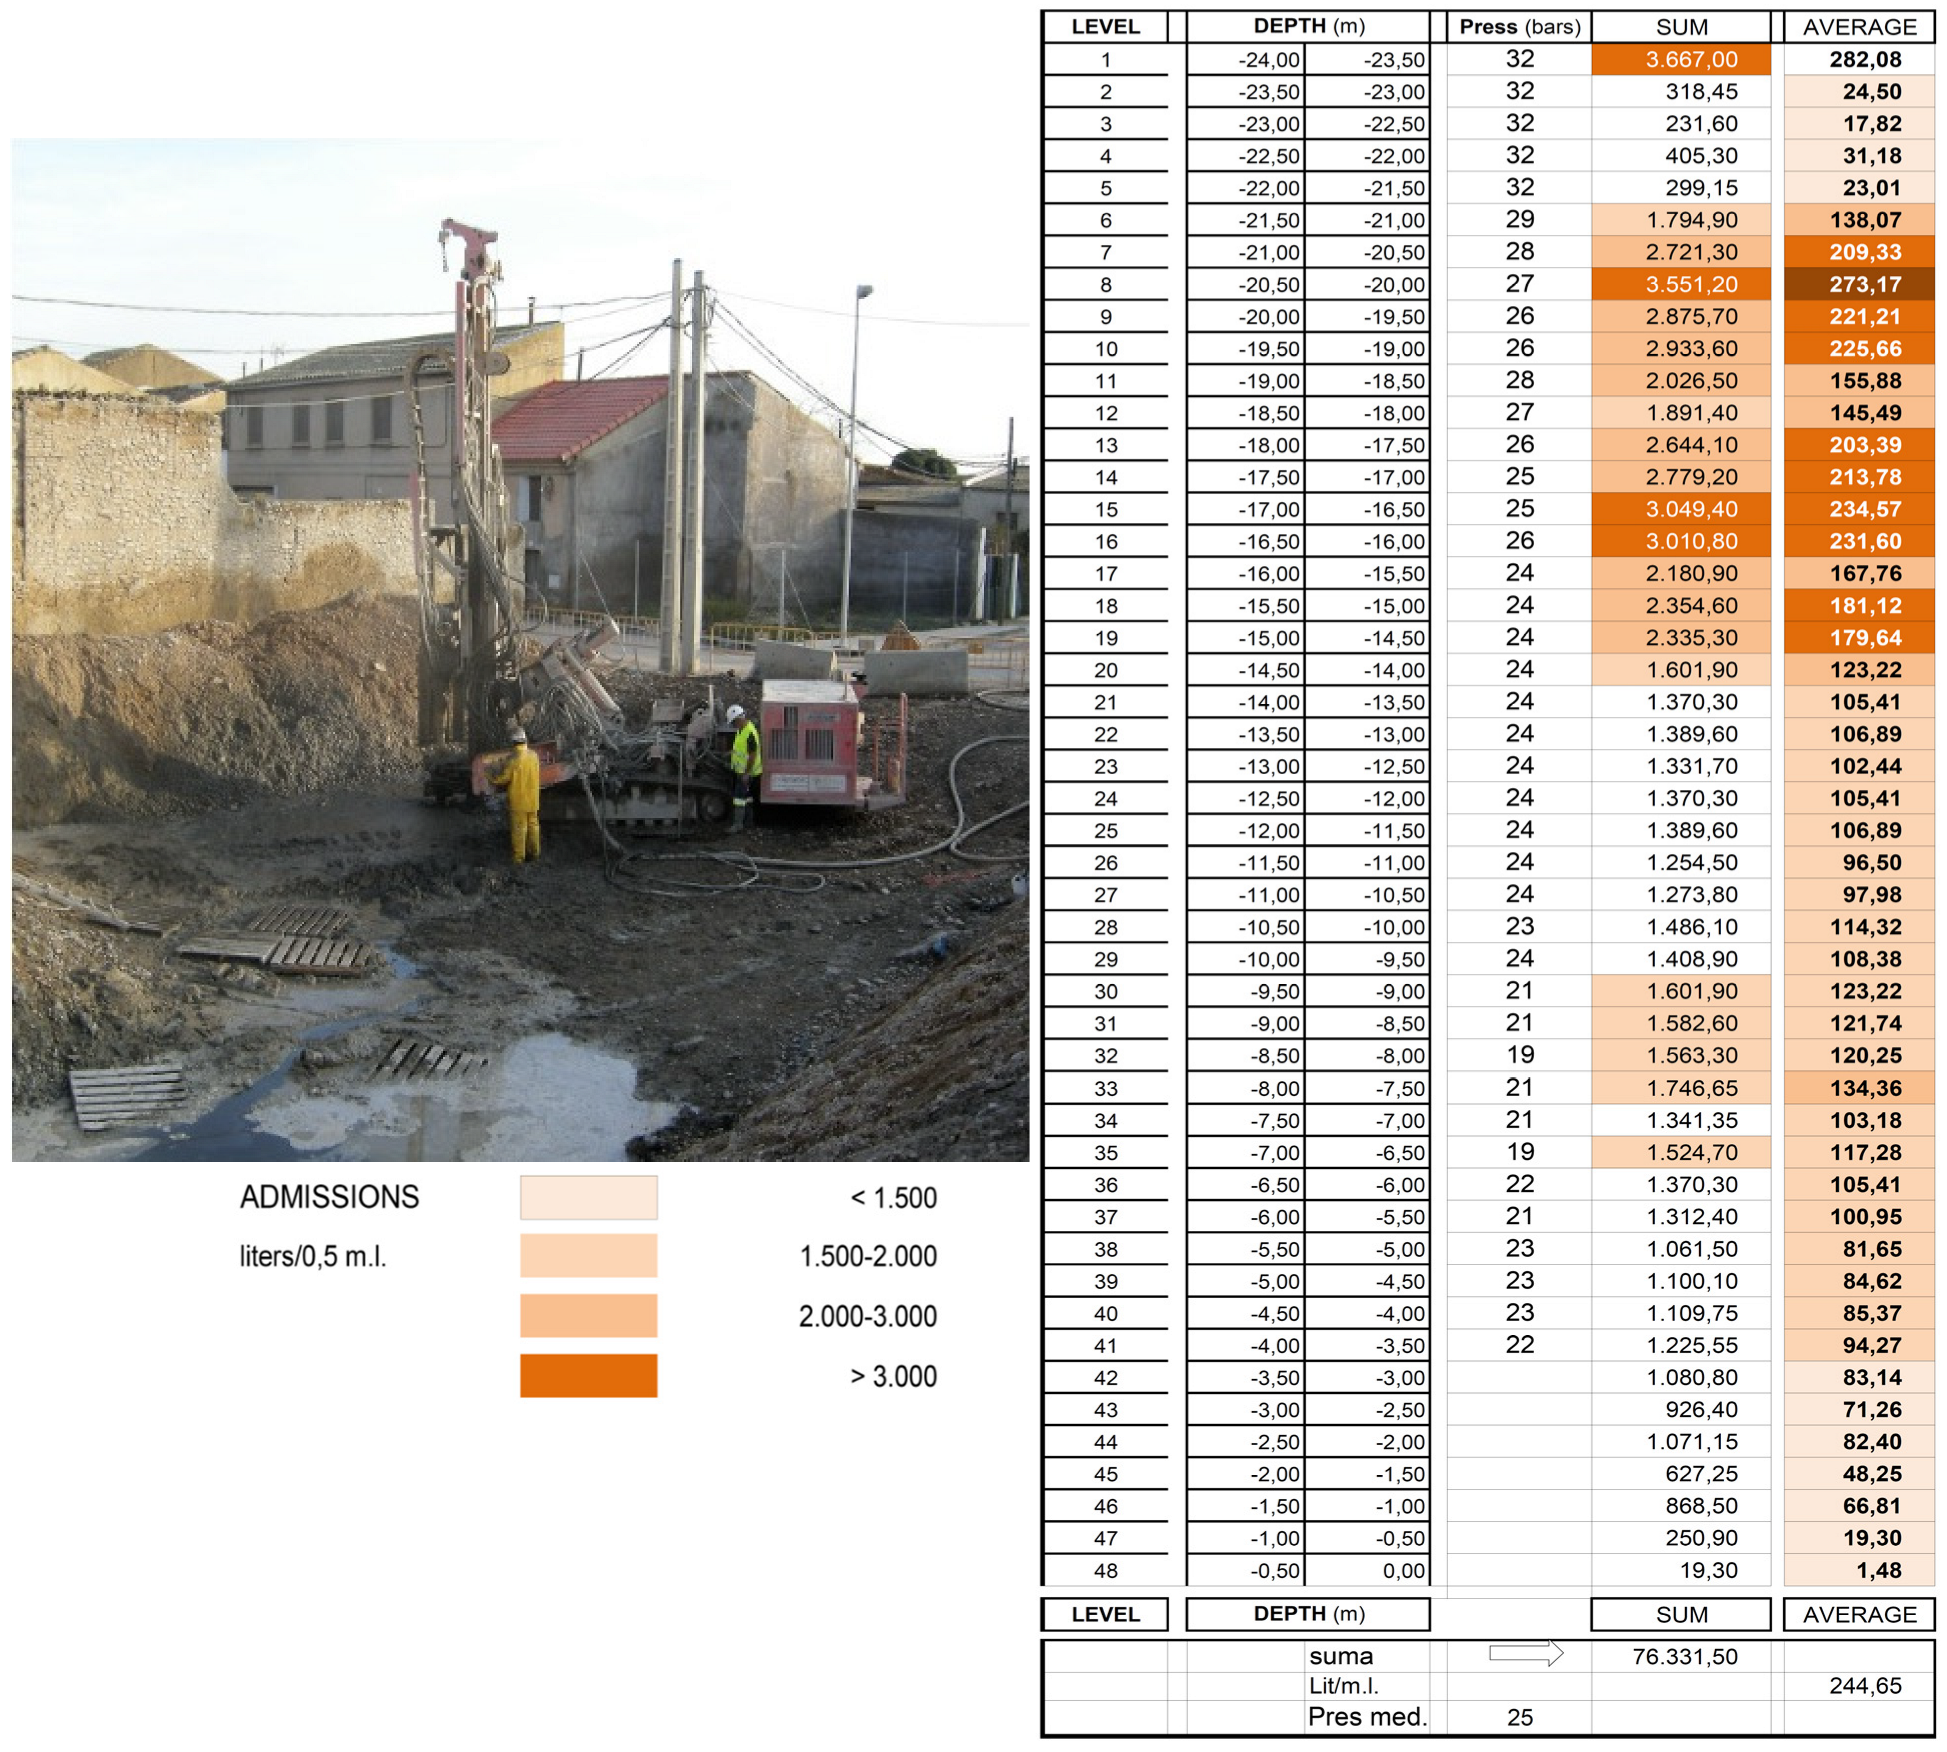
- In the second row, consumption was moderated by being “protected by the injections of the first column” and by recalibration of the injection procedure. The total injected in the second column was 76,331.50 L in 13 injections of 24 m of relative length, of the order of 244.65 L/m.l.
- In the third row, 46,339.30 L were injected in seven injections of 24 m in relative length, of the order of 275.83 L/m.l.
- In the fourth row, these consumptions were moderated even more as they were confined between the first three columns and the injections carried out in 2015 on the street (very close). The total injected in the fourth row was 33,321.45 L in seven injections of 24 m of relative length, of the order of 198.34 L/m.l.
- Admissions are mainly concentrated in the recognised section, between −14.0 m and −21.0 m (between 5 and 7 m), where it is assessed that there is a dissolution-undermining process associated with levels or layers of salts (type glauberite, halite, etc.) that are exceptionally soluble.
- More than half of the registered entries are concentrated in this section, of about 35,000 L of mortar.
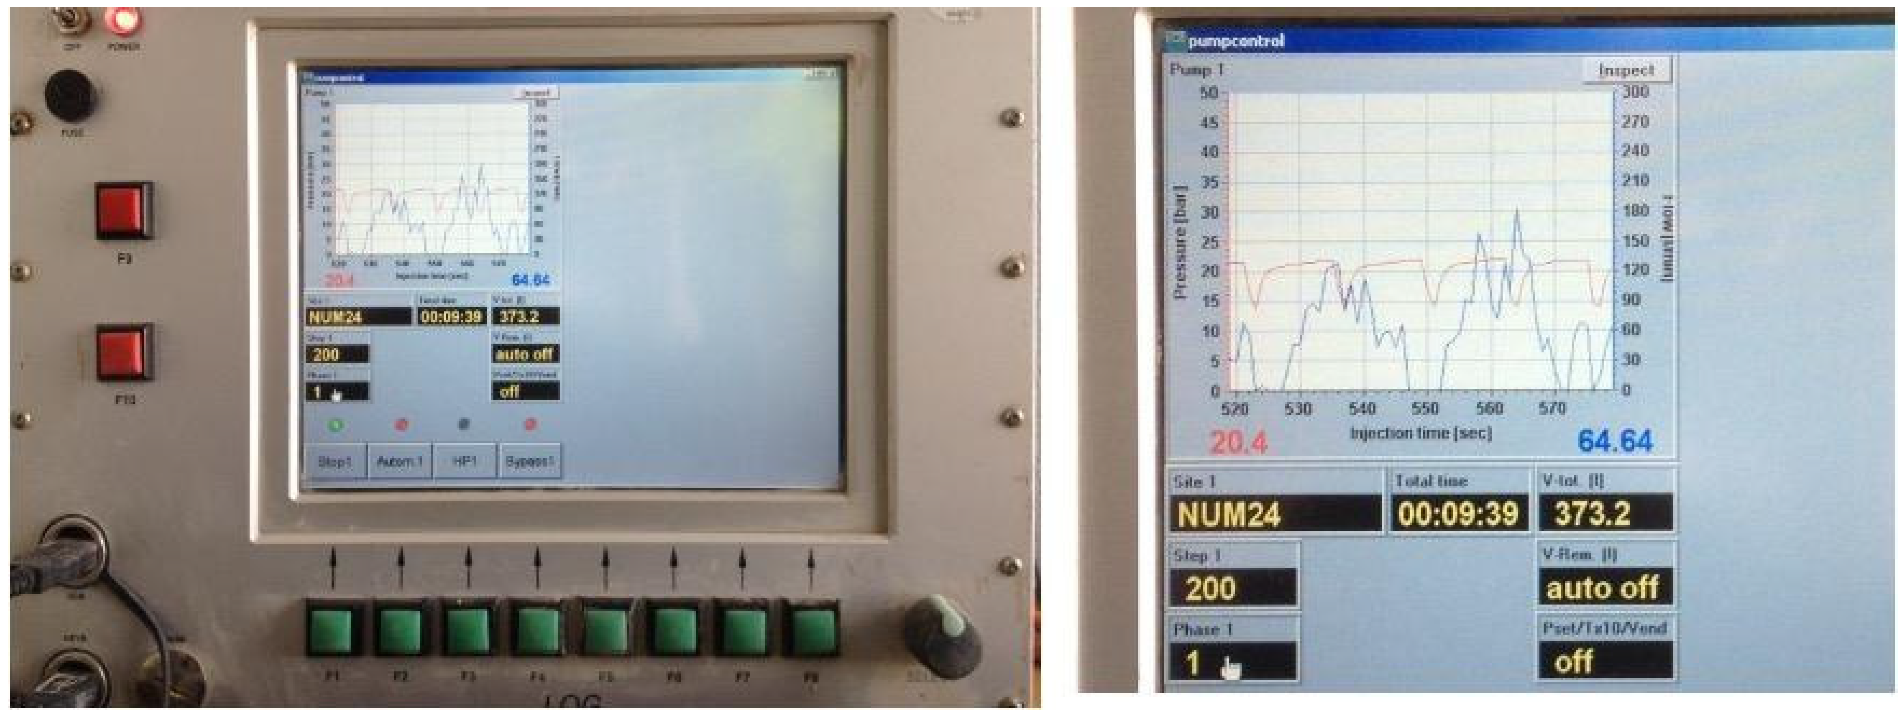
- It is confirmed that the resistance to drilling is greater at a depth of −24 m. It is not considered necessary to drill deeper. Based on the developed model, the injections penetrate the apparently undercut rock substrate to a depth of 3–5 m. In this first interval, once the drill-injection pipe is filled, injections of the order of 20 to 30 L per litre are recorded, which is practically equivalent to filling the perforation itself.
- The intakes, between −14.0 and −6.0 m, have average intakes of between 200 and 250 L per litre. Occasionally, however, volumes of up to twice the injected mortar are recorded, which can be interpreted as fill from previous sinkholes and/or collapses associated with the undermined lower level.
- The upper part (from −6 m to the surface) corresponds to the body of the trench, which is made of compacted gravel. In dry terrain, it usually has a capacity of 100–150 L per litre, and in many cases, the capacity is reduced to the volume of the borehole itself. In some cases, however, there is conspicuous over-consumption, which means that the borehole may be close to the surface. In Column 1, in injections 4 and 5, consumption of up to 4 m3 was recorded at a depth of around −6 m.
- In Column 2, overconsumption was also recorded in injections 15 and 18 with more than 700 L/m.l. less than 2–3 m from the surface. Although these are not volumes associated with large voids, they may be associated with fractures connecting them at greater depths. The same could be interpreted for perforation 29 in line 3 and injection 34 in line 4.
3.2. Control Work on the Consolidation Measures Carried Out. Topographic Auscultation
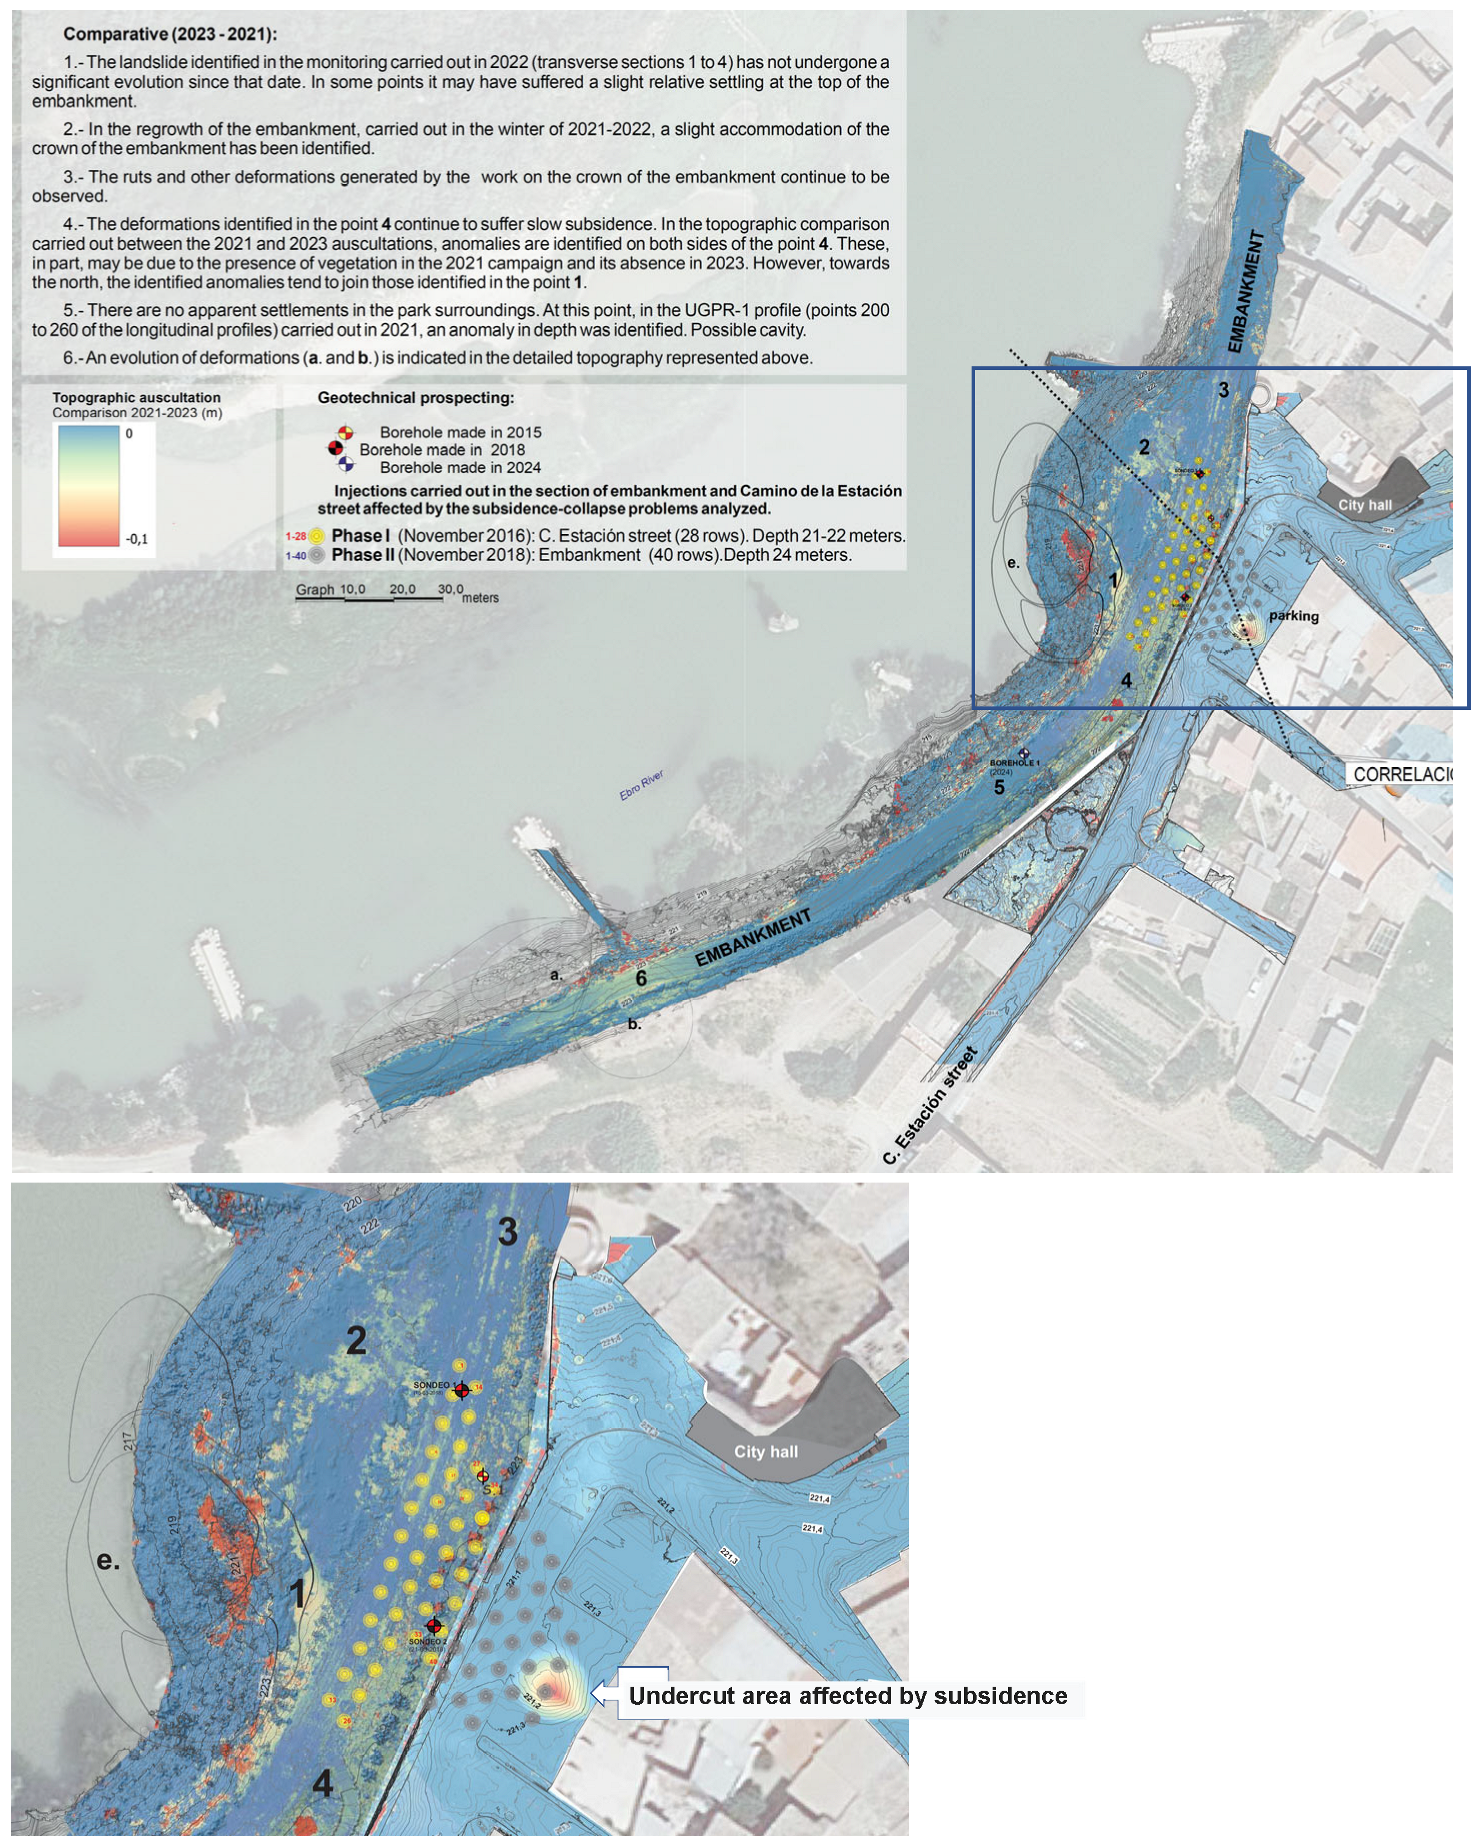
- During the 2022 monitoring, a small landslide was detected at the top of the embankment (cross sections 1 to 4, Figure 11). In some places, it may have experienced a slight relative subsidence at the top of the embankment. However, it has not changed significantly since then.
- During the winter of 2021–2022, the embankment was raised as a preventive measure against the Ebro River. At that time, a slight accretion of the crown of the embankment was noted.
- The ruts and other deformations caused by the work on the crown of the embankment continue to be observed.
- The deformations identified in the staircase continue to suffer from slow subsidence. The topographic comparison between the 2021 and 2023 surveys (Figure 11) shows anomalies on both sides of the staircase. These may in part be due to the presence of vegetation in the 2021 campaign and its absence in 2023. However, towards the north, between PPKK 90 and 100, the anomalies identified tend to merge with those identified in point 1, corresponding to the slip.
- There are no obvious seats in the park area. At this point in the UGPR-1 profile (points 200 to 260 of the longitudinal profiles), an anomaly at greater depths has been identified. There is a possible cavity.
- Old sinkhole (1975). Old sinkhole [5].
- Seventy-five deformations of up to 0.9–1.2 cm were observed between November 2021 and October 2023. This differential movement is reflected in the cracks observed in the pavement, as well as in the walls that would make up old structures of houses or corrals. During these years, no significant increase in the size and dimension of these cracks was observed, as the recorded evolution is not very high.
- Deformations in the public park. Between November 2021 and October 2023, minor specific deformations will be detected, generally between 0.5 and 0.8 cm, although they may reach 2.0 cm.
- Concentric contour curves are identified in the topography. This point is related to deformations in structure no. 11 of the station path. This is related to points 1 and 2 and represents the rocky substrate at a depth of 22 m.
- Deformation at the corner of the station path and the royal path, which is related, in depth, to the collapses that occurred previously in the parking lot area.
- Deformations near the embankment. In the area of point 5, in the steps leading up to the embankment next to the park, outside the detailed topography, a series of cracks have been observed, indicating some relative settlement. This is obviously related to the deformation at point 5. According to the topographic comparison carried out, a relative settlement between 0.8 and 1.3 cm occurred in the period 22 November 2021–5 October 2023.
- Parking area. These deformations are related to the collapses that occurred at this point, which were partially treated in 2016–2017 by injecting low-mobility mortar columns.
- Station Road Street and Don Miguel Cervantes Street. A small deformation has been identified next to the bar, and another larger one, which seems to indicate differential settlement towards the embankment. A concentric depression has been identified around point 7, right at the junction of the two streets. From 22 November 2021 to 5 October 2023, a subsidence of the order of 1 cm was measured around the maximum deformation. This point is in a manhole of the sewerage or supply network, although it seems to be moving to a lesser extent towards the sewer to the north.
- Small deformations of the embankment towards the open side facing the Ebro, apparently due to slow movements of the slope caused by the undermining of the river.
- Deformation of the slope inwards, towards the town, with up to 15–20 cm maximum subsidence towards the slope edge.
- Deformations on top of the hill next to the park. This topographic subsidence would correlate with certain anomalies noted in previous studies.
- Apparent collapse in the embankment that projects towards the access “ramp”. This was taken from the road. At this point, new cracks have been observed (in the concrete of the access staircase), which mark possible deformations or differential settlements and correlate well with the slight subsidence indicated in point 5, identified just below, on the pavement itself.
- Signs of sliding towards the free face of the slope towards the river. The possible origin may be related to the scour processes of the river that are currently eroding this margin or settlements caused by a deeper scour related to the karst activity of the specific area.
3.3. New Geophysical and Verification Surveys in the Identified Areas
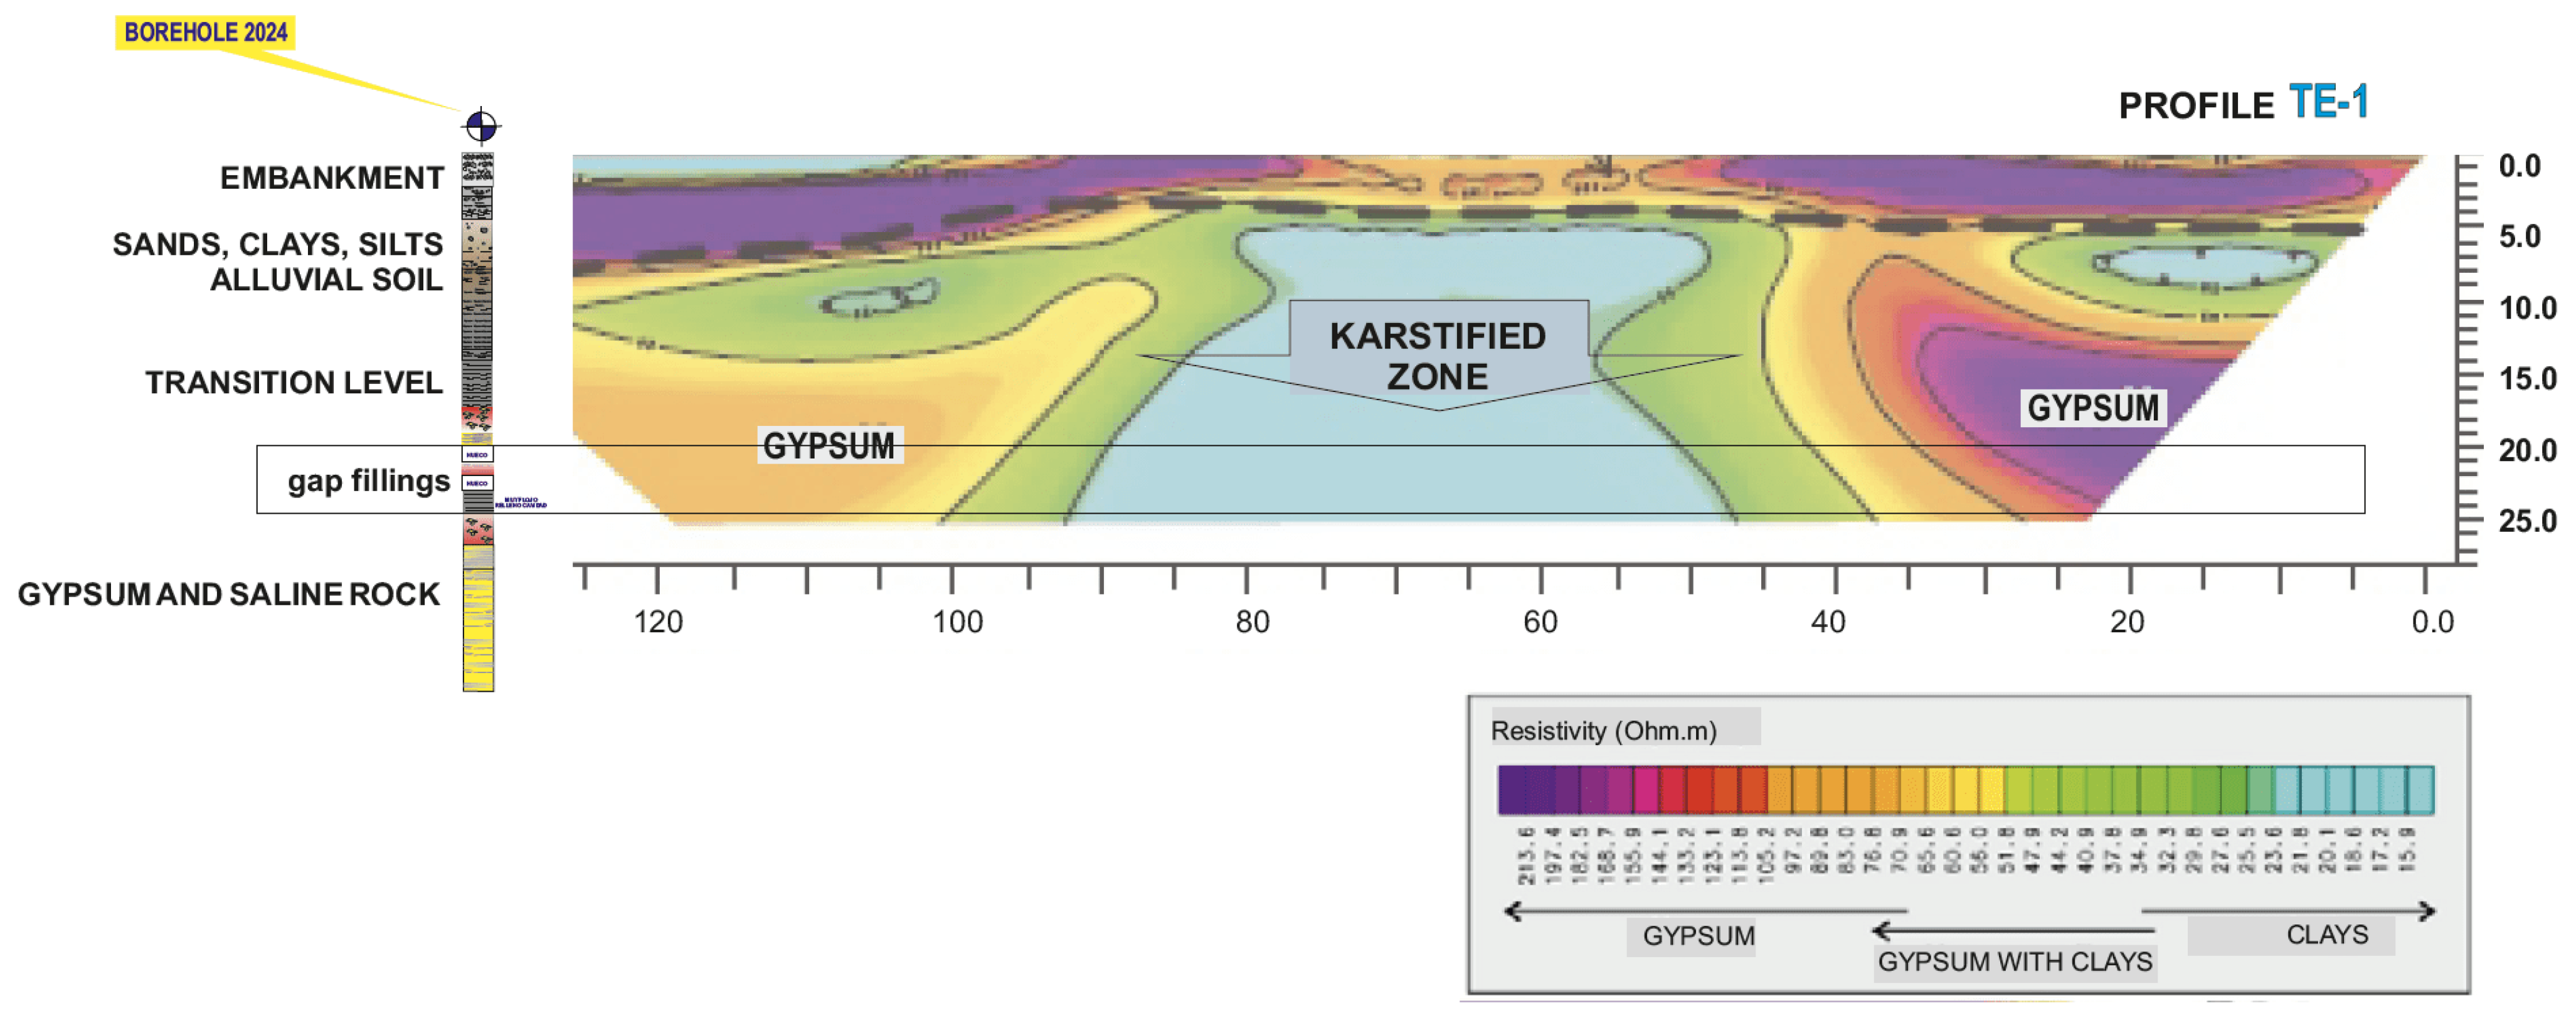
- Electrical tomography. The IGT report indicates that the most significant part of a surface layer of approximately 5 m thickness, corresponding to the body of the ditch and possible detrital alluvium, is the resistivity level interpreted as gypsum (Figure 10), located at a depth of 10–12 m. This resistivity level is abruptly interrupted between 45 and 85 m, where a moderately conductive anomaly is defined, interpreted as a karstified zone in the gypsum. This resistivity level is abruptly interrupted between 45 and 85 m, where a moderately conductive anomaly, interpreted as a karstified zone in the gypsum materials, is defined and extends below to a depth of 30 m.
- UltraGPR type georadar. The UGPR-1 profile reveals the existence of an anomalous zone with considerable lateral and depth extension. Its clearest manifestation can be seen between 120 and 220 m from a depth of 35 m, but it is interesting to note that the anomaly extends to shallower levels towards the north, corresponding to the anomaly defined in the electrical tomography measurements, as can be seen from the results of both measurements (Figure 11).
- A verification survey in the area was indicated by geophysical anomalies. Due to the presence of these anomalies at greater depths, it was particularly interesting to carry out deep surveys to contrast the information obtained. For this reason, survey one was carried out (10 July 2024), reaching a depth of 35 m (Figure 15).
4. Discussion and Conclusions
- It provides a base from which to incorporate all the information collected in previous studies. The areas where the collapses have occurred are also included. It has made it possible to locate all the tests and surveys carried out, the geophysical anomalies of various types identified, the drilling campaigns, dynamic penetration tests, pits, etc.
- The areas of land consolidation work have also been more accurately located, specifically, of the two low-mobility mortar injection campaigns. The first is on the station road and the second is on the river protection embankment.
- It has been possible to identify areas of apparent relative sinking or subsidence. The formation of points or small areas of closed or semi-closed contours in this environment can indicate the situation of a deformation process on the surface, related to the situation of sunken areas, in the process of subsidence and/or at risk of collapse. New studies and research have focused on these points. In a survey carried out during the last research campaign, undermined levels and holes were again detected at a depth very similar to that recognised in previous phases of work.
- Using the first measurements as a reference, new measurements using this method will allow us to assess whether the process has stopped and/or whether it is still ongoing, and even its rate of development.
Author Contributions
Funding
Data Availability Statement
Acknowledgments
Conflicts of Interest
References
- Esnaola, J.M.; Leyva, F.; Marqués, L.; Ramírez del Pozo, J.; Granados, M.; Herranz, J.M. Geological Map Sheet 353 (Pedrola). Spanish Geological Map Scale 1:50000; Instituto Geológico y Geominero de España (IGME): Madrid, Spain, 1992. (In Spanish) [Google Scholar]
- Gracia, A.; Torrijo, F.J.; Garzón-Roca, J.; Pérez-Picallo, M.; Alonso-Pandavenes, O. Identification and Mitigation of Subsidence and Collapse Hazards in Karstic Areas: A Case Study in Alcalá de Ebro (Spain). Appl. Sci. 2023, 13, 5687. [Google Scholar] [CrossRef]
- Gutiérrez, F.; Benito-Calvo, A.; Carbonel, D.; Desir, G.; Sevil, J.; Guerrero, J.; Martínez-Fernández, A.; Karamplaglidis, T.; García-Arnay, A.; Fabregat, I. Review on sinkhole monitoring and performance of remediation measures by high-precision leveling and terrestrial laser scanner in the salt karst of the Ebro Valley, Spain. Eng. Geol. 2019, 248, 283–308. [Google Scholar] [CrossRef]
- Tomás, R.; Romero, R.; Mulas, J.; Marturià, J.J.; Mallorquí, J.J.; Lopez-Sanchez, J.M.; Herrera, G.; Gutiérrez, F.; González, P.J.; Fernández, J.; et al. Radar interferometry techniques for the study of ground subsidence phenomena: A review of practical issues through cases in Spain. Environ. Earth Sci. 2014, 71, 163–181. [Google Scholar] [CrossRef]
- Zaragoza Gumis, G. Study for the Project of Defenses Against Flooding in the Urban Area of Alcalá de Ebro; Geological Service for Public Works (SGOP), Ebro Hydrographic Confederation (CHE): Zaragoza, Spain, 1980. (In Spanish) [Google Scholar]
- Sowers, G.F. Building on Sinkholes: Design and Construction of Foundations in Karst Terrain; American Society of Civil Engineers: Reston, VA, USA, 1996. [Google Scholar]
- Gutiérrez, F.; Galve, J.P.; Lucha, P.; Bonachea, J.; Jorda, L.; Jorda, R. Investigation of a large collapse sinkhole affecting a multi-storey building by means of geophysics and the trenching technique (Zaragoza city, NE Spain). Environ. Geol. 2009, 58, 1107–1122. [Google Scholar] [CrossRef]
- Guerrero, J.; Gutiérrez, F.; Bonachea, J.; Lucha, P. A sinkhole susceptibility zonation based on paleokarst analysis along a stretch of the Madrid-Barcelona high-speed railway built over gypsum- and salt-bearing evaporites (NE Spain). Eng. Geol. 2008, 102, 62–73. [Google Scholar] [CrossRef]
- EN 12350-2:2019; European Standard—Testing Fresh Concrete: Part 2: Slump Test. AENOR: Madrid, Spain, 2019.
- Cooper, A.H.; Gutiérrez, F. Dealing with gypsum karst problems: Hazards, environmental issues and planning. Treatise Geomorphol. 2013, 6, 451–462. [Google Scholar]
- Sanz Pérez, E.; Sanz Riaguas, C. Identification and Investigation of Subsidence Areas to Mitigate Karstic Risks in Urbanized Areas of Madrid, Spain: A Case Study. Sustainability 2021, 13, 7716. [Google Scholar] [CrossRef]


Disclaimer/Publisher’s Note: The statements, opinions and data contained in all publications are solely those of the individual author(s) and contributor(s) and not of MDPI and/or the editor(s). MDPI and/or the editor(s) disclaim responsibility for any injury to people or property resulting from any ideas, methods, instructions or products referred to in the content. |
© 2025 by the authors. Licensee MDPI, Basel, Switzerland. This article is an open access article distributed under the terms and conditions of the Creative Commons Attribution (CC BY) license (https://creativecommons.org/licenses/by/4.0/).
Share and Cite
Gracia, A.; Torrijo, F.J.; García, A.; Boix, A. Investigation and Monitoring of Sinkhole Subsidence and Collapse: Additional Data on the Case Study in Alcalá de Ebro (Zaragoza, Spain). Land 2025, 14, 1006. https://doi.org/10.3390/land14051006
Gracia A, Torrijo FJ, García A, Boix A. Investigation and Monitoring of Sinkhole Subsidence and Collapse: Additional Data on the Case Study in Alcalá de Ebro (Zaragoza, Spain). Land. 2025; 14(5):1006. https://doi.org/10.3390/land14051006
Chicago/Turabian StyleGracia, Alberto, Francisco Javier Torrijo, Alberto García, and Alberto Boix. 2025. "Investigation and Monitoring of Sinkhole Subsidence and Collapse: Additional Data on the Case Study in Alcalá de Ebro (Zaragoza, Spain)" Land 14, no. 5: 1006. https://doi.org/10.3390/land14051006
APA StyleGracia, A., Torrijo, F. J., García, A., & Boix, A. (2025). Investigation and Monitoring of Sinkhole Subsidence and Collapse: Additional Data on the Case Study in Alcalá de Ebro (Zaragoza, Spain). Land, 14(5), 1006. https://doi.org/10.3390/land14051006